Article

Use of Reflectance Indices to Assess Vine Water Status under Mild to Moderate Water Deficits

Departament d’Enginyeria Agroalimentària i Biotecnologia, Universitat Politècnica de Catalunya, 08060 Castelldefels (Barcelona), Spain
*
Author to whom correspondence should be addressed.
Agronomy 2019, 9(7), 346; https://doi.org/10.3390/agronomy9070346
Submission received: 11 April 2019 / Revised: 9 June 2019 / Accepted: 27 June 2019 / Published: 1 July 2019
(This article belongs to the Special Issue Viticulture and Winemaking under Climate Change)

Abstract

:
The monitoring of vine water status is of interest for irrigation management in order to improve water use while optimizing both berry yield and quality. Remote-sensing techniques might provide accurate, rapid, and non-destructive estimates of vine water status. The objective of this study was to test the capability of the reflectance-based water index (WI) and the photochemical reflectance index (PRI) to characterize Vitis vinifera L. cv. Xarel·lo water status under mild to moderate water deficits. The study was conducted at the leaf level in irrigated potted plants and at the plant level on five commercial rain-fed vineyards in 2009 and 2010. In potted plants, the reflectance indices PRI and WI closely tracked variation in the leaf-to-air temperature difference (ΔT) with r2 = 0.81 and r2 = 0.83, for WI and PRI, respectively (p < 0.01). In addition, in potted plants, both PRI and WI showed significant relationships with light-use efficiency (LUE)—calculated as the ratio between net CO2 assimilation rate (An) and incident photosynthetic active radiation (PAR) at the leaf surface—with r2 = 0.92 and r2 = 0.74 for PRI and WI, respectively. At the canopy level, vine predawn water potential (Ψpd) was related to the canopy-to-air temperature difference (ΔTm) across years (r2 = 0.37, p < 0.05). In the years of study, the relationships between PRI and WI showed variable degrees of correlation against Ψpd and ΔTm. Across years, PRI and WI showed significant relationships with Ψpd, with r2 = 0.41 and r2 = 0.37 (p < 0.01), for WI and PRI, respectively. Indices formulated to account for variation in canopy structure (i.e., PRInorm and WInorm) showed similar degrees of correlation against Ψpd to their original formulations. In addition, PRI and WI were capable of differentiating (p < 0.01) between mild (Ψpd > −0.4 MPa) and moderate (Ψpd < −0.4 MPa) water deficits, and a similar response was observed when PRInorm and WInorm—formulated to account for variation in canopy structure—were considered. Thus, at the leaf level, our result suggest that WI and PRI can be used to adequately predict the diurnal dynamics of stomatal aperture and transpiration. In addition, at the canopy level, PRI and WI effectively differentiated vines under mild water deficits from those experiencing moderate water deficits. Thus, our results show the capability of WI and PRI in characterizing vine water status under mild to moderate water deficits.

1. Introduction

Water deficits are the major constraint for grape production in the Mediterranean region [1], and future scenarios predict further increases in the frequency and intensity of water deficits as a result of climate change [2]. As a result, irrigation is being widely adopted in order to secure more regular and predictable yields [1,3,4]. Concurrently, and due to the increasing water scarcity, as well as the rising competition between water users, deficit irrigation techniques emerged as a potential strategy to improve the productivity of water [5]. Particularly, in viticulture areas, the use of regulated deficit irrigation strategies emerged as a way of reducing water use with little or no impact on yield and a positive impact on berry quality [1,3,6]. In regulated deficit irrigation strategies, plant water status is maintained within predefined limits of deficit during certain phases of the seasonal development, normally when fruit growth is least sensitive to water reductions [5]. Thus, in order to guarantee the success of the use of this technique, an accurate control of plant water status is required for scheduling irrigation. Several physiological indicators are used to assess plant water status, with leaf water potential, stem water potential, stomatal conductance, and transpiration being the most widely used in viticulture [4,7,8]. However, measurement of these water stress indicators for practical irrigation scheduling is labor-intensive and time-consuming due to the large number of observations necessary to characterize the spatial variability. As an alternative, remote-sensing techniques might be a very useful tool to monitor vine water status because of opportunities for cost-effective generation of spatial data.
Remote-sensing methods based on thermal emission to monitor plant water status were extensively evaluated in field trials. In vineyards, infrared thermometry and thermal imaging were shown to provide reasonable estimations of whole-canopy conductance [8,9] and plant water potential in grapevines [10]. However, largely due to the effects of environmental conditions on canopy temperature [11], the practical application of thermal methods to irrigation scheduling is currently limited to regions with very constant (semi-)arid weather conditions during the growth season [11]. In addition, since grapevine cultivars present, in terms of stomatal control and water potential regulation, contrasted responses to water deficits [2], temperature-based indicators might not always properly characterize vine water status [12]. Reflectance-based indices might also provide direct or indirect estimates on vine water status. Previous studies showed the capability of reflectance indices based on water absorption features in assessing vine water status [13,14,15]. Particularly, the reflectance-based water index (WI) [16] was shown to track diurnal changes in stomatal conductance in irrigated vines, as well as in the canopy-to-air temperature difference in vineyards experiencing moderate to severe water stress [13]. Similarly, several studies showed the capability of the photochemical reflectance index (PRI) [17,18]—an index related to the epoxidation state of xanthophyll pigments and, thus, to photosynthetic efficiency—at detecting water stress in fruit trees grown using regulated deficit irrigation techniques [19,20] and in vineyards [12]. However, both WI and PRI are sensitive to changes in canopy structure [21,22], which might impair their capacity to assess vine water status under contrasted growing conditions (environmental), including cultural practices such as fertilization and pruning methods. Thus, because water content of vegetation depends on both leaf area and relative water content [22,23], changes in canopy structure might impair the capacity of the WI to assess vine water status. Similarly, PRI estimates of plant water status might be affected by changes in the size of constitutive pigments pools (i.e., chlorophyll and carotenoid)—which control the facultative short-term variation in PRI—as well as by changes in canopy structure [24,25]. Approaches to overcome these confounding effects consist of combining the primary index (i.e., WI or PRI) with indices of canopy structure—such as the normalized difference vegetation index (NDVI) (20,23)—or including specific bands on their formulation [12,20] that account for the effects of varying leaf area and/or pigment content.
We herein explore the capability of the reflectance indices PRI and WI as a proxy to assess vine water status under mild to moderate water deficits in Vitis vinifera L. cv. Xarel·lo. The specific objectives were (i) to evaluate the performance of WI and PRI in estimating physiological parameters related to water status at the leaf level on potted irrigated vines; (ii) to assess the capability of WI and PRI, as well as their normalized formulations, in estimating vine water status in field-grown vines experiencing mild to moderate water deficits; and (iii) to evaluate the capability of WI and PRI in differentiating mild from moderate water deficits levels in field-grown vines.

2. Materials and Methods

2.1. Leaf Level Study

Three-year-old Vitis vinifera L. cv. Xarel·lo grafted on 110R (V. berlandieri × V. rupestris) vines were grown in 17 L pots filled with a mixture of sand and peat turf (1:1, v/v). Vines were grown in a greenhouse and were watered daily with 0.67 L∙plant−1 of water. In addition, once a week, 1 L∙plant−1 of a full Hoagland solution was provided. During the growth period, all the lateral shoots, buds, and young flowers were removed in order to leave only the winter buds and leaves.
A diurnal cycle of gas exchange and reflectance measurements was carried out on 27 July 2010, approximately every two hours. Vines were placed outside the greenhouse in order to register measurements under direct sunlight. Data acquisition started at dawn (5:30 a.m. solar time) and finished late in the afternoon (7:30 p.m. solar time). Two fully expanded leaves of four vines were measured (eight leaves). Gas exchange parameters were measured with a portable gas exchange system CIRAS-2 (PP Systems Ltd., Havervill, MA, USA) under current air temperature and humidity, and leaf cuvette (Automatic Leaf Universal Cuvette, PLC6) CO2 concentration was set to ~400 ppm using a CO2 cartridge. The leaf cuvette had an aperture of 25 mm × 7 mm and was held to keep the leaves in their natural positions. Air vapor pressure deficit (VPD), air temperature (Ta), photosynthetic photon flux density incident on the leaf (PPFDi), net CO2 assimilation rate (An), transpiration rate (E), stomatal conductance (gs), and leaf temperature (Tl) were averaged among the eight observations to represent the mean value at the measuring time. Light-use efficiency (LUE) was calculated as the ratio between An and PPFDi.
Leaf reflectance was measured using a spectroradiometer UNISPEC (PP Systems Ltd., Havervill, MA, USA) with a 2.3-mm-diameter bifurcated fiber optic and a leaf clip (models UNI410 and UNI501, PP Systems, Havervill). The detector samples 256 bands at roughly even intervals (average band-to-band spacing of 3.3 nm) within a 400–1100-nm effective spectral range. Each leaf scan resulted from the average of three internal measurements. Apparent reflectance was obtained after standardization by a Spectralon reflectance standard measured before each cycle. Afterward, the water index (Equation (1)) [16] and the photochemical reflectance index (Equation (2)) [17,18] were formulated as follows:
WI = R900/R970,
PRI = (R531 − R570)/(R531 + R570),
where R indicates spectral reflectance, and the subindices indicate the respective wavelengths in nanometers.
Vine water status was determined using a Scholander pressure chamber (Soilmoisture 3005, Soil Moisture Corp., Santa Barbara, CA, USA). At 5:30 a.m. (dawn), four leaves (i.e., one leaf per vine), which were previously wrapped in a plastic bag and covered with aluminum foil the evening before, were used to determine vine predawn water potential (Ψpd). Leaves subjected to the same coverage were used to measure stem water potential (Ψs) at midday (solar noon). In addition, leaf water potential was determined at midday (Ψm).

2.2. Field Study

The field study took place in 2009 and 2010 in five Vitis vinifera L. cv. Xarel·lo rain-fed vineyards (plantation years between 1989 and 1998) located in the west area of Barcelona (Alt Penedès and Anoia counties, 1°48’22” west (W), 41°28’54” north (N)). Vines were planted at varying density (2016 to 3086 stock∙ha−1) and the training system was Double Royat. In each vineyard, three plots (with three adjacent vines per plot) with contrasting vigor were studied. Nonetheless, in order to evaluate the capability of reflectance indices in assessing vine water status under mild to moderate water deficits, only plots with average values of Ψpd > −0.6 MPa were considered. Thus, the study comprised 14 plots in 2009 and 12 plots in 2010. Weather data were obtained from a nearby weather station located in Els Hostalets de Pierola (1°48’31” W; 41°31’59” N). The average temperature is around 15 °C, while the average cumulative annual precipitation is 479.2 mm. The weather water balance was computed as the difference between precipitation (P) and reference evapotranspiration (ET0). Veraison took place between 31 July and 4 August in 2009 and from 10 August until 18 August in 2010.
Predawn water potential (Ψpd) was measured at veraison using a pressure chamber (Soilmosture 3005, Soil Moisture Corp., Santa Barbara, CA, USA). Measurements were carried out on a single mature external leaf per vine (three per plot). Additionally, the canopy-to-air temperature difference (ΔTm) was measured at midday using a hand-held infrared thermometer (ST Pro Plus, Raytek Corp., Santa Cruz, CA, USA) at approximately 20 cm of the canopy. Measurements were taken on both the sun-exposed and the shaded sides of the canopy, and ΔTm was computed as the average of these two measurements.
Fractional intercepted photosynthetic active radiation (fIPAR) was measured at midday using a hand-held ceptometer (Accupar, Decagon Devices Inc., Pullman, WA, USA). Seven measurements, parallel and perpendicular to the row of the vine, were collected at 10 cm of ground level. Incident light radiation was registered above the canopy. In 2010, fIPAR measurements were carried out only in eight blocks due to a failure of the instrument. In addition, exposed leaf area (ELA) was determined using the procedure proposed by Smart and Robinson [26] as follows:
ELA = (2 h + e) × (100 − T) × d,
where e is the mean of three measures of canopy width, h is the mean of three measures of canopy height, T is the percent canopy gaps, and d is the distance between vines in the same row. Values of fIPAR in the remaining plots in 2010 were estimated from the regression of fIPAR against ELA as follows:
fIPAR = 41.37 + 12.14 × ELA (r2 = 0.86, p < 0.01).
Reflectance data measurements were conducted at midday (solar noon) on cloudless days in order to minimize variation due to differences in illumination conditions at the stage of veraison. Spectral data were collected using a narrow-band spectroradiometer (UNISPEC, PP Systems Ltd., Havervill, MA, USA), which works in a wavelength range between 310 and 1100 nm (visible and near-infrared), with a resolution of 3.3 nm. Irradiance was measured by connecting the spectroradiometer to a cosine-corrected detector lens (UNI-685 PP Systems Ltd., Havervill, MA, USA) mounted on a tripod boom and oriented to the sky above the canopy. Canopy radiance was obtained with the spectroradiometer connected to a 12° field-of-view foreoptic (UNI-710, PP Systems Ltd., Havervill, MA, USA) via a 2.3-mm-diameter fiber optic (model UNI410, PP Systems, Havervill, MA, USA). The foreoptic instrument was mounted on a tripod boom and held on a nadir orientation 0.75 m above the canopy, so that the field of view covered an area of ~15 cm in diameter. Three scans were collected and internally averaged for each vine. Apparent reflectance was calculated as the ratio between radiance and irradiance. The normalized difference vegetation index (NDVI), the photochemical reflectance index (PRI) [17], the water index (WI), the normalized WI (WInorm) [16], the normalized PRI (PRInorm) [12], and the structural independent pigment index (SIPI) [27] were calculated using narrow-band apparent reflectance values as follows:
NDVI = (R900 − R680)/(R900 + R680),
PRI = (R531 − R570)/(R531 + R570),
WI = R900/R970,
WInorm = WI/NDVI,
PRInorm = PRI/(((R800 − R670)/(R800 +R670)0.5) × R700/R670),
SIPI = (R800 − R445)/(R800 − R680),
where R indicates apparent reflectance, and the subindices indicate the respective wavelengths in nanometers.

2.3. Statistical Analyses

Statistical analyses were carried out using the statistical package SPSS 25.0 (SPSS Inc., Chicago, IL, USA). In the leaf level study, analyses of variance (ANOVA) were carried out to assess the changes in gas exchange parameters and reflectance indices throughout the day (i.e., time of sampling as a source of variation). In addition, Pearson correlation analyses were used to study the relationships between water status, gas exchange parameters, and reflectance indices. In the field study, differences in the variables studied were determined using ANOVA analyses while considering both year and water deficit level as sources of variation. Means were compared using the Student–Knewman–Keuls test, and the relationships among the canopy variables and reflectance data were studied by Pearson correlation analysis.

3. Results

3.1. Leaf Level Study

3.1.1. Environmental Conditions

The air temperature (Ta) and vapor pressure deficit (VPD) were typical of Mediterranean summer conditions and were characterized by a gradual increase until midday/early afternoon, followed by a gradual decrease until the end of the diurnal cycle (data not shown). During the measurement period, minimum and maximum temperatures were 24.1 °C and 32.7 °C, respectively, whereas vapor pressure deficit ranged between 1.27 kPa and 2.83 kPa. Similarly, incident photosynthetic photon flux density at the leaf surface (PPFDi) showed a gradual increase from early morning until early afternoon and decreased afterward. Incident PAR on the leaf surface ranged between 60 μmol∙m−2∙s−1 and 1025 μmol∙m−2∙s−1 during the diurnal cycle (Figure 1).

3.1.2. Water Potential

Predawn water potential (Ψpd) ranged between −0.30 MPa and −0.35 MPa among plants with an average value of −0.33 ± 0.02 MPa (average ± standard error of the mean), whereas values of Ψs and Ψm were −0.49 ± 0.20 MPa and −1.00 ± 0.05 MPa, respectively.

3.1.3. Gas Exchange and Reflectance Indices

Diurnal courses of environmental conditions, gas exchange, and reflectance indices are shown in Figure 1. Net photosynthesis (An) showed a peak early in the morning, while it decreased in the central hours of the day, and further decreased again in the afternoon. Nonetheless, An did not show significant variation (p > 0.05) throughout the diurnal cycle with an average value of 2.37 ± 0.33 μmol CO2∙m−2∙s−1.
In contrast, stomatal conductance (gs) significantly decreased (p < 0.01) throughout the diurnal cycle from early morning (143 ± 11.4 mmol H2O∙m−2∙s−1) to sundown (70 ± 6.3 mmol H2O∙m−2∙s−1). Transpiration rate (E) steadily increased throughout the day, reaching a peak in the early afternoon (2.47 ± 0.19 mmol H2O∙m−2∙s−1) and significantly decreasing afterward. Similarly, ΔT varied significantly (p < 0.01) throughout the day, increasing from early morning until mid-afternoon (with a peak value of 0.65 ± 0.31 °C) and decreasing afterward. The narrow-band indices WI and PRI significantly varied throughout the diurnal cycle (p < 0.01). Both, WI and PRI showed a gradual decrease from early morning to early afternoon and increased again toward the end of the diurnal cycle (Figure 1).
Gas exchange parameters (i.e., An, E, and gs) were not significantly correlated. Nonetheless, E was found to be closely related to VPD (r = 0.85, p < 0.01), whereas An was related to PPFDi, although to a lesser extent (r = 0.63; p < 0.10). In addition, there was no significant correlation between either WI or PRI and gas exchange parameters (Table 1). Both PRI and WI showed significant correlation (p < 0.01) with light-use efficiency (LUE)—calculated as the ratio between An and incident PPFD at the leaf surface—with r = 0.96 and r = 0.86, for PRI and WI, respectively. In addition, PRI and WI were significantly correlated (p < 0.01) with ΔT, with r = −0.92 and r = −0.90, for PRI and WI, respectively (Figure 2).

3.2. Field Study

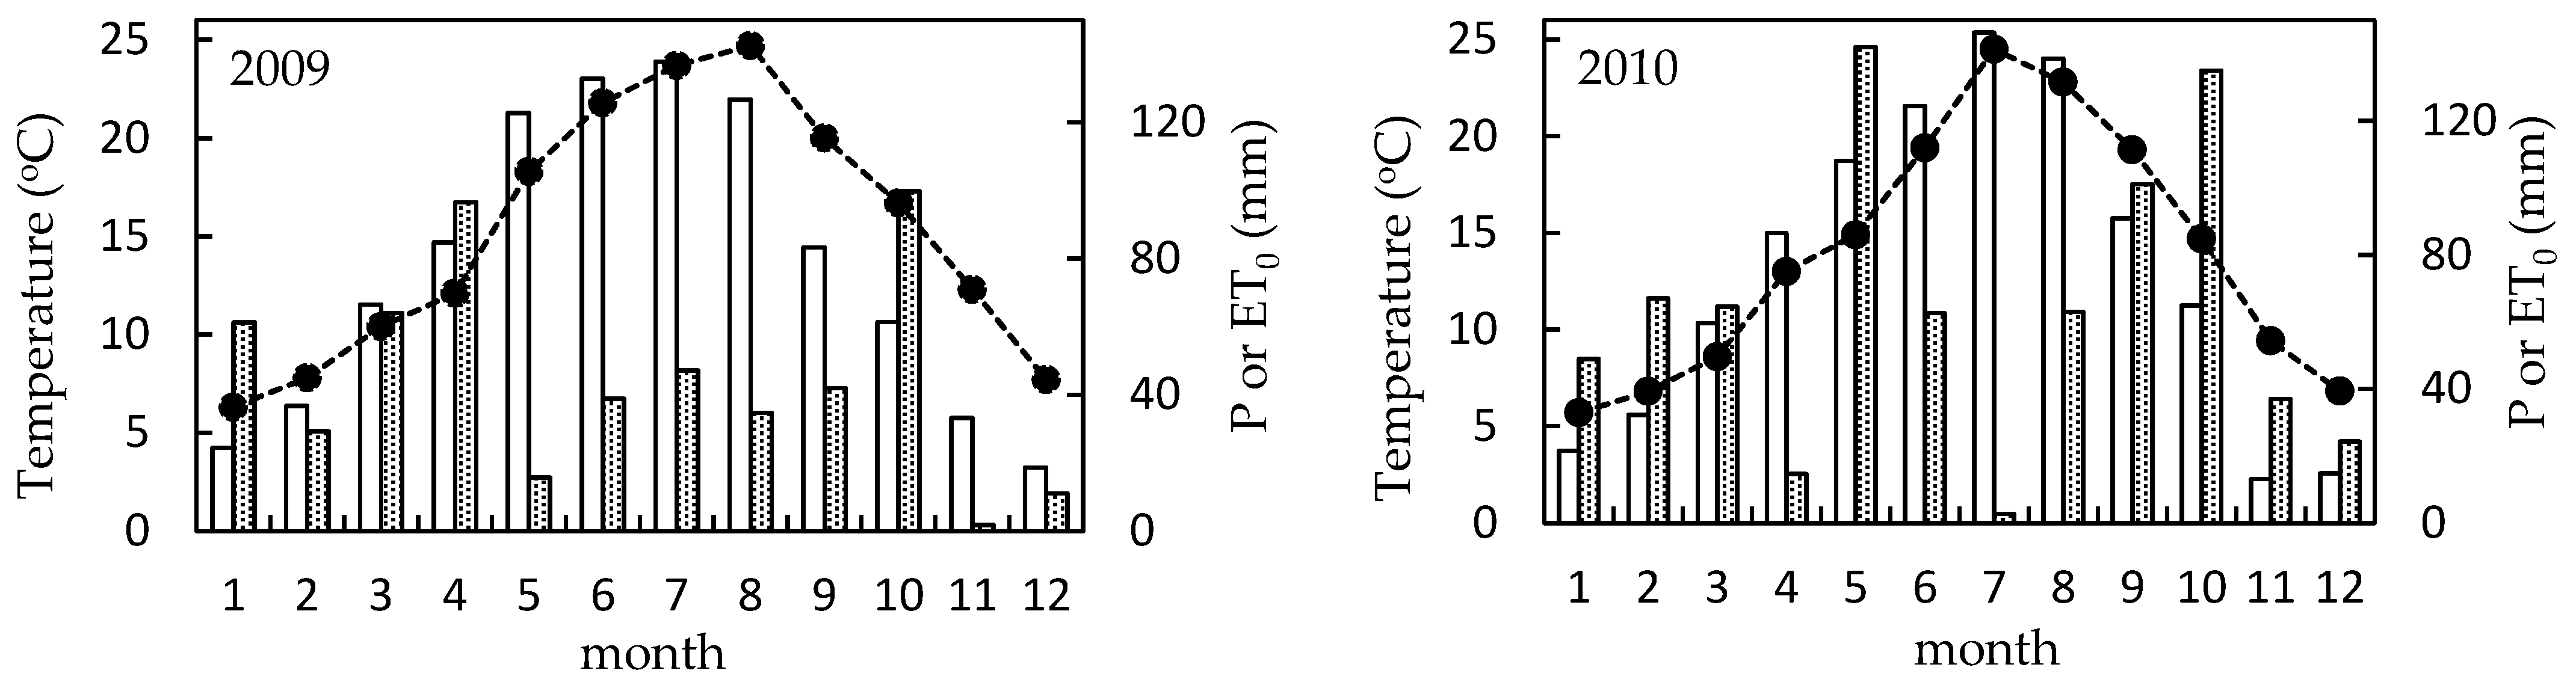
3.2.1. Weather Conditions

Temperatures in the years of study were similar to the long-term average, whereas precipitation was characterized by an increase of 30% over the long-term precipitation average (479.2 mm) (Figure 3). In addition, according to the weather water balance, there was abundant water availability over the period of study, except in summer when water deficits had a larger incidence.

3.2.2. Vine Water Status

Predawn water potential ranged from −0.18 MPa to −0.48 MPa among vines with an average value of −0.34 ± 0.03 MPa in 2009, whereas, in 2010, Ψpd varied from −0.27 MPa to −0.56 MPa with an average value of −0.41 ± 0.03 MPa. In addition, ΔTm ranged from −4.85 °C to −1.08 °C among vines with an average value of −2.38 ± 0.29 °C in 2009, whereas, in 2010, ΔTm varied from −4.10 °C to 0.33 °C with an average value of −1.75 ± 0.46 °C. In 2010, plot average values of ΔTm and Ψpd were significantly related (r = −0.74, p < 0.01), whereas no significant correlation emerged in 2009 (r = −0.35, p = 0.26). However, in 2009, when ΔTm temperatures acquired under partially overcast conditions were disregarded, ΔTm and Ψpd were found to be significantly related (r = −0.69, p < 0.05). Moreover, when only data acquired under clear-sky conditions were considered, a unique relationship between ΔTm and Ψpd emerged across years with r2 = 0.37 and p < 0.05 (Figure 4).

3.2.3. Relationships between Reflectance Indices and Vine Vigor and Water Status

In the years of study, there were no significant relationships between the reflectance indices (NDVI, WI, and PRI) and fIPAR, except in 2009 when WI was negatively related with fIPAR (r = −0.61, p < 0.05), while these reflectance indices showed variable degrees of correlation with vine water status parameters (Table 2). In 2009, PRI and PRInorm showed significant and similar correlation with Ψpd (r = 0.76), whereas these correlations were not significant in 2010. Similarly, in 2009, WI and WInorm were significantly related to Ψpd (r = −0.69), whereas no significant correlations emerged in 2010.
In addition, in 2009, the relationships between PRI and WI and ΔTm were either not significant or not consistent, probably due to the small sample size, and were not considered to any further extent. Contrastingly, in 2010, PRI and PRInorm were significantly related to ΔTm with r = −0.60 (p < 0.05) and r = −0.75 (p < 0.01), for PRI and PRInorm, respectively. Similarly, in 2010, WI was marginally related to ΔTm (r = 0.53, p < 0.10), whereas the correlation between WInorm and ΔTm was significant (r = 0.65, p < 0.05). When data from both years were pooled, PRI and WI were significantly (p < 0.05) related to ΔTm (Table 2). Similarly, both WI and PRI were significantly related to Ψpd (p < 0.01) across years with r2 = 0.41 and r2 = 0.37 (p < 0.01), for WI and PRI, respectively (Figure 5). In addition, the relationship between Ψpd and PRI increased when PRI was normalized by canopy structure (i.e., PRInorm) with r2 = 0.41 (p < 0.01). In contrast, WInorm was found to be related to Ψpd to a lesser extent than WI with r2 = 0.36 (p < 0.01).
To further assess the capability of PRI and WI in detecting vine water status, data were grouped according to the water deficit level as defined by Carbonneau et al. [28]. Thus, we considered Ψpd > −0.2 MPa as no water deficit, −0.2 MPa < Ψpd < −0.4 MPa as mild water stress, and Ψpd < −0.6 MPa as moderate water stress. Since there were no significant differences in Ψp between no water deficit and mild water stress, data were pooled into a unique group (i.e., mild water deficit). Therefore, we examined two conditions, namely mild (Ψpd < −0.4 MPa) and moderate (Ψpd > −0.4 MPa) water deficits. In 2009, Ψpd values showed significant differences (p < 0.01) between water deficit levels with average values of −0.24 ± 0.04 MPa and −0.42 ± 0.01 MPa for mild and moderate water deficits, respectively. Similarly, in 2010, Ψpd significantly differed (p < 0.01) with Ψpd = −0.31 ± 0.02 MPa and Ψpd = −0.50 ± 0.02 MPa, for mild and moderate water deficits, respectively. Consistently, WI and PRI, as well as their respective normalized formulations (i.e., WInorm and PRInorm), showed significant differences between mild and moderate water deficits in the years of study (Figure 6). Differences in WI between mild and moderate water deficits were larger in 2009 (p < 0.01) than in 2010 (p < 0.05), and a similar response was observed for WInorm (for more details, see Table S1, Supplementary Materials). In 2009, PRI significantly decreased (p < 0.01) from 0.031 ± 0.008 to −0.012 ± 0.005 between mild and moderate water deficits, and a similar response was observed in 2010, although less significant (p < 0.05). In addition, PRInorm significantly differed (p < 0.05) between mild and moderate water deficit levels in the years of study.

4. Discussion

4.1. Leaf Level Study

Values of Ψpd and Ψs in potted plants indicated that vines were subject to mild to moderate water stress [28]. In spite of ample water availability, stomatal conductance (gs) decreased, particularly at central hours of the day under high air vapor pressure deficits (i.e., VPD > 2.0 kPa), as indicated by the close dependence of stomatal conductance on the leaf-to-air VPD (r = −0.95, p < 0.01, n = 5). Similarly, we observed that variation in E during the diurnal cycle was mainly driven by changes in VPD (r = 0.85, p < 0.01, n = 8) rather than changes in stomatal regulation. Previous studies reported a decline in stomatal conductance associated with high vapor pressure deficits even in well-watered vines [29], which results from an imbalance between water loss through evapotranspiration and water flow into the leaf [3,30]. In turn, at central hours of the day, when the photosynthetic rate was not light-limited, An was largely determined by stomatal conductance (r = 0.99, p < 0.01, n = 5). Indeed, under high temperature and VPD deficits, such as those experienced in the summer in Mediterranean environments, a midday depression of both An and gs was observed in agreement with previous studies [13,31,32]. Thus, stomatal conductance was particularly sensitive to developing water deficits [32]. The gs values were within the range reported for potted plants at similar Ψpd [6,13] and in field studies [33] and, on average, similar to those of vines experiencing moderate water deficits [34,35]. Therefore, it appears that, in Xarel·lo vines experiencing mild to moderate water deficits, stomatal conductance might be a good indicator of vine water status and could potentially provide a tool for irrigation scheduling [36].
Previous studies showed the sensitivity of PRI for crop water stress detection over diurnal and short time scales [12,19,37]. In our study, the PRI accounted for 92% variation in photosynthetic light-use efficiency (LUE) and 85% variation in ΔT, which agrees with the close coordination correlation observed among gas exchange parameters described above. Therefore, under the conditions of the study, PRI closely tracked diurnal changes in LUE in Xarel·lo vines. These results add to previous studies which showed the capability of PRI in estimating photosynthetic-related parameters across a wide range of water status [17,18,27,37,38,39], supporting the hypothesis that PRI could be a feasible indicator of plant physiological status under mild to moderate water deficits [19,20].
In addition, previous studies showed the capability of WI in tracking variation in stomatal aperture [13,16,40]. However, in the present study, WI was poorly related to gs, although it was a good indicator of changes in transpiration as suggested by the close correlation with ΔT. This is consistent with the fact that, in our study, variations in transpiration rates were mainly driven by changes in VPD rather than by changes in gs. Moreover, WI closely tracked changes in LUE, which might be attributed to the close dependence of net CO2 uptake on gs observed in our study. Thus, our results add to previous studies conducted in vines [13] by showing that WI effectively tracked changes in the leaf-to-air temperature difference in Xarel·lo vines experiencing mild to moderate water deficits.

4.2. Field Study

In the years of study, Ψpd values were similar to those reported in vines grown under deficit irrigation programs [41,42,43] and indicated that, at veraison, water stress was mild to moderate [28]. Under these conditions, PRI was related to Ψpd as previously reported in vineyards experiencing mild to moderate water deficits [44,45]. In addition, in our study, a negative relationship emerged between WI and Ψpd, indicating that enhanced water status (i.e., increases in Ψpd) resulted in decreased water content at midday (i.e., decreases in WI). This is consistent with the observed relationship between Ψpd and ΔTm (Figure 4) and suggests that higher Ψpd was presumably accompanied by higher transpiration rates at midday [36]. Indeed, in grapevines experiencing mild to moderate water deficits, as those occurring in our study or under deficit irrigation programs, Ψpd is highly related to water potential and stomatal conductance measured at midday [12,43,46,47]. In addition, in our study, WI decreased as PRI increased (r = −0.66, p < 0.01), indicating that enhanced water loss (lower WI) was accompanied by increased carbon assimilation (higher PRI), which agrees with the tight dependence of leaf photosynthesis on stomatal conductance previously reported in grapevines experiencing mild to moderate water deficits [3,32,48]. Thus, both PRI and WI were feasible indicators of Ψpd under mild to moderate water deficits, whereas, in grapevines experiencing moderate to severe water stress, PRI and WI failed to estimate Ψpd [13,45]. These contrasting results might be reconciled by considering the effects of the intensity and duration of water deficits on stomatal responses [3]. In grapevines experiencing prolonged soil water deficits, Ψpd may not necessarily reflect the plant’s water status later in the day since changes in cell-wall elasticity and osmotic adjustment might dictate different responses in midday water potential [48]. Increases in cell-wall elasticity lead to a larger decline in plant water potential at midday, whereas osmotic adjustment may contribute to the maintenance of open stomata at lower water potentials [3]. These responses might partly explain the lack of correlation between reflectance indices acquired at midday (i.e., PRI and WI) and Ψpd previously reported in rain-fed vineyards experiencing prolonged and severe soil water deficits [13,45]. In addition, prolonged soil water deficits during the vegetative stage might result in differences in vine leaf area, leading to different velocities in dehydration [49], which might also affect the relationship between Ψpd and both PRI and WI measured at midday. Thus, the timing of occurrence and intensity of water deficits might affect the relationships between PRI and WI and predawn water potential [13,45], whereas both PRI and WI were reliable indicators of predawn water potential and photosynthetic functioning under mild to moderate water deficits.
In spite of the variability in weather conditions (i.e., radiation, temperature, and VPD) during data acquisition, ΔTm was found to be negatively related to Ψpd (r2 = 0.37, p < 0.05). The correlations between PRI and WI with ΔTm were low, although significant, when data from both years were pooled, which might be attributed to varying environmental conditions (leaf and VPD) during ΔTm measurements [36]. In 2010, in accordance with the observed responses at both the leaf (Figure 2) and canopy (Figure 4) levels, PRI increased along with ΔTm decreases, whereas WI decreased in parallel with ΔTm. The relationships of both PRI and WI against ΔTm notably improved when considering their respective normalized formulation (i.e., PRInorm and WInorm). Previous studies showed that PRI might be affected by changes in canopy structure and might reflect changes in pigment composition (i.e., chlorophyll to carotenoid ratios) as a result of leaf development, aging, or long-term stresses rather than the epoxidation state [39,50,51]. On the other hand, differences in vegetative growth might also affect WI values because the water content of vegetation responds to both leaf area and relative water content [22,23]. In our study, there was a close correlation between ΔTm and SIPI (r = 0.79, p < 0.01), indicating larger carotenoid relative to chlorophyll content on more stressed vines [27]. In addition, fIPAR was significantly related to Ψpd (r = 0.64, p < 0.05) suggesting an association between vine vigor and water availability. Thus, PRInorm, which accounts for variation in both canopy structure and pigment composition [52], showed higher sensitivity than PRI to changes in ΔTm. Similarly, WInorm, which accounts for variation in both leaf area and chlorophyll content, was positively related to ΔTm, indicating that enhanced water status was associated with higher transpiration rates and, thus, lower water content, in agreement with previous studies [13,40]. Contrastingly, the relationships between PRI, WI, and Ψpd did not improve when reflectance indices were normalized, which highlights the effects of varying canopy structure on vine water status at midday (when ΔTm was determined). Therefore, under the conditions of our study—where field data were acquired over two years on several fields and during several days within a year—correcting for variation on canopy size and pigment concentration effectively contributed to improving the performance of WI and PRI in estimating vine water status [12]. In summary, in line with recent studies, our results show the capability of the PRI [12,20,53] and WI [13,40,54], as well as their respective normalized formulations (i.e., PRInorm and WInorm), in monitoring vine water status.
Under regulated deficit irrigation strategies, the ability to diagnose vine water status is crucial since irrigation is normally scheduled under mild to moderate water deficits [3]. When comparing water deficit conditions, significant differences occurred between moderate (Ψpd < −0.4 MPa) and mild (Ψpd > −0.4 MPa) water deficits, in agreement with previous studies [44]. In accordance, PRI and WI, as well as their respective normalized formulations, distinguished between mild and moderate water deficits. Thus, PRI and WI were reliable as reference measures for irrigation management when assessing vine water status at veraison and proved to work in a range expanding from mild to moderate water stress, a common situation in field-grown grapevines, including those managed under regulated deficit irrigation programs [41,42]. Moreover, the results herein reported are promising, considering that these indices showed a lineal response in the range of water potentials found in this study (Figure 5). However, since regulated deficit irrigation programs require recurrent assessment of plant water status throughout the growing cycle, more studies are needed to assess the capability of PRI and WI (or their corresponding normalized formulations) in estimating vine water status at growth stages other than veraison prior to confirming their usefulness as practical tools for irrigation scheduling in vineyards.

5. Conclusions

In the present study, the capability of WI and PRI in assessing water status in vines experiencing mild to moderate water deficits was assessed. In irrigated vines, diurnal variation in stomatal conductance was particularly sensitive to developing water deficits driven by changes in the leaf-to-air vapor pressure deficit, suggesting that, in Xarel·lo vines, stomatal conductance might be a good indicator of water status. The indices PRI and WI effectively tracked diurnal changes in the leaf-to-air temperature difference. Similarly, due to the close dependence of net CO2 uptake on stomatal conductance observed in our study, PRI and WI effectively tracked diurnal changes in light-use efficiency. Thus, PRI and WI were feasible indicators of variation in photosynthetic functioning and transpiration (i.e., the light-use efficiency and the leaf-to-air temperature difference) linked to stomatal regulation in response to mild to moderate water deficits. At the canopy level, and despite ample variability in both weather conditions between years and growing conditions among fields, differences in water availability (i.e., Ψpd) were translated into differences in transpiration rates (i.e., the canopy-to-air temperature differences, ΔTm). Under these conditions, both WI and PRI provided consistent estimates of Ψpd. Moreover, in accordance with the observed differences in predawn water potentials, both PRI and WI effectively distinguished between mild and moderate water deficits levels. In addition, WInorm and PRInorm, which accounted for long-term effects of water availability on canopy structure—namely leaf area and chlorophyll content—were related to the canopy-to-air temperature difference. Therefore, PRI and WI, as well as their normalized formulations PRInorm and WInorm, provided estimates of key water stress indicators in vineyards within a range of mild to moderate water deficits. The capability of WI and PRI in monitoring vine water status might be of great significance in the context of increasing irrigated viticulture areas, particularly those under regulated deficit irrigation, as potential tools to support vineyard irrigation management. In this sense, the development of cost-effective methods for image acquisition and analysis that are commercially available to farmers is needed to make remote-sensing techniques operational for precision irrigation management.

Supplementary Materials

The following are available online at https://www.mdpi.com/2073-4395/9/7/346/s1, Table S1: Effects of mild (Ψpd > −0.4 MPa) and moderate (−0.4 MPa < Ψpd < −0.6MPa) water deficits on the water index (WI), the normalized water index (WInorm), the photochemical reflectance index (PRI), and the normalized photochemical reflectance index (PRInorm).

Author Contributions

C.G.-F., field sampling, data analyses, and writing—original draft preparation; G.G., field sampling, data analyses, and writing—review and editing; L.S., conceptualization, financial support, data analyses, and writing—original draft preparation.

Funding

This research was funded by the Ministerio de Ciencia e Innovación (Spain), grant number AGL2009-13105-C03-03, and by the Universitat Politècnica de Catalunya, grant number 9-INREC-09.

Acknowledgments

We are grateful to Antoni Abad (Codorniu S.A.) for assistance in field data collection and Olga Gener for management of the greenhouse facility.

Conflicts of Interest

The authors declare no conflicts of interest.

References

  1. Chaves, M.M.; Santos, T.P.; Souza, C.R.; Ortuño, M.F.; Rodrigues, M.L.; Lopes, C.M.; Maroco, J.P.; Pereira, J.S. Deficit irrigation in grapevine improves water-use efficiency while controlling vigour and production quality. Ann. Appl. Biol. 2007, 150, 237–252. [Google Scholar] [CrossRef]
  2. Schultz, H.R.; Stoll, M. Some critical issues in environmental physiology of grapevines: Future challenges and current limitations. Aust. J. Grape Wine Res. 2010, 16, 4–24. [Google Scholar] [CrossRef]
  3. Chaves, M.M.; Zarrouk, O.; Francisco, R.; Costa, J.M.; Santos, T.; Regalado, A.P.; Rodrigues, M.L.; Lopes, C.M. Grapevine under deficit irrigation: Hints from physiological and molecular data. Ann. Bot. 2010, 105, 661–676. [Google Scholar] [CrossRef]
  4. Cifre, J.; Bota, J.; Escalona, J.M.; Medrano, H.; Flexas, J. Physiological tools for irrigation scheduling in grapevine (Vitis vinifera L.): An open gate to improve water-use efficiency? Agric. Ecosyst. Environ. 2005, 106, 159–170. [Google Scholar] [CrossRef]
  5. Fereres, E.; Soriano, M.A. Deficit irrigation for reducing agricultural water use. J. Exp. Bot. 2007, 58, 147–159. [Google Scholar] [CrossRef]
  6. Medrano, H.; Escalona, J.M.; Cifre, J.; Bota, J.; Flexas, J. A ten-year study on the physiology of two Spanish grapevine cultivars under field conditions: Effects of water availability from leaf photosynthesis to grape yield and quality. Funct. Plant Biol. 2003, 30, 607–619. [Google Scholar] [CrossRef]
  7. Choné, X.; Van Leeuwen, C.; Dubourdieu, D.; Gaudillère, J.P. Stem water potential is a sensitive indicator of grapevine water status. Ann. Bot. 2001, 87, 477–483. [Google Scholar] [CrossRef]
  8. Jones, H.G.; Stoll, M.; Santos, T.; de Sousa, C.; Chaves, M.M.; Grant, O.M. Use of infrared thermography for monitoring stomatal closure in the field: Application to grapevine. J. Exp. Bot. 2002, 53, 2249–2260. [Google Scholar] [CrossRef]
  9. Grant, O.M.; Tronina, L.; Jones, H.G.; Chaves, M.M. Exploring thermal imaging variables for the detection of stress responses in grapevine under different irrigation regimes. J. Exp. Bot. 2006, 58, 815–825. [Google Scholar] [CrossRef]
  10. Möller, M.; Alchanatis, V.; Cohen, Y.; Meron, M.; Tsipris, J.; Naor, A.; Ostrovsky, V.; Sprintsin, M.; Cohen, S. Use of thermal and visible imagery for estimating crop water status of irrigated grapevine. J. Exp. Bot. 2006, 58, 827–838. [Google Scholar] [CrossRef] [Green Version]
  11. Maes, W.H.; Steppe, K. Estimating evapotranspiration and drought stress with ground-based thermal remote sensing in agriculture: A review. J. Exp. Bot. 2012, 63, 4671–4712. [Google Scholar] [CrossRef]
  12. Zarco-Tejada, P.J.; González-Dugo, V.; Williams, L.E.; Suárez, L.; Berni, J.A.J.; Goldhamer, D.; Fereres, E. A PRI-based water stress index combining structural and chlorophyll effects: Assessment using diurnal narrow-band airborne imagery and the CWSI thermal index. Remote Sens. Environ. 2013, 138, 38–50. [Google Scholar] [CrossRef]
  13. Serrano, L.; González-Flor, C.; Gorchs, G. Assessing vineyard water status using the reflectance based Water Index. Agric. Ecosyst. Environ. 2010, 139, 490–499. [Google Scholar] [CrossRef]
  14. Rodríguez-Pérez, J.R.; Riaño, D.; Carlisle, E.C.; Ustin, S.B.; Smart, D.R. Evaluation of hyperspectral reflectance indexes to detect grapevine water status in vineyards. Am. J. Enol. Vitic. 2007, 58, 302–317. [Google Scholar]
  15. De Bei, R.; Cozzolino, D.; Sullivan, W.; Cynkar, W.; Fuentes, S.; Dambergs, R.; Pech, J.; Tyerman, S.D. Non-destructive measurement of grapevine water potential using near infrared spectroscopy. Aust. J. Grape Wine Res. 2011, 17, 62–71. [Google Scholar] [CrossRef]
  16. Peñuelas, J.; Filella, I.; Biel, C.; Serrano, L.; Savé, R. The reflectance at the 950–970 nm region as an indicator of plant water status. Int. J. Remote Sens. 1993, 14, 1887–1905. [Google Scholar] [CrossRef]
  17. Gamon, J.A.; Serrano, L.; Surfus, J.S. The photochemical reflectance index: An optical indicator of photosynthetic radiation use efficiency across species, functional types, and nutrient levels. Oecologia 1997, 112, 492–501. [Google Scholar] [CrossRef]
  18. Gamon, J.A.; Peñuelas, J.; Field, C.B. A narrow-waveband spectral index that tracks diurnal changes in photosynthetic efficiency. Remote Sens. Environ. 1992, 41, 35–44. [Google Scholar] [CrossRef]
  19. Suárez, L.; Zarco-Tejada, P.J.; Sepulcre-Cantó, G.; Pérez-Priego, O.; Miller, J.R.; Jiménez-Muñoz, J.C.; Sobrino, J.A. Assessing canopy PRI for water stress detection with diurnal airborne imagery. Remote Sens. Environ. 2008, 112, 560–575. [Google Scholar] [CrossRef]
  20. Stagakis, S.; González-Dugo, V.; Cid, P.; Guillén-Climent, M.L.; Zarco-Tejada, P.J. Monitoring water stress and fruit quality in an orange orchard under regulated deficit irrigation using narrow-band structural and physiological remote sensing indices. ISPRS J. Photogramm. Remote Sens. 2012, 71, 47–61. [Google Scholar] [CrossRef] [Green Version]
  21. Barton, C.V.M.; North, P.R.J. Remote sensing of canopy light use efficiency using the photochemical reflectance index model and sensitivity analysis. Remote Sens. Environ. 2001, 78, 264–273. [Google Scholar] [CrossRef]
  22. Serrano, L.; Ustin, S.L.; Roberts, D.A.; Gamon, J.A.; Peñuelas, J. Deriving water content of chaparral vegetation from AVIRIS data. Remote Sens. Environ. 2000, 74, 570–581. [Google Scholar] [CrossRef]
  23. Sims, D.; Gamon, J. Estimation of vegetation water content and photosynthetic tissue area from spectral reflectance: A comparison of indices based on liquid water and chlorophyll absorption features. Remote Sens. Environ. 2003, 84, 526–537. [Google Scholar] [CrossRef]
  24. Filella, I.; Porcar-Castell, A.; Munné-Bosch, S.; Bäck, J.; Garbulsky, M.F.; Peñuelas, J. PRI assessment of long-term changes in carotenoids/chlorophyll ratio and short-term changes in de-epoxidation state of the xanthophyll cycle. Int. J. Remote Sens. 2009, 30, 4443–4455. [Google Scholar] [CrossRef]
  25. Wong, C.Y.S.; Gamon, J.A. Three causes of variation in the photochemical reflectance index (PRI) in evergreen conifers. New Phytol. 2015, 206, 187–195. [Google Scholar] [CrossRef]
  26. Smart, R.; Robinson, M. Sunlight into Wine: A Handbook for Winegrape Canopy Management; Winetitles: Adelaide, Australia, 1991. [Google Scholar]
  27. Peñuelas, J.; Filella, I. Visible and near-infrared reflectance techniques for diagnosing plant physiological status. Trends Plant Sci. 1998, 3, 151–156. [Google Scholar] [CrossRef]
  28. Carbonneau, A. Irrigation, vignoble et produits de la vigne. In Traité D’Irrigation; Tiercelin, J.R., Ed.; Lavoisier Tec & Doc: Paris, France, 1998; pp. 257–298. [Google Scholar]
  29. Correia, M.J.; Pereira, J.S.; Chaves, M.M.; Rodrigues, M.L.; Pacheco, C.A. ABA xylem concentrations determine maximum daily leaf conductance of field-grown Vitis vinifera L. plants. Plant Cell Environ. 1995, 18, 511–521. [Google Scholar] [CrossRef]
  30. Schultz, H.R. Differences in hydraulic architecture account for near-isohydric and anisohydric behaviour of two field-grown Vitis vinifera L. cultivars during drought. Plant Cell Environ. 2003, 26, 1393–1405. [Google Scholar] [CrossRef]
  31. Correia, M.J.; Chaves, M.M.C.; Pereira, J.S. Afternoon depression in photosynthesis in grapevine leaves—Evidence for a high light stress effect. J. Exp. Bot. 1990, 41, 417–426. [Google Scholar] [CrossRef]
  32. Flexas, J.; Escalona, J.M.; Medrano, H. Water stress induces different levels of photosynthesis and electron transport rate regulation in grapevines. Plant Cell Environ. 1999, 22, 39–48. [Google Scholar] [CrossRef]
  33. Costa, J.M.; Ortuño, M.F.; Lopes, C.M.; Chaves, M.M. Grapevine varieties exhibiting differences in stomatal response to water deficit. Funct. Plant Biol. 2012, 39, 179–189. [Google Scholar] [CrossRef]
  34. Flexas, J.; Bota, J.; Escalona, J.M.; Sampol, B.; Medrano, H. Effects of drought on photosynthesis in grapevines under field conditions: An evaluation of stomatal and mesophyll limitations. Funct. Plant Biol. 2002, 29, 461–471. [Google Scholar] [CrossRef]
  35. Medrano, H.; Escalona, J.M.; Bota, J.; Gulías, J.; Flexas, J. Regulation of photosynthesis of C3 plants in response to progressive drought: Stomatal conductance as a reference parameter. Ann. Bot. 2002, 89, 895–905. [Google Scholar] [CrossRef]
  36. Jones, H.G. Irrigation scheduling: Advantages and pitfalls of plant-based methods. J. Exp. Bot. 2004, 55, 2427–2436. [Google Scholar] [CrossRef]
  37. Sun, P.; Wahbi, S.; Tsonev, T.; Haworth, M.; Liu, S.; Centritto, M. On the use of leaf spectral indices to assess water status and photosynthetic limitations in Olea europaea L. during water-stress and recovery. PLoS ONE 2014, 9, e105165. [Google Scholar] [CrossRef]
  38. Serrano, L.; Peñuelas, J. Assessing forest structure and function from spectral transmittance measurements: A case study in a Mediterranean holm oak forest. Tree Physiol. 2005, 67–74. [Google Scholar] [CrossRef]
  39. Zhang, C.; Filella, I.; Liu, D.; Ogaya, R.; Llusià, J.; Asensio, D.; Peñuelas, J. Photochemical Reflectance Index (PRI) for detecting responses of diurnal and seasonal photosynthetic activity to experimental drought and warming in a mediterranean Shrubland. Remote Sens. 2017, 9, 1189. [Google Scholar] [CrossRef]
  40. Dzikiti, S.; Verreynne, J.S.; Stuckens, J.; Strever, A.; Verstraeten, W.W.; Swennen, R.; Coppin, P. Determining the water status of Satsuma mandarin trees [Citrus Unshiu Marcovitch] using spectral indices and by combining hyperspectral and physiological data. Agric. For. Meteorol. 2010, 150, 369–379. [Google Scholar] [CrossRef]
  41. Patakas, A.; Noitsakis, B.; Chouzouri, A. Optimization of irrigation water use in grapevines using the relationship between transpiration and plant water status. Agric. Ecosyst. Environ. 2005, 106, 253–259. [Google Scholar] [CrossRef]
  42. De Souza, C.R.; Maroco, J.P.; dos Santos, T.P.; Rodrigues, M.L.; Lopes, C.; Pereira, J.S.; Chaves, M.M. Control of stomatal aperture and carbon uptake by deficit irrigation in two grapevine cultivars. Agric. Ecosyst. Environ. 2005, 106, 261–274. [Google Scholar] [CrossRef]
  43. Intrigliolo, D.S.; Castel, J.R. Vine and soil-based measures of water status in a Tempranillo vineyard. VITIS J. Grapevine Res. 2006, 45, 157–163. [Google Scholar]
  44. Pôças, I.; Rodrigues, A.; Gonçalves, S.; Costa, P.M.; Gonçalves, I.; Pereira, L.S.; Cunha, M. Predicting grapevine water status based on hyperspectral reflectance vegetation indices. Remote Sens. 2015, 7, 16460–16479. [Google Scholar] [CrossRef]
  45. González-Flor, C.; Serrano, L.; Gorchs, G. Predicting berry quality attributes in cv. Xarel·lo rain-fed vineyards using narrow-band reflectance-based indices. Am. J. Enol. Vitic. 2013, 64, 88–97. [Google Scholar] [CrossRef]
  46. Williams, L.E.; Araujo, F.J. Correlations among predawn leaf, midday leaf, and midday stem water potential and their correlations with other measures of soil and plant water status in vitis vinifera. J. Am. Soc. Hortic. Sci. 2002, 127, 448–454. [Google Scholar] [CrossRef]
  47. Winkel, T.; Rambal, S. Stomatal conductance of some grapevines growing in the field under a Mediterranean environment. Agric. For. Meteorol. 1990, 51, 107–121. [Google Scholar] [CrossRef]
  48. Lovisolo, C.; Perrone, I.; Carra, A.; Ferrandino, A.; Flexas, J.; Medrano, H.; Schubert, A. Drought-induced changes in development and function of grapevine (Vitis spp.) organs and in their hydraulic and non-hydraulic interactions at the whole-plant level: A physiological and molecular update. Funct. Plant Biol. 2010, 37, 98–116. [Google Scholar] [CrossRef]
  49. Rogiers, S.Y.; Greer, D.H.; Hutton, R.J.; Landsberg, J.J. Does night-time transpiration contribute to anisohydric behaviour in a Vitis vinifera cultivar? J. Exp. Bot. 2009, 60, 3751–3763. [Google Scholar] [CrossRef] [Green Version]
  50. Gamon, J.A.; Surfus, J.S. Assessing leaf pigment content and activity with a reflectometer. New Phytol. 1999, 143, 105–117. [Google Scholar] [CrossRef]
  51. Gamon, J.A.; Huemmrich, K.F.; Wong, C.Y.S.; Ensminger, I.; Garrity, S.; Hollinger, D.Y.; Noormets, A.; Peñuelas, J. A remotely sensed pigment index reveals photosynthetic phenology in evergreen conifers. Proc. Natl. Acad. Sci. USA 2016, 113, 13087–13092. [Google Scholar] [CrossRef] [Green Version]
  52. Zarco-Tejada, P.J.; Guillén-Climent, M.L.; Hernández-Clemente, R.; Catalina, A.; González, M.R.; Martín, P. Estimating leaf carotenoid content in vineyards using high resolution hyperspectral imagery acquired from an unmanned aerial vehicle (UAV). Agric. For. Meteorol. 2013, 171–172, 281–294. [Google Scholar] [CrossRef]
  53. Ritchie, G.L.; Sullivan, D.G.; Perry, C.D.; Hook, J.E.; Bednarz, C.W.; Sullivan, D.G.; Perry, C.D.; Member Engineer, A.; Hook, J.E.; Bednarz, C.W.; et al. Preparation of a low-cost digital camera system for remote sensing. Appl. Eng. Agric. 2008, 24, 885–896. [Google Scholar] [CrossRef]
  54. Pôças, I.; Gonçalves, J.; Costa, P.M.; Gonçalves, I.; Pereira, L.S.; Cunha, M. Hyperspectral-based predictive modelling of grapevine water status in the Portuguese Douro wine region. Int. J. Appl. Earth Obs. Geoinf. 2017, 58, 177–190. [Google Scholar] [CrossRef]
Figure 1. Diurnal time course of (a) photosynthetic photon flux density incident on the leaf (PPFDi), (b) net photosynthesis (An), (c) stomatal conductance (gs), (d) transpiration rate (E), (e) leaf-to-air vapor pressure deficit (VPD), (f) photochemical reflectance index (PRI), (g) water index (WI), and (h) leaf-to-air temperature difference (ΔT). Values are means ± standard errors of the mean (n = 8).
Agronomy 09 00346 g001
Figure 2. Relationship between the leaf-to-air temperature difference (ΔT) measured at the leaf level in Xarel·lo potted plants with (a) water index (WI) and (b) photochemical reflectance index (PRI). Values are the means ± standard errors of the mean (n = 8) measured at different hours throughout the day.
Agronomy 09 00346 g002
Figure 3. Monthly mean air temperature, precipitation (P) (dark columns), and reference evapotranspiration (ET0) (white columns) at the experimental site in years 2009 and 2010. Data are from the meteorological station of Els Hostalets de Pierola (1°48’31” west (W), 41°31’59” north (N)).
Agronomy 09 00346 g003
Figure 4. Relationship between the predawn water potential (Ψpd) and the canopy-to-air temperature difference (ΔTm) in Xarel·lo field plots acquired in 2009 (open symbols) and 2010 (bold symbols) collected under clear-sky conditions. Values are means ± standard errors of the mean at each plot (n = 8 and n = 12 for 2009 and 2010, respectively). The regression line and regression coefficient are for pooled data across years.
Agronomy 09 00346 g004
Figure 5. Relationships between predawn water potential (Ψpd) and the reflectance indices (a) water index (WI), (b) normalized water index (WInorm), (c) photochemical reflectance index (PRI), and (d) normalized photochemical reflectance index (PRInorm) in Xarel·lo vines. Pooled data for 2009 (n = 14) and 2010 (n = 12).
Agronomy 09 00346 g005aAgronomy 09 00346 g005b
Figure 6. Effects of mild (Ψpd > −0.4 MPa; open bars) and moderate (Ψpd < −0.4 MPa; shaded bars) water deficits on (a) water index (WI), (b) normalized water index (WInorm), (c) photochemical reflectance index (PRI), and (d) normalized photochemical reflectance index (PRInorm) in Xarel·lo vines. Values are means ± standard errors of the mean (n = 6 for mild water deficits in 2009 and 2010; n = 8 and n = 7 for moderate water deficits in 2009 and 2010, respectively).
Agronomy 09 00346 g006aAgronomy 09 00346 g006b
Table 1. Correlation coefficients between leaf-to-air temperature difference (ΔT), stomatal conductance (gs), transpiration (E), net photosynthesis (An), and light-use efficiency (LUE) and the reflectance indices, water index (WI) and photochemical reflectance index (PRI). Data are for average values at each sampling time (n = 8). Significant correlations at the 0.01 (**) level are indicated.
PRIWI
ΔT (°C)−0.92 **−0.90 **
gs (mmol H2O∙m−2∙s−1)0.440.45
E (mmol H2O∙m−2∙s−1)−0.61−0.43
An (μmol CO2∙m−2∙s−1)−0.31 0.01
LUE (μmol CO2∙μmol photon−1)0.96 **0.86 **
Table 2. Correlation coefficients between predawn water potential (Ψpd), canopy-to-air temperature difference at midday (ΔTm), and reflectance indices. Data are averaged values per plot (n = 14 in 2009, except for ΔTm where n = 8; and n = 12 in 2010). Significant correlations at the 0.05 (*) and 0.01 (**) level are indicated. NDVI—normalized difference vegetation index.
200920102009 and 2010
Ψpd (MPa)ΔTm (°C)Ψpd (MPa)ΔTm (°C)Ψpd (MPa)ΔTm (°C)
NDVI0.320.84 **0.19−0.440.090.23
PRI0.76 **0.480.51−0.60 *0.59 **−0.51 *
WI−0.69 **0.19−0.510.53−0.64 **0.49 *
PRInorm0.76 **0.580.57−0.75 **0.63 **−0.56 *
WInorm−0.68 **−0.81 **−0.530.65 *−0.60 **0.21

