Responses of Canopy Growth and Yield of Potato Cultivars to Weather Dynamics in a Complex Topography: Belg Farming Seasons in the Gamo Highlands, Ethiopia

 , ,
, , 
Abstract
:1. Introduction
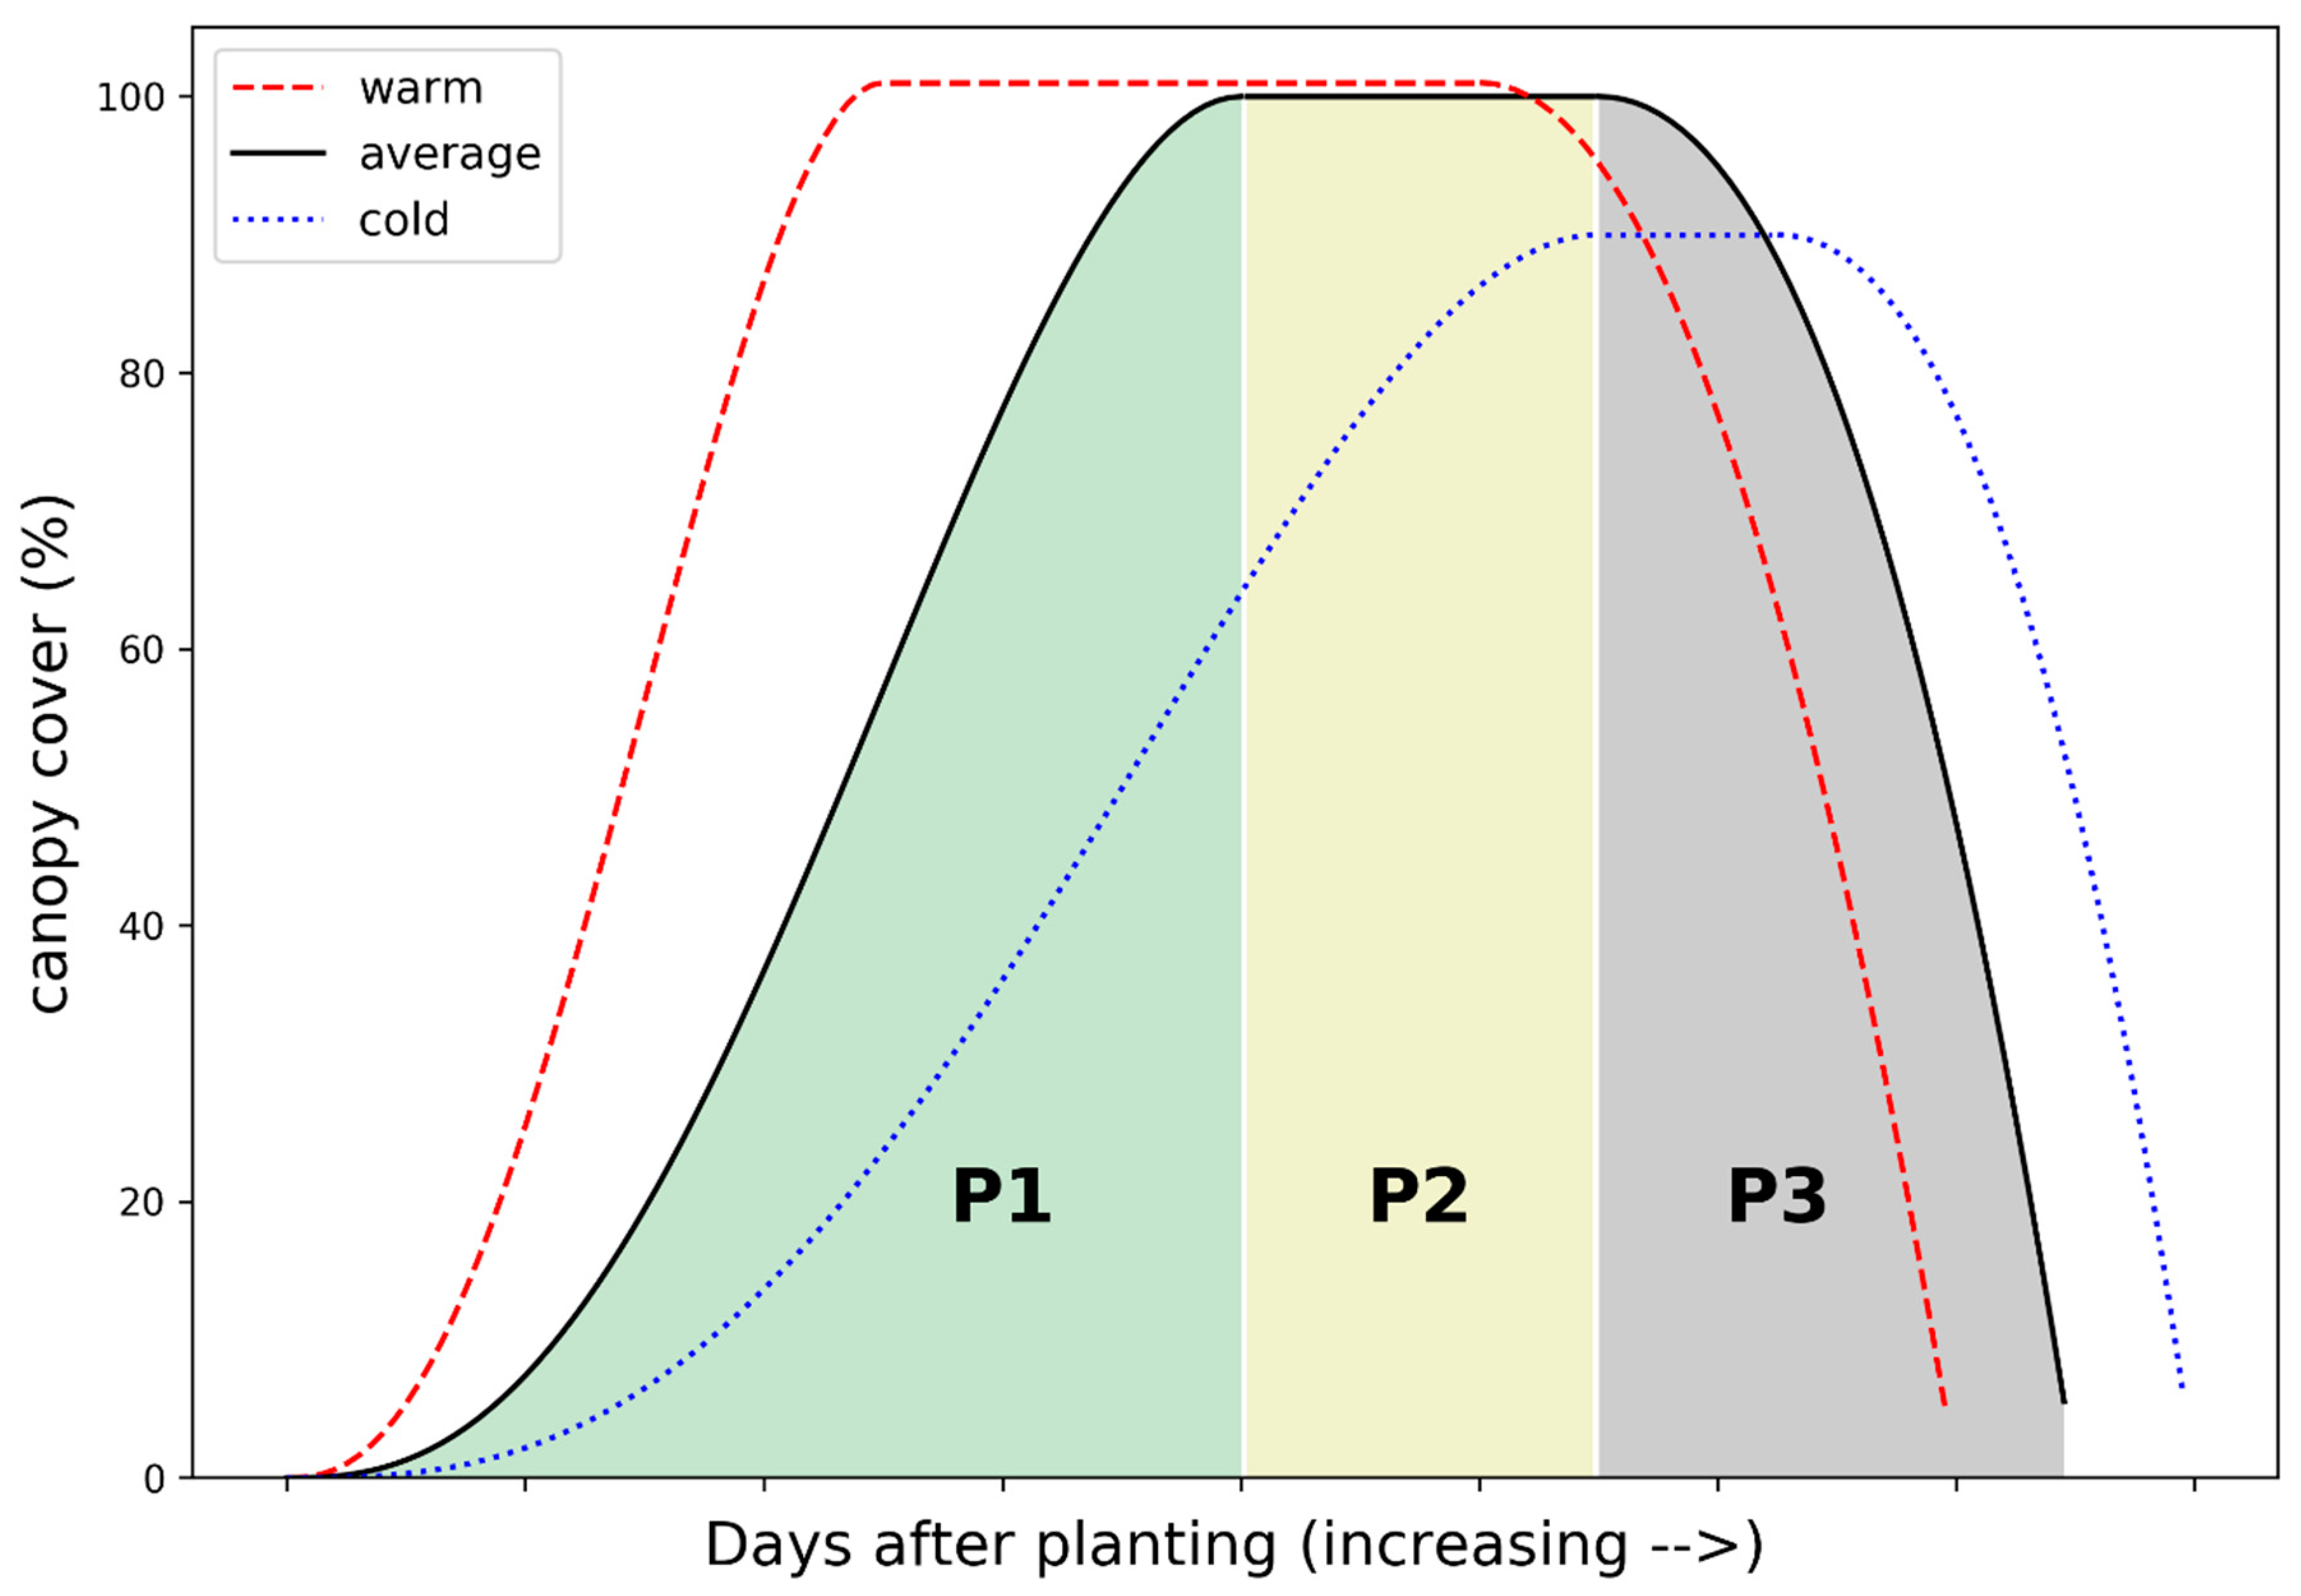
- How does canopy growth vary with environmental variables in P1 across elevations, among potato cultivars, and between seasons? Does this growth follow similar patterns as in temperate climates?
- How does the yield depend on physiological crop characteristics, such as number of tubers, number of branches, days to maturity, cultivar, and on meteorologically dependent variables, such as intercepted radiation and temperature?
2. Materials and Methods
2.1. GEMS Weather Dataset during Belg 2017 and 2018
2.2. The Potato Farm Experiments during Belg-2017 and Belg-2018
2.3. Canopy Growth and Crop Yield Observations
2.4. Statistical and Mathematical Data Analysis Approaches
2.4.1. Crop Growth and Environmental Variables Relations
2.4.2. The Daily Crop Growth and Temperature Sum
2.4.3. Estimating Harvest Index using the Cumulative Incoming Shortwave Radiation
3. Results
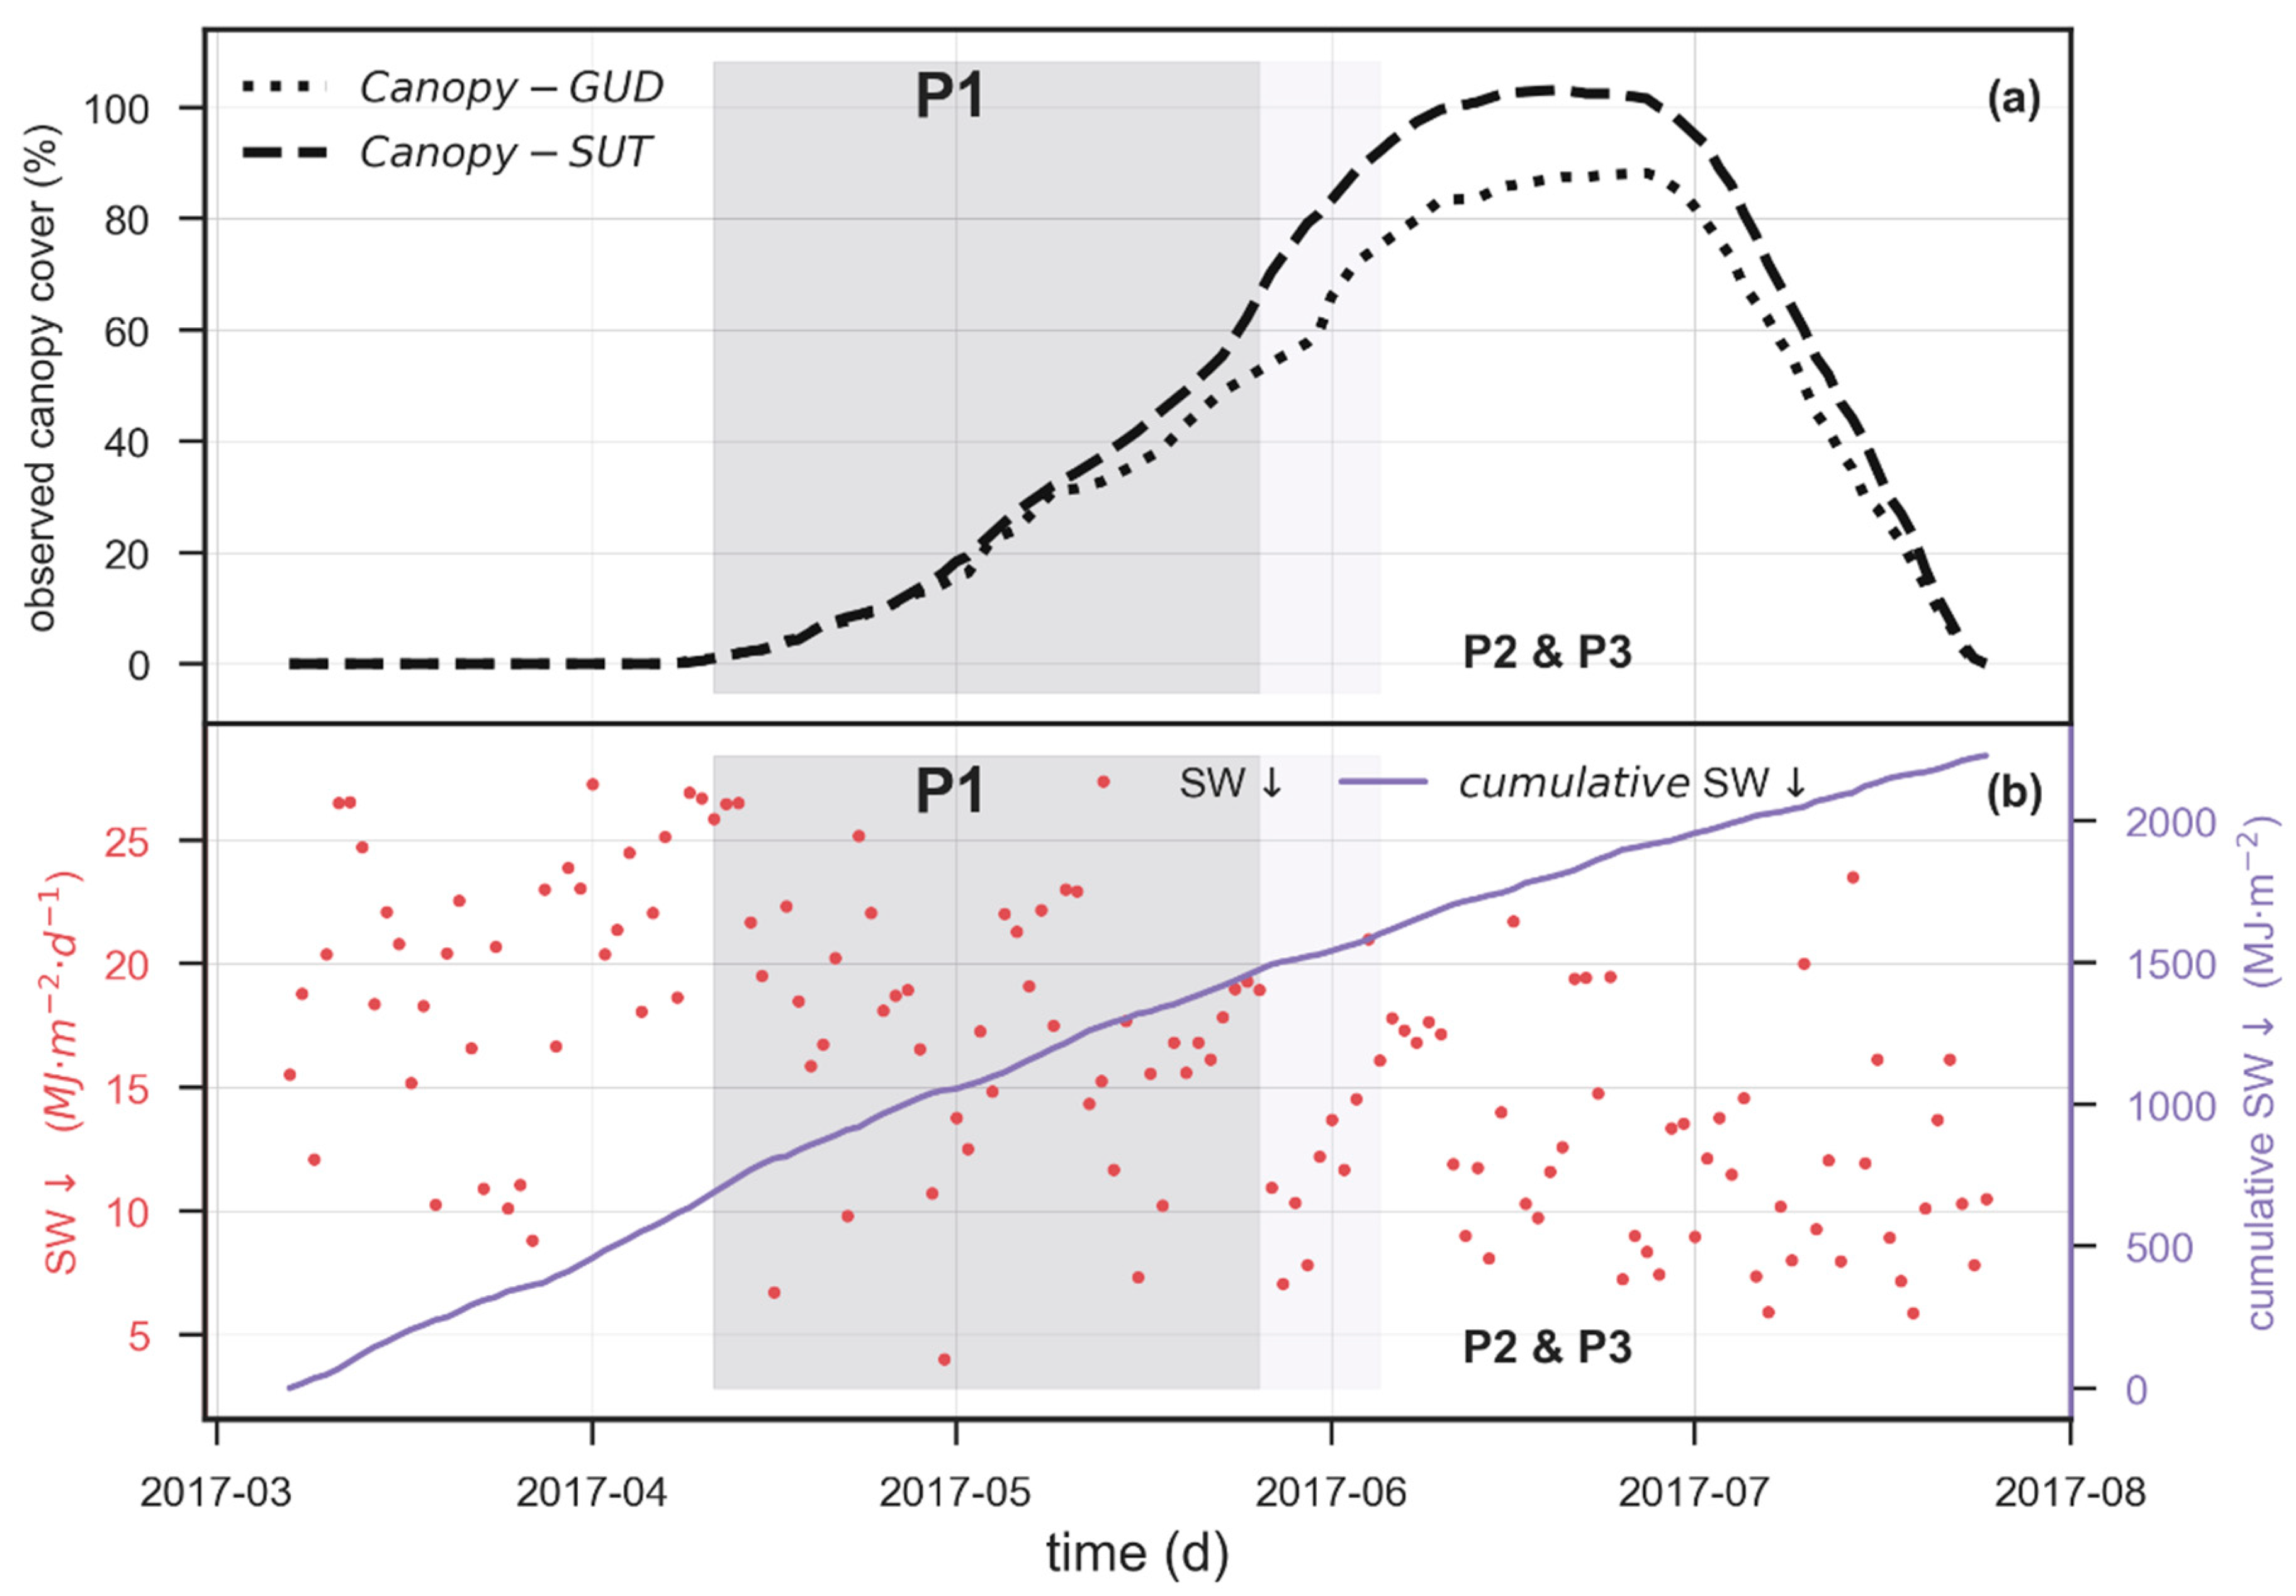
3.1. The Role of Environmental Variables on Canopy Growth in the Canopy Buildup Stage
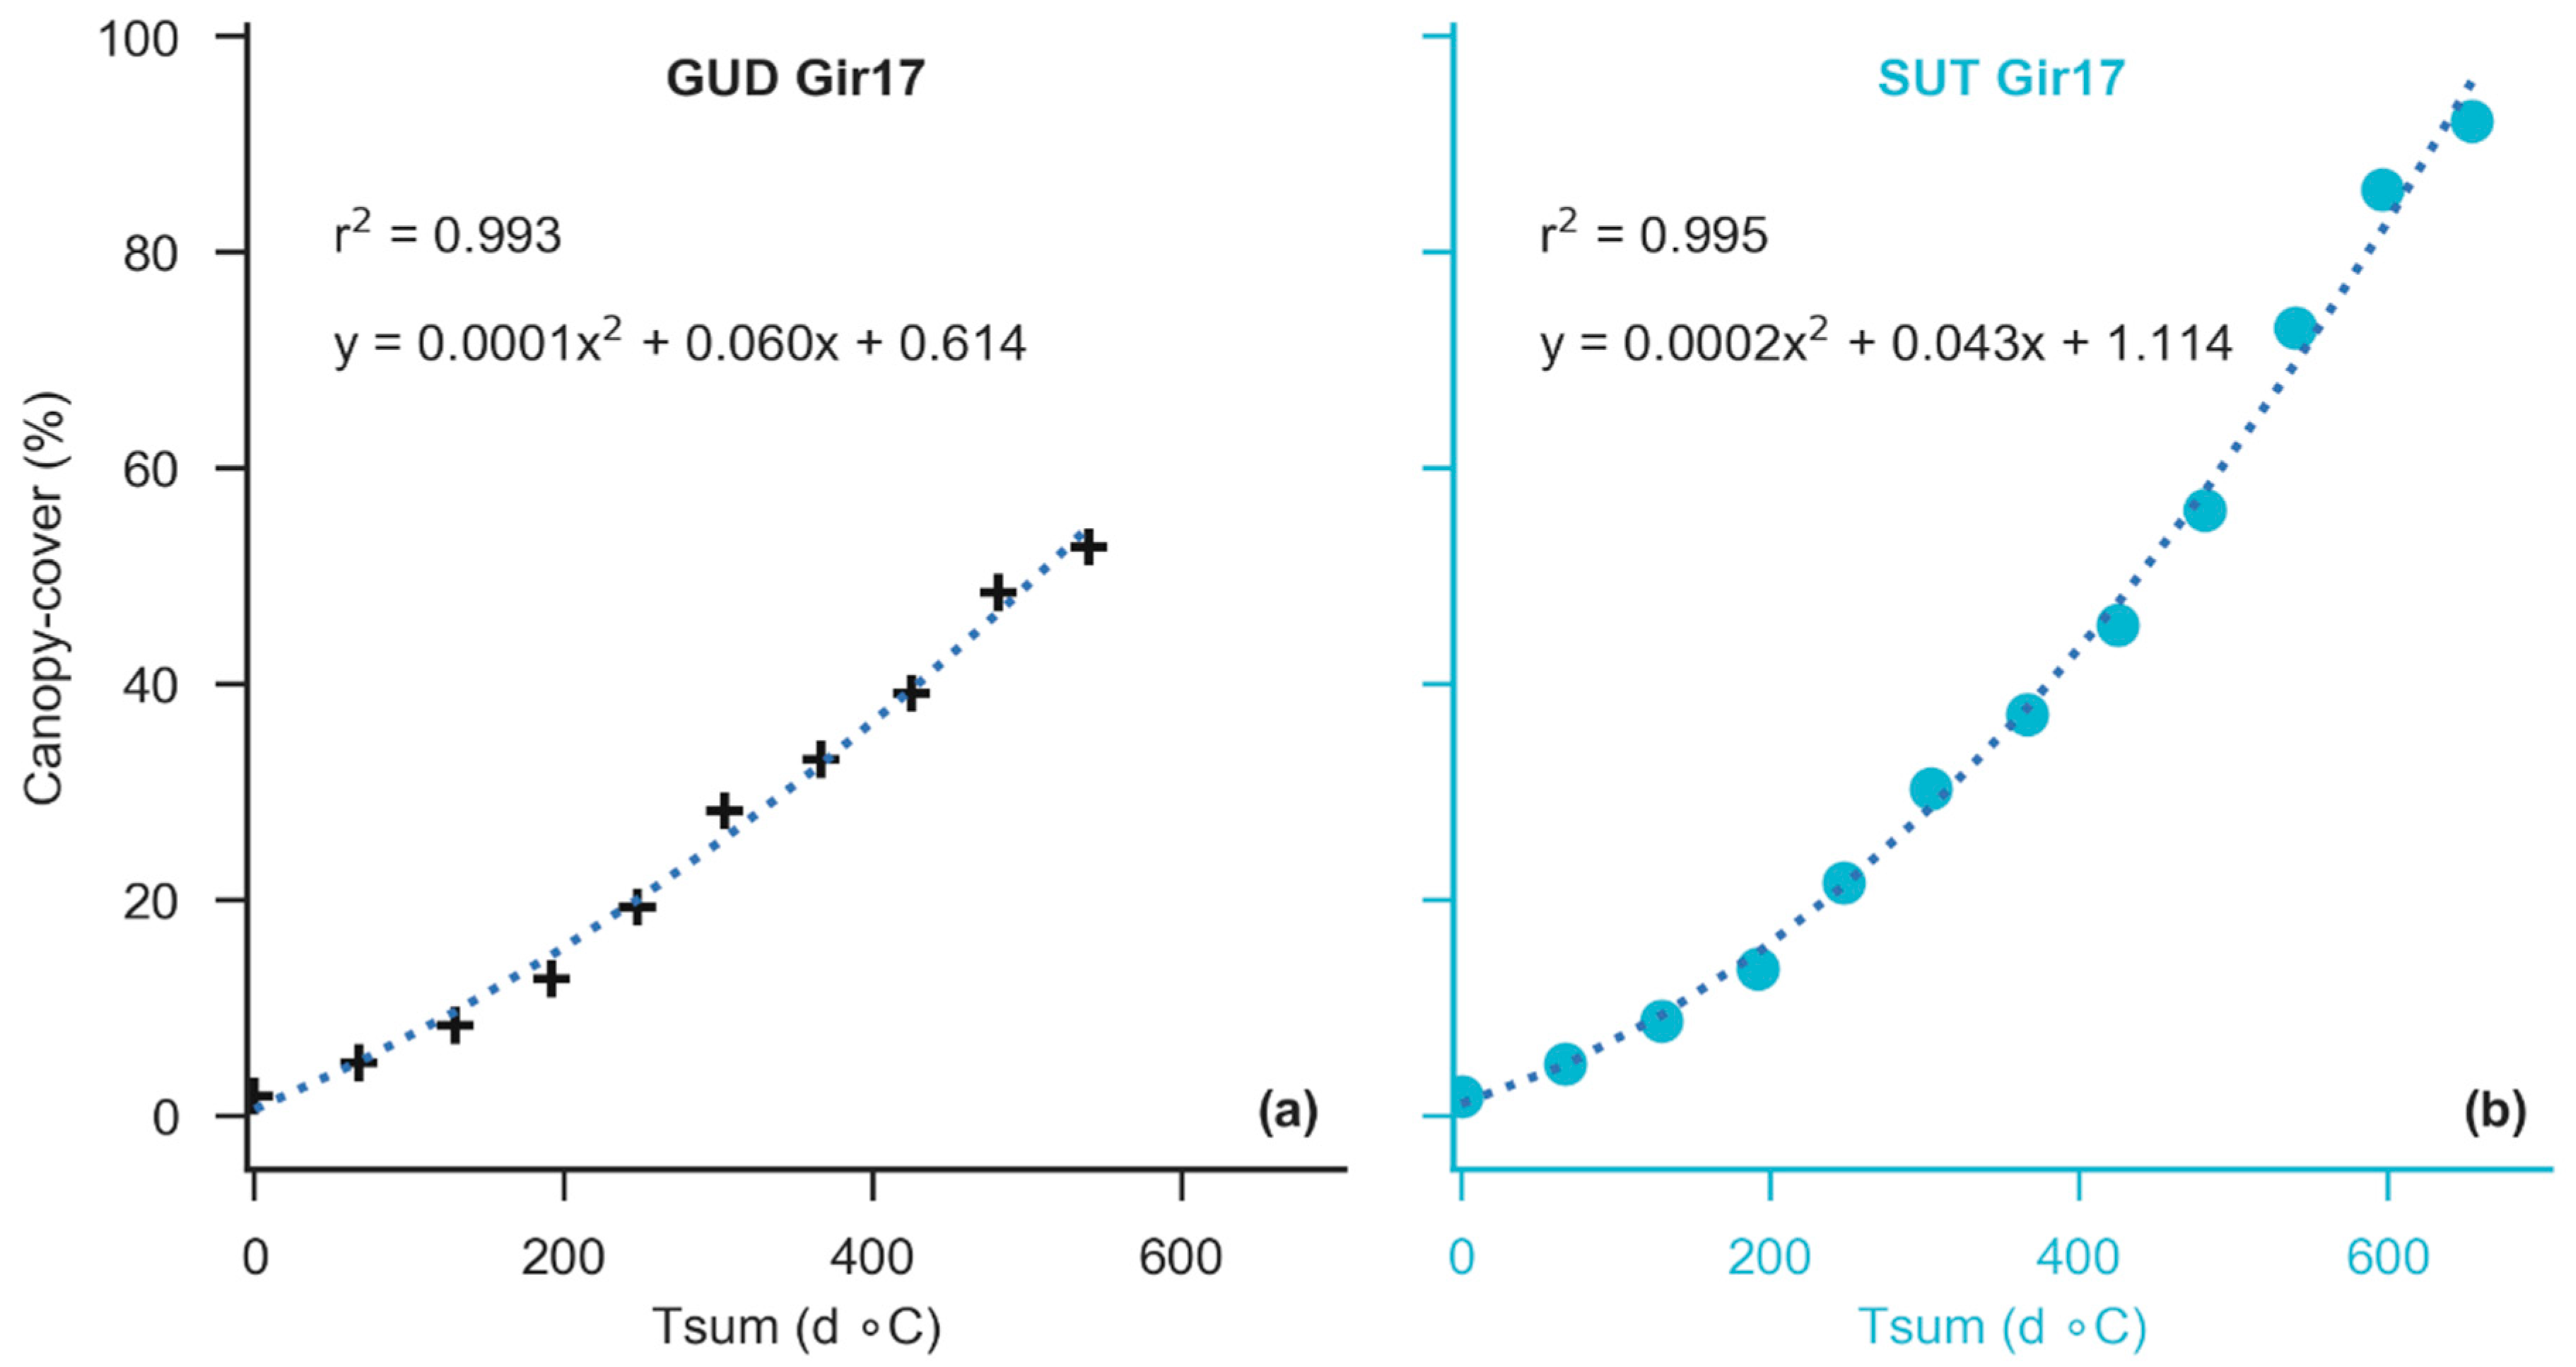
3.1.1. Canopy Cover and Temperature Sum
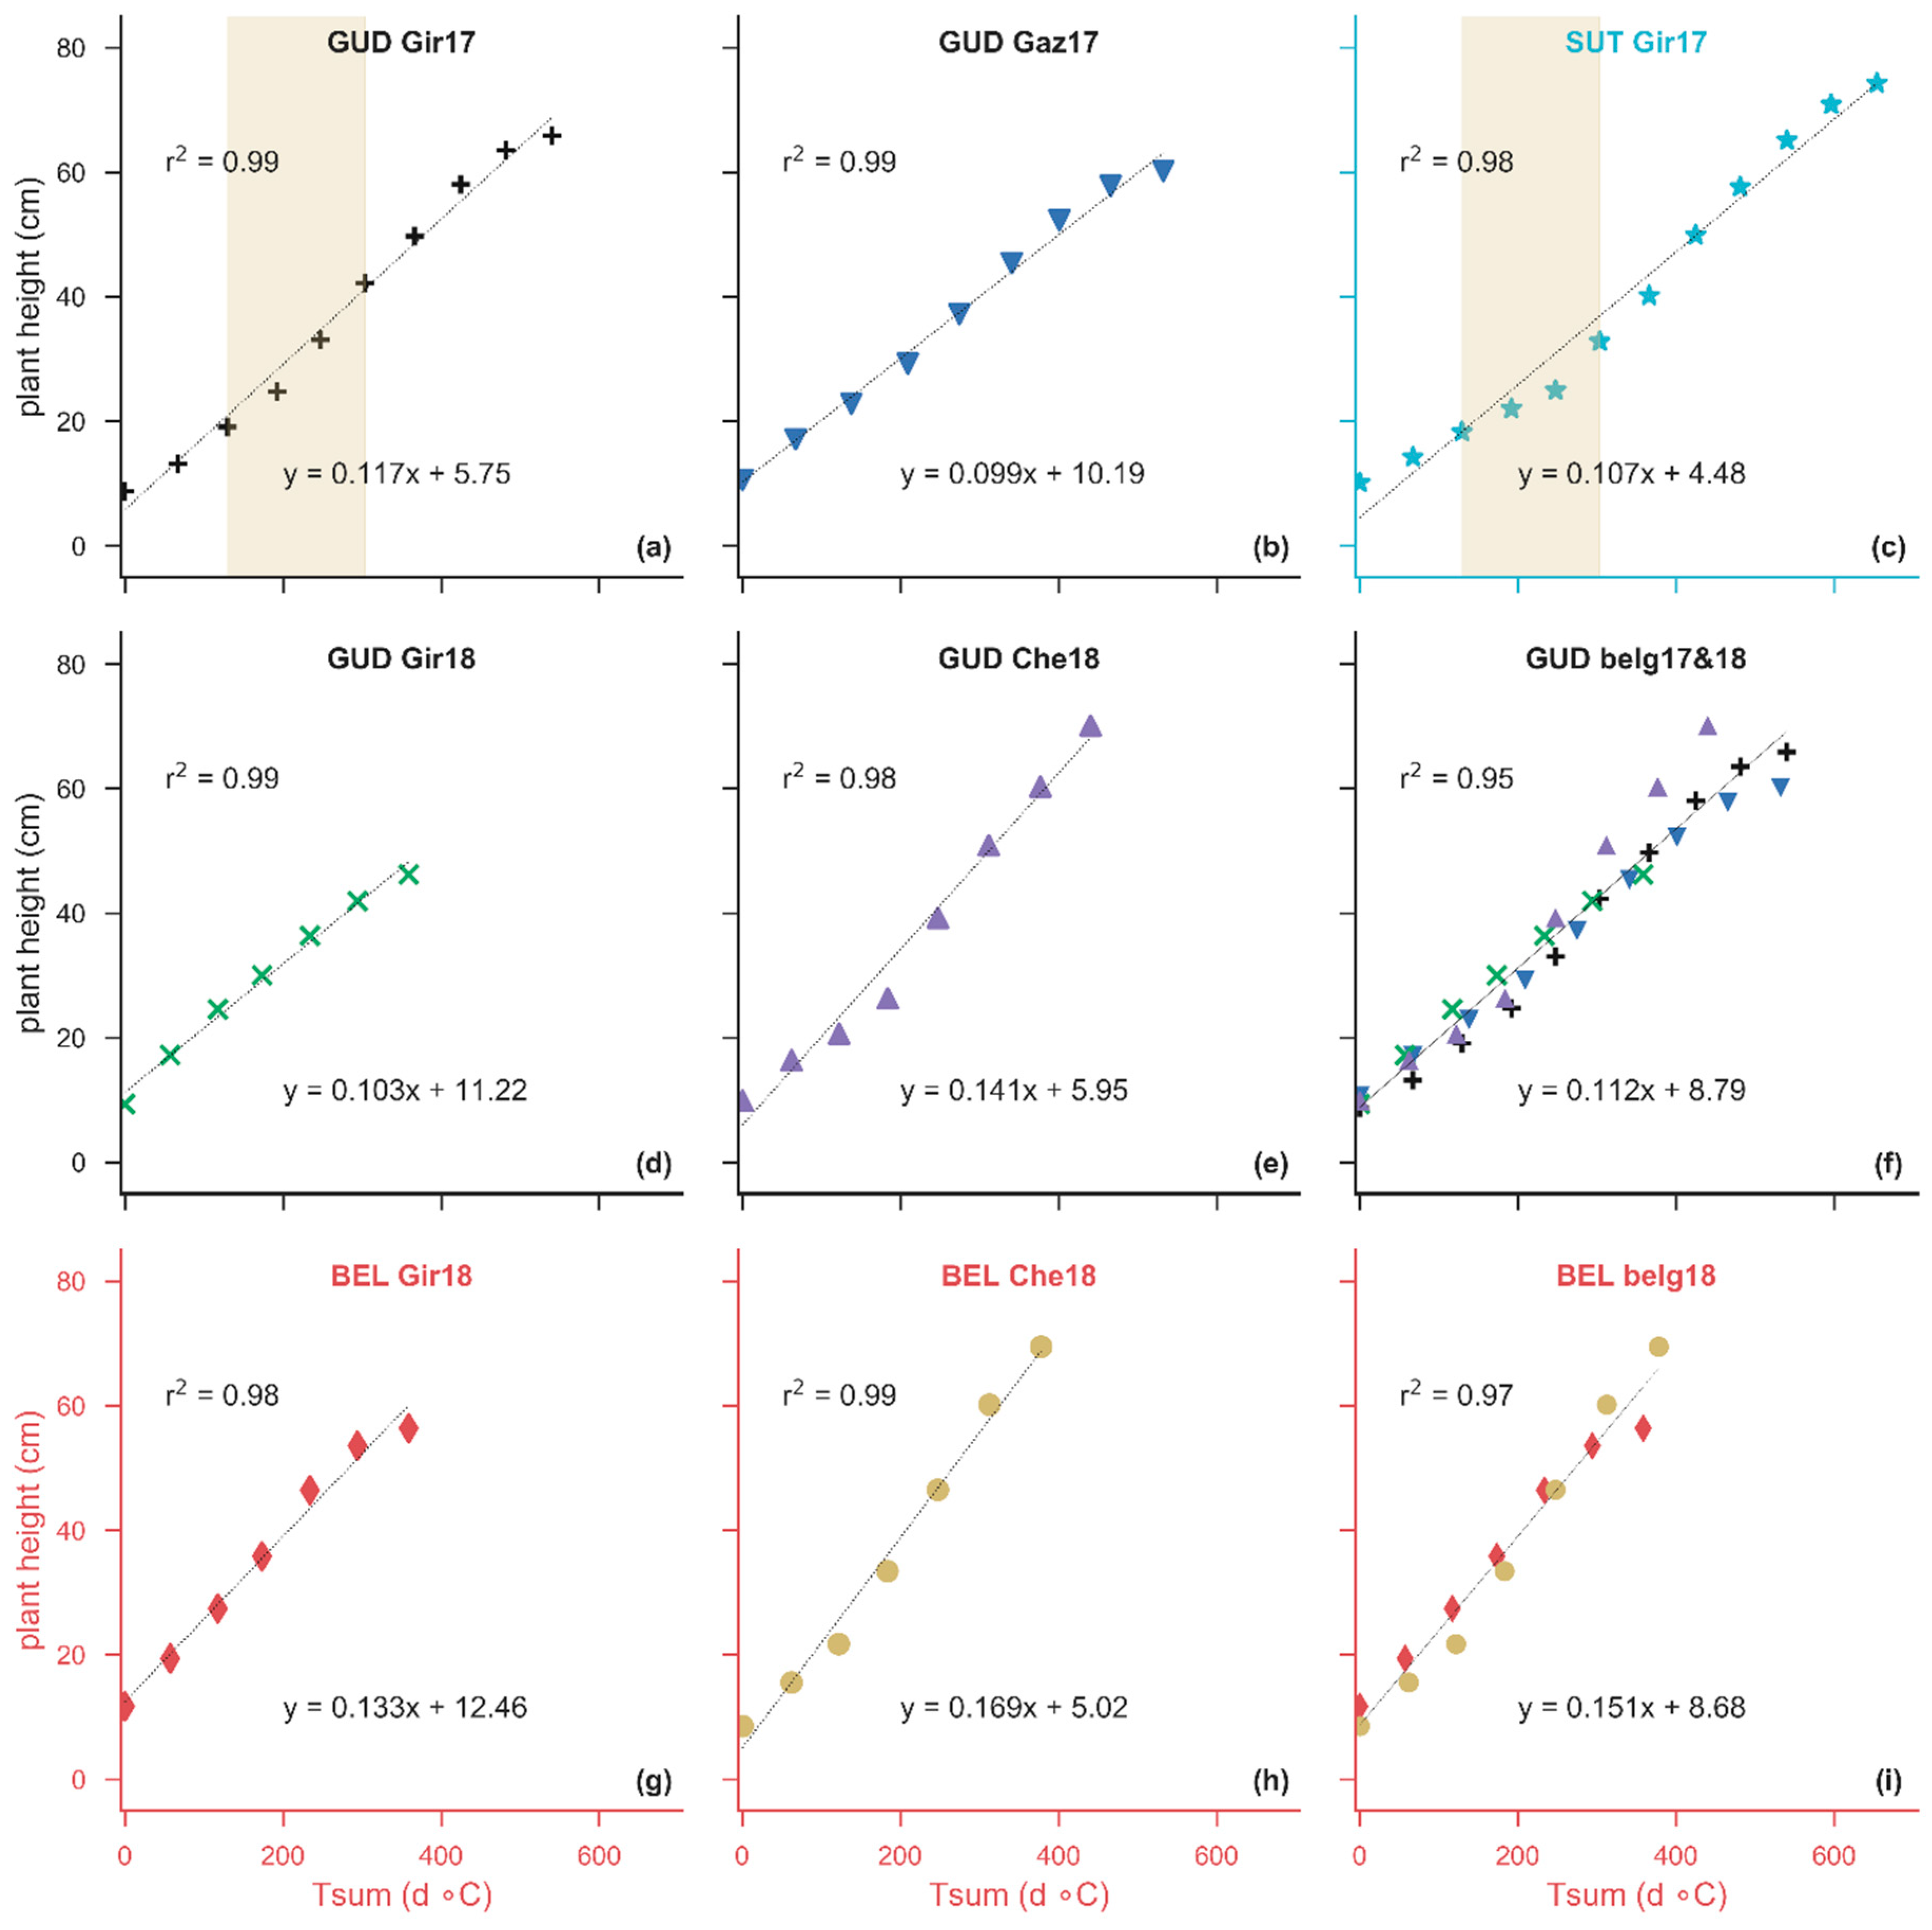
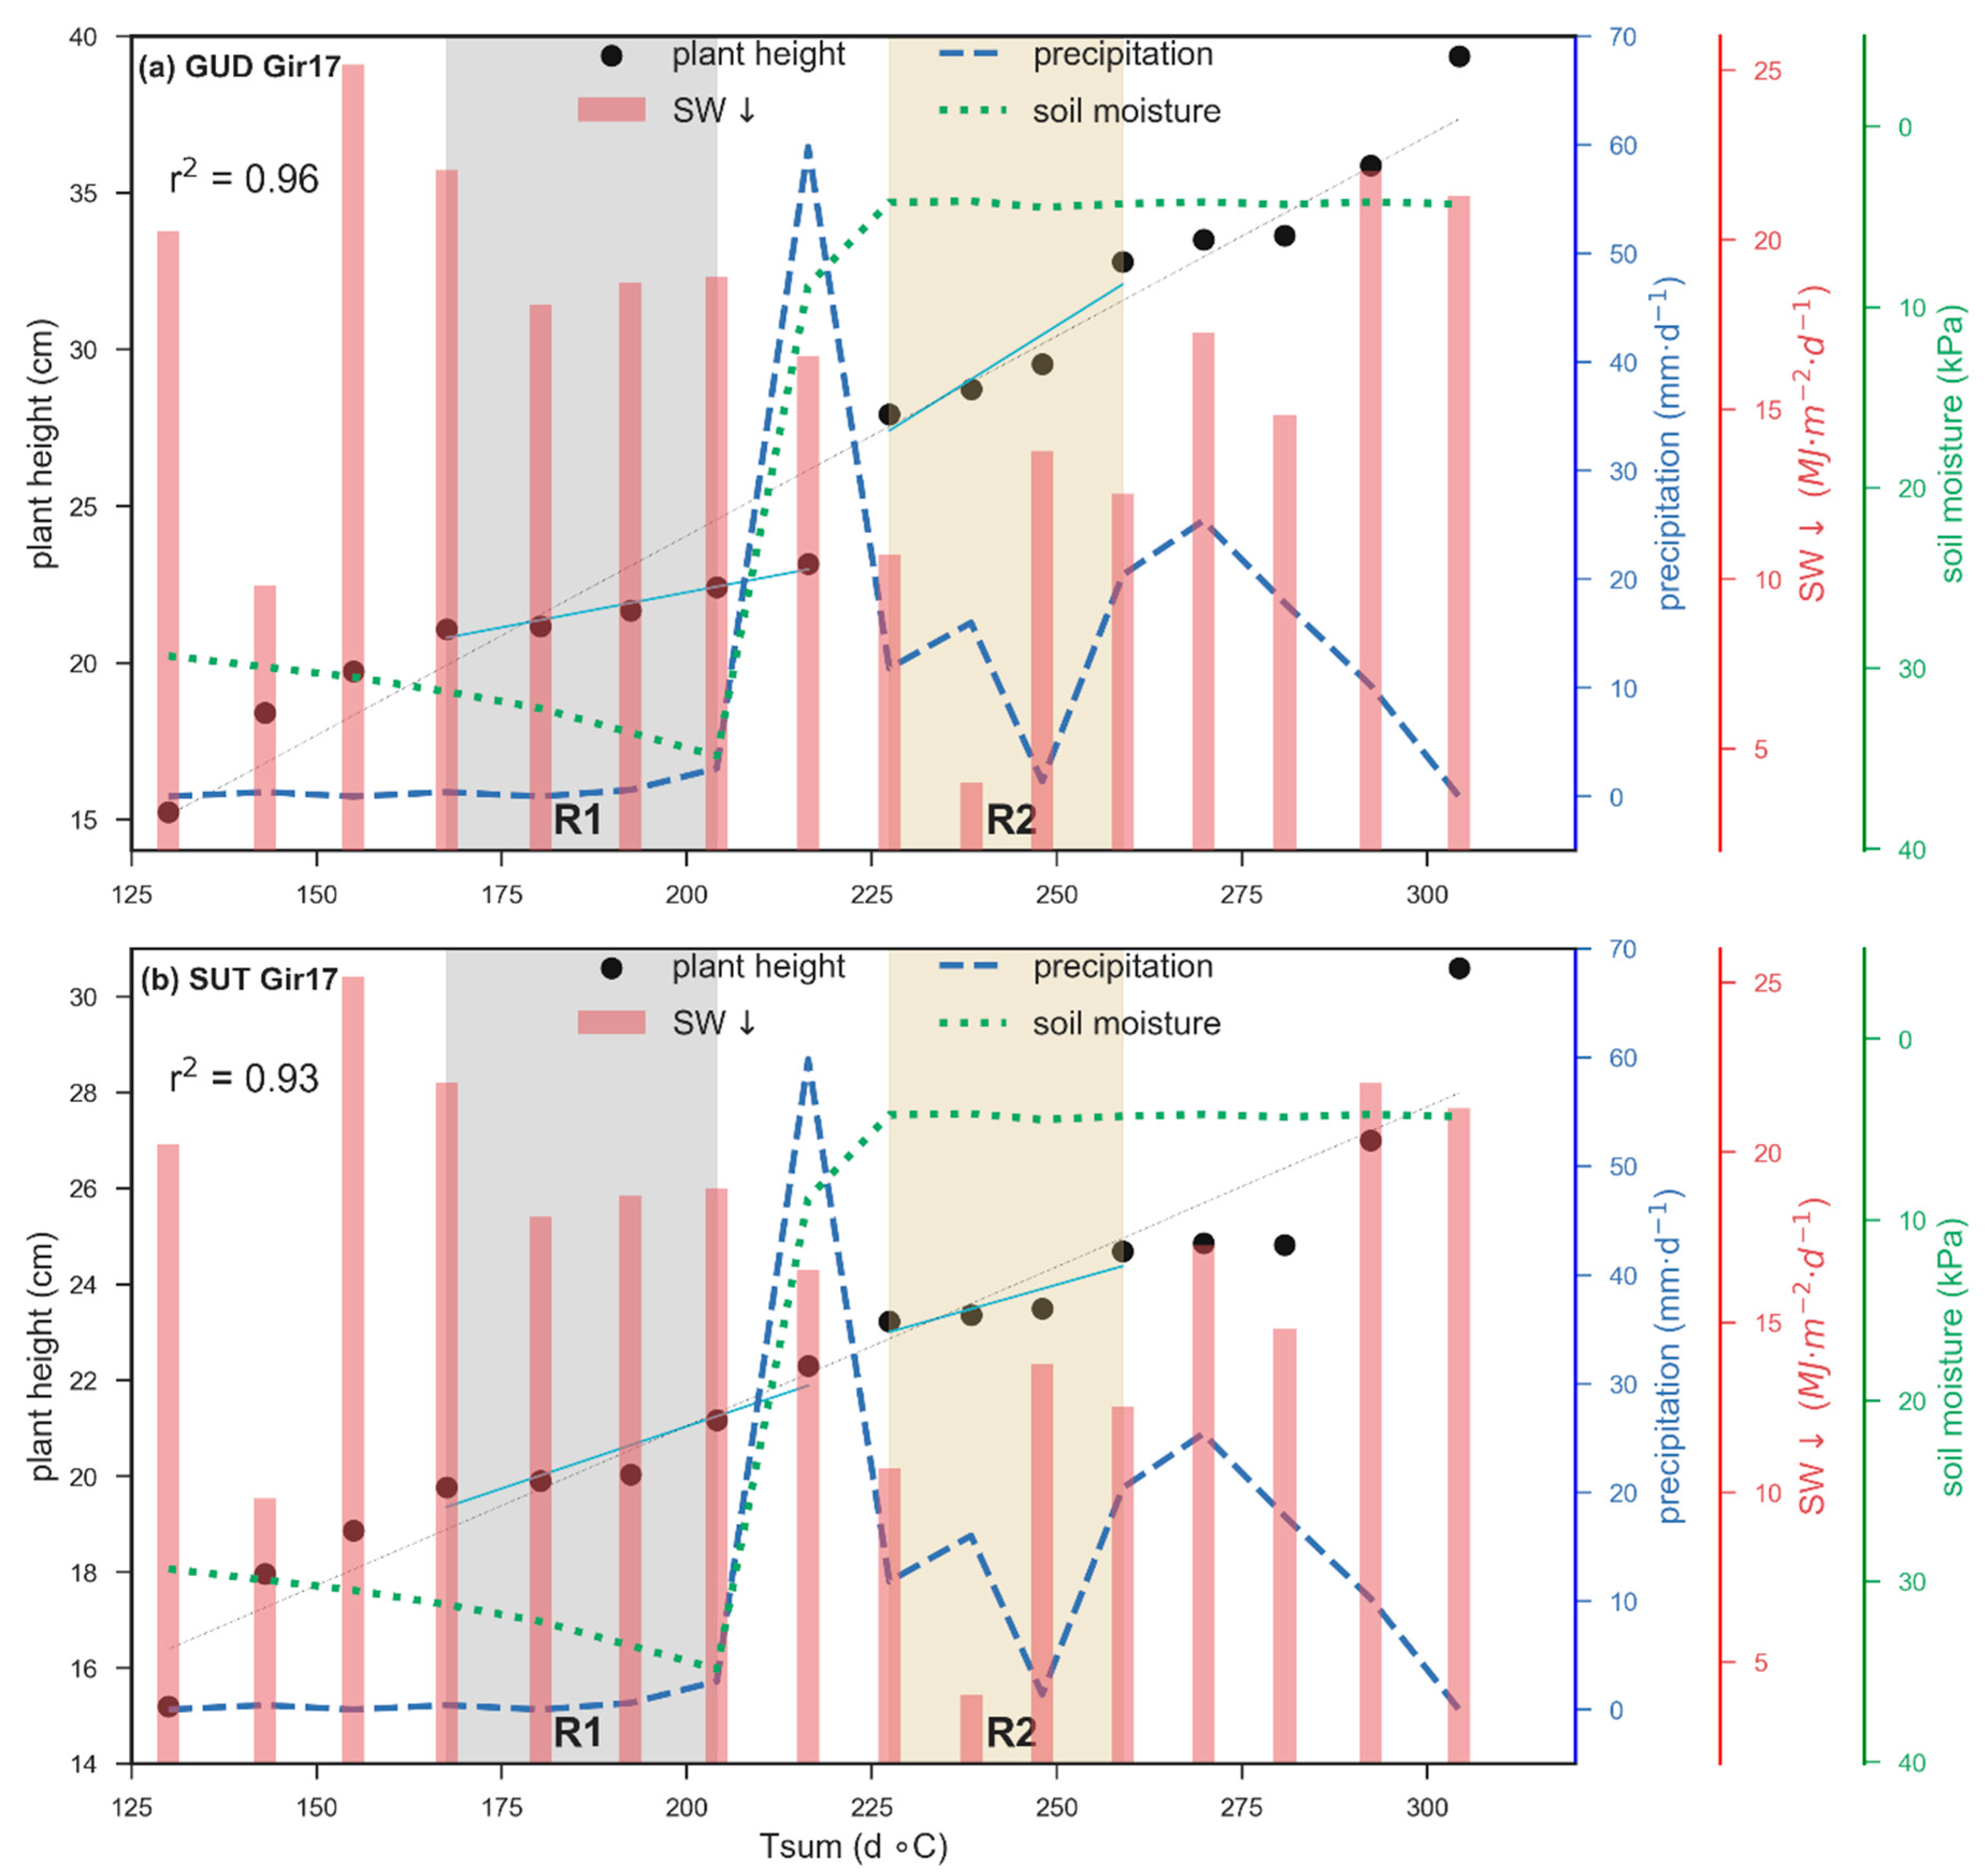
3.1.2. Plant Height and Temperature Sum
3.1.3. A Further Look at the Plant Height—Temperature Sum Curve
3.2. Response of Yield to Variations in Elevation, Cultivar and Environomental Variables
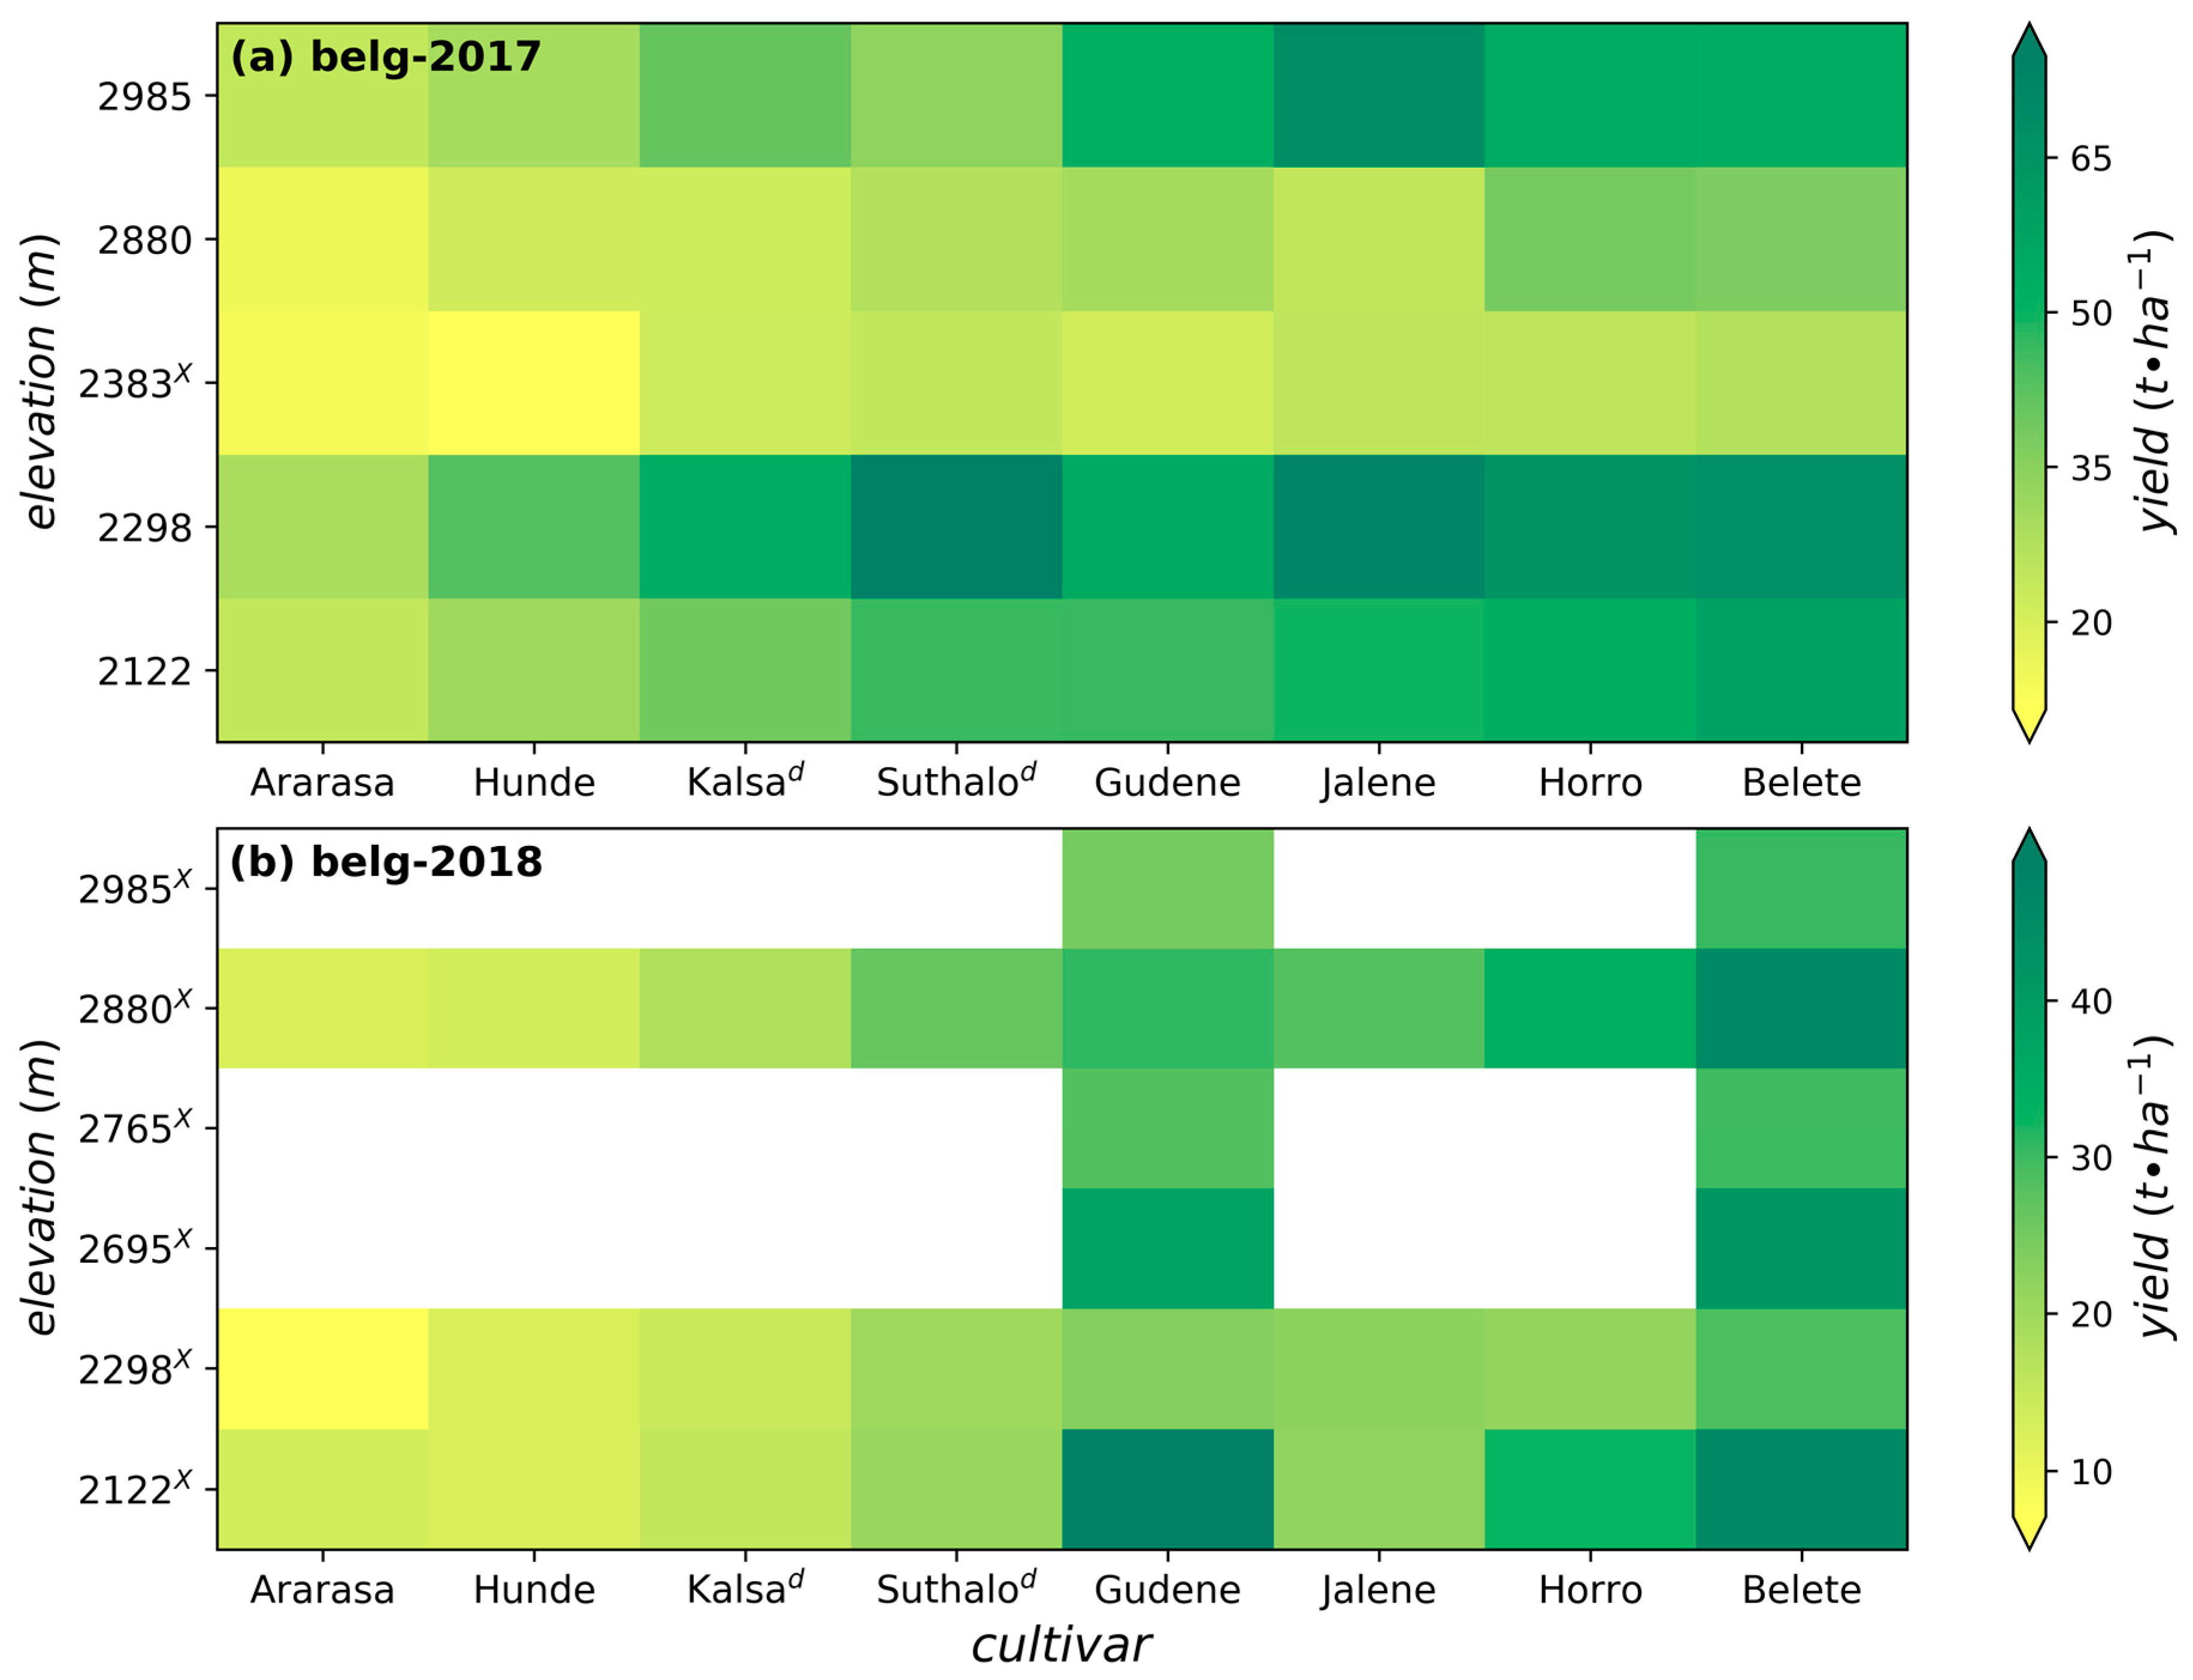
3.2.1. Yield Variations with Topography and Among Cultivars
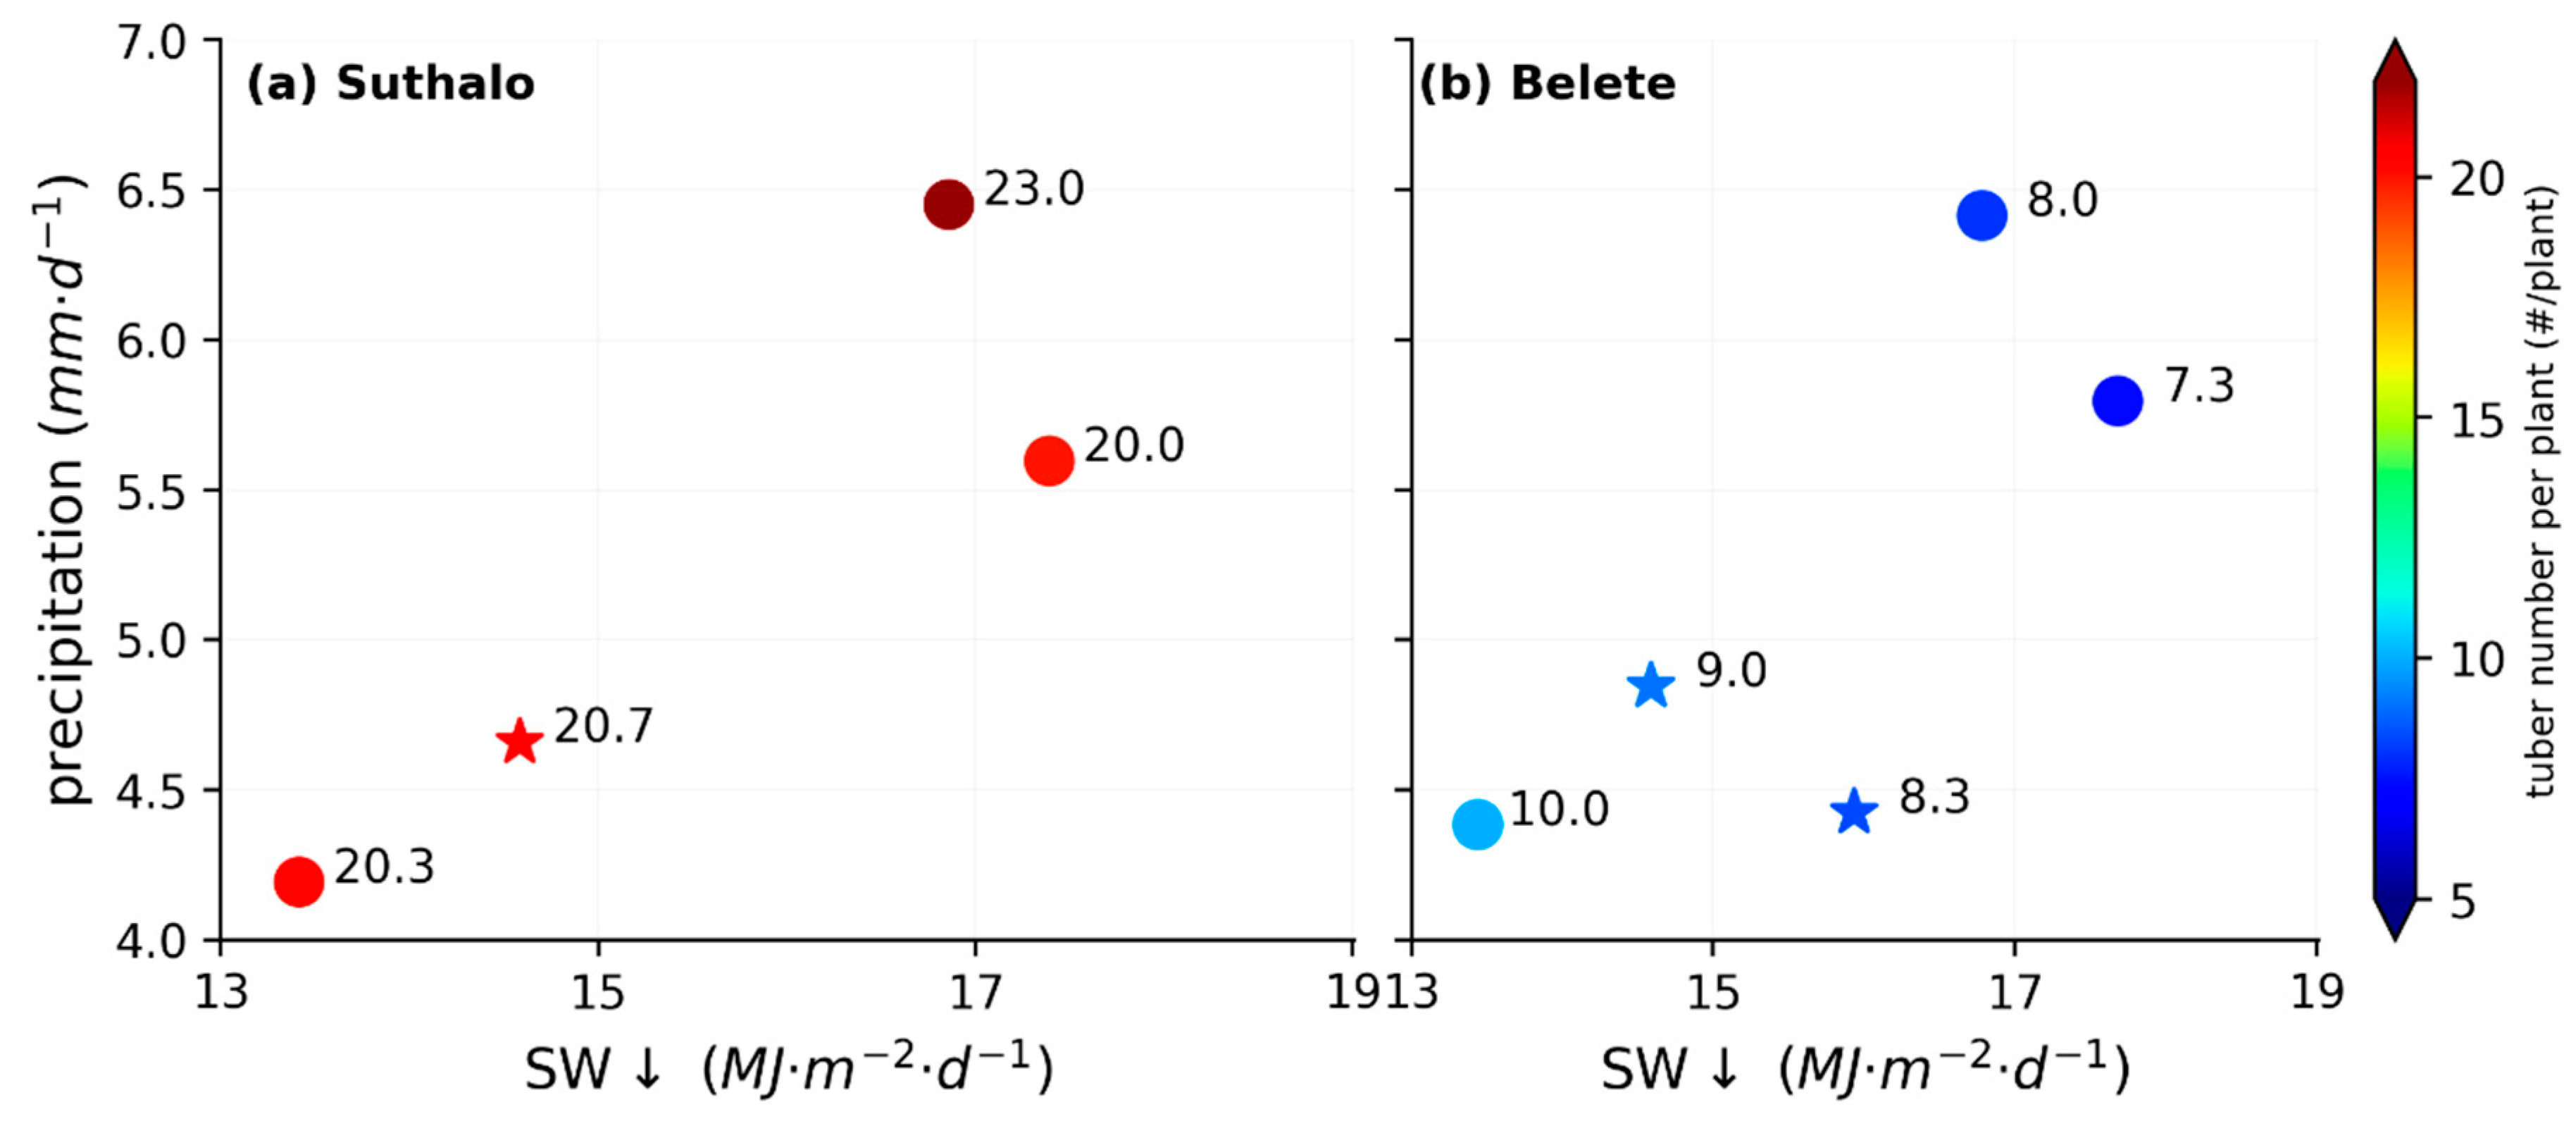
3.2.2. Tuber Number as a Function of Radiation and Precipitation in P1
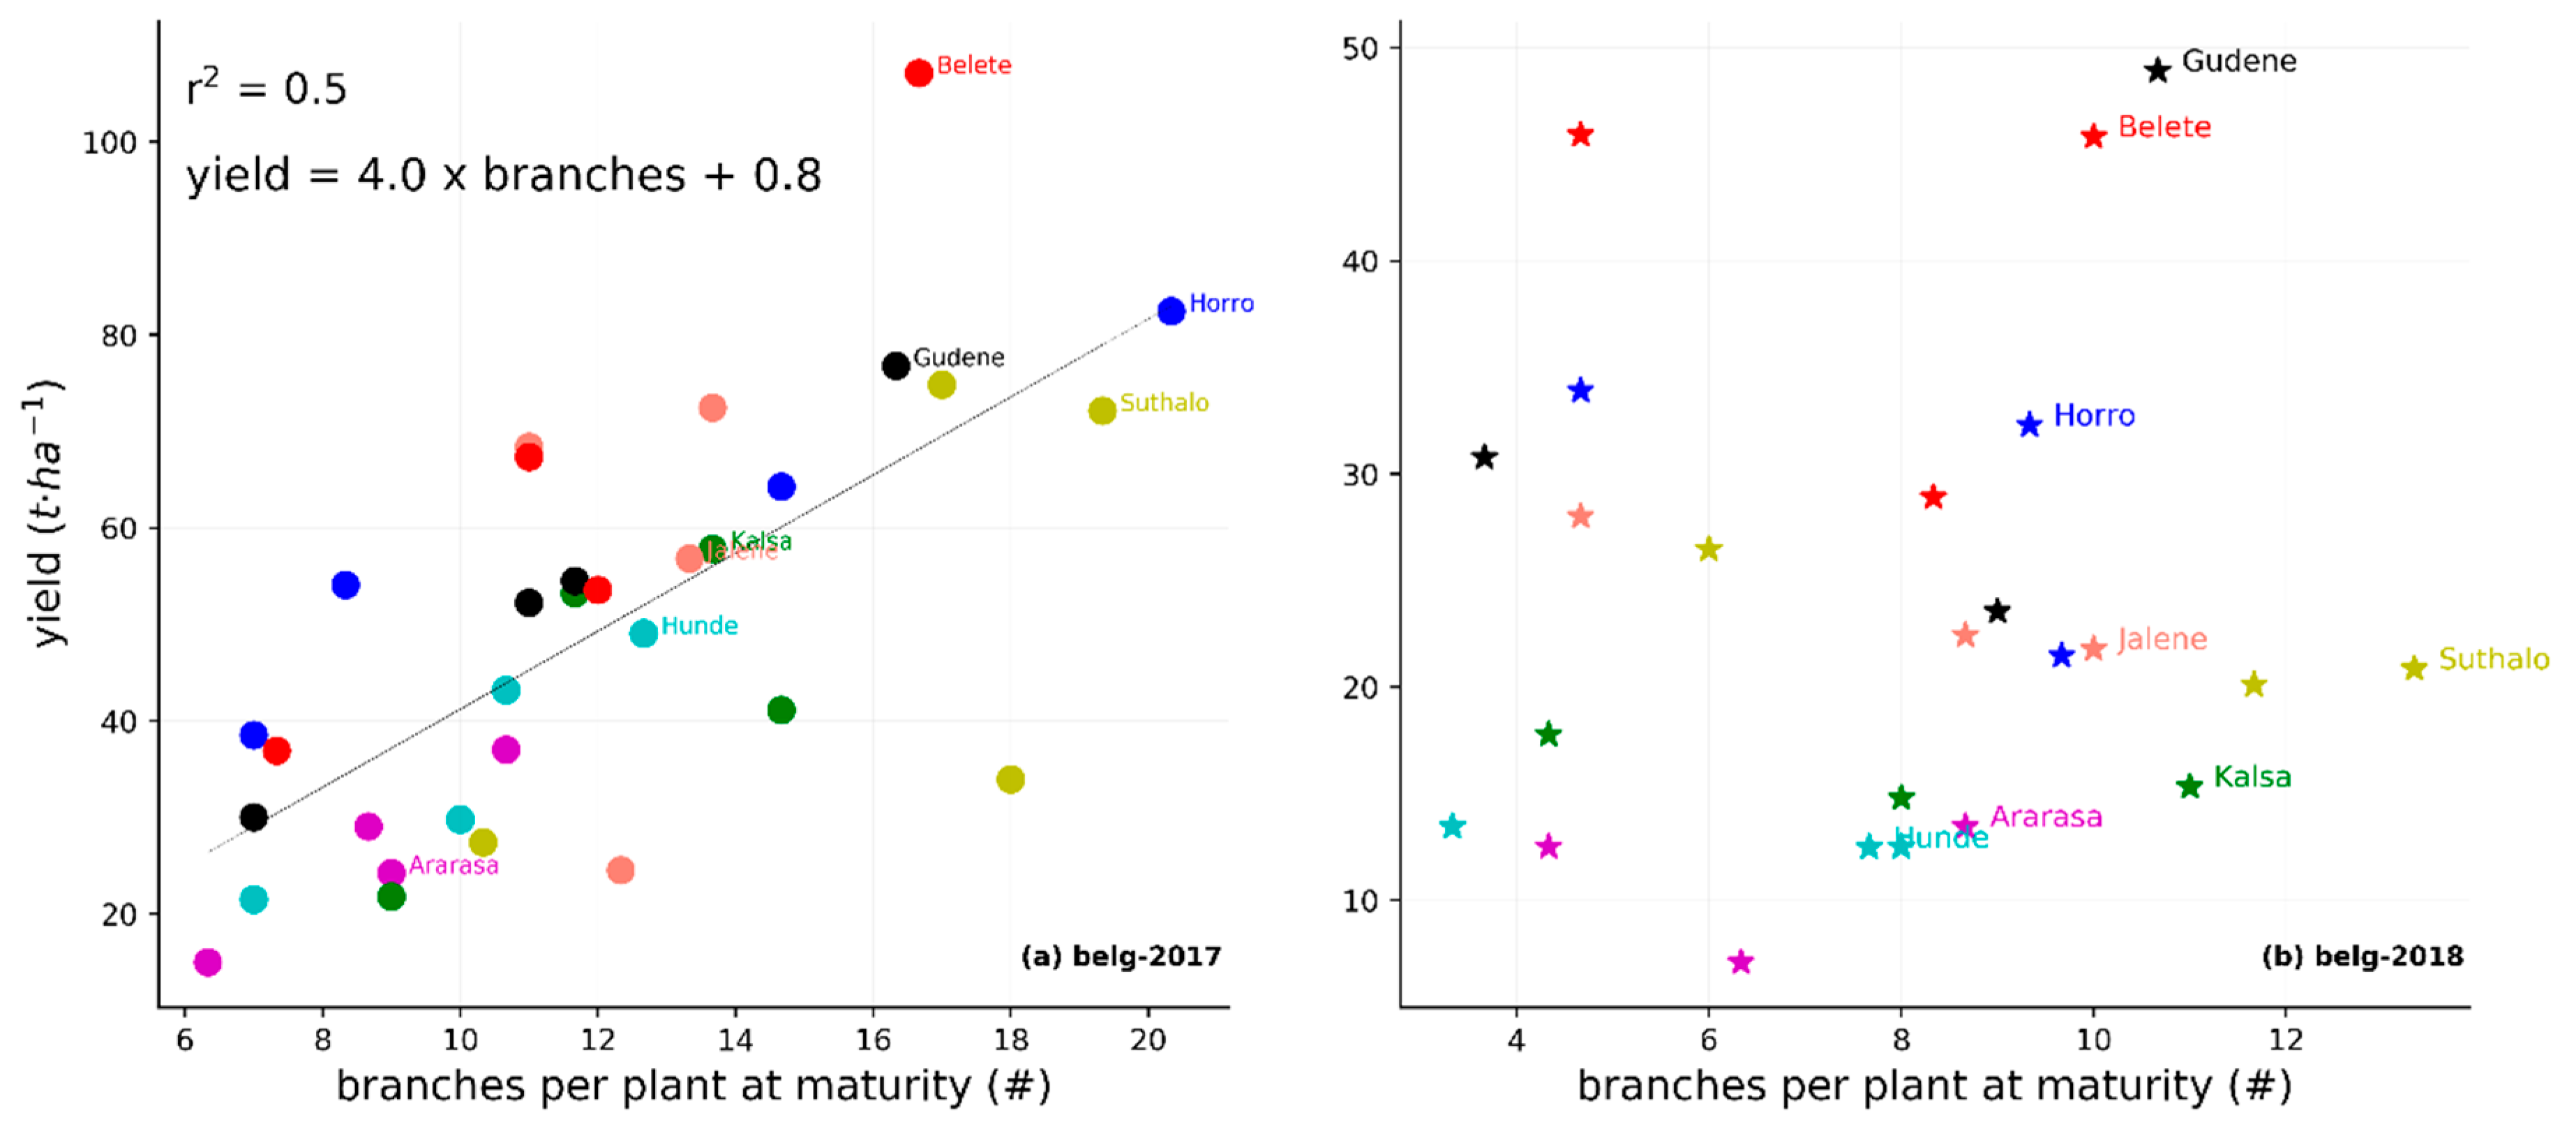
3.2.3. Number of Branches and Yield
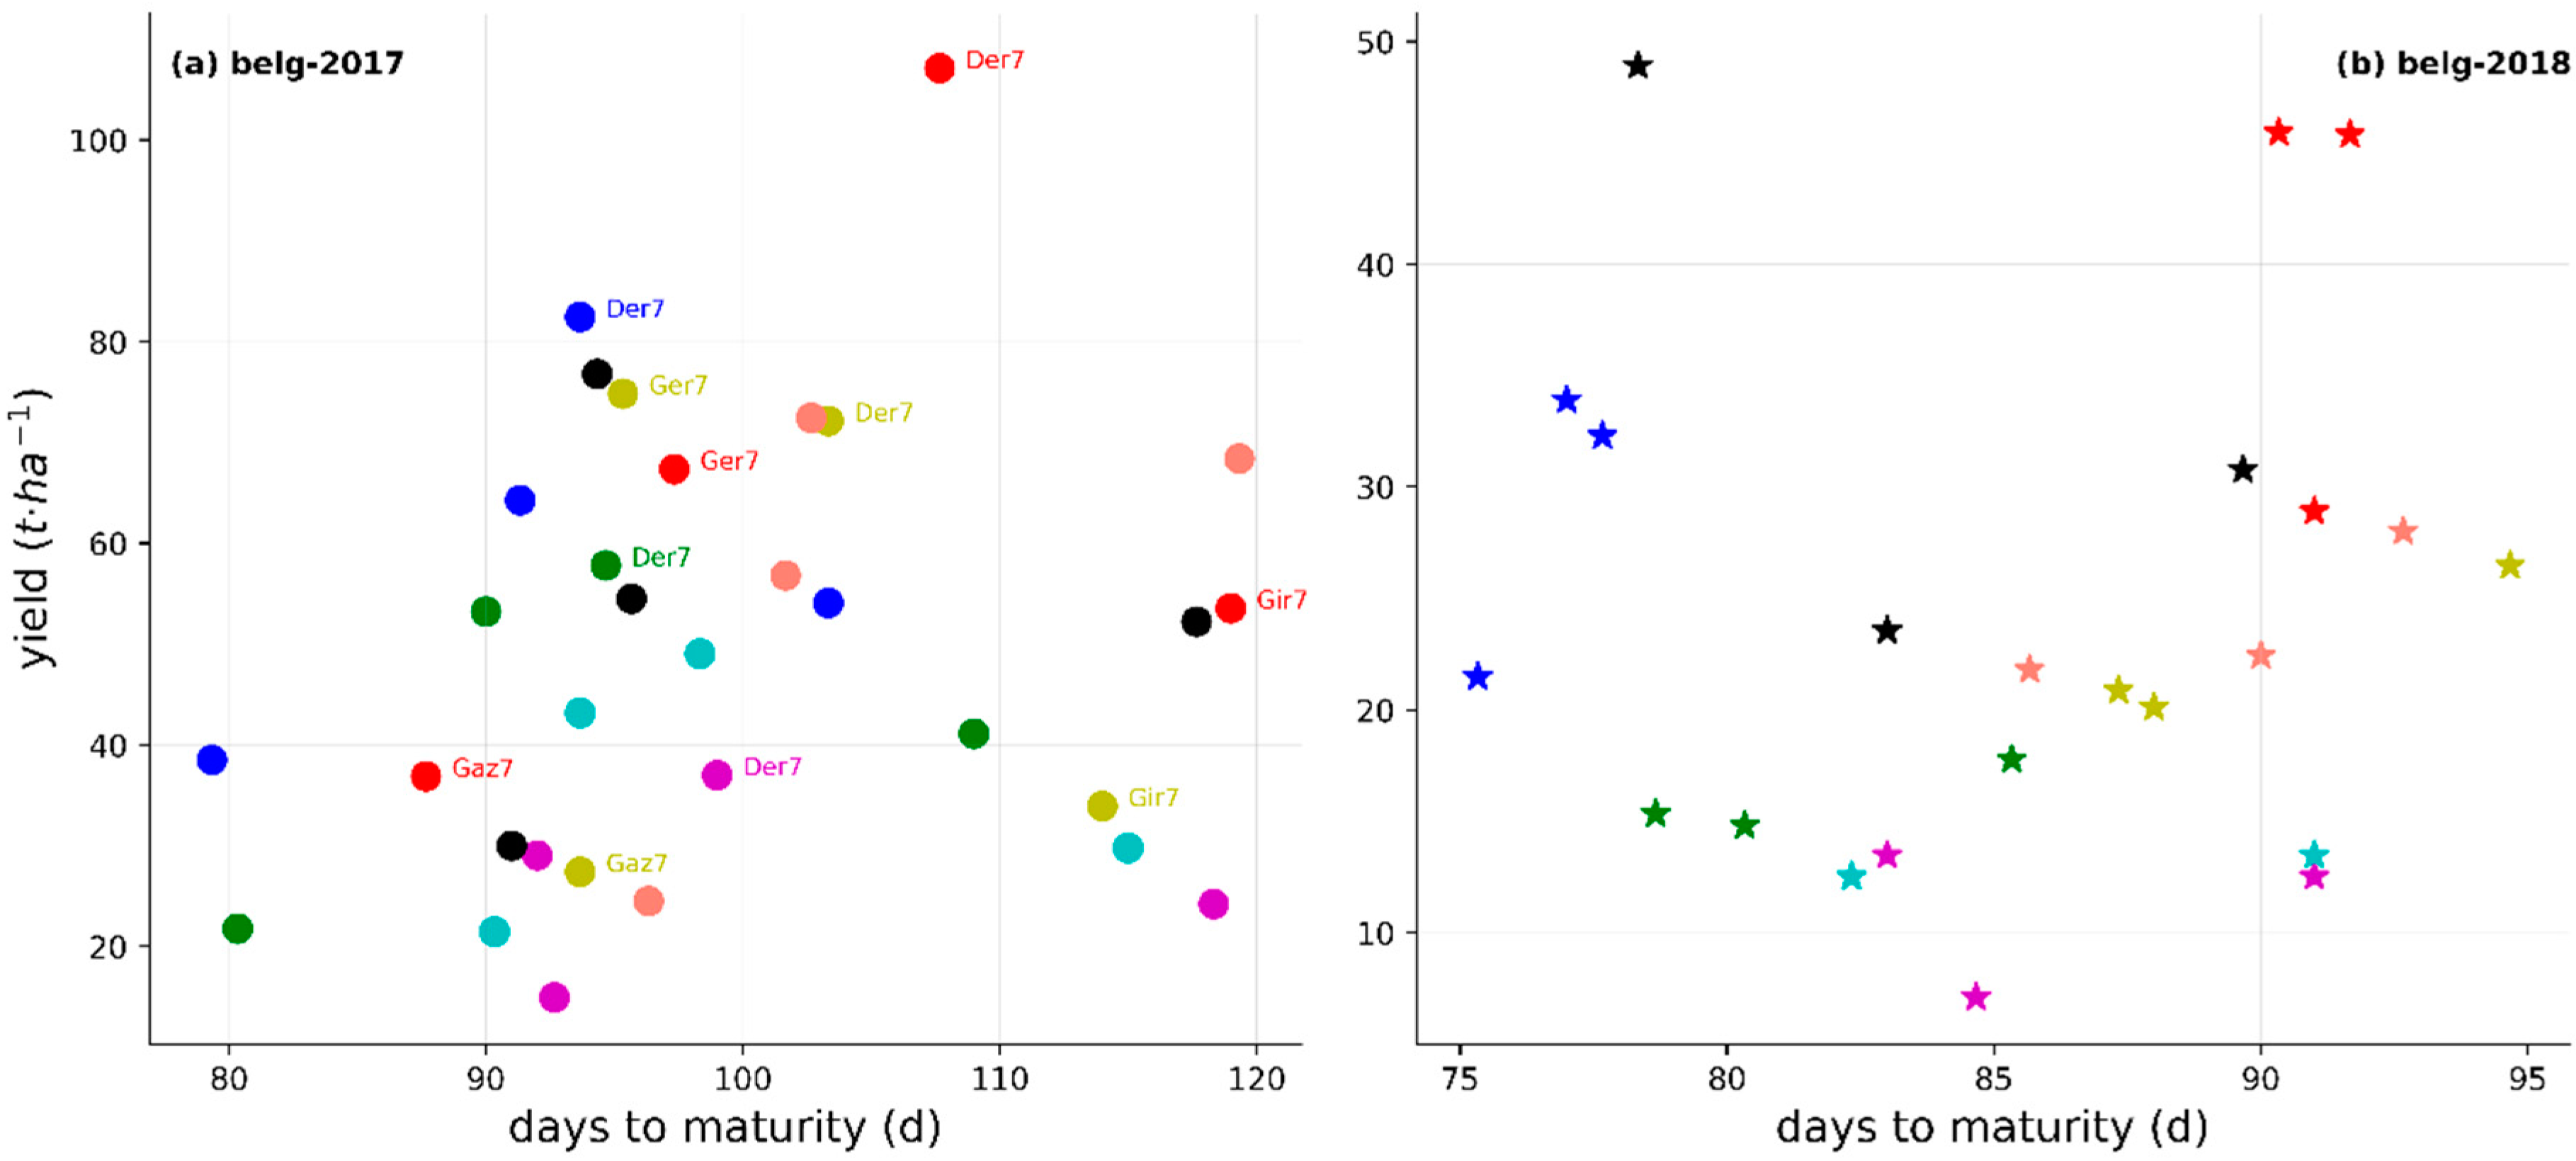
3.2.4. Days to Maturity and Yield
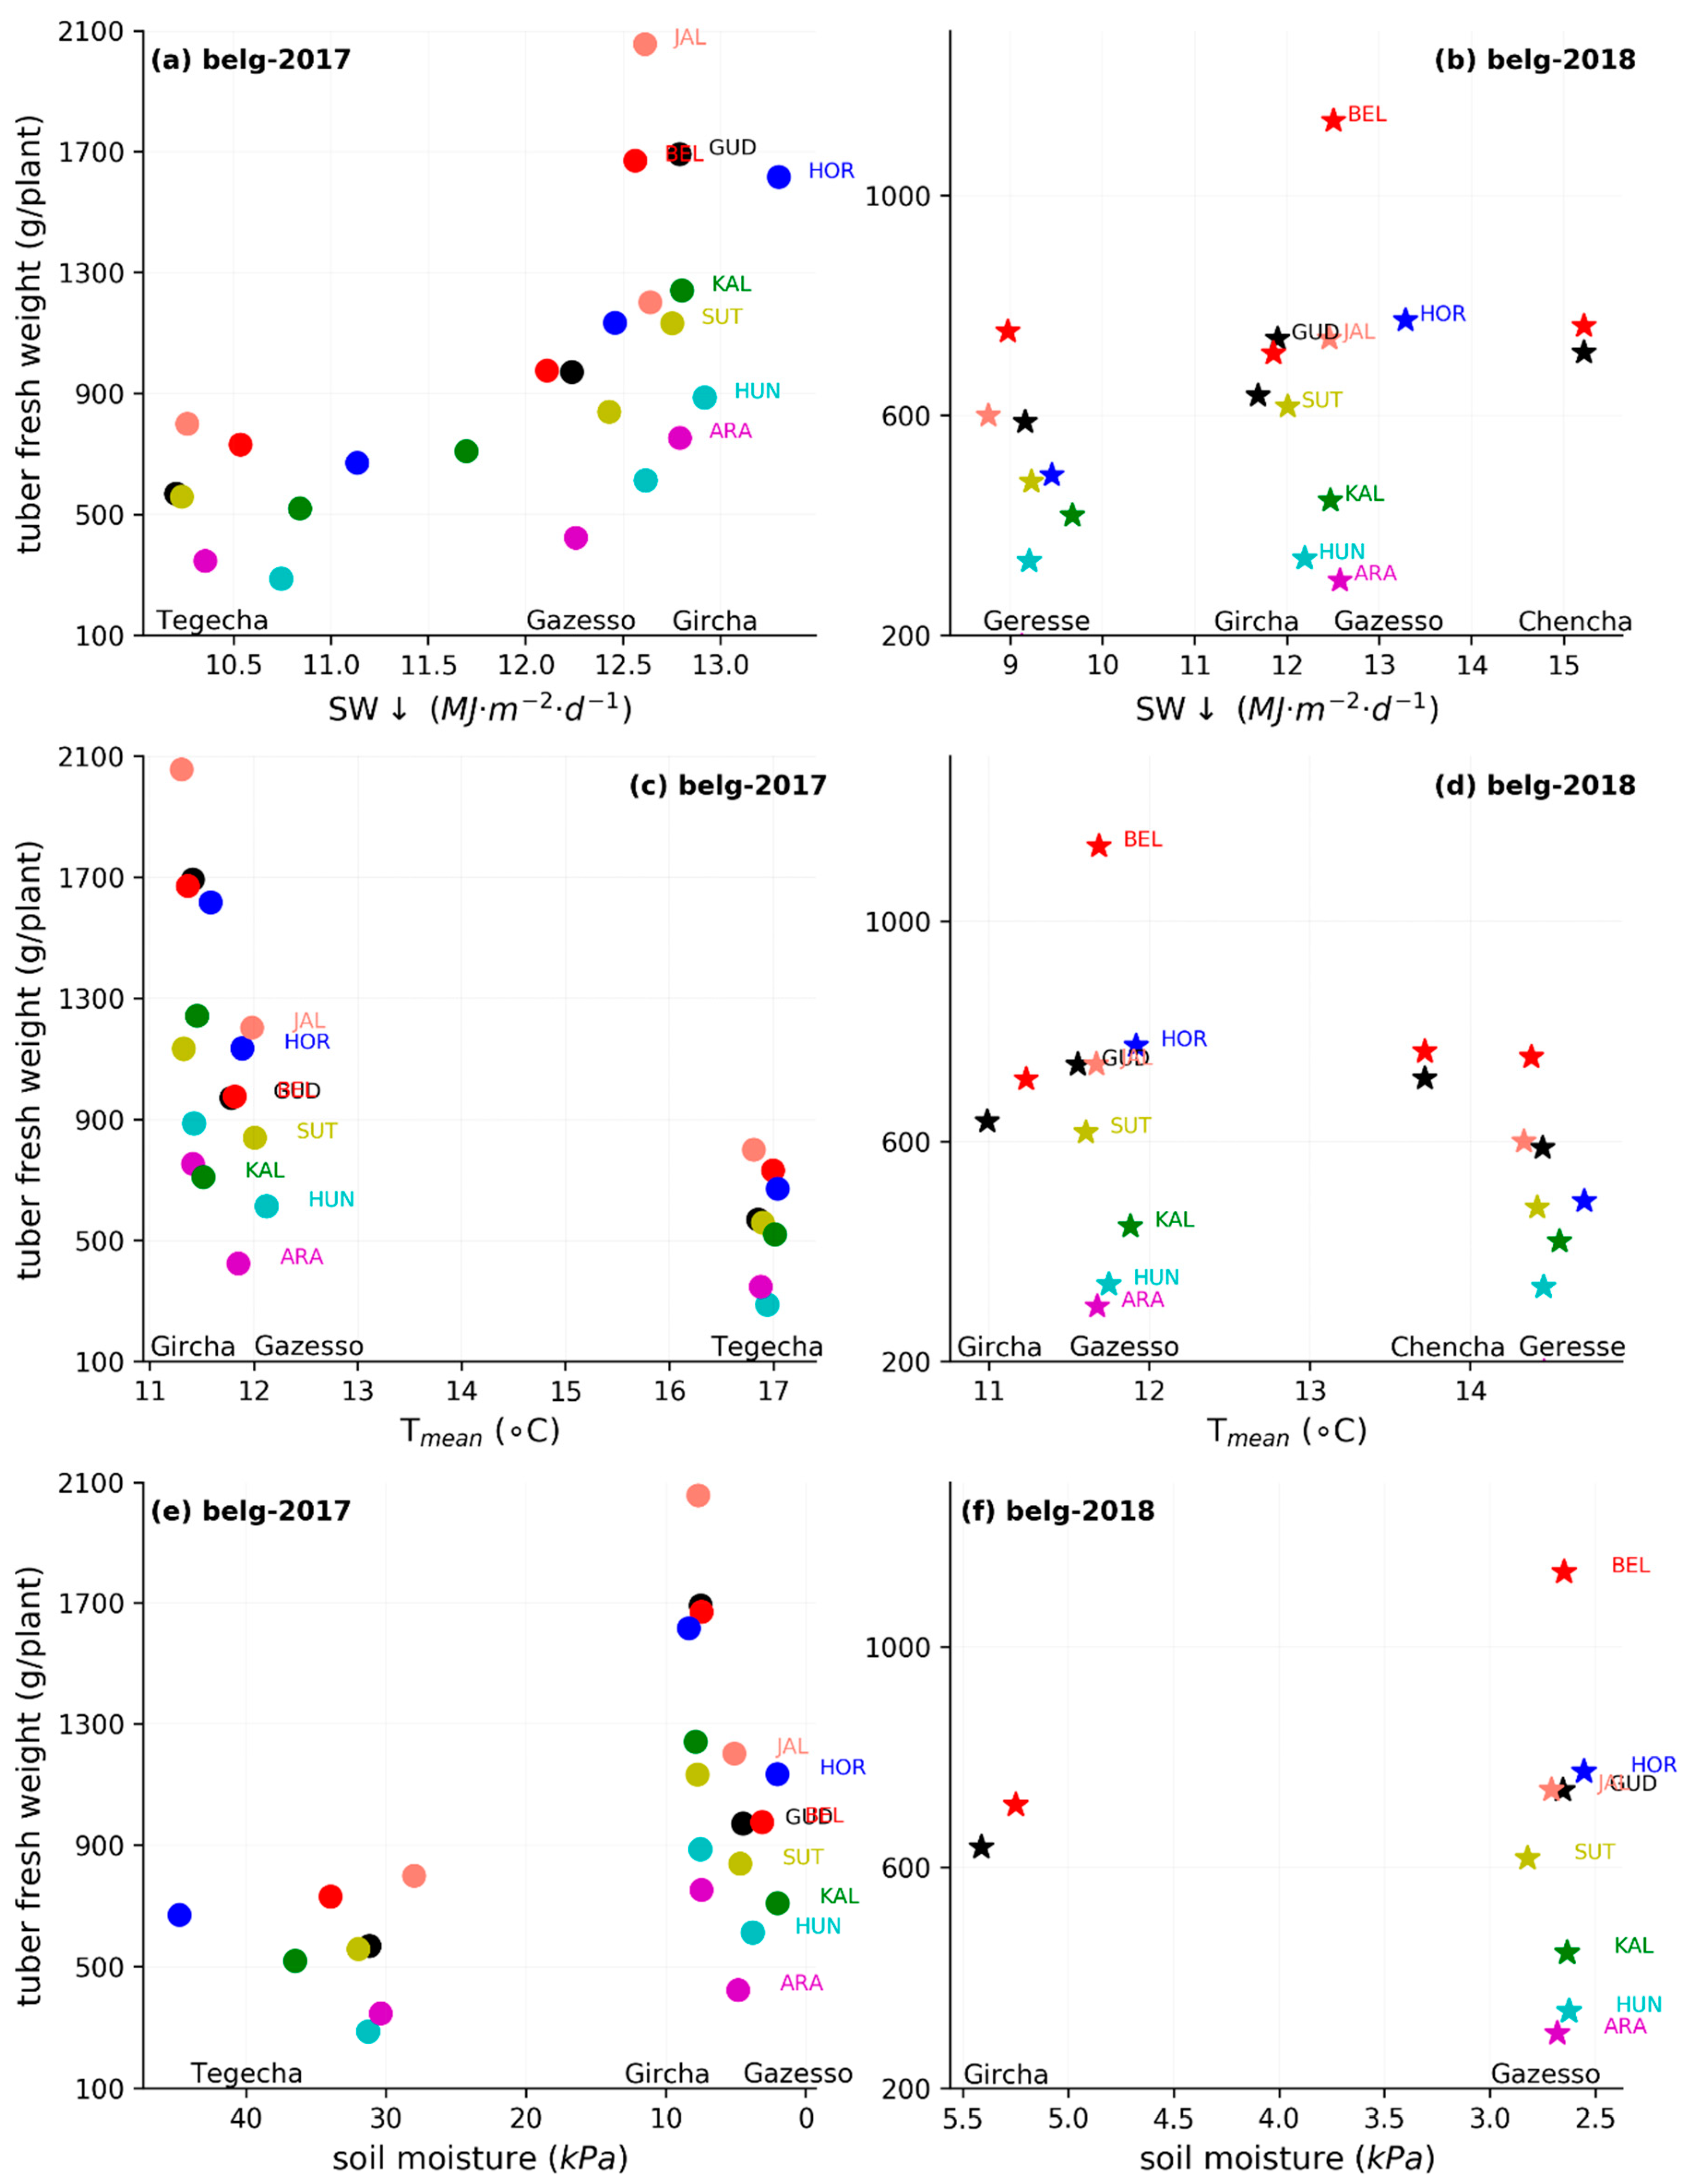
3.2.5. Tuber Fresh Weight as a Function of Environmental Variables in P2 and P3
3.2.6. Partitioning of Dry Matter over Parts of the Plant
4. Discussion
5. Conclusions
Author Contributions
Funding
Acknowledgments
Conflicts of Interest
References
- Dersseh, W.M. Agronomic and Socioeconomic Sustainability of Farming Systems: A Case in Chencha, South Ethiopia. Ph.D. Thesis, Wageningen University and Research, Wageningen, The Netherlands, 2017. [Google Scholar]
- Baye, B.; Gebremedhin, W. Potato research and development in Ethiopia achievements and trends. In Seed Potato Tuber Production and Dissemination: Experiences, Challenges and Prospects, Proceedings of the National Workshop on Seed Potato Tuber Production and Dissemination, Bahir Dar, Ethiopia, 12–14 Mar 2012; Ethiopian Institute of Agricultural Research (EIAR)/Amhara Regional Agricultural Research Institute (ARARI)/International Potato Center (CIP): Addis Ababa, Ethiopia; Bahir Dar, Ethiopia; Lima, Peru, 2012. [Google Scholar]
- Philip, S.; Kew, S.F.; Oldenborgh, G.J.v.; Otto, F.; O’Keefe, S.; Haustein, K.; King, A.; Zegeye, A.; Eshetu, Z.; Hailemariam, K.; et al. Attribution Analysis of the Ethiopian Drought of 2015. J. Clim. 2018, 31, 2465–2486. [Google Scholar] [CrossRef]
- Haile, M. Weather patterns, food security and humanitarian response in sub-Saharan Africa. Philos. Trans. R. Soc. B Biol. Sci. 2005, 360, 2169–2182. [Google Scholar]
- Qian, C.; Wu, Z.; Fu, C.; Wang, D. On Changing El Niño: A View from Time-Varying Annual Cycle, Interannual Variability, and Mean State. J. Clim. 2011, 24, 6486–6500. [Google Scholar] [CrossRef]
- Tsidu, G.M. Southern Africa [in “State of the Climate in 2015”]. Bull. Am. Meteorol. Soc. 2016, 97, S189–S192. [Google Scholar]
- Wolde-Georgis, T. El Niño and drought early warning in Ethiopia (March 1, 1997). Intern. J. Afr. Stud. 1997, 2, 1–10. [Google Scholar]
- Viste, E.; Korecha, D.; Sorteberg, A. Recent drought and precipitation tendencies in Ethiopia. Theor. Appl. Climatol. 2013, 112, 535–551. [Google Scholar]
- Menza, M.; Girmay, G.; Woldeyes, F. Enhancing Household Food Security through Irish Potato Production in Gamo Highlands of Southern Ethiopia. Sch. J. Agric. Sci. 2014, 4, 410–419. [Google Scholar]
- Thiele, G.; Theisen, K.; Bonierbale, M.; Walker, T. Targeting the poor and hungry with potato science. Potato J. 2010, 37, 75–86. [Google Scholar]
- Abebe, G.; Bijman, J.; Pascucci, S.; Omta, S.; Tsegaye, A. Diverging quality preferences along the supply chain: Implications for variety choice by potato growers in Ethiopia. In Quality and Innovation in Food Chains: Lessons and Insights from Africa; Wageningen Academic Publishers: Wageningen, The Netherlands, 2016; pp. 89–102. [Google Scholar]
- Abebe, G.K.; Bijman, J.; Pascucci, S.; Omta, O. Adoption of improved potato varieties in Ethiopia: The role of agricultural knowledge and innovation system and smallholder farmers’ quality assessment. Agric. Syst. 2013, 122, 22–32. [Google Scholar] [CrossRef]
- Haverkort, A.J. Potato Handbook: Crop of the Future; Potato World Magazine: The Hague, The Netherlands, 2018. [Google Scholar]
- Tadesse, Y.; Almekinders, C.J.; Schulte, R.P.O.; Struik, P.C. Understanding farmers’ potato production practices and use of improved varieties in Chencha, Ethiopia. J. Crop Improv. 2017, 31, 673–688. [Google Scholar] [CrossRef]
- Hirpa, A.; Meuwissen, M.P.; Tesfaye, A.; Lommen, W.J.M.; Lansink, A.O.; Tsegaye, A.; Struik, P.C. Analysis of seed potato systems in Ethiopia. Am. J. Potato Res. 2010, 87, 537–552. [Google Scholar] [CrossRef]
- Haverkort, A.J.; van Koesveld, F.; Schepers, H.; Wijnands, J.; Wustman, R.; Zhang, X. Potato Prospects for Ethiopia: On the Road to Value Addition; Praktijkonderzoek Plant & Omgeving: Lelystad, The Netherlands, 2012. [Google Scholar]
- Haverkort, A.J.; Struik, P.C. Yield levels of potato crops: Recent achievements and future prospects. Field Crop. Res. 2015, 182, 76–85. [Google Scholar] [CrossRef]
- Mazengia, W.; Schulte, R.; Tadese, Y.; Griffin, D.; Schulz, S.; Struik, P.C. The Farming Systems of Potential Potato Production Areas of Chencha, Southern Ethiopia. Chapter 37. In Potato and Sweetpotato in Africa: Transforming the Value Chains for Food and Nutrition Security; Low, J., Nyongesa, M., Quinn, S., Parker, M., Eds.; CABI: Cambridge, UK, 2015; pp. 382–396. [Google Scholar]
- Dersseh, W.M.; Gebresilase, Y.T.; Schulte, R.P.O.; Struik, P.C. The Analysis of Potato Farming Systems in Chencha, Ethiopia: Input, Output and Constraints. Am. J. Potato Res. 2016, 93, 436–447. [Google Scholar] [CrossRef]
- Tadele, Z. Raising Crop Productivity in Africa through Intensification. Agronomy 2017, 7, 22. [Google Scholar] [CrossRef]
- Svubure, O.; Struik, P.C.; Haverkort, A.J.; Steyn, J.M. Yield gap analysis and resource footprints of Irish potato production systems in Zimbabwe. Field Crop. Res. 2015, 178, 77–90. [Google Scholar] [CrossRef]
- Struik, P.C. Chapter 18—Responses of the Potato Plant to Temperature, in Potato Biology and Biotechnology; Vreugdenhil, D., Bradshaw, J., Gebhardt, C., Govers, F., Mackerron, D.K.L., Taylor, M.A., Ross, H.A., Eds.; Elsevier Science B.V.: Amsterdam, The Netherlands, 2007; pp. 367–393. [Google Scholar]
- van Dam, J.; Kooman, P.; Struik, P.C. Effects of temperature and photoperiod on early growth and final number of tubers in potato (Solanum tuberosum L.). Potato Res. 1996, 39, 51–62. [Google Scholar] [CrossRef]
- Haverkort, A.J. Chapter 17—Potato Crop Response to Radiation and Daylength. In Potato Biology and Biotechnology; Vreugdenhil, D., Bradshaw, J., Gebhardt, C., Govers, F., Mackerron, D.K.L., Taylor, M.A., Ross, H.A., Eds.; Elsevier Science B.V.: Amsterdam, The Netherlands, 2007; pp. 353–365. [Google Scholar]
- Hijmans, R.J. The effect of climate change on global potato production. Am. J. Potato Res. 2003, 80, 271–279. [Google Scholar] [CrossRef]
- Bodlaender, K.B.A. Influence of Temperature, Radiation and Photoperiod on Development and Yield. In The Growth of the Potato; Ivins, J.D., Milthorpe, E.L., Eds.; Butterworths: London, UK, 1963; pp. 199–210. [Google Scholar]
- Carter, T.; Parry, M.; Porter, J.; Goudriaan, J. Climate change and future crop suitability in Europe. In The Greenhouse Effect and Primary Productivity in European Agro-Ecosystems; Academic Press: Cambridge, MA, USA, 1990; pp. 3–6. [Google Scholar]
- FAO. International Year of the Potato 2008. Available online: http://www.fao.org/potato-2008/en/potato/index.html (accessed on 8 February 2019).
- Minda, T.T.; van der Molen, M.K.; Heusinkveld, B.G.; Struik, P.C.; de Arellano, J.V.-G. Observational Characterization of the Synoptic and Mesoscale Circulations in Relation to Crop Dynamics: Belg 2017 in the Gamo Highlands, Ethiopia. Atmosphere 2018, 9, 398. [Google Scholar] [CrossRef]
- Badr, M.; El-Tohamy, W.; Zaghloul, A. Yield and water use efficiency of potato grown under different irrigation and nitrogen levels in an arid region. Agric. Water Manag. 2012, 110, 9–15. [Google Scholar] [CrossRef]
- Minda, T.T.; van der Molen, M.K.; Struik, P.C.; Combe, M.; Jiménez, P.A.; Khan, M.S.; de Arellano, J.V.-G. The combined effect of elevation and meteorology on potato crop dynamics: A 10-year study in the Gamo Highlands, Ethiopia. Agric. For. Meteorol. 2018, 262, 166–177. [Google Scholar] [CrossRef]
- Abdurahman, A.; Griffin, D.; Elphinstone, J.; Struik, P.C.; Schulz, S.; Schulte-Geldermann, E.; Sharma, K. Molecular characterization of Ralstonia solanacearum strains from Ethiopia and tracing potential source of bacterial wilt disease outbreak in seed potatoes. Plant Pathol. 2017, 66, 826–834. [Google Scholar] [CrossRef]
- Berihun, B.; Woldegiorgis, G. Potato Research and Development in Ethiopia: Achievements and trends. In Tuber Production and Dissemination Expreiences, Challenges and Prospects, Proceedings of the National Workshop on Seed Potato Tuber Production and Dissemination, Bahir Dar, Ethiopia, 12–14 March 2012; Woldegiorgis, G., Schulz, S., Berihun, B., Eds.; Ethiopian Institute of Agricultural Research (EIAR) and Amahara Regional Agricultural Research Institute (ARARI): Bahir Dar, Ethiopia, 2013; pp. 35–44. [Google Scholar]
- Kirub, A.; Asfaw, F. Seed Potato Tuber Production and Dissemination. In Proceedings of the National Workshop on Seed Potato Tuber Production and Dissemination, Bahir Dar, Ethiopia, 12–14 March 2012. [Google Scholar]
- Tadesse, Y.; Almekinders, C.J.M.; Schulte, R.P.O.; Struik, P.C. Potatoes and livelihoods in Chencha, southern Ethiopia. NJAS Wagening. J. Life Sci. 2019, 88, 105–111. [Google Scholar] [CrossRef]
- Darshana, A.; Ostrowski, P.M.; Pandey, R.P. Simulation and optimization for irrigation and crop planning. Irrig. Drain. 2012, 61, 178–188. [Google Scholar] [CrossRef]
- Bradshaw, J.E.; Bonierbale, M. Potatoes, in Root and Tuber Crops; Springer: Berlin, Germany, 2010; pp. 1–52. [Google Scholar]
- Tufa, A.H. Economic and Agronomic Analysis of the Seed Potato Supply Chain in Ethiopia. Ph.D. Thesis, Wageningen University and Research, Wageningen, The Netherlands, 2013. [Google Scholar]
- Vos, J.; Haverkort, A.J. Chapter 16—Water Availability and Potato Crop Performance. In Potato Biology and Biotechnology; Vreugdenhil, D., Bradshaw, J., Gebhardt, C., Govers, F., Mackerron, D.K.L., Taylor, M.A., Ross, H.A., Eds.; Elsevier Science B.V.: Amsterdam, The Netherlands, 2007; pp. 333–351. [Google Scholar]
- Diro, G.T.; EBlack; Grimes, D. Seasonal forecasting of Ethiopian spring rains. Meteorol. Appl. 2008, 15, 73–83. [Google Scholar] [CrossRef]
- Degefu, W. Some Aspects of Meteorological Drought in Ethiopia; Cambridge University Press: Cambridge, UK, 1987. [Google Scholar]
- Gissila, T.; Black, E.; Grimes, D.; Slingo, J. Seasonal forecasting of the Ethiopian summer rains. Int. J. Climatol. 2004, 24, 1345–1358. [Google Scholar] [CrossRef]
- Awulachew, S.B.; Erkossa, T.; Namara, R.E. Irrigation Potential in Ethiopia. Constraints and Opportunities for Enhancing the System; International Water Management Institute Contributions: Addis Ababa, Ethiopia, 2010. [Google Scholar]
- Woldegiorgis, G. Potato variety development strategies and methodologies in Ethiopia. In Seed Potato Tuber Production and Dissemination: Experiences, Challenges and Prospects; Ethiopian Institute of Agricultural Research and Amhara Agricultural Research Institute: Bahir Dar, Ethiopia, 2013. [Google Scholar]
- Khan, M. Assessing Genetic Variation in Growth and Development of Potato. Ph.D. Thesis, Wageningen University and Research, Wageningen, The Netherlands, 2012. [Google Scholar]
- Haverkort, A.J. Ecology of potato cropping systems in relation to latitude and altitude. Agric. Syst. 1990, 32, 251–272. [Google Scholar] [CrossRef]
- van Loon, C.D. The effect of water stress on potato growth, development, and yield. Am. Potato J. 1981, 58, 51–69. [Google Scholar] [CrossRef]
- Millard, P.; Marshall, B. Growth, nitrogen uptake and partitioning within the potato (Solanum tuberosum L.) crop, in relation to nitrogen application. J. Agric. Sci. 1986, 107, 421–429. [Google Scholar] [CrossRef]
- Sibma, L. Relation between total radiation and yield of some field crops in the Netherlands. Neth. J. Agric. Sci. 1970, 18, 125–131. [Google Scholar]
- Allen, E.J.; Scott, R.K. An Analysis of Growth of the Potato Crop. J. Agric. Sci. 1980, 94, 583–606. [Google Scholar] [CrossRef]
- Kooman, P.L.; Haverkort, A.J. Modelling development and growth of the potato crop influenced by temperature and daylength: LINTUL-POTATO. In Potato Ecology and Modelling of Crops under Conditions Limiting Growth, Proceedings of the Second International Potato Modeling Conference, Wageningen, The Netherlands, 17–19 May 1994; Haverkort, A.J., MacKerron, D.K.L., Eds.; Springer: Dordrecht, The Netherlands, 1995; pp. 41–59. [Google Scholar]
- Spitters, C.; van Keulen, H.; van Kraalingen, D. A Simple and Universal Crop Growth Simulator: SUCROS87, in Simulation and Systems Management in Crop Protection; Pudoc: Wageningen, The Netherlands, 1989; pp. 147–181. [Google Scholar]
- Yin, X.; Goudriaan, J.; Lantinga, E.A.; Vos, J.; Spiertz, H.J. A Flexible Sigmoid Function of Determinate Growth. Ann. Bot. 2003, 91, 361–371. [Google Scholar] [CrossRef]
- MOANR. Crop Variety Register Issue No. 18. 2016, Ministry of Agriculture and Natural Resources (MOANR); Ethiopia: Addis Ababa, Ethiopia, 2016. [Google Scholar]
- Gebreselassie, H.; Mohamed, W.; Shimelis, B. Evaluation of Potato (Solanum tuberosum L.) Varieties for Yield and Yield Components in Eastern Ethiopia. J. Biol. Agric. Healthc. 2016, 6, 146–154. [Google Scholar]
- Tadesse, Y.; Almekinders, C.J.M.; Schulte, R.P.O.; Struik, P.C. Tracing the seed: Seed diffusion of improved potato varieties through farmers’ networks in Chencha, Ethiopia. Exp. Agric. 2016, 53, 481–496. [Google Scholar] [CrossRef]
- Kolech, S.A.; Halseth, D.; de Jong, W.; Perry, K.; Wolfe, D.; Tiruneh, F.M.; Schulz, S. Potato Variety Diversity, Determinants and Implications for Potato Breeding Strategy in Ethiopia. Am. J. Potato Res. 2015, 92, 551–566. [Google Scholar] [CrossRef]
- Tadesse, T. Experiences, Challenges, and Opportunities in Participatory Quality Potato Seed Production: The Case of Southern Region. In Seed Potato Tuber Production and Dissemination; Ethiopian Institute of Agricultural Research and Amhara Agricultural Research Institute: Bahir Dar, Ethiopia, 2013. [Google Scholar]
- Tsidu, G.M. Eastern Africa [in “State of the Climate in 2017”]. Bull. Am. Meteorol. Soc. 2018, 99, S216–S217. [Google Scholar]
- Blunden, J.; Arndt, D.S.; Hartfield, G. State of the Climate in 2017. Bull. Am. Meteorol. Soc. 2018, 99, Si–S332. [Google Scholar]
- Gomez, K.A.; Gomez, A.A. Statistical Procedures for Agricultural Research; John Wiley & Sons: Hoboken, NJ, USA, 1984. [Google Scholar]
- Yactayo, W.; Ramírez, D.A.; Gutiérrez, R.; Mares, V.; Posadas, A.; Quiroz, R. Effect of partial root-zone drying irrigation timing on potato tuber yield and water use efficiency. Agric. Water Manag. 2013, 123, 65–70. [Google Scholar] [CrossRef]
- Deblonde, P.M.K.; Ledent, J.F. Effects of moderate drought conditions on green leaf number, stem height, leaf length and tuber yield of potato cultivars. Eur. J. Agron. 2001, 14, 31–41. [Google Scholar] [CrossRef]
- Boyd, N.; Gordon, R.; Martin, R. Relationship between leaf area index and ground cover in potato under different management conditions. Potato Res. 2002, 45, 117–129. [Google Scholar] [CrossRef]
- Taye, M.; Lommen, W.J.M.; Struik, P.C. Effects of shoot tipping on development and yield of the tuber crop Plectranthus edulis. J. Agric. Sci. 2012, 150, 484–494. [Google Scholar] [CrossRef]
- Ospina, C.A.; Lammerts van Bueren, E.T.; Allefs, J.J.H.M.; Engel, B.; van der Putten, P.E.L.; van der Linden, C.G.; Struik, P.C. Diversity of crop development traits and nitrogen use efficiency among potato cultivars grown under contrasting nitrogen regimes. Euphytica 2014, 199, 13–29. [Google Scholar] [CrossRef]
- Firman, D.; Allen, E. Relationship between light interception, ground cover and leaf area index in potatoes. J. Agric. Sci. 1989, 113, 355–359. [Google Scholar] [CrossRef]
- Buck-Sorlin, G.H.; Evers, J.B.; Vos, J.; Andrieu, B.; Chelle, M.; de Visser, P.H.B. Functional–structural plant modelling: A new versatile tool in crop science. J. Exp. Bot. 2009, 61, 2101–2115. [Google Scholar]
- Abbas, G.; Hafiz, I.; Abbasi, N.; Hussain, A. Determination of processing and nutritional quality attributes of potato genotypes in Pakistan. Pak. J. Bot. 2012, 44, 201–208. [Google Scholar]
- MacKerron, D.; Davies, H. Markers for maturity and senescence in the potato crop. Potato Res. 1986, 29, 427–436. [Google Scholar] [CrossRef]
- van de Geijn, S.C.; Dijkstra, P. Physiological effects of changes in atmospheric carbon dioxide concentration and temperature on growth and water relations of crop plants. In Potato Ecology and Modelling of Crops under Conditions Limiting Growth, Proceedings of the Second International Potato Modeling Conference, Wageningen, The Netherlands, 17–19 May 1994; Haverkort, A.J., MacKerron, D.K.L., Eds.; Springer: Dordrecht, The Netherlands, 1995; pp. 89–99. [Google Scholar]
- Sinclair, T.R.; Muchow, R.C. Radiation Use Efficiency. In Advances in Agronomy; Sparks, D.L., Ed.; Academic Press: Cambridge, MA, USA, 1999; pp. 215–265. [Google Scholar]
- Burstall, L.; Harris, P. The estimation of percentage light interception from leaf area index and percentage ground cover in potatoes. J. Agric. Sci. 1983, 100, 241–244. [Google Scholar] [CrossRef]
- Fahem, M.; Haverkort, A.J. Comparison of the growth of potato crops grown in autumn and spring in North Africa. Potato Res. 1988, 31, 557–568. [Google Scholar] [CrossRef]
- Oliveira, J. Growth and Development of Potato (Solanum tuberosum L.) Crops after Different Cool Season Storage. Ph.D. Thesis, Lincoln University Digital Thesis, New Zealand, 2015. [Google Scholar]
- Spitters, C.J.T. An analysis of variation in yield among potato cultivars in terms of light absorption, light utilization and dry matter partitioning. Acta Horticulturae 1987, 214, 71–84. [Google Scholar] [CrossRef]
- Ingram, K.T.; McCloud, D.E. Simulation of Potato Crop Growth and Development1. Crop Sci. 1984, 24, 21–27. [Google Scholar] [CrossRef]
- Mazurczyk, W.; Lutomirska, B.; Wierzbicka, A. Relation between air temperature and length of vegetation period of potato crops. Agric. For. Meteorol. 2003, 118, 169–172. [Google Scholar] [CrossRef]
- Gordon, R.; Brown, D.; Dixon, M. Stomatal resistance of three potato cultivars as influenced by soil water status, humidity and irradiance. Potato Res. 1997, 40, 47–57. [Google Scholar] [CrossRef]
- Pleijel, H.; Danielsson, H.; Vandermeiren, K.; Blum, C.; Colls, J.; Ojanperä, K. Stomatal conductance and ozone exposure in relation to potato tuber yield—Results from the European CHIP programme. Eur. J. Agron. 2002, 17, 303–317. [Google Scholar] [CrossRef]
- Tsegaw, T. Response of Potato to Paclobutrazol and Manipulation of Reproductive Growth under Tropical Conditions. Ph.D. Thesis, University of Pretoria, Pretoria, South Africa, 2005. [Google Scholar]
- Kooman, P.L. Yielding Ability of Potato Crops as Influenced by Temperature and Daylength. Ph.D. Thesis, Wageningen University and Research, Wageningen, The Netherlands, 1995. [Google Scholar]
- Onder, S.; Caliskan, M.E.; Onder, D.; Caliskan, S. Different irrigation methods and water stress effects on potato yield and yield components. Agric. Water Manag. 2005, 73, 73–86. [Google Scholar] [CrossRef]
- Haverkort, A.J.; van de Waart, M.; Bodlaender, K.B.A. The effect of early drought stress on numbers of tubers and stolons of potato in controlled and field conditions. Potato Res. 1990, 33, 89–96. [Google Scholar] [CrossRef]
- Yuan, B.-Z.; Nishiyama, S.; Kang, Y. Effects of different irrigation regimes on the growth and yield of drip-irrigated potato. Agric. Water Manag. 2003, 63, 153–167. [Google Scholar] [CrossRef]
- Borah, M.; Burt, R.; Headford, D.; Milthorpe, F.; Sadler, E.M. Growth of the potato plant. Ann. Appl. Biol. 1960, 48, 433–434. [Google Scholar] [CrossRef]
- Timlin, D.; Rahman, S.M.L.; Baker, J.; Reddy, V.R.; Fleisher, D.; Quebedeaux, B. Whole Plant Photosynthesis, Development, and Carbon Partitioning in Potato as a Function of Temperature. Agron. J. 2006, 98, 1195–1203. [Google Scholar] [CrossRef]


| Station | Lon (°) | Lat (°) | Elv (m) | Meteorology (belg) | Edaphic (belg) | Potato crop | |||||||||||||
|---|---|---|---|---|---|---|---|---|---|---|---|---|---|---|---|---|---|---|---|
| Tmean(°C) | SW↓ (MJ∙m−2∙d−1) | PPT (mm∙belg−1) | ψ (kPa) | Tsoil (°C) | No of cultivars planted | Date of planting | Disease observations | ||||||||||||
| ‘17 | ‘18 | ‘17 | ‘18 | ‘17 | ‘18 | ‘17 | ‘18 | ‘17 | ‘18 | ‘17 | ‘18 | ‘17 | ‘18 | ‘17 e | ’18 e | ||||
| Gircha | 37.566 | 6.309 | 2985 | 13.0 | 12.2 | 17.3 | 15.7 | 443.8 | 476 | 60.6 | 43.5 | 16.4 | 13.8 | 8 | 2 | 07-Mar | 12-Mar | No | Yes |
| Gazesso | 37.333 | 6.132 | 2880 | 13.7 | 13.2 | 17.0 | 15.3 | >475d | 462 | 52.2 | 45.5 | 17.6 | 16.4 | 8 | 8 | 02-Mar | 03-Apr | No | Yes |
| Chencha a,c | 37.566 | 6.258 | 2765 | 14.0 | 13.2 | 18.4 | 16.1 | 540.2 | 2 | 08-Mar | Yes | ||||||||
| Zozo,a,c | 37.605 | 6.265 | 2695 | 2 | 12-Mar | Yes | |||||||||||||
| Tegecha c | 37.575 | 6.184 | 2383 | 20.3 | 18.3 | 18.6 | 14.0 | 458.8 | 564 | 130.7 | 140.0 | 22.7 | 21.7 | 8 | 05-Apr | Yes | |||
| Geresse b | 37.310 | 5.929 | 2298 | 16.6 | 14.1 | 8 | 8 | 10-Apr | 05-Apr | No | Yes | ||||||||
| Derashe | 37.368 | 5.637 | 2122 | 8 | 8 | 01-Apr | 27-Mar | No | Yes | ||||||||||
© 2019 by the authors. Licensee MDPI, Basel, Switzerland. This article is an open access article distributed under the terms and conditions of the Creative Commons Attribution (CC BY) license (http://creativecommons.org/licenses/by/4.0/).
Share and Cite
Minda, T.T.; van der Molen, M.K.; Vilà-Guerau de Arellano, J.; Chulda, K.C.; Struik, P.C. Responses of Canopy Growth and Yield of Potato Cultivars to Weather Dynamics in a Complex Topography: Belg Farming Seasons in the Gamo Highlands, Ethiopia. Agronomy 2019, 9, 163. https://doi.org/10.3390/agronomy9040163
Minda TT, van der Molen MK, Vilà-Guerau de Arellano J, Chulda KC, Struik PC. Responses of Canopy Growth and Yield of Potato Cultivars to Weather Dynamics in a Complex Topography: Belg Farming Seasons in the Gamo Highlands, Ethiopia. Agronomy. 2019; 9(4):163. https://doi.org/10.3390/agronomy9040163
Chicago/Turabian StyleMinda, Thomas T., Michiel K. van der Molen, Jordi Vilà-Guerau de Arellano, Kanko C. Chulda, and Paul C. Struik. 2019. "Responses of Canopy Growth and Yield of Potato Cultivars to Weather Dynamics in a Complex Topography: Belg Farming Seasons in the Gamo Highlands, Ethiopia" Agronomy 9, no. 4: 163. https://doi.org/10.3390/agronomy9040163
APA StyleMinda, T. T., van der Molen, M. K., Vilà-Guerau de Arellano, J., Chulda, K. C., & Struik, P. C. (2019). Responses of Canopy Growth and Yield of Potato Cultivars to Weather Dynamics in a Complex Topography: Belg Farming Seasons in the Gamo Highlands, Ethiopia. Agronomy, 9(4), 163. https://doi.org/10.3390/agronomy9040163