Article

Effects of Nitrogen Management on Biomass Production and Dry Matter Distribution of Processing Tomato Cropped in Southern Italy

1
Department of Life Science, University of Modena and Reggio Emilia, Via Amendola, n. 2, 42122 Reggio Emilia, Italy
2
CREA Research Centre for Animal Production and Aquaculture, viale Piacenza 29, 26900 Lodi, Italy
3
CREA Research Centre for Vegetable and Ornamental Crops, Via Cavalleggeri, 25, 84098 Pontecagnano Faiano, Italy
4
Department of Agricultural Sciences, University of Naples Federico II, Via Università, n. 100, 80055 Portici, Italy
*
Author to whom correspondence should be addressed.
Agronomy 2019, 9(12), 855; https://doi.org/10.3390/agronomy9120855
Submission received: 19 November 2019 / Revised: 30 November 2019 / Accepted: 2 December 2019 / Published: 5 December 2019
(This article belongs to the Special Issue Nitrogen Fertilization in Vegetable Crops)

Abstract

:
Processing tomato is an important worldwide horticultural crop. It is generally grown in high-input systems; nevertheless, plant responses to nitrogen fertilization, in terms of the effects on dry matter production and allocation to different plant organs, have yet to be investigated in depth. Moreover, information on the crop marginal net return and global warming potential (as an index of the environmental impact of crop cultivation) at different nitrogen rates is still scarce. Therefore, the aim of this work was to study the effects of different nitrogen rates (0, 50, 100, 150, 200, and 250 kg of N ha−1) on the agronomic, economic, and environmental aspects of processing tomato grown under conventional management in the Mediterranean area. The results of the two-year trials indicated 200 kg of nitrogen ha−1 as the best rate, ensuring the highest values of marketable and total yields, brix ton ha−1, and marginal net return and the lowest global warming potential per ton of marketable yield. However, since plants fertilized with 200 kg of N ha−1 did not record the highest values of nitrogen use efficiency and nitrogen uptake efficiency, our finding suggest the possibility to select better-performing cultivars for these physiological parameters by adopting specific tomato breeding programs.

1. Introduction

Tomato (Solanum lycopersicum L.) is one of the most cultivated horticultural crops worldwide with an area of 4.8 million hectares and with production of 182 million tonnes in 2017 (FAOSTAT, 2019) [1]. About 20% of this production is used by canning industries for paste, peeled, diced, etc., tomato products. In this context, Italy is the second-largest world producer of processing tomato (~5 million tonnes) (WPTC, 2019) [2].
In recent years, one of the key agricultural challenges has been how to limit the negative impact of agricultural practices and increase crop production sustainability [3,4]. Nitrogen (N) administration represents an example of such a challenge; indeed, the lack of this element is one of the major yield-limiting factors [5], while an excess can cause environmental pollution [6].
Nowadays, in some Italian areas known for processing tomato production, the marketable yield reaches at least 70 t ha−1 and more than 110 t ha−1 in the most suitable district. A potential increase in marketable yield and the possibility to apply N fertilizers at specific times have induced farmers to reconsider their N management strategies.
Yield is the main parameter adopted in comparisons among different agronomic management types. Ronga et al. [7] reported that in processing tomato, high yields were obtained with leaf area index (LAI) of about 2.0–3.0 m2 m−2. In addition, a high specific leaf area increases the assimilates available for fruit growth [8]. Leaf senescence and its chlorophyll content, as well as dry matter production and photoassimilates distribution, affect crop yield and are important parameters that should be evaluated in plant growth and crop yield improvement studies [9,10,11,12]. Moreover, agronomic management and pedoclimatic conditions (such as tillage, nutrient availability, and weather conditions) might affect the efficiency of source organs and the allocation of dry matter production to the plant organs [13].
Nitrogen fertilization affects processing tomato yield and fruit quality parameters requested by canning industries, such as total solids, soluble solids, pH, and acidity [9]. A fully ripe tomato fruit contains 93–96% water, which dissolves the carbohydrates, organic acids, minerals, vitamins, and pigments that represent the total soluble solids, measured as °Brix. Total soluble solids are a key parameter in processing tomato productions. In fact, tomato paste is produced and sold based on its total soluble solids content; thus, the total soluble solids dictate the factory yield. Higher total soluble solids in incoming fruits means that fewer tons of tomatoes will be needed to produce a given amount of tomato paste.
The sink–source relationship and leaf nitrogen content affect dry matter production; moreover, yield is correlated with both source capacity and sink strength [8,14,15]. A higher allocation of biomass to fruits is a key crop goal to achieve the highest crop yield.
Several works have been carried out on the N fertilization and N uptake of drip-irrigated processing tomatoes, but with contrasting results. In Turkey, Erdal et al. [15] displayed that 160 kg ha−1 of N was suitable to maximize fruit yield. Similar results were reported in Italy by Tei et al. [16] supplying 200 kg ha−1 of N. On the other hand, researchers working in Australia [17], in Brazil [18], and in Spain [19] reported that N rates over 300 kg ha−1 were required to achieve the highest fruit yield.
To the authors’ knowledge, only a few research papers have reported the relationships between dry matter partitioning (including root) and yield in processing tomato [20,21]; moreover, these studies did not consider the effects of N fertilization on processing tomato sustainability.
The aim of our work was to display the best N rate, able to improve processing tomato production sustainability. Therefore, in the present study, two-year field trials were carried out to investigate the effects of different nitrogen rates (0, 50, 100, 150, 200, and 250 kg of N ha−1) on the agronomic, physiological, economic, and environmental aspects of processing tomato grown under conventional management in the Mediterranean area.

2. Materials and Methods

2.1. Location of the Trial

Agronomic trials were performed in an open field at Sele Valley (40°35′03.8″ N, 14°58′48.6″ E) (Salerno, southern Italy) during a two-year period (2004–2005) in a typical Haploxerepts soil (Soil Taxonomy; USDA, 2014) [22]. The physical and chemical soil properties were as follows: sand 26.8%, silt 40.8%, clay 32.4%, limestone 2.4%, pH 7.8, organic matter 1.6%, total nitrogen 1.3‰, P2O5 126 mg kg−1, and K2O 324 mg kg−1. The climate of this region is typically Mediterranean. The mean maximum and minimum air temperatures and total rainfall during the cropping cycles (May to August) were 26.9 and 17.2 °C and 255 mm for the year 2004 and 28.3 and 17.9 °C and 118 mm for the year 2005, respectively (Figure 1).

2.2. Crop Production

In each year of the experiment, cv “Messapico” [Nunhems, S’Agata Bolognese (BO), Italy] with elongated fruit was cropped with a planting density of 3.36 plants m−2. Seedlings were transplanted into twin rows (first week of May for both years) with a distance of 0.35 m between each row of the twin and 0.35 m between seedlings in the row, while the distance between the twin rows was 1.7 m. The total K and P supplies were calculated on the basis of soil analysis, and nutrient requirements were applied at ploughing. For N fertilization, six rates were assessed (0, 50, 100, 150, 200, and 250 kg of N ha−1) (henceforth denoted N-0, N-50, N-100, N-150, N-200, and N-250) in both years. A randomized complete block design was adopted with four replicates, and each replicate was 4.0 m × 5.1 m, containing 68 plants. The amount of N for each treatment was split into three applications during the crop cycle: 40% at transplanting (as ammonium sulphate), 30% at 20 days after transplanting (as ammonium nitrate), and 30% at full blossom (as ammonium nitrate). For irrigation scheduling, evapotranspiration of the crop (ETc) was calculated as ETc = ETo × Kc, where ETo (reference evapotranspiration) was determined according to Hargreaves and Samani [23], and Kc (crop coefficient) for tomato crop was adjusted for the environmental conditions and crop growth stage [24]. In each plot, 100% ETc was restored when 40% of the total available water was depleted, according to the evapotranspiration method of Doorenbos and Pruitt [25]. Totals of 245 and 294 mm of water were applied in 2004 and 2005, respectively, by drip irrigation. Plant protection was done according to the cultivation protocols of the Campania Region (Italy). Weed control was performed at two plant stages: the first one was at 20 days after transplanting (before blooming) using Metribuzin (52.17 g%) at a dose of 0.45 L ha−1 and spraying 500 L ha−1 of this solution, while the second one was during fruit ripening, using mechanical and hand hoeing control. A single harvest was carried out in each year at the end of the growing season, i.e., within the first ten days of August 2004 and 2005, when ripe fruits accounted for approximately 85% of the total.

2.3. Recorded Parameters

Starting one month after transplant, physiological and morphological parameters were biweekly assessed in five sampling times (T1, T2, T3, T4, and T5) on two plants per plot. For the destructive analyses, in each year, two plants were collected at each time-point (leaving at least another two neighboring plants on each side) by digging plants to a soil depth of 40 cm, then washing away the soil from the roots. The different organs were weighed, recorded, and oven-dried at 65 °C until constant weight, so the root, stem, leaf, fruit (ripe and un-ripe), and total biomass dry weight (aboveground and belowground) were obtained. Furthermore, the LAI was measured using a subsample of fresh leaves that was run through an LI-3000A leaf area meter (LI-COR, Lincoln, NE, USA), and this was linked to the leaf dry weight.
The N content of the below- and aboveground biomass was also measured by the Kjeldahl method [26]. Harvested fruits (adopting an assay area of 9.52 m2) were classified into unmarketable (unripe and rotten) and marketable yield and weighed, and the total yield was then calculated as the sum of the fractions.
Some physiological parameters were also calculated: crop water productivity, fruit water productivity, and nitrogen use efficiency (NUE), and its components like nitrogen uptake efficiency (NUpE) and nitrogen utilization efficiency (NUtE). During the growing season, crop water productivity (CWP) was calculated as the ratio between the plant dry weight (kg) and total water used by plants (L m−2) [27,28], while fruit water productivity (FWP) was calculated as the ratio between the marketable yield and the total water used by plants (L m−2) [29]. NUE was calculated as the ratio between dry matter allocated to fruits (kg) and N supplied (defined as the sum of N applied as fertilizer and total N absorbed by unfertilized plants, considering the above- and belowground biomass). NUpE was obtained as the ratio between total plant N (kg) and N supplied (kg), while NUtE was obtained as the ratio between dry matter allocated to fruit (kg) and total plant N (kg).
Finally, brix t ha−1 was calculated by multiplying the hectare marketable yield by °Brix and dividing the result by 100. The °Brix was determined using a Refracto 30PX digital refractometer (Mettler Toledo, Germany).

2.4. Economic and Environmental Aspects

The marginal net return (MNR) was calculated as follows:
M N R   =   ( Y i e l d   ×   P r i c e )     ( N f e r t i l i z a t i o n   ×   C o s t )
where Yield was the marketable yield for each treatment, Price was the price paid for yield (105 euro t−1), N f e r t i l i z a t i o n was the N fertilizer amount given, and Cost was the cost of the N fertilizer (190 and 250 euro t−1 for ammonium sulphate and ammonium nitrate, respectively). The Price and the Cost were indicative costs for the last few years (R. Reggiani, and U. Cucino, personal communication).
To assess the environmental impact of the different N rates investigated in the present study, the greenhouse gas (GHG) emissions of each N rate were measured by life cycle assessment (LCA), considering the entire life cycle at the farm gate. One hectare (ha) of production and one tonne (t) of harvested marketable yield [based on fresh weight (f.w.)] was used as functional units. Global warming potential (GWP) was adopted as the impact category of human activities on global climate change. Functional units expressed in kilograms of carbon dioxide equivalents (CO2-eq) were obtained using Tier 2 methodologies recommended by the Intergovernmental Panel on Climate Change (IPCC) [30], and here we considered the process from the soil tillage to the harvest time of the crop. Most data related to energy consumption were recorded during the crop cycles; in addition, available data such as electrical energy (0.57 kg CO2-eq per kW hel; [31]), gasoline and diesel (0.53 and 0.58 kg CO2-eq per L of gasoline and diesel, respectively; [32]), lubricant (1.07 kg CO2-eq per kg of lubricant; [33]), and fertilizer production (3.6 kg CO2-eq per Kg of N; [34]) were also considered. Direct emissions from fertilizer administration and soil management were calculated by applying the Tier 1 method described in the 2006 Intergovernmental Panel on Climate Change Guidelines for National Greenhouse Gas Inventories [30]. Therefore, an emission of 0.01 kg of nitrogen dioxide (N2O) for each kg of N applied to the field [35] and indirect N2O emissions were considered. For the last parameter, the atmospheric deposition of N volatilized from soil management and leaching and runoff were considered (0.006 kg of N2O for each kg of N applied). N2O emissions were therefore converted to CO2-eq by adopting the relative contribution of a gas to the greenhouse effect (IPCC, 1996) [36]. The impacts of seed, seedling, pesticide, and fungicide productions, as well as the manufacture and maintenance of farm equipment, their transport, and waste management, were omitted in the analysis due to them having the same contribution in the different fertilization treatments [37].

2.5. Data Analysis

Agronomic and physiological data were subjected to analysis of variance (one-way ANOVA) separately for each growing season due to unpredictable weather conditions in the Mediterranean basin [38]. Means were separated when the F test of the ANOVA for treatment was significant at least at the 0.05 probability level. For statistical analysis, the GENSTAT 7 (VSN International, Hemel Hempstead, UK) Release 1 software package [39] was used.

3. Results

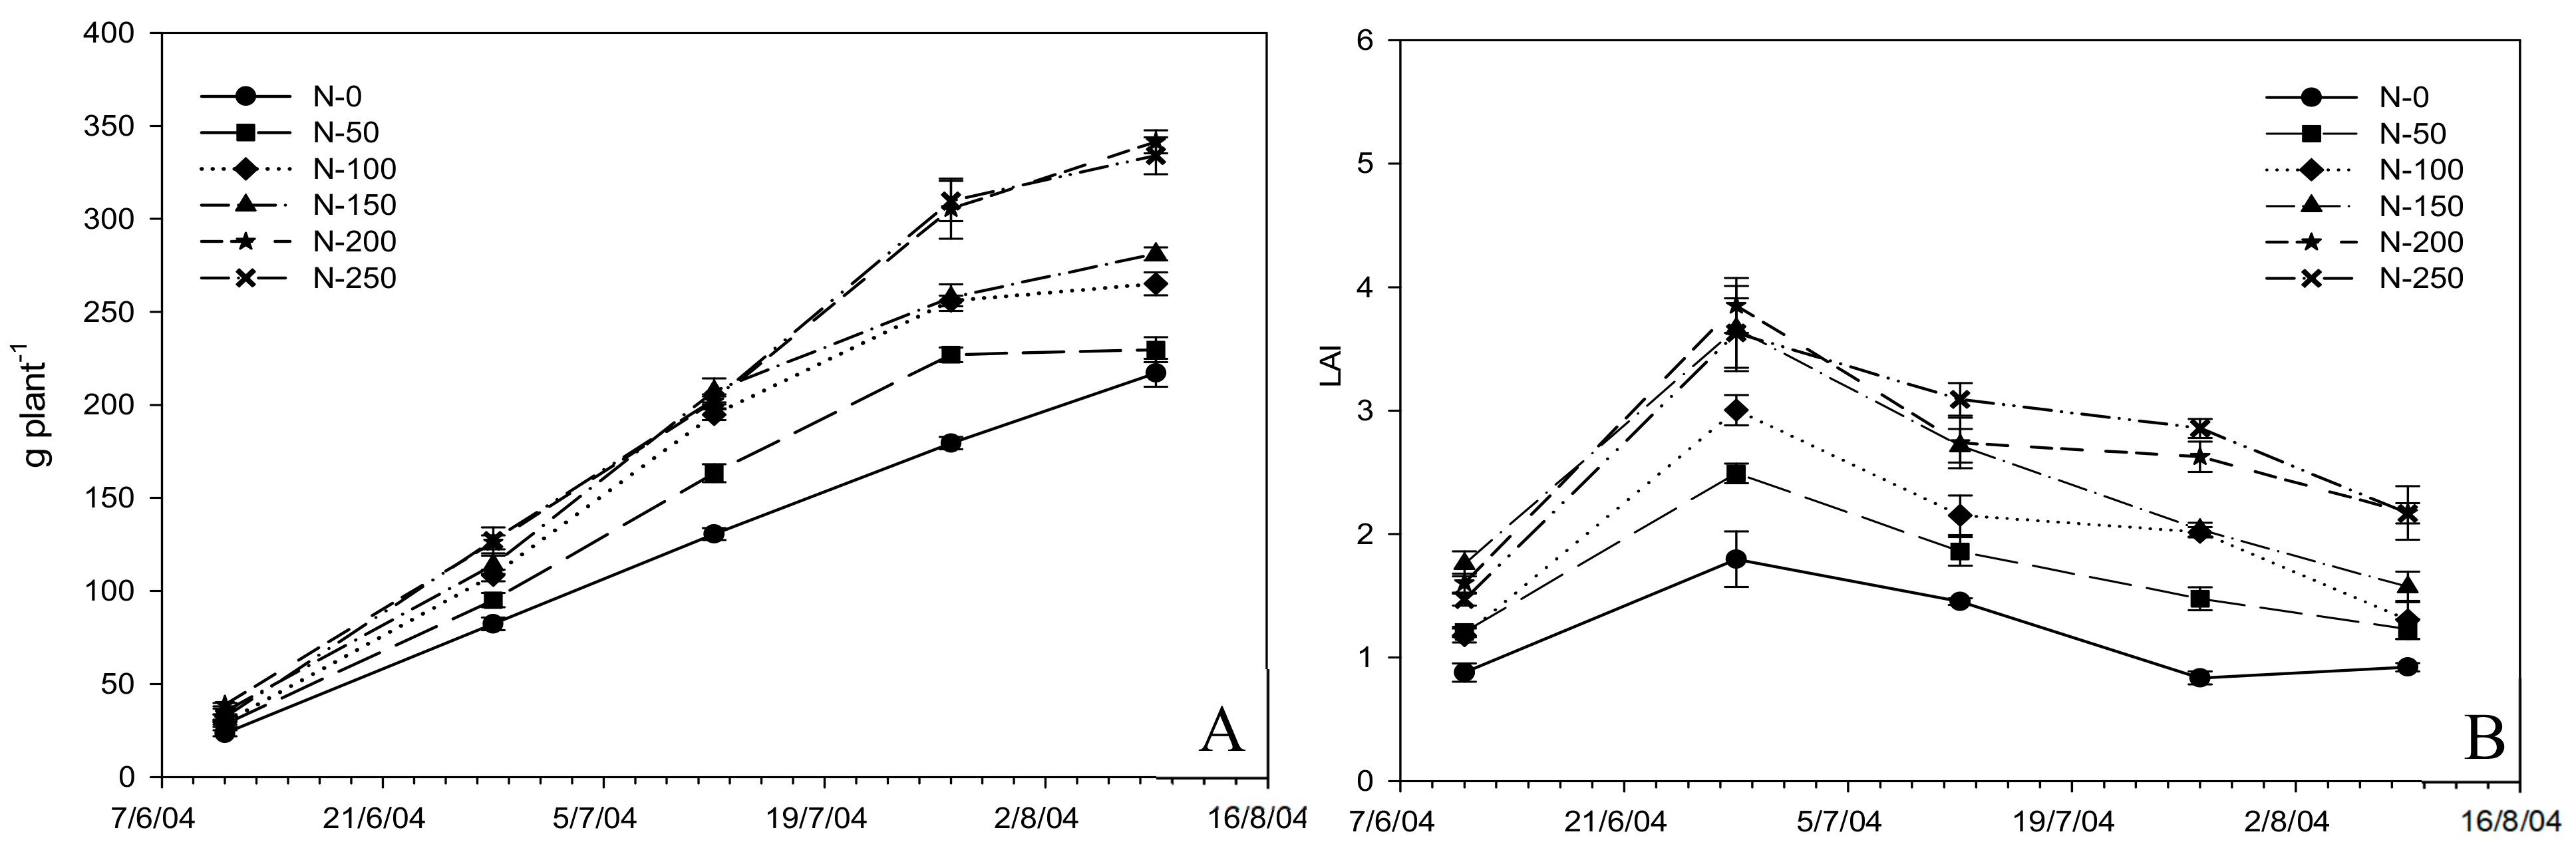
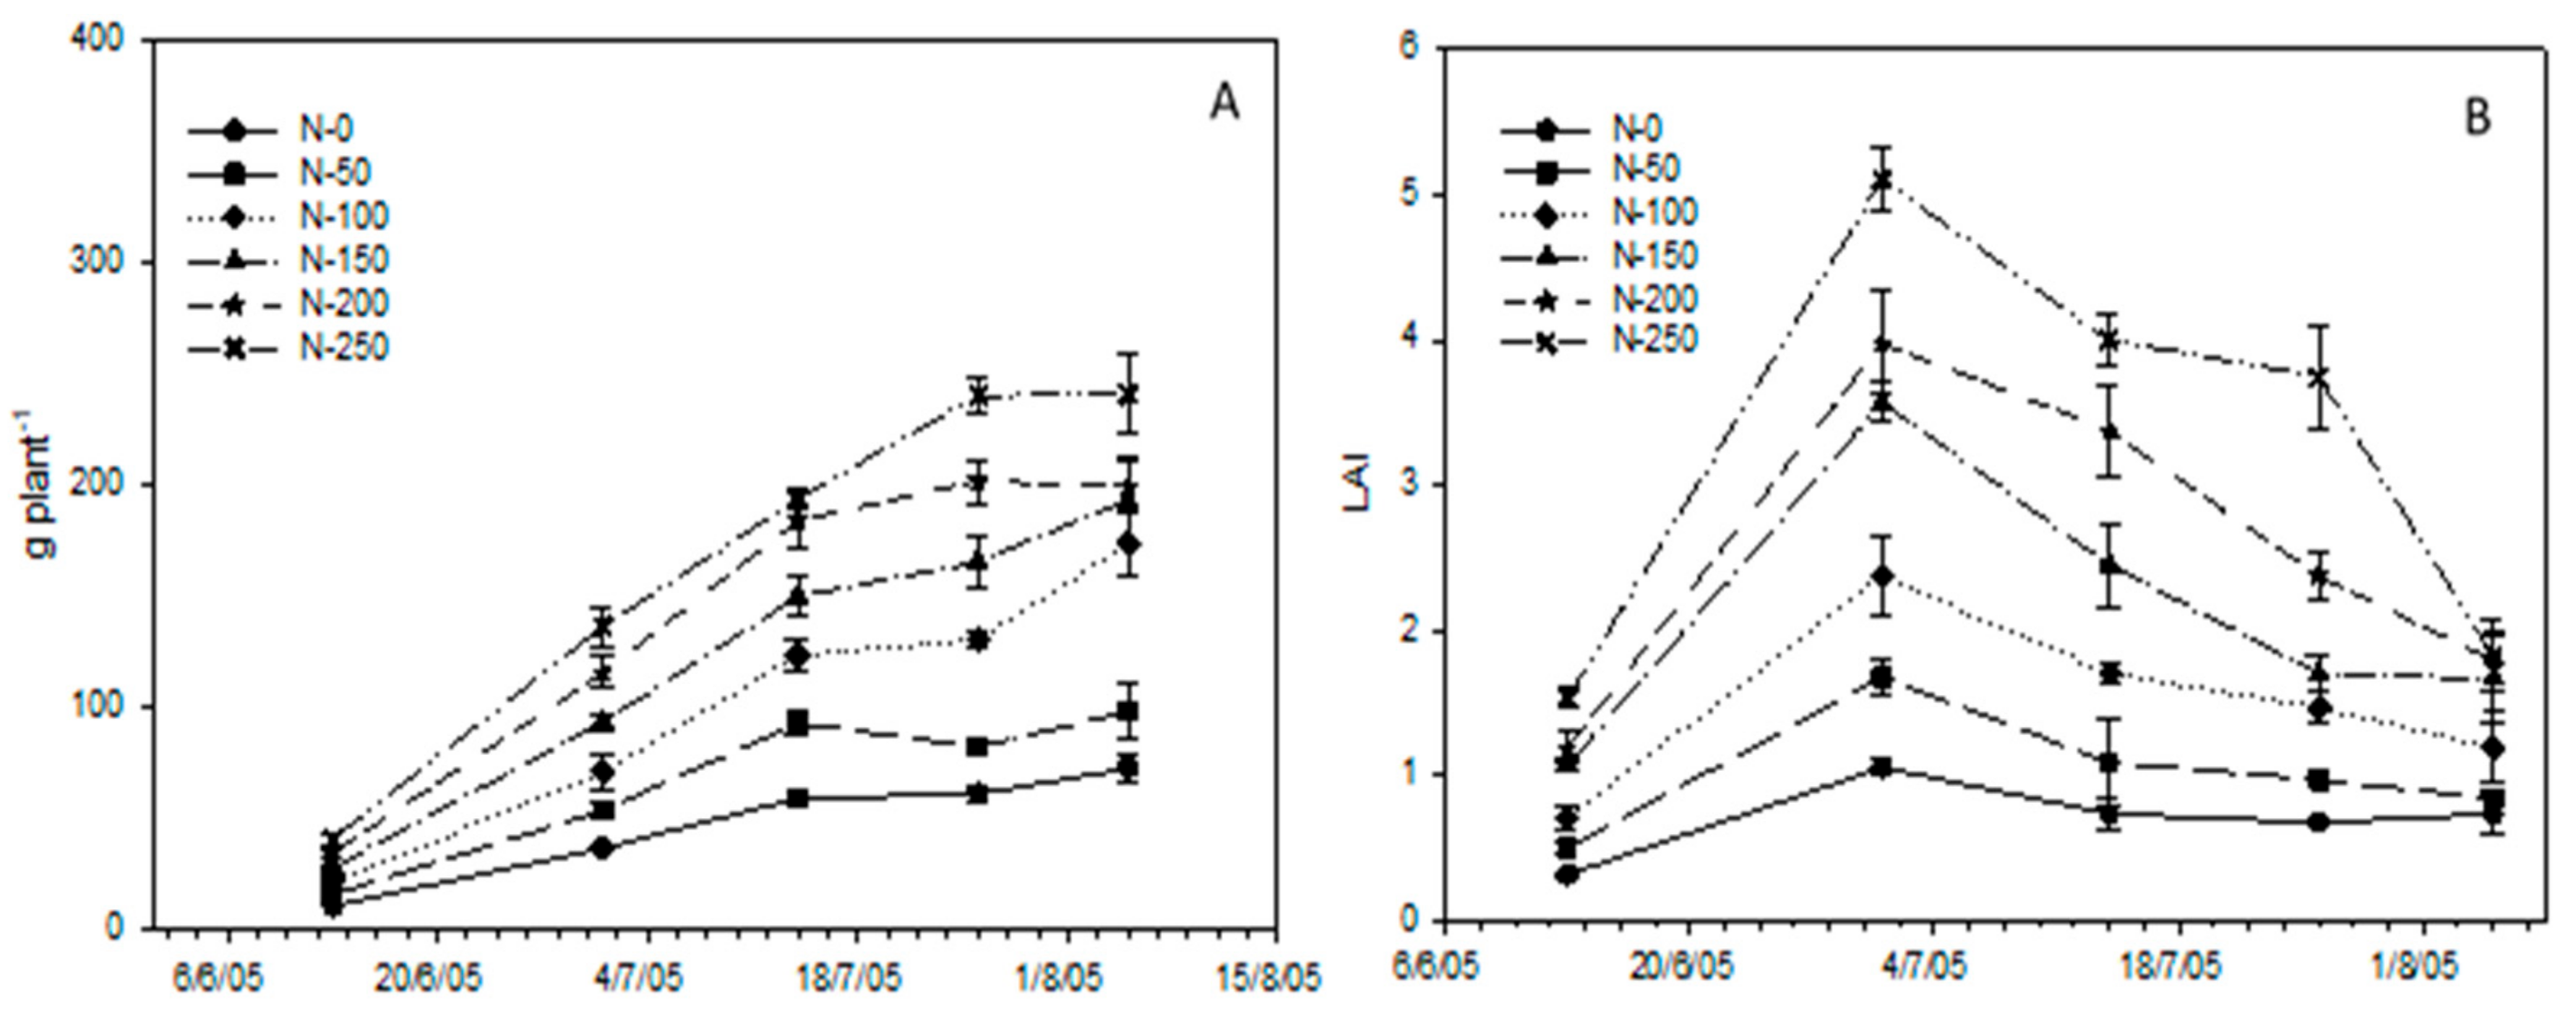
3.1. Effect of Nitrogen Rate on Growth Parameters

The effect of the N rate on dry matter accumulation and LAI, studied in the first year of the experiment (2004), is reported in Figure 2A,B, respectively. For dry matter accumulation, the trend was increasing for all treatments, but with different behavior between all N-fertilized treatments and the unfertilized control (N-0). Indeed, for N-0, the increasing rate was linear from T1 (~25 g plant−1) to T5 (~210 g plant−1); instead, a lower rate of dry matter accumulation at the end of the crop cycle (from T4 to T5) was noticed for N-50–250 (with values ranging from ~220 to ~350 g plant−1). Moreover, at T5, dry matter accumulation did not differ between the control (N-0) and N-50 or between N-250 and N-200 fertilized plants.
In the present study, the LAI (Figure 2A) increased until the end of June (from T1 to T2); thereafter, a decreasing trend was recorded up to the lowest value detected at the last sampling (T5) when physiological senescence of plants occurred. As obviously expected, the N rate affected the LAI; indeed, the control (N-0) showed the lowest value during the whole growing cycle (ranging from 1 to 1.5), while the LAI values of the N-fertilized plants increased in accordance with the nitrogen rates. No differences were found among the N-150, N-200, and N-250 treatments; at the end of June (T2) (when the highest LAI values—3.5, on average—were measured), however, in the following samplings (from T2 to T5), N-250 resulted in the highest LAI values, delaying plant senescence and ensuring greater soil cover.
The effect of sampling data and N rate on the dry matter distribution to each plant organ in 2004 is reported in Figure 3A,B, respectively. In the early stages of the growing cycle (T1), the dry matter allocated to the root (~ 10%) was higher than that in the following samplings (from T2 to T5), similar to what happened for the stem (Figure 3A). As expected also, the dry matter allocated to the leaf decreased during the growing cycle, being reduced at the end of cycle by at least one-third of the average values of T1 and T2. An opposite trend was found for the dry matter allocated to fruit, reaching the highest percentages (~65%) at the end of July (T4).
Finally, no significant differences in dry matter allocation to different organs were found as the effect of N rates in the first year of investigations (Figure 3B).
Figure 4 reports the dry matter accumulation and LAI recorded in the second year of the experiment (2005). The trend of the dry matter accumulation (Figure 3A) resembled the results of the first year; however, the effect of the N rate was more marked, especially in the last two samplings (T4 and T5). The values of total dry matter accumulation, as affected by N supplies, were lower than those in the first year. Indeed, the final values of dry matter per plant were 290.3 g plant−1 in 2004 and 181.3 g plant−1 in 2005 as a mean value of all N rates adopted.
The LAI values of the second experimental year are reported in Figure 4B. As in the first year, the highest values of this parameter were recorded at the end of June (T2); however, for the N-200 and N-250 treatments, higher accumulation than that in 2004 was recorded (+14% and +43%, respectively) at this sampling.
In Figure 5A,B the effect of sampling dates and the N rate on dry matter allocation to the different plant organs is reported for the year 2005. The recorded values of dry matter allocated to root, stem, and leaf resembled the results from the first year of the trial, even if at the second sampling (T2) the dry matter allocated to leaf was already half that in the first sampling (T1), and the dry matter allocated to fruit at T1 was ~7 times higher than that recorded in the year 2004. Contrary to what was found in the first year, the N rate affected the dry matter distribution; indeed, the N-100, N-150, and N-200 treatments resulted in similar allocations to the different organs, while the N-250 and N-0 rates induced low dry matter allocation to fruit.

3.2. Effect of Nitrogen Supply on Yield Parameters

In the first year, the N rate significantly affected the unmarketable, marketable, and total yields and brix t ha−1 as reported in Table 1. The total yield increased with N supply; however, no significant differences were found between the highest N rates (N-200 and N-250), displaying values of 107.6 and 102.6 t ha−1, respectively, which were almost double the control yield (N-0). Moreover, an increase of 13.7% in total yield was also observed when comparing the mean yield of the N-100 and N-150 treatments and that of the highest N rates. Treatments N-200 and N-250 resembled the trend of the marketable and unmarketable yields. The percentages of these two yield components were on average ~83% and ~17.0% of the recorded total yield. Finally, the highest values of brix ton ha−1 (with an average value of 4.11 t ha−1) were reported for the N-200 and N-250 treatments, displaying a similar behavior to the total yield.
Yield and its components recorded in the second year of research are reported in Table 2. Notwithstanding the lower dry matter accumulation than 2004, the total yield was consistent with that in the first growing season; moreover, no significant differences were found for the highest N rates (N-200 and N-250) in terms of the total (107.6 t ha−1 and 102.6 t ha−1, respectively) and marketable yields (76.1 t ha−1 and 82.0 t ha−1, respectively). However, the highest N rate (N-250) resulted in the highest unmarketable fruit production (30.2 t ha−1, equal to 26.9% of the total yield). Similar to the other yield parameters, brix ton ha−1 increased according to the N rates, without significant differences between the N-200 and N-250 treatments. Finally, the mean value in 2005 (3.47 brix ton ha−1) was lower (~15%) than that in the first year (2.94 brix t ha−1).

3.3. Effect of Nitrogen Supply on Physiological Parameters

In the present study, plants were dripline irrigated and well-watered without any drought stress for both years of our research. Nonetheless, as reported in Figure 6A,C, CWP ranged from ~0.0028 kg d.w. L H2O−1 to ~0.0045 kg d.w. L H2O−1 in 2004, and from ~0.0008 kg d.w. L H2O−1 to ~0.0028 kg d.w. L H2O−1 in 2005, and it was affected by the N rate. In any case, the lowest CWP measurements were recorded for the untreated control (N-0), and the highest values were achieved by treatments N-150, N-200, and N-250 in both years.
The trend in fruit water productivity (FWP) resembled the CWP trend, ranging from ~0.018 kg f.w. L H2O−1 (N-0) to ~0.038 kg d.w. L H2O−1 (N-200) in 2004 and from ~0.011 kg f.w. L H2O−1 (N-0) to ~0.028 kg d.w. L H2O−1 (N-250) in 2005. However, no significant differences were found in 2004 among treatments N-150, N-200, and N-250, or in 2005 between N-200 and N-250 rates (Figure 6B,D ).
NUE, NUpE, and NUtE values are reported in Figure 7. The highest values of NUE were recorded for treatments N-100 and N-150 in both years (producing 50 kg of fruit dry weight per kg of N supplied, on average, across treatments and years), but for N-50, the detected value in 2004 was comparable to N-100 and N150 supplies. Regarding the two components of NUE, NUpE resembled the behavior of NUE in 2004 and 2005, reaching 0.61 kg of total plant N per kg of N supplied, on average, across treatments and years. On the other hand, the highest N rates (N-200 and N-250) always recorded the lowest values of NUE and NUpE (20 and 0.30 kg kg1, on average, across years, respectively). NUtE values for N-50, N-100, and N-250 rates were comparable among treatments and over the two years (70 kg of fruit dry weight per kg of total plant N, on average). Significant differences were recorded only in the first growing season (2004).

3.4. Effect of Nitrogen Supply on Economic and Environmental Aspects

The effect of N fertilization on marginal net return (MNR) and global warming potential (GWP) is reported in Figure 8.
In both year, treatments N-150, N-200, and N-250 displayed the highest values of MNR (8000 € ha−1, as the mean of three detected values), with no significant differences in 2004, if compared with the N-100 rate. As expected, the lowest values of MNR were always found for the N-0 rate.
Considering the GWP of processing tomato production per 1 tonne of f.w. marketable yield (Figure 8B,E), the highest values were found in the untreated control (N-0) both in 2004 (~90 kg of CO2-eq per t of f.w. marketable yield, Figure 8B) and in 2005 (~130 kg of CO2-eq per t of f.w. marketable yield, Figure 8E). Furthermore, only in the year 2005, N rates from 50 up to 250 kg ha−1 linearly decreased and affected the GWP (ranging from 90 to 70 kg of CO2-eq per t of f.w. marketable yield). The GWP of the processing tomato per 1 ha of production is reported in Figure 8C,F. As obviously expected, for both years, GHG emissions were significantly affected by the N rates (ranging from 4000 kg CO2-eq per ha up to 5500 kg CO2-eq per ha, on average, across treatments and years).

4. Discussion

Processing tomato represents an important economically valuable industrial crop requiring huge amount of external inputs like fertilizers, irrigation water, and pesticides that, if not well managed, can negatively affect environmental sustainability [40]. Hence, researchers are called to give strategic and useful information on agronomic management to improve processing tomato’s production sustainability.
Several studies have reported the effects of cultural practices on the yield and quality of this horticultural crop [21,22,41,42], however, without information on economic and environmental impacts.
One of the most important issues in tomato crop production regards N administration and its soil availability [43]. More than any other nutrient, N affects vegetative growth, yield, and quality attributes [37,44,45,46,47].
Water availability, phosphorus and N fertilization, different growth seasons, shading levels, soil salinity, etc., affect dry matter partitioning in tomato crops [8,17,21,48]. However, a few papers published on dry matter partitioning considered both the above- and the belowground biomass. In addition, the effects of agricultural practices should also be considered in terms of economic and environmental aspects, as well as the impact on crop yield and quality [49]. Studies are frequently lacking in useful information on environmental impacts [28,40]. From this point of view, the present study investigated the effects of different N rates on dry matter accumulation and partitioning in a processing tomato crop while also focusing on MNR and GWP, which are very important parameters of the production process.
Our results highlighted the impact of the environment (year) on both dry matter accumulation and its distribution to the different tomato plant organs. Variability in climatic conditions across the years (mainly related to air temperatures and rainfall distributions) occurred during the growing seasons and strongly affected tomato crop growth, as also reported in similar areas for the same crop [7] and for quinoa (Chenopodium quinoa Willd.) cultivated in the Apulia region [50]. Indeed, the second growing season was drier and hotter than the first one, which influenced the lower values of dry matter accumulation and marketable yield of the tomato crop.
Taking into account the effects of N fertilization, as expected, the N-250 rate resulted in the highest dry matter accumulation and LAI in both the 2004 and 2005 growing seasons. Moreover, comparing N-250 to treatment N-0, an increase in dry matter accumulation and maximum LAI (on average, +130% and +280%, respectively) over the years was observed. Our results are in accordance with results found in Italian tomato cultivation [51] and even in experimental trials performed in California [21]. Finally, similar results were also highlighted for durum wheat and broccoli cultivated in Southern Italy by Tedone et al. [52] and Conversa et al. [53], respectively. Both authors reported that high nitrogen applications are required to achieve the highest values in terms of vegetation nutritional status and dry matter in both durum wheat and broccoli.
The present study highlighted the same behavior in terms of dry matter accumulation for treatments N-100, N-150, and N-200, regardless of growing seasons and, therefore, of the total dry matter allocation, suggesting no plant physiological changes in the source–sink relationship affected by N rates in the range between 100 and 200 kg ha−1. According to these results, no translocation efficiency improvement could be obtained by applying more than 100 kg of N ha−1. Similar results were also reported in comparisons between different farming systems (organic vs. conventional) and nitrogen fertilizers (organic vs. mineral) by Ronga et al. [7].
Focusing on the dry matter distribution to the sink organ, the most striking differences as an effect of N rates were recorded in the second growing season (2005). N supply from 50 to 200 kg ha−1 resulted in the highest dry matter allocated to fruits, while the N-0 and N-250 treatments favored more accumulation to leaf, stem, and root than fruit. This behavior seemed to be related to the need to improve the source strength in the unfertilized control (N-0), while the highest N rate gave excessive and imbalanced crop growth of vegetative luxuriance. Ronga et al. [10] and Higashide and Heuvelink [41] pointed out the importance of a balanced leaf area as a factor in obtaining satisfactory tomato production.
The highest rates of dry matter accumulation to the fruits were clearly observed starting from the third sampling (T3, corresponding to the middle July in both years), while an opposite trend was found for root, stem, and leaf. Interestingly, the highest dry matter allocation to the root was measured in 2005 under scant natural rainfall, suggesting an improved increase in root growth by dripline in the drought environment conditions. Moreover, Poorter et al. [54] and Hermans et al. [55] also reported a higher biomass allocation to root than other organs under limited soil resources such as water and N.
After fruit set, the increased rates in dry matter allocation to fruits, coinciding with a decrease to the other organs, measured in our research agree with the results of Scholberg et al. [21]. Indeed, the same authors reported that high-yielding crops, such as tomato, displayed values of ~65% of the dry matter allocated to fruit [also called the harvest index (HI)]. Tollenaar [56] also reported in maize crop a high yield according to the greatest dry matter production, although the HI did not vary, as also showed in our study, as not affected by N supply.
Fertilization affected the unmarketable, marketable, and total yields and fruit quality (in terms of brix t per ha) similarly in both years, resulting in increasing effects up to 200 Kg ha−1 (without significant differences from 250 Kg ha−1). Similar research, performed in the same location on peeling tomato (cv. Galeon), reported increasing yield up to N-200 [46]. The authors also reported no significant effects in tomato production moving from N-200 to N-250 supply. The yield performance under high N rates was also in accordance with other investigations carried out in a similar area [10,51] and under different environmental conditions [57].
Inappropriate N administration can reduce crop production and NUE, resulting in increased fertilizer losses and in reduced tomato crop sustainability [46,47,48,49,50,51,52,53,54,55,56,57,58]. NUE is a complex physiological parameter depending on plant genetic background and affected by environmental factors. It has two components: N uptake efficiency (NUpE) and N utilization efficiency (NUtE) [59,60].
In the present study, the N-100 and N-150 rates showed the highest values of NUE and NupE in both years. Despite the highest marketable tomato yield being achieved by supplying 200–250 Kg of N ha−1, these N fertilization levels displayed intermediate and low values of NUE and NUpE, respectively. Considering the importance of N management as a key factor in achieving satisfactory yields, the results of our research identified treatment N-200 as the optimal rate to obtain high tomato production and avoiding N losses like volatilization and leaching, which both contribute to the impact due to GWP [59,61].
In the field experiments, tomato crops were well watered in both years. Our results showed the highest values of crop water productivity and fruit water productivity in the N-200 and N-250 fertilized plants, confirming the important relationship between soil water content and N fertilization that was also reported in other studies [62,63]. In addition, similar results were reported by Mastalerczuk et al. [64] on festulolium, confirming that lack of nitrogen results in lower values of water use efficiency.
Crop MNR and environmental impacts due to N administration are two aspects frequently ignored by farmers. In this experiment, no significant increases in MNR were detected above 200 kg of N ha−1 in both the years of research. On the other hand, N rates less than N-200 did not result in a satisfactory marketable yield; however, no significant differences in MNR were noticed for the N-150 rate. In the Mediterranean environment, low N supplies also resulted in unacceptable values of MNR for wheat; moreover, the production trend resulting from N fertilization was affected by interannual climatic variability [49].
Farmers adopt huge amounts of external inputs for agricultural productions, contributing to GWP via greenhouse gases, like carbon dioxide, methane, and nitrous oxide. Hence, the implementation of sustainable agronomic management to mitigate the production of GHGs is a crucial point [65]. In our study, treatment N-200 resulted in the lowest GWP impact in both the growing seasons, especially due to the highest marketable yields. The GWP of processing tomato production per 1 ha obviously increased according to N fertilization. Interestingly, our results on GWP, both per marketable yield and per cropped area, are in agreement with data reported by Ronga et al. [40] and Ntinas et al. [65] who investigated the GWP of processing tomato cultivation in similar areas.

5. Conclusions

Our results, as expected, showed that the N rates affected dry matter accumulation, interestingly without effects on dry matter distribution to the different plant organs during a mild and rainy growing season (2004). On the other hand, N fertilization from 50 to 200 Kg of N ha−1 resulted in the highest values of dry matter allocated to fruit during the drier year of the experiment (2005). These results suggest that until now, tomato breeding has putatively selected plants with a high translocation efficiency of dry matter to fruit in the range from 50 to 200 kg of N ha−1. Considering the highest value of marketable yield and MNR and the lowest environmental impact (GWP), the rate of 200 Kg ha−1 represents the most advisable level of N fertilization in the environmental conditions of Southern Italy. Finally, since the N-200 rate did not result in the highest values of NUE and NupE, an improvement of these physiological parameters should be considered in future processing tomato breeding programs.

Author Contributions

Conceptualization, D.R., M.P. and I.D.M.; Methodology: M.P. and D.R; Data curation, M.P., M.M. and A.P.; Formal analysis, D.R., and M.M.; Investigation, M.P., A.P., M.M., and I.D.M.; Software, D.R., Supervision, M.P.; Visualization, D.R. and M.M.; Writing—original draft, D.R.; Writing—review and editing, D.R. and M.P.; Funding acquisition, M.P.

Funding

This work was supported by the project “Piano regionale per la consulenza alla fertilizzazione aziendale in Campania”, funded by the Campania Region (Italy).

Conflicts of Interest

The authors declare no conflicts of interest.

References

  1. FAOSTAT. 2019. Available online: www.fao.org/statistics/databases/en/ (accessed on 18 November 2019).
  2. World Processing Tomato Council (WPTC). 2019. Available online: https://www.wptc.to (accessed on 12 May 2019).
  3. Ronga, D.; Caradonia, F.; Setti, L.; Hagassou, D.; Giaretta Azevedo, C.V.; Milc, J.; Pedrazzi, S.; Allesina, G.; Arru, L.; Francia, E. Effects of innovative biofertilizers on yield of processing tomato cultivated in organic cropping systems in Northern Italy. Acta Hortic. 2019, 1233, 129–136. [Google Scholar] [CrossRef]
  4. Tilman, D.; Balzer, C.; Hill, J.; Befort, B.L. Global food demand and the sustainable intensification of agriculture. Proc. Natl. Acad. Sci. USA 2011, 108, 20260–20264. [Google Scholar] [CrossRef] [PubMed] [Green Version]
  5. Howarth, R.W. Coastal nitrogen pollution: A review of sources and trends globally and regionally. Harmful Algae 2008, 8, 14–20. [Google Scholar] [CrossRef]
  6. Ronga, D.; Zaccardelli, M.; Lovelli, S.; Perrone, D.; Francia, E.; Milc, J.; Ulrici, A.; Pecchioni, N. Biomass production and dry matter partitioning of processing tomato under organic vs. conventional cropping systems in a Mediterranean environment. Sci. Hortic. 2017, 224, 163–170. [Google Scholar] [CrossRef]
  7. Heuvelink, E. Re-interpretation of an experiment on the role of assimilated transport resistance in partitioning in tomato. Ann. Bot. 1996, 78, 467–470. [Google Scholar] [CrossRef] [Green Version]
  8. Horst, W.J.; Behrens, T.; Heuberger, H.; Kamh, M.; Reidenbach, G.; Wiesler, F. Genotypic differences in nitrogen use-efficiency in crop plants. Inn. Soil–Plant Sys. Sust. Agric. Prod. 2003, 75–92. [Google Scholar]
  9. Ronga, D.; Lovelli, S.; Zaccardelli, M.; Perrone, D.; Ulrici, A.; Francia, E.; Milc, J.; Pecchioni, N. Physiological responses of processing tomato in organic and conventional Mediterranean cropping systems. Sci. Hortic. 2015, 190, 161–172. [Google Scholar] [CrossRef] [Green Version]
  10. Mosisa, W.; Habtamu, Z. Advances in improving harvest index and grain yield of maize in Ethiopia. Afr. J. Sci. 2007, 1, 112–119. [Google Scholar]
  11. Osorio, S.; Ruan, Y.L.; Fernie, A.R. An update on source-to-sink carbon partitioning in tomato. Front. Plant Sci. 2014, 5, 516. [Google Scholar] [CrossRef] [Green Version]
  12. Venkateswarlu, B.; Visperas, R.M. Source-sink relationships in crop plants. Intern. Rice Res. Paper Series 1987, 125, 1–19. [Google Scholar]
  13. Crafts-Brandner, S.J.; Below, F.E.; Harper, J.E.; Hageman, R.H. Differential senescence of maize hybrids following ear removal. I. Whole plant. Plant Physiol. 1984, 74, 360–367. [Google Scholar]
  14. Feller, U.; Fischer, A. Nitrogen metabolism in senescing leaves. CRC Crit. Rev. Plant Sci. 1994, 13, 241–273. [Google Scholar] [CrossRef]
  15. Erdal, I.; Ertek, A.; Senyigit, U.; Yilmaz, H.I. Effects of different irrigation programs and nitrogen levels on nitrogen concentration, uptake and utilization in processing tomatoes (Lycopersicum esculentum). Aust. J. Exp. Agric. 2006, 46, 1653–1660. [Google Scholar] [CrossRef]
  16. Tei, F.; Benincasa, P.; Guiducci, M. Critical nitrogen concentration in processing tomato. Eur. J. Agron. 2002, 18, 45–55. [Google Scholar] [CrossRef]
  17. Blaesing, D.; Murray, A.; Shultz, M.; Stewart, M. Nutrient management for high soluble solids production in Australia processing tomatoes. Acta Hortic. 2006, 724, 75–83. [Google Scholar] [CrossRef]
  18. De C. Carmello, Q.A.; Anti, G.R. Accumulation of nutrients and growth of processing tomato. Acta Hortic. 2006, 724, 85–90. [Google Scholar]
  19. Vazquez, N.; Pardo, A.; Suso, M.L.; Quemada, M. Drainage and leaching under processing tomato growth with drip irrigation and plastic mulch. Agric. Ecosyst. Environ. 2006, 112, 313–323. [Google Scholar] [CrossRef]
  20. Elia, A.; Conversa, G. Agronomic and physiological responses of a tomato crop to nitrogen input. Eur. J. Agron. 2012, 40, 64–74. [Google Scholar] [CrossRef]
  21. Scholberg, J.; McNeal, B.L.; Jones, J.W.; Boote, K.J.; Stanley, C.D.; Obreza, T.A. Growth and canopy characteristics of field-grown tomato. Agron. J. 2000, 92, 152–159. [Google Scholar] [CrossRef]
  22. Soil Survey Staff. Keys to Soil Taxonomy, 12th ed.; USDA-Natural Resources Conservation Service: Washington, DC, USA, 2014.
  23. Hargreaves, G.H.; Samani, Z.A. Reference crop evapotranspiration from tem-perature. Appl. Eng. Agric. 1985, 1, 96–99. [Google Scholar] [CrossRef]
  24. Allen, R.G.; Pereira, L.S.; Raes, D.; Smith, M. Crop Evapotranspiration. Guidelines for Computing Crop Water Requirements FAO Irrigation and Drainage; Paper No. 56; FAO: Rome, Italy, 1998. [Google Scholar]
  25. Doorenbos, J.; Pruitt, W.O. Crop Water Requirement. FAO Irrigation and Drainage; Paper No. 24 (rev.); FAO: Rome, Italy, 1977. [Google Scholar]
  26. Association of Official Analytical Chemists International (AOAC). Official Methods of Analysis, 15th ed.; Association of Official Analytical Chemists Inc.: Arlington, VA, USA, 1990; pp. 1028–1039. [Google Scholar]
  27. Cosentino, S.L.; Patané, C.; Sanzone, E.; Copani, V.; Foti, S. Effects of soil water content and nitrogen supply on the productivity of Miscanthus x giganteus greef et deu. in a Mediterranean environment. Ind. Crops Prod. 2007, 25, 75–88. [Google Scholar] [CrossRef]
  28. Ronga, D.; Villecco, D.; Zaccardelli, M. Effects of compost and defatted oilseed meals as sustainable organic fertilisers on cardoon (Cynara cardunculus L.) production in the Mediterranean basin. J. Hortic. Sci. Biotech. 2019, 94, 664–675. [Google Scholar] [CrossRef]
  29. Padilla-Díaz, C.M.; Rodriguez-Dominguez, C.M.; Hernandez-Santana, V.; Perez-Martin, A.; Fernandes, R.D.M.; Montero, A.; García, J.M.; Fernández, J.E. Water status, gas exchange and crop performance in a super high density olive orchard under deficit irrigation scheduled from leaf turgor measurements. Agric. Water Manag. 2018, 202, 241–252. [Google Scholar] [CrossRef]
  30. Intergovernmental Panel on Climate Change (IPCC). Guidelines for National Greenhouse Gas Inventories. In Agriculture, Forestry and Other Land Use; Intergovernmental Panel on Climate Change, IGES: Kanagawa, Japan, 2006; Volume 4, pp. 1.1–1.21. Available online: https://www.ipcc-nggip.iges.or.jp/public/2006gl/pdf/0_Overview/V0_1_Overview.pdf (accessed on 18 November 2019).
  31. Pehnt, M. Dynamic life cycle assessment (LCA) of renewable energy technologies. Ren. Energy 2006, 31, 55–71. [Google Scholar] [CrossRef]
  32. Furuholt, E. Life cycle assessment of gasoline and diesel. Resour. Conserv. Recycl. 1995, 14, 251–263. [Google Scholar] [CrossRef]
  33. Cuevas, P. Comparative Life Cycle Assessment of Biolubricants and Mineral Based Lubricants. Master’s Thesis, University of Pittsburgh, Pittsburgh, PA, USA, 2005. [Google Scholar]
  34. Hesq, Y.; Fossum, J.P. Calculation of carbon footprint of fertilizer production. Des. Pilot Plant Recover. Ammon. Salts WWTP Residual Water 2014, 76. [Google Scholar]
  35. Aguilera, E.; Lassaletta, L.; Sanz-Cobena, A.; Garnier, J.; Vallejo, A. The potential of organic fertilizers and water management to reduce N2O emissions in Mediterranean climate cropping systems. A review. Agric. Ecosys. Env. 2013, 164, 32–52. [Google Scholar] [CrossRef] [Green Version]
  36. Intergovernmental Panel on Climate Change (IPCC). Revised IPCC Guidelines for National Greenhouse Gas Inventories: Reference Manual; Intergovernmental Panel on Climate Change (IPCC): London, UK, 1996; Available online: https://www.ipcc-nggip.iges.or.jp/meeting/pdfiles/2006GLs_scoping_meeting_report_final.pdf (accessed on 18 November 2019).
  37. Meisterling, K.; Samaras, C.; Schweizer, V. Decision to reduce greenhouse gases from agriculture and product transport: LCA case study of organic and conventional wheat. J. Clean. Prod. 2009, 17, 222–230. [Google Scholar] [CrossRef]
  38. Gomez, K.A.; Gomez, A.A. Statistical Procedures for Agricultural Research; John Wiley & Sons: New York, NY, USA, 1984. [Google Scholar]
  39. GENSTAT COMMITTEE, GENSTAT 7 Release 1 Reference Manual; Clarendon Press: Oxford, UK, 2004.
  40. Ronga, D.; Gallingani, T.; Zaccardelli, M.; Perrone, D.; Francia, E.; Milc, J.; Pecchioni, N. Carbon footprint and energetic analysis of tomato production in the organic vs. the conventional cropping systems in Southern Italy. J. Clean. Prod. 2019, 220, 836–845. [Google Scholar] [CrossRef] [Green Version]
  41. Higashide, T.; Heuvelink, E. Physiological and morphological changes over the past 50 years in yield components in tomato. J. Am. Soc. Hortic. Sci. 2009, 134, 460–465. [Google Scholar] [CrossRef] [Green Version]
  42. Di Cesare, L.F.; Migliori, C.; Ferrari, V.; Parisi, M.; Campanelli, G.; Candido, V.; Perrone, D. Effects of irrigation-fertilization and irrigation-mycorrhization on the alimentary and nutraceutical properties of tomatoes (Chapter 11). In Irrigation Systems and Practices in Challenging Environments; Lee, T.S., Ed.; InTechOpen Science: London, UK, 2012; pp. 207–232. [Google Scholar] [CrossRef]
  43. Marschner, H. Mineral. Nutrition of Higher Plants, 2nd ed.; Academic Press: London, UK, 1995; p. 889, eBook ISBN 9780080571874. [Google Scholar]
  44. Alam, M.M.; Billah, K.M.; Prince, M.H.; Hasan, K.M. Effect of Nitrogen and Phosphorous Fertilizer Application on the Growth and Yield of Tomato: A Mini-Review. Int. J. Adv. Agric. Sci. 2018. [Google Scholar]
  45. Di Cesare, L.F.; Migliori, C.; Viscardi, D.; Parisi, M. Quality of tomato fertilized with nitrogen and phosphorous. Ital. J. Food Sci. 2010, 22, 186–191. [Google Scholar]
  46. Parisi, M.; Giordano, I.; Pentangelo, A.; D’Onofrio, B.; Villari, G. Effects of different levels of nitrogen fertilization on yield and fruit quality in processing tomato. Acta Hortic. 2006, 700, 129–132. [Google Scholar] [CrossRef]
  47. Dorais, M.; Ehret, D.L.; Papadopoulos, A.P. Tomato (Solanum lycopersicum) health components: From the seed to the consumer. Phytochem. Rev. 2008, 7, 231–250. [Google Scholar] [CrossRef]
  48. Hagassou, D.; Francia, E.; Ronga, D.; Buti, M. Blossom end-rot in tomato (Solanum lycopersicum L.): A multi-disciplinary overview of inducing factors and control strategies. Sci. Hortic. 2019, 249, 49–58. [Google Scholar] [CrossRef]
  49. Basso, B.; Ritchie, J.T.; Cammarano, D.; Sartori, L. A strategic and tactical management approach to select optimal N fertilizer rates for wheat in a spatially variable field. Eur. J. Agron. 2011, 35, 215–222. [Google Scholar] [CrossRef]
  50. De Santis, G.; Ronga, D.; Caradonia, F.; Ambrosio, T.D.; Troisi, J.; Rascio, A.; Fragassom, M.; Pecchioni, N.; Rinaldi, M. Evaluation of two groups of quinoa (Chenopodium quinoa Willd.) accessions with different seed colours for adaptation to the Mediterranean environment. Crop. Pasture Sci. 2019, 69, 1264–1275. [Google Scholar] [CrossRef]
  51. Farneselli, M.; Benincasa, P.; Tosti, G.; Pace, R.; Tei, F.; Guiducci, M. Nine-year results on maize and processing tomato cultivation in an organic and in a conventional low input cropping system. Ital. J. Agron. 2013, 8e2, 9–13. [Google Scholar] [CrossRef] [Green Version]
  52. Tedone, L.; Verdini, L.; Grassano, N.; Tarraf, W.; De Mastro, G. Optimising nitrogen in order to improve the efficiency, eco-physiology, yield and quality on one cultivar of durum wheat. Ital. J. Agron. 2014, 9, 49–54. [Google Scholar] [CrossRef] [Green Version]
  53. Conversa, G.; Lazzizera, C.; Bonasia, A.; Elia, A. Growth, N uptake and N critical dilution curve in broccoli cultivars grown under Mediterranean conditions. Sci. Hortic. 2019, 244, 109–121. [Google Scholar] [CrossRef]
  54. Poorter, H.; Sack, L. Pitfalls and possibilities in the analysis of biomass allocation patterns in plants. Front. Plant Sci. 2012, 3, 259. [Google Scholar] [CrossRef] [PubMed] [Green Version]
  55. Hermans, C.; Hammond, J.P.; White, P.J.; Verbruggen, N. How do plants respond to nutrient shortage by biomass allocation? Trends Plant Sci. 2006, 11, 610–617. [Google Scholar] [CrossRef] [PubMed]
  56. Tollenaar, M. Genetic improvement in grain yield of commercial maize hybrids grown in Ontario from 1959 to 1988. Crop. Sci. 1989, 29, 1365–1371. [Google Scholar] [CrossRef]
  57. Martínez-Blanco, J.; Muñoz, P.; Assumpció, A.; Rieradevall, J. Assessment of tomato Mediterranean production in open-field and standard multi-tunnel greenhouse, with compost or mineral fertilizers, from an agricultural and environmental standpoint. J. Clean. Prod. 2011, 19, 985–997. [Google Scholar] [CrossRef]
  58. Abenavoli, M.R.; Longo, C.; Lupini, A.; Miller, A.J.; Araniti, F.; Mercati, F.; Sunseri, F. Phenotyping two tomato genotypes with different nitrogen use efficiency. Plant Phys. Biochem. 2006, 107, 21–32. [Google Scholar] [CrossRef]
  59. Good, A.G.; Shrawat, A.K.; Muench, D.G. Can less yield more? Is reducing nutrient input into the environment compatible with maintaining crop production? Trends Plant Sci. 2004, 9, 597–605. [Google Scholar] [CrossRef]
  60. Xu, G.; Fan, X.; Miller, A.J. Plant nitrogen assimilation and use efficiency. Ann. Rev. Plant Biol. 2012, 63, 153–182. [Google Scholar] [CrossRef] [Green Version]
  61. Sebilo, M.; Mayer, B.; Nicolardot, B.; Pinay, G.; Mariotti, A. Long-term fate of nitrate fertilizer in agricultural soils. Proc. Natl. Acad. Sci. USA 2013, 110, 18185–18189. [Google Scholar] [CrossRef] [Green Version]
  62. Cammarano, D.; Ceccarelli, S.; Grando, S.; Romagosa, I.; Benbelkacem, A.; Akar, T.; Ronga, D. The impact of climate change on barley yield in the Mediterranean basin. Eur. J. Agron. 2019, 106, 1–11. [Google Scholar] [CrossRef]
  63. Cammarano, D.; Hawes, C.; Squire, G.; Holland, J.; Rivington, M.; Murgia, T.; Ronga, D. Rainfall and temperature impacts on barley (Hordeum vulgare L.) yield and malting quality in Scotland. Field Crop. Res. 2019, 241, 107559. [Google Scholar] [CrossRef]
  64. Mastalerczuk, G.; Borawska-Jarmułowicz, B.; Kalaji, H.M.; Dąbrowski, P.; Paderewski, J. Gas-exchange parameters and morphological features of festulolium (Festulolium braunii K. Richert A. Camus) in response to nitrogen dosage. Photosynthetica 2017, 55, 20–30. [Google Scholar] [CrossRef] [Green Version]
  65. Ntinas, G.K.; Neumair, M.; Tsadilas, C.D.; Meyer, J. Carbon footprint and cumulative energy demand of greenhouse and open-field tomato cultivation systems under Southern and Central European climatic conditions. J. Clean. Prod. 2017, 42, 3617–3626. [Google Scholar] [CrossRef]
Figure 1. The mean maximum and minimum air temperatures and total rainfall during the cropping cycles (May to August) recorded in the two growing seasons (2004 and 2005).
Agronomy 09 00855 g001
Figure 2. Effect of nitrogen supply (N-0 = 0 kg N ha−1; N-50 = 50 kg N ha−1; N-100 = 100 kg N ha−1; N-150 = 150 kg N ha−1; N-200 = 200 kg N ha−1; N-250 = 250 kg N ha−1) on dry matter accumulation (A) and leaf area index (LAI) (B) of tomato plants during the first experimental year (2004). Vertical bars indicate standard errors.
Agronomy 09 00855 g002
Figure 3. Effect of sampling data (A) and nitrogen rate (B) (N-0 = 0 kg N ha−1; N-50 = 50 kg N ha−1; N-100 = 100 kg N ha−1; N-150 = 150 kg N ha−1; N-200 = 200 kg N ha−1; N-250 = 250 kg N ha−1) on dry matter distribution to the different tomato plant organs in 2004. FTR = fraction to root; FTS = fraction to stem; FTL = fraction to leaf; FTF = fraction to fruit. Different letters indicate different means, according to LSD test (p < 0.05).
Agronomy 09 00855 g003
Figure 4. Effect of nitrogen rate (N-0 = 0 kg N ha−1; N-50 = 50 kg N ha−1; N-100 = 100 kg N ha−1; N-150 = 150 kg N ha−1; N-200 = 200 kg N ha−1; N-250 = 250 kg N ha−1) on dry matter accumulation (A) and leaf area index (B) of tomato plants during the second experimental year (2005). Vertical bars indicate standard errors.
Agronomy 09 00855 g004
Figure 5. Effect of sampling data (A) and N rate (B) (N-0 = 0 kg N ha−1; N-50 = 50 kg N ha−1; N-100 = 100 kg N ha−1; N-150 = 150 kg N ha−1; N-200 = 200 kg N ha−1; N-250 = 250 kg N ha−1) on dry matter distribution to the different tomato plant organs in the second year of the experiment (2005). FTR = fraction to root; FTS = fraction to stem; FTL = fraction to leaf; FTF = fraction to fruit. Different letters indicate different means, according to LSD test (p < 0.05).
Agronomy 09 00855 g005
Figure 6. (A) Crop water productivity (CWP) according to nitrogen supply (N-0 = 0 kg N ha−1; N-50 = 50 kg N ha−1; N-100 = 100 kg N ha−1; N-150 = 150 kg N ha−1; N-200 = 200 kg N ha−1; N-250 = 250 kg N ha−1) in 2004; (B) fruit water productivity (FWP) according to nitrogen supply in 2004; (C) CWP according to nitrogen supply in 2005; (D) FWP according to nitrogen supply in 2005. Different letters between each column indicate significant differences according to Duncan’s test (p ≤ 0.05).
Agronomy 09 00855 g006
Figure 7. (A) Nitrogen use efficiency (NUE) according to nitrogen supply (N-0 = 0 kg N ha−1; N-50 = 50 kg N ha−1; N-100 = 100 kg N ha−1; N-150 = 150 kg N ha−1; N-200 = 200 kg N ha−1; N-250 = 250 kg N ha−1) in 2004; (B) nitrogen uptake efficiency (NUpE) according to nitrogen supply in 2004; (C) nitrogen utilization efficiency (NUtE) according to nitrogen supply in 2004; (D) NUE according to nitrogen supply in 2005; (E) NUpE according to nitrogen supply in 2005; (F) NUtE according to nitrogen supply in 2005. Different letters between each column indicate significant differences according to Duncan’s test (p ≤ 0.05).
Agronomy 09 00855 g007
Figure 8. (A) Marginal net return (MNR) according to nitrogen supply (N-0 = 0 kg N ha−1; N-50 = 50 kg N ha−1; N-100 = 100 kg N ha−1; N-150 = 150 kg N ha−1; N-200 = 200 kg N ha−1; N-250 = 250 kg N ha−1) in 2004; (B) global warming potential (GWP) per marketable yield according to nitrogen supply in 2004; (C) global warming potential (GWP) per cultivated area according to nitrogen supply in 2004; (D) MNR according to nitrogen supply in 2005; (E) GWP per marketable yield according to nitrogen supply in 2005; (F) GWP per cultivated area according to nitrogen supply in 2005. Different letters between each column indicate significant differences according to Duncan’s test (p ≤ 0.05).
Agronomy 09 00855 g008
Table 1. Effect of nitrogen supply (N-0 = 0 kg N ha−1; N-50 = 50 kg N ha−1; N-100 = 100 kg N ha−1; N-150 = 150 kg N ha−1; N-200 = 200 kg N ha−1; N-150 = 250 kg N ha−1) on yield and its components (marketable, unmarketable, and soluble solids) in the year 2004.
TreatmentsUnmarketable FruitMarketable YieldTotal YieldFruit Quality
t ha−1 brix t ha−1
N-011.0 d44.1 e55.1 d2.15 d
N-5012.3 d62.8 d75.1 c3.05 c
N-10014.2 c75.7 c89.9 b3.63 b
N-15015.6 bc79.2 bc94.8 b3.79 b
N-20017.3 ab90.3 a107.6 a4.19 a
N-25018.0 a84.6 ab102.6 a4.03 a
Significance*******
*, **, Significant at p ≤ 0.05, 0.01. Different letters within each column indicate significant differences according to Duncan’s test (p ≤ 0.05).
Table 2. Effect of nitrogen supply (N-0 = 0 kg N ha−1; N-50 = 50 kg N ha−1; N-100 = 100 kg N ha−1; N-150 = 150 kg N ha−1; N-200 = 200 kg N ha−1; N-250 = 250 kg N ha−1) on yield parameters (marketable, unmarketable, and soluble solids) in the year 2005.
TreatmentsUnmarketable FruitMarketable YieldTotal YieldFruit Quality
t ha−1brix t ha−1
N 011.0 e31.9 e42.9 e1.55 e
N 5015.0 d47.6 d62.6 d2.31 d
N 10019.6 c60.3 c79.9 c2.92 c
N 15023.9 b66.9 b90.8 b3.29 b
N 20025.9 b76.1 a102.0 a3.66 a
N 25030.2 a82.0 a112.2 a3.91 a
Significance********
**, significance at p ≤ 0.01. Different letters within each column indicate significant differences according to Duncan’s test (p ≤ 0.05).

