Article

Spatial and Temporal Distribution of Ecballium elaterium in Almond Orchards

1
Department of Plant Pathology and Weed Research, ARO, Volcani Center, Rishon LeZion 7528809, Israel
2
The Robert H. Smith Faculty of Agriculture, Food and Environment, The Hebrew University of Jerusalem, Rehovot 76100, Israel
3
Newe Ya’ar Research Center, ARO, Ramat Yishay 30095, Israel
*
Author to whom correspondence should be addressed.
Agronomy 2019, 9(11), 751; https://doi.org/10.3390/agronomy9110751
Submission received: 7 October 2019 / Revised: 11 November 2019 / Accepted: 12 November 2019 / Published: 13 November 2019
(This article belongs to the Special Issue Weed Management & New Approaches)

Abstract

:
The concept of site-specific weed management is based on the assumption that weeds are aggregated in patches. In this study, we surveyed four plots in four commercial almond orchards for three years and mapped the locations of Ecballium elaterium, a troublesome weed in Israeli agriculture, specifically in almond orchards. We analyzed the spatial pattern of the plants’ locations using nearest neighbor analysis and Ripley’s L function. The number of E. elaterium plants increased by more than 70% in the four plots from 2015 to 2016. In addition, the observed mean distance between nearest neighbors increased by more than 10% from 2016 and 2017. We found in all four plots that the spatial pattern of E. elaterium was clustered and that these weed patch locations were consistent over the years although the density within the patches increased. The extent of these clusters ranged between 40 to 70 m and remained similar in size throughout the study. These features make E. elaterium a suitable target for site-specific weed management and for pre-emergence patch spraying. Knowledge of the spatial and temporal pattern of weeds could aid in understanding their ecology and could help target herbicide treatments to specific locations of the field and, thus, reducing the chemical application.

1. Introduction

Traditionally, herbicides application is carried out with the assumption that weeds are evenly distributed in the field. This assumption means that the herbicides are applied uniformly without accounting to the spatial heterogeneity in the distribution of weeds [1]. However, site-specific weed management (SSWM) suggest that if weeds are not randomly distributed in the field then farmers can specifically target weed-infested areas in the field [2]. And indeed, numerous studies have shown that different weed species, annuals (e.g., Abutilon theophrasti, Solanum nigrum L.), and perennials (e.g., Sorghum halepense L., Cyperus rotundus L.), in different crop systems tend to spatially aggregate [3,4,5,6,7].
The observed patchy pattern is the result of heterogeneous environmental conditions (e.g., soil spatial heterogeneity, microclimatic conditions) [8,9], or of processes such as the dispersal rate and distance from the parent plant [10], competition between species or facilitation processes in which species mitigate the environmental condition and thus benefit other species (e.g., nurse plants [11]), or a combination of these factors [12,13]. Patchiness in weed distributions might also reflect differences in local management actions (e.g., seed dispersal and movement by farm equipment [14] and direction of tillage and irrigation furrows [15]).
Compared to the relatively well-studied spatial aspects of weeds, the temporal aspect has been less studied. Some studies have indicated that the spatial distribution of weeds in crop fields is often relatively stable between years [9,16,17,18,19]. However, not all studies have shown temporal consistency in the distribution of weeds. For example, Johnson et al. [20] found that the edges of patches varied considerably in consecutive seasons. Gerhards et al. [17] found that the spatial pattern of foxtail was unstable and its distribution and density temporal dynamics varied between fields.
Another issue that has gotten less attention is the population dynamics within patches over time. The concentration of weeds within a patch can increase or decrease as a consequence of biotic (e.g., competition) and abiotic (e.g., a change in resources or in microclimate conditions) interactions. This is an important issue as weed density has been shown to affect different aspects of crop management, such as weed control [21], herbicide application timing [22], or crop yield [23].
Studies on weed distribution have been done mostly in crops systems, mainly soybean and maize [7,15,24], and not in orchards. In crop systems, an increase in weed seed dispersal is largely attributed to the combine harvesting process that results in seed dispersal in the direction of crop rows [25]. In that sense, cropping systems might be relevant when studying weed spatial distribution. Orchards, for example, need less agro-managements field operations compared to most crop systems, and thus it is expected that weed distribution would be less affected by the field operations in orchards.
The use of spatial analysis methodologies, spatial statistics, and geostatistical theory to analyze spatial and temporal properties of weed distribution is an active research area [26]. Because of the central role of spatial autocorrelation in identifying locations of clusters, proper analysis of spatial autocorrelation is important to successful statistical analysis of geospatial data. Moran’s I and Geary’s care global measurements are used to quantify the spatial autocorrelation and to test the tendency of values to cluster together. When the attribute variable is binary (e.g., presence/absence of a species), these two methods are not appropriate. Other measurements commonly used to evaluate clustering include quadrat analysis, nearest neighbor index, and K-function [27]. Ripley’s K-function is used to indicate when the clustering becomes nonsignificant and to identify the scale of clustering.
In this work we employed geostatistic methods to study the spatial and temporal distribution of the Ecballium elaterium, squirting cucumber. It is a decumbent, perennial herb restricted to the Mediterranean Basin. Flowering begins in April and lasts until December [28]. The species is monoecious (flowers are either male or female, but both can be found on the same plant) and is pollinated by insects. The squirting cucumber reproduces sexually and use a self-dispersal mechanism as the seeds are ejected out of the basal opening away from the mother plant by the release of osmotic pressure that builds up within the ripe fruit [29]. Ecballium elaterium distribution in Israel has increased rapidly in the last decade mainly in orchards, e.g., citrus, vineyards, almonds, and more. A rapid acceleration in the infestation of E. elaterium was observed after herbicides from the triazine family (e.g., simazine) were banned for use in Israel and in Europe. The reduction in herbicide active ingredient options increases the selection pressure on the weed community, reduces their control efficacy, and may enhance specific species to become resistant or tolerant to herbicides [30,31,32].
The objectives of this study were to (1) quantify the spatial distribution of E. elaterium plants which survived the standard growers’ protocol herbicide treatments, as mentioned in the materials and methods below, (2) assess if the spatial distribution is stable over time, and (3) measure the temporal trend in weed density within patches. We studied E. elaterium in four almond orchards in Northern Israel in three consecutive years. We hypothesized that if E. elaterium can be shown to form patches within almond orchards and there is some degree of patch stability then it could be considered a candidate for targeting specific patch spraying.

2. Material and Methods

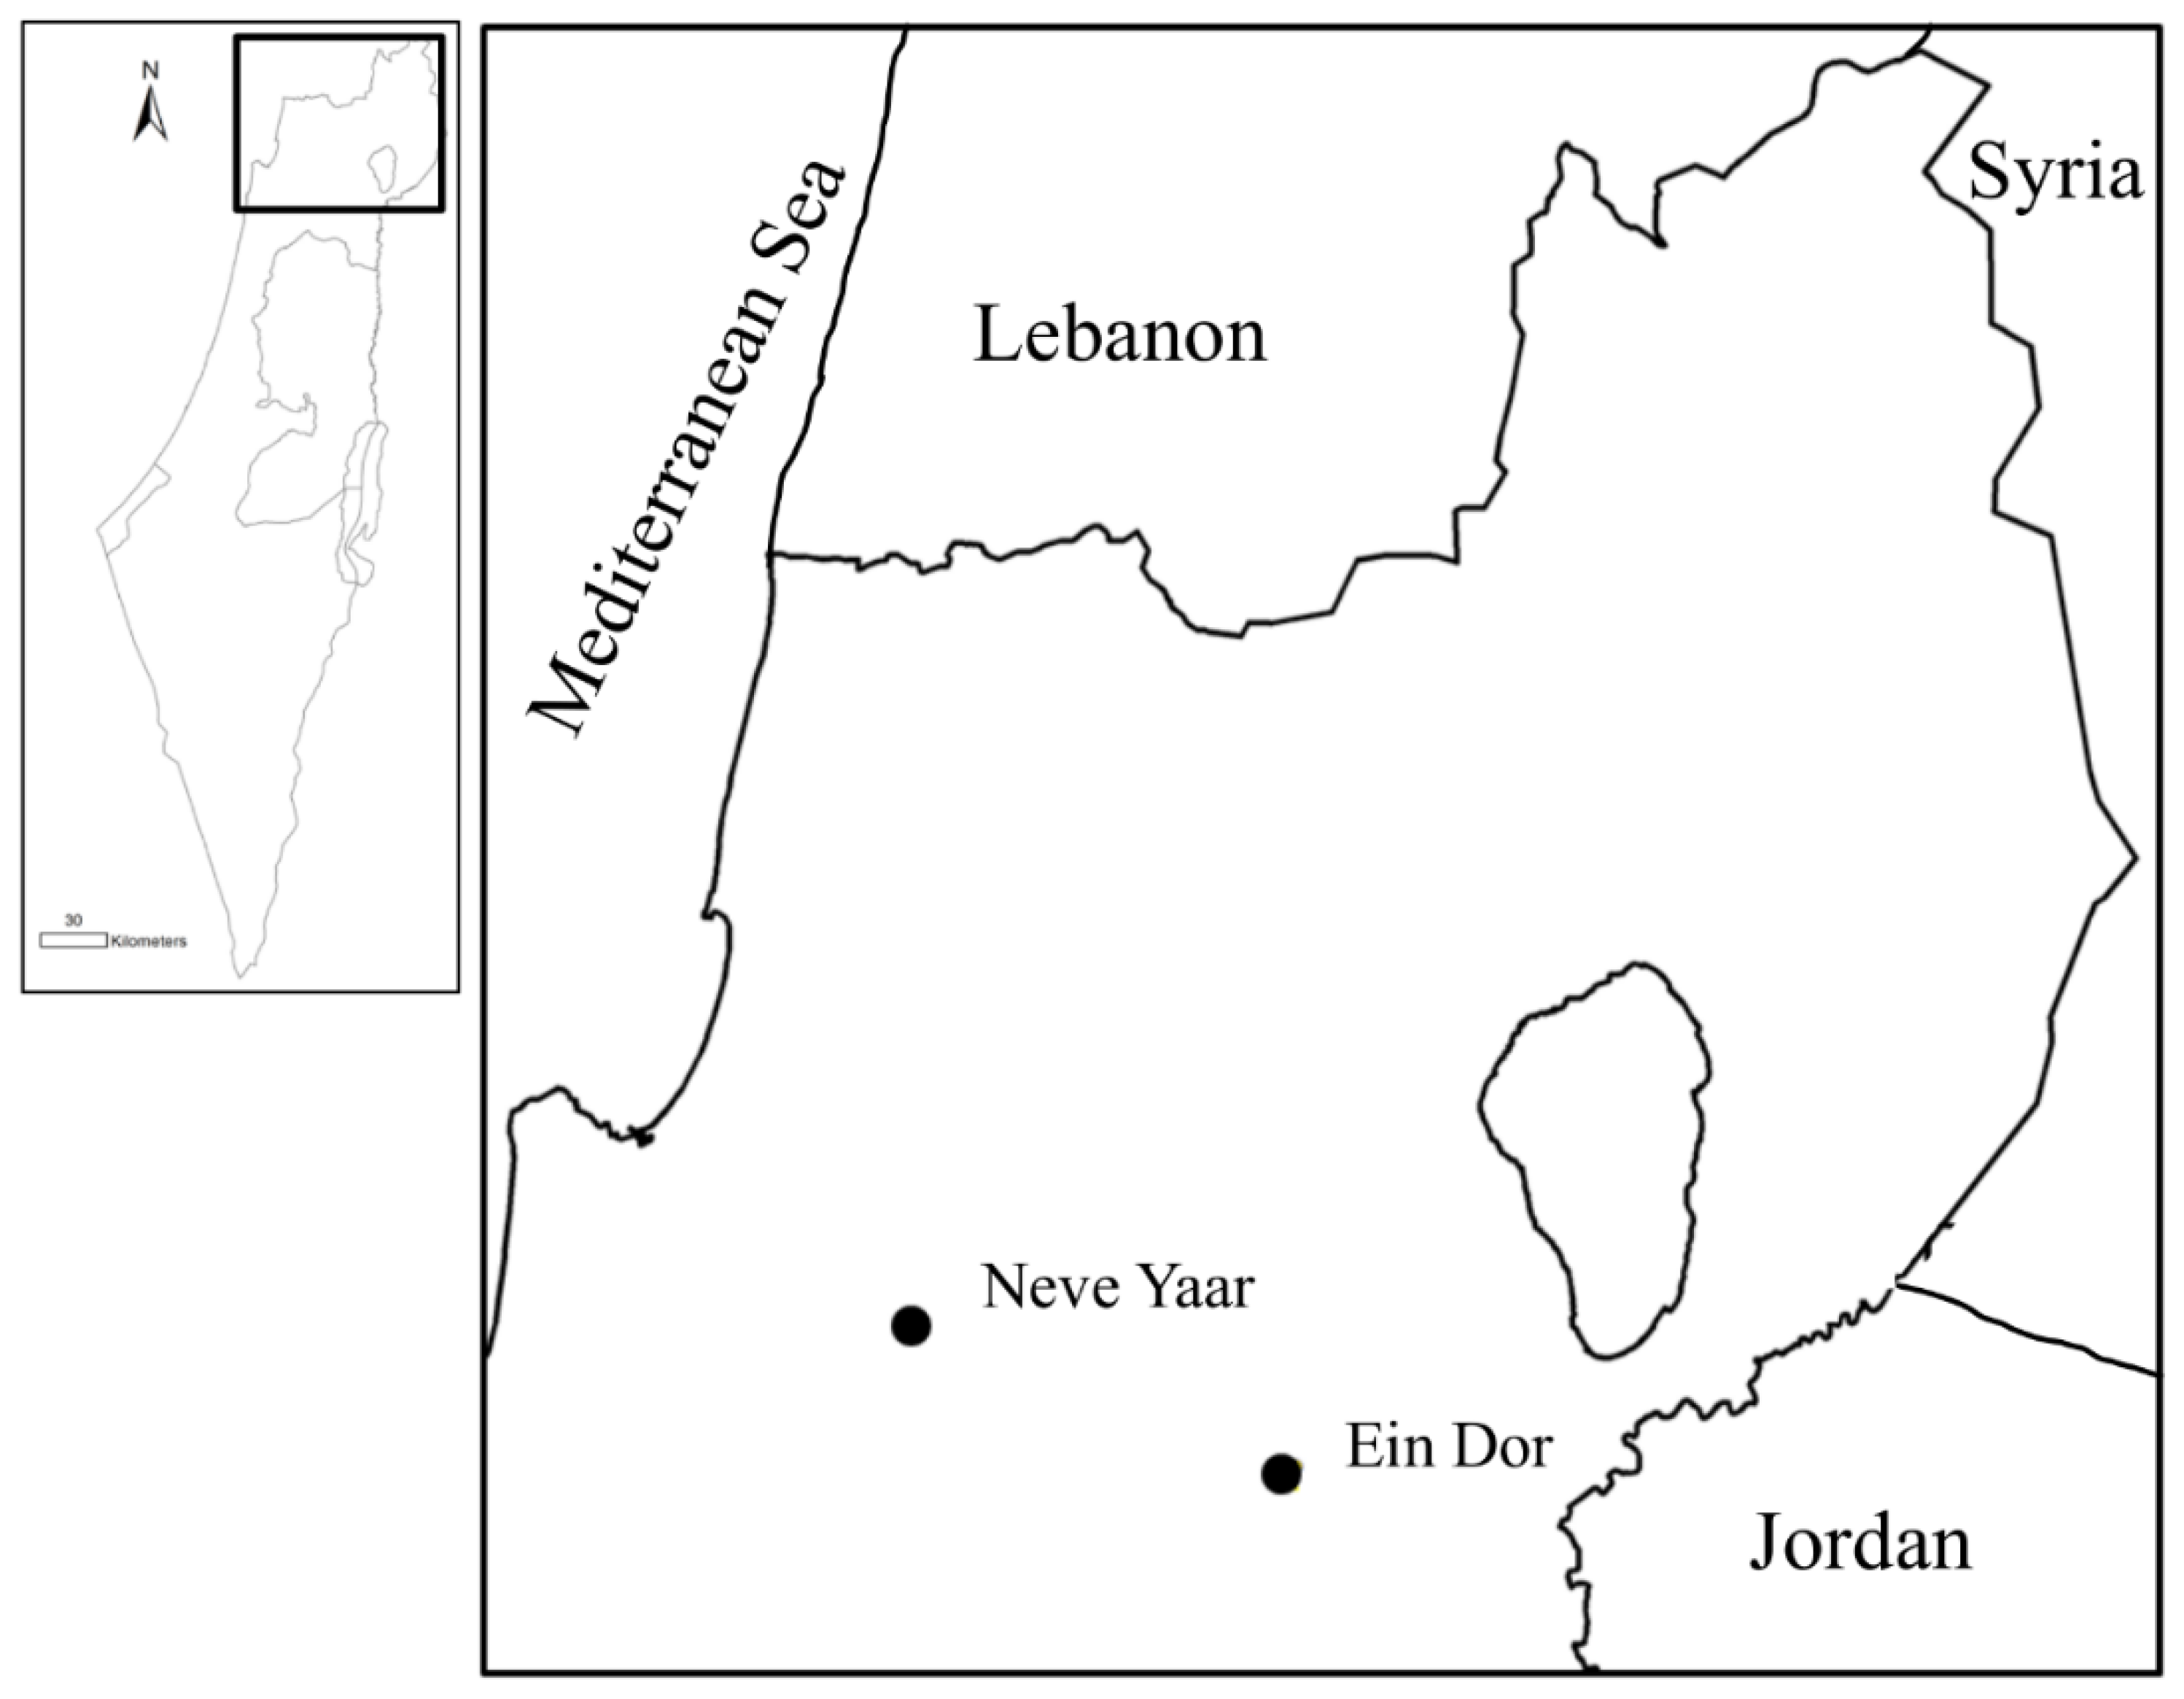
2.1. Study Sites and Data Collection

Data on E. elaterium spatial distribution was collected in four plots selected randomly within four commercial orchards in Northern Israel on two farms (Figure 1 and Table 1). The distance between the two plots in Ein Dor (EDW and EDN) was 850 m and 10 m in Newe Yaar (NYN and NYS). The soil type in both farms is Grumosol. The area surrounding the Ein Dor plots is mainly an agricultural landscape composed of orchards (mainly almonds) and field crops (rotation of wheat, tomatoes, cotton, maize, onion, legumes, and watermelon). The surrounding landscape around the Newe Yaar plots is orchards (mainly almonds and pomegranate; Figure 1). The use of herbicides in these commercial plots follow a standard grower’s protocol according to the manufacturer’s instructions, aiming, among others, to suppress the E. elaterium population. These treatments include the following chemicals: Diuron (800 gr ha−1), Oxyfluorfen (595 gr ha−1) and Glyphosate (1200 gr ae ha−1) during the winter, 2, 4 D (937.5 gr ha−1) and Glyphosate (1800 gr ae ha−1) during the spring and summer. Both farms are located in the same climatic region and are about 20 km apart. The climate in this region is eastern Mediterranean, characterized by relatively cool, wet winters and hot, dry summers. The area receives approximately 500 to 600 mm rainfall annually, mainly between November and March (Table 2). Each year, a single scout surveyed all four plots during May, a month after Ecballium elaterium emergence. In each plot the scout walked between all the rows and recorded the location of all plant individuals (from seedlings to mature plants) using a GPS (Trimble Juno 5, accuracy 1–4 m) and ArcPad (ESRI). The data was then transferred to ArcMap 10.5 software (ESRI, Redlands, CA, USA). It is worth noting that in May most of the E. elaterium plants are mature and are among the only weeds that have survived the chemical treatments and thus were easy to identify.

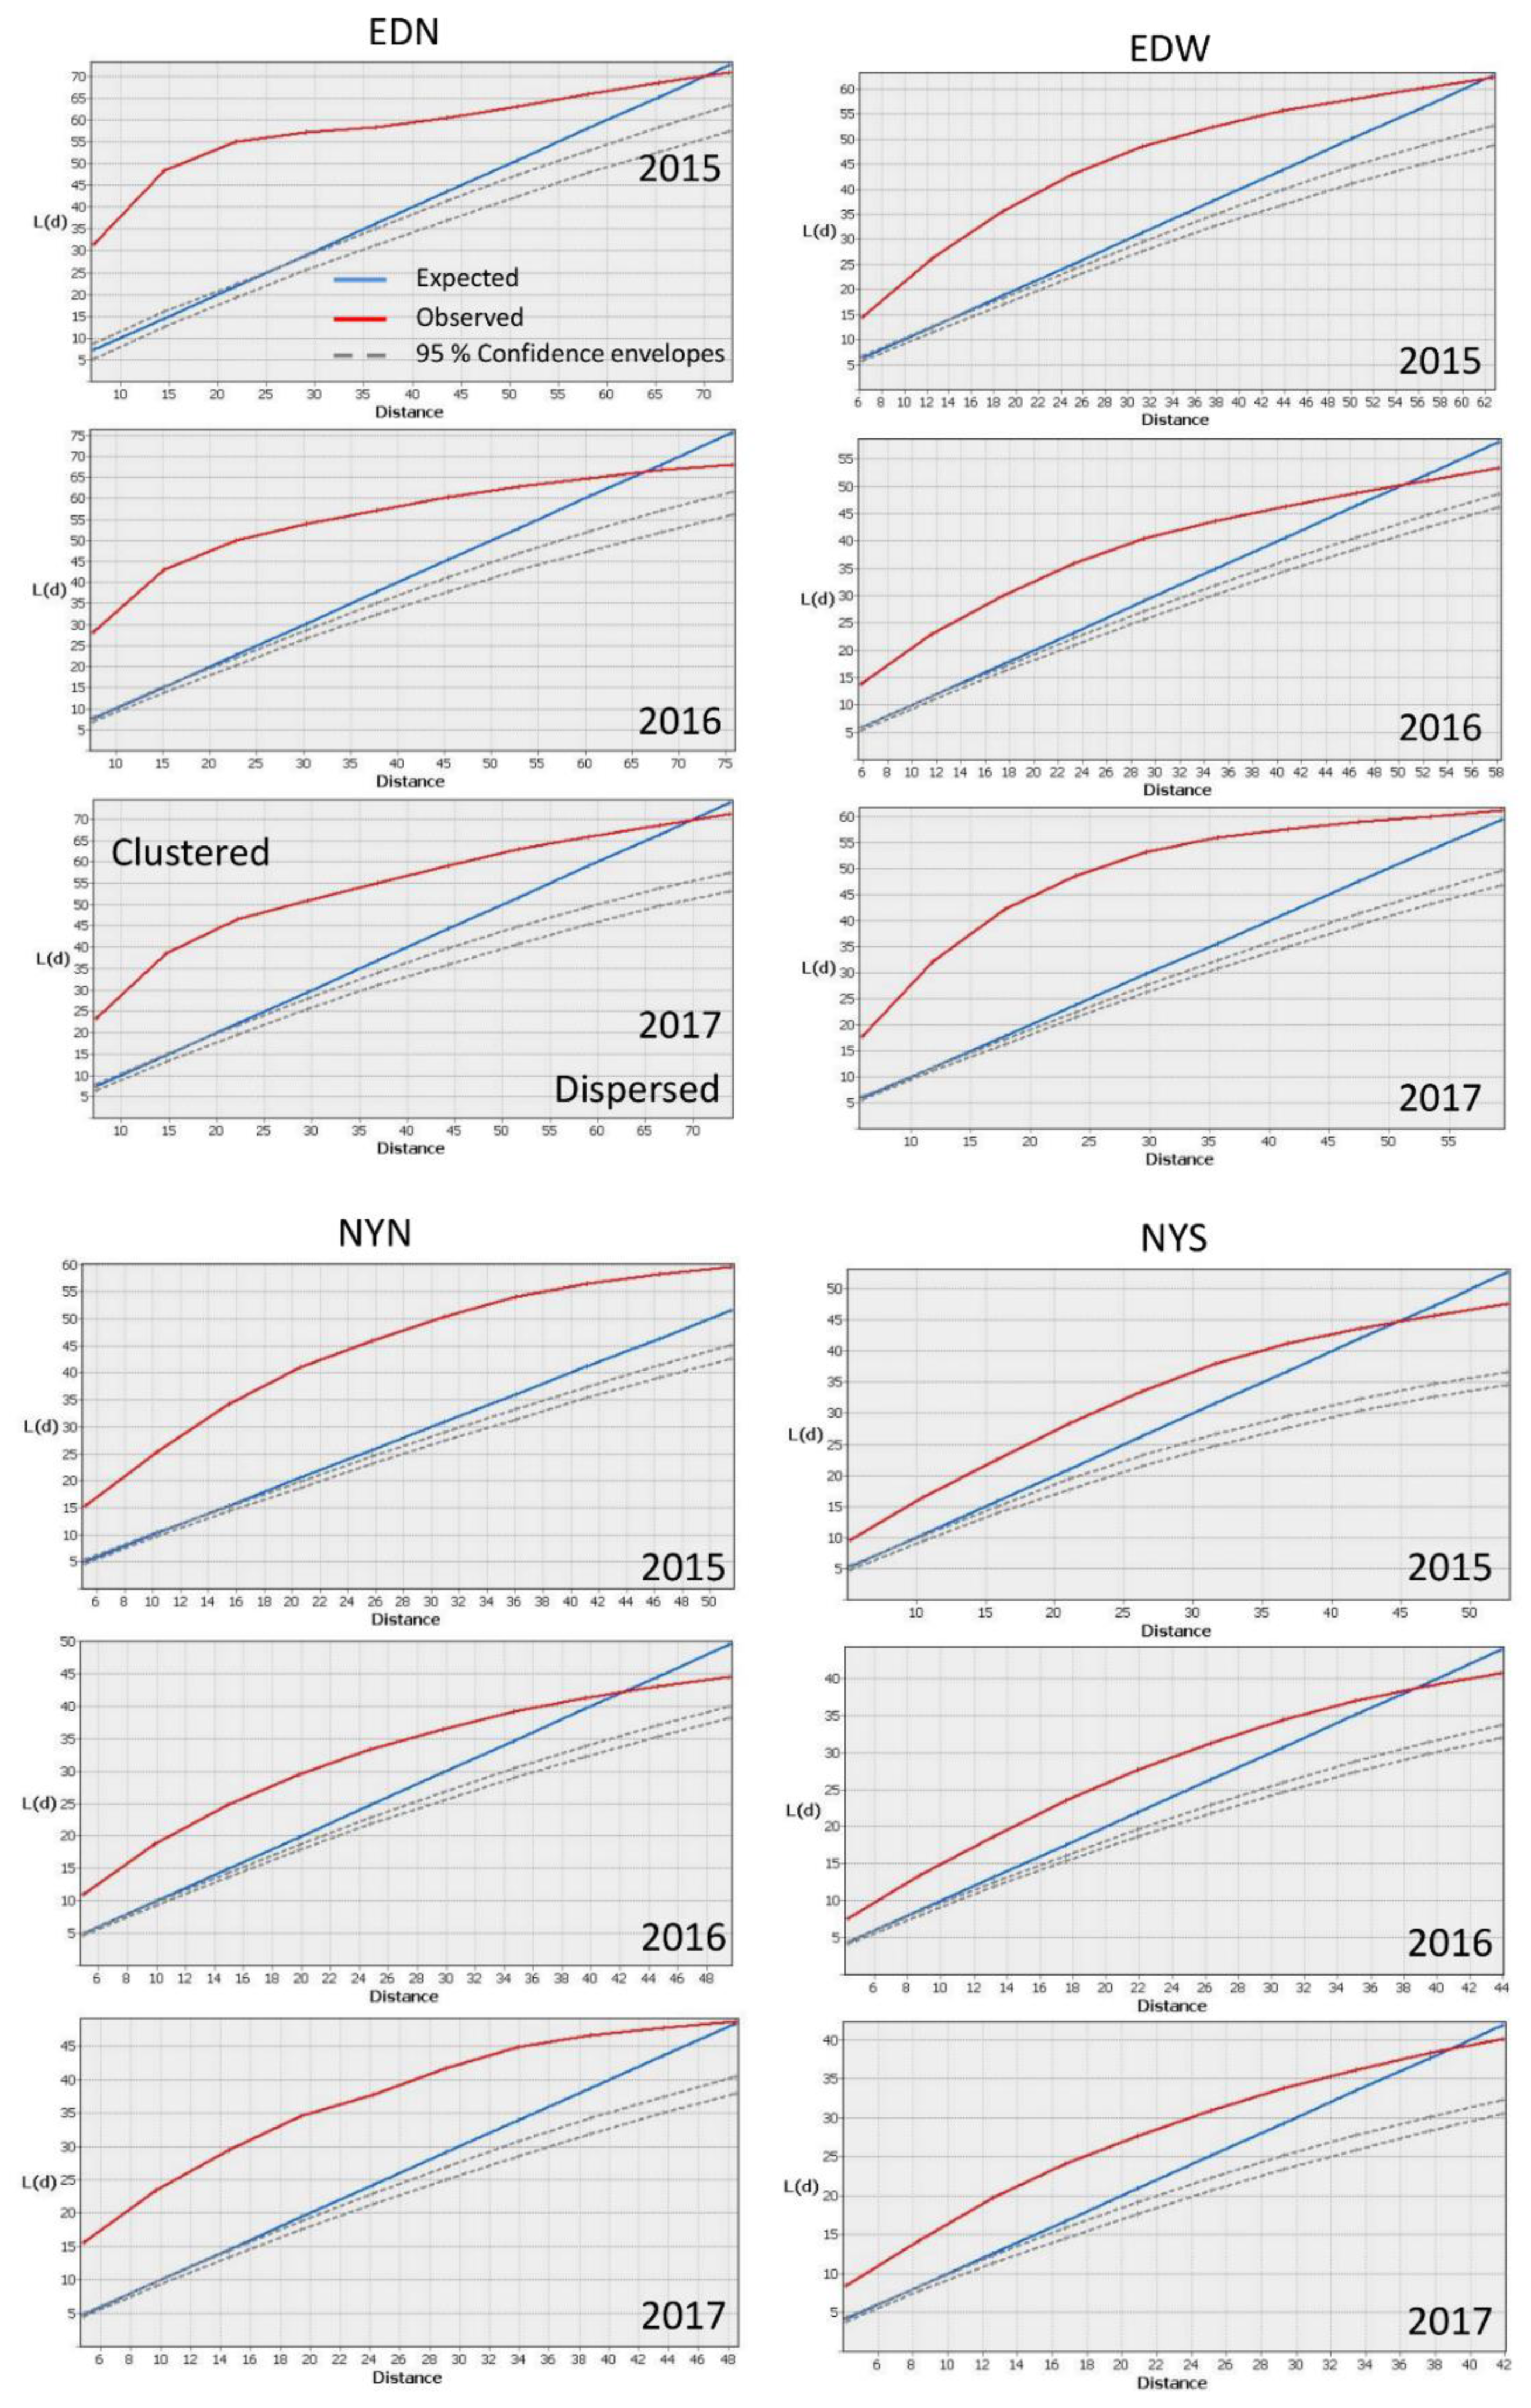
2.2. Spatially Analyzing Patterns

To analyze spatial patterns and explore spatial clustering of E. elaterium populations, nearest neighbor analysis was performed using spatial statistic tools in ArcGIS 10.5 (ESRI, Redlands, CA, USA). We used heatmap to visualize plant density using qGIS v. 2.12.0 software (QGIS Development Team. Open Source Geospatial Foundation.http://www.qgis.org/). As a first step, we tested the null hypothesis that E. elaterium plants were randomly distributed throughout our four plots using nearest neighbor analysis (ANN). Nearest neighbor analysis was performed using the average nearest neighbor function in ArcGIS to evaluate the degree of clustering. The analysis calculates the ratio of observed average nearest neighbor distance and expected average Euclidean distance based on random distribution. If the ratio differs significantly from zero, the null hypothesis is rejected and the spatial pattern is either dispersed (>1) or clustered (<1) [27]. Heatmaps are a visualization tool for dense point data. Heatmaps are used to easily identify clusters where there is a high concentration of certain features. The heatmap uses Kernel density estimation to create a density raster of an input point vector layer. The density is calculated based on the number of points in a location, with larger numbers of clustered points resulting in larger values. Some authors have demonstrated that Ripley’s K-function provides important information about the spatial organization of plants and animals [33,34]. We tested for spatial randomness of all mapped seedlings in each plot based on Ripley’s L(d) function [35]. L(d) is a local version of Ripley’s K-function in which L(d) is calculated for each event individually, providing information concerning local patterns, such as areas of aggregation vs. dispersed distribution in the same plot. Ninety-five percent confidence interval boundaries were calculated from 99 permutations, for a p-value < 0.01 confidence interval. Values above the confidence interval boundaries indicate statistically significant spatial aggregation. K-function analysis provides a measurement that enables us to test the extent of spatial clustering at defined distance intervals which helps in overcoming the drawbacks of the global nearest neighbor test [36].

3. Results

The total number of E. elaterium plants ranged between 155 and 768 (Table 3). The number of E. elaterium plants increased by more than 70% in the four plots from 2015 to 2016, and decreased in the consecutive year, in more than 10% in all the plots except in EDW. The observed mean distance between nearest neighbors ranged between 0.72 and 2.89 m (Table 3). ANN increased between 9% to 24% from 2016 and 2017. The nearest neighbor ratio did not exceed 0.63 for all plots and in the three years, suggesting that the E. elaterium plants in these plots were clustered (Table 3, Figure 2). In addition, the locations of the highly dense areas within the plots seem to retain their locations throughout the years (Figure 3). As illustrated in Figure 3C for the NYN plot, five highly dense areas are marked and their locations remain constant between 2015 to 2017. Outside this demarcated area, no new establishment of high dense areas was observed. Ripley’s L shows significant spatial aggregation in all the plots and years (Figure 4). Interestingly, the overall extent of the spatial clustering remained similar in size in the three years. The significance of the clustering disappears at distances of ~70 m for EDN, between 50 to 60 m for EDW, around 40 m for NYS in all three years and between 42 to 48 m for NYN in 2016 and 2017.

4. Discussion

Understanding the spatial temporal dynamics of weeds within fields may be beneficial in trying to better manage weeds [2]. If weeds are not randomly distributed, and tend to clump in patches, then the farmer can direct his actions to only the weedy areas in his field. Our study shows that the size and location of the E. elaterium infested areas remained similar over three years although seeds could be disperse to all parts of the plot [37]. This information can be used to direct pre-emergence herbicide treatments (e.g., Indaziflam), when no visual information is available in the field. In this aspect, the information regarding the spatial distribution of weeds from one year could be used as a basis for making spraying decisions the following year.
Perennial species generally have more aggregated distribution than annual species [25]. San Martin et al. [7] studied six species, four annual and two perennial. All six-species showed aggregated patterns. The perennial, Purple nutsedge, was aggregated significantly in all relevant fields. This robust aggregation pattern is in line with the results reported by Roham et al. [38]. In the specific case of purple nutsedge, propagates by tubers formed along underground rhizome, in the vicinity of the mother plant thus creating patchy distribution patterns. On the other hand, Andújar et al. [5,39] found that johnsongrass, also a perennial, showed an aggregated pattern distribution, but San Martin et al. [7] found that the distribution of johnsongrass did not aggregated in all the studied fields. This might be due to the dispersion by seeds that is a significant mode of dispersal for this species [40], paralleling rhizomes that are the primary method of johnsongrass reproduction and dispersal. Barroso et al. [41] showed that the dispersal of johnsongrass seeds, as well as the effect of combine harvesting, may have an effect to a less aggregated distribution of this species. In Ecballium elaterium, which distributes solely by seeds, the patchy distribution might be the results of the unique self-dispersal mechanism that does not relay on wind or water support, thus most of the seeds are established near the mother plant.
The size and location of the patches remained relatively constant between seasons. This could result from two major processes: habitat association and dispersal limitation [42,43,44,45]. Species–habitat association is a niche-based process that can give rise to spatial aggregations of species [44,46,47]. For example, soil properties were found to influence weeds growth, distribution, and density [18,48]. Such an association, however, is not the only ecological process that generates spatial aggregation. Dispersal limitation predicts that spatial aggregation can arise from the fact that propagules are not able to reach every suitable site in a landscape, regardless of underlying habitat conditions or species specificities [42,43]. Birger [37] found that the dispersal distance of E. elaterium can reach 10.2m and stated that this distance is probably a conservative estimation. Thus, we would expect that the spatial aggregation is not the result of dispersal limitation but rather based on niche limitation. Another implication to the temporal patch stability can be used in weed mapping. Generally, weeds with a stable distribution, similar to the distribution of E. elaterium that was discovered in this work, will require relatively low frequency mapping (e.g., every several years) whereas species whose spatial distribution changes from year to year will require new mapping in each growing season. This understanding is specifically important in orchards. Generating maps to direct the sprayer is done by intensive field sampling or by using remote sensing or UAVs (unmanned aerial vehicles) are used mainly in field crop systems [7,24,49]. However, the use of UAVs in orchards is limited and using them to map weeds is confined to areas between rows, and they cannot be accurately used to detect weeds under the canopy. Thus, in light of this constrain, the issue of temporal consistency in patch location between years might be even more important in orchards than in crop systems.
Another pattern we identified was the pronounce increase in plant density between 2015 and 2016 (more than 70% increase), which occurred in all the patches. The increase in plant density is even more striking when considering that 2015 was the rainiest year out of the three (annual rainfall of 645 and 545 mm in NY and ED, respectively) compared to 493 and 444 mm in NY and ED in 2016 and 516 and 421 mm in NY and ED in 2017. However, the decrease in rainfall might explain the difficulties for seeds to establish outside the patches, areas that might be less favorable in the first place. The differences in rain between the two farms might also explain the higher number of plants in NY compared to ED. This increase in weeds density has direct management implications as weed density alter the effectiveness of weed control and should be accounted for in implementing management [21,22]. Whether the increase in weeds density within patches is a general phenomenon or confined to certain species, is an important question that needs to be addressed in future studies.
Site-specific weed management aims to focus management actions and specifically herbicide application based on the spatial characteristics of weed distribution within a field. The insights we identified in this study—E. elaterium patchy distribution, patch temporal stability and weeds density increase within patches—Can be used to target management actions. By better understanding weed distribution, SSWM strives to adjusting herbicide application in order to reduce herbicide use [50]. This in turn has obvious cost saving advantages for the farmer and reduces the effects of weed control on the environment.

Author Contributions

Conceptualization, L.B., N.B. and H.E.; Formal analysis, L.B., N.B. and H.E.; Writing—original draft, L.B.; Writing—review & editing, H.E.

Funding

This research received no external funding

Acknowledgments

We would like to thank Noam Ariel for his help with the field sampling. The work is a contribution of the Agricultural Research Organization, Volcani Center, Israel, No. 601/19.

Conflicts of Interest

The authors declare no conflicts of interest.

References

  1. Steward, B.L.; Tian, L.F. Real-time machine vision weed-sensing. ASAE Pap. 1998. Paper number 983033. [Google Scholar]
  2. Lopez-Granados, F. Weed detection for site-specific weed management: Mapping and real-time approaches. Weed Res. 2011, 51, 1–11. [Google Scholar] [CrossRef]
  3. Dieleman, J.A.; Mortensen, D.A.; Cooper, E.M.; Sims, J.T.; Cunningham, S.D.; Huang, J.W.; Berti, W.R. Characterizing the spatial pattern of Abutilon theophrasti seedling patches. Weed Res. 1999, 39, 455–467. [Google Scholar] [CrossRef]
  4. Heijting, S.; Van Der Werf, W.; Stein, A.; Kropff, M.J. Are weed patches stable in location? Application of an explicitly two-dimensional methodology. Weed Res. 2007, 47, 381–395. [Google Scholar] [CrossRef]
  5. Andújar, D.; Barroso, J.; Fernández-Quintanilla, C.; Dorado, J. Spatial and temporal dynamics of Sorghum halepense patches in maize crops. Weed Res. 2012, 52, 411–420. [Google Scholar] [CrossRef]
  6. Calha, I.M.; Sousa, E.; González-Andújar, J.L. Infestation maps and spatial stability of main weed species in maize culture. Planta Daninha 2014, 32, 275–282. [Google Scholar] [CrossRef]
  7. San Martín, C.; Andújar, D.; Fernández-Quintanilla, C.; Dorado, J. Spatial distribution patterns of weed communities in corn fields of central Spain. Weed Sci. 2015, 63, 936–945. [Google Scholar] [CrossRef]
  8. Metcalfe, H.; Milne, A.E.; Webster, R.; Lark, R.M.; Murdoch, A.J.; Kanelo, L.; Storkey, J. Defining the habitat niche of Alopecurus myosuroides at the field scale. Weed Res. 2018, 58, 165–176. [Google Scholar] [CrossRef]
  9. Walter, A.M.; Christensen, S.; Simmelsgaard, S.E. Spatial correlation between weed species densities and soil properties. Weed Res. 2002, 42, 26–38. [Google Scholar] [CrossRef]
  10. Ballaré, C.L.; Scopel, A.L.; Ghersa, C.M.; Sánchez, R.A. The population ecology of Datura ferox in soybean crops. A simulation approach incorporating seed dispersal. Agric. Ecosyst. Environ. 1987, 19, 177–188. [Google Scholar] [CrossRef]
  11. Blank, L.; Carmel, Y. Woody vegetation patch types affect herbaceous species richness and composition in a Mediterranean ecosystem. Community Ecol. 2012, 13, 72–81. [Google Scholar] [CrossRef]
  12. Cardina, J.; Johnson, G.A.; Sparrow, D.H. The nature and consequence of weed spatial distribution. Weed Sci. 1997, 45, 364–373. [Google Scholar] [CrossRef]
  13. Thill, D.C.; Mallory-Smith, C.A. The nature and consequence of weed spread in cropping systems. Weed Sci. 1997, 45, 337–342. [Google Scholar] [CrossRef]
  14. Blanco-Moreno, J.M.; Chamorro, L.; Masalles, R.M.; Recasens, J.; Sans, F.X. Spatial distribution of Lolium rigidum seedlings following seed dispersal by combine harvesters. Weed Res. 2004, 44, 375–387. [Google Scholar] [CrossRef]
  15. Garibay, S.V.; Richner, W.; Stamp, P.; Nakamoto, T.; Yamagishi, J.; Abivardi, C.; Edwards, P.J. Extent and implications of weed spatial variability in arable crop fields. Plant Prod. Sci. 2001, 4, 259–269. [Google Scholar] [CrossRef]
  16. Gerhards, R.; Christensen, S. Real-time weed detection, decision making and patch spraying in maize, sugarbeet, winter wheat and winter barley. Weed Res. 2003, 43, 385–392. [Google Scholar] [CrossRef]
  17. Gerhards, R.; Wyse-Pester, D.Y.; Johnson, G.A. Characterizing spatial stability of weed populations using interpolated maps. Weed Sci. 1997, 45, 108–119. [Google Scholar] [CrossRef]
  18. Wilson, B.J.; Brain, P. Long-term stability of distribution of Alopecurus myosuroides Huds. within cereal fields. Weed Res. 1991, 31, 367–373. [Google Scholar] [CrossRef]
  19. Wyse-Pester, D.Y.; Mortensen, D.A.; Gotway, C.A. Statistical methods to quantify spatial stability of weed population. Proc. North Cent. Weed Control Conf. 1995, 50, 512. [Google Scholar]
  20. Johnson, G.A.; Mortensen, D.A.; Gotway, C.A. Spatial and temporal analysis of weed seedling populations using geostatistics. Weed Sci. 1996, 44, 704–710. [Google Scholar] [CrossRef]
  21. Myers, M.W.; Curran, W.S.; Vangessel, M.J.; Majek, B.A.; Scott, B.A.; Mortensen, D.A.; Calvin, D.D.; Karsten, H.D.; Roth, G.W. The effect of weed density and application timing on weed control and corn grain yield. Weed Technol. 2005, 19, 102–107. [Google Scholar] [CrossRef]
  22. Lati, R.N.; Filin, S.; Eizenberg, H. Effect of tuber density and trifloxysulfuron application timing on purple nutsedge (Cyperus rotundus) control. Weed Sci. 2012, 60, 494–500. [Google Scholar] [CrossRef]
  23. Cousens, R. A simple model relating yield loss to weed density. Ann. Appl. Biol. 1985, 107, 239–252. [Google Scholar] [CrossRef]
  24. Longchamps, L.; Panneton, B.; Reich, R.; Simard, M.-J.; Leroux, G.D. Spatial pattern of weeds based on multispecies infestation maps created by imagery. Weed Sci. 2016, 64, 474–485. [Google Scholar] [CrossRef]
  25. Colbach, N.; Forcella, F.; Johnson, G.A. Spatial and temporal stability of weed populations over five years. Weed Sci. 2000, 48, 366–377. [Google Scholar] [CrossRef]
  26. Mueller-Warrant, G.W.; Whittaker, G.W.; Young, W.C. GIS analysis of spatial clustering and temporal change in weeds of grass seed crops. Weed Sci. 2008, 56, 647–669. [Google Scholar] [CrossRef]
  27. Mitchel, A. The ESRI Guide to GIS Analysis, Volume 2: Spatial Measurements and Statistics; ESRI Press: Redlands, CA, USA, 2005. [Google Scholar]
  28. Dafni, A.; Benítez, G.C.; Blanché, C.; Rammón-Laca, L.; Petanidou, T.; Aytaç, B.; Horvat, M.; Lucchese, F.; Geva-Kleinberger, A. The etymological, ecological, historical and ethnobotanical roots of the vernacular names of Ecballium elaterium (L.) Rich. (Squirting cucumber). J. Ethnobiol. Tradit. Med. Photon 2013, 119, 515–537. [Google Scholar]
  29. Lewes, D. Observations on the internal pressure of the ripening fruit of Ecballium elaterium. Kew Bull. 1951, 6, 443–444. [Google Scholar] [CrossRef]
  30. Beckie, H.J.; Reboud, X. Selecting for weed resistance: Herbicide rotation and mixture. Weed Technol. 2009, 23, 363–370. [Google Scholar] [CrossRef]
  31. Powles, S.B.; Yu, Q. Evolution in action: Plants resistant to herbicides. Annu. Rev. Plant Biol. 2010, 61, 317–347. [Google Scholar] [CrossRef]
  32. CRDC Integrated weed management Hub. Section 3: Herbicide Resistance. Grains Research and Development Corporation, Australia Government; CRDC Integrated weed management Hub: Canberra, Australia, 2014. [Google Scholar]
  33. Sezen, U.U.; Chazdon, R.L.; Holsinger, K.E. Proximity is not a proxy for parentage in an animal-dispersed Neotropical canopy palm. Proc. R. Soc. B 2009, 276, 2037–2044. [Google Scholar] [CrossRef] [PubMed]
  34. Wehenkel, C.; Brazão-Protázio, J.M.; Carrillo-Parra, A.; Martínez-Guerrero, J.H.; Crecente-Campo, F. Spatial distribution patterns in the very rare and species-rich Picea chihuahuana tree community (Mexico). PLoS ONE 2015, 10, e0140442. [Google Scholar]
  35. Ripley, B.D. Spatial Statistics; John Wiley & Sons: Hoboken, NJ, USA, 2005; Volume 575. [Google Scholar]
  36. Lynch, H.J.; Moorcroft, P.R. A spatiotemporal Ripley’s K-function to analyze interactions between spruce budworm and fire in British Columbia, Canada. Can. J. For. Res. 2008, 38, 3112–3119. [Google Scholar] [CrossRef]
  37. Birger, N. Environmental Friendly Management of Ecballium elaterium in Almond Orchards Based on Understanding the Relationship Between Spatial Distribution, Weed Biology and Chemical Control. Master’s Thesis November 2018. [Google Scholar]
  38. Roham, R.; Pirdashti, H.; Yaghubi, M.; Nematzadeh, G. Spatial distribution of nutsedge (Cyperus spp. L.) seed bank in rice growth cycle using geostatistics. Crop Prot. 2014, 55, 133–141. [Google Scholar] [CrossRef]
  39. Andújar, D.; Ruiz, D.; Ribeiro, Á.; Fernández-Quintanilla, C.; Dorado, J. Spatial distribution patterns of johnsongrass (Sorghum halepense) in commercial corn fields in Spain. Weed Sci. 2011, 59, 82–89. [Google Scholar] [CrossRef]
  40. Mitskas, M.B.; Tsolis, C.E.; Eleftherohorinos, I.G.; Damalas, C.A. Interference between corn and johnsongrass (Sorghum halepense) from seed or rhizomes. Weed Sci. 2003, 51, 540–545. [Google Scholar] [CrossRef]
  41. Barroso, J.; Andújar, D.; San Martín, C.; Fernández-Quintanilla, C.; Dorado, J. Johnsongrass (Sorghum halepense) seed dispersal in corn crops under Mediterranean conditions. Weed Sci. 2012, 60, 34–41. [Google Scholar] [CrossRef]
  42. Hubbell, S.P.; Foster, R.B.; O’Brien, S.T.; Harms, K.E.; Condit, R.; Wechsler, B.; Wright, S.J.; De Lao, S.L. Light-gap disturbances, recruitment limitation, and tree diversity in a neotropical forest. Science 1999, 283, 554–557. [Google Scholar] [CrossRef] [Green Version]
  43. Plotkin, J.B.; Chave, J.; Ashton, P.S. Cluster analysis of spatial patterns in Malaysian tree species. Am. Nat. 2002, 160, 629–644. [Google Scholar] [CrossRef]
  44. Gunatilleke, C.V.S.; Gunatilleke, I.; Esufali, S.; Harms, K.E.; Ashton, P.M.S.; Burslem, D.; Ashton, P.S. Species–habitat associations in a Sri Lankan dipterocarp forest. J. Trop. Ecol. 2006, 22, 371–384. [Google Scholar] [CrossRef] [Green Version]
  45. Mendelsohn, O.; Dayan, T.; Aidlin-Harari, S.; Silberstein, M.; Orlov, V.; Blank, L. Mediterranean fruit fly subplot hot spots prediction by experts’ experience. J. Appl. Entomol. 2018, 142, 371–379. [Google Scholar] [CrossRef]
  46. Bar-Massada, A.; Belmaker, J. Non-stationarity in the co-occurrence patterns of species across environmental gradients. J. Ecol. 2017, 105, 391–399. [Google Scholar] [CrossRef]
  47. Wiegand, T.; Gunatilleke, S.; Gunatilleke, N. Species associations in a heterogeneous Sri Lankan dipterocarp forest. Am. Nat. 2007, 170, E77–E95. [Google Scholar] [CrossRef] [PubMed] [Green Version]
  48. Nordmeyer, H.; Dunker, M.; Stafford, J.V. Variable weed densities and soil properties in a weed mapping concept for patchy weed control. In Proceedings of the Precision agriculture ’99, Part 1; Sheffield Academic Press: Odense Denmark, 1999; pp. 453–462. [Google Scholar]
  49. Andújar, D.; Rueda-Ayala, V.; Dorado, J.; Gerhards, R.; Fernández-Quintanilla, C. Multivariate Analysis of the Agricultural Management Presence of Sorghum halepense (L.) Pers. Relationships in Maize Crops. Gesunde Pflanz. 2014, 66, 17–22. [Google Scholar]
  50. Timmermann, C.; Gerhards, R.; Kühbauch, W. The economic impact of site-specific weed control. Precis. Agric. 2003, 4, 249–260. [Google Scholar] [CrossRef]
Figure 1. The location of Newe Yaar (NYN and NYS) and In Dor (EDN and EDW) farms. Square on the left map indicates the study area. For plots name abbreviations, see Table 1.
Agronomy 09 00751 g001
Figure 2. Ecballium elaterium patch in the NYN almond orchard.
Agronomy 09 00751 g002
Figure 3. The locations of all plants found in each plot (green dots) and the heatmap showing absolute density of plants. All maps are overlayed an orthophoto of the plots. (A) EDW; (B) EDN; (C) NYN and (D) NYS. Frames in the NYN plot maps mark the locations of high density areas within the plot. For plots name abbreviations see Table 1.
Agronomy 09 00751 g003aAgronomy 09 00751 g003b
Figure 4. Ripley’s K test for spatial randomness of plants in the three years and four plots. The observed value of the test statistic L(d) at a given distance is marked by red lines, while expected distance is presented with a blue line. Observed L(d) greater than expected (L(d) > d) indicates clustering. The boundaries of the confidence interval on the null hypothesis (complete spatial randomness) are denoted by thin dashed lines.
Agronomy 09 00751 g004
Table 1. Fields location and sampled fields size in the commercial orchards studied.
Plot NameAbbreviationsPlantation YearSurvey Area (m2)
Ein Dor WestEDW200624,800
Ein Dor NorthEDN200732,800
Newe Yaar NorthNYN200718,900
Newe Yaar SouthNYS20076600
Table 2. Average temperature and precipitation in the two studies farms during the three years of the study.
201520162017
Oct-Dec (2014)Jan–MarApr–JunOct–Dec (2015)Jan–MarApr–JunOct–Dec (2016)Jan–MarApr–Jun
Newe Yaar
Average Temperature (°C)18.2 ± 5.213.4 ± 521.5 ± 5.918.4 ± 6.214.3 ± 5.223.0 ± 5.917.8 ± 6.512.4 ± 4.722.0 ± 5.7
Precipitation (mm)186.8379.978.1141.2334.617312.1179.623.9
Ein Dor
Average Temperature (°C)18.1 ± 5.413.3 ± 5.221.9 ± 6.318.5 ± 6.314.2 ± 5.223.0 ± 5.918.0 ± 6.912.4 ± 4.822.9 ± 6.1
Precipitation (mm)178.6297.768.5122308.813.3242.1158.820.5
Table 3. Comparing the number of plants, the average distance between individual plants and the average nearest neighbor ratio.
Plot NameNumber of PlantsAverage Distance between Plants (M)ANN Ratio
201520162017201520162017201520162017
EDW2975055262.891.091.370.630.330.41
EDN1552941912.421.361.870.290.270.33
NYN4437684671.470.721.040.40.340.37
NYS2805154521.620.871.220.560.420.49

