Comparison of Different Multivariate Statistical Methods for Screening the Drought Tolerant Genotypes of Pearl Millet (Pennisetum americanum L.) and Sorghum (Sorghum bicolor L.)

Abstract
1. Introduction
2. Materials and Methods
2.1. Treatments
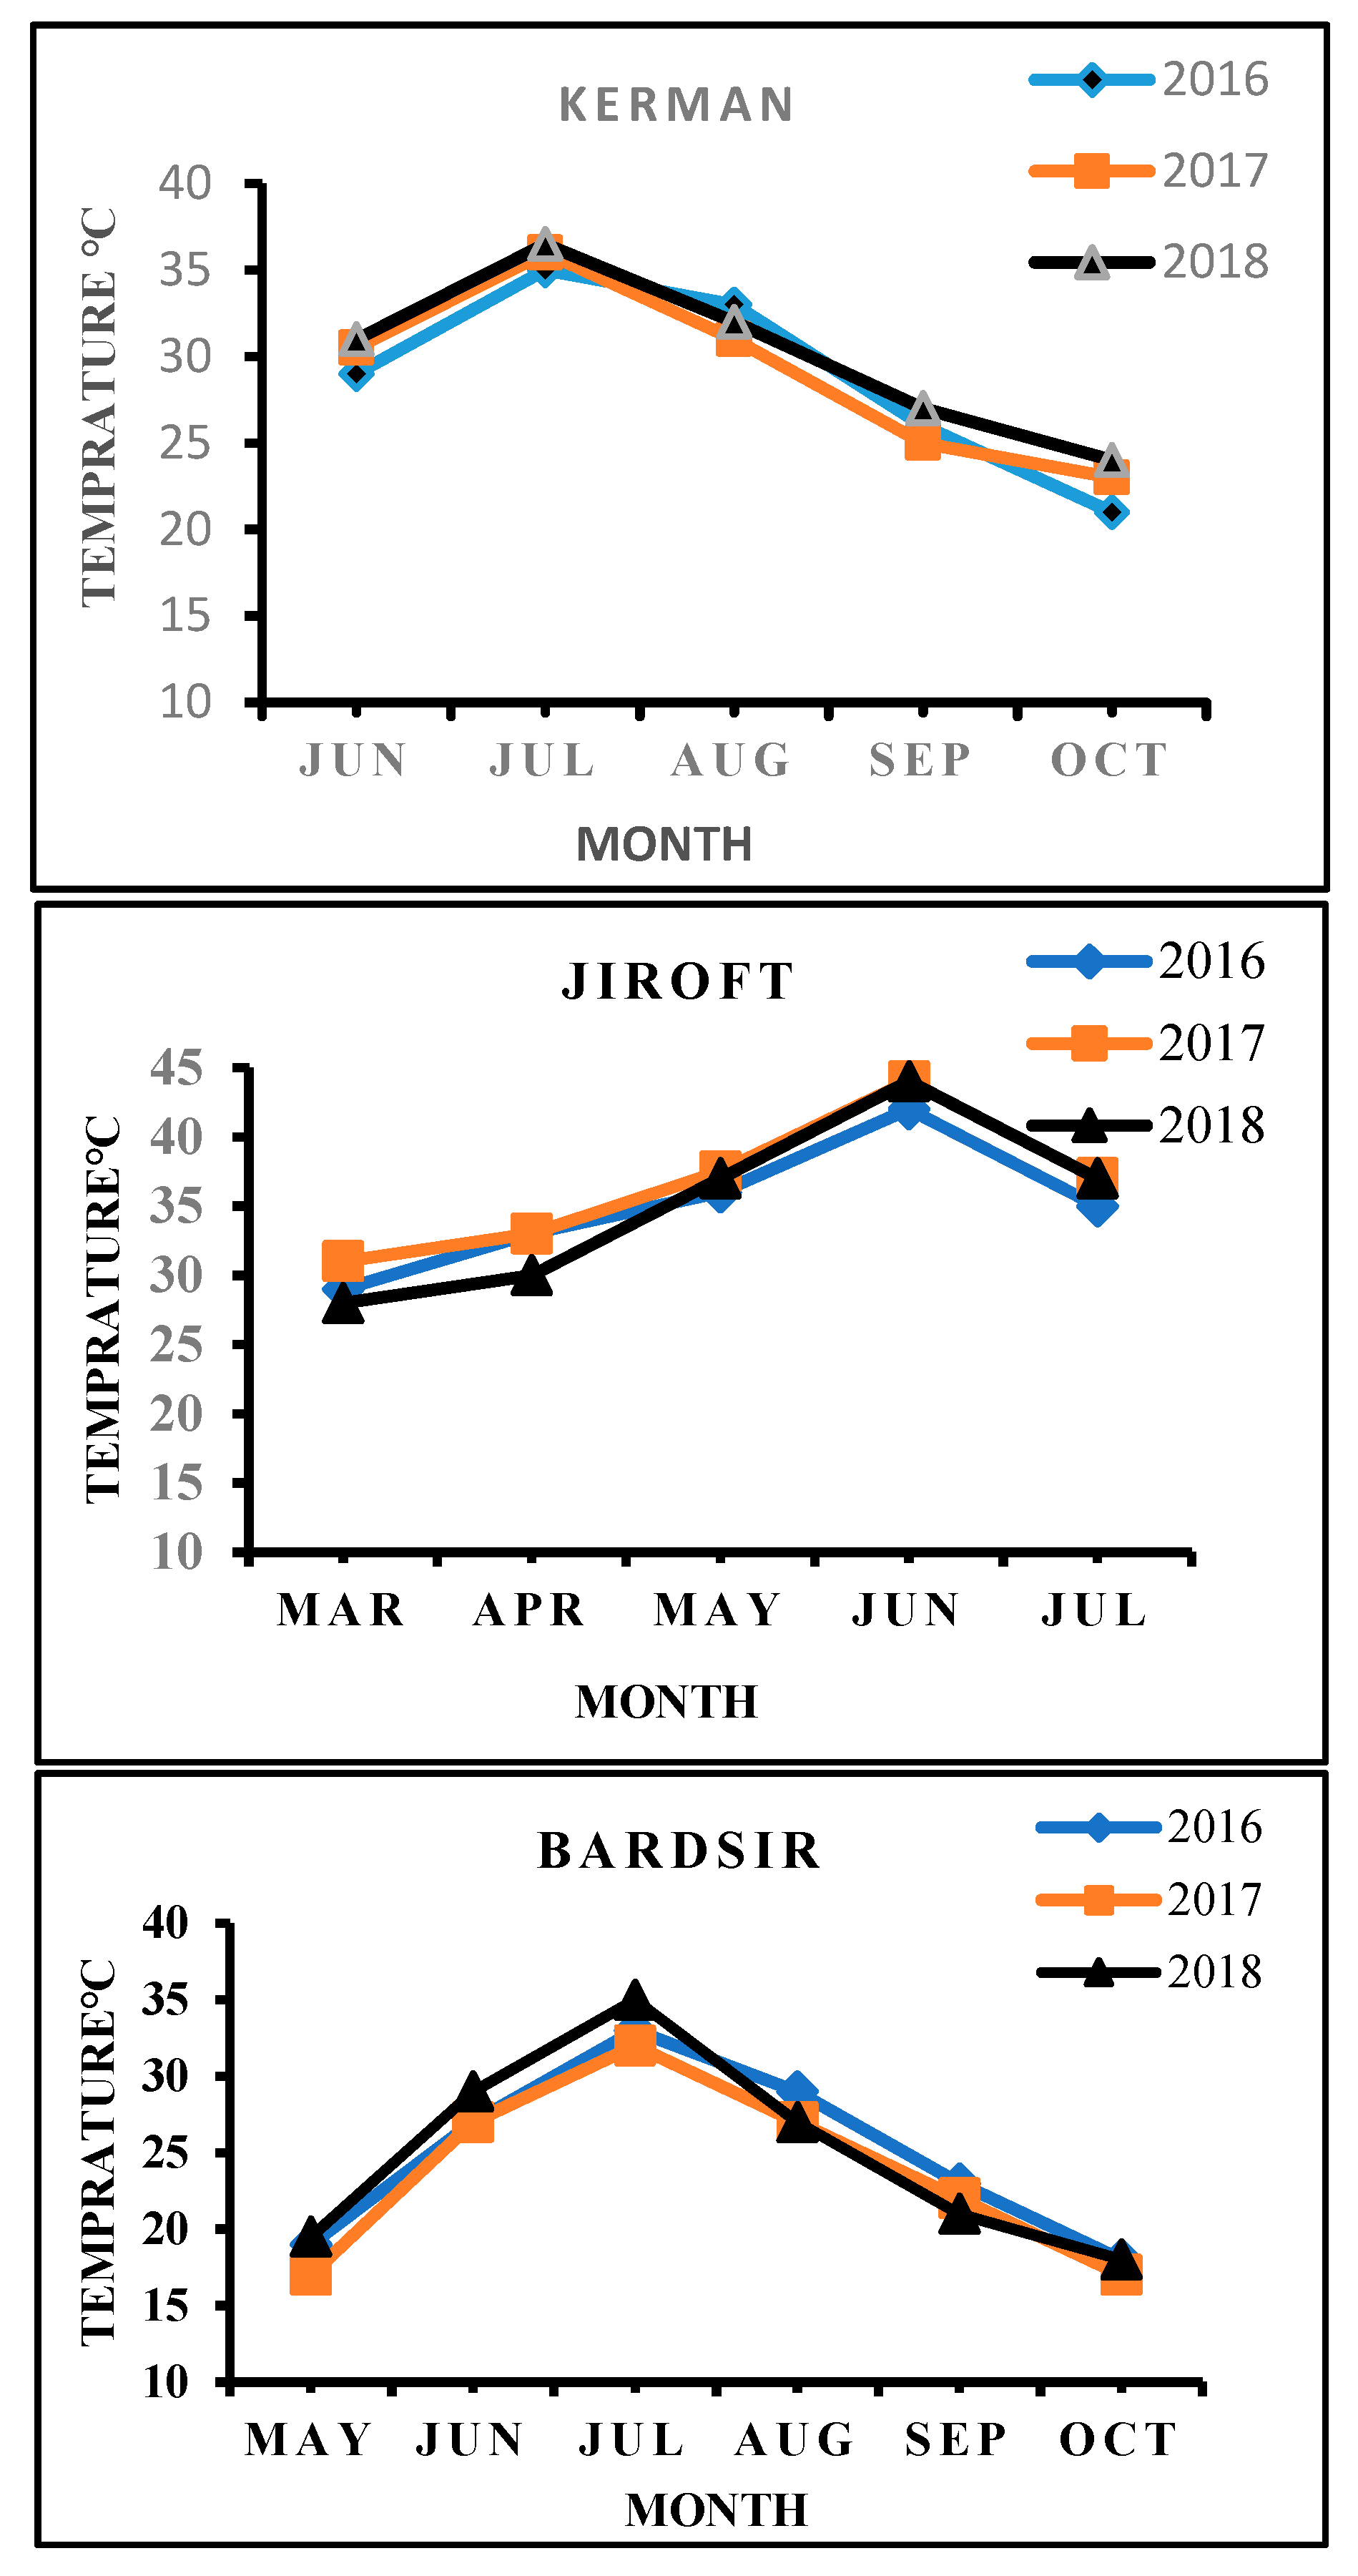
2.2. The Characteristics of Experimental Farms
2.3. The Stages of Implementation
2.4. Calculation of Drought Tolerance/Susceptibility Indices
2.5. Statistical Analysis
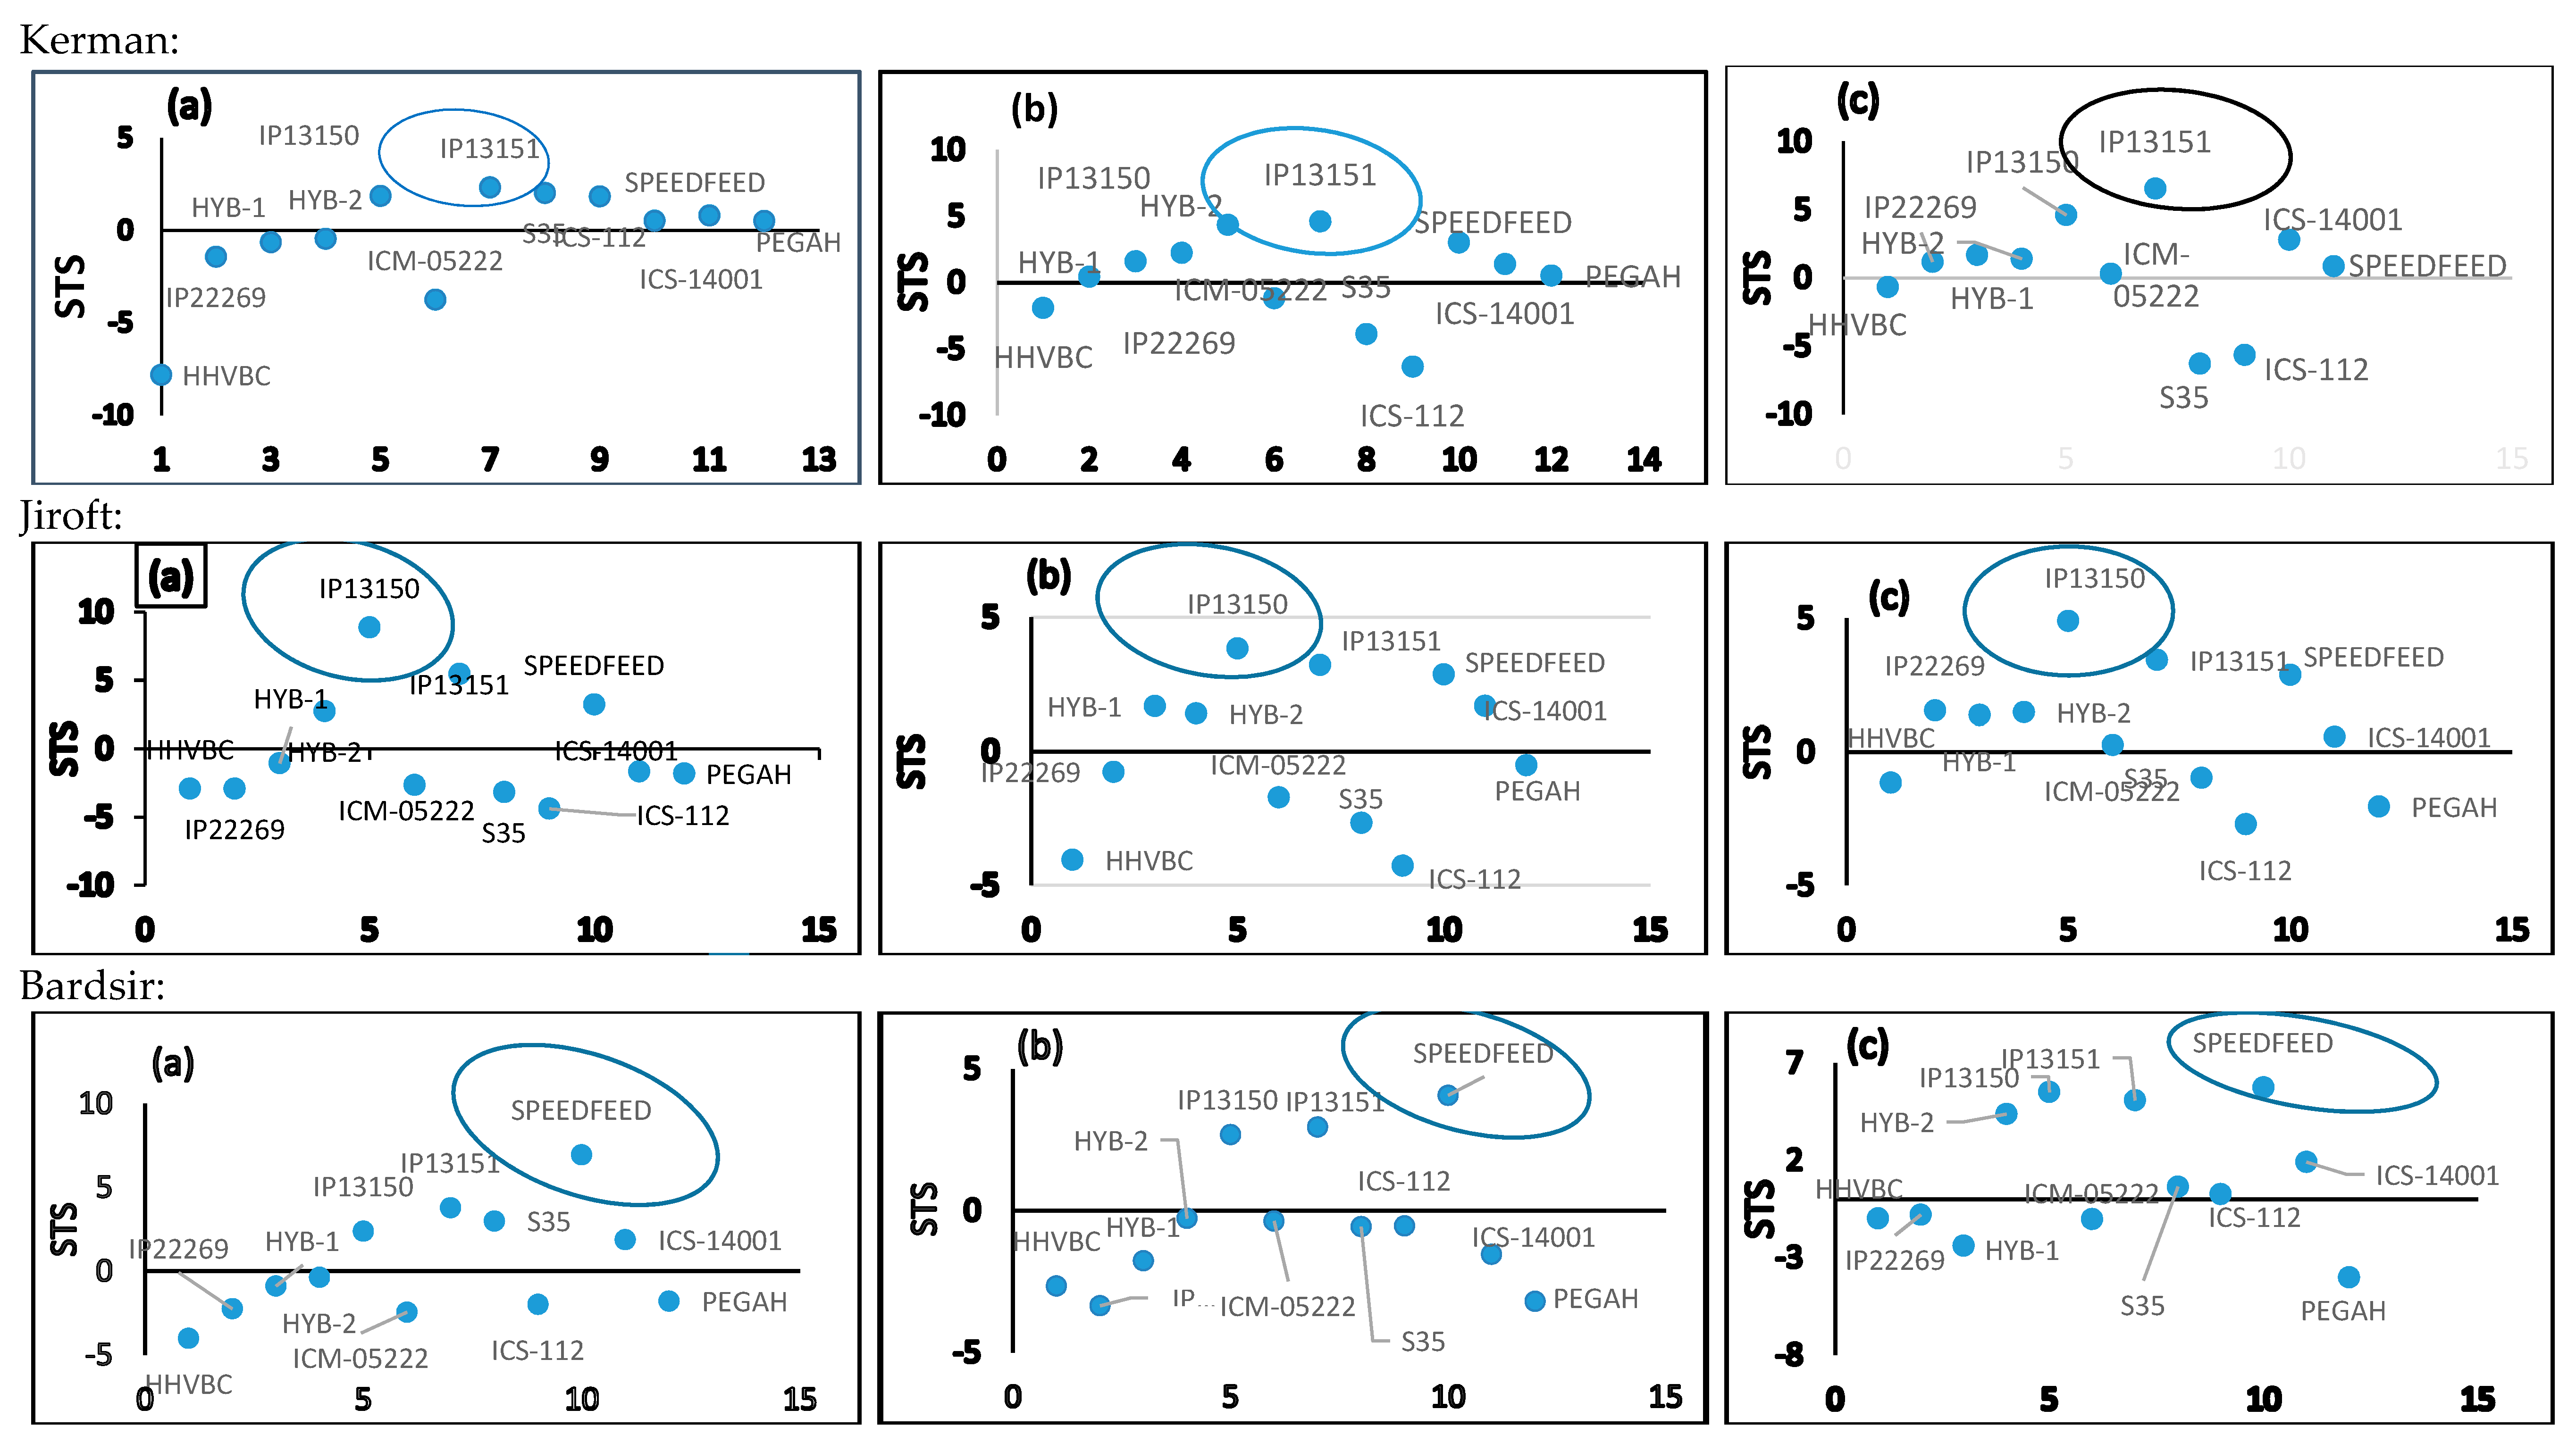
3. Results
4. Discussion
5. Conclusions
Author Contributions
Acknowledgments
Conflicts of Interest
References
- Blum, A. Drought resistance–is it really a complex trait? Funct. Plant Biol. 2011, 38, 753–757. [Google Scholar] [CrossRef]
- Yadav, O.; Bhatnagar, S. Evaluation of indices for identification of pearl millet cultivars adapted to stress and non-stress conditions. Field Crop. Res. 2001, 70, 201–208. [Google Scholar] [CrossRef]
- Zegada-Lizarazu, W.; Iijima, M. Deep root water uptake ability and water use efficiency of pearl millet in comparison to other millet species. Plant Prod. Sci. 2005, 8, 454–460. [Google Scholar] [CrossRef]
- Diouf, O.; Brou, Y. Response of pearl millet to nitrogen as affected by water deficit. Agronomie 2004, 24, 77–84. [Google Scholar] [CrossRef][Green Version]
- Gholamhoseini, M.; Aghaalikhani, M.; Malakouti, M. Effect of natural zeolite and nitrogen rates on canola forage quality and quantity. J. Sci. Technol. Agric. Nat. Resour. 2008, 12, 537–548. [Google Scholar]
- Bidinger, F.; Mahalakshmi, V.; Rao, G.D.P. Assessment of drought resistance in pearl millet (Pennisetum americanum (L.) Leeke). II. Estimation of genotype response to stress. Aust. J. Agric. Res. 1987, 38, 49–59. [Google Scholar] [CrossRef]
- Mahalakshmi, V.; Bidinger, F. Water deficit during panicle development in pearl millet: Yield compensation by tillers. J. Agric. Sci. 1986, 106, 113–119. [Google Scholar] [CrossRef]
- Bruck, H.; Payne, V.; Sattelmacher, B. Effects of phosphorus and water supply on yield, transpirational water-use efficiency, and carbon isotope discrimination of pearl millet. Crop Sci. 2000, 40, 120–125. [Google Scholar] [CrossRef]
- Rosielle, A.; Hamblin, J. Theoretical aspects of selection for yield in stress and non-stress environment 1. Crop Sci. 1981, 21, 943–946. [Google Scholar] [CrossRef]
- Fernandez, G.C. Effective selection criteria for assessing plant stress tolerance. In Proceedings of the International Symposium on Adaptation of Vegetables and other Food Crops in Temperature and Water Stress, Shanhua, Taiwan, 13–16 August 1992. [Google Scholar]
- Fischer, R.; Maurer, R. Drought resistance in spring wheat cultivars. I. Grain yield responses. Aust. J. Agric. Res. 1978, 29, 897–912. [Google Scholar] [CrossRef]
- Bouslama, M.; Schapaugh, W.T. Evaluation of three screening techniques for heat and drought tolerance. Crop Sci. 1984, 24, 933–937. [Google Scholar] [CrossRef]
- Gavuzzi, P.; Rizza, F.; Palumbo, M.; Campanile, R.G.; Ricciardi, G.L.; Borghi, B. Evaluation of field and laboratory predictors of drought and heat tolerance in winter cereals. Can. J. Plant Sci. 1997, 77, 523–531. [Google Scholar] [CrossRef]
- Ouk, M.; Basnayake, J.; Tsubo, M.; Fukai, S.; Fischer, K.S.; Cooper, M.; Nesbitt, H. Use of drought response index for identification of drought tolerant genotypes in rainfed lowland rice. Field Crop. Res. 2006, 99, 48–58. [Google Scholar] [CrossRef]
- Hao, Z.F.; Li, X.H.; Su, Z.J.; Xie, C.X.; Li, M.S.; Liang, X.L.; Weng, J.F.; Zhang, D.G.; Li, L.; Zhang, S.H. A proposed selection criterion for drought resistance across multiple environments in maize. Breed. Sci. 2011, 61, 101–108. [Google Scholar] [CrossRef]
- Gholamin, R.; Zaeifizadeh, M.; Khayatnzhad, M. Factoranalysis for performance and other characteristics in durum wheat under drought stress and without stress. Middle East J. Sci. Res. 2010, 6, 599–603. [Google Scholar]
- Abdolshahi, R.; Safarian, A.; Nazari, M.; Pourseyedi, S.; Mohamadi-Nejad, G. Screening drought-tolerant genotypes in bread wheat (Triticum aestivum L.) using different multivariate methods. Arch. Agron. Soil Sci. 2013, 59, 685–704. [Google Scholar] [CrossRef]
- Dadbakhsh, A.; Yazdan-Sepas, A. Evaluation of drought tolerance indices for screening bread wheat genotypes in end-season drought stress conditions. Adv. Environ. Biol. 2011, 5, 1040–1045. [Google Scholar]
- Mardeh, A.S.S.; Ahmadi, A.; Poustini, K.; Mohammadi, V. Evaluation of drought resistance indices under various environmental conditions. Field Crop. Res. 2006, 98, 222–229. [Google Scholar] [CrossRef]
- Lker, E.; Tatar, Ö.; Tonk, F.A.; Tosun, M. Determination of tolerance level of some wheat genotypes to post-anthesis drought. Turk. J. Field Crop. 2011, 16, 59–63. [Google Scholar]
- Jafari, A.; Paknejad, F.; Jami, A.-A. Evaluation of selection indices for drought tolerance of corn (Zea mays L.) hybrids. Int. J. Plant Prod. 2012, 3, 33–38. [Google Scholar]


| Kerman | Jiroft | Bardsir | |
|---|---|---|---|
| Above sea level | 1756 m | 680 m | 2047 m |
| Longitude | 30°29′ | 28°40′ | 29°55′ |
| Latitude | 57°6′ | 57°44′ | 56°34′ |
| Average rainfall in 10 year | 122.7 mm | 180 mm | 92.5 mm |
| Soil type | L-S | L | L-S |
| Growth season | 20 June–31 October | 20 March–2 August | 30 April–11 September |
| N% | P (mg kg−1) | K (mg kg−1) | pH | EC (dsm−1) | OC% | Fe (mg kg−1) | Zn (mg kg−1) | |
|---|---|---|---|---|---|---|---|---|
| Kerman | 0.4 | 9 | 470 | 7.5 | 4.2 | 1.2 | 8 | 1 |
| Jiroft | 0.5 | 11 | 440 | 7.5 | 4.6 | 1.1 | 6.2 | 1.2 |
| Bardsir | 0.3 | 8.8 | 460 | 7.5 | 4.1 | 1.4 | 6.8 | 0.8 |
| Plant | Cut | Number of Irrigation | Total Amount of Applied Water (m3 ha−1) | |
|---|---|---|---|---|
| Kerman | ||||
| I100 | ||||
| Pearl millet | 2 | 15.28 | 6744.51 | |
| Sorghum | 2 | 15.28 | 7495.91 | |
| I50 | ||||
| Pearl millet | 2 | 15.28 | 3372.26 | |
| Sorghum | 2 | 15.28 | 3747.95 | |
| Jiroft | ||||
| I100 | ||||
| Pearl millet | 3 | 27.75 | 7726.8 | |
| Sorghum | 3 | 27.75 | 8731.28 | |
| I50 | ||||
| Pearl millet | 3 | 27.75 | 3863.4 | |
| Sorghum | 3 | 27.75 | 4365.64 | |
| Bardsir | ||||
| I100 | ||||
| Pearl millet | 2 | 15.28 | 6455.44 | |
| Sorghum | 2 | 15.28 | 7423.75 | |
| I50 | ||||
| Pearl millet | 2 | 15.28 | 3227.72 | |
| Sorghum | 2 | 15.28 | 3711.72 |
| 2016 | Yp | Ys | SSI | MP | TOL | STI | GMP | YI | YSI | β |
|---|---|---|---|---|---|---|---|---|---|---|
| Yp | 1 | |||||||||
| Ys | 0.76 ** | 1 | ||||||||
| SSI | 0.71 * | 0.08 | 1 | |||||||
| MP | 0.98 ** | 0.84 ** | 0.59 | 1 | ||||||
| TOL | 0.97 ** | −0.58 ** | 0.85 ** | 0.92 ** | 1 | |||||
| STI | 0.96 ** | 0.89 ** | 0.51 | 0.99 ** | 0.88 ** | 1 | ||||
| GMP | 0.96 ** | 0.90 ** | 0.50 | 0.99 ** | 0.87 ** | 0.99 ** | 1 | |||
| YI | 0.76 ** | 0.99 ** | 0.09 | 0.85 ** | 0.59 * | 0.89 ** | 0.90 ** | 1 | ||
| YSI | −0.68 | −0.05 | −0.99 ** | −0.57 | −0.83 ** | −0.48 | −0.47 | −0.06 | 1 | |
| β | −0.69 ** | 0.08 | −0.97 ** | −0.58 ** | −0.82 ** | −0.50 * | 0.48 | 0.09 | −0.97 * | 1 |
| 2017 | Yp | Ys | SSI | MP | TOL | STI | GMP | YI | YSI | β |
| Yp | 1 | |||||||||
| Ys | 0.98 ** | 1 | ||||||||
| SSI | −0.11 | −0.26 | 1 | |||||||
| MP | 0.99 ** | 0.99 ** | −0.84 ** | 1 | ||||||
| TOL | 0.99 ** | 0.39 | −0.82 ** | 0.99 ** | 1 | |||||
| STI | 0.99 ** | 0.99 ** | −0.85 ** | 0.99 ** | 0.99 ** | 1 | ||||
| GMP | 0.99 ** | 0.99 ** | −0.85 ** | 0.99 ** | 0.99 ** | 0.99 ** | 1 | |||
| YI | 0.98 ** | 0.99 ** | −0.86 ** | 0.99 ** | 0.99 ** | 0.99 ** | 0.99 ** | 1 | ||
| YSI | 0.23 ** | 0.38 ** | −0.78 ** | 0.80 ** | 0.78 ** | 0.81 ** | 0.80 ** | 0.81 ** | 1 | |
| β | 0.12 | −0.03 | 0.48 | −0.06 | −0.01 | −0.09 | −0.07 | −0.1 | −0.41 | 1 |
| 2018 | Yp | Ys | SSI | MP | TOL | STI | GMP | YI | YSI | β |
| Yp | 1 | |||||||||
| Ys | 0.99 ** | 1 | ||||||||
| SSI | −0.22 ** | −0.29 ** | 1 | |||||||
| MP | 0.99 ** | 0.99 ** | −0.23 ** | 1 | ||||||
| TOL | 0.99 ** | -0.43 * | −0.18 | 0.99 ** | 1 | |||||
| STI | 0.99 ** | 0.99 ** | −0.25 | 0.99 ** | 0.99 ** | 1 | ||||
| GMP | 0.99 ** | 0.99 ** | −0.25 | 0.99 ** | 0.99 ** | 0.99 ** | 1 | |||
| YI | 0.99 ** | 0.99 ** | −0.29 | 0.99 ** | 0.99 ** | 0.99 ** | 0.99 ** | 1 | ||
| YSI | −0.08 ** | −0.01 ** | −0.76 ** | −0.06 | 0.11 | 0.06 | −0.04 | −0.009 | 1 | |
| β | 0.16 | 0.08 | −0.87 ** | 0.14 | 0.20 | 0.12 | 0.12 | 0.08 | −0.8 ** | 1 |
| 2016 | Yp | Ys | SSI | MP | TOL | STI | GMP | YI | YSI | β |
|---|---|---|---|---|---|---|---|---|---|---|
| Yp | 1 | |||||||||
| Ys | 0.98 ** | 1 | ||||||||
| SSI | 0.008 | −0.18 | 1 | |||||||
| MP | 0.99 ** | 0.98 ** | −0.03 | 1 | ||||||
| TOL | 0.99 ** | 0.35 | 0.10 | 0.99 ** | 1 | |||||
| STI | 0.99 ** | 0.99 ** | −0.08 | 0.99 ** | 0.97 ** | 1 | ||||
| GMP | 0.99 ** | 0.99 ** | −0.08 | 0.99 ** | 0.98 ** | 0.99 ** | 1 | |||
| YI | 0.98 ** | 0.99 ** | −0.17 | 0.98 ** | 0.95 ** | 0.99 ** | 0.99 ** | 1 | ||
| YSI | −0.09 | 0.09 | −0.97 ** | −0.04 | −0.18 | 0.006 | 0.003 | 0.09 | 1 | |
| β | 0.96 ** | −0.91 ** | 0.19 | 0.96 ** | 0.98 ** | 0.93 ** | 0.94 ** | 0.91 ** | −0.27 | 1 |
| 2017 | Yp | Ys | SSI | MP | TOL | STI | GMP | YI | YSI | β |
| Yp | 1 | |||||||||
| Ys | 0.98 ** | 1 | ||||||||
| SSI | 0.02 | −0.15 | 1 | |||||||
| MP | 0.99 ** | 0.98 ** | −0.01 | 1 | ||||||
| TOL | 0.99 ** | −0.96 ** | 0.11 | 0.99 ** | 1 | |||||
| STI | 0.99 ** | 0.99 ** | −0.07 | 0.99 ** | 0.97 ** | 1 | ||||
| GMP | 0.99 ** | 0.99 ** | −0.06 | 0.99 ** | 0.98 ** | 0.99 ** | 1 | |||
| YI | 0.98 ** | 0.99 ** | −0.15 | 0.98 ** | 0.96 ** | 0.99 ** | 0.99 ** | 1 | ||
| YSI | −0.20 | −0.02 | −0.94 ** | −0.16 | −0.26 | −0.11 | −0.11 | −0.03 | 1 | |
| β | 0.96 ** | −0.92 ** | 0.20 | 0.96 ** | 0.98 ** | 0.93 ** | 0.95 ** | 0.92 ** | −0.37 | 1 |
| 2018 | Yp | Ys | SSI | MP | TOL | STI | GMP | YI | YSI | β |
| Yp | 1 | |||||||||
| Ys | 0.99 ** | 1 | ||||||||
| SSI | −0.13 | −0.60 | 1 | |||||||
| MP | 0.99 ** | 0.99 ** | −0.13 | 1 | ||||||
| TOL | 0.99 ** | −0.76 ** | −0.11 | 0.99 ** | 1 | |||||
| STI | 0.99 ** | 0.99 ** | −0.11 | 0.99 ** | 0.99 ** | 1 | ||||
| GMP | 0.99 ** | 0.99 ** | −0.14 | 0.99 ** | 0.99 ** | 0.99 ** | 1 | |||
| YI | 0.99 ** | 0.99 ** | −0.16 | 0.99 ** | 0.99 ** | 0.99 ** | 0.99 ** | 1 | ||
| YSI | −0.24 | −0.19 | −0.50 ** | −0.22 | −0.26 | −0.19 | −0.21 | −0.19 | 1 | |
| β | 0.98 ** | −0.97 ** | −0.15 | 0.98 ** | 0.98 ** | 0.95 ** | 0.97 ** | 0.97 ** | −0.39 | 1 |
| 2016 | Yp | Ys | SSI | MP | TOL | STI | GMP | YI | YSI | β |
|---|---|---|---|---|---|---|---|---|---|---|
| Yp | 1 | |||||||||
| Ys | 0.99 ** | 1 | ||||||||
| SSI | 0.25 | 0.13 | 1 | |||||||
| MP | 0.99 ** | 0.99 ** | 0.22 | 1 | ||||||
| TOL | 0.99 ** | −0.41 * | 0.32 | 0.99 ** | 1 | |||||
| STI | 0.99 ** | 0.99 ** | 0.17 | 0.99 ** | 0.98 ** | 1 | ||||
| GMP | 0.99 ** | 0.99 ** | 0.2 | 0.99 ** | 0.99 ** | 0.99 ** | 1 | |||
| YI | 0.99 ** | 0.99 ** | 0.13 | 0.99 ** | 0.97 ** | 0.99 ** | 0.99 ** | 1 | ||
| YSI | −0.19 | −0.08 | −0.86 | −0.16 | −0.25 | −0.1 | −0.14 | −0.07 | 1 | |
| β | 0.47 | −0.35 | 0.95 ** | 0.44 | 0.63 ** | 0.38 | 0.41 | 0.35 | −0.86 | 1 |
| 2017 | Yp | Ys | SSI | MP | TOL | STI | GMP | YI | YSI | β |
| Yp | 1 | |||||||||
| Ys | 0.99 ** | 1 | ||||||||
| SSI | −0.52 | −0.59 | 1 | |||||||
| MP | 0.99 ** | 0.99 ** | −0.54 | 1 | ||||||
| TOL | 0.99 ** | 0.38 | −0.47 | 0.99 ** | 1 | |||||
| STI | 0.99 ** | 0.99 ** | −0.56 | 0.99 ** | 0.99 ** | 1 | ||||
| GMP | 0.99 ** | 0.99 ** | −0.56 | 0.99 ** | 0.99 ** | 0.99 ** | 1 | |||
| YI | 0.85 ** | 0.86 ** | −0.6 | 0.85 ** | 0.84 ** | 0.85 ** | 0.86 ** | 1 | ||
| YSI | 0.52 | 0.59 | −1 | 0.54 | 0.47 | 0.56 | 0.56 | 0.60 * | 1 | |
| β | 0.98 ** | −0.96 ** | −0.41 | 0.97 ** | 0.99 ** | 0.97 ** | 0.97 ** | 0.80 ** | 0.41 | 1 |
| 2018 | Yp | Ys | SSI | MP | TOL | STI | GMP | YI | YSI | β |
| Yp | 1 | |||||||||
| Ys | 0.99 ** | 1 | ||||||||
| SSI | −0.46 | −0.41 | 1 | |||||||
| MP | 0.99 ** | 0.99 ** | −0.45 | 1 | ||||||
| TOL | 0.98 ** | −0.48 * | −0.48 | 0.99 ** | 1 | |||||
| STI | 0.99 ** | 0.99 ** | −0.43 | 0.99 ** | 0.99 ** | 1 | ||||
| GMP | 0.99 ** | 0.99 ** | −0.43 | 0.99 ** | 0.99 ** | 0.99 ** | 1 | |||
| YI | 0.99 ** | 0.99 ** | −0.41 | 0.99 ** | 0.98 ** | 0.99 ** | 0.99 ** | 1 | ||
| YSI | −0.19 | −0.11 | 0.23 | −0.17 | −0.24 | −0.16 | −0.15 | −0.1 | 1 | |
| β | 0.26 | −0.16 | −0.57 | 0.24 | 0.32 | 0.22 | 0.21 | 0.16 | −0.8 | 1 |
| Kerman | 2016 | 2017 | 2018 | ||||||
|---|---|---|---|---|---|---|---|---|---|
| Factor loading | Factor loading | Factor loading | |||||||
| Index | FA1 | FA2 | Com. | FA1 | FA2 | Com. | FA1 | FA2 | Com. |
| SSI | −0.293 | 0.955 | 0.996 | −0.164 | 0.986 | 0.997 | −0.054 | 0.998 | 0.99 |
| MP | 0.960 | −0.276 | 1 | 0.999 | −0.038 | 1 | 0.999 | 0.012 | 1 |
| TOL | 0.992 | −0.123 | 0.996 | 0.991 | 0.121 | 1 | 0.992 | 0.117 | 0.999 |
| STI | 0.952 | −0.301 | 0.998 | 0.992 | −0.101 | 0.994 | 0.997 | −0.026 | 0.998 |
| GMP | 0.946 | −0.321 | 1 | 0.995 | −0.093 | 1 | 0.999 | −0.026 | 1 |
| YI | 0.918 | −0.394 | 0.997 | 0.981 | −0.191 | 1 | 0.994 | −0.101 | 1 |
| YSI | 0.290 | 0.956 | 0.996 | 0.167 | 0.985 | 0.997 | 0.054 | 0.998 | 0.997 |
| B | −0.221 | 0.974 | 0.97 | 0.152 | 0.987 | 0.995 | 0.095 | 0.994 | 0.998 |
| %Var | 0.517 | 0.477 | 0.994 | 0.71 | 0.287 | 0.998 | 0.574 | 0.424 | 0.998 |
| Jiroft | 2016 | 2017 | 2018 | ||||||
| Factor loading | Factor loading | Factor loading | |||||||
| Index | FA1 | FA2 | Com. | FA1 | FA2 | Com. | FA1 | FA2 | Com. |
| SSI | −0.207 | −0.977 | 0.948 | 0.044 | 0.998 | 1 | 0.230 | 0.931 | 1 |
| MP | 0.918 | 0.395 | 0.998 | 0.999 | 0.039 | 1 | 0.998 | −0.056 | 1 |
| TOL | 0.984 | 0.174 | 0.992 | 0.985 | 0.170 | 0.999 | 0.994 | −0.095 | 1 |
| STI | 0.853 | 0.512 | 0.992 | 0.995 | −0.019 | 0.991 | 0.993 | −0.045 | 0.989 |
| GMP | 0.888 | 0.458 | 0.999 | 0.999 | −0.007 | 1 | 0.999 | −0.041 | 1 |
| YI | 0.824 | 0.564 | 1 | 0.994 | −0.101 | 1 | 0.999 | −0.012 | 1 |
| YSI | 0.207 | 0.977 | 0.976 | −0.046 | −0.998 | 1 | 0.102 | 0.960 | 1 |
| B | 0.990 | −0.040 | 0.979 | 0.955 | 0.257 | 0.979 | 0.976 | −0.103 | 0.973 |
| %Var | 0.543 | 0.442 | 0.986 | 0.733 | 0.263 | 0.996 | 0.742 | 0.253 | 0.995 |
| Bardsir | 2016 | 2017 | 2018 | ||||||
| Factor loading | Factor loading | Factor loading | |||||||
| Index | FA1 | FA2 | Com. | FA1 | FA2 | Com. | FA1 | FA2 | Com. |
| SSI | 0.085 | 0.996 | 1 | −0.275 | −0.956 | 0.998 | −0.418 | 0.658 | 1 |
| MP | 0.985 | 0.167 | 1 | 0.949 | 0.307 | 0.991 | 0.992 | −0.010 | 1 |
| TOL | 0.963 | 0.267 | 1 | 0.971 | 0.227 | 0.972 | 0.980 | −0.185 | 0.999 |
| STI | 0.992 | 0.118 | 0.998 | 0.935 | 0.343 | 1 | 0.995 | −0.061 | 0.998 |
| GMP | 0.989 | 0.140 | 1 | 0.941 | 0.331 | 1 | 0.995 | −0.080 | 0.981 |
| YI | 0.996 | 0.076 | 0.997 | 0.798 | 0.428 | 0.968 | 0.998 | −0.029 | 1 |
| YSI | −0.082 | 0.996 | 0.996 | 0.261 | −0.960 | 0.947 | 0.161 | 0.966 | 0.997 |
| B | 0.312 | 0.949 | 0.97 | 0.981 | 0.144 | 1 | 0.126 | 0.971 | 0.998 |
| %Var | 0.621 | 0.378 | 0.994 | 0.669 | 0.308 | 1 | 0.63 | 0.369 | 0.369 |
| Kerman | ||||||||||||
|---|---|---|---|---|---|---|---|---|---|---|---|---|
| 2016 Genotype | Yp (t ha−1) | Ys (t ha−1) | SSI | MP (t ha−1) | TOL (t ha−1) | STI | GMP (t ha−1) | YI | YSI | β | FA1 + FA2 | STS |
| HHVBC | 67.69 | 27.32 | 1.29 | 47.51 | 40.37 | 0.27 | 43 | 0.75 | 0.4 | 2.2 | 3.21 | −1.92 |
| IP22269 | 78.86 | 34.51 | 1.21 | 56.69 | 44.35 | 0.4 | 52.15 | 0.95 | 0.44 | 2.07 | 0.26 | −0.43 |
| HYB-1 | 84.86 | 36.14 | 1.24 | 60.5 | 48.72 | 0.45 | 55.36 | 1 | 0.43 | 2.14 | −0.02 | 1.59 |
| HYB-2 | 90.92 | 37.16 | 1.28 | 64.04 | 53.76 | 0.5 | 58.12 | 1.02 | 0.41 | 2.24 | −0.37 | 2.23 |
| IP13150 | 99.65 | 39.8 | 1.3 | 69.73 | 59.85 | 0.59 | 62.98 | 1.1 | 0.4 | 2.17 | −0.52 | 4.34 |
| ICM-05222 | 82.81 | 33.12 | 1.3 | 57.97 | 49.69 | 0.41 | 52.37 | 0.91 | 0.4 | 2.27 | 1.22 | −1.19 |
| IP13151 | 99.96 | 40.8 | 1.28 | 70.38 | 59.16 | 0.61 | 63.86 | 1.13 | 0.41 | 2.27 | −0.89 | 4.6 |
| S35 | 71.34 | 36.18 | 1.06 | 53.76 | 35.16 | 0.38 | 50.76 | 1 | 0.51 | 1.76 | 3.89 | −3.88 |
| ICS-112 | 68.7 | 35.34 | 1.03 | 52.02 | 33.36 | 0.36 | 49.16 | 0.97 | 0.53 | 1.72 | 7.71 | −6.35 |
| SPEEDFEED | 92.92 | 37.68 | 1.29 | 65.3 | 55.24 | 0.52 | 59.17 | 1.04 | 0.41 | 2.1 | −0.27 | 3.01 |
| ICS-14001 | 81.75 | 36.95 | 1.18 | 59.35 | 44.8 | 0.45 | 54.95 | 1.02 | 0.45 | 2.01 | −0.35 | 1.39 |
| PEGAH | 66.02 | 33.86 | 1.05 | 49.94 | 32.16 | 0.33 | 47.28 | 0.93 | 0.51 | 1.73 | −2.43 | 0.52 |
| LSD | 2.07 | 3 | 0.09 | 3.68 | 6.56 | 0.05 | 3.38 | 0.08 | 0.05 | 0.21 | ||
| 2017 Genotype | Yp (t ha−1) | Ys (t ha−1) | SSI | MP (t ha−1) | TOL (t ha−1) | STI | GMP (t ha−1) | YI | YSI | β | FA1 + FA2 | STS |
| HHVBC | 85.54 | 27.54 | 1.04 | 56.28 | 58.53 | 0.29 | 48.07 | 0.92 | 0.32 | 2.92 | 0.82 | −6.31 |
| IP22269 | 93.34 | 30.33 | 1.03 | 62.84 | 65 | 0.36 | 53.77 | 1.03 | 0.32 | 2.92 | 0.37 | −3.49 |
| HYB-1 | 96.46 | 31.56 | 1.02 | 56.44 | 64.89 | 0.38 | 55.17 | 1.07 | 0.33 | 2.84 | −1.44 | 1.14 |
| HYB-2 | 103.44 | 33.77 | 1.02 | 60.23 | 69.68 | 0.43 | 59.1 | 1.15 | 0.33 | 2.86 | −1.28 | 2.99 |
| IP13150 | 111.74 | 37.03 | 1.01 | 65.1 | 74.71 | 0.51 | 64.32 | 1.26 | 0.33 | 2.83 | −2.28 | 5.95 |
| ICM-05222 | 97.52 | 30.57 | 1.04 | 55.08 | 66.95 | 0.37 | 54.6 | 1.04 | 0.31 | 2.97 | 1.3 | −0.62 |
| IP13151 | 115.71 | 38.22 | 1.03 | 65.08 | 77.5 | 0.55 | 66.5 | 1.3 | 0.33 | 2.85 | −2.05 | 8.72 |
| S35 | 72.41 | 22.58 | 1.04 | 48.01 | 49.83 | 0.2 | 40.42 | 0.77 | 0.31 | 2.91 | 1.61 | −3.17 |
| ICS-112 | 74.63 | 22.32 | 1.06 | 46.43 | 52.31 | 0.21 | 40.81 | 0.76 | 0.3 | 2.04 | 4.2 | −4.12 |
| SPEEDFEED | 94.24 | 31.6 | 1.01 | 61.71 | 62.64 | 0.37 | 54.27 | 1.08 | 0.34 | 2.77 | −3.06 | 5.19 |
| ICS-14001 | 83.62 | 27.84 | 1.01 | 54.58 | 55.79 | 0.29 | 48.25 | 0.95 | 0.33 | 2.76 | −2.59 | −0.15 |
| PEGAH | 63.34 | 21.38 | 1 | 43.76 | 41.97 | 0.17 | 36.8 | 0.73 | 0.34 | 2.64 | −3.50 | −1.28 |
| LSD | 6.01 | 3.02 | 0.09 | 3.55 | 6.32 | 0.05 | 3.32 | 0.08 | 0.05 | 0.2 | ||
| 2018 Genotype | Yp (t ha−1) | Ys (t ha−1) | SSI | MP (t ha−1) | TOL (t ha−1) | STI | GMP (t ha−1) | YI | YSI | β | FA1 + FA2 | STS |
| HHVBC | 84.5 | 26.63 | 1.01 | 55.57 | 57.87 | 0.27 | 47.44 | 0.93 | 0.32 | 3.09 | −1.15 | −0.68 |
| IP22269 | 94.24 | 29.84 | 1 | 62.04 | 64.4 | 0.34 | 53.02 | 1.04 | 0.32 | 3.08 | −1.51 | 1.71 |
| HYB-1 | 96.03 | 30.31 | 1.01 | 63.17 | 65.72 | 0.35 | 53.95 | 1.06 | 0.32 | 3.09 | −1.26 | 1.67 |
| HYB-2 | 102.84 | 32.04 | 1.01 | 67.44 | 70.8 | 0.4 | 57.4 | 1.12 | 0.31 | 3.14 | −0.35 | 1.39 |
| IP13150 | 111.56 | 36.32 | 1.01 | 73.94 | 75.25 | 0.49 | 63.65 | 1.27 | 0.33 | 3.01 | −0.64 | 4.6 |
| ICM-05222 | 97.19 | 30.29 | 1.01 | 63.74 | 66.91 | 0.36 | 54.25 | 1.06 | 0.31 | 3.14 | −0.38 | 0.3 |
| IP13151 | 113.77 | 36.02 | 1 | 74.9 | 77.75 | 0.5 | 64.01 | 1.26 | 0.32 | 3.1 | −2.11 | 6.53 |
| S35 | 71.98 | 22.04 | 1.02 | 47.01 | 49.95 | 0.19 | 39.82 | 0.77 | 0.31 | 3.17 | 0.86 | −6.29 |
| ICS-112 | 73.95 | 22.69 | 1.02 | 48.32 | 51.26 | 0.2 | 40.96 | 0.79 | 0.31 | 3.16 | 0.66 | −5.65 |
| SPEEDFEED | 95.02 | 30.32 | 1 | 62.67 | 64.7 | 0.35 | 53.67 | 1.06 | 0.32 | 3.06 | −2.03 | 2.78 |
| ICS-14001 | 83.18 | 26.61 | 1 | 54.9 | 56.58 | 0.27 | 47.04 | 0.93 | 0.32 | 3.04 | −2.20 | 0.85 |
| PEGAH | 63.07 | 20.28 | 1 | 41.68 | 42.78 | 0.15 | 35.76 | 0.71 | 0.32 | 3 | −2.62 | −1.98 |
| LSD | 6.35 | 3.09 | 0.09 | 3.79 | 6.51 | 0.06 | 3.5 | 0.08 | 0.05 | 0.21 | ||
| Jiroft | ||||||||||||
| 2016 Genotype | Yp (t ha−1) | Ys (t ha−1) | SSI | MP (t ha−1) | TOL (t ha−1) | STI | GMP (t ha−1) | YI | YSI | β | FA1 + FA2 | STS |
| HHVBC | 85.69 | 25.31 | 1.02 | 55.5 | 60.38 | 0.26 | 46.57 | 0.72 | 0.3 | 1.46 | −4.99 | −2.92 |
| IP22269 | 95.66 | 27.74 | 1.03 | 61.7 | 67.92 | 0.32 | 51.51 | 0.79 | 0.29 | 1.7 | −1.59 | −2.92 |
| HYB-1 | 96.72 | 29.09 | 1.01 | 62.91 | 67.63 | 0.34 | 53.04 | 0.83 | 0.3 | 1.65 | 0.75 | −1.06 |
| HYB-2 | 103.1 | 32.91 | 0.99 | 68.01 | 70.19 | 0.41 | 58.23 | 0.94 | 0.32 | 1.66 | 6.95 | 2.73 |
| IP13150 | 109.98 | 38.46 | 0.94 | 74.22 | 71.52 | 0.51 | 65.01 | 1.09 | 0.35 | 1.6 | 15.96 | 8.86 |
| ICM-05222 | 97.57 | 28.35 | 1.03 | 62.96 | 69.22 | 0.33 | 52.59 | 0.81 | 0.29 | 1.73 | −0.66 | −2.65 |
| IP13151 | 116.52 | 37.8 | 0.98 | 77.16 | 78.72 | 0.53 | 66.36 | 1.07 | 0.32 | 1.8 | 14.39 | 5.45 |
| S35 | 70.82 | 21.2 | 1.02 | 46.01 | 49.62 | 0.18 | 38.74 | 0.6 | 0.3 | 1.01 | −10.64 | −3.17 |
| ICS-112 | 73.84 | 21.41 | 1.03 | 47.63 | 52.43 | 0.19 | 39.76 | 0.61 | 0.29 | 1.16 | −10.75 | −4.39 |
| SPEEDFEED | 94.35 | 31.02 | 0.97 | 62.69 | 63.33 | 0.35 | 54.1 | 0.88 | 0.33 | 1.47 | 4.51 | 3.21 |
| ICS-14001 | 83.66 | 25.47 | 1.01 | 54.57 | 58.18 | 0.26 | 46.16 | 0.72 | 0.3 | 1.38 | −4.36 | −1.66 |
| PEGAH | 63.5 | 19.75 | 1 | 41.63 | 43.75 | 0.15 | 35.4 | 0.56 | 0.31 | 0.76 | −11.91 | −1.82 |
| LSD | 8.31 | 3.26 | 0.09 | 5.54 | 6.06 | 0.06 | 4.97 | 0.09 | 0.02 | 0.24 | ||
| 2017 Genotype | Yp (t ha−1) | Ys (t ha−1) | SSI | MP (t ha−1) | TOL (t ha−1) | STI | GMP (t ha−1) | YI | YSI | β | FA1 + FA2 | STS |
| HHVBC | 85.71 | 26.02 | 1.03 | 55.87 | 59.69 | 0.27 | 47.23 | 0.89 | 0.3 | 1.42 | 1.64 | −4.03 |
| IP22269 | 95.68 | 30.09 | 1.01 | 62.89 | 65.59 | 0.35 | 53.65 | 1.03 | 0.31 | 1.57 | 0.53 | −0.74 |
| HYB-1 | 96.75 | 31.6 | 0.99 | 64.17 | 65.15 | 0.37 | 55.29 | 1.08 | 0.33 | 1.52 | −0.67 | 1.68 |
| HYB-2 | 103.14 | 33.01 | 1 | 68.07 | 70.13 | 0.41 | 58.35 | 1.12 | 0.32 | 1.65 | 0 | 1.4 |
| IP13150 | 117.18 | 37.29 | 1 | 77.24 | 79.9 | 0.53 | 66.1 | 1.27 | 0.32 | 1.84 | 0.18 | 3.36 |
| ICM-05222 | 97.77 | 30.12 | 1.02 | 63.95 | 67.65 | 0.35 | 54.27 | 1.03 | 0.31 | 1.63 | 1.2 | −1.70 |
| IP13151 | 108.58 | 35.25 | 0.99 | 71.92 | 73.34 | 0.46 | 61.96 | 1.2 | 0.32 | 1.7 | −0.47 | 3.21 |
| S35 | 72.35 | 22.98 | 1 | 47.67 | 49.37 | 0.2 | 40.75 | 0.78 | 0.32 | 1.03 | 0.05 | −2.65 |
| ICS-112 | 73.93 | 22.85 | 1.02 | 48.39 | 51.08 | 0.21 | 41.09 | 0.78 | 0.31 | 1.09 | 1.17 | −4.27 |
| SPEEDFEED | 94.35 | 31.57 | 0.98 | 62.96 | 62.41 | 0.36 | 54.58 | 1.08 | 0.33 | 1.45 | −1.48 | 2.86 |
| ICS-14001 | 83.66 | 28.18 | 0.98 | 55.92 | 55.48 | 0.28 | 48.55 | 0.96 | 0.34 | 1.24 | −1.67 | 1.69 |
| PEGAH | 63.62 | 21.4 | 0.98 | 42.51 | 42.22 | 0.16 | 36.89 | 0.73 | 0.34 | 0.7 | −1.63 | −0.52 |
| LSD | 8.31 | 1.95 | 0.08 | 5.07 | 6.58 | 0.04 | 3.99 | 0.06 | 0.02 | 0.25 | ||
| 2018 Genotype | Yp (t ha−1) | Ys (t ha−1) | SSI | MP (t ha−1) | TOL (t ha−1) | STI | GMP (t ha−1) | YI | YSI | β | FA1 + FA2 | STS |
| HHVBC | 85.32 | 26.57 | 1 | 55.95 | 58.74 | 0.28 | 47.62 | 0.76 | 0.31 | 1.38 | −0.73 | −1.15 |
| IP22269 | 95.28 | 30.09 | 1 | 62.69 | 65.19 | 0.35 | 53.55 | 0.86 | 0.32 | 1.55 | 0.56 | 1.54 |
| HYB-1 | 96.1 | 30.26 | 1 | 63.18 | 65.84 | 0.35 | 53.93 | 0.87 | 0.31 | 1.57 | 0.3 | 1.37 |
| HYB-2 | 102.9 | 32.11 | 1 | 67.5 | 70.79 | 0.4 | 57.48 | 0.92 | 0.31 | 1.69 | −0.55 | 1.48 |
| IP13150 | 117.05 | 36.31 | 1 | 77.18 | 79.74 | 0.53 | 66.08 | 1.07 | 0.32 | 1.84 | −0.81 | 4.9 |
| ICM-05222 | 97.88 | 30.4 | 1 | 64.14 | 67.48 | 0.36 | 54.55 | 0.87 | 0.31 | 1.62 | −0.99 | 0.26 |
| IP13151 | 113.81 | 35.58 | 1 | 74.7 | 78.24 | 0.49 | 63.63 | 1.02 | 0.31 | 1.83 | −0.40 | 3.43 |
| S35 | 71.13 | 22.5 | 1 | 46.81 | 48.63 | 0.2 | 40 | 0.64 | 0.32 | 0.97 | 0.9 | −0.98 |
| ICS-112 | 74.02 | 22.96 | 1.01 | 48.49 | 51.05 | 0.21 | 41.23 | 0.66 | 0.31 | 1.09 | 1.07 | −2.71 |
| SPEEDFEED | 94.03 | 30.15 | 0.99 | 62.09 | 63.88 | 0.34 | 53.24 | 0.86 | 0.32 | 1.51 | 0.09 | 2.87 |
| ICS-14001 | 83.33 | 26.5 | 0.99 | 54.92 | 56.83 | 0.27 | 46.99 | 0.76 | 0.32 | 1.31 | −1.18 | 0.57 |
| PEGAH | 63.37 | 20 | 1 | 41.69 | 43.37 | 0.15 | 35.6 | 0.57 | 0.32 | 0.74 | 0.49 | −2.05 |
| LSD | 7.57 | 2.29 | 0.01 | 4.89 | 5.41 | 0.04 | 4.12 | 0.07 | 0.01 | 0.22 | ||
| Bardsir | ||||||||||||
| 2016 Genotype | Yp (t ha−1) | Ys (t ha−1) | SSI | MP (t ha−1) | TOL (t ha−1) | STI | GMP (t ha−1) | YI | YSI | β | FA1 + FA2 | STS |
| HHVBC | 75.69 | 27.15 | 1.01 | 51.42 | 48.54 | 0.29 | 45.33 | 0.89 | 0.36 | 2.69 | 0.26 | −4.00 |
| IP22269 | 79.21 | 28.54 | 1 | 53.88 | 50.67 | 0.32 | 47.55 | 0.94 | 0.36 | 2.68 | −0.07 | −2.24 |
| HYB-1 | 81.75 | 29.56 | 1 | 55.66 | 52.18 | 0.34 | 49.16 | 0.97 | 0.36 | 2.67 | −0.33 | −0.89 |
| HYB-2 | 92.49 | 32.89 | 1.01 | 62.69 | 59.6 | 0.43 | 55.16 | 1.08 | 0.36 | 2.73 | 0.9 | −0.36 |
| IP13150 | 95.67 | 34.37 | 1.01 | 65.02 | 61.3 | 0.47 | 57.34 | 1.13 | 0.36 | 2.71 | 0.14 | 2.39 |
| ICM-05222 | 81.4 | 29.18 | 1.01 | 55.29 | 52.22 | 0.34 | 48.73 | 0.96 | 0.36 | 2.7 | 0.32 | −2.44 |
| IP13151 | 96.02 | 34.76 | 1 | 65.39 | 61.26 | 0.48 | 57.77 | 1.14 | 0.36 | 2.68 | −0.40 | 3.79 |
| S35 | 77.13 | 28.83 | 0.98 | 52.98 | 48.3 | 0.32 | 47.15 | 0.95 | 0.37 | 2.58 | −2.71 | 3 |
| ICS-112 | 77.81 | 28.15 | 1 | 52.98 | 49.65 | 0.31 | 46.8 | 0.93 | 0.36 | 2.67 | −0.37 | −1.98 |
| SPEEDFEED | 97.33 | 35.81 | 0.99 | 66.57 | 61.51 | 0.5 | 59.03 | 1.18 | 0.37 | 2.64 | −1.60 | 6.95 |
| ICS-14001 | 82.7 | 30.37 | 0.99 | 56.53 | 52.33 | 0.36 | 50.11 | 1 | 0.37 | 2.63 | −1.44 | 1.89 |
| PEGAH | 67.89 | 25.05 | 0.99 | 46.47 | 42.85 | 0.24 | 41.24 | 0.82 | 0.37 | 2.6 | −1.78 | −1.79 |
| LSD | 4.39 | 2.1 | 0.02 | 3.19 | 2.58 | 0.04 | 3.01 | 0.08 | 0.01 | 0.07 | ||
| 2017 Genotype | Yp (t ha−1) | Ys (t ha−1) | SSI | MP (t ha−1) | TOL (t ha−1) | STI | GMP (t ha−1) | YI | YSI | β | FA1 + FA2 | STS |
| HHVBC | 75.68 | 27.46 | 1.01 | 51.57 | 48.22 | 0.3 | 45.58 | 0.75 | 0.36 | 1.27 | −2.25 | −2.66 |
| IP22269 | 79.08 | 28.79 | 1.01 | 53.94 | 50.3 | 0.33 | 47.71 | 0.56 | 0.36 | 1.33 | −1.86 | −3.35 |
| HYB-1 | 81.57 | 29.65 | 1.01 | 55.61 | 51.92 | 0.35 | 49.18 | 0.81 | 0.36 | 1.37 | −2.05 | −1.76 |
| HYB-2 | 92.32 | 33.49 | 1.01 | 62.91 | 58.83 | 0.44 | 55.6 | 0.91 | 0.36 | 1.54 | −2.36 | −0.27 |
| IP13150 | 95.49 | 35.51 | 1 | 65.5 | 59.98 | 0.48 | 58.23 | 0.97 | 0.37 | 1.54 | 0.6 | 2.68 |
| ICM-05222 | 81.22 | 30.01 | 1 | 55.61 | 51.21 | 0.35 | 49.37 | 0.82 | 0.37 | 1.35 | −0.17 | −0.36 |
| IP13151 | 95.99 | 35.76 | 1 | 65.87 | 60.23 | 0.49 | 58.59 | 0.97 | 0.37 | 1.54 | 0.82 | 2.95 |
| S35 | 76.94 | 28.54 | 1 | 52.74 | 48.41 | 0.31 | 46.86 | 0.78 | 0.37 | 1.26 | 0.28 | −0.56 |
| ICS-112 | 77.62 | 28.78 | 1 | 53.2 | 48.84 | 0.32 | 47.27 | 0.78 | 0.37 | 1.28 | 0.26 | −0.54 |
| SPEEDFEED | 97.4 | 36.6 | 0.99 | 67 | 60.8 | 0.51 | 59.71 | 1 | 0.38 | 1.55 | 1.84 | 4.07 |
| ICS-14001 | 82.77 | 30.09 | 1.01 | 56.43 | 52.68 | 0.36 | 49.9 | 0.82 | 0.36 | 1.39 | −2.02 | −1.54 |
| PEGAH | 68.17 | 24.79 | 1.01 | 46.48 | 43.38 | 0.24 | 41.1 | 0.68 | 0.36 | 1.1 | −2.01 | −3.20 |
| LSD | 4.48 | 1.92 | 0.02 | 3.07 | 3.1 | 2.07 | 2.81 | 0.19 | 0.01 | 0.09 | ||
| 2018 Genotype | Yp (t ha−1) | Ys (t ha−1) | SSI | MP (t ha−1) | TOL (t ha−1) | STI | GMP (t ha−1) | YI | YSI | β | FA1 + FA2 | STS |
| HHVBC | 75.67 | 26.47 | 1 | 51.07 | 49.2 | 0.29 | 44.75 | 0.9 | 0.35 | 2.76 | −1.51 | −0.98 |
| IP22269 | 79.07 | 27.36 | 1.01 | 53.22 | 51.72 | 0.31 | 46.51 | 0.93 | 0.35 | 2.79 | −2.84 | −0.80 |
| HYB-1 | 81.56 | 27.96 | 1.01 | 54.76 | 53.61 | 0.33 | 47.75 | 0.95 | 0.34 | 2.82 | −3.97 | −2.39 |
| HYB-2 | 91.94 | 32.44 | 1 | 62.19 | 59.5 | 0.43 | 54.62 | 1.1 | 0.35 | 2.75 | −1.18 | 4.38 |
| IP13150 | 95.11 | 33.59 | 1 | 64.35 | 61.52 | 0.46 | 56.52 | 1.14 | 0.35 | 2.75 | −1.18 | 5.51 |
| ICM-05222 | 80.87 | 28.28 | 1 | 54.57 | 52.59 | 0.33 | 47.82 | 0.96 | 0.35 | 2.76 | −1.70 | −1.02 |
| IP13151 | 94.47 | 33.48 | 0.99 | 64.88 | 61.83 | 0.46 | 57.04 | 1.15 | 0.35 | 2.74 | −0.78 | 5.08 |
| S35 | 76.7 | 27.38 | 0.99 | 52.04 | 49.31 | 0.3 | 45.83 | 0.93 | 0.36 | 2.7 | 0.78 | 0.64 |
| ICS-112 | 78.11 | 27.85 | 0.99 | 52.98 | 50.25 | 0.31 | 46.64 | 0.95 | 0.36 | 2.71 | 0.57 | 0.26 |
| SPEEDFEED | 98 | 34.4 | 0.8 | 66.2 | 63.6 | 0.48 | 58.07 | 1.17 | 0.35 | 2.77 | −1.95 | 5.74 |
| ICS-14001 | 83.25 | 29.51 | 0.99 | 56.38 | 53.75 | 0.35 | 49.56 | 1 | 0.35 | 2.73 | −0.36 | 1.91 |
| PEGAH | 68.05 | 24.11 | 0.99 | 46.08 | 43.95 | 0.23 | 40.5 | 0.82 | 0.35 | 2.71 | 0.41 | −4.01 |
| LSD | 4.78 | 1.91 | 0.01 | 3.3 | 3.07 | 0.04 | 2.98 | 0.06 | 0.01 | 0.07 |
© 2019 by the authors. Licensee MDPI, Basel, Switzerland. This article is an open access article distributed under the terms and conditions of the Creative Commons Attribution (CC BY) license (http://creativecommons.org/licenses/by/4.0/).
Share and Cite
Negarestani, M.; Tohidi-Nejad, E.; Khajoei-Nejad, G.; Nakhoda, B.; Mohammadi-Nejad, G. Comparison of Different Multivariate Statistical Methods for Screening the Drought Tolerant Genotypes of Pearl Millet (Pennisetum americanum L.) and Sorghum (Sorghum bicolor L.). Agronomy 2019, 9, 645. https://doi.org/10.3390/agronomy9100645
Negarestani M, Tohidi-Nejad E, Khajoei-Nejad G, Nakhoda B, Mohammadi-Nejad G. Comparison of Different Multivariate Statistical Methods for Screening the Drought Tolerant Genotypes of Pearl Millet (Pennisetum americanum L.) and Sorghum (Sorghum bicolor L.). Agronomy. 2019; 9(10):645. https://doi.org/10.3390/agronomy9100645
Chicago/Turabian StyleNegarestani, Mohammadreza, Enayatollah Tohidi-Nejad, Gholamreze Khajoei-Nejad, Babak Nakhoda, and Ghasem Mohammadi-Nejad. 2019. "Comparison of Different Multivariate Statistical Methods for Screening the Drought Tolerant Genotypes of Pearl Millet (Pennisetum americanum L.) and Sorghum (Sorghum bicolor L.)" Agronomy 9, no. 10: 645. https://doi.org/10.3390/agronomy9100645
APA StyleNegarestani, M., Tohidi-Nejad, E., Khajoei-Nejad, G., Nakhoda, B., & Mohammadi-Nejad, G. (2019). Comparison of Different Multivariate Statistical Methods for Screening the Drought Tolerant Genotypes of Pearl Millet (Pennisetum americanum L.) and Sorghum (Sorghum bicolor L.). Agronomy, 9(10), 645. https://doi.org/10.3390/agronomy9100645