Article

Terrestrial and Remote Indexes to Assess Moderate Deficit Irrigation in Early-Maturing Nectarine Trees

by
María R. Conesa
,
Wenceslao Conejero
,
Juan Vera
,
Juan M. Ramírez-Cuesta
and
M. Carmen Ruiz-Sánchez
*
Irrigation Department, Centro de Edafología y Biología Aplicada del Segura (CEBAS-CSIC), P.O. Box 164, 30100 Murcia, Spain
*
Author to whom correspondence should be addressed.
Agronomy 2019, 9(10), 630; https://doi.org/10.3390/agronomy9100630
Submission received: 4 October 2019 / Revised: 7 October 2019 / Accepted: 9 October 2019 / Published: 11 October 2019
(This article belongs to the Special Issue Irrigation Strategies and Soil Management in Orchards)

Abstract

:
Monitoring plant water status is relevant for the sustainable management of irrigation under water deficit conditions. Two treatments were applied to an early-maturing nectarine orchard: control (well irrigated) and precise deficit irrigation (PDI, based on soil water content thresholds). Moderate water deficits generated by PDI were assessed by comparing terrestrial: stem water potential (Ψstem) and gas exchange parameters, with remote: canopy temperature, normalized difference vegetation (NDVI), and soil adjusted vegetation index (SAVI), plant water status indicators. The Ψstem was the only indicator that showed significant differences between treatments. NDVI and SAVI at the postharvest period were appropriate indexes for estimating winter pruning, although they did not serve well as plant stress indicator. Vapor pressure deficit along with Ψstem values were able to predict remote sensing data. Ψstem and canopy to air temperature difference values registered the highest signal intensity and NDVI the highest sensitivity for detecting water deficit situations. The results suggest that care should be taken when using instantaneous remote indicators to evaluate moderate water deficits in deciduous fruit trees; more severe/longer water stress conditions are probably needed. The proposed PDI strategy promoted water saving while maintaining yield, and could be considered a promising tool for semi-arid agrosystems.

1. Introduction

Efficient irrigation of horticultural crops using technologies that enable the better husbandry of scarce freshwater resources has been increasingly studied in recent years, because irrigated agriculture is the largest user (up to 70%) of freshwater worldwide [1]. This situation might worsen in coming years as the world’s population is expected to increase by 30% by 2050 coupled with forecasted climate change and competition with urban, touristic, and industrial activities [2,3].
Among irrigated woody crops, peach and nectarine trees have particularly high irrigation requirements, especially during dry and hot seasons [4,5], when irrigated orchards are frequently subjected to drastic reductions in the water supply. Indeed, this situation is aggravated in early-maturing cultivars with their high water needs during the summer postharvest interval [6,7]. Since irrigation is essential to ensure optimal yield, it is imperative to develop efficient irrigation strategies for peach and nectarine orchards by means of irrigation scheduling based on the requirements of the plants and optimal water productivity.
To optimize water use and save water, deficit irrigation (DI) practices can be used since they minimize any impact on fruit yield and quality, while reducing excessive vegetative growth [2,8]. When using such strategies, the time, intensity, and duration of the water reductions applied are critical. Furthermore, in order to mitigate the effects of plant water deficits, fruit culture should be directed towards pruning and crop load control (management) practices that decrease water demand while maintaining productivity and fruit quality at harvest [9,10,11].
The fruit trees identify the water scarcity by analyzing leaf morphological traits, and vegetative growth, and photosynthetic characteristics [12], but in order to take suitable irrigation decisions, it is crucial to monitor the crop water status, especially when DI strategies are applied. Plant water status is probably the main determining variable for evaluating fruit tree performance [5,13], and to increase water use efficiency, since plant measurements integrate climate and soil water status [14]. Several authors have proposed the use of midday stem water potential (Ψstem) as a tool to measure plant water status [15]. However, this indicator requires measuring manually using a pressure chamber [16] in a reduced span of time around noon, which is impractical in large commercial orchards [17,18]; besides this method provides discrete measures that may not reflect the spatial variability within the field [19].
Remote sensing technologies using unmanned aerial vehicles (UAVs) for crop management have multiplied in recent years [20]. Two main approaches exist for assessing crop evapotranspiration and crop water stress: thermal and visible-near infrared (VIS-NIR) remote sensing. Aerial thermal imagery has become a powerful method for assessing the spatial variability of water deficit using canopy temperature [18,21]. In this respect, the crop water stress index (CWSI, [22]) has been widely used in studies aimed at estimating crop water status using thermal data [23,24]. Bellvert et al. [18] proposed the CWSI, calculated from airborne thermal imagery data, as a suitable indicator for water stress monitoring in peach and nectarine trees, while González-Dugo et al. [25] highlighted the shortcoming of using CWSI due to the short-term fluctuations in canopy temperature (Tc).
Multispectral VIS-NIR images have been widely used for investigating the vegetative growth of fruit tree crops and thus determining plant water status based on tree vigor. The normalized difference vegetation index (NDVI, [26]) is the most used vegetation index due to its easy computation with a fixed range of variation (between −1 and +1), which enables thresholds to be established and images to be compared. However, NDVI has the disadvantage of its poor ability to minimize the influence of the soil and the atmosphere, especially when coarse spatial resolutions are used [27], so other indexes that solve this limitation have been developed; for example, soil adjusted vegetation index (SAVI, [28]).
Recent studies have investigated the relationship between remote sensing-derived indexes obtained by thermal and VIS-NIR multispectral imagery and tree vigor [29], yield and fruit quality [30], leaf structural properties [31], soil characteristics [32], and plant water status [33,34]. Indeed, the applicability and limitations of these derived indexes have been reviewed in many fruit crops [33,35,36]. A sensitivity analysis to water deficits of both terrestrial and remote-sensing-based indexes was made by Ballester et al. [37], but the study only includes the Goldhamer and Fereres [38] approach. However, no studies have discussed the comparison using the new approach described by de la Rosa et al. [39], in order to evaluate the indicator that best define plant water status in early-maturing nectarine trees.
The main goal of this study was to compare terrestrial and remote sensing-based indicators to evaluate plant water status and vegetative growth in early-maturing nectarine trees under precise deficit irrigation (PDI), based on real-time soil water content (SWC) values. The sensitivity analysis of these indexes to the imposed water stress conditions was also assessed.

2. Materials and Methods

2.1. Experimental Site

This study was carried out during the 2017–2018 growing season in a 0.5 ha orchard of seven-year-old extra early-maturing nectarine trees (Prunus persica (L.) Batsch, cv. Flariba, on GxN-15 rootstock), at the CEBAS-CSIC experimental station in Santomera, Murcia (SE Spain, 38°06′31″N, 1°02′14″W). The phenological stages of this cultivar are depicted in Conesa et al. [11], briefly, flowering started at the end of January, followed by leaf development, and harvesting time occurred at early-May. Trees were spaced 6.5 m × 3.5 m and trained to an open-center canopy. The soil in the 0–0.5 m layer was stony with a clay loam texture and low organic matter content. The average bulk density was 1.43 g cm−3. Soil water content (SWC) at field capacity and permanent wilting point were 0.29 and 0.14 m3 m−3, respectively. More details about the experimental site, soil characteristics, climate parameters, fertilization, and cultural practices are described in Vera et al. [3].
The experiment involved two different irrigation scheduling treatments during the growing season, which were divided into two periods: fruit growth (March–May) and postharvest (May–October): a control treatment, irrigated to satisfy maximum crop water requirements (100% of crop evapotranspiration (ETc) throughout the growing season), and a precise deficit irrigation (PDI) treatment, based on threshold SWC values obtained using capacitance probes, at 30% (postharvest) and 10% (fruit growth) of the allowed soil water deficit (α), respectively [3]. The irrigation system comprised one drip-line per tree row with four pressure-compensated emitters (4 L h−1) per tree located 0.5 and 1.3 m from the tree trunk. For the control treatment, ETc was estimated following the approach proposed by Allen et al. [40], by multiplying reference evapotranspiration (ET0) by a crop coefficient (Kc). In this study, the Kc values were those proposed by Abrisqueta et al. [7] and the ET0 was calculated using the Penman–Monteith equation [40]. Daily meteorological data were recorded by an automated weather station located at the CEBAS-CSIC experimental station.
The experimental layout consisted of a completely randomized design with four replications per irrigation treatment, each consisting of six trees (the central four were used for measurements and the rest served as guard trees), with a total of 24 trees per irrigation treatment. No active roots were seen more than 1.5 m from the drip line as revealed root distribution studies [41].

2.2. Automated Irrigation Feedback

Volumetric soil water content (θv) was measured at 0.1, 0.3, 0.5, and 0.7 m depth with capacitance probes (EnviroScan®, Sentek Pty. Ltd., Adelaide, South Australia). Four PVC access tubes were installed 0.1 m from the emitter located 0.5 m from the trunk of four representative trees, one for each replication of the two irrigation treatments. Probes were normalized and calibrated for a clay-loam soil according to Evett et al. [42] and Abrisqueta et al. [43].
The SWC values in the 0–0.5m soil profile (coinciding with the effective root depth [44]), were computed and used to activate electro-hydraulic valves by means of a telemetry system. Threshold SWC values in the PDI treatment were set at 30% (postharvest of 2017) and 10% (fruit growth of 2018), respectively, to trigger irrigation and the field capacity (FC) value was used to end irrigation (Figure 1). More details can be found in Vera et al. [3].
Average θv values in the monitored soil profile (0–0.5 m) were used to calculate the relative extractable water (REW), defined by the equation proposed by Granier [45]:
REW = (R − Rmin)/(Rmax − Rmin)
where R (mm) is the actual soil water content, Rmin (mm) the minimum soil water content measured in dry conditions, and Rmax (mm) the maximum soil water content obtained in each probe. In this study, the values of Rmax and Rmin were normalized with the θv at field capacity and permanent wilting point of 29% and 14%, respectively.

2.3. Plant Water Status and Gas Exchange

Plant water status was estimated by measuring stem water potential (Ψstem) at midday (12:00 h solar time) using a pressure chamber (Soil Moisture Equipment Corp. Model 3000). One leaf was selected from each replicate trees from both irrigation treatments (n = 4). Leaves were placed in plastic bags covered with aluminium foil for at least 2 h prior to the measurements, which were carried out every week from April to October following the recommendations of [16,46,47].
Net CO2 assimilation rate (ACO2, μmol m−2 s−1), stomatal conductance (gs mmol m−2 s−1), and transpiration rate (E, mmol m−2 s−1) were measured in one mature sunny leaf per replication (n = 4), at around 10:00 h solar time at mean values of ambient photosynthetic photon flux density (PPFD) ≈ 1200 μmolm−2 s−1 and near constant ambient CO2 concentration (Ca ≈ 400 μmol mol−1) obtained with a portable gas exchange system (LI-COR, LI-6400, Lincoln, NE, USA). Instantaneous water use efficiency (WUEi) was calculated as the ratio between ACO2 and E (μmol CO2 mmol−1 H2O).

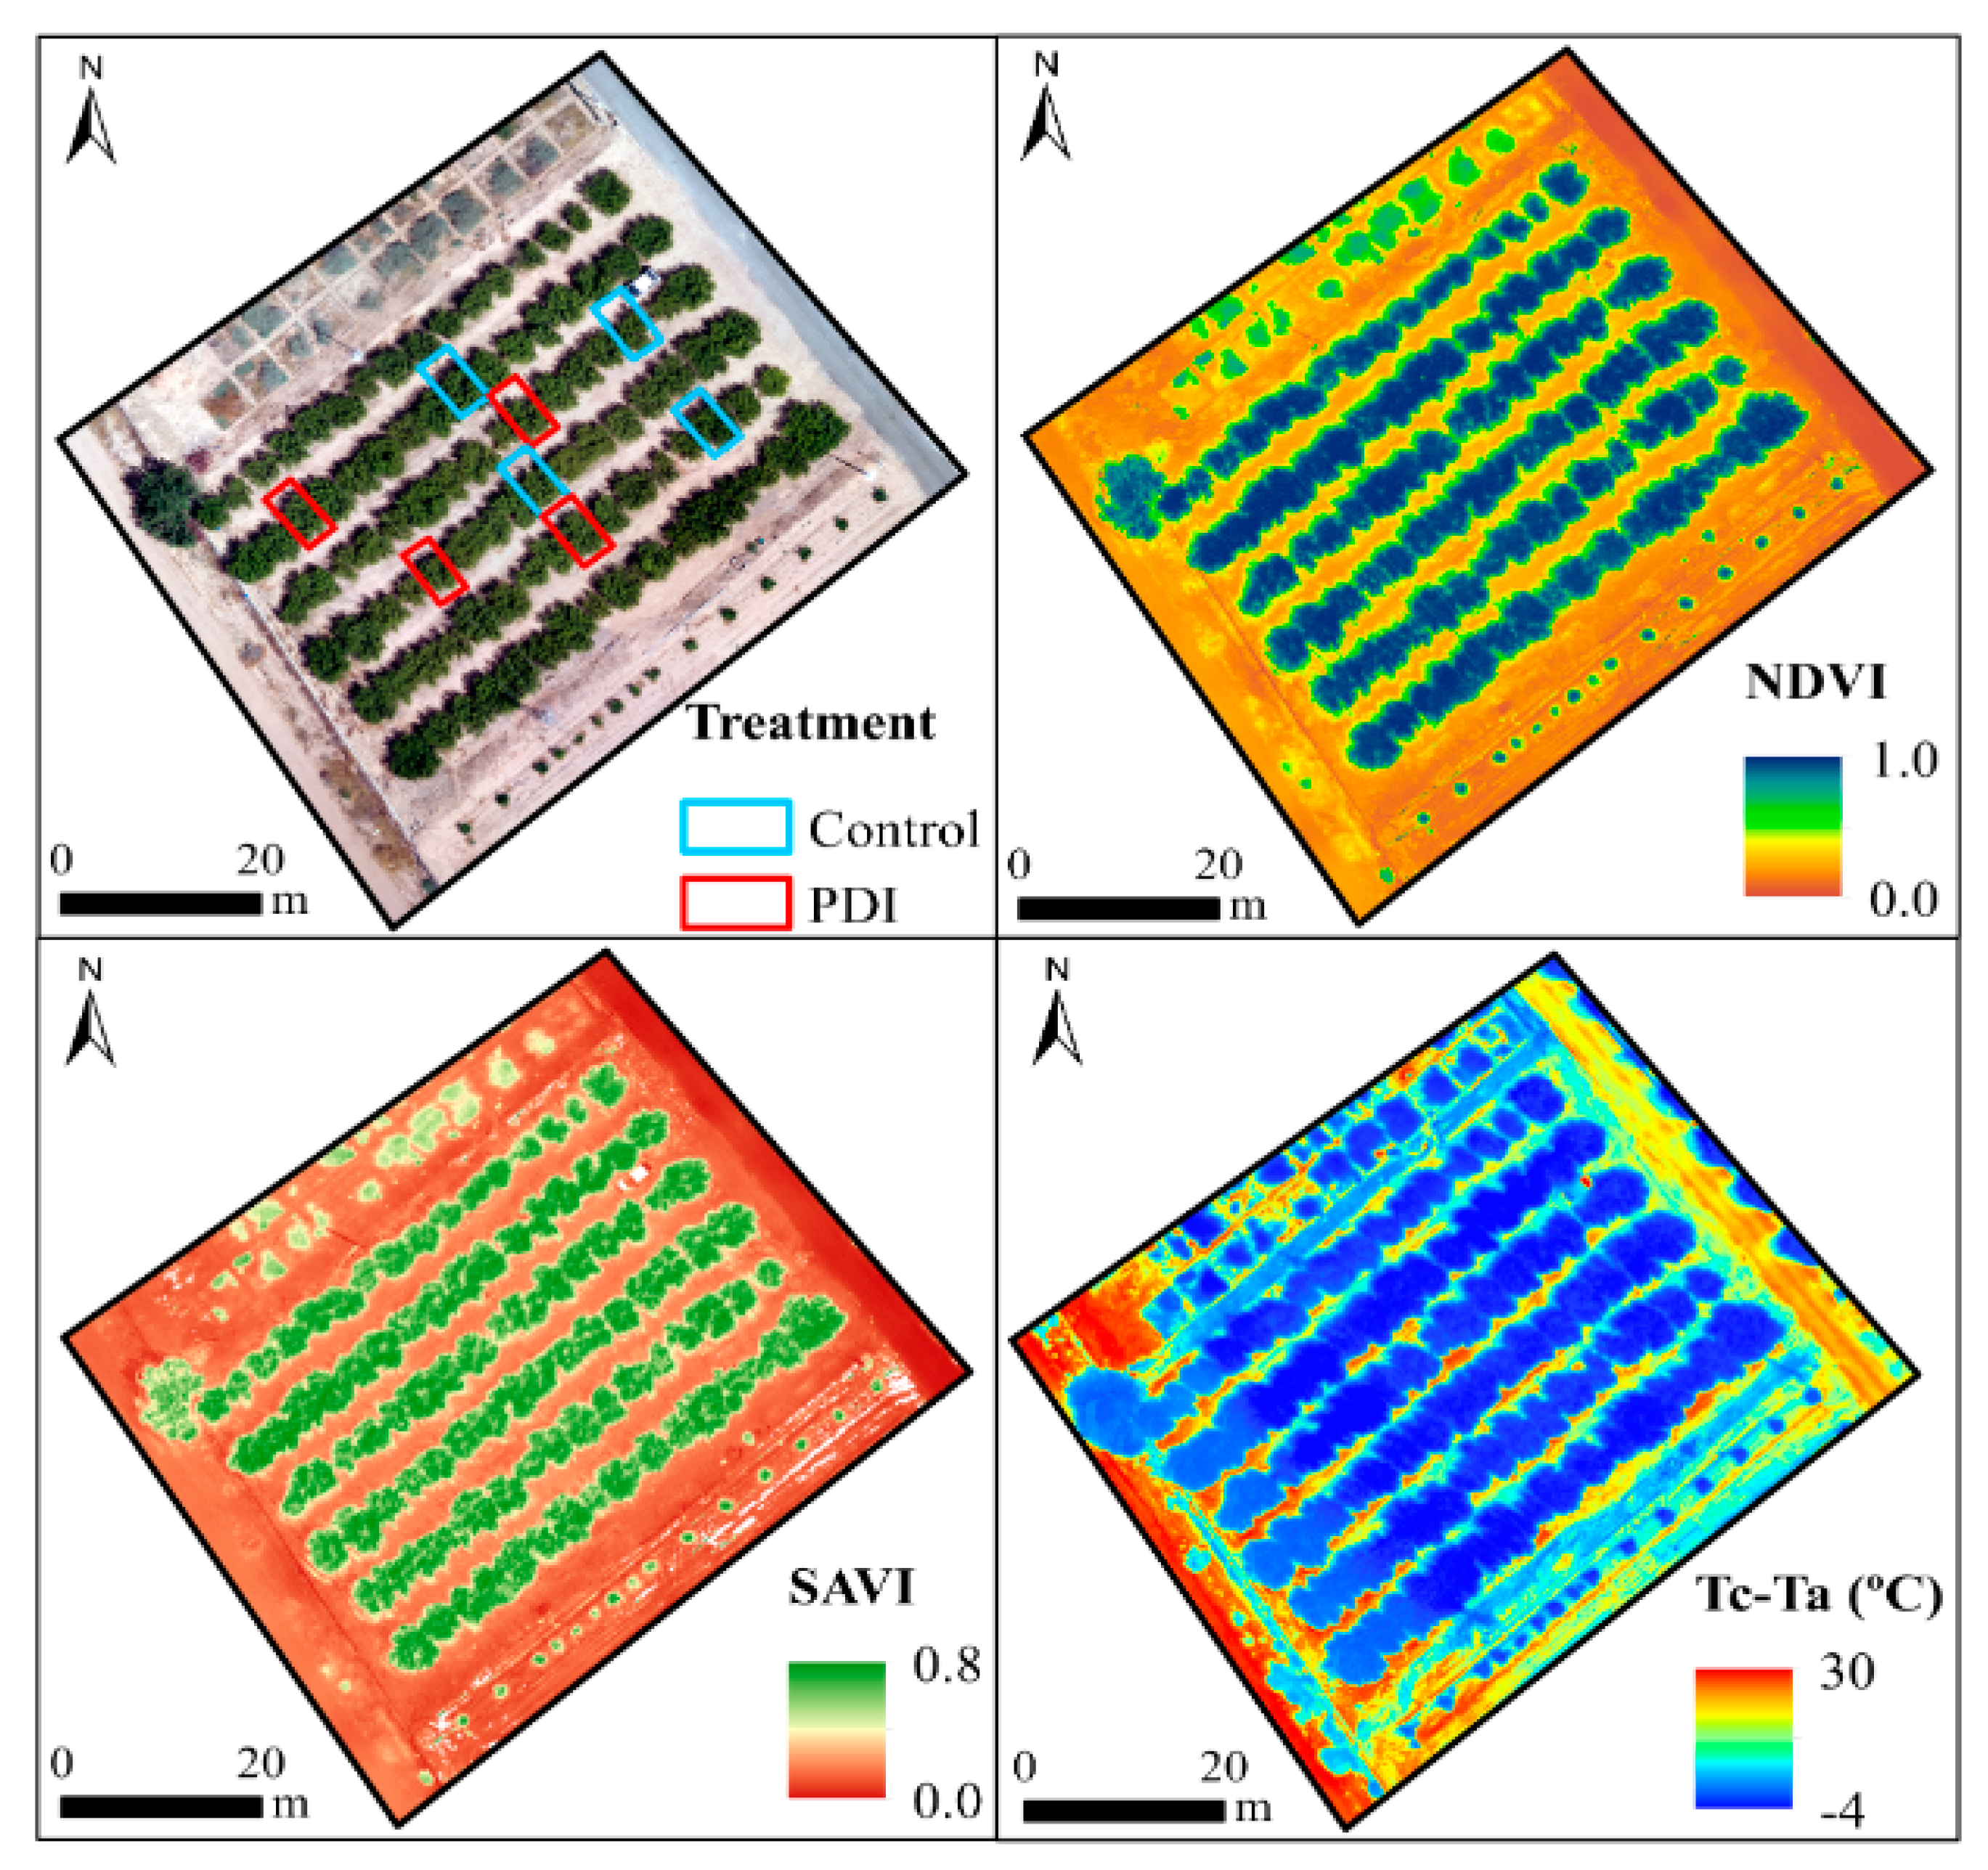
2.4. Airborne Campaign

A flight campaign was carried out by Drónica Servicios Aéreos, S.L.L., on 19 July 2017 using a VIS-NIR multispectral and thermal camera installed in an UAV (DJI S900 model). Two flights were conducted at approximately 120 m of altitude over the experimental plot: the first one at around 10:00 GMT (t1) and the second at 12:00 GMT (t2). For this study the autopilot was used, following the waypoints of a flight plan created using flight planner software (Pix4D). The UAV was equipped with a GPS receiver, altimeter, wind meter, and a digital camera that was electronically triggered by the autopilot system to acquire images at the correct positions. The multispectral camera used was a Parrot Sequoia+ (Parrot Co. Ltd., Paris, France), which measures 59 mm × 41 mm × 28 mm, weights 72 g and supports a 16-megapixel sensor RGB, and captures images in the green (G, 550 nm), red (R, 660 nm), red edge (RE, 735 nm), and near infrared (NIR, 790 nm) wavelengths. The sensor field of view, FOV, is 61.9° × 48.5° (H × V), resulting in images with a resolution of 1280 × 960 pixels of 5 cm spatial resolution.
The thermal camera used was a FLIR Tau2 (Tau 2 640, FLIR Systems, Wilsonville, OR, USA), which measures 29 mm × 29 mm × 19 mm, weighs 71 g, and has a resolution of 640 × 512 pixels. This is an uncooled long wave infrared Thermal Imager covering the 7.5–13.5 µm spectral range, with a pixel size of 17 µm. The FOV (H × V) is 32° × 26° (H × V), resulting in images with 5 cm pixel resolution.
The spectral data retrieved from the R and NIR domains were used to compute NDVI and SAVI as indicators of vegetation development using ArcGIS (v10.2; Esri, Redlands, CA, USA). NDVI is the ratio of the difference between NIR and R and the sum of these two bands [48], while SAVI includes an additional canopy background adjustment factor, L:
NDVI = (NIR − R)/(NIR + R)
SAVI = (1 + L) (NIR − R)/(NIR + R + L)
where NIR is reflectance in the NIR and R is reflectance in the visible red band.
When the L is close to 0, the value of SAVI is equal to NDVI. However, the L factor varies inversely with the amount of vegetation present to obtain the optimal adjustment for the soil effect. In this sense, a value of L = 0.5 was considered in this study to minimize the soil noise [28].
The NDVI and SAVI algorithms take advantage of the fact that green vegetation reflects less visible light and more NIR, while sparse or less green vegetation reflects a greater portion of the visible and less NIR. These indexes combine these reflectance characteristics in a ratio making them indexes related to photosynthetic capacity and vegetative growth. Generally, NDVI and SAVI values range between −1 and +1. Only positive values correspond to vegetated zones; the higher the index, the greater the chlorophyll content of the target.
The high spatial resolution of both multispectral and thermal data allowed the separation of non-leaf material and background soil from pure leaf material. Specifically, to extract the average canopy temperature (Tc) of each measurement, the acquired thermal images were processed following the recommendations of González-Dugo et al. [35] and adjusted for an emissivity value of 0.98, which is the whole plant emissivity value reported by Jones [14]. In all cases, the average temperature of several sun-exposed leaves involved checking the visible band.
Simultaneously with the two flights, Ψstem, ACO2, gs, and WUEi were determined (see Section 2.3). The maximum, minimum, and mean temperatures on the day of data collection, 19 July 2017, were 33 °C, 22 °C, and 27 °C, respectively, with no rainfall occurring in the previous weeks. Furthermore, the ET0, mean relative humidity (RH) and the wind speed at 2 m of the same day were 5 mm, 67%, and 4.6 km h−1, respectively.

2.5. Vegetative Growth, Yield, and Fruit Quality

Trunk diameter was measured before harvest with a forest caliper instrument (Codimex-C 100 cm, Canada) on four trees per replicate (n = 16 trees per treatment) at a marked location about 0.3 m from the soil surface. Trunk cross-sectional area (TCSA) was estimated as being equivalent of a circle. Pruning dry mass was determined during winter dormancy in four trees per replicate (n = 16 trees per treatment). Canopy tree cover was estimated in summer with zenithal images analyzed following the procedure indicated in Conesa et al. [11].
Commercial yield at harvest (30 April, 2018) was evaluated in four trees per replicate (n = 16 trees per treatment), weighing and counting the total number of fruits per tree. Fruits affected by cracking were previously removed and were not considered in the study. Average fruit mass was calculated from total mass and number of fruits per tree. Nectarine size distribution was separated in the field by manual calibration into 7 fruit diameter categories according to [49]. Crop load was determined as the ratio of the number of fruits to TCSA. Crop water use efficiency (WUE) was determined as the ratio between yield and the total amount of irrigation applied.
Equatorial fruit diameter was assessed at harvest in 20 fruits per replicate (n = 80 fruits per treatment). Skin color was measured in the same samples using a Minolta CR-10 colorimeter (Osaka, Japan) and the results were expressed in the CIE L*, a*, b* system, from which the skin Chroma [C* = (a*2 + b*2)½] and Hue angle [°hue = tan−1 (b*/a*)] were calculated. Total soluble solids content was evaluated in fruit juice, mixing 10 fruits per replicate (n = 40 fruits per treatment), using a digital refractometer (Atago ATC-1, Tokyo, Japan). Values were expressed as °Brix.

2.6. Sensitivity Analysis

Sensitivity analysis of the different plant water stress indicators was carried out using the method proposed by Goldhamer and Fereres [38], which uses the following equation:
S = SI/CV
where S is the sensitivity concept, SI is the signal intensity, and CV is “noise” or the coefficient of variation. SI was calculated as the ratio between the average values of the PDI and control treatments. S is always higher than 0: the higher the value, the greater the sensitivity.
Moreover, we used the corrected method (S*) described by de la Rosa et al. [39] as:
S* = (SI − 1)/CV.
In this case, an S* higher than 1 indicates sensitivity to water deficit, whereas if S* is = 0, there is no sensitivity. When S* is between 1 and 0, the results indicate that the noise is greater than the SI, meaning that there are no significant differences between the treatments studied. However, in some cases, S* might be lower than 0, indicating an anomalous behavior. As the authors [39] explained, this occurs when water stressed plants acquire values which are contrary to those expected.
All measurements were always taken in the same trees, so that variables relating to the sampling day and type and size of the sample did not interfere with the sensitivity study.

2.7. Statistical Analysis

The data were subjected to one-way analysis of variance (ANOVA) using the SPSS v 9.1 (IBM, Armonk, NY, USA) to discriminate between irrigation treatments. Statistical comparisons were considered significant at p ≤ 0.05. The degree of agreement of the regressions among variables was evaluated through the coefficient of determination (r2) and the mean square error (MSE).

3. Results and Discussion

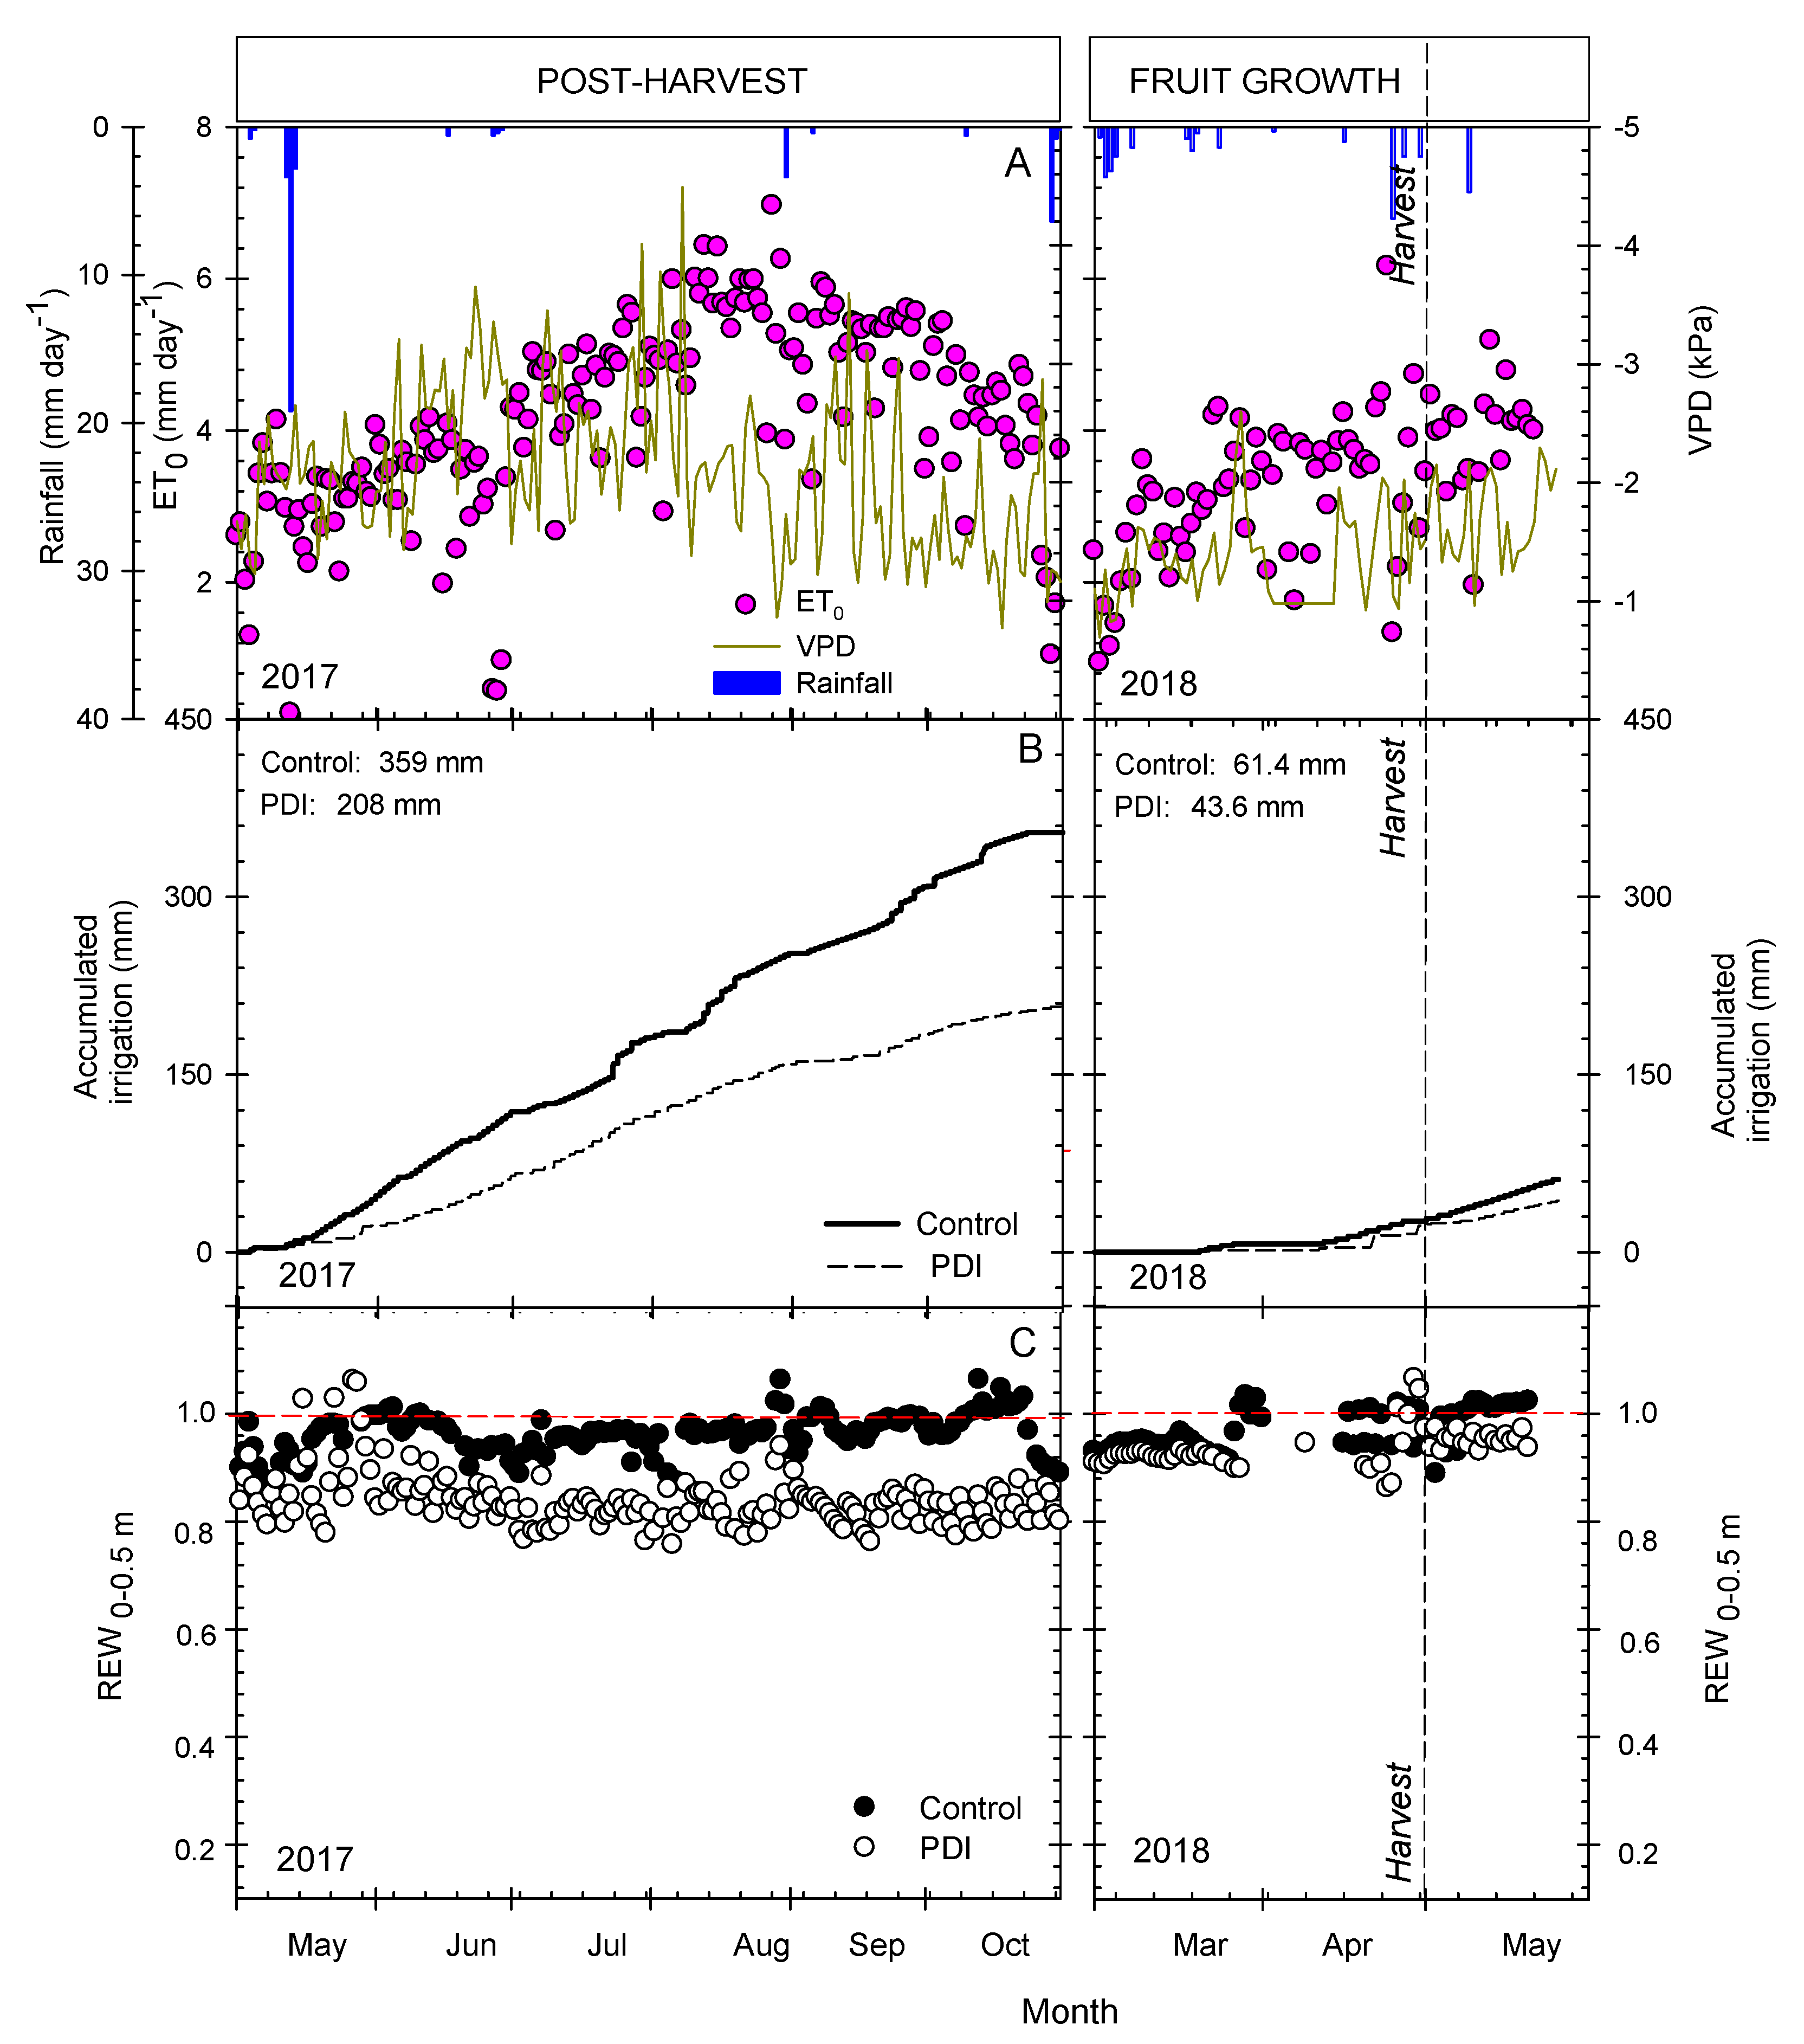
3.1. Environmental Conditions and Irrigation Applied

Environmental conditions were typical for Mediterranean regions characterized by hot dry summers and mild wet winters, high evaporative demand, and low rainfall. During the study period (postharvest 2017 and fruit growth 2018) rainfall was 71 mm and the ET0 was 1068 mm. Vapor pressure deficit (VPD) reached daily mean values of −2.2 and −1.6 kPa during postharvest and fruit growth periods, respectively (Figure 2A). Considering the ten year-seasonal average rainfall and ET0 were 250 mm and 1320 mm, respectively [50].
The annual amounts of water applied in the growing season (2017/2018), measured by the in-line water meters were 420.4 mm and 251.6 mm for the control and PDI treatments, respectively, meaning that the soil deficit imposed in the PDI treatment represented a mean water reduction of about 40% (Figure 2B).

3.2. Seasonal Evolution of Terrestrial Soil and Plant Water-Status Indicators

The mean θv in the control treatment was almost constant in the top 0–0.5 m of soil, with values close to that corresponding to the field capacity (290 mm m−1) during the 2017/2018 growing season (data not shown). De la Rosa et al. [5] found similar θv values (≈ 300 mm m−1) in full-watered early-maturing nectarine trees also cultivated in clay-loam soils. Therefore, control trees maintained REW0–0.5 m values close to unity throughout the irrigation season, with a mean seasonal value of 0.98, while the PDI treatment showed a mean reduction in REW0–0.5m of up to 15% during the postharvest period and 4% during fruit growth (Figure 2C).
A non-flat pattern of the Ψstem in both irrigation treatments reflected the climatic demand (Figure 2A), with decreasing values from May onwards. In control trees, mean Ψstem was −0.82 MPa (Figure 3A), which is characteristic of well-watered nectarine trees [3,51,52], whereas in the PDI treatment Ψstem values were on average 0.25 MPa lower with respect to control trees, this difference being statistically significant from mid-July onwards. A minimum Ψstem value of −1.7 MPa was reached in September in the PDI treatment (Figure 3A). Girona et al. [13] and Naor et al. [51] established threshold Ψstem values of −1.5 MPa to ensure no impairment of bloom fertility and −2.0 MPa to limit the occurrence of double fruits for peach trees. A short- mild water deficit (Ψstem = −1.25 MPa) before harvest might have negatively affected mid-maturing nectarine fruit size and yield [52].
The time course evolution of the gas exchange parameters was affected by the soil water deficit imposed in the PDI treatment (Figure 3B–D). ACO2 and gs values followed similar trends, with a significant decrease compared with the control treatment from August to the end of the postharvest period. ACO2 and gs patterns in the control treatment averaged seasonal values of 18 µmol m−2 s−1 and 263 mmol m−2 s−1, respectively, while the water deficit imposed in the PDI treatment pointed to a mean reduction with respect to the control of 12% (ACO2) and 18% (gs), respectively (Figure 3B,C). Maximum values of were noted during fruit growth period followed by a gradual decrease as the season progressed (Figure 3), which could be ascribed to the feedback effect of the fruits on leaf photosynthesis [53,54]. Some studies have indicated that a mild soil water deficit in the postharvest increases the sensitivity of leaf gas exchange parameters to environmental conditions [55]. Furthermore, the dynamics of Ψstem (Figure 3A) were related with the photosynthetic activity of the early-maturing nectarine trees, which could be particularly useful to identify the critical stages of the crop and the threshold depletion values for starting irrigation [56]. WUEi did not exhibit significant differences between irrigation treatments (Figure 3D), as also found by Conesa et al. [57] in deficit irrigated table grapes, despite the fact that water shortage usually increases transpiration efficiency [58].
Similar values for these terrestrial plant water status indicators were reported by Marsal and Girona [59] and Flexas et al. [60] in peach trees, where stomatal conductance was considered as a particularly suitable plant water stress indicator. Moreover, Shackel at al. [61] found that at a Ψstem value of about −1.5 MPa, the decrease in leaf gas exchange might be compensated by a reduction in the growth rate of the vegetative apexes, which are the major users of carbohydrates during the postharvest. In fact, in early-maturing nectarine trees, Conesa et al. [11] observed an improvement in the plant water status after removal of the water sprouts.

3.3. Vegetative Growth, Yield, and Fruit Quality

There were no significant differences between the control and PDI treatments as regards to the yield components studied (yield, n° fruits, fruit mass, and crop load efficiency). Moreover, the crop WUE was similar for both irrigation treatments (Table 1). The rainfall events that occurred during the fruit growth period (Figure 2B) increased the fruit cracking, which was slightly higher in the PDI treatment (Table 1). In this respect, Galindo et al. [62] reported that rainfall intensified fruit peel cracking in water stressed pomegranate trees, the result of an asymmetric increase in fruit turgor pressure because aril turgor increased to a much greater extent than peel turgor, favoring cracking.
It should be noted that nectarine yields were lower than those reported by de la Rosa et al. [5], probably due to the differences in crop management practices (e.g., fruit thinning). Furthermore, the PDI treatment did not increase the crop WUE despite providing 40% less water than the control (Figure 2B and Table 1), which might be explained by the low number of commercial-sized fruits per tree, due to the higher incidence of cracking in the PDI treatment (Table 1). Previous studies on deficit irrigation applied during postharvest pointed to a decrease in peach yield in the following year as a result of fewer fruits per tree, while fruit size remained relatively unchanged in an early-maturing peach [4] and nectarine [51] trees.
In our study, the soil water deficit imposed in the PDI treatment did not affect the vegetative components studied (pruning, canopy tree cover, and TCSA) (Table 1), as also reported by de la Rosa et al. [10]. However, a reduction in tree size was noted in peach trees submitted to severe water deficits [13].
In terms of fruit quality, only skin Chroma significantly increased in the PDI treatment, indicating the lower red coloration compared with control fruits. Alcobendas et al. [63], in early-maturing peach fruits, emphasized that greater exposure to sunlight is able to compensate the possible negative effects of the fruit position on the tree when submitted to DI strategies.

3.4. Remote and Terrestrial Plant-Water-Status Indicators

Figure 4 shows the mean values of the remote (NDVI, SAVI, Tc, and Tc-Ta) and terrestrial plant water status indicators (Ψstem, ACO2, gs, and WUEi) measured by the t1 (10:00 GTM) and t2 (12:00 GTM) flights. An illustration of the indexes derived from the UAV imagery at t2 (NDVI, SAVI, Tc-Ta) and the sampled trees for terrestrial indicators is shown in Figure 5. Pure vegetation NDVI values ranged from 0.76 to 0.93 and from 0.73 to 0.91, at t1 and t2, respectively, whereas lower values were obtained for the SAVI index, which varied between 0.40–0.91 (t1); and 0.36–0.64 (t2). As regards to the Tc and Tc-Ta values, they were closely dependent on the flight time, with lower mean values at t1 (Tc ≈ 23.5 °C; Tc-Ta ≈ −4 °C) than at t2 (Tc ≈ 32.4 °C; Tc-Ta ≈ 0–2 °C). However, neither remote plant water status indicator identified significant differences between the control and PDI treatments, with p values of 0.25/0.26, 0.07/0.42, 0.47/0.15, and 0.47/0.14 for NDVI, SAVI, Tc, and Tc-Ta, at t1/t2, respectively.
Canopy architecture, including leaf angle distribution and leaf area density, could also explain the variability observed in NDVI, SAVI, and Tc-Ta among the different treatments [64,65]. However, the methodology followed in this work to discriminate between vegetated and soil surfaces (see Section 2.4) minimized the effect that open-center canopies could have been influenced these variables, since the non-vegetated areas inside the tree crown were removed from the analysis.
Ψstem at both t1 and t2 flight times was the only plant water status indicator (considering both remote and terrestrial) that detected significant differences between irrigation treatments, with mean Ψstem values of −0.74 and −1.01 MPa, for control and PDI treatments, respectively, at t1, and −0.88 and −1.34 MPa for control and PDI treatments, at t2. In this respect, it is important to note that the use of Ψstem for scheduling deficit irrigation strategies has been widely used in many deciduous crops such as nectarine [5] and peach [66]. These authors reported the feasibility of using Ψstem as the plant water status indicator, not only for its robustness but also for its stability in successive growing seasons. Moreover, a model based on soil water content and meteorological variables that provides information on plant water status has been proposed as a guide for irrigation scheduling of early-maturing peach trees under Mediterranean conditions [67].
Similar to the remote plant water status indicators, the leaf gas exchange indicators (ACO2, gs, and WUEi), did not reflect significant differences between the two irrigation treatments (Figure 4F–H). This fact could be due to the anisohydric behavior of nectarine trees, which tolerate soil drought and responds to a decrease in water availability by tissue dehydration [68]. Indeed, anisohydric plants have more variable leaf water potentials and maintain their stomata open longer periods, accompanied by high photosynthetic rates, even in the presence of decreasing leaf water potentials or increasing atmospheric water demands [69]. This also agrees with the gs versus Tc-Ta relationship found in Citrus, where Tc-Ta did not vary when gs was greater than a mean value of 200 mmol m−2 s−1 [70]. Therefore, the moderate plant water stress induced by the PDI treatment caused a Ψstem reduction (0.27 MPa at t1 and 0.46 MPa at t2) while maintaining gs values almost constant. This would also explain why, according to the average gs range observed in the PDI treatment (210 and 180 mmol m−2 s−1 at t1 and t2, respectively), no differences were observed between treatments when the Tc-Ta indicator was used (Figure 4D,G).

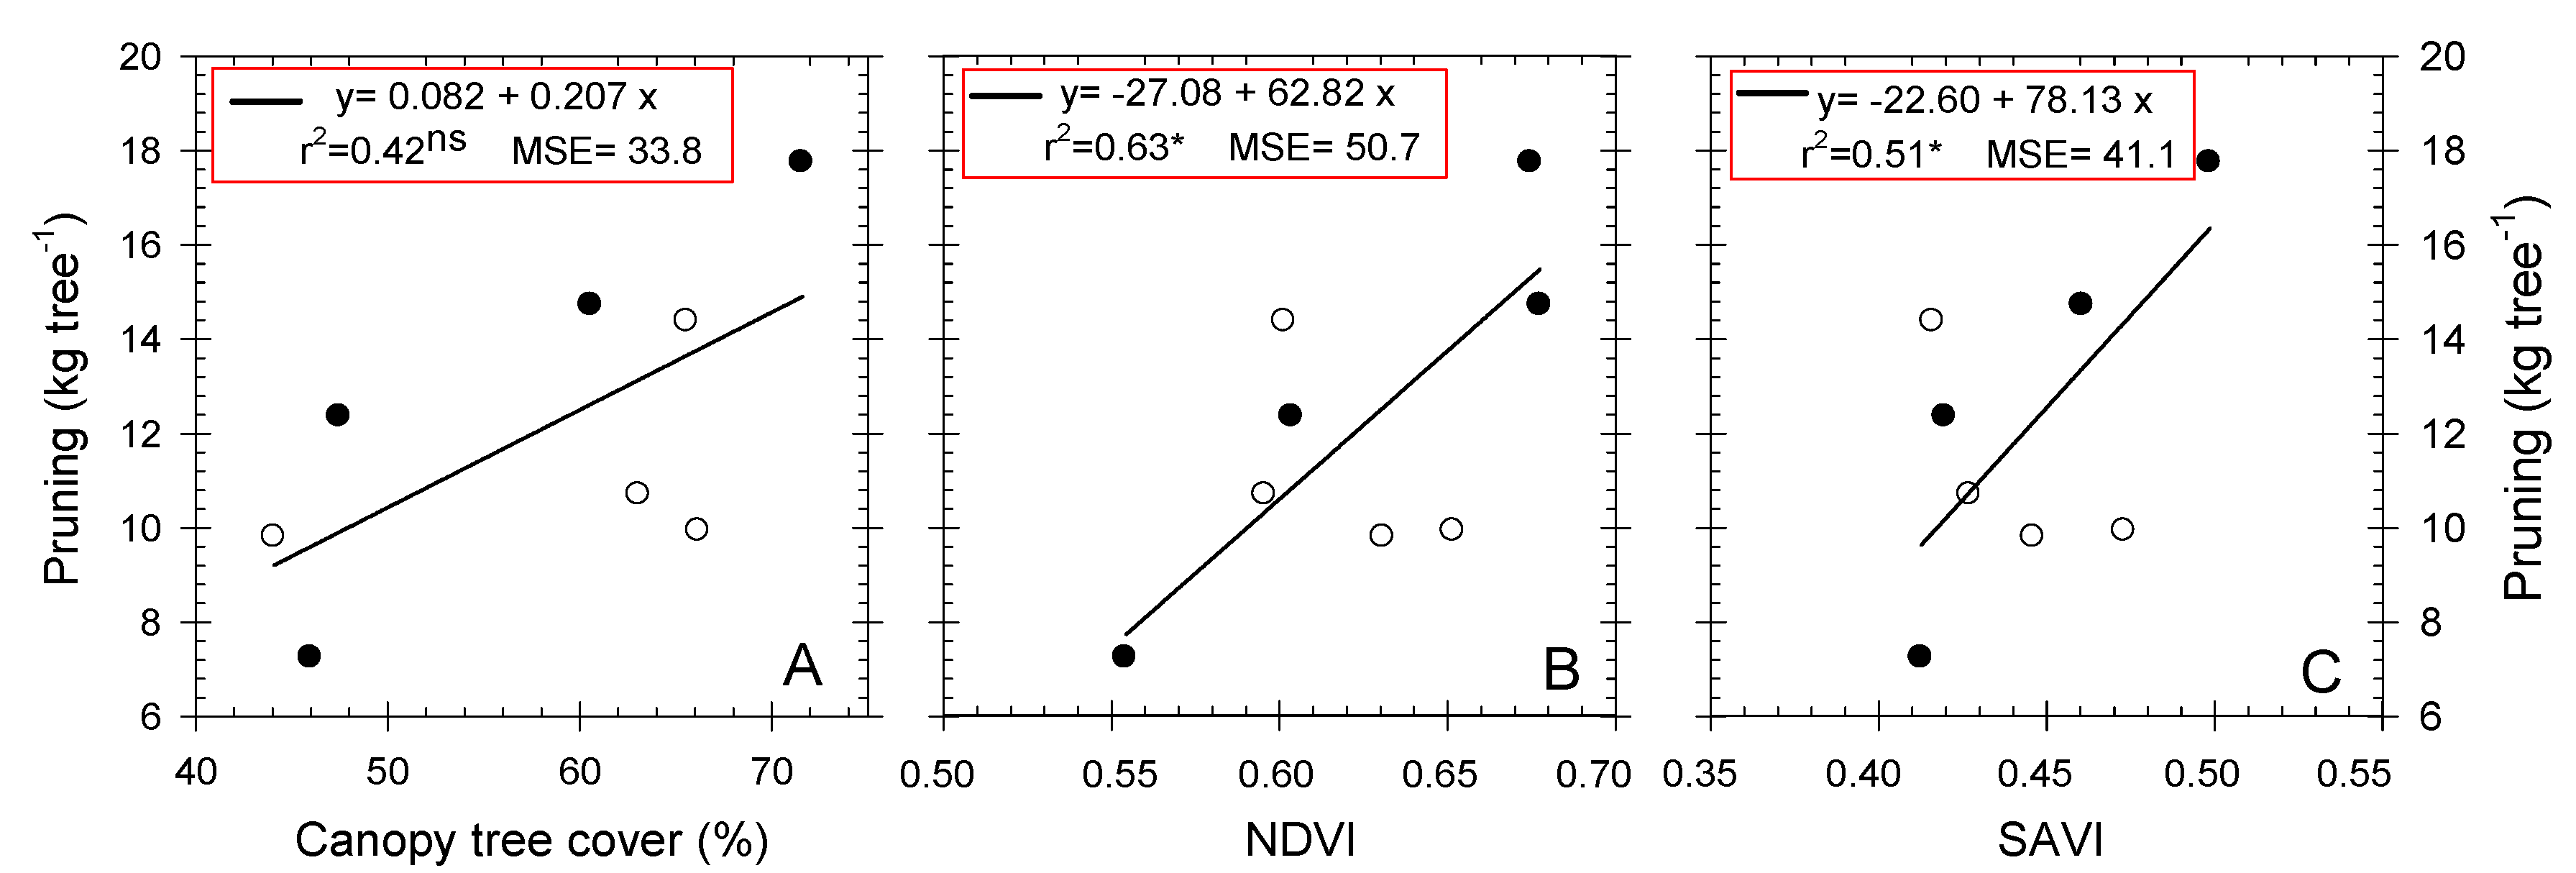
3.5. Role of NDVI, SAVI, and Tc-Ta indexes

One direct use of NDVI and SAVI is to characterize canopy growth and tree vigor [48,71,72], and so these indexes can be good estimators of pruning needs. However, it is well known that the lack of correlation between NDVI and vegetative growth could be due to soil water distribution and soil surface anisotropy, as well as the angular geometry of illumination at the time of the measurements [73]. Rondeaux et al. [74] reported that NDVI was sensitive to soil background noise and concluded that it is difficult to interpret when the vegetation cover is low. For this reason, a relationship between pruning and canopy tree cover (Figure 6A) and NDVI and SAVI (Figure 6B,C) was drawn with data referring to the entire planting framework (6.5 m × 3.5 m) rather than considering only pure vegetation.
The results indicated that canopy tree cover and the vegetation indexes (NDVI and SAVI) were related to changes observed in the pruning removed in the control and PDI treatments. When data were pooled, all of them showed a linear relationship with pruning weight, with a coefficient of determination (r2) of 0.42, 0.63, and 0.51 for canopy tree cover, NDVI, and SAVI, respectively. Dobrowski et al. [75] found in vineyards that NDVI was linearly correlated with field-wide measurements of pruning weight density. Hogrefe et al. [76] found a strong curvilinear relationship between NDVI and the biomass—the more biomass observed, the higher the NDVI value.
One indirect use of NDVI and SAVI is to detect plant water stress situations. Indeed, both remote indexes have shown positive correlations with Ψstem and gs in several crops [33]. Nevertheless, as can be seen in Figure 4A,B, neither NDVI nor SAVI identified significant differences between the control and PDI treatments. When both remote indexes were related with Ψstem, the linear relationship showed a poor coefficient of determination (r2 = 0.27, p ≤ 0.05, and r2 = 0.22 ns) (Figure 7A,C).
The lack of correlation between NDVI and SAVI with Ψstem at t1 and t2 flight times might be related to the moderate soil water deficit induced by PDI treatment based on real-time SWC. Although the PDI treatment was able to promote a noticeable water saving (about 40%) with respect to the control treatment without affecting the yield components studied (Table 1), the SWC thresholds imposed were not sufficient to promote significant differences between the treatments in the structural remote indexes (NDVI and SAVI). Thus, in order to ascertain water stress conditions using NDVI and SAVI it would be necessary to apply more severe and longer periods of water stress.
The relationship between Ψstem and Tc-Ta explained the 56% of the variations observed (Figure 7E), which suggests that Tc-Ta describes the response to water stress better than the leaf structural changes assessed by NDVI and SAVI indexes. Therefore, the spectral VIS-NIR images were not as sensitive to water deficits as those derived from canopy temperature [36,77].
In our study, the Tc-Ta behavior coincided with that observed for gs both at t1 and t2 (Figure 4D,G) since the major determinant of leaf temperature is the rate of evaporation or transpiration from the leaf [36]; thus, as plants transpire, the temperature of the leaves did not increase as usually happens under drought conditions [21]. However, it is also known that the variability of Tc in deciduous trees is different from that observed in annual crops, which mainly results from the heterogeneity of soil properties and the lack of irrigation uniformity when using UAV thermal cameras [78]. Also, the heterogeneity of the Tc in moderate water stress conditions was explained by González-Dugo et al. [65,79] as being due to the onset of stress in a few areas within the crown with substantial stomatal closure, while in the rest of the crown the stomata could still be open.
Camino et al. [80] pointed to the importance of using high resolution hyperspectral and thermal imagery for pure-object segmentation extraction from tree crowns in order to ascertain water stress situations. In this sense, Bellvert et al. [18] recommended an optimum pixel size to detect water stress in peach and nectarine orchards that ranged from 0.6 to 0.8 m in images taken from UAV.
Interestingly, when the mean VPD value registered at t1 (−0.98 kPa) and t2 (−2.96 kPa) was included in the independent term, along with the Ψstem, as a two-variable function of the relationship with NDVI (Figure 7B), SAVI (Figure 7D), and Tc-Ta (Figure 7F), the coefficient of determination (r2) improved considerably in this order: Tc-Ta > SAVI > NDVI. As VPD integrates Ta and RH, it is a sensitive agro-meteorological variable for correlating with Ψstem [43]. In peach trees, Abrisqueta et al. [81] proposed an alternative to the field measurement of Ψstem, using a multiple linear regression equation based on SWC, mean VPD, and growing degree hours (GDH) values. These authors reported that the contribution of the soil and atmosphere components to Ψstem differed according to the intensity of the water deficit imposed in each irrigation treatment. Blanco et al. [82] also proposed a multiple linear regression equation based on average soil water tension and mean VPD for estimating Ψstem in sweet cherry trees.

3.6. Sensitivity of Remote and Terrestrial Plant Water Status Indicators

The sensitivity analysis at t1 and t2 flight times showed that Ψstem was the plant water status indicator with the highest signal intensity (SI) followed by Tc and Tc-Ta (Table 2). Indeed, Tc-Ta registered the highest SI values of the remote sensing indicators studied. Although NDVI had lower signal intensity than Ψstem, its sensitivity values (S) were much higher due to the low CV (0.99% and 1.10% at t1 and t2, respectively). Blanco et al. [82], in sweet cherry trees, reported the high sensitivity of the soil matric potential (Ψm) despite the high CV. In our case, the variability observed in NDVI, SAVI, and Tc-Ta values may have been mediated by the environmental conditions, underlining the importance of considering VPD along with the plant water status (Figure 7B,D,F). For this reason, the S* method [39], which diminished the influence of CV in the analysis, showed the strongest sensitivity for Ψstem, followed by Tc-Ta at both flight times (Table 2).

4. Conclusions

The current work showed that in early-maturing nectarine trees submitted to moderate deficit irrigation, Ψstem is a valuable robust indicator for detecting water stress; however, it needs to be considered together with VPD for comparison with remote sensing data to reveal spatial patterns of water stress. The described relationship was able to predict remote sensing indicators when they were not available at the time of Ψstem acquisition. Therefore, Ψstem is still a powerful indicator of the water status of the plant, which must be taken into account to adjust the adequate soil water depletion at each phenological period to apply the precise water needs. Furthermore, Ψstem followed by Tc-Ta registered the highest signal intensity for detecting water deficit situations. NDVI and SAVI assessed in the postharvest period were seen to be good indicators for estimating the winter pruning needs. However, they were not able to identify significant differences between control and PDI treatments, since these multispectral indexes respond less strongly to water stress than Tc-Ta. These results suggest that care should be taken when NDVI and SAVI are used to assess moderate water deficits in early-maturing nectarine trees. More severe and/or longer water stress conditions of stress are probably needed. Whatever the case, precise deficit irrigation based on SWC used 40% less total irrigation volume than a traditionally scheduled treatment with no penalty in yield of early-maturing nectarine trees. This suggests that the use of real-time threshold SWC values could be a promising irrigation strategy in clay-loam soils in Mediterranean areas endangered by climate change.

Author Contributions

M.C.R.-S. and M.R.C. conceived and designed the conceptual framework of the study. W.C., M.C.R.-S. and J.V. performed the field experiment and acquired data. M.R.C. analyzed and interpreted the results, made the figures and tables, and wrote the original draft paper. W.C. and J.M.R.-C. worked on the UAV image analysis. J.M.R.-C. revised the discussion about remote sensing. M.C.R.-S. supervised the work and led the projects’ administration. All authors revised and approved the final manuscript.

Funding

This study was supported by Spanish Research Agency co-financed with European Union FEDER funds (AEI/FEDER, UE, AGL2016-77282-C3-1R) and Seneca Foundation of Region of Murcia (19903/GERM/15) projects.

Acknowledgments

M.R. Conesa acknowledges the postdoctoral financial support received from Juan de la Cierva Spanish Postdoctoral Program (FJCI-2017-32045). J.M. Ramírez-Cuesta thanks the collaborative international consortium IRIDA financed under the ERA-NET Cofund Water-Works 2014 Call with Spanish national funds from the Agencia Estatal de Investigación grant PCIN-2015-263. This ERA-NET is an integral part of the 2015 Joint Activities developed by the Water Challenges for a Changing World Joint Program Initiative (Water JPI) JPIWaterWaterWorks 2014.

Conflicts of Interest

The authors declare no conflict of interest.

References

  1. United Nations Education Scientific and Cultural Organization (UNESCO). Understanding the pressure of water (Part 1). In Water in a Changing World; The United Nations World Water Development, Ed.; UNESCO Publishing: Paris, France, 2019; pp. 29–75. ISBN 978-9-23104-095-5. [Google Scholar]
  2. Chai, Q.; Gan, Y.; Zhao, C.; Xu, H.L.; Waskom, R.M.; Niu, Y.; Siddique, K.H.M. Regulated deficit irrigation for crop production under drought stress: A review. Agron. Sustain. Dev. 2016, 36, 3. [Google Scholar] [CrossRef]
  3. Vera, J.; Conejero, W.; Conesa, M.R.; Ruiz-Sánchez, M.C. Irrigation Factor Approach Based on Soil Water Content: A Nectarine Orchard Case Study. Water 2019, 11, 589. [Google Scholar] [CrossRef]
  4. Vera, J.; Abrisqueta, I.; Abrisqueta, J.M.; Ruiz-Sánchez, M.C. Effect of deficit irrigation on early-maturing peach tree performance. Irrig. Sci. 2013, 31, 747–757. [Google Scholar] [CrossRef]
  5. De La Rosa, J.; Domingo, R.; Gómez-Montiel, J.; Pastor, A.P. Implementing deficit irrigation scheduling through plant water stress indicators in early nectarine trees. Agric. Water Manag. 2015, 152, 207–216. [Google Scholar] [CrossRef]
  6. Ruiz-Sánchez, M.C.; Abrisqueta, I.; Conejero, W.; Vera, J. Deficit Irrigation Management in Early-Maturing Peach Crop. In Water Scarcity and Sustainable Agriculture in Semiarid Environment; Elsevier BV: Amsterdam, The Netherlands, 2018; pp. 111–129. [Google Scholar]
  7. Abrisqueta, I.; Abrisqueta, J.; Tapia, L.; Munguía, J.; Conejero, W.; Vera, J.; Ruiz-Sánchez, M. Basal crop coefficients for early-season peach trees. Agric. Water Manag. 2013, 121, 158–163. [Google Scholar] [CrossRef]
  8. Ruiz-Sánchez, M.C.; Domingo, R.; Castel, J.R. Review. Deficit irrigation in fruit trees and vines in Spain. Span. J. Agric. Res. 2010, 8, 5. [Google Scholar] [CrossRef]
  9. Lopez, G.; Mata, M.; Arbones, A.; Solans, J.R.; Girona, J.; Marsal, J. Mitigation of effects of extreme drought during stage III of peach fruit development by summer pruning and fruit thinning. Tree Physiol. 2006, 26, 469–477. [Google Scholar] [CrossRef] [Green Version]
  10. De La Rosa, J.; Domingo, R.; Aguayo, E.; Falagan, N.; Pérez-Pastor, A.; Conesa, M. Combined effects of deficit irrigation and crop level on early nectarine trees. Agric. Water Manag. 2016, 170, 120–132. [Google Scholar] [CrossRef] [Green Version]
  11. Conesa, M.; Martínez-López, L.; Conejero, W.; Vera, J.; Ruiz-Sánchez, M. Summer pruning of early-maturing Prunus persica: Water implications. Sci. Hortic. 2019, 256, 108539. [Google Scholar] [CrossRef]
  12. Bhusal, N.; Han, S.G.; Yoon, T.M. Impact of drought stress on photosynthetic response, leaf water potential, and stem sap flow in two cultivars of bi-leader apple trees (Malus × domestica Borkh.). Sci. Hortic. 2019, 246, 535–543. [Google Scholar] [CrossRef]
  13. Girona, J.; Gelly, M.; Mata, M.; Arbones, A.; Rufat, J.; Marsal, J. Peach tree response to single and combined deficit irrigation regimes in deep soils. Agric. Water Manag. 2005, 72, 97–108. [Google Scholar] [CrossRef]
  14. Jones, H.G. Irrigation scheduling: Advantages and pitfalls of plant-based methods. J. Exp. Bot. 2004, 55, 2427–2436. [Google Scholar] [CrossRef]
  15. Naor, A. Irrigation Scheduling and Evaluation of Tree Water Status in Deciduous Orchards. Hortic. Rev. 2010, 32, 111–165. [Google Scholar]
  16. Scholander, P.F.; Bradstreet, E.D.; Hemmingsen, E.A.; Hammel, H.T. Sap Pressure in Vascular Plants: Negative hydrostatic pressure can be measured in plants. Science 1965, 148, 339–346. [Google Scholar] [CrossRef]
  17. Naor, A.; Cohen, S. Sensitivity and variability of maximum trunk shrinkage, midday stem water potential and transpiration rate in response to withholding irrigation from weld grown apple trees. HortScience 2003, 38, 547–551. [Google Scholar] [CrossRef]
  18. Bellvert, J.; Marsal, J.; Girona, J.; González-Dugo, V.; Fereres, E.; Ustin, S.L.; Zarco-Tejada, P.J. Airborne Thermal Imagery to Detect the Seasonal Evolution of Crop Water Status in Peach, Nectarine and Saturn Peach Orchards. Remote Sens. 2016, 8, 39. [Google Scholar] [CrossRef]
  19. Ramírez-Cuesta, J.M.; Mirás-Avalos, J.M.; Rubio-Asensio, J.S.; Intrigliolo, D.S. A novel ArcGIS toolbox for estimating crop water demands by integrating the dual crop coefficient approach with multi-satellite imagery. Water 2019, 11, 38. [Google Scholar] [CrossRef]
  20. Park, S.; Ryu, D.; Fuentes, S.; Chung, H.; Hernández-Montes, E.; O’Connell, M. Adaptative estimation of crop water stress in nectarine and peach orchards using high-resolution imagery from an Unmmanned Aerial Vehicle (UAV). Remote Sens. 2017, 9, 828. [Google Scholar] [CrossRef]
  21. Egea, G.; Padilla-Díaz, C.M.; Martinez-Guanter, J.; Fernández, J.E.; Pérez-Ruiz, M. Assessing a crop water stress index derived from aerial thermal imaging and infrared thermometry in super-high density olive orchards. Agric. Water Manag. 2017, 187, 210–221. [Google Scholar] [CrossRef] [Green Version]
  22. Idso, S.; Jackson, R.; Pinter, P.; Reginato, R.; Hatfield, J. Normalizing the stress-degree-day parameter for environmental variability. Agric. Meteorol. 1981, 24, 45–55. [Google Scholar] [CrossRef]
  23. Berni, J.; Zarco-Tejada, P.J.; Sepulcre-Cantó, G.; Fereres, E.; Villalobos, F.; Jimenez-Berni, J.A. Mapping canopy conductance and CWSI in olive orchards using high resolution thermal remote sensing imagery. Remote Sens. Environ. 2009, 113, 2380–2388. [Google Scholar] [CrossRef]
  24. Zarco-Tejada, P.J.; González-Dugo, V.; Williams, L.E.; Suárez, L.; Berni, J.A.J.; Goldhamer, D.; Fereres, E. A PRI-based water stress index combining structural and chlorophyll effects: Assessment using diurnal narrow-band air-borne imagery and the CWSI thermal index. Remote Sens. Environ. 2013, 138, 38–50. [Google Scholar] [CrossRef]
  25. Gonzalez-Dugo, V.; Zarco-Tejada, P.J.; Fereres, E. Applicability and limitations of using the crop water stress index as an indicator of water deficits in citrus orchards. Agric. For. Meteorol. 2014, 198, 94–104. [Google Scholar] [CrossRef]
  26. Rouse, J.W.; Hass, R.H.; Schell, J.A.; Deering, D.W. Monitoring vegetation systems in the Great Plains with ERTS. In Proceedings of the 3rd ERTS Symposium, College Station, TX, USA, 1 January 1974; pp. 309–317. [Google Scholar]
  27. Xue, J.; Su, B. Significant Remote Sensing Vegetation Indexes: A review of Developments and Applications. J. Sens. 2017, 2017, e1353691. [Google Scholar] [CrossRef]
  28. Huete, A.; Huete, A. A soil-adjusted vegetation index (SAVI). Remote Sens. Environ. 1988, 25, 295–309. [Google Scholar] [CrossRef]
  29. Viña, A.; Gitelson, A.A.; Nguy-Robertson, A.L.; Peng, Y. Comparison of different vegetation indices for the remote assessment of green leaf area index of crops. Remote Sens. Environ. 2011, 115, 3468–3478. [Google Scholar] [CrossRef]
  30. Stagakis, S.; Gonzalez-Dugo, V.; Cid, P.; Guillén-Climent, M.; Zarco-Tejada, P.J. Monitoring water stress and fruit quality in an orange orchard under regulated deficit irrigation using narrow-band structural and physiological remote sensing indices. ISPRS J. Photogramm. Remote Sens. 2012, 71, 47–61. [Google Scholar] [CrossRef] [Green Version]
  31. Romero-Trigueros, C.; Nortes, P.A.; Alarcón, J.J.; Hunink, J.E.; Parra, M.; Contreras, S.; Droogers, P.; Nicolás, E. Effects of saline reclaimed waters and deficit irrigation on Citrus physiology assessed by UAV remote sensing. Agric. Water Manag. 2017, 183, 60–69. [Google Scholar] [CrossRef] [Green Version]
  32. Vanella, D.; Ramírez-Cuesta, J.M.; Intrigliolo, D.S.; Consoli, S. Combining Electrical Resistivity Tomography and Satellite Images for Improving Evapotranspiration Estimates of Citrus Orchards. Remote Sens. 2019, 11, 373. [Google Scholar] [CrossRef]
  33. Gago, J.; Douthe, C.; Coopman, R.; Gallego, P.; Ribas-Carbo, M.; Flexas, J.; Escalona, J.; Medrano, H. UAVs challenge to assess water stress for sustainable agriculture. Agric. Water Manag. 2015, 153, 9–19. [Google Scholar] [CrossRef]
  34. Ramírez-Cuesta, J.M.; Allen, R.G.; Zarco-Tejada, P.J.; Kilic, A.; Santos, C.; Lorite, I.J. Impact of the spatial resolution on the energy balance components on an open-canopy olive orchard. Int. J. Appl. Earth Obs. Geoinf. 2019, 74, 88–102. [Google Scholar] [CrossRef]
  35. Gonzalez-Dugo, V.; Zarco-Tejada, P.J.; Nicolas, E.; Nortes, P.A.; Alarcón, J.J.; Intrigliolo, D.S.; Fereres, E. Using high resolution UAV thermal imagery to assess the variability in the water status of five fruit tree species within a commercial orchard. Precis. Agric. 2013, 14, 660–678. [Google Scholar] [CrossRef]
  36. Usha, K.; Singh, B. Potential applications of remote sensing in horticulture—A review. Sci. Hortic. 2013, 153, 71–83. [Google Scholar] [CrossRef]
  37. Ballester, C.; Zarco-Tejada, P.J.; Nicolás, E.; Alarcón, J.J.; Fereres, E.; Intrigliolo, D.S.; González-Dugo, V. Evaluating the performance of xanthophyll chlorophyll and structure-sensitive spectral indices to detect water stress in five fruit tree species. Precis. Agric. 2018, 19, 178–193. [Google Scholar] [CrossRef]
  38. Goldhamer, D.; Fereres, E. Irrigation scheduling protocols using continuously recorded trunk diameter measurements. Irrig. Sci. 2001, 20, 115–125. [Google Scholar] [CrossRef]
  39. De La Rosa, J.M.; Conesa, M.R.; Domingo, R.; Pérez-Pastor, A. A new approach to ascertain the sensitivity to water stress of different plant water indicators in extra-early nectarine trees. Sci. Hortic. 2014, 169, 147–153. [Google Scholar] [CrossRef]
  40. Allen, R.G.; Pereira, L.S.; Raes, D.; Smith, M. Crop Evapotranspiration: Guidelines for Computing Crop Water Requirements; Food and Agriculture Organization of the United Nations: Rome, Italy, 1998. [Google Scholar]
  41. Méndez, A.; Blaya, J.M.; López-Torres, F.J.; Rodriguez, E.; Conejero, W.; Vera, J.; Ruiz-Sánchez, M.C. Distribución de raíces de nectarino en distintas condiciones de riego. In Proceedings of the II Congreso IDIES, Murcia, Spain, 22 June 2015. [Google Scholar]
  42. Evett, S.R.; Tolk, J.A.; Howell, T.A. Soil Profile Water Content Determination. Vadose Zone J. 2006, 5, 894. [Google Scholar] [CrossRef]
  43. Abrisqueta, I.; Vera, J.; Tapia, L.; Abrisqueta, J.; Ruiz-Sánchez, M. Soil water content criteria for peach trees water stress detection during the postharvest period. Agric. Water Manag. 2012, 104, 62–67. [Google Scholar] [CrossRef]
  44. Abrisqueta, I.; Conejero, W.; López-Martínez, L.; Vera, J.; Sánchez, M.C.R. Root and aerial growth in early-maturing peach trees under two crop load treatments. Span. J. Agric. Res. 2017, 15, e0803. [Google Scholar] [CrossRef] [Green Version]
  45. Granier, A. Evaluation of transpiration in a Douglas-fir stand by means of sap flow measurements. Tree Physiol. 1987, 3, 309–320. [Google Scholar] [CrossRef]
  46. Hsiao, T.C. Measurement of plant water status. In Irrigation of Agricultural Crops. Agronomy Monograph No.30; Steward, B.A., Nielsen, D.R., Eds.; American Society of Agronomy: Madison, WI, USA, 1990; pp. 243–279. [Google Scholar]
  47. McCutchan, H.; Shackel, K. Stem-water Potential as a Sensitive Indicator of Water Stress in Prune Trees (Prunus domestica L. cv. French). J. Am. Soc. Hortic. Sci. 1992, 117, 607–611. [Google Scholar] [CrossRef]
  48. Rouse, J.W.; Haas, R.H.; Schell, J.A.; Deering, D.W.; Harlan, J.C. Monitoring the Vernal Advancement and Retrogradation (Greenwave Effect) of Natural Vegetation; NASA/GSFC Type II Final Report 371; Remote Sensing Center, Texas A&M University: College Station, TX, USA, 1973. [Google Scholar]
  49. European Union. Commission Regulation (EC) No 1221/2008 of 5 December, 2008. Amending Regulation (EC) No 1580/2007 laying down implementing rules of Council Regulations (EC) No 2200/96, (EC) No 2201/96 and (EC) No 1182/2007 in the fruit and vegetable sector as regards marketing standards. Off. J. Eur. Union. 2008, 51, 80. [Google Scholar]
  50. Agencia Española de Meteorología (AEMET). Available online: http://www.aemet.es/es (accessed on 18 June 2019).
  51. Naor, A.; Stern, R.; Peres, M.; Greenblat, Y.; Gal, Y.; Flaishman, M.A. Timing and Severity of Postharvest Water Stress Affect Following-year Productivity and Fruit Quality of Field-grown ‘Snow Queen’ Nectarine. J. Am. Soc. Hortic. Sci. 2005, 130, 806–812. [Google Scholar] [CrossRef]
  52. Lopez, G.; Echeverria, G.; Bellvert, J.; Mata, M.; Behboudian, M.H.; Girona, J.; Marsal, J. Water stress for a short period before harvest in nectarine: Yield, fruit composition, sensory quality, and consumer acceptance of fruit. Sci. Hortic. 2016, 211, 1–7. [Google Scholar] [CrossRef]
  53. Bhusal, N.; Bhusal, S.J.; Yoon, T.M. Comparisons of physiological and anatomical characteristics between two cultivars in bi-leader apple trees (Malus×domestica Borkh.). Sci. Hortic. 2018, 231, 73–81. [Google Scholar] [CrossRef]
  54. Pérez-Pastor, A.; Domingo, R.; Torrecillas, A.; Ruiz-Sánchez, M.C. Response of apricot trees to deficit irrigation strategies. Irrig. Sci. 2009, 27, 231–242. [Google Scholar] [CrossRef]
  55. Osório, M.L.; Breia, E.; Rodrigues, A.; Osório, J.; Roux, X.; Daudet, F.; Ferreira, I.; Chaves, M.M. Limitations to carbon assimilation by mild drought in nectarine trees growing under field conditions. Environ. Exp. Bot. 2006, 55, 235–247. [Google Scholar] [CrossRef]
  56. Dichio, B.; Xiloyannis, C.; Sofo, A.; Montanaro, G. Effects of postharvest regulated deficit irrigation on carbohydrate and nitrogen partitioning, yield quality and vegetative growth of peach trees. Plant Soil 2007, 290, 127–137. [Google Scholar] [CrossRef]
  57. Conesa, M.; Dodd, I.; Temnani, A.; De La Rosa, J.; Pérez-Pastor, A. Physiological response of post-veraison deficit irrigation strategies and growth patterns of table grapes (cv. Crimson Seedless). Agric. Water Manag. 2018, 208, 363–372. [Google Scholar] [CrossRef] [Green Version]
  58. Medrano, H.; Tomás, M.; Martorell, S.; Escalona, J.M.; Pou, A.; Fuentes, S.; Flexas, J.; Bota, J. Improving water use efficiency of vineyards in semi-arid regions: A review. Agron. Sustain. Dev. 2015, 35, 499–517. [Google Scholar] [CrossRef]
  59. Marsal, J.; Girona, J. Relationship between Leaf Water Potential and Gas Exchange Activity at Different Phenological Stages and Fruit Loads in Peach Trees. J. Am. Soc. Hortic. Sci. 1997, 122, 415–421. [Google Scholar] [CrossRef] [Green Version]
  60. Flexas, J.; Bota, J.; Escalona, J.M.; Sampol, B.; Medrano, H. Effects of drought on photosynthesis and electron transport rate regulation in grapevine. Plant Cell Environ. 2002, 22, 39–48. [Google Scholar] [CrossRef]
  61. Shackel, K.; Lampinen, B.; Sibbett, S.; Olson, W. The Relation of Midday Stem Water Potential to the Growth and Physiology of Fruit Trees Under Water Limited Conditions. Acta Hortic. 2000, 537, 425–430. [Google Scholar] [CrossRef]
  62. Galindo, A.; Rodríguez, P.; Collado-González, J.; Cruz, Z.; Torrecillas, E.; Ondoño, S.; Corell, M.; Moriana, A.; Torrecillas, A.; González, M.C. Rainfall intensifies fruit peel cracking in water stressed pomegranate trees. Agric. For. Meteorol. 2014, 194, 29–35. [Google Scholar] [CrossRef]
  63. Alcobendas, R.; Mirás-Avalos, J.M.; Alarcón, J.J.; Pedrero, F.; Nicolás, E. Combined effects of irrigation, crop load and fruit position on size, color and firmness of fruits in an extra-early cultivar of peach. Sci. Hortic. 2012, 142, 128–135. [Google Scholar] [CrossRef]
  64. Leinonen, I.; Jones, H.G. Combining thermal and visible imagery for estimating canopy temperature and identifying plant stress. J. Exp. Bot. 2004, 55, 1423–1431. [Google Scholar] [CrossRef] [Green Version]
  65. Gonzalez-Dugo, V.; Zarco-Tejada, P.J.; Berni, J.; Suarez, L.; Goldhamer, D.; Fereres, E.; Jimenez-Berni, J.A. Almond tree canopy temperature reveals intra-crown variability that is water stress-dependent. Agric. For. Meteorol. 2012, 154, 156–165. [Google Scholar] [CrossRef]
  66. Rahmati, M.; Davarynejad, G.H.; Génard, M.; Bannayan, M.; Azizi, M.; Vercambre, G. Peach Water Relations, Gas Exchange, Growth and Shoot Mortality under Water Deficit in Semi-Arid Weather Conditions. PLoS ONE 2015, 10, e0120246. [Google Scholar] [CrossRef]
  67. Valdés-Vela, M.; Abrisqueta, I.; Conejero, W.; Vera, J.; Sánchez, M.C.R. Soft computing applied to stem water potential estimation: A fuzzy rule based approach. Comput. Electron. Agric. 2015, 115, 150–160. [Google Scholar] [CrossRef]
  68. Drew, M.C. Stress physiology. In Plant Physiology, 4th ed.; Taiz, L., Zeiger, E., Eds.; Sinauer Associates: Sunderland, MA, USA, 2006; p. 764. [Google Scholar]
  69. Tardieu, F.; Simonneau, T. Variability among species of stomatal control under fluctuating soil water status and evaporative demand: Modelling isohydric and anisohydric behaviours. J. Exp. Bot. 1998, 49, 419–432. [Google Scholar] [CrossRef]
  70. García-Tejero, I.F.; Durán-Zuazo, V.H.; Muriel-Fernández, J.L.; Jiménez-Bocanegra, J.A. Linking canopy temperature and trunk diameter fluctuations with other physiological water status tools for water stress management in citrus orchards. Funct. Plant Boil. 2011, 38, 106. [Google Scholar] [CrossRef]
  71. Zarco-Tejada, P.J.; Gonzalez-Dugo, V.; Berni, J.; Jimenez-Berni, J.A. Fluorescence, temperature and narrow-band indices acquired from a UAV platform for water stress detection using a micro-hyperspectral imager and a thermal camera. Remote Sens. Environ. 2012, 117, 322–337. [Google Scholar] [CrossRef]
  72. Ferrer, M.; Echeverria, G.; Pereyra, G.; González-Neves, G.; Pans, D.; Mirás-Avalos, J.M. Mapping vineyard vigour using airborne remote sensing: Relations with yield, berry composition and sanitary status under humid climate conditions. Precis. Agric. 2019, 1–20. [Google Scholar] [CrossRef]
  73. Rojas, O.; Vrieling, A.; Rembold, F. Assessing drought probability for agricultural areas in Africa with coarse resolution remote sensing imagery. Remote Sens. Environ. 2011, 115, 343–352. [Google Scholar] [CrossRef]
  74. Rondeaux, G.; Steven, M.; Baret, F. Optimization of soil adjusted vegetation indexes. Remote Sens. Environ. 1996, 55, 95–107. [Google Scholar] [CrossRef]
  75. Dobrowski, S.; Ustin, S.; Wolpert, J. Grapevine dormant pruning weight prediction using remotely sensed data. Aust. J. Grape Wine Res. 2003, 9, 177–182. [Google Scholar] [CrossRef]
  76. Hogrefe, K.R.; Patil, V.P.; Ruthrauff, D.R.; Meixell, B.W.; Budde, M.E.; Hupp, J.W.; Ward, D.H. Normalized Difference Vegetation Index as an Estimator for Abundance and Quality of Avian Herbivore Forage in Arctic Alaska. Remote Sens. 2017, 9, 1234. [Google Scholar] [CrossRef]
  77. Jackson, R.D. Canopy Temperature and Crop Water Stress. In Advances in Irrigation; Elsevier BV: Amsterdam, The Netherlands, 1982; Volume 1, pp. 43–85. [Google Scholar]
  78. González-Dugo, M.P.; Moran, M.S.; Mateos, L.; Bryant, R. Canopy temperature variability as an indicator of crop water stress severity. Irrig. Sci. 2006, 24, 233. [Google Scholar] [CrossRef]
  79. González-Dugo, V.; Goldhamer, D.; Zarco-Tejada, P.J.; Fereres, E. Improving the precision of irrigation in a pistachio farm using an unmanned airborne thermal system. Irrig. Sci. 2015, 33, 43–52. [Google Scholar] [CrossRef]
  80. Camino, C.; Zarco-Tejada, P.J.; González-Dugo, V. Effects of Heterogeneity within Tree Crowns on Airborne-Quantified SIF and the CWSI as Indicators of Water Stress in the Context of Precision Agriculture. Remote Sens. 2018, 10, 604. [Google Scholar] [CrossRef]
  81. Abrisqueta, I.; Conejero, W.; Valdés-Vela, M.; Vera, J.; Ortuño, M.F.; Ruiz-Sánchez, M.C.; Ortuño, M.F. Stem water potential estimation of drip-irrigated early-maturing peach trees under Mediterranean conditions. Comput. Electron. Agric. 2015, 114, 7–13. [Google Scholar] [CrossRef]
  82. Blanco, V.; Domingo, R.; Pérez-Pastor, A.; Blaya-Ros, P.J.; Torres-Sánchez, R. Soil and plant water indicators for deficit irrigation management of field-grown sweet cherry trees. Agric. Water Manag. 2018, 208, 83–94. [Google Scholar] [CrossRef]
Figure 1. Soil water content (SWC, %) in the 0–0.5m soil profile during 2017/2018 growing season. Dashed horizontal lines delimit field capacity and the allowed water deficit threshold values (α): 30% (post-harvest 2017) and 10% (fruit growth 2018). Vertical bars indicate daily rainfall (mm).
Agronomy 09 00630 g001
Figure 2. Seasonal evolution of (A) daily rainfall (mm), reference crop evapotranspiration (ET0, mm day−1) and vapor pressure deficit (VPD, kPa), (B) accumulated irrigation (mm), and (C) relative extractable water (REW) in the 0–0.5 m soil profile in control (●) and PDI (o) treatments. Values are means of four replicates.
Agronomy 09 00630 g002
Figure 3. Seasonal evolution of (A) midday stem water potential (Ψstem, MPa) and daily rainfall, (B) net CO2 assimilation rate (ACO2, µmol m−2 s−1), (C) stomatal conductance (gs, mmol m−2 s−1), and (D) instantaneous water use efficiency (WUEi, µmol mmol−1), in control (●) and PDI (o) treatments during the 2017/2018 growing season. Values are means ± SE (n = 4). Asterisks indicate statistically significant differences between treatments at p ≤ 0.05.
Agronomy 09 00630 g003
Figure 4. Mean values of (A) normalized difference vegetation index (NDVI), (B) soil adjusted vegetation index (SAVI), (C) canopy temperature (Tc, °C), (D) canopy to air temperature difference (Tc-Ta, °C), (E) midday stem water potential (Ψstem, MPa), (F) net CO2 assimilation rate (ACO2 µmol m−2 s−1), (G) stomatal conductance (gs, mmol m−2 s−1), and (H) instantaneous water use efficiency (WUEi, µmol mmol−1) in control ( Agronomy 09 00630 i001) and PDI ( Agronomy 09 00630 i002) treatments at t1 (10: 00 GTM) and t2 (12:00 GTM) flights. Values are means ± SE of 4 replicates. Different letters on the bars indicate significant differences between treatments at p ≤ 0.05 within t1 or t2.
Agronomy 09 00630 g004
Figure 5. Spatial distribution of the selected soil-monitored trees and the derived indexes from the UAV imagery at t2 flight: normalized difference vegetation index (NDVI), soil adjusted vegetation index (SAVI), and canopy to air temperature difference (Tc-Ta, °C).
Agronomy 09 00630 g005
Figure 6. Relationship between the total pruning (kg tree−1) and (A) canopy tree cover (%), (B) normalized difference vegetation index (NDVI), and (C) soil adjusted vegetation index (SAVI) in control (●) and PDI (o) treatments during the 2017/2018 growing season 2017/2018. Each point corresponds to the selected trees. Values of NDVI and SAVI were obtained at t2 (12:00 GTM). ns, not-significant; * p ≤ 0.05, MSE mean square error.
Agronomy 09 00630 g006
Figure 7. Relationship between stem water potential (Ψstem, MPa) and (A) normalized difference vegetation index (NDVI), (C) soil adjusted vegetation index (SAVI), and (C) canopy to air temperature difference (Tc-Ta, °C), and between the function of Ψstem and vapor pressure deficit (VPD) and (B) NDVI,(D) SAVI, and (F) Tc-Ta in control (●) and PDI (o) treatments at t1 (10:00 GTM) and t2 (12:00 GTM) flight times. Each point corresponds to selected trees. ns, not-significant; * p ≤ 0.05, ** p ≤ 0.01; *** p ≤ 0.001, MSE mean square error.
Agronomy 09 00630 g007
Table 1. Vegetative, yield, and fruit quality components in control and precise deficit irrigation (PDI) treatments.
Vegetative ComponentsControlPDIANOVA
Pruning (kg tree−1)13.01 ± 2.2211.20 ± 1.08ns
Canopy tree cover (%)56.43 ± 6.0359.75 ± 5.26ns
Trunk cross-section area (TCSA, cm2) 242.28 ± 31.78214.72 ± 20.02ns
Yield components
Yield (t ha−1) 8.37 ± 1.156.24 ± 0.64ns
N° fruits (fruits tree−1) 145.67 ± 21.95118 ± 13.65ns
Cracking (%)22.67 ± 3.8423.67 ± 10.17ns
Fruit mass (g)131.20 ± 2.44120.70 ± 5.81ns
Crop load (fruits cm−2 TCSA) 0.55 ± 0.070.51 ± 0.07ns
Crop water use efficiency (WUE, kg m−3)4.74 ± 0.655.01 ± 0.52ns
Fruit quality components
Fruit diameter z (mm)64.09 ± 0.6763.42 ± 0.19ns
Soluble solid content (SSC, °Brix)11.65 ± 0.3112.16 ± 0.18ns
Lightness (L)39.33 ± 1.1544.09 ± 2.11ns
Hue angle (°hue)40.49 ± 0.1840.15 ± 1.19ns
Skin Chroma (*C)31.90 ± 1.78 41.98 ± 3.39 *
Values are means ± SE (n = 4 replicates). ns = not significant, and * = significant at p ≤ 0.05. z corresponds to commercial size B according to [49].
Table 2. Sensitivity analysis for terrestrial and remote plant water status indicators at the two flight times: t1 (10:00 GMT) and t2 (12:00 GMT).
t1t2
SICVSS*SICVSS*
Ѱstem1.360.187.561.991.530.1312.054.15
ACO20.990.0521.13‒0.250.900.156.18‒0.71
gs1.060.0520.001.140.900.194.84‒0.55
WUEi1.030.0170.611.,970.940.165.99‒0.37
NDVI0.990.01100.58‒0.890.990.0191.28‒0.74
SAVI0.970.0168.49‒1.910.980.0241.01‒0.64
Tc1.020.0243.220.931.010.0334.330.17
Tc-Ta0.900.136.96‒0.811.211.001.210.21
Values are means of four replicates. SI, signal intensity; CV, coefficient of variation; S, SI/CV; S*, (SI-1)/CV; Ψstem, midday stem water potential (MPa); ACO2, net CO2 assimilation rate (µmol m−2 s−1); gs, stomatal conductance (mmol m−2 s−1); WUEi, instantaneous water use efficiency (µmol mmol−1); NDVI, normalized difference vegetation index; SAVI, soil adjusted vegetation index (SAVI); Tc, canopy temperature (°C); Tc-Ta, canopy to air temperature difference (°C).

