Article

Estimating the Soil Hydraulic Functions of Some Olive Orchards: Soil Management Implications for Water Saving in Soils of Salento Peninsula (Southern Italy)

by
Mirko Castellini
1,*,
Anna Maria Stellacci
2,
Marcello Mastrangelo
1,
Francesco Caputo
3 and
Luisa Maria Manici
3
1
Research Center for Agriculture and Environment, Council for Agricultural Research and Economics (CREA–AA), Via C. Ulpiani 5, 570125 Bari, Italy
2
Department of Soil Plant and Food Sciences, University of Bari Aldo Moro, Via G. Amendola 165/a, 70126 Bari, Italy
3
Research Center for Agriculture and Environment, Council for Agricultural Research and Economics (CREA–AA), Via di Corticella 133, 40128 Bologna, Italy
*
Author to whom correspondence should be addressed.
Agronomy 2020, 10(2), 177; https://doi.org/10.3390/agronomy10020177
Submission received: 18 December 2019 / Revised: 9 January 2020 / Accepted: 23 January 2020 / Published: 26 January 2020
(This article belongs to the Special Issue Irrigation Strategies and Soil Management in Orchards)

Abstract

:
Saving water resources in agriculture is a topic of current research in Mediterranean environments, and rational soil management can allow such purposes. The Beerkan Estimation of Soil Transfer parameters (BEST) procedure was applied in five olive orchards of Salento peninsula (southern Italy) to estimate the soil physical and hydraulic properties under alternative soil management (i.e., no-tillage (NT) and minimum tillage (MT)), and to quantify the impact of soil management on soil water conservation. Results highlighted the soundness of BEST predictions since they provided consistent results in terms of soil functions or capacitive-based soil indicators when (i) the entire data set was grouped by homogeneous classes of texture, bulk density, and capillarity of the soil, (ii) the predictions were compared with the corresponding water retention measures independently obtained in lab, and (iii) some correlations of literature were checked. BEST was applied to establish a comparison at Neviano (NE) and Sternatia (ST) sites. The two neighboring NT soils compared at NE showed substantial discrepancies in soil texture (i.e., sandy loam (NE-SL) or clay (NE-C)). This marked difference in soil texture could determine a worsening of the relative field capacity at the NE-SL site (relative field capacity, RFC < 0.6), as compared to NE-C where RFC was optimal. The current soil management determined a similar effect (RFC < 0.6) at Sternatia (ST-MT vs. ST-NT), but the worsening in soil properties, due to soil tillage, must be considered substantially transient, as progressive improvement is expected with the restoration of the soil structure. The results of this work suggest that strategic MT can be a viable solution to manage the soil of Salento olive orchards.

1. Introduction

Sustainable soil management in dry-farmed olive orchards represents a current topic in agricultural research because it is expected that rainfalls patterns (i.e., distributions and intensity) could vary due to climate changes [1,2]. As a consequence, coupled with the expected temperature variations, the aforementioned changes could seriously affect the water availability of Mediterranean orchards [3], and specific investigations aimed at quantifying the impact of soil management on the water availability of specific geographical areas are necessary.
The olive tree represents the main crop in the Salento peninsula (Puglia region, southern Italy). This spread mainly was due to the relatively high environmental aridity conditions of that area (i.e., relatively shallow soils with fine or medium texture, coupled with typical rainfall patterns of semiarid Mediterranean climate) [4]. Also, some olive orchards are not managed following the sustainable and advanced cultivation criteria because owners are often not full-time farmers. For these main reasons, low-cost management techniques (i.e., the no-tillage of the soil) coupled with chemical weed control (or with spontaneous grassing covers) is a widely applied approach by Salento landowners.
It is well known that soil tillage is an agronomic option that can appreciably modify the physical and hydraulic properties of the soil [5]. Tillage type, depth, and machinery characteristics, in fact, represent some major factors able to affect the aforementioned soil properties [6,7,8]. However, strategic minimum tillage without soil layers inversion was suggested to implement “options of good agricultural practices” for soil management (i) to increase the soil water storage, (ii) to improve soil water infiltration, (iii) to reduce evaporative losses from Mediterranean soils or, most recently, (iv) to ensure the control of disease vectors [4,9]. Consequently, because a lack of information for Salento soils exists on this topic, to provide specific findings is necessary.
There is experimental evidence that soil property assessments can represent an effective approach to investigate the influence of soil management on water storage [10], or to evaluate the impact of different soil conservation practices on soil functions [11,12]. Such studies have increased our knowledge on the sustainable management of orchards, but further investigations are needed for specific arid areas of the Mediterranean basin.
Knowledge of the soil water retention curve (WRC; i.e., the relationship between the volumetric soil water content and the soil water pressure head) and the hydraulic conductivity function (HCF; i.e., the relationship between the volumetric soil water content (or soil water pressure head) and the soil hydraulic conductivity) is crucial for adopting appropriate site-specific water management strategies (water volumes, irrigation scheduling, etc.). However, both WRC and HCF are variable in space and time, also because of the adopted soil tillage [13], and the choice of alternative soil management such as minimum tillage (MT) or no-tillage (NT) in orchards may represent a crucial factor because they also allow sustainable weed management [10]. Moreover, WRC–HCF determination is costly, time consuming, and/or practically inapplicable at the territorial scale (i.e., extensive farms, irrigation districts, or at larger scales) [14], and new experimental procedures that are cheap and relatively simplified should be selected and tested as a practical alternative to standard methods [15].
The Beerkan Estimation of Soil Transfer (BEST) procedure by Lassabatère et al. [16] allows to estimate both WRC and HCF starting from relatively easily measured or routinely surveyed soil data, such as the soil texture (i.e., soil particles distribution or, alternatively, clay, silt, and sand contents), the soil water content at the time of experiment, soil bulk density, and the cumulative infiltration by a very simple infiltrometric experiment in the field. Briefly, BEST is based on the analytical infiltration model proposed by Haverkamp et al. [17] and, assumed that that soil hydraulic properties (WRC and HCF) are expressed by given empirical relationships, it estimates the unknown parameters from a pedotransfer function and a simple field single-ring infiltration experiment conducted under saturated soil conditions. The van Genuchten [18] relationship with the condition of Burdine [19] is used for WRC and the Brooks and Corey [20] relationship for HCF [21]. More details on the BEST theory and on the three calculation algorithms can be found in Bagarello et al. [22]. Moreover, to allow easy application of the procedure, free tools were shared (i) to analyze the BEST data using an automatic analysis of multiple infiltration experiments using Scilab coded by Lassabatére, or using Excel and Visual Basic coded by Di Prima [23], and (ii) to build an automated infiltrometer for field experiments (i.e., infiltrometer constructive schemes for the automation of infiltration measures) [24]. Consequently, new approaches for the acquisition of several infiltration runs at the same time and the improvement of the statistical treatment of the data were proposed [25].
To date, several BEST applications have proven the method’s soundness in different agro-environmental investigations. In southern China, for example, the method has been applied to investigate the effects of Napier grass management on soil hydrologic functions in a karst landscape and to identify reasonable strategies for maintaining soil hydrologic function [26], or to establish the impact of different vegetation restoration types on saturated hydraulic conductivity, within a large global ecological restoration engineering project [27]. Khaledian et al. [28] applied BEST to investigate the impact of soil tillage on spatio-temporal variation of soil properties under drip irrigation. Di Prima et al. [29] assessed the soil physical quality of a Spanish orchard under three different types of soil management (i.e., no-tillage using herbicides, conventional tillage under chemical farming, and no-tillage under organic farming), and common indicators such as soil bulk density, organic carbon content, or structural stability index were considered in conjunction with capacitive indicators estimated by BEST. The results showed that independent and BEST-derived indicators yielded similar information, suggesting their ability to distinguish soil quality among contrasting soil management types. Therefore, cited references suggest that BEST is a suitable method for spatially distributed investigations, carried out under very varied operating conditions, but other field tests are necessary in different agro-environments to further verify their robustness.
The main objective of this study was to investigate the impact of soil tillage management (minimum tillage and no-tillage) on physical and hydraulic properties of porous media in typical rainfed olive orchards of the Salento peninsula. Specific goals were (i) to estimate the soil physical and hydraulic properties of some olive orchards, (ii) to test the BEST procedure’s reliability to estimate the soil hydraulic functions, and (iii) to use the experimental information obtained to quantify the effects of soil management on soil water conservation.

2. Materials and Methods
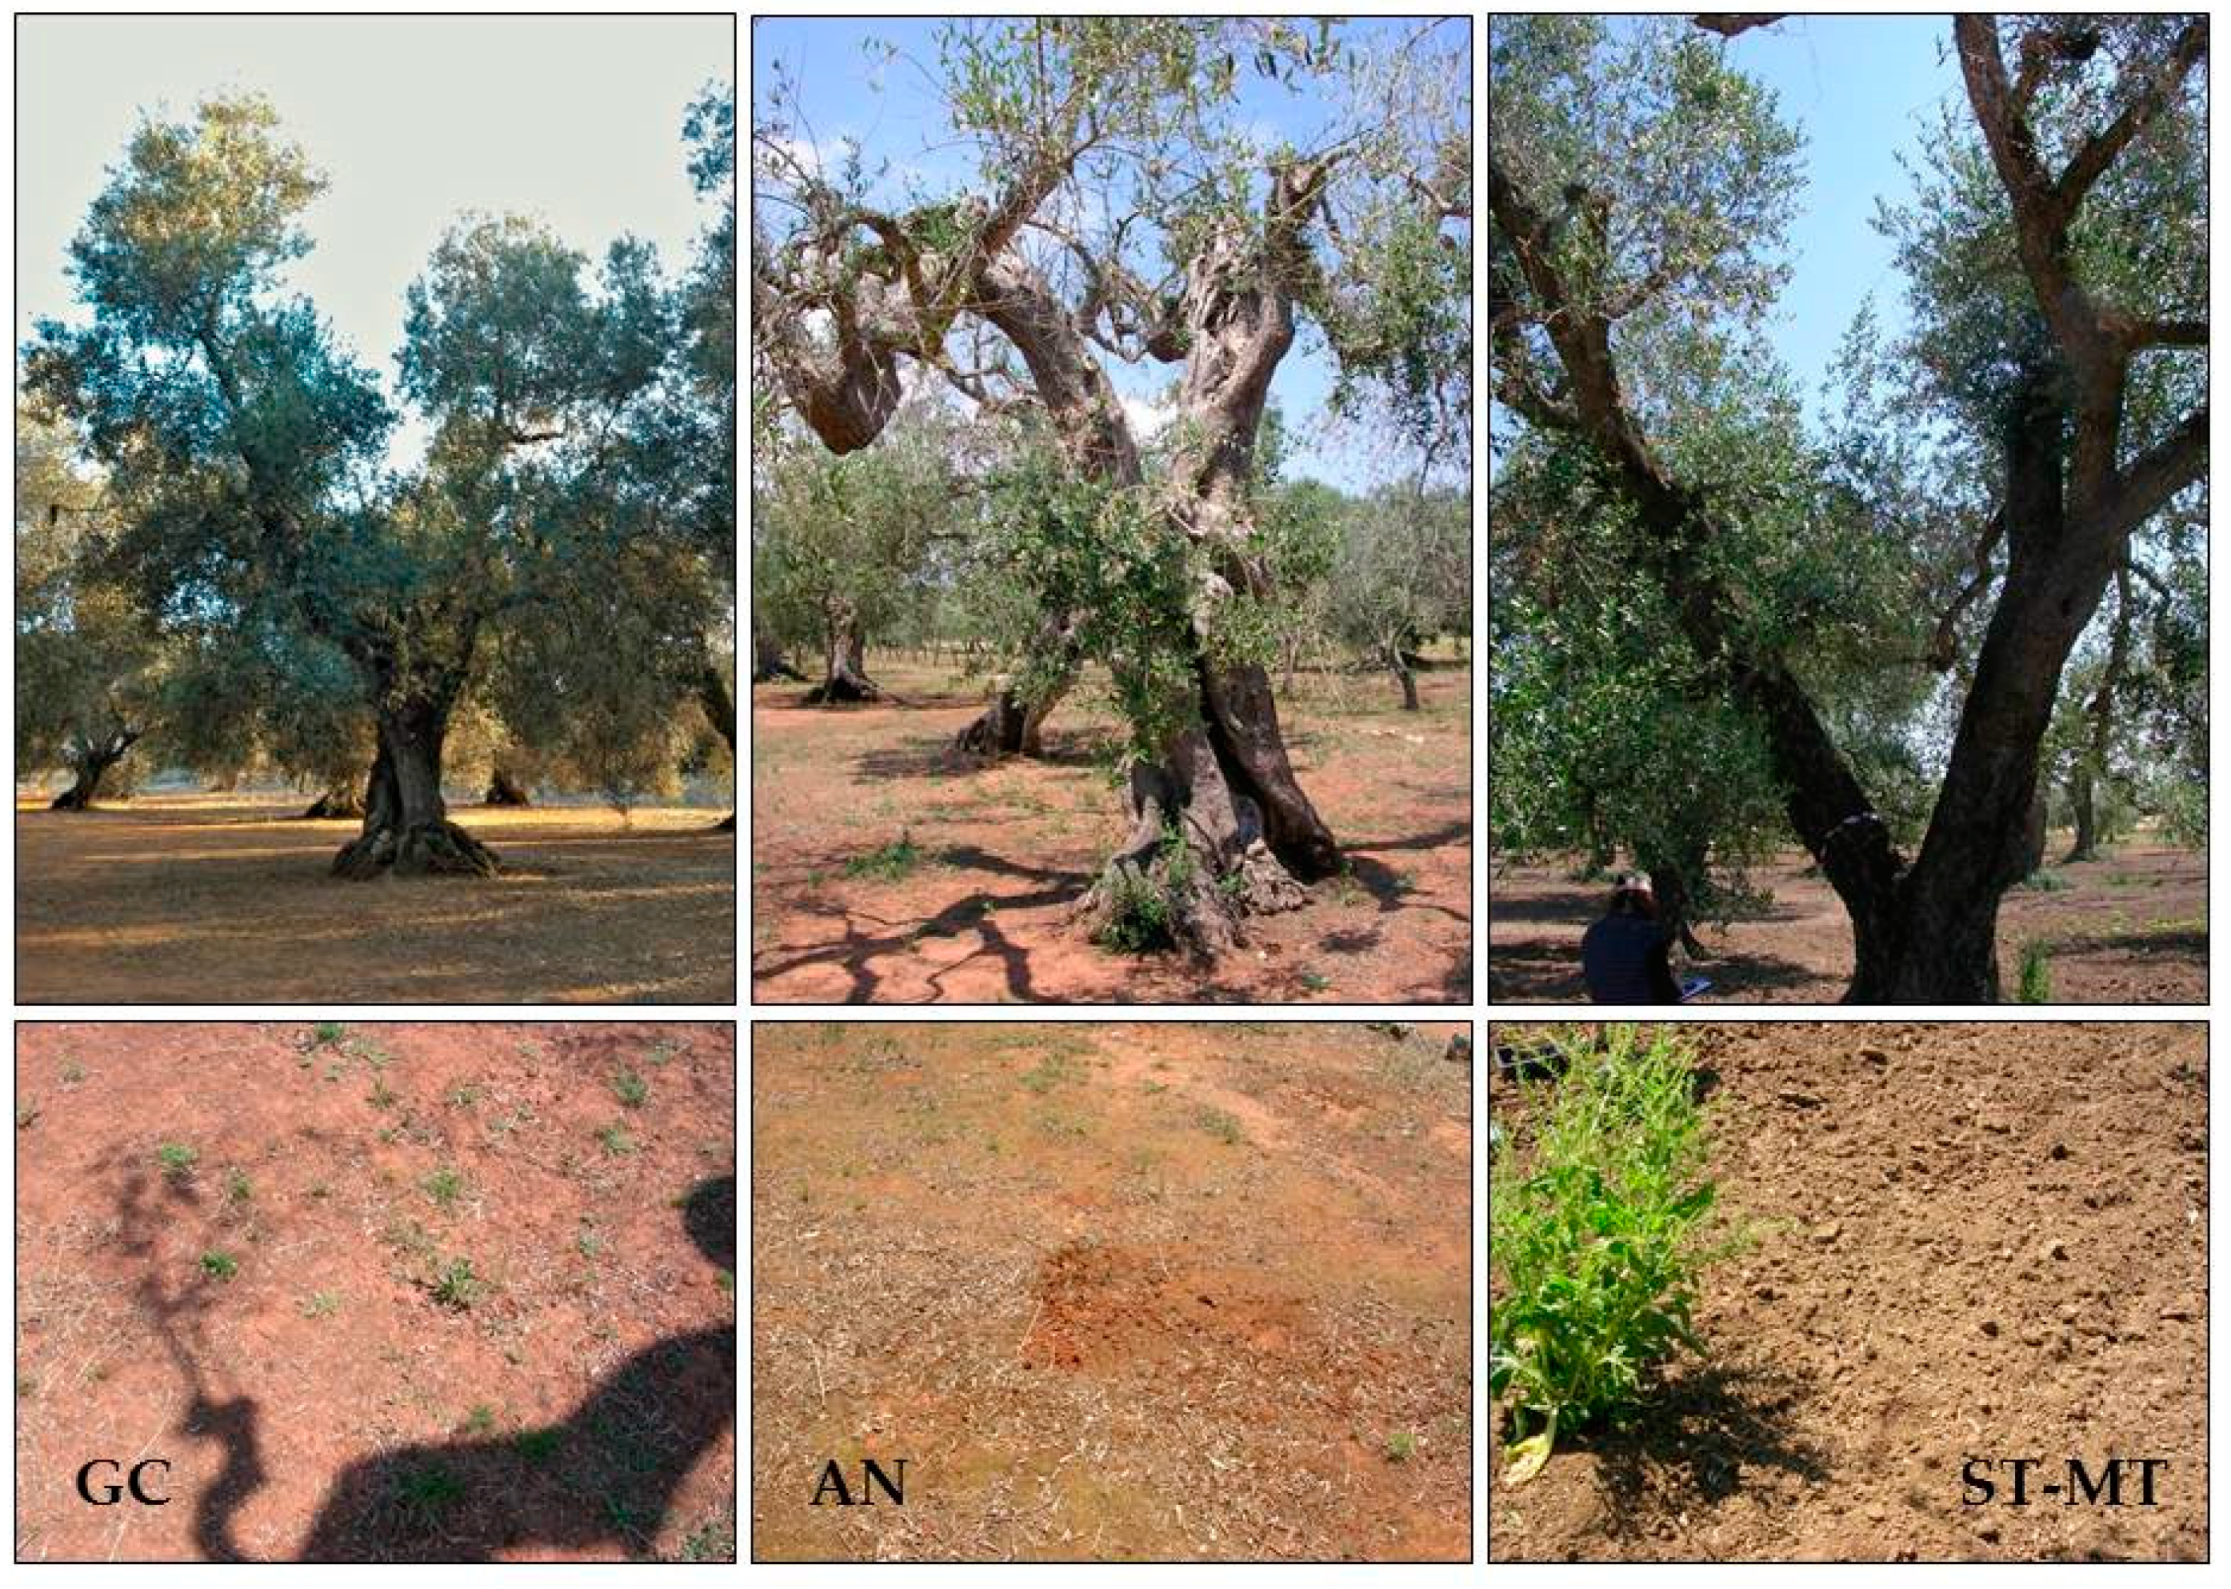
2.1. Field Sites

This study was performed in five olive orchards, located in the Salento peninsula (Apulia region, southern Italy), and the inter-row has been subject to intense soil sampling. Overall, the investigated soils were heterogeneous in terms of soil management (i.e., minimum tillage (MT) and no-tillage (NT)) and soil textures (from relatively coarse to fine soil textures). However, given the prevailing soil management for olive orchards in that area, four of the five sites were NT soils. This has prevented to establish comparisons on all selected sites. For each orchard, sampling areas of 1.0–1.6 Ha were selected, in accordance with the purposes reported by Manici et al. [4]. Details on the experimental sites are shown in Table 1, and examples of soil tillage conditions at the time of experiments are depicted in Figure 1. Information on past soil management, that is to say, on the soil tillage in the previous years to the present investigation, was obtained only for the sites of NE and GC. As shown in Figure 1 (ST-MT), the soil at the Sternatia site was subjected to minimum tillage a few days before field measurements. Therefore, for this site, the comparison provides information on the extreme soil tillage conditions that were experimentally observable.

2.2. Field and Lab Measurements

A total of 34 BEST experiments were carried out in the spring–summer season of 2017 to obtain a complete hydraulic characterization (i.e., WRC and HCF) of investigated soils. Specifically, the BEST procedure was applied in 5 to 6 randomly selected sampling points at Gagliano del Capo (GC; five sampling points), Neviano (NE), Sternatia (ST), and Andrano (AN) sites, while 11 locations were sampled at Soleto (SO) where a water supply was available. For each sampling point, the application of BEST required performing a Beerkan infiltration and sampling a soil core (10 cm in height by 5 cm in diameter; 196 cm3) to obtain both the soil water content at the time of the experiment, θ0, and the soil bulk density (BD). As common for the application of the method, a ring with a diameter of 15 cm was superficially inserted into the soil (1 cm), and 15 water volumes of 200 cm3 each were repeatedly poured into the ring. The experimental cumulative infiltration, I(t), was then deduced. Therefore, because each experimental site required about 20 L of water, the lack of water supply in almost all the sites prevented sampling a greater number of points. Saturated soil water content, θs, was estimated from BD assuming a particle density of 2.65 g cm−3. Following a standard experimental protocol for BEST application, the auxiliary determinations (θ0 and BD) concerned the 0–10 cm soil layer. A disturbed soil sample was also taken at each sampling point to determine both the soil particle size distribution (PSD) and the total organic carbon of the soil (TOC). The PSD was determined with the standard pipette method [30], while TOC was quantified through dry combustion using a TOC Vario Select analyzer (Elementar, Langenselbold, Germany). TOC measurements were evaluated because, together with the finest fraction of the soil (clay and silt), the soil structure may have been affected. The clay, silt, and sand percentages, which were determined according to the USDA classification, were used to run BEST [31]. Therefore, the BEST-steady algorithm allowed estimating also the saturated hydraulic conductivity of the soil, Ks. Briefly, the BEST-steady algorithm by Bagarello et al. [22] makes use of both the intercept and the slope (bs and is, respectively) of the straight line fitted to the data describing steady-state conditions on the I vs. t plot. According to Di Prima et al. [32], Ks can be directly calculated by the following equation:
K s = C   i s A   b s + C
where A and C are constants [32]. More details on the applied methodology can be found in Castellini et al. [31].

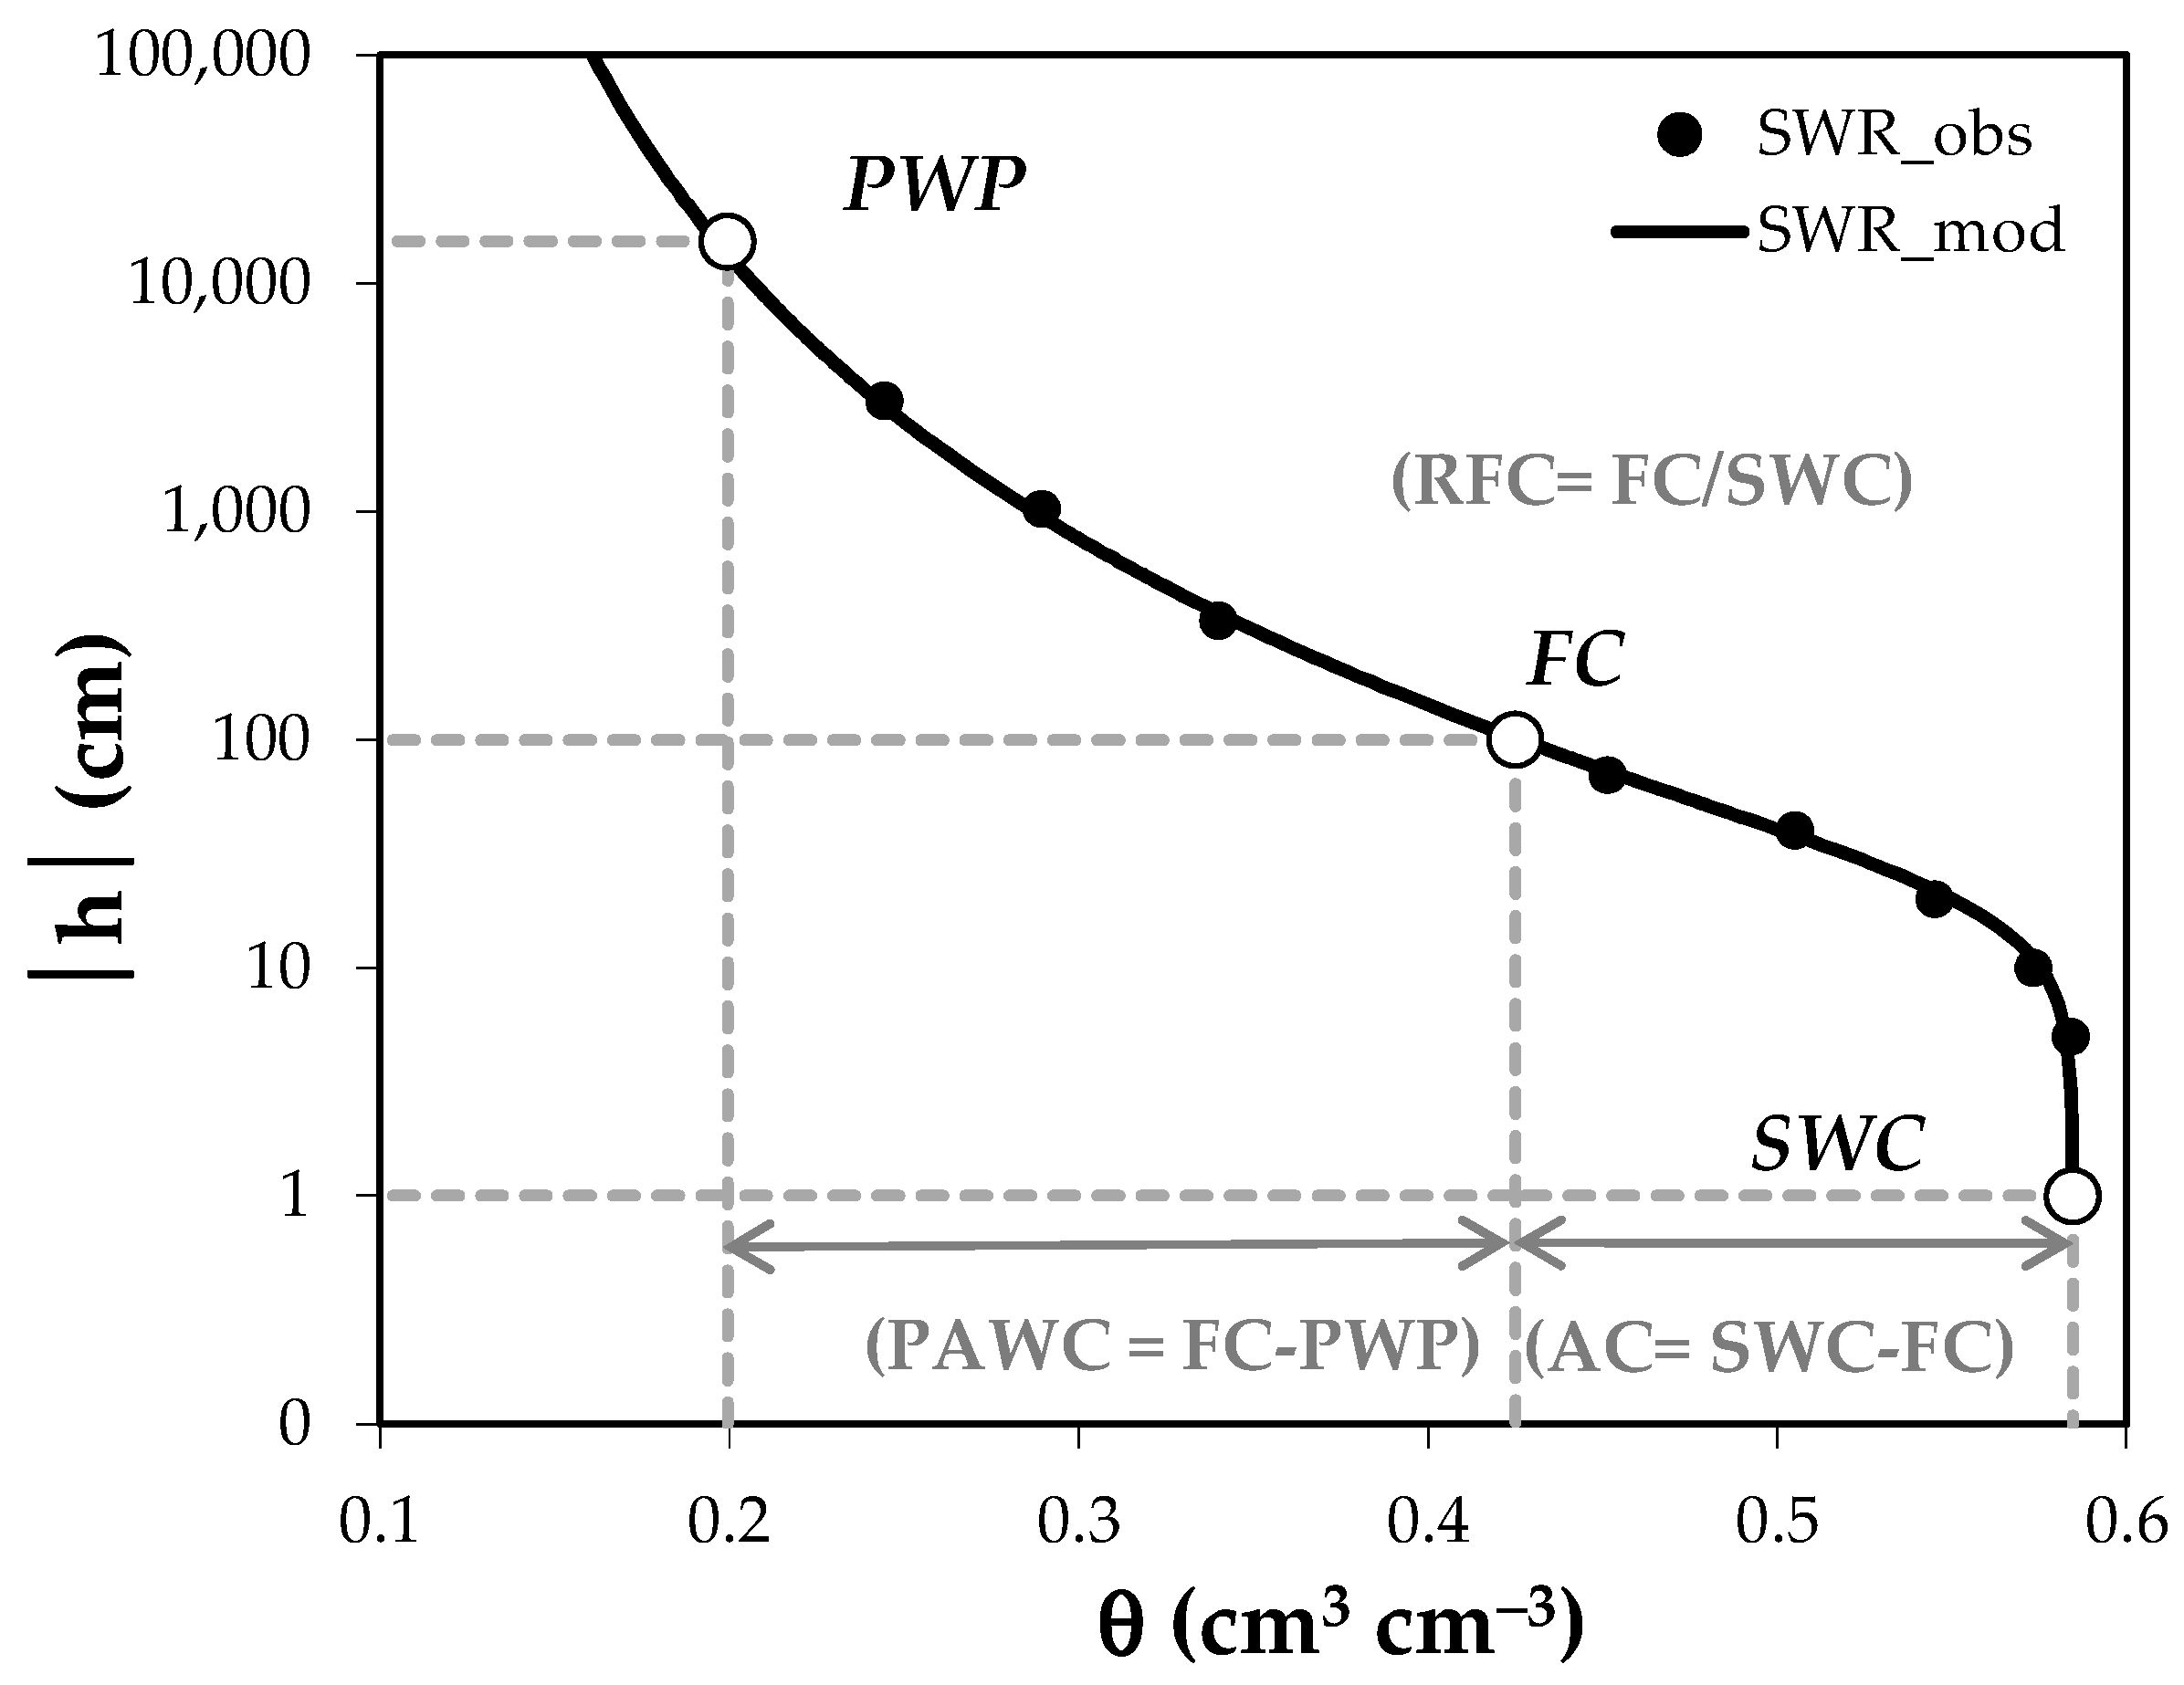
2.3. Capacitive-Based Soil Indicators Determination

To account for the optimal proportion between water and air into the soil, three capacitive-based soil indicators were considered in this investigation, namely air capacity (AC), plant available water capacity (PAWC), and relative field capacity (RFC). Specifically, the aforementioned soil indicators were calculated by differences (i.e., AC and PAWC) or ratios (RFC) between the main points of the water retention curve (i.e., saturated soil water content, field capacity, and wilting point). The schematic example of Figure 2 shows the formulas for their calculation. Therefore, AC and PAWC were selected to account for the optimal (or not optimal) availability of air and water into the soil. On the other hand, RFC was also considered because it was applied in many investigations (among others, [33,34]). RFC is an effective soil indicator because it partially combines the air capacity and plant available water capacity indicators by expressing soil ability to store air and water relative to the soil’s total pore volume [35]. Consequently, since RFC was also selected as the main variable to assess the effect of tillage [35], it seems suitable for the specific purposes of this investigation.
For each of the three soil indicators considered, we selected optimal values or critical limits, according to the reference of literature [35,36]. Therefore, the following classes have been considered for AC (cm3 cm−3), PAWC (cm3 cm−3), and RFC (‒):
  • AC < 0.10 poor, 0.10 ≤ AC ≤ 0.14 good, 0.14 < AC ≤ 0.26 optimal, AC > 0.26 poor;
  • PAWC < 0.10 poor, 0.10 ≤ PAWC < 0.15 limited, 0.15 ≤ PAWC < 0.20 good, PAWC ≥ 0.20 ideal;
  • RFC < 0.6 poor (water-limited soil), 0.6 ≤ RFC ≤0.7 optimal, RFC > 0.7 poor (aeration limited soil).

2.4. Data Analysis

WRC and HCF functions were estimated using the BEST-steady algorithm [22], and the obtained soil properties were used to establish comparisons among soils. WRC was used to estimate the selected capacitive-based soil indicators.
In order to verify the reliability of both soil functions and capacitive-based soil indicators obtained by BEST, a first analysis was carried out by subdividing the available dataset into classes of 1) soil texture, 2) soil bulk density, and 3) soil capillarity (λc). Specifically, after estimating soil functions (i.e., WRC) and calculating capacitive-based soil indicators (AC, PAWC, and RFC), they were discriminated against for the following:
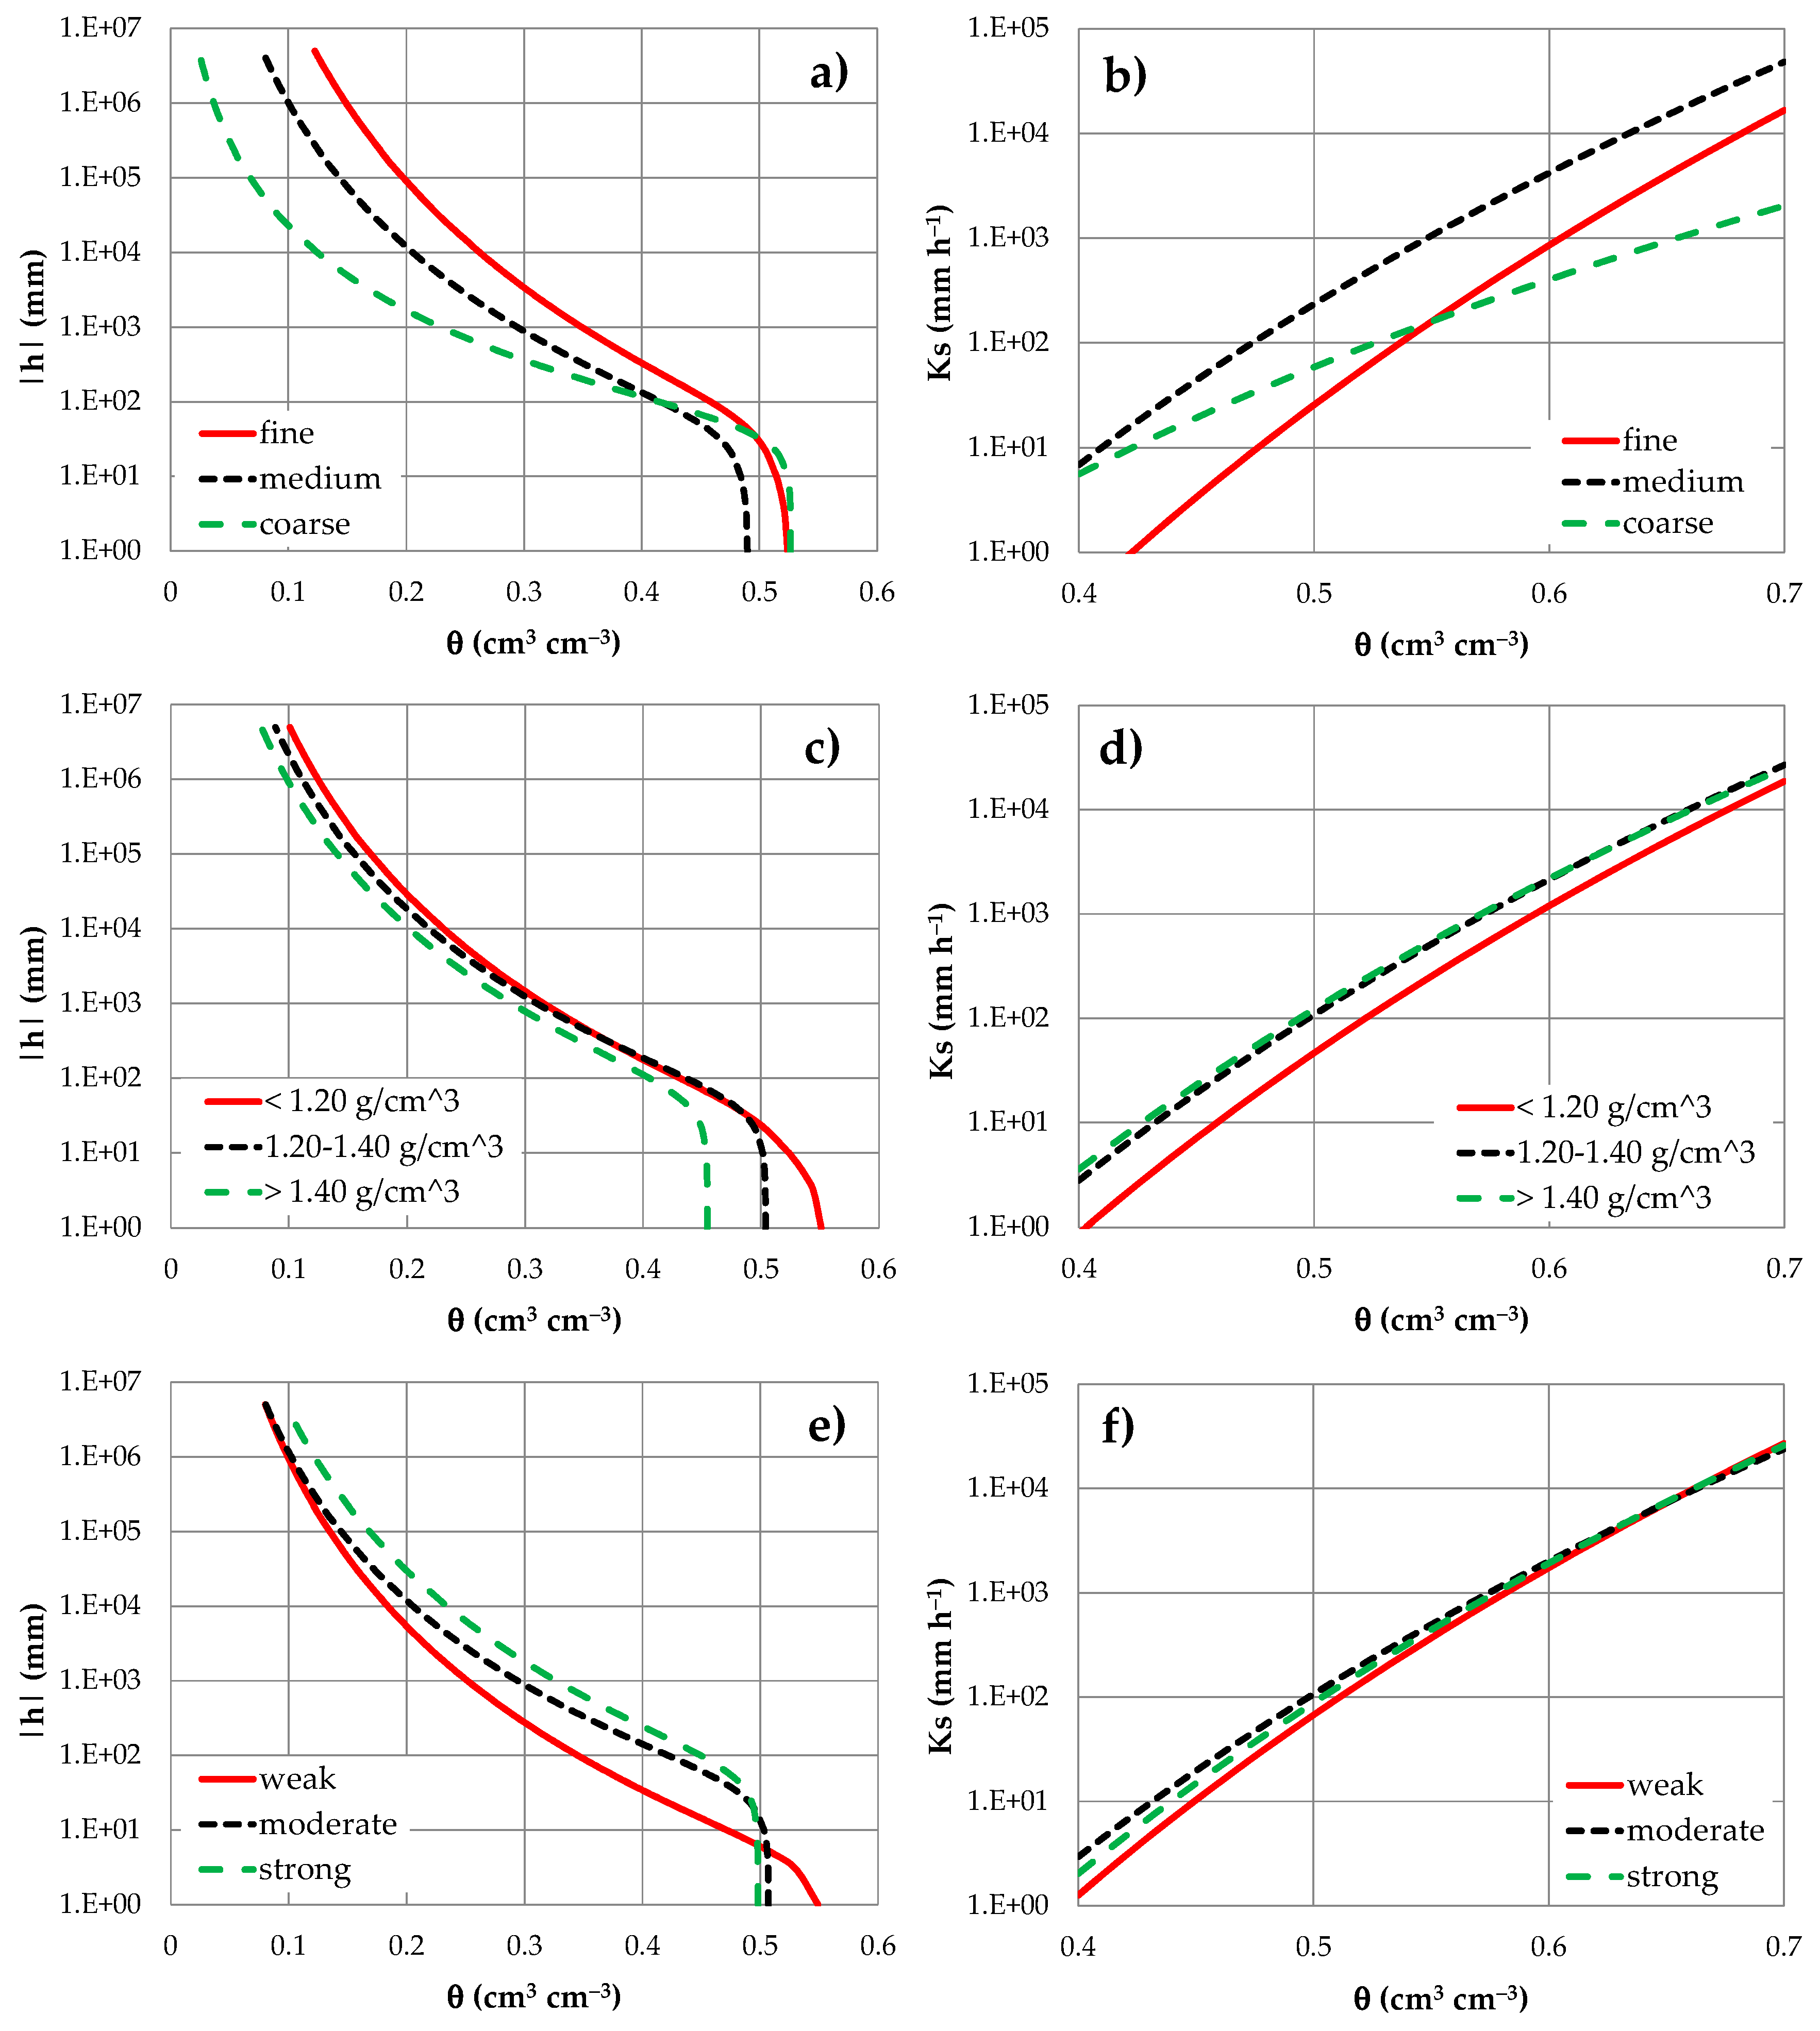
  • soil texture, which measured coarse soils (sandy-loam, loamy-sand, and sand), medium soils (sandy-clay loam, loam, silt-loam, and silt), and fine-textured soils (all the remaining classes of the USDA classification);
  • soil bulk density (g cm−3), which measured BD < 1.2, 1.2 ≤ BD ≤ 1.4, and BD > 1.4;
  • soil capillarity (mm), which measured 10 < λc < 42 (weak), 42 ≤ λc < 250 (moderate), and 250 ≤ λc < 1000 (strong).
The macroscopic capillary length, λc (mm), was calculated as
λ c = b Δ θ b s C
where b is a dimensionless constant commonly set equal to 0.55 for field soils, and Δθ is the difference between the soil water contents at saturation and at the time of the infiltration experiment (i.e., θs ‒ θ0) [21]. The first classification is rather applied when is necessary to discretize the soil textures according to the prevailing hydrological behavior, while the others were developed both using literature references or adequately considering the available BD measurements [37,38,39,40]. Consequently, a qualitative assessment of the expected value for a given indicator (i.e., increasing or decreasing), according to the considered classes, was carried out.
A further analysis was carried out to compare the water retention estimations obtained by BEST and the corresponding values independently obtained by standard lab methods. Specifically, 9 points of the soil water retention curve of Neviano-SL and Sternatia-CT were obtained by the hanging water column apparatus (for h values ranging from 5 to 100 cm) and pressure cells (for h values ranging from 1030 to 15300 cm) [14]. Moreover, some correlations between variables estimated by BEST (i.e., AC or RFC) and variables independently obtained (BD) were verified.
Finally, two comparisons were performed to establish the impact of soil management (i.e., soil tillage) on soil physical and hydraulic properties for the sites of Neviano and Sternatia.
For each variable considered in this investigation (clay, silt, sand, θ0, θs, BD, TOC, λc, AC, PAWC, RFC, and Ks), a given dataset was summarized by calculating the mean (M) and the associated coefficient of variation (CV). Arithmetic means were considered for all variables except Ks, which was assumed to be log-normally distributed, as commonly suggested in the literature [41]. Consequently, for the latter, geometric means and associated CVs were calculated using log-normal equations [41].

3. Results

3.1. Field Sites

Results of soils texture characterization classified the no-tilled soil of Andrano (AN) as clay-loam, and the soils of Gagliano del Capo (GC) and Soleto (SO) as sandy-clay-loam (Table 1). Moreover, the two fields at the Neviano (NE) site, although adjacent, showed different soil textures, (i.e., sandy-loam or clay), while Sternatia soils were sandy-clay-loam or clay, according to the soil tillage (i.e., ST-MT or ST-NT, respectively, under minimum tillage or no-tillage). Therefore, the impact of both soil texture and soil tillage on physical and hydraulic properties of the soil were investigated at Neviano and Sternatia sites, respectively.
Overall, TOC values were usual for Mediterranean soils [4,31], with TOC values that ranged between 10 and 15 g kg−1 (Table 1). However, since previous investigations on these same soils (except for GC) have shown no significant differences in soil stability structure (i.e., obtained as a function of the contents of clay, silt, and soil organic carbon) [4], possible effects of soil organic carbon could be indirect (i.e., for the improvement of the physical and hydraulic properties of investigated soils).

3.2. Evaluation of BEST for Soil Properties Classes

Figure 3 shows the differences in terms of WRC and HCF when investigated soils were grouped by soil texture classes, bulk density, and soil capillarity. Overall, soil texture gave more obvious differences. Specifically, WRCs estimated by BEST returned higher soil water contents for fine soils and lower for coarse soils (h < 100 mm), as expected. However, relatively lower soil water contents were shown close to water saturation for medium soils because of a higher soil bulk density of that class. Conversely, relatively higher discrepancies were detected for HCF because the saturated hydraulic conductivity function changed less abruptly as a function of soil water content for coarse soils than that for medium or fine textured soils (Figure 3). On the other hand, grouping soils by bulk density or capillarity provided equally plausible findings. In fact, higher θ values were shown close to water saturation (h > 100 mm) for lower BD values (i.e., <1.2 g cm−3) and lower θ values for higher BD values (i.e., >1.2 g cm−3); this is expected from a physical point of view because more soil porosity determines greater water availability into the soil. However, although the differences in observed BD values were within the range 1.26–1.45 g cm−3, BEST returned curves that overlapped for h values lower than about 100 mm (Figure 3). Similar results have been obtained for HCF. Intermediate discrepancies in θ values were obtained when investigated soils were grouped by soil capillarity. Also for this comparison, the obtained findings were plausible because (i) for a given h value, the corresponding soil water content was lower for a weak soil capillarity and higher for a strong one; and (ii) a less evident s-shaped curve was obtained as compared with those characterized by moderate-strong λc values. Negligible effects were detected for HCF (Figure 3).
Table 2, Table 3 and Table 4 summarize the results of capacitive-based soil indicators grouped by texture classes (Table 2), bulk density (Table 3), and soil capillarity (Table 4). Overall, regardless of the classification adopted, results were in agreement with the theoretical assumptions. For instance, AC increased passing from finer to coarser soil textures, while it decreased as the bulk density of the soil, or its capillarity, increased. Conversely, RFC showed the opposite trend because lower, or higher, RFC values accounted for a greater, or lower, air presence into the soil. Although PAWC results appeared to be consistent with the expectations, for example PAWC increased with increasing capillarity of the soil (higher soil capillarity is expected for finer soils, such as clayey soils), it showed relatively small variations, and a clear schematization was not obtained in terms of texture and BD classes. This was attributed to the relatively low heterogeneous dataset available or to the different sample sizes within each class. However, despite the mentioned approximations, the preliminary analysis provided further evidence of the applicability of BEST to assess the effects of soil management on soil property modifications.
The comparison between θ values predicted by BEST and the corresponding measurements obtained in lab are depicted in Figure 4. Overall, BEST’s ability to estimate the soil water retention was comparable between the two sites because the root-mean-square deviations were equal to 0.068 and 0.072 cm3 cm−3, respectively, for Neviano and Sternatia. This suggests that, regardless of the soil texture (sandy loam or sandy clay loam) or the soil management (no tillage or minimum tillage), the accuracy degree of the θ estimations was comparable. However, some discrepancies were detected as a function of the applied soil pressure head (h) because BEST seems to have been more accurate near to water saturation for ST and more accurate under unsaturated soil conditions for NE (Figure 4). In this regard, in order to estimate the capacitive-based soil indicators, relatively small differences have been identified at saturation or at field capacity, while higher discrepancies were detected at the wilting point. As a consequence, a relatively higher reliability is expected for AC and RFC rather than PAWC.
Finally, for a given site, the correlation between the BEST estimations (i.e., AC and RFC) and the measurements independently obtained (BD) were consistent with expectations [4], and they provide further evidence on the good reliability of BEST in providing consistent information on the relationships between soil properties (Figure 5).

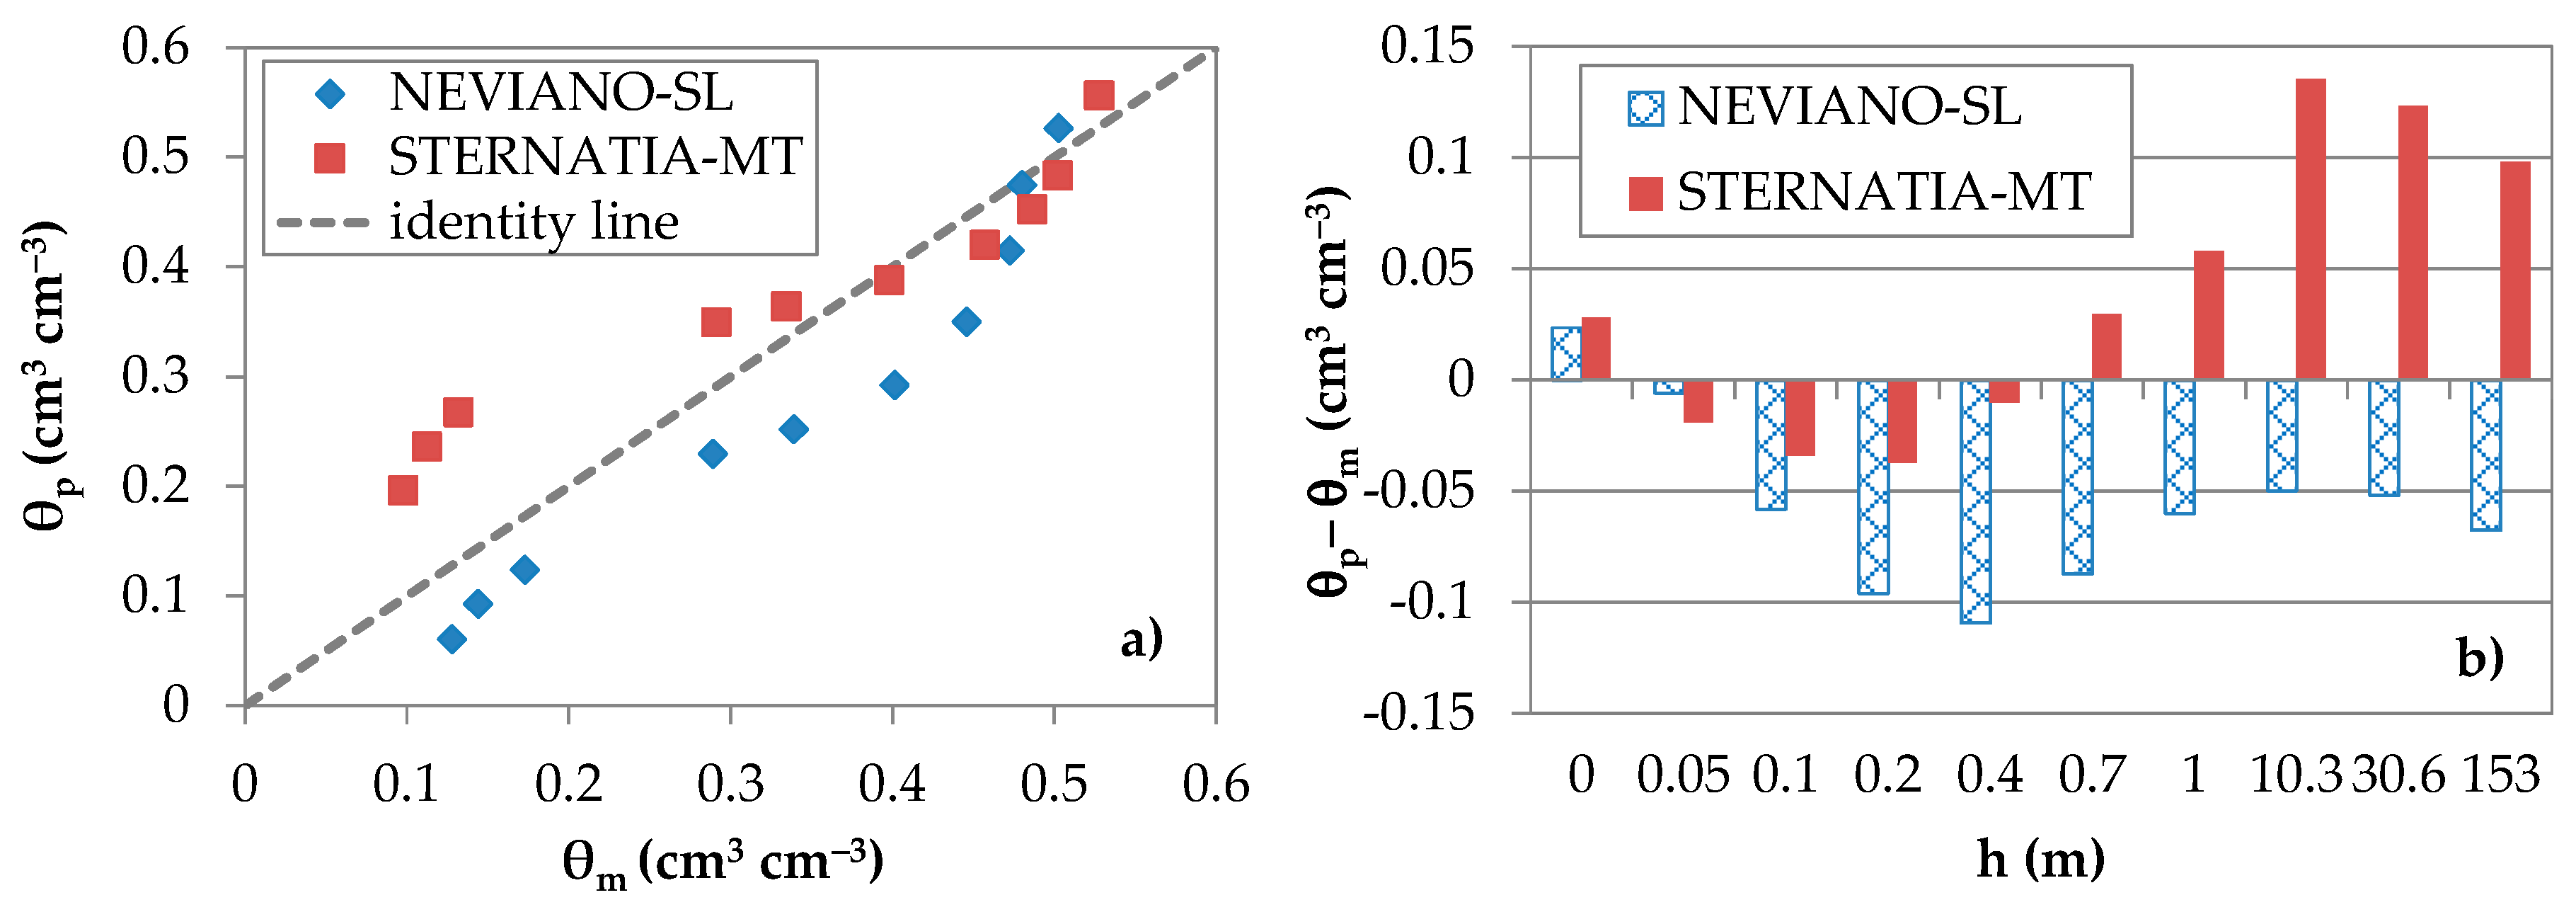
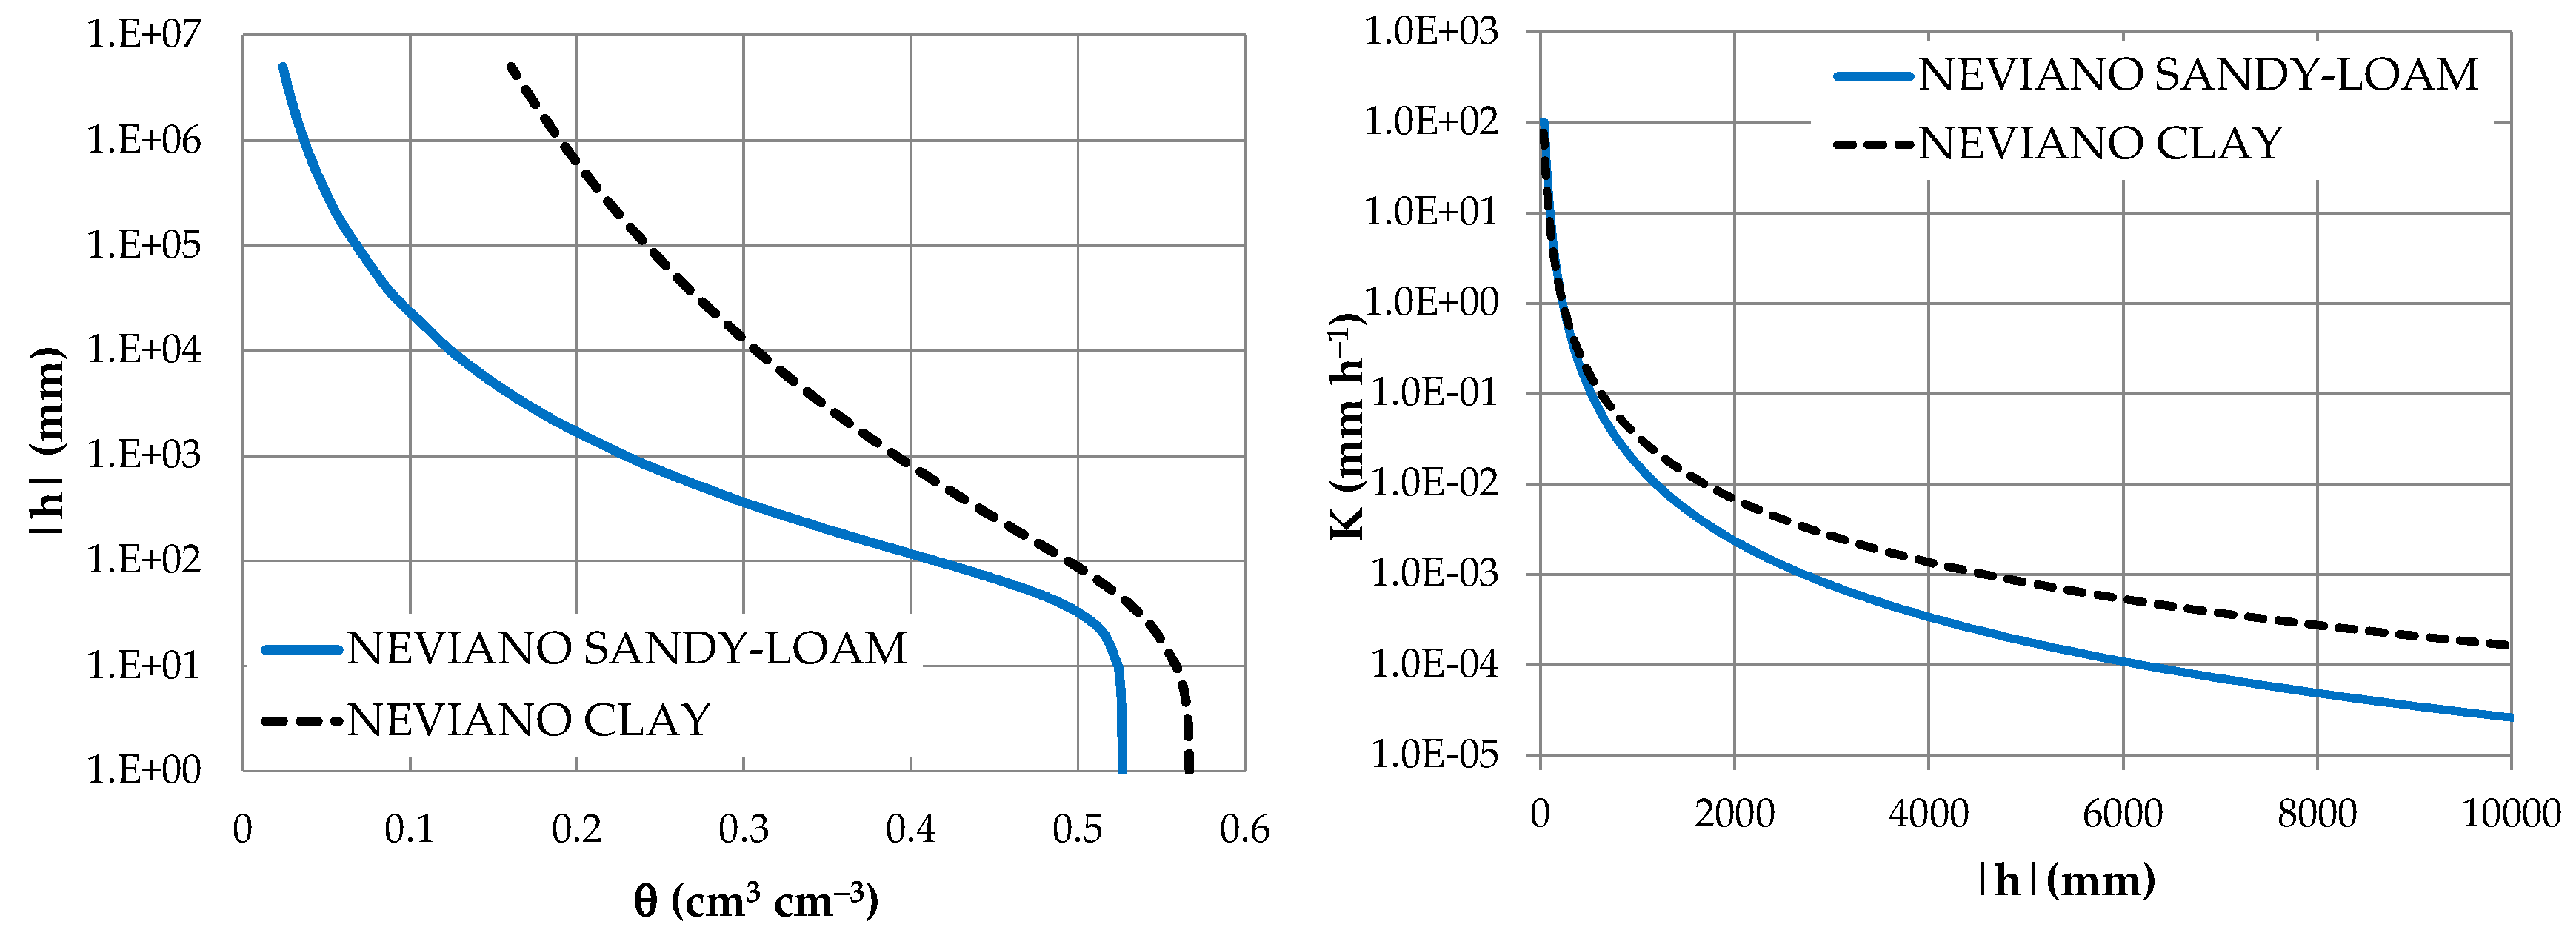
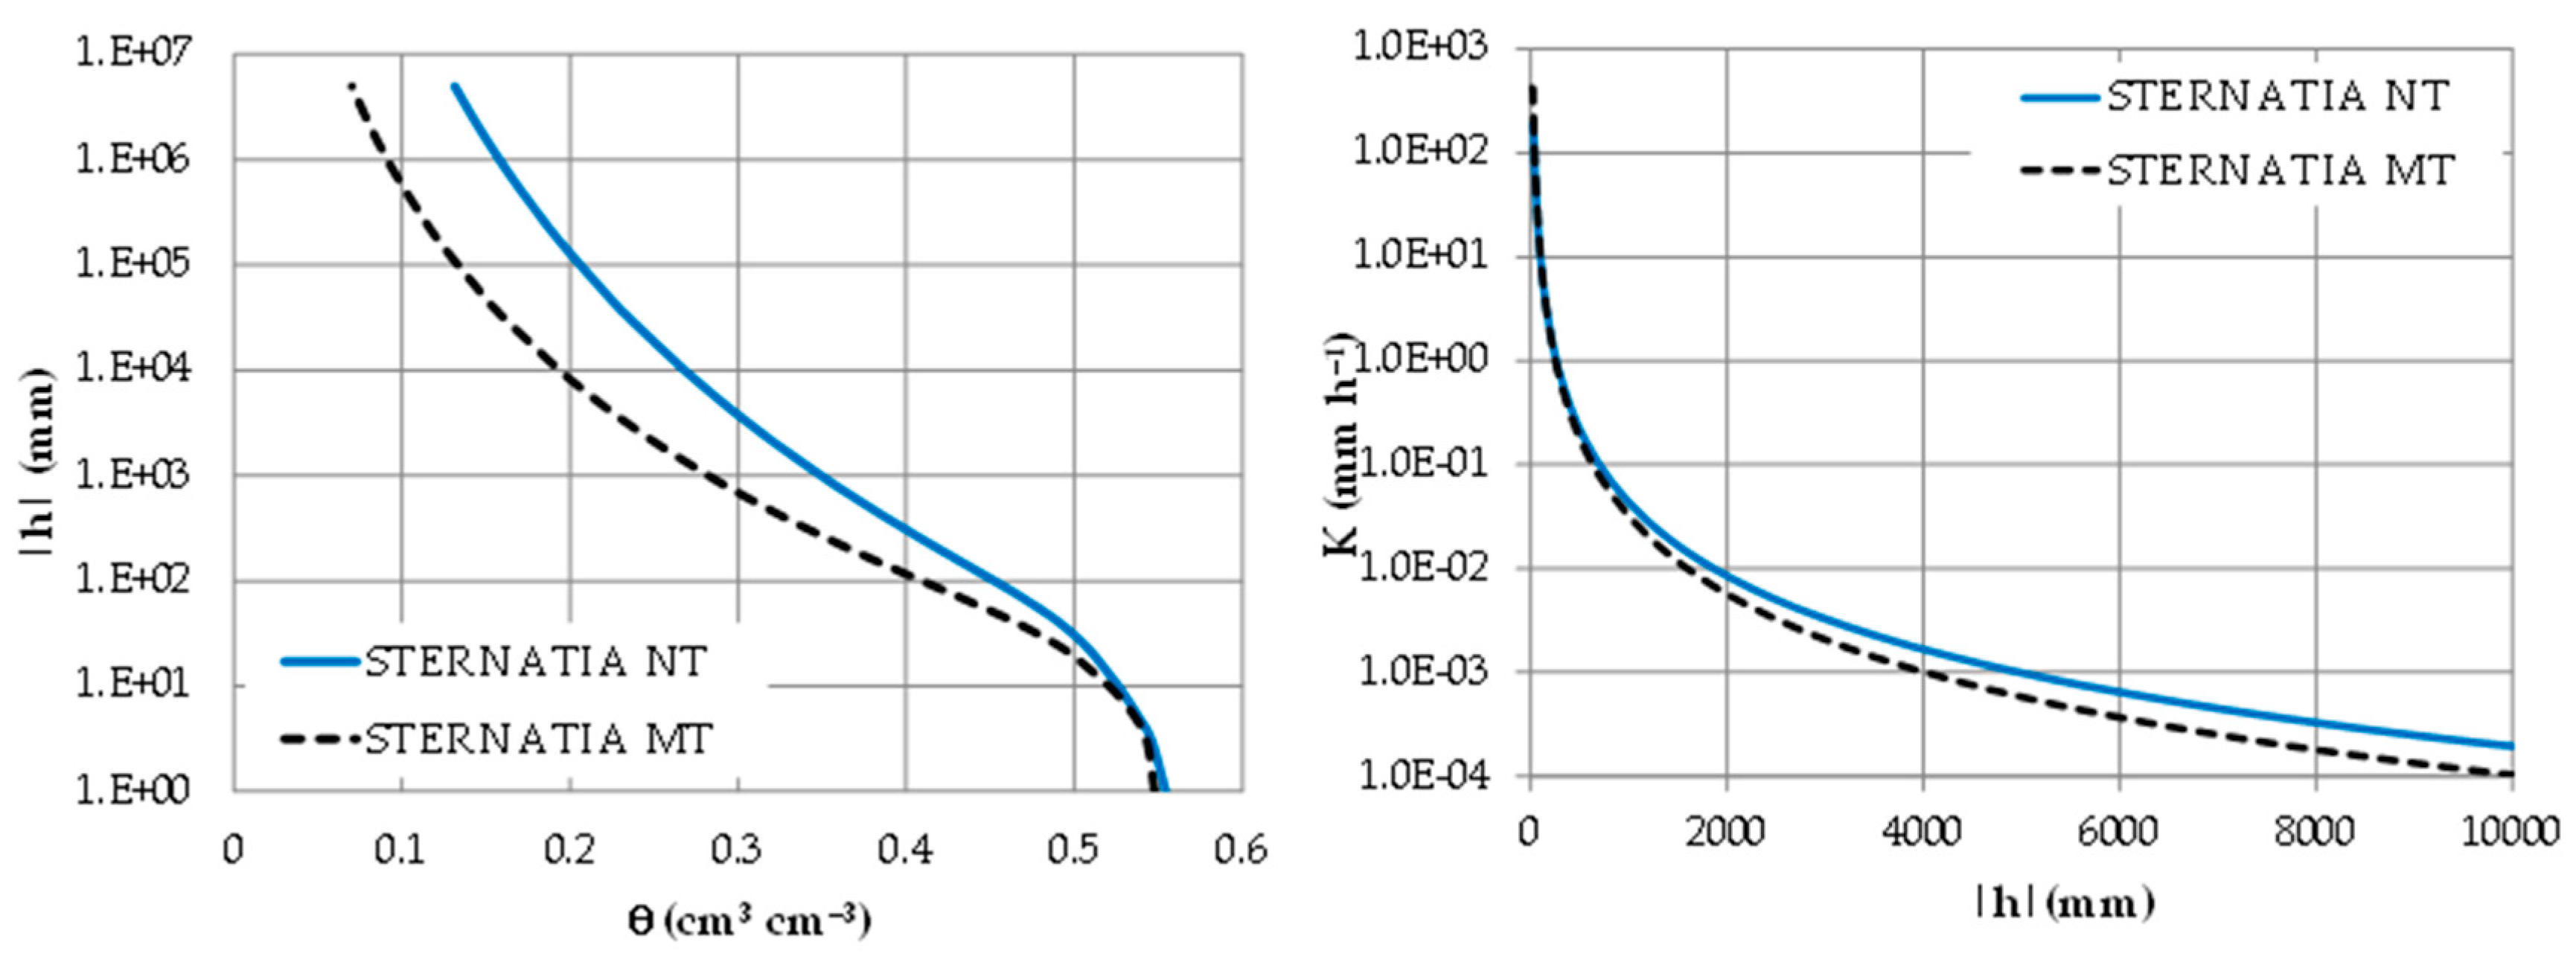
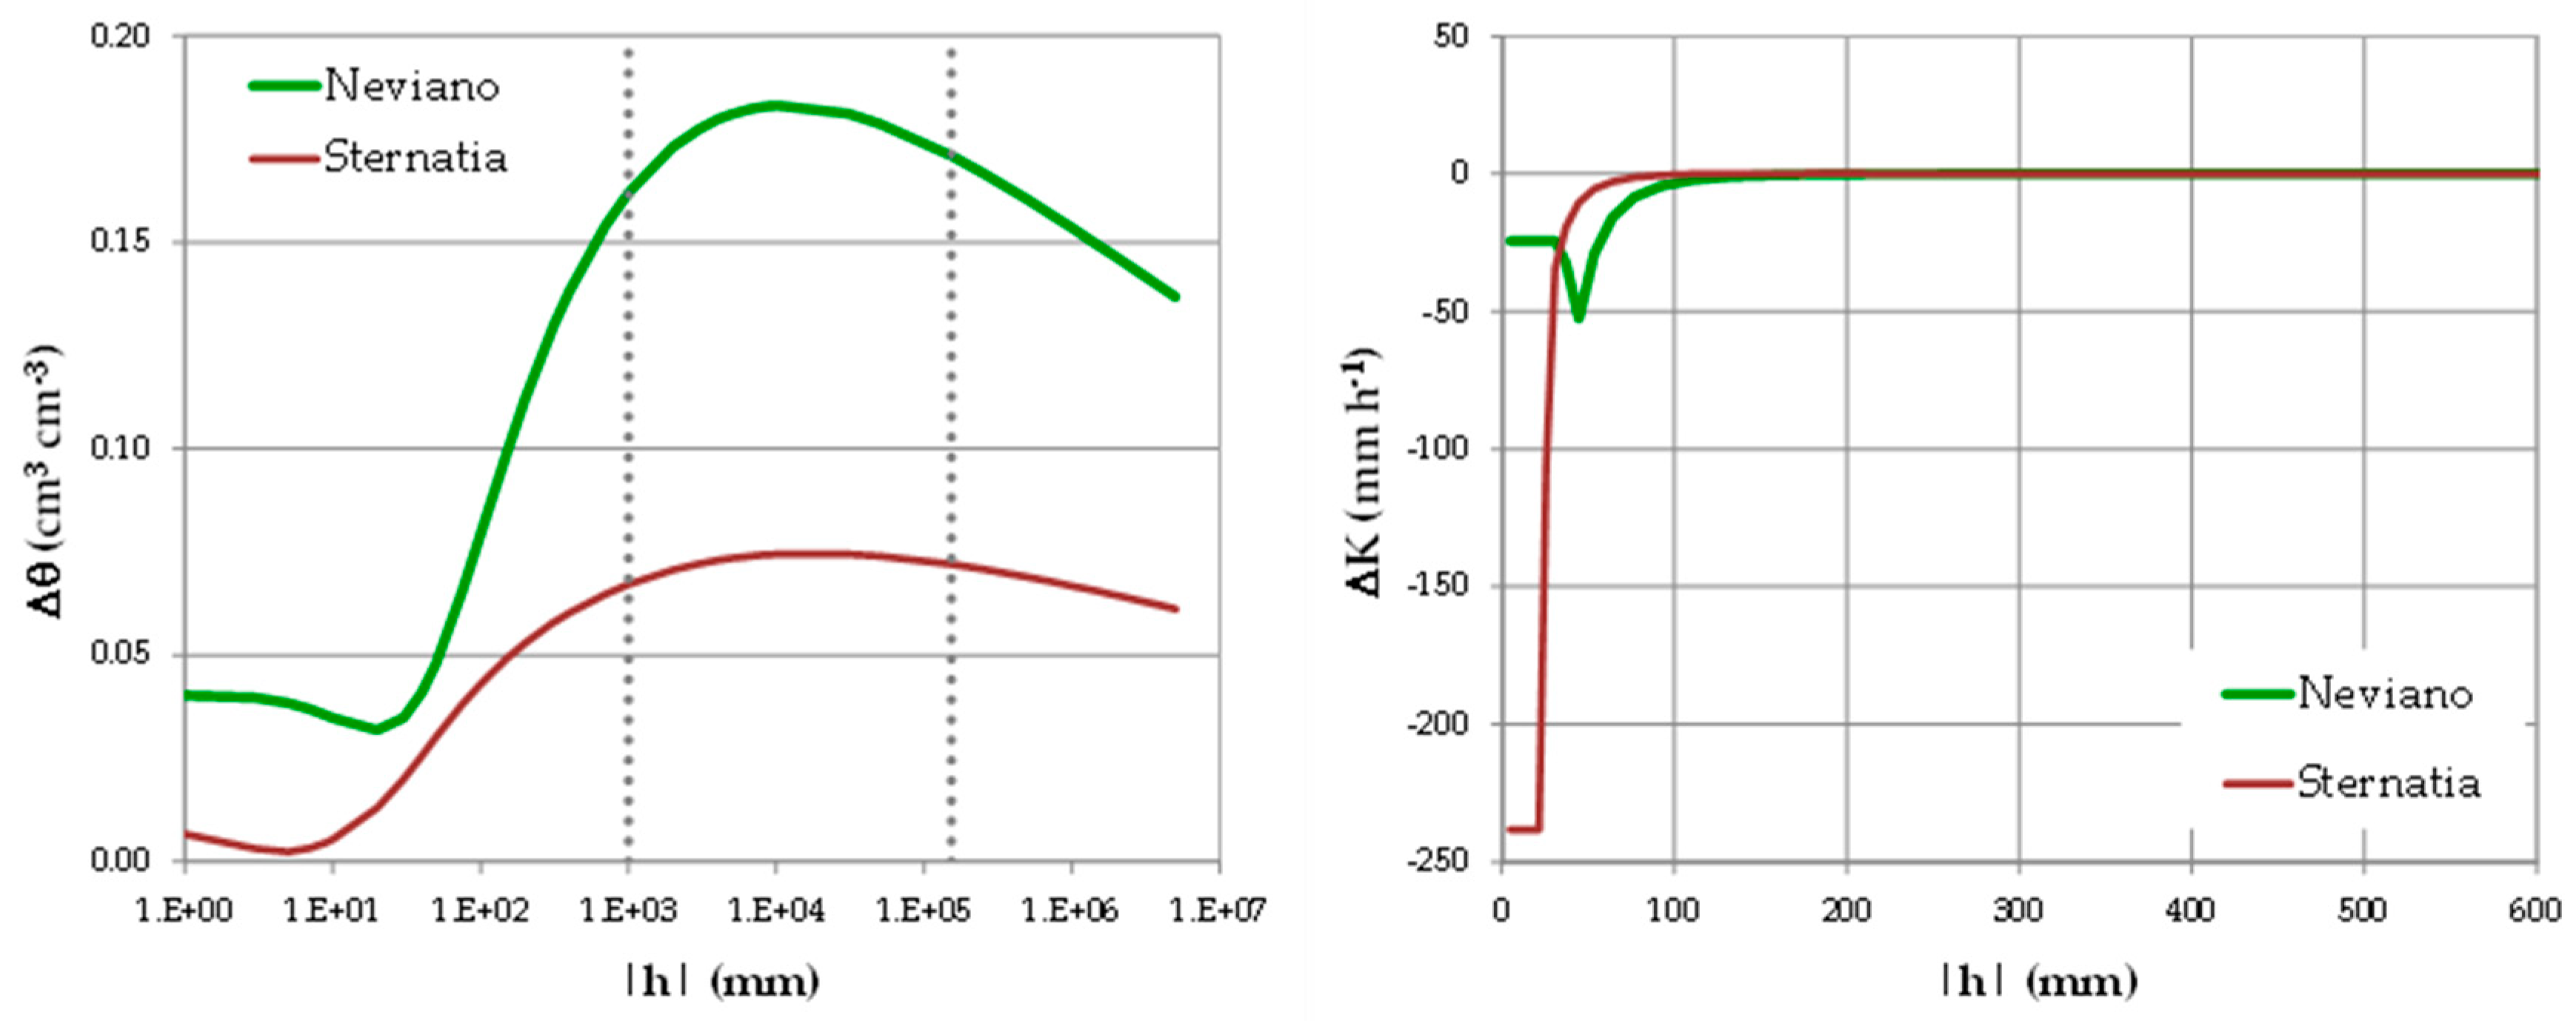
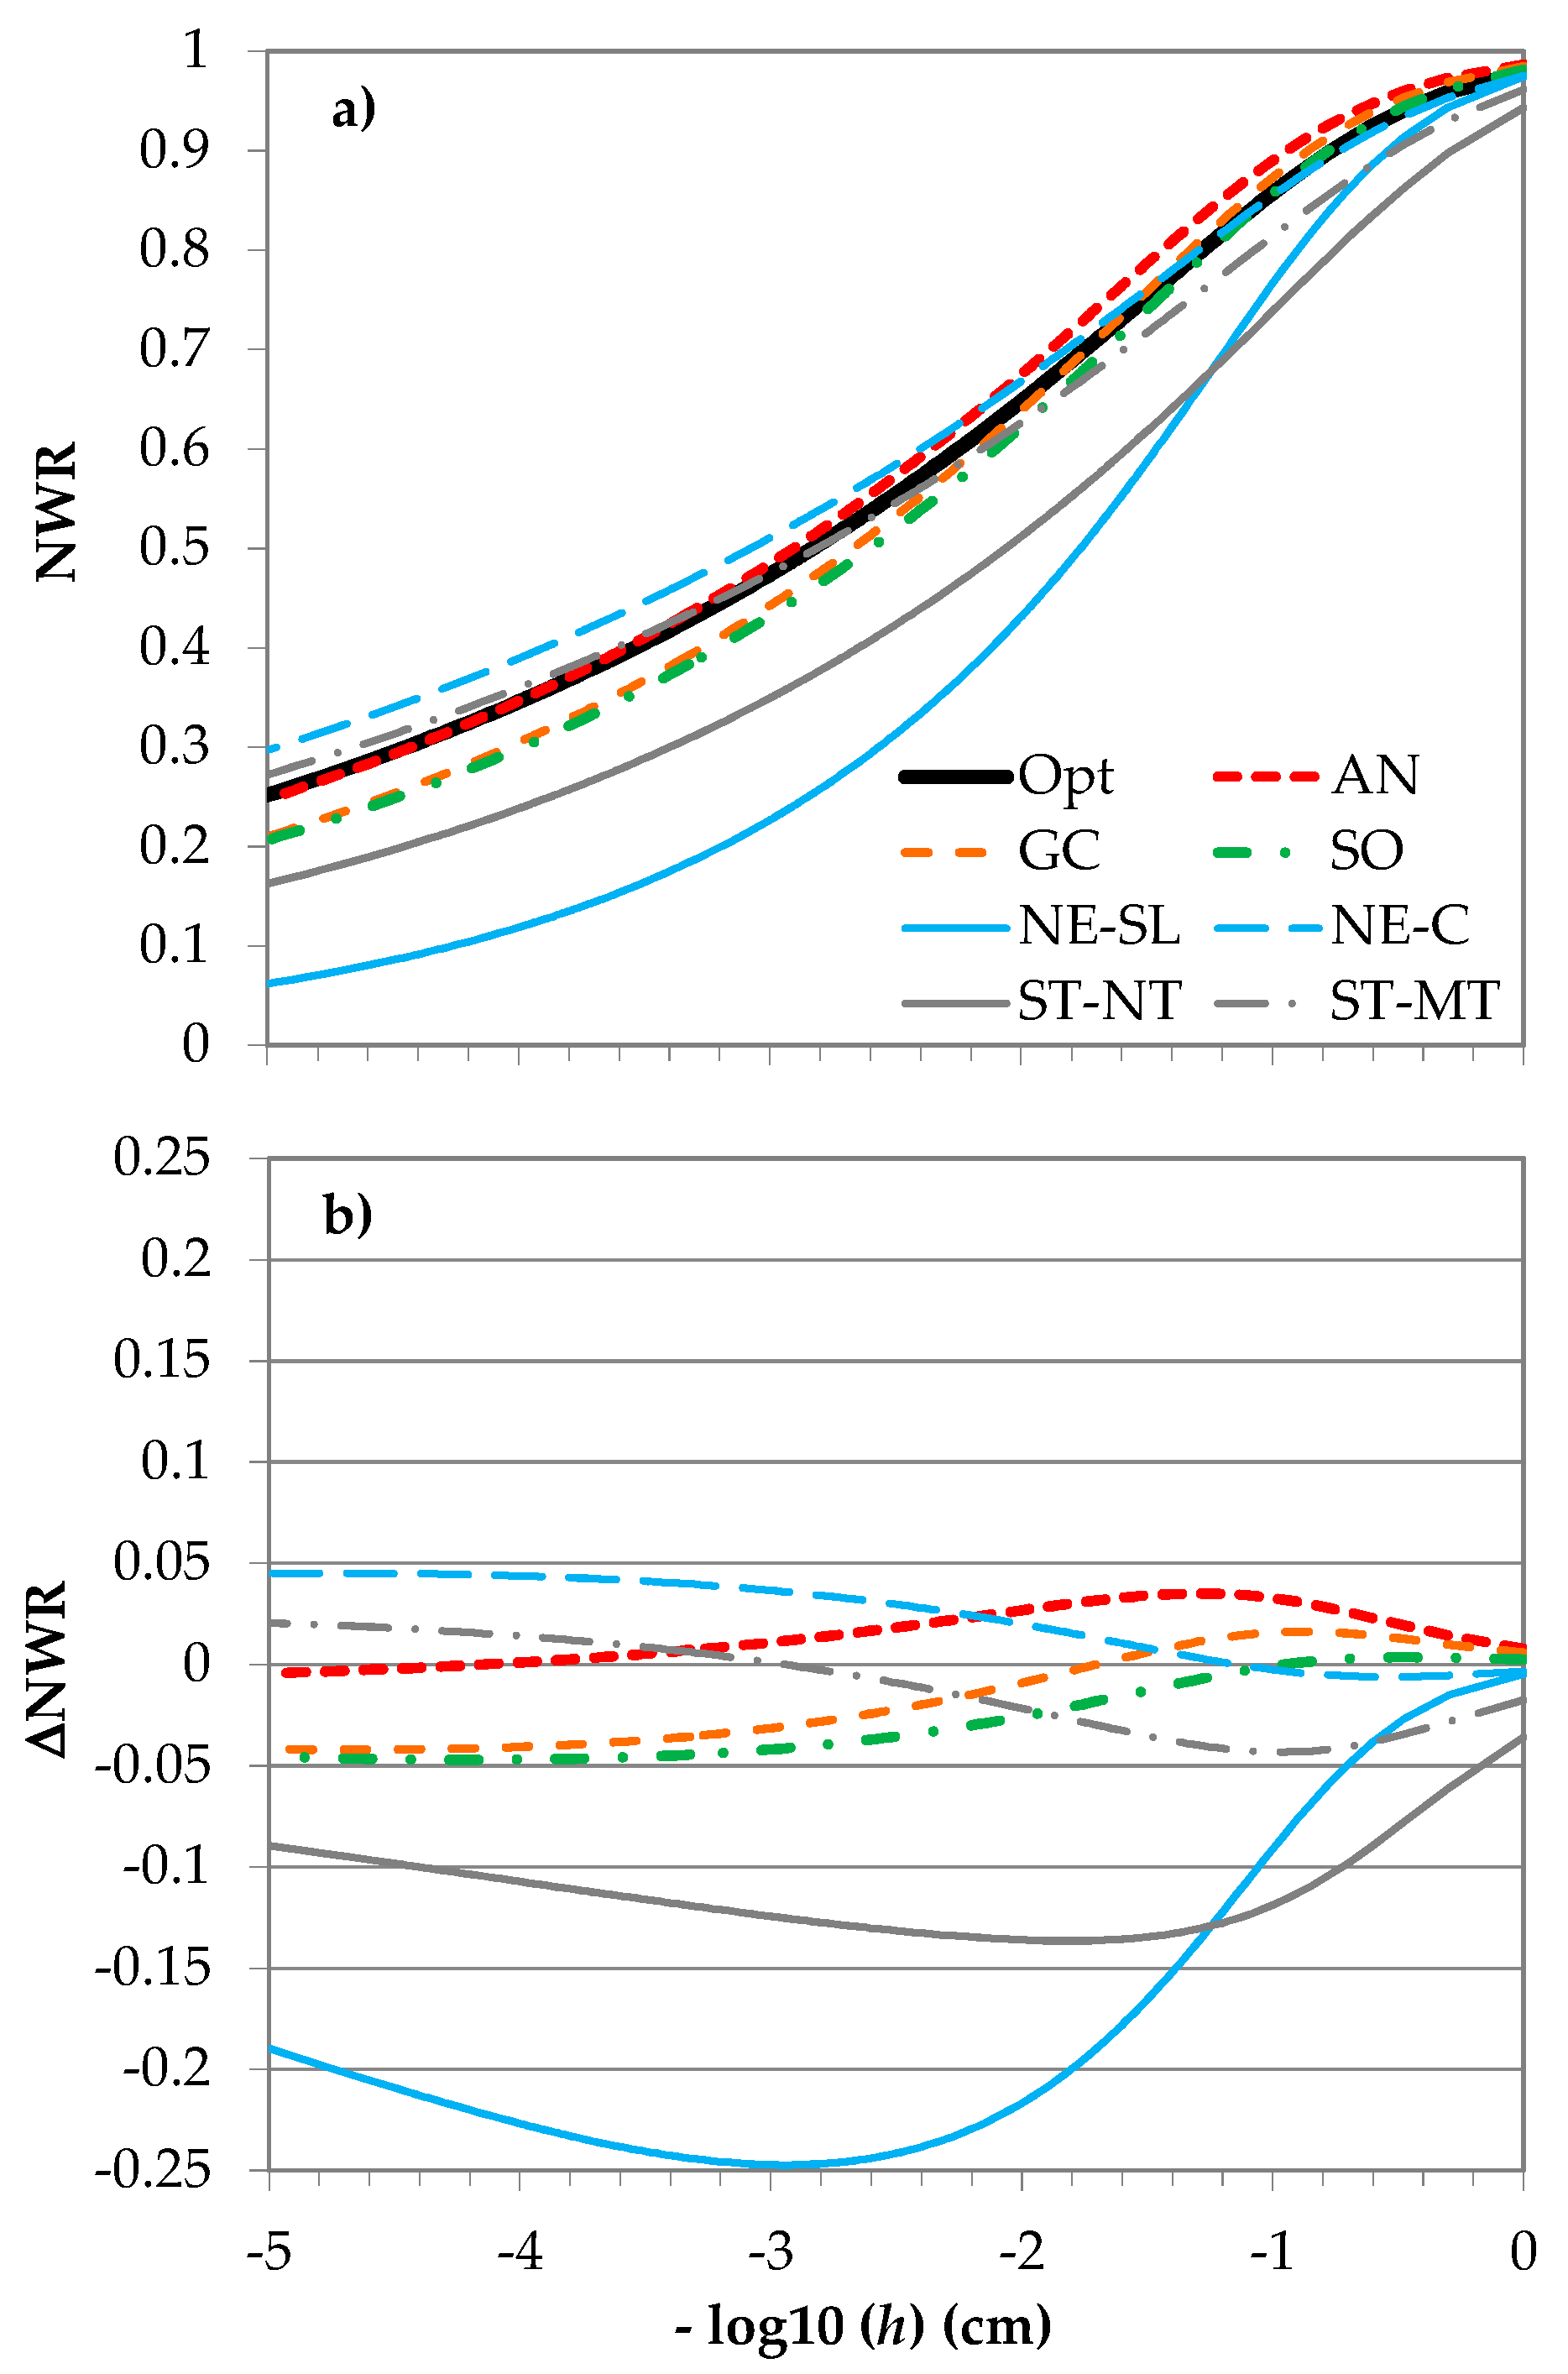
3.3. Impact of Soil Tillage on Physical and Hydraulic Properties of the Soil

Overall, the lack of alternative soil tillage at Andrano, Gagliano del Capo, and Soleto sites prevented to establish comparisons. Consequently, only the sites of Neviano and Sternatia were considered for further investigation.
Results of Neviano are reported in Figure 6. Although the no-tilled sites of Neviano were very close (about 50 m), so we assumed they could have the same soil texture, discrepancies were detected in the particle size distribution, as they were sandy-loam and clay soils. Based on available information, we established that only one of the two sites (i.e., clay soil) was undisturbed for a long time, while the second one (sandy-loam soil) was periodically tilled until sometime before (4–5 years or more). This finding is plausible because, considering that the bedrock was quite superficial in the investigated soils, continuous soil tillage (with or without inversion of the soil layers) may have brought back relatively coarser soil particles to the surface, or determined the downward migration of finer ones. This would explain the highest sand (about 69%) and the lowest clay (about 10%) contents observed at the NE site (Table 1). However, NE sites were comparable in terms of BD, that is, they were not statistically different according to Manici et al. [4], and the probability that the soil was undisturbed for at least five years therefore appears to be founded. As a consequence, observed discrepancies in particle size distribution at Neviano prevented a homogeneous comparison in terms of physical and hydraulic properties of the soil. Specifically, the coarser soil showed BD values higher by a factor 1.1 than the finer one (1.26 and 1.15 g cm−3, respectively for sandy-loam and clay); this resulted in a higher saturated soil water content for the former soil (Figure 6). As a consequence, coarser soil was more conductive than the finer one by a factor 1.3 (Ks equal to 0.028 and 0.021 mm s−1). The shapes of the water retention curves were quite typical, as WRCs of coarser soils are generally less flat as compared to those of finer soils (in other words, the changes of water content as a function of pressure head are relatively larger; therefore, the curve is steeper). Conversely, relatively negligible differences were detected for HCF, with differences in unsaturated hydraulic conductivity, K, by a factor of 2.0 (NE-C/NE-SL) at field capacity (a factor 4.5 when an agronomic field capacity value, i.e., h = 300 cm, was considered).
Sternatia sites showed relatively lower discrepancies (Figure 7). Although ST-MT was sampled a few days after a minimum tillage, comparable BD values were detected (1.18 and 1.20 g cm−3, respectively, under MT and NT). Therefore, a possible soil compaction during sampling may have occurred. However, the WRC modelled by BEST also takes into account soil texture and infiltrometric measurements. For this site, in fact, differences in Ks values by a factor 2.3 were detected (0.051 and 0.117 mm s−1, respectively, for NT and MT). Consequently, discrepancies between soil management in WRC and HCF increased from saturated to unsaturated soil conditions (Figure 7). In agreement with the results discussed so far, HCF showed even smaller K discrepancies, equal to a factor 1.3 (ST-NT/ST-MT) at field capacity (a factor 1.6 at h = 300 cm).
In summary, the differences in water retained in the two soils compared were not negligible (up to 18%), both at field capacity and wilting point (Figure 8). However, results of the homogeneous comparison in terms of soil texture carried out at ST, although they have quantified the maximum discrepancies due to alternative soil tillage (CT and NT), also confirms that optimal soil aeration can be reached with the natural restoration of the soil structure.
The effects of soil management on capacitive-based soil indicators are depicted in Figure 10. In agreement with literature references to establish optimal values for agricultural soils, on average, our findings showed (i) poor (NE-C) or good (NE-SL, ST-MT, and ST-NT) AC values, (ii) always good PAWC values, and (iii) poor (NE-SL and ST-MT) or good (NE-C and ST-NT) RFC values. As a result, soil management effects will be discussed in the next section.

4. Discussion

The optimization of water resources is an open topic in the agriculture of the Mediterranean basin [42], and rational soil management of rainfed orchards needs the knowledge of the hydraulic functions of the soil [43]. For instance, Rallo et al. [44] investigated the relationship between plant and soil water status for mature olive orchards in Sicily using the AQUACROP model to establish critical thresholds of soil water content, in accordance with the vegetative stages. Moreover, in order to apply the selected model on physically based bases, the physical and hydraulic properties of the soil were measured directly using standard methods, and the model parameters were estimated accordingly. Findings allowed to establish two critical thresholds of soil water content at specific soil pressure head values: ‒40 and ‒200 m, equal respectively to 16% and 11% of volumetric soil water content. This result has practical implications for crop production because θ values higher than 16% can assure the absence of water stress, while for lower values (θ < 16%), the crop water stress increased with decreasing soil water contents. In another investigation by Autovino et al. [45], the performance of the physically based hydrological model HYDRUS-2D to predict the soil water contents and transpiration fluxes in a Sicilian irrigated olive orchard was assessed. Also in this investigation, accurate soil characterization has been carried out, and the BEST-procedure, coupled with the tension infiltrometer method, was applied to estimate the hydraulic conductivity of the soil. Main results showed that HYDRUS-2D, in general, was able to reproduce the trends of measured soil water contents at the different distances and depths from the plant row, and, in particular, it was also suitable (i) to estimate actual transpiration, (ii) to identify crop water status during the different stages of crop growth, and therefore (iii) can be used to identify irrigation strategies aimed to cope with water scarcity [45]. As a consequence, the cited studies confirm that the knowledge of the physical and hydraulic properties of the soil is the prerequisite for an adequate modeling of the soil–plant–atmosphere (SPA) system.
In this study, the impact of the soil tillage on physical and hydraulic soil properties was investigated by applying the BEST-procedure to obtain complete soil hydraulic characterization. A preliminary comparative evaluation of BEST among investigated soils allowed establishing that the procedure is applicable for the purposes of comparisons in rainfed orchards.
Specific insights for the soils of Neviano and Sternatia investigated the impact of soil texture and soil tillage, respectively, on soil hydraulic functions. Notably, results confirmed that differences in soil texture determined greater differences as compared to soil tillage. However, findings of this study quantified how the voids of the soil, mainly determined by the different particle size distributions (meso-micropores) or by the induced changes in pore size distribution during tillage (macropores), can modify the balance of water and air into the soil. Consequently, since a lack of information on this topic exists for the soils of Salento, this case study can represent a contribution of knowledge to better understand the soil tillage impact on water saving in dry-farmed olive orchards. Figure 9a shows the comparison between the retention curves of the investigated soils obtained by BEST and the “optimal” one, as suggested by Reynolds et al. [35]. Among those considered in the study, two curves (i.e., NE-SL and ST-NT) differed more than the literature reference, and the differences in water retention between estimated and optimal values (Figure 9b) may be summarized, on average, by the sequence NE-SL > ST-NT > SO > NE-C > GC > AN > ST-MT. Therefore, based on this criterion, the main result of this analysis suggests that, compared with no tillage, minimum tillage improved the soil water retention, as to obtain a curve with slightly greater degrees of saturation than that of the optimal curve (i.e., for pore sizes up to 1 μm, and lower ones for bigger soil pores).
Among capacitive-based soil indicators considered in this investigation, references of literature suggest that multivariate analysis has identified the relative field capacity (RFC) as a key soil physical indicator, as it partially combines the air capacity (AC) and plant available water capacity (PAWC) of the soil, thus expressing the optimal air/water ratio into the porous medium [31]. As a consequence, RFC was selected to compare the investigated olive orchards. Figure 10 clearly shows that, compared to NE-C, NE-SL showed an imbalance of the soil properties towards excessive aeration (RFC < 0.6), with potential negative effects such as the reduction in microbial activity and nitrate production because of insufficient soil water [30]. This result fully summarizes the possible effect of the different soil textures on the optimal water–air availability in the soil.
On the other hand, the comparison between NT and MT at Sternatia highlighted the possible RFC range between a long-term no-tilled soil (ST-NT) and a recently tilled one (ST-MT) (Figure 10). For this second case study, our results showed that ST-NT soil had optimal average RFC values, and that surface soil tillage (MT) induced an obvious increase in soil porosity. However, this relatively negative soil condition (RFC < 0.6) should be considered as temporary because such optimal RFC values (0.6–0.7) are theoretically achievable again, in accordance with the time for a natural re-consolidation of the soil. Moreover, MT is traditionally suggested in dry-farming as useful practice to break the continuity of the soil capillaries and decrease water losses by evaporation or to control the spread of weeds (both in conventional and biological agriculture). Moreover, according with the current European legislation, this option should ensure to control disease vectors in southern Italy [4,46].
Overall, several investigations in the Mediterranean basin have evaluated the impact of surface tillage (i.e., minimum or conventional) on soil erosion [47,48], pointing out that the shift to organic farming (i.e., reduction of soil tillage; spread of agronomic management systems that incorporate a vegetative cover) could assure an increased protection of the soil and a corresponding lowered erosion risk. However, Salento soils are generally flat, and under the experimental conditions of the Sternatia site, ST-CT has shown a lower saturated hydraulic conductivity than that of ST-MT by a factor of 2.3. This should allow a better wetting of the soil profile even for low rainy events (lower water losses due to deep percolation) and, consequently, the improvement of the soil water storage.

5. Conclusions

This study represents a contribution of knowledge for water resource optimization of the olive orchards of Salento, and the impact of minimum and no tillage on soil water retention was quantified through well-established guidelines of literature.
The BEST- procedure was able to model the hydraulic functions of the soil through a simple and relatively quick procedure, with an acceptable degree of accuracy, and it was able to provide indicators to quantify the impact of soil use on water saving. Therefore, its reliability was established for agro-environments different from those so far tested.
The positive effects of the minimum tillage, as compared to a long-term no-tilled soil, were clearly highlighted, and comparisons with optimal values in the literature strengthened the experimental information reached. Consequently, although periodic surface tillage seems an advisable solution to improve the water reserve of the soils, further investigations are necessary to verify such findings in order to improve the sustainability of the arid Mediterranean environments.

Author Contributions

Conceptualization, M.C.; methodology, M.C.; formal analysis, M.C.; investigation, M.C. and M.M.; data curation, M.C. and F.C.; writing—original draft preparation, M.C.; writing—review and editing, M.C., A.M.S., and L.M.M. All authors have read and agreed to the published version of the manuscript.

Acknowledgments

This work was supported and funded by Apulia region, Policy Area for Rural Development, Agriculture Service, through the EZIOCONTROL project, approved in the section B, called “CODIRO” Determination of the Director of Agriculture Service n. 495 of 14 October 2015. The authors would like to thank the owner of the farm “Piana del Lentisco”, Andrea Melcarne, for his availability and support provided in the GC field, and Marcello Mastrorilli for the valuable suggestions. The authors also thank the anonymous reviewers who contributed to the improvement of the manuscript.

Conflicts of Interest

The authors declare no conflict of interest.

References

  1. Ventrella, D.; Charfeddine, M.; Giglio, L.; Castellini, M. Application of DSSAT models for an agronomic adaptation strategy under climate change in Southern Italy: Optimum sowing and transplanting time for winter durum wheat and tomato. Ital. J. Agron. 2012, 7, 109–115. [Google Scholar] [CrossRef]
  2. Ventrella, D.; Giglio, L.; Charfeddine, M.; Lopez, R.; Castellini, M.; Sollitto, D.; Castrignanò, A.; Fornaro, F. Climate change impact on crop rotations of winter durum wheat and tomato in southern Italy: yield analysis and soil fertility. Ital. J. Agron. 2012, 7, 100–108 e15. [Google Scholar] [CrossRef] [Green Version]
  3. Tanasijevic, L.; Todorovic, M.; Pereira, L.S.; Pizzigalli, C.; Lionello, P. Impacts of climate change on olive crop evapotranspiration and irrigation requirements in the Mediterranean region. Agri. Water Manag. 2014, 144, 54–68. [Google Scholar] [CrossRef]
  4. Manici, L.M.; Castellini, M.; Caputo, F. Soil-inhabiting fungi can integrate soil physical indicators in multivariate analysis of Mediterranean agroecosystem dominated by old olive groves. Ecol. Indic. 2019, 106, 105490. [Google Scholar] [CrossRef]
  5. Busari, M.A.; Kukai, S.S.; Kaur, A.; Bhatt, R.; Dulazi, A.A. Conservation tillage impacts on soil, crop and the environment. Int. Soil Water Conserv. Res. 2015, 3, 119–129. [Google Scholar] [CrossRef] [Green Version]
  6. Cameira, M.R.; Fernando, R.M.; Pereira, L.S. Soil macropore dynamics affected by tillage and irrigation for a silty loam alluvial soil in southern Portugal. Soil Till. Res. 2003, 70, 131–140. [Google Scholar] [CrossRef]
  7. Strudley, M.W.; Green, T.R.; Ascough, J.C., II. Tillage effects on soil hydraulic properties in space and time: State of the science. Soil Till. Res. 2008, 99, 4–48. [Google Scholar] [CrossRef]
  8. Castellini, M.; Ventrella, D. Impact of conventional and minimum tillage on soil hydraulic conductivity in typical cropping system in southern Italy. Soil Till. Res. 2012, 124, 47–56. [Google Scholar] [CrossRef]
  9. Xiloyannis, C.; Martinez Raya, A.; Kosmas, C.; Favia, M. Semi-intensive olive orchards on sloping land: requiring good land husbandry for future development. J. Environ. Manag. 2008, 89, 110–119. [Google Scholar] [CrossRef]
  10. Palese, A.M.; Vignozzi, N.; Celano, G.; Agnelli, A.E.; Pagliai, M.; Xiloyannis, C. Influence of soil management on soil physical characteristics and water storage in a mature rainfed olive orchard. Soil Till. Res. 2014, 144, 96–109. [Google Scholar] [CrossRef]
  11. Gucci, R.; Caruso, G.; Bertolla, C.; Urbani, S.; Taticchi, A.; Esposto, S.; Servili, M.; Sifola, M.I.; Pellegrini, S.; Pagliai, M.; et al. Changes of soil properties and tree performance induced by soil management in a high-density olive orchard. Eur. J. Agron. 2012, 41, 18–27. [Google Scholar] [CrossRef]
  12. Vignozzi, N.; Agnelli, A.E.; Brandi, G.; Gagnarli, E.; Goggioli, D.; Lagomarsino, A.; Caruso, G. Soil ecosystem functions in a high-density olive orchard managed by different soil conservation practices. Appl. Soil Ecol. 2019, 134, 64–76. [Google Scholar] [CrossRef]
  13. Castellini, M.; Pirastru, M.; Niedda, M.; Ventrella, D. Comparing physical quality of tilled and no-tilled soils in an almond orchard in southern Italy. Ital. J. Agron. 2013, 8, 149–157. [Google Scholar] [CrossRef]
  14. Castellini, M.; Iovino, M. Pedotransfer functions for estimating soil water retention curve of Sicilian soils. Arch. Agron. Soil Sci. 2019, 65, 1401–1416. [Google Scholar] [CrossRef]
  15. Castellini, M.; Stellacci, A.M.; Tomaiuolo, M.; Barca, E. Spatial Variability of Soil Physical and Hydraulic Properties in a Durum Wheat Field: An Assessment by the BEST-Procedure. Water 2019, 11, 1434. [Google Scholar] [CrossRef] [Green Version]
  16. Lassabatère, L.; Angulo-Jaramillo, R.; Ugalde, J.M.S.; Cuenca, R.; Braud, I.; Haverkamp, R. Beerkan estimation of soil transfer parameters through infiltration experiments: BEST. Soil Sci. Soc. Am. J. 2006, 70, 521–532. [Google Scholar] [CrossRef]
  17. Haverkamp, R.; Ross, P.J.; Smettem, K.R.J.; Parlange, J.Y. Three-dimensional analysis of infiltration from the disc infiltrometer: 2. Physically based infiltration equation. Water Resour. Res. 1994, 30, 2931–2935. [Google Scholar] [CrossRef] [Green Version]
  18. Van Genuchten, M.T. A closed-form equation for predicting the hydraulic conductivity of unsaturated soils. Soil Sci. Soc. Am. J. 1980, 44, 892–898. [Google Scholar] [CrossRef] [Green Version]
  19. Burdine, N.T. Relative permeability calculation from pore size distribution data. Petr. Trans. Am. Inst. Min. Metall. Eng. 1953, 198, 71–77. [Google Scholar] [CrossRef]
  20. Brooks, R.H.; Corey, T. Hydraulic properties of porous media. In Hydrology Papers 3; Colorado State University: Fort Collins, CO, USA, 1964; p. 27. [Google Scholar]
  21. Castellini, M.; Di Prima, S.; Iovino, M. An assessment of the BEST procedure to estimate the soil water retention curve: A comparison with the evaporation method. Geoderma 2018, 320, 82–94. [Google Scholar] [CrossRef]
  22. Bagarello, V.; Di Prima, S.; Iovino, M. Comparing Alternative Algorithms to Analyze the Beerkan Infiltration Experiment. Soil Sci. Soc. Am. J. 2014, 78, 724–736. [Google Scholar] [CrossRef]
  23. Di Prima, S. Automatic analysis of multiple Beerkan infiltration experiments for soil Hydraulic Characterization. In Proceedings of the 1st CIGR Inter-Regional Conference on Land and Water Challenges, Bari, Italy, 10–14 September 2013; p. 127. [Google Scholar]
  24. Di Prima, S. Automated single ring infiltrometer with a low-cost microcontroller circuit. Comput. Electron. Agr. 2015, 118, 390–395. [Google Scholar] [CrossRef]
  25. Lassabatère, L.; Di Prima, S.; Angulo-Jaramillo, R.; Keesstra, S.; Salesa, D. Beerkan multi-runs for characterizing water infiltration and spatial variability of soil hydraulic properties across scales. Hydrolog. Sci. J. 2019, 64, 165–178. [Google Scholar] [CrossRef]
  26. Yang, J.; Xu, X.; Liu, M.; Xu, C.; Luo, W.; Song, T.; Du, H.; Kiely, G. Effects of Napier grass management on soil hydrologic functions in a karst landscape, southwestern China. Soil Till. Res. 2016, 157, 83–92. [Google Scholar] [CrossRef]
  27. Yang, J.; Xu, X.; Liu, M.; Xu, C.; Zhang, Y.; Luo, W.; Zhang, R.; Li, Z.; Kiely, G. Effects of Grain for Green program on soil hydrologic functions in karst landscapes, southwestern China. Agric. Ecosyst. Environ. 2017, 247, 120–129. [Google Scholar] [CrossRef]
  28. Khaledian, M.R.; Shabanpour, M.; Alinia, H. Saturated hydraulic conductivity variation in a small garden under drip irrigation. Geosystem Engineering 2016, 19, 266–274. [Google Scholar] [CrossRef]
  29. Di Prima, S.; Rodrigo-Comino, J.; Novara, A.; Iovino, M.; Pirastru, M.; Keesstra, S.; Cerda, A. Soil physical quality of citrus orchards under tillage, herbicide, and organic managements. Pedosphere 2018, 28, 463–477. [Google Scholar] [CrossRef] [Green Version]
  30. Gee, G.W.; Bauder, J. Particle-size Analysis. In Methods of Soil Analysis, Part 1, 2nd ed.; American Society of Agronomy/Soil Science Society of America: Madison, WI, USA, 1986. [Google Scholar]
  31. Castellini, M.; Fornaro, F.; Garofalo, P.; Giglio, L.; Rinaldi, M.; Ventrella, D.; Vitti, C.; Vonella, A.V. Effects of no-tillage and conventional tillage on physical and hydraulic properties of fine textured soils under winter wheat. Water 2019, 11, 484. [Google Scholar] [CrossRef] [Green Version]
  32. Di Prima, S.; Lassabatere, L.; Bagarello, V.; Iovino, M.; Angulo-Jaramillo, R. Testing a new automated single ring infiltrometer for Beerkan infiltration experiments. Geoderma 2016, 262, 20–34. [Google Scholar] [CrossRef]
  33. Reynolds, W.D.; Bowman, B.T.; Drury, C.F.; Tan, C.S.; Lu, X. Indicators of good soil physical quality: density and storage parameters. Geoderma 2002, 110, 131–146. [Google Scholar] [CrossRef]
  34. Ferrara, R.M.; Mazza, G.; Muschitiello, C.; Castellini, M.; Stellacci, A.M.; Navarro, A.; Lagomarsino, A.; Vitti, C.; Rossi, R.; Rana, G. Short-term effects of conversion to no-tillage on respiration and chemical-physical properties of the soil: A case study in a wheat cropping system in semi-dry environment. Ital. J. Agrometeorol. 2017, 1, 47–58. [Google Scholar] [CrossRef]
  35. Reynolds, W.D.; Drury, C.F.; Tan, C.S.; Fox, C.A.; Yang, X.M. Use of indicators and pore volume-function characteristics to quantify soil physical quality. Geoderma 2009, 152, 252–263. [Google Scholar] [CrossRef]
  36. Castellini, M.; Stellacci, A.M.; Barca, E.; Iovino, M. Application of multivariate analysis techniques for selecting soil physical quality indicators: A case study in long-term field experiments in Apulia (southern Italy). Soil Sci. Soc. Am. J. 2019, 83, 707–720. [Google Scholar] [CrossRef] [Green Version]
  37. Di Prima, S.; Castellini, M.; Abou Najm, M.R.; Stewart, R.D.; Angulo-Jaramillo, R.; Winiarski, T.; Lassabatere, L. Experimental assessment of a new comprehensive model for single ring infiltration data. J. Hydrol. 2019, 573, 937–951. [Google Scholar] [CrossRef] [Green Version]
  38. Elrick, D.E.; Reynolds, W.D. Methods for analyzing constant-head well permeameter data. Soil Sci. Soc. Am. J. 1992, 56, 320. [Google Scholar] [CrossRef]
  39. Reynolds, W.D.; Lewis, J.K. A drive point application of the Guelph Permeameter method for coarse-textured soils. Geoderma 2012, 187–188, 59–66. [Google Scholar] [CrossRef]
  40. Di Prima, S.; Stewart, R.D.; Castellini, M.; Bagarello, V.; Abou Najm, M.R.; Pirastru, M.; Giadrossich, F.; Iovino, M.; Angulo-Jaramillo, R.; Lassabatere, L. Estimating the macroscopic capillary length from Beerkan infiltration experiments. J. Hydrol. Submitted.
  41. Bagarello, V.; Castellini, M.; Iovino, M.; Sgroi, A. Testing the concentric-disk tension infiltrometer for field measurements of soil hydraulic conductivity. Geoderma 2010, 158, 427–435. [Google Scholar] [CrossRef]
  42. Rallo, G.; Provenzano, G.; Castellini, M.; Sirera, À.P. Application of EMI and FDR Sensors to assess the fraction of transpirable soil water over an olive grove. Water 2018, 10, 168. [Google Scholar] [CrossRef] [Green Version]
  43. Guzmán, G.; Perea-Moreno, A.-J.; Gómez, J.A.; Cabrerizo-Morales, M.Á.; Martínez, G.; Giráldez, J.V. Water Related Properties to Assess Soil Quality in Two Olive Orchards of South Spain under Different Management Strategies. Water 2019, 11, 367. [Google Scholar] [CrossRef] [Green Version]
  44. Rallo, G.; Agnese, C.; Minacapilli, M.; Provenzano, G. Assessing AQUACROP water stress function to evaluate the transpiration reductions of olive mature tree. Ital. J. Agrometeorol. 2012, 1, 21–28. [Google Scholar]
  45. Autovino, D.; Rallo, G.; Provenzano, G. Predicting soil and plant water status dynamic in olive orchards under different irrigation systems with Hydrus-2D: Model performance and scenario analysis. Agric. Water Manag. 2018, 203, 225–235. [Google Scholar] [CrossRef]
  46. Cornara, D.; Saponari, M.; Zeilinger, A.R.; de Stradis, A.; Boscia, D.; Loconsole, G.; Bosco, D.; Martelli, G.P.; Almeida, R.P.P.; Porcelli, F. Spittlebugs as vectors of Xylella fastidiosa in olive orchards in Italy. J. Pest Sci. 2017, 90, 521. [Google Scholar] [CrossRef] [PubMed] [Green Version]
  47. Milgroom, J.; Soriano, M.A.; Garrido, J.M.; Gómez, J.A.; Fereres, E. The influence of a shift from conventional to organic olive farming on soil management and erosion risk in southern Spain. Renew. Agric. Food Syst. 2007, 22, 1–10. [Google Scholar] [CrossRef]
  48. Rodrigo-Comino, J.; Taguas, E.; Seeger, M.; Ries, J.B. Quantification of soil and water losses in an extensive olive orchard catchment in Southern Spain. J. Hydrol. 2018, 556, 749–758. [Google Scholar] [CrossRef]
Figure 1. Images of Gagliano del Capo (GC), Andrano (AN), and Sternatia-MT (ST-MT) sites and corresponding soil tillage conditions (i.e., NT or MT, respectively GC, AN, or ST-MT) at the time of infiltration measurements.
Agronomy 10 00177 g001
Figure 2. Schematic representation of the soil water retention curve (SWR; observed, obs, and modeled, mod) to show the calculation of air capacity (AC), plant available water capacity (PAWC), and the relative field capacity (RFC) of the soil. PWP, FC, and SWC are the abbreviations for permanent wilting point, field capacity, and saturated soil water content, respectively.
Agronomy 10 00177 g002
Figure 3. Soil water retention curve and hydraulic conductivity function (left and right, respectively) obtained for a given class of soil texture (fine, medium, and coarse; (a,b)), soil bulk density range (lower than 1.2 g cm−3, between 1.2 and 1.4 g cm−3, and higher than 1.4 g cm−3; (c,d)), or soil capillarity class (10 < λc < 42 mm, 42 ≤ λc ≤ 250 mm, and 250 ≤ λc ≤ 1000 mm representing weak, moderate, and strong, respectively; (e,f)).
Agronomy 10 00177 g003
Figure 4. Comparison between predicted (θp) and measured (θm) soil water retention at Neviano and Sternatia sites (a) and corresponding differences as a function of soil pressure head (h) values (b).
Agronomy 10 00177 g004
Figure 5. Relationships between mean values of air capacity (AC) and relative field capacity (RFC) as a function of soil bulk density (BD), corresponding to the five sites investigated.
Agronomy 10 00177 g005
Figure 6. Soil water retention curve and hydraulic conductivity function (left and right, respectively) obtained at the Neviano site.
Agronomy 10 00177 g006
Figure 7. Soil water retention curve and hydraulic conductivity function (left and right, respectively) obtained at the Sternatia site.
Agronomy 10 00177 g007
Figure 8. Differences in soil water retention (Δθ) and in hydraulic conductivity (ΔK) as a function of soil pressure head (h) for Neviano (differences between clay and sandy-loam) and Sternatia (differences between no-tillage and minimum tillage). Vertical bars represent θ values at field capacity and wilting point.
Agronomy 10 00177 g008
Figure 9. (a) Normalized water retention (NWR) of investigated soils plotted with the “optimal” (Opt) curve by Reynolds at al. [35], and (b) corresponding differences (estimated–optimal) in normalized water retention values (ΔNWR) as a function of soil pressure head, h.
Agronomy 10 00177 g009
Figure 10. Air capacity (AC), plant available water capacity (PAWC), and relative field capacity (RFC) values. Open symbols represent discrete values and lines mean values. The optimal range or critical limits as suggested in the literature were represented with dashed lines.
Agronomy 10 00177 g010
Table 1. Clay, silt, and sand contents (0–0.1 m depth) according to the USDA classification and soil total organic carbon content (TOC) for each site and soil management (minimum tillage, MT, and no-tillage, NT).
SiteAcronymClay (%)Silt (%)Sand (%)Texture Classification (USDA)Soil ManagementTOC (g kg−1)
AndranoAN32.426.241.3Clay-LoamNT12.4
Gagliano del CapoGC28.218.153.7Sandy-Clay-LoamNT14.7
SoletoSO29.113.257.7Sandy-Clay-LoamNT14.8
NevianoNE-SL9.921.368.9Sandy-LoamNT10.1
NE-C46.716.337.0ClayNT9.9
SternatiaST-MT26.816.956.2Sandy-Clay-LoamMT14.7
ST-NT40.216.843.0ClayNT11.9
Table 2. Mean and associated coefficient of variation (in brackets) of air capacity (AC), plant available water capacity (PAWC), and relative field capacity (RFC) obtained for the three soil texture classes.
FineMediumCoarse
Sample size12166
AC (cm3 cm−3)0.066 (72.7)0.074 (55.5)0.112 (20.3)
PAWC (cm3 cm−3)0.161 (9.5)0.160 (7.4)0.169 (6.2)
RFC (−)0.666 (9.6)0.603 (9.5)0.435 (6.2)
Table 3. Mean and associated coefficient of variation (in brackets) of air capacity (AC), plant available water capacity (PAWC), and relative field capacity (RFC) obtained for the three soil bulk density classes.
BD < 1.2 g cm−31.2 ≤ BD ≤ 1.4 g cm−3BD > 1.4 g cm−3
Sample size6235
AC (cm3 cm−3)0.121 (57.6)0.067 (43.1)0.049 (34.7)
PAWC (cm3 cm−3)0.156 (15.9)0.164 (5.5)0.157 (5.6)
RFC (−)0.572 (19.3)0.615 (13.7)0.635 (5.6)
Table 4. Mean and associated coefficient of variation (in brackets) of air capacity (AC), plant available water capacity (PAWC), and relative field capacity (RFC) obtained for three soil capillarity λc (mm) classes (week, moderate, and strong, respectively).
10 < λc < 4242 ≤ λc ≤ 250250 ≤ λc ≤ 1000
Sample size41317
AC (cm3 cm−3)0.207 (18.2)0.085 (27.8)0.049 (36.0)
PAWC (cm3 cm−3)0.124 (2.9)0.159 (6.2)0.168 (3.5)
RFC (−)0.455 (13.0)0.581 (12.1)0.655 (9.9)

