Article

Agrobiodiversity for Adaptive and Yield Traits in Romanian and Italian Barley Cultivars across Four Continental Environments

1
Council for Agricultural Research and Economics, Centre for Genomics and Bioinformatics CREA-GB, Via San Protaso, 302, 29017 Fiorenzuola d’Arda, PC, Italy
2
National Agricultural Research and Development Institute Fundulea, N. Titulescu street, 1, Fundulea, 915200 Calarasi, Romania
*
Author to whom correspondence should be addressed.
These authors contributed equally to this work.
Agronomy 2018, 8(6), 79; https://doi.org/10.3390/agronomy8060079
Submission received: 2 May 2018 / Revised: 14 May 2018 / Accepted: 16 May 2018 / Published: 23 May 2018

Abstract

:
Within temperate climates the frequency and severity of high and low temperature stresses vary with continentality. The current study reports on the assessment of the performance of 49 barley cultivars across four environments. The cultivars stem from 50 years of breeding activities in Romania and Italy, in two temperate climates that differ in continentality. The plants were phenotyped through stress monitoring, measurements of yield and yield related traits as well as laboratory stress tolerance tests. Genotypes for alleles of vernalisation and photoperiod genes were determined. These genes were significantly associated with frost damage in the field and frost tolerance in laboratory tests. Grain yield (GY) was more closely correlated with the number of grain sinks than with the degree of grain filling indicating major limitations in the vegetative growth phase and during grain initiation. High temperature stress during the grain filling phase significantly reduced GY. Frost damage due to freezing temperatures below −10 °C when plants were not protected by snow cover significantly reduced GY of sensitive cultivars. The characterisation of environmental cues that cause stresses with yield penalties as well as the susceptibility of genetically different cultivars lay the ground for future targeted selection.

1. Introduction

Barley is a small grain cereal crop with a wide range of adaptation to climatic and soil conditions [1]. It is well suited for cultivation in autumn/winter sowing in continental climates. Autumn sowing allows using the combination of winter precipitation and low evapotranspiration during winter to improve agronomic water use efficiency [2]. In addition it leads to longer growing seasons than spring sowing, thus boosting productivity and avoiding late season drought and heat stresses. Autumn sowing can be of special advantage under current climate change trends. In many regions climate change leads to a combination of warmer winters, and increases the probability of late season drought and heat stress events [3]. Autumn sowing then allows exploitation of more favourable thermal conditions in winter and reduction of the exposure to late season stresses. However, even though climate change generally leads to warmer conditions, the plants still have to cope with winter frost events. Climate change, though leading to higher winter temperatures and thus alleviation of stresses related to frost, may also increase the probability of episodic low temperature incursions from the arctic [4]. The warming climate permits the extension of cereal cultivation in Europe to higher latitudes and altitudes [5]. Moreover, the exposure of plants to low non-freezing temperatures is essential for acclimation of cereals (hardening) which is necessary for winter survival. Plants can also suffer from freezing stress when de-acclimation occurs because of the warmer climate background [6]. Furthermore, low temperatures are determinant for the success of cultivation influencing growth, heading date and, consequently, yield and quality of products. In cultivars that require vernalisation (i.e., exposure to low temperatures) for the transition to generative development [7] or reduction of the time to flowering [8,9], warm winters can limit the satisfaction of vernalisation requirement.
Thus, winter hardiness, vernalisation and the response to photoperiod remain decisive for crop growth and yield under changing environmental conditions [7,8,9,10,11,12,13,14,15,16,17].
High temperatures have been shown to limit grain yield in temperate small grain cereals. Evidences for the detrimental effect of elevated temperatures come from statistical analyses of climate—yield relationships [18], modelling studies [19] and experiments with controlled temperature regimes [20].
The study of genetic diversity in the cultivated germplasm by analysing landraces and cultivars selected in different environments can be of great utility to maintain and, when possible, improve yield and quality in crops [21]. In recent years a notable number of studies have explored the genetic diversity present in diverse cereal species and environments [3,22,23,24,25,26,27]. Diversification within domesticated species and the potential to exploit this diversity for further selection was described in these studies. To this aim the identification of factors determinant for crop adaptation in different geographical areas is a challenge at present and in future in consideration of climate change scenarios [3].
Here, we report on a study of barley varieties independently bred within the last 50 years in two European countries characterised by different continentality, Romania (Eastern Europe) and Italy (Mediterranean). An economically important objective for barley breeding in Romania is to improve varieties suitable for malting [28] and animal feed. The beer production sector is a key factor for Romania’s economic growth. Three elements place the beer industry among the key economic sectors for the development of Romania: over 97% of marketed beer comes from national production; a high level of investments in beer making; and 70% of the raw material (malt) is produced in Romania (Annual report of Romania’s brewers, 2017 edition, p. 32). In Italy the barley use is dominated by feed, with the Northern regions cultivating mainly winter barley designated to cow and pig raising. Barley cultivation for malt production is concentrated in the Central and Southern regions of the country [29]. In the last three decades demand increased for barley with specific qualitative traits for the production of functional foods and improvement of diets for animal feed. This favours selection of new cultivars with diversification of grain quality characteristics.
Grain yield, yield related traits and extreme temperature response of cultivars were compared in four environments. The challenge is “a posteriori” identification of key traits for adaptation and quality on which to focus the plant breeding progress. A phenotype analysis through physiological evaluation combined with a genotyping study based on a few selected molecular markers was applied. Integration of phenotyping and molecular approaches has in fact been previously used to identify traits of adaptation selected even unconsciously in a specific environment [30]. In the present study, the field experiments were conducted according to local practice. Therefore, the environments under study differed for a combination of soils, weather and agronomic practices and thus the crop performance is subject to Genotype × Environment × Management interactions that require physiological phenotyping across scales (see Großkinsky et al. [31]). Environmental conditions specifically limiting within determinate crop developmental phases were described with a set of climatic indicators.
The effect of abiotic stress on the different cultivars was analysed also in growth chamber experiments. Chlorophyll fluorescence has been shown to be an important non-invasive technique in stress physiology in field and laboratory studies [32]. It can be used to assess and quantify damage to the leaf photosynthetic apparatus, particularly photosystem II (PSII) activity in response to environmental stresses [33]. The maximum quantum yield of photosystem II photochemistry (Fv/Fm) in dark adapted leaves measured as ratio of the variable (Fv) to maximal (Fm) fluorescence is about 0.8 in healthy leaves and decreases in presence of stress induced perturbations of the photosynthetic apparatus. It is often used as indicator of perturbations in leaf metabolism not directly involved in photosynthesis [34] and is well suited for characterisation of large populations due to it’s non-invasiveness and rapidity. Problems may arise in the interpretation of changes in Fv/Fm after damage in plants subjected to frost or high temperature. In the case of frost damage, the drop in Fv/Fm after recovery relative to non-damaged plants is used as an indicator of damage to membranes [35,36]. In the case of non-lethal heat stress, the drop in Fv/Fm indicates a decrease in the efficiency of the photosynthetic apparatus related to slowly reverting mechanism of energy dissipation [37,38,39]. Chlorophyll fluorescence was applied using measurements of Fv/Fm in dark-adapted plants to assess the effects of stress [40]. In addition a preliminary analysis for diversity in high temperature tolerance was developed.
At this end, we applied a phenotype analysis through physiological evaluation combined with a genotyping study based on a few selected molecular markers.
Sets of molecular markers related to frost tolerance and plant phenology have previously been applied [30] in a panel of 121 barley genotypes different for origin and growth habit. VRN-H1, VRN-H2 and PPD-H2 conjointly explained 69% of the variation in frost tolerance. This genotyping approach has been extended to all the cultivars considered in this study. We aim to evaluate if the allelic constitution of VRN-H1, VRN-H2 and PPD-H2 genes explains an important fraction of the variance in yield due to G and G × E effects, as reported for Mediterranean environments in [16,17].
The objectives were to test the hypotheses that: (1) Grain yield (GY) in environments of different continentality but same latitude within Europe depends on cultivars differences in heading date and in sensitivity to climatic limitations, (2) haplotypes of the genes VRN-H1 and PPD-H2 explain differences in response to abiotic stress (low/high temperature) and yield related traits between the studied cultivars, (3) diversity in abiotic stress tolerance can be detected in cultivars selected in environments of different continentality though similar in respect to many environmental conditions.

2. Materials and Methods

A set of 49 cultivars (Table S1) was analysed in a field experiment at two sites, Fundulea, Southern Romania (44°33′ N, 24°10′ E, 68 m.a.s.l.) and Fiorenzuola d’Arda (PC), Northern Italy (44°56’ N 9°54’ E, 80 m.a.s.l.). The climate at both sites is classified as Cfa in the Koeppen Geiger climate classification, i.e., temperate climate without dry seasons and hot summers. It is more continental at Fundulea with a continentality index of 40.1, as compared to Fiorenzuola with a Continental index of 31.7. Long-term average temperatures are warmer at Fiorenzuola than at Fundulea between October and March and Fundulea has a higher annual temperature amplitude (Table S2).
Eighteen varieties, released in the winter barley breeding program in Romania from 1968 to 2013 were selected to represent the history of barley breeding activity at NARDI Fundulea. Twenty-nine varieties, most with winter growth habit, were derived from the breeding work at the CREA-GB of Fiorenzuola since 1979. Two other cultivars from central Europe (Germany) were included as controls with high winter survival capacity (Table S1).

2.1. Field Experiments

The soils of the experimental farm at Fundulea are classified as cambic chernozem. The soil composition in texture classes is: sand 28%, silt 34%, and clay 38%. The soils are slightly acidic, pH (H2O): 6.5 down to 45 cm depth and slightly basic below, with an organic mass of 1.7%. The soils of the experimental farm at Fiorenzuola are classified as fine silty, mixed, mesic Udic Ustochrepts. The soil composition in texture classes is: sand 14%, silt 50%, and clay 36%. The soils are slightly basic, pH (H2O): 7.85, with an organic mass of 3.0% in the 30 cm topsoil.
A total of four trials were performed as follows: in the first season (2014–2015) trials were done with small (1.5 m2) plots in three replications. In the second (2015–2016) and third season (2016–2017) three replicates of 6 m2 plots were used and final harvest done on 4.5 m2. Subsequently the abbreviations Y1I, Y1R, Y2R, Y3R will be used for addressing the trials of season 1 in Italy, season 1 in Romania, season 2 in Romania, and season 3 in Romania, respectively. Fertilisation and agronomic treatments were applied following standard local practice (Table 1).

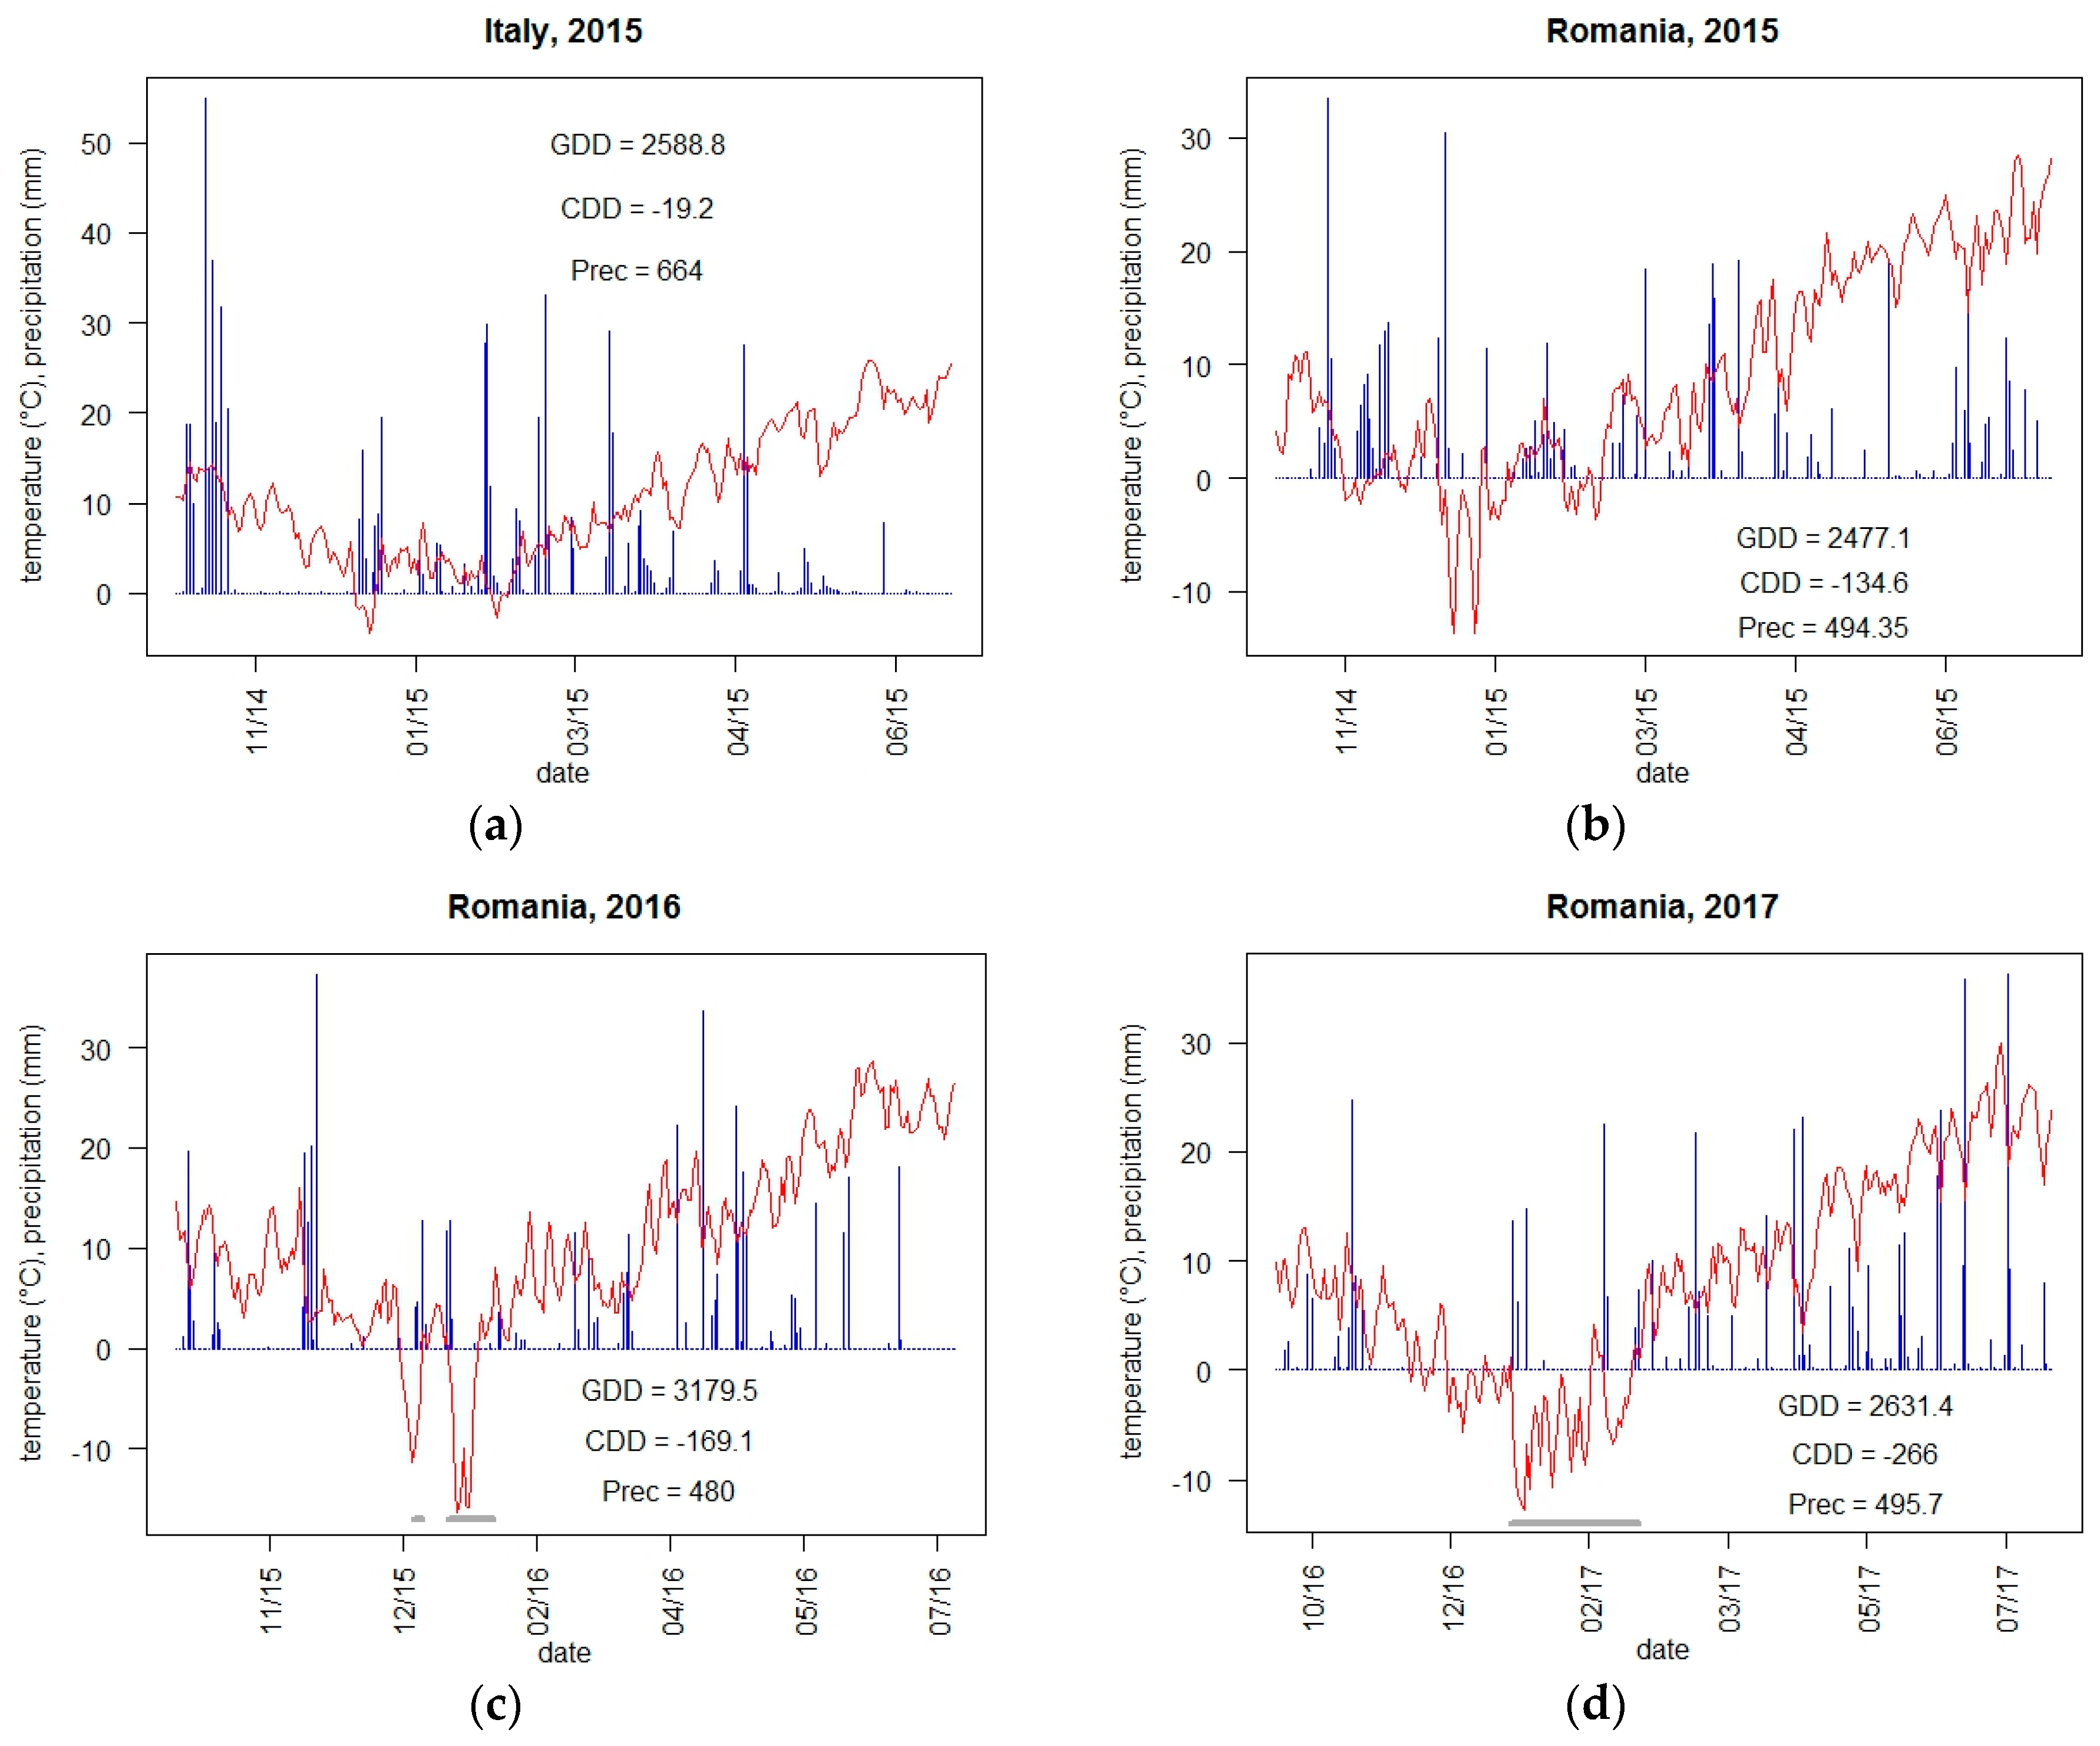
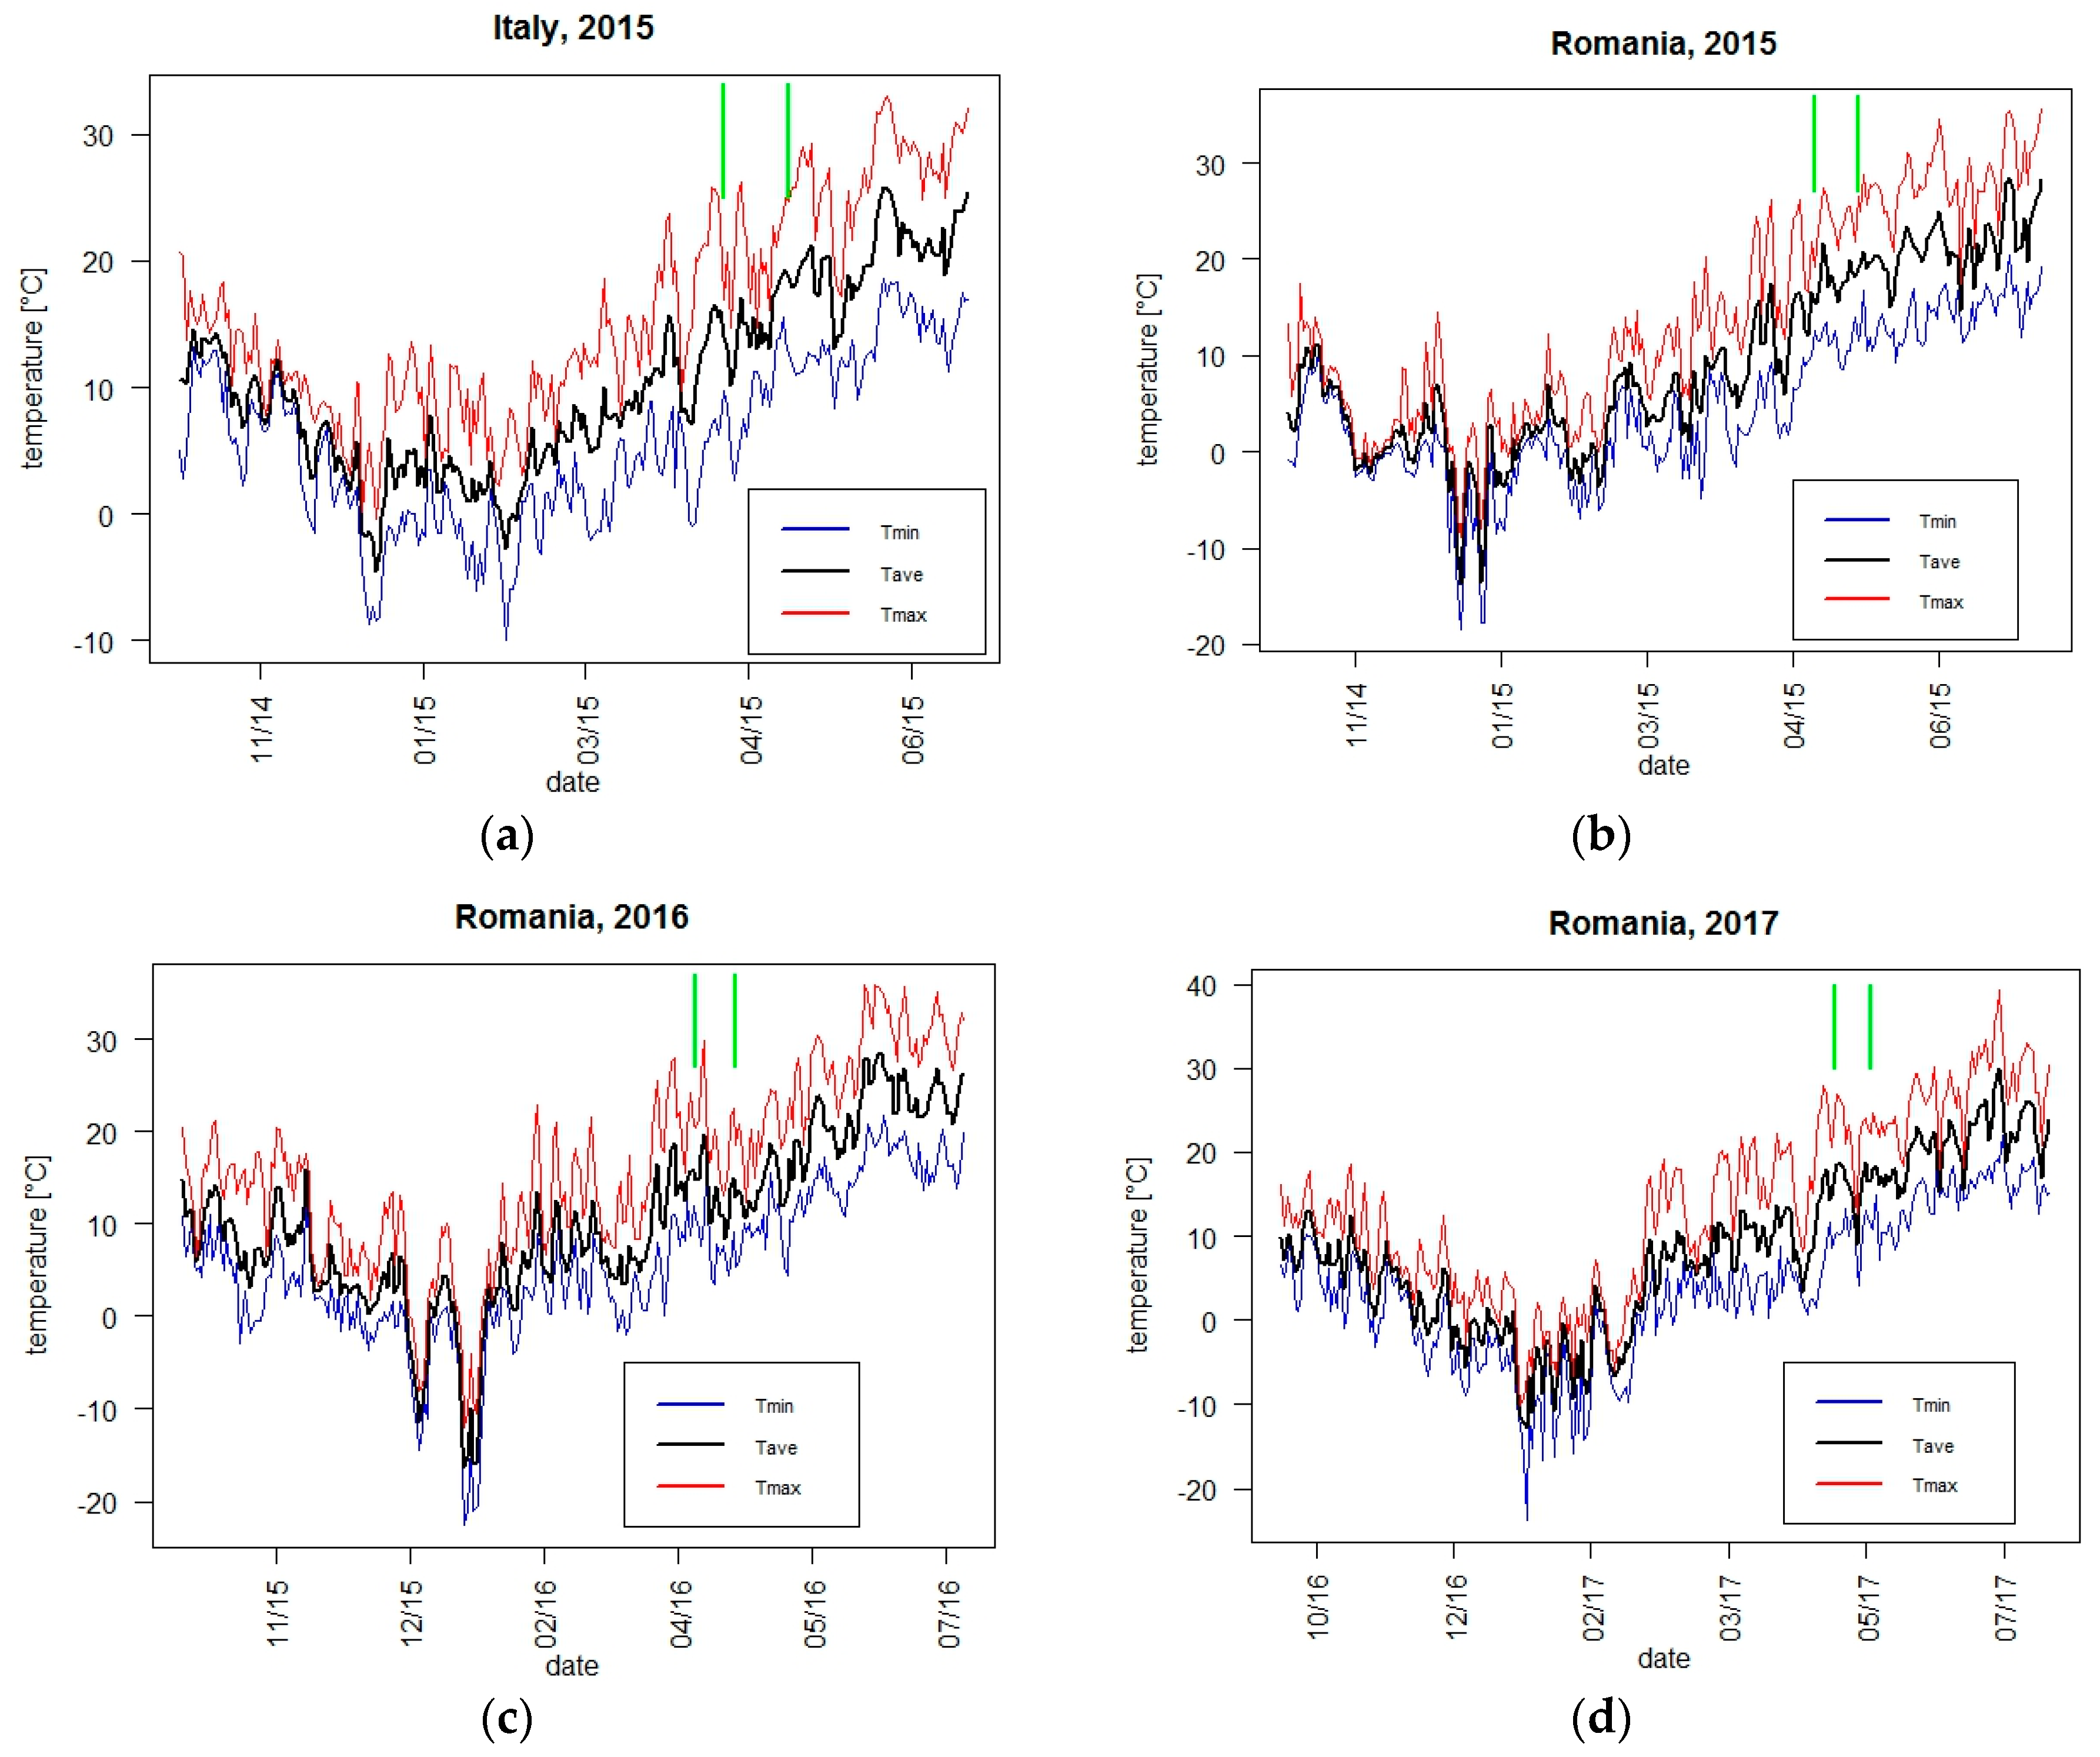
2.2. Meteorological Conditions and Climate Indicators

Temperature (maximum daily temperature, Tmax, minimum daily temperature, Tmin, average daily temperature, Tave) and precipitation, P, were measured with climate stations close to the experimental fields. Based on these data, we calculated a series of climate indicators either for the period sowing to heading (suffix sh) or heading to harvest (suffix hh) or the whole crop growth cycle (suffix vp). The length of the grain filling period (GFP) was approximated by the interval heading to harvest. The climate indicators are GDD (growing degree days) calculated as sum of Tave for days with Tave > 0 °C, CDD (cold degree days) calculated as sum of Tave for days with Tave < 0 °C, number of frost days (nfrostd) calculated as number of days with Tmin ≤ 0 °C, number of hot days (nhotd) calculated as number of days with Tmax ≥ 30 °C, fraction of hot days post anthesis (fhd) as nhotd/GFP, mean average daily temperature (Tave), precipitation sum (Psum), Tave/Psum, climatic water balance (cWB) calculated as Psum-Epot based on the Thorntwaite model for potential evaporation (Epot) and a Water Stress Index (WSI) according to [41]. In addition for the period from 5 days before to 8 days after anthesis we calculated the number of heat stress days (ndheatstr) and cold stress days (ndcoldstr) as number of days with Tmax > 31 and Tmin < 9 °C, respectively. For the heading to harvest interval we calculated an index of deviation from optimal temperatures (Tdevopt) as the average of the absolute difference between Tave and 16, 18 or 20 °C (Tdevopt16, Tdevopt18, Tdevopt20).
Grain yield (GY), thousand grain weight (TGW), grain number per square metre (GN), and grain protein content (GPC) were determined for all trials. GPC was determined with an Infratech 1241 Grain Analyser (Foss Tecator) as 6.25 × %N. GY is reported as fresh biomass at humidity of 13% usually reported in production statistics (FAO standards). For conversion to dry mass grain yield the masses need to be multiplied by 0.8849558. In addition scoring of lodging, frost survival and net blotch (Pyrenophora teres f. teres) damage were done for trials with relevant occurrence of the disturbances. In the first and third growing season no visible frost damage was detected at Fundulea. In Y2R frost survival was assessed at 5 March as percent of green leaves (GLFfrost).

2.3. Laboratory Experiments

2.3.1. Low Temperature

The 49 cultivars were tested for frost tolerance in two laboratory experiments at Fiorenzuola. Seeds were directly germinated in polystyrene boxes in six replicates. Seedlings were grown during one week at 20/15 °C (day/night), 10 h photoperiod, and 200 μmol m−2 s−1 photosynthetic photon flux density (PPFD), at leaf level, and then acclimated during four weeks at hardening temperatures of 3/1 °C (day/night). Subsequently, plants were subjected to a freezing treatment in the dark as described in [35]: temperature was gradually (2 °C h−1) reduced to −3 °C, and plants were kept at this temperature for 16h. Subsequently, temperature was gradually lowered (2 °C h−1) to the minimum freezing temperatures of −13 and −14 °C for the two experiments, respectively.Plants were kept at this temperature for 16h. The temperature was then gradually raised to 1 °C (2 °C h−1). Plants were at the first-leaf stage at the end of the hardening treatment.
The maximum quantum efficiency of PSII photochemistry was measured by the Fv/Fm (variable to maximal fluorescence) ratio in dark-adapted leaves. Fv/Fm was determined in leaves with a pulse amplitude-modulated fluorometer (PAM 2000, Walz, Effeltrich, Germany) to evaluate frost tolerance. The measurements were done before and immediately after stress and after 24 h of recovery at 20/15 °C (day/night) [35]. The measurement after 24 h recovery is best suited to differentiate damage [42].

2.3.2. High Temperature

A first analysis of tolerance to high temperature was employed in two laboratory test. In both experiments the Fv/Fm ratio was measured to quantify the level of damage in the leaves and evidence the role for tolerance of the photosynthetic apparatus to the heat stress [38].
In a first experiment 45 cultivars, 18 Romanian, 25 Italian (Arda, Cometa, Doria and Nure were not included due to germination failure), 2 controls, were analysed at two-leaf stage in 5 replicates. After 10 days of growth at 20/15 °C, 12 h photoperiod, and 200 μmol m−2 s−1 (PPFD), the plantlets were successively exposed to 30, 37, 42, and 45 °C for 1 h at each temperature level. The measurements were done before exposure to the first stress temperature, immediately after every level of the high temperature stress treatment as well as after 24 h of recovery at 20/15 °C subsequent to the last high temperature stress level. In addition Fv/Fm was also measured after 4 days of recovery. Fv/Fm was measured on the last fully developed leaf.
In a second experiment a subset of 20 cultivars, 18 Romanian, one Italian (Sfera) and one control (Merlot), was grown at 20/15 °C, as described above but followed by 4 days under (a) control treatment at 20/15 °C (day/night); (b) hardening treatment at 32/27 °C (day/night). Stress was imposed by exposing control and hardened plants to elevated temperatures of 35, 40 or 45 °C. In this case, different plants were exposed to different stress temperatures.

2.4. Statistical Analyses

ANOVA for the completely randomised block design of the field test and the laboratory experiments, LSD tests and HSD tests, correlation analyses, regression analyses and Generalised Linear Models (GLM) were performed with the R statistical software [43]. Variance components and heritability were calculated with the “sommer” package in R.

2.5. Molecular Marker Analysis

DNA was extracted from young leaf samples according to [44]. Haplotype analysis for VRN-H1, VRN-H2, and PPD-H2 loci was carried out as detailed in [30] (Supplementary Information SI1). The same methods employed to characterise the Italian cultivars were applied for the Romanian cultivars (Table S1).

3. Results

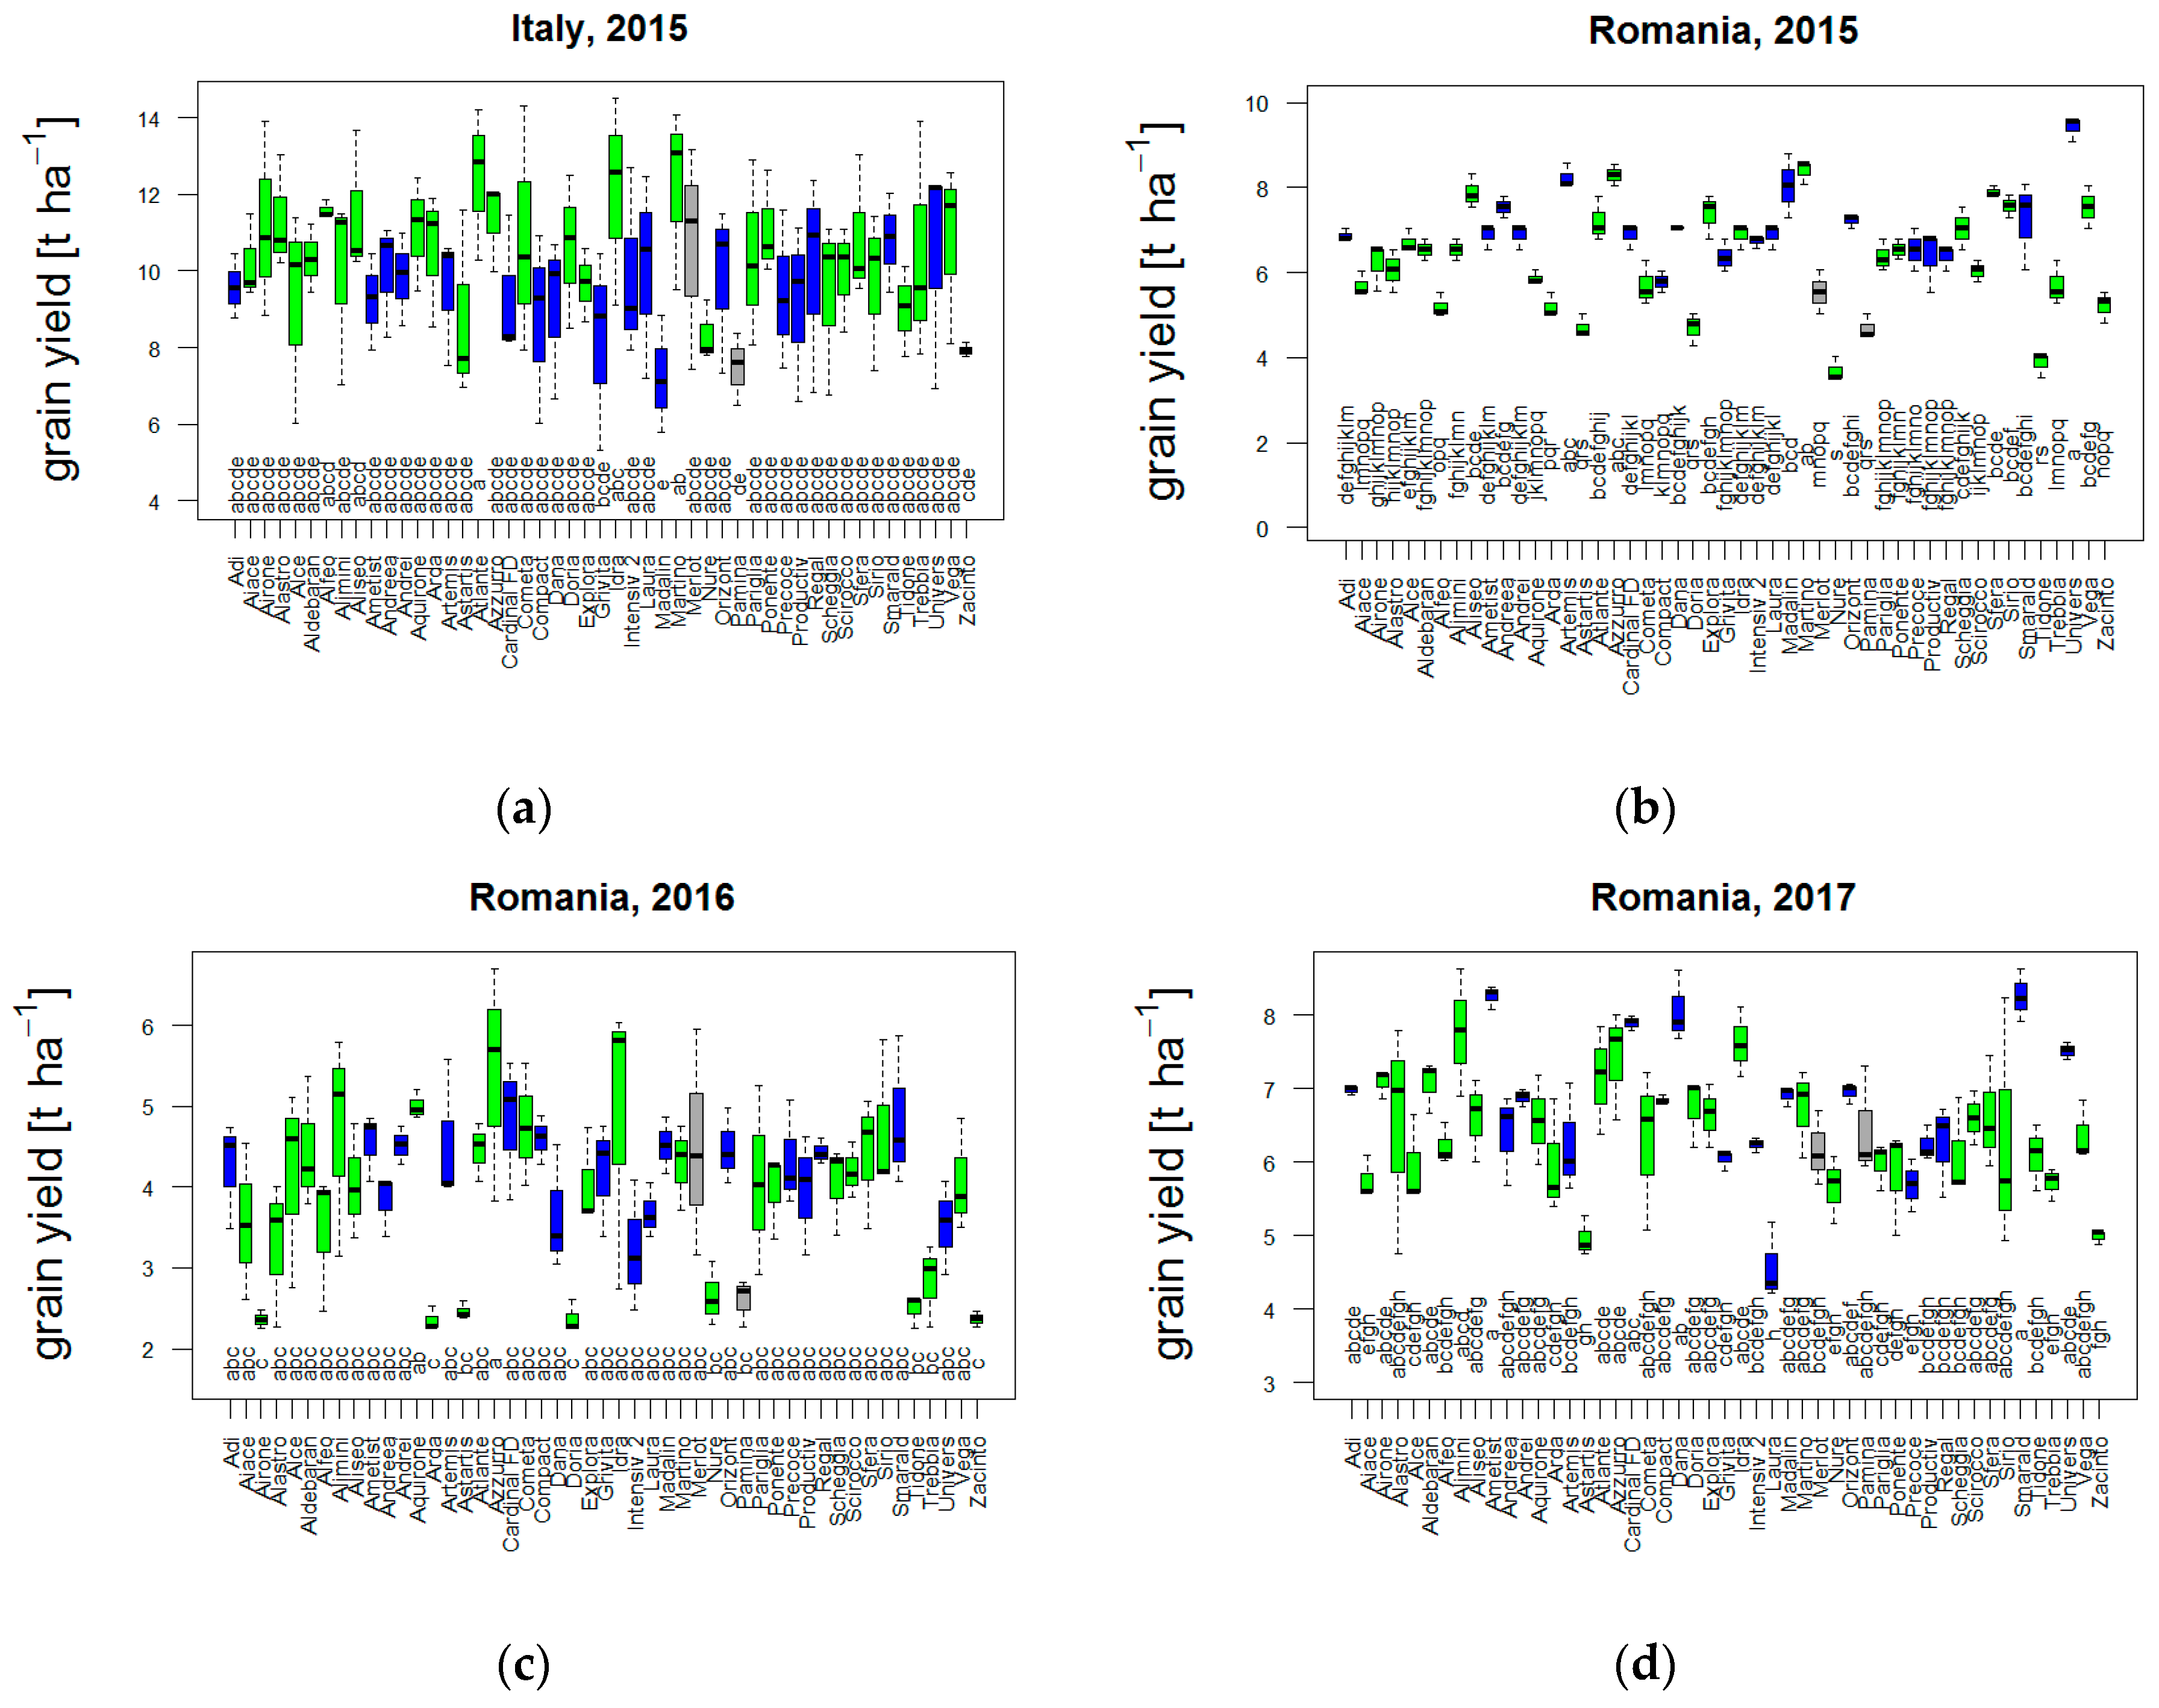
3.1. Diversity in Field Trials

3.1.1. Yield and Adaptive Traits with Respect to Weather Conditions and Climate Indicators

The weather conditions in all trials were relatively humid with well distributed precipitation events and cumulative precipitation during the growing seasons above 450 mm (Figure 1).
The lowest minimum temperatures in Y1I were −8.68 °C at 29 December and −9.98 °C at 9 February. During both these frost events the plants were not covered with snow. The minimum temperatures in Y1R was −18.5 °C at 15 January and reached minima below −20 °C in Y2R and Y3R, with −14.5 °C at 3 January 2016, −22.6 °C at 20 January 2016 and −23.8 °C at 10 January 2017. The plants were covered by snow during most of the freezing periods with temperatures below −7 °C in Y1R and Y3R. In Y2R snow cover was established only after the first frost event with temperatures below −10 °C. Average daily mean temperatures in the sowing to heading period Tavesh was 6.99, 4.24, 5.77 and 3.92 °C in Y1I, Y1R, Y2R and Y3R, respectively. The difference between the Italian and the Romanian trials is in line with the cooler winters expected due to the higher continentality at Fundulea. Maximum temperatures above 30 °C were not reached before at least two weeks after heading and never exceeded 40 °C (Figure 2).
Cultivars differed significantly for all studied crop traits in all four trials (Table 2). Average GY was highest in Y1I and lowest in Y2R. Grain yield was significantly different between cultivars (Figure 3, Table 2). Highly productive cultivars stemmed from both Romania and Italy (Figure 3). Cultivar mean yields were positively correlated between all trials. The correlations between the trials at Fundulea were all significant (Y1R vs. Y2R: r = 0.6, p < 0.001; Y1R vs. Y3R: r = 0.43, p < 0.003; Y2R vs. Y3R: r = 0.47, p < 0.001). The yield in Y1I was still positively associated with the yield in the Romanian trials yet not significantly so (Y1I vs. Y1R: r = 0.28, p = 0.54, Y1I vs. Y2R: r = 0.23, p = 0.105; Y1I vs. Y3R: r = 0.22, p = 0.134). The ranking of the trials for GN was the same as the ranking for GY. TGW was highest in Y1R and Y3R and lowest in Y2R. The sowing to heading period was shortest in Y1I. In general the Romanian cultivars had a lower GPC than the Italian cultivars.
Broad sense heritability was H2GY = 0.674 for grain yield, H2NG = 0.775 for the number of grains per square metre, H2TGW = 0.859 for thousand grain weight, H2HD = 0.759 for the length of the sowing to heading interval, H2GPC = 0.662 for grain protein content. The variance for between trial differences was several-fold superior to the genotypic and G × E variances, with variance ratios VG/VE = 0.055 and VGxE/VE = 0.045. The error variance, i.e., variance due to differences between replicates plus measurement errors, was 14.44% of the total variance.

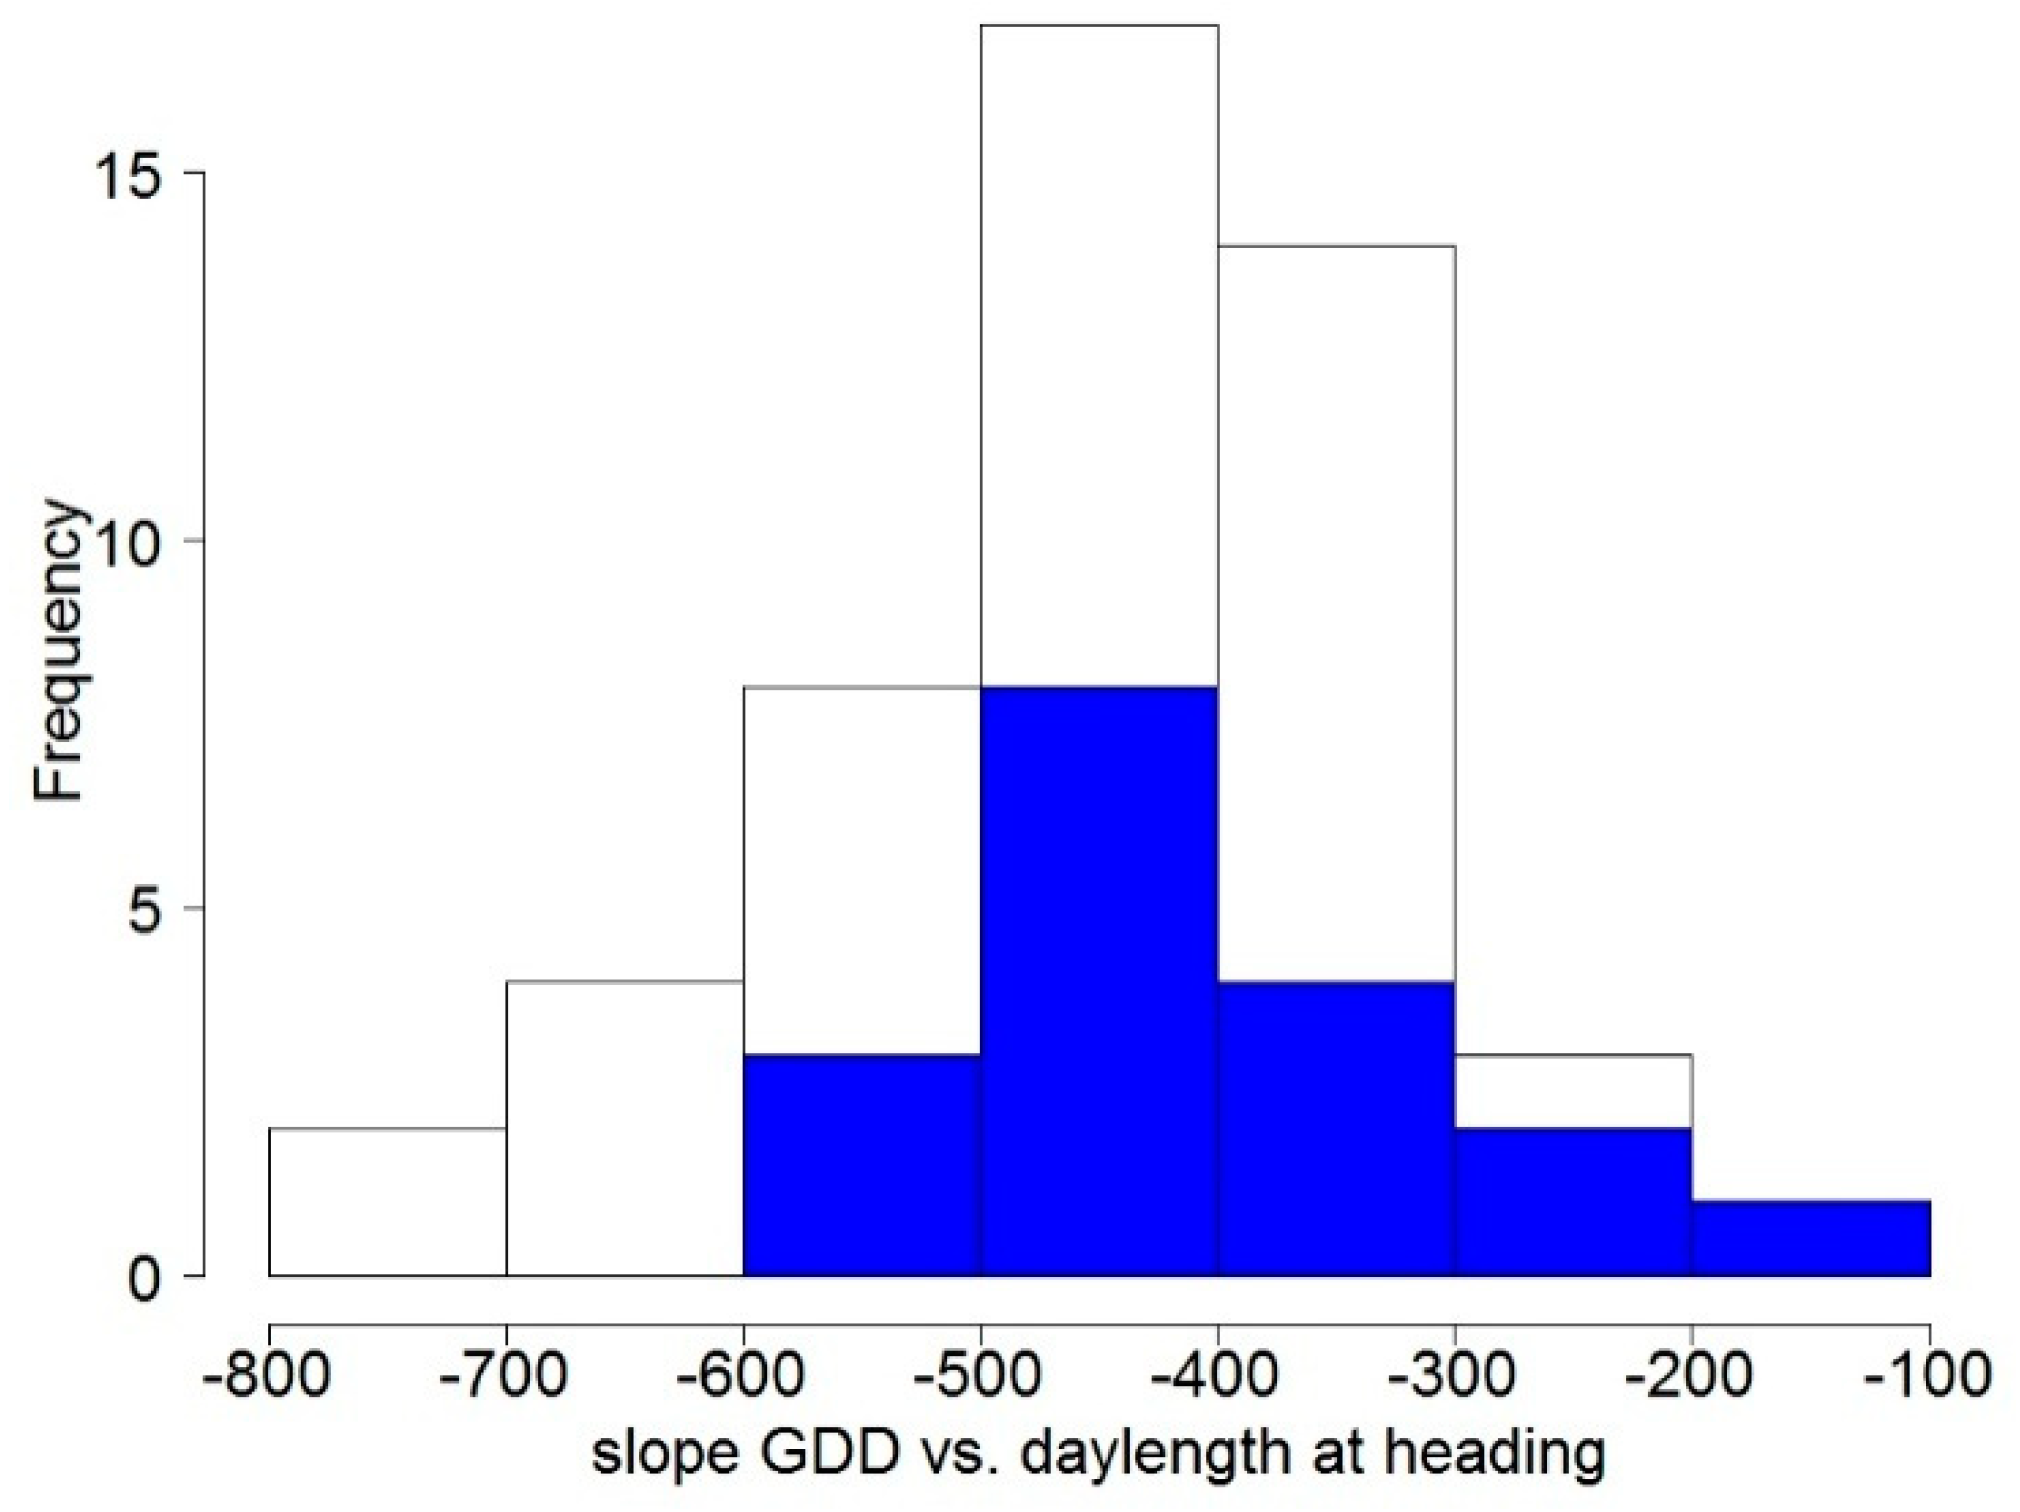
3.1.2. Flowering Phenology

Heading dates differed between cultivars. The difference between earliest and latest heading cultivars was 20, 15, 15 and 13 days in Y1I, Y1R, Y2R, Y3R, respectively. The Italian cultivars headed earlier than the Romanian cultivars on average by 5.6 days in Y1I and by 1.2 and 2.1 days in Y1R and Y3R respectively, while in Y2R the Italian cultivars showed a slight but non-significant delay of 0.6 days relative to the Romanian cultivars. GDD accumulated till the date of heading varied between cultivars and trials. Heading later in the year was associated with a lower sum of accumulated GDD. Regression of GDD at heading versus day length at heading for every cultivar resulted in significant, negative slopes (Figure 4) except for cultivar Intensiv 2, for which it was however close to significant (p = 0.069). The slopes varied between −192 and −788 °C h−1 with a mean of −441 °C h−1.
Late heading was non-linearly related with lower TKW (Y1R, Y3R), and yield (Y1R) with maxima at intermediate HD, but not so with GPC.

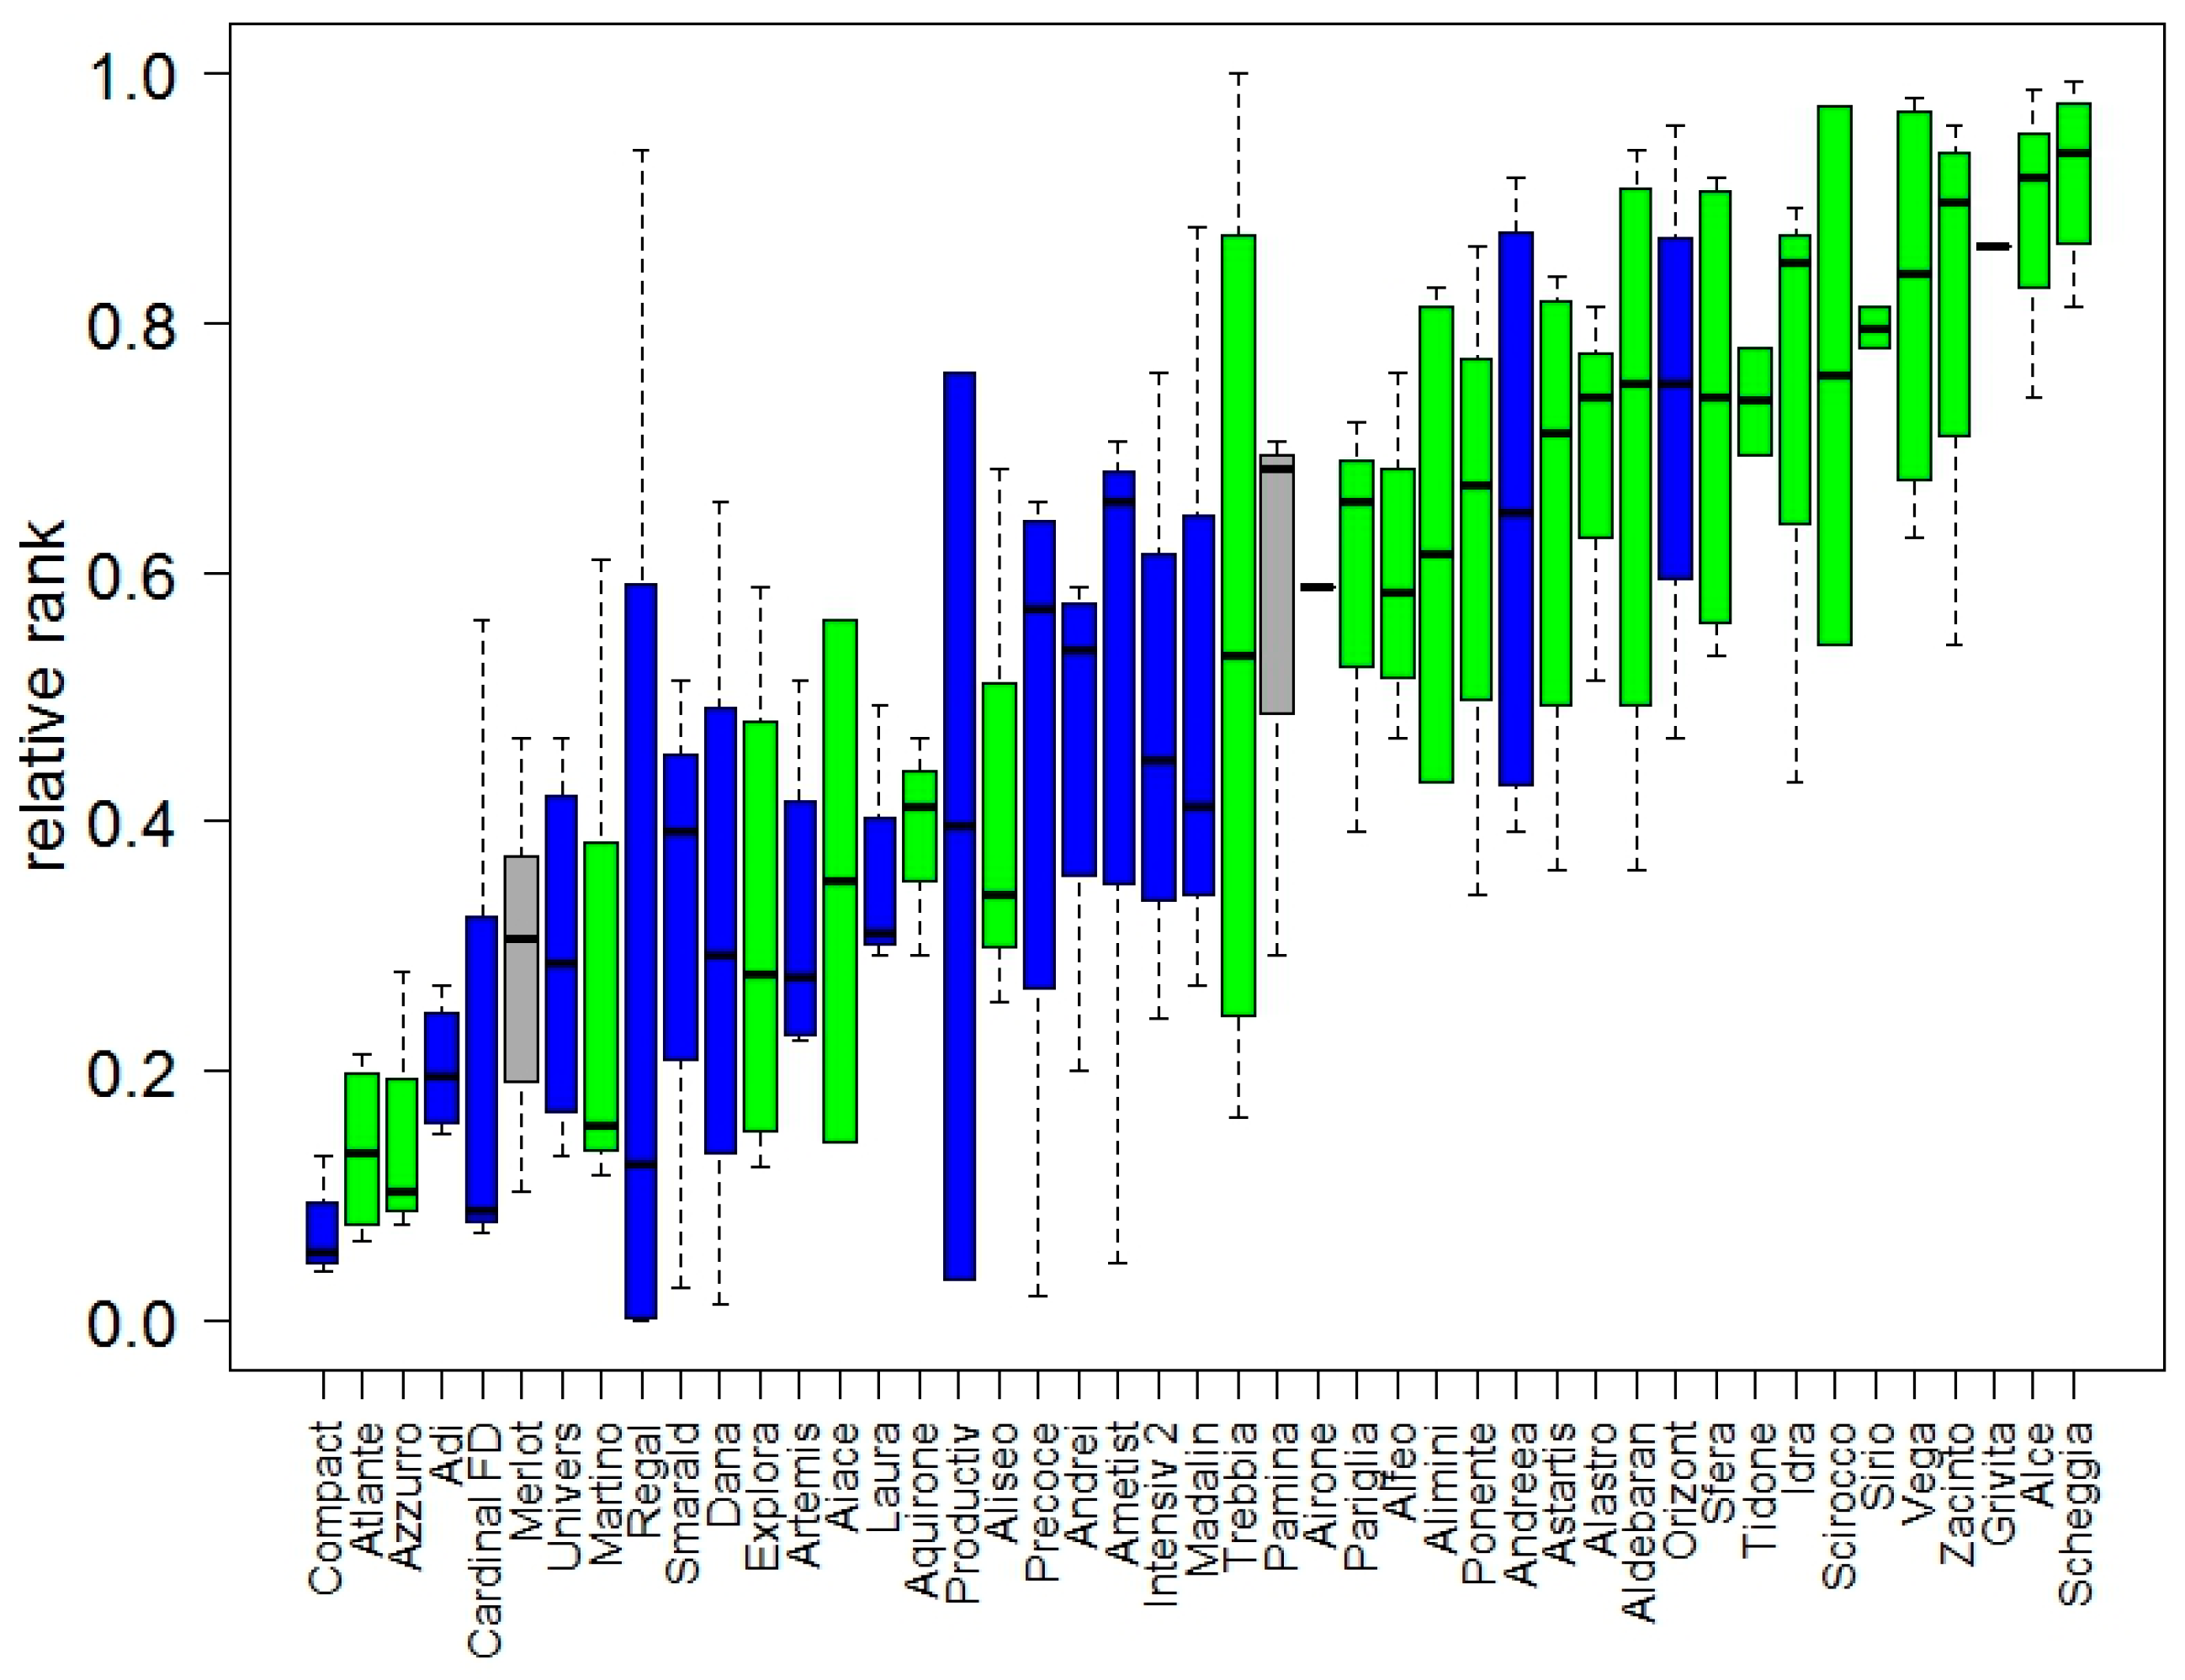
3.1.3. Genetic Gain and Selection Trends

Selection trends across the whole set of cultivars were evidenced by significant correlation of several traits with year of introduction. A trend for lower stature of recently released cultivars (−0.56 cm year−1, p < 0.001, assessed in Y1I only) was associated with reduced wind-throw. More recently introduced cultivars also headed earlier and realised higher grain yields. The genetic gain in grain yield was +50 kg ha−1 year−1 (p < 0.002) in the environment of highest productivity, Y1I and +30 (p = 0.053), +31 (p < 0.004), +22 (p = 0.033) kg ha−1 year−1 in Y1R, Y2R and Y3R, respectively. The genetic gain in percent of the average yield in the trial was similar in Y1I and Y1R with +0.49 and +0.46% year−1, respectively, while Y2R favoured modern cultivars and thus led to an average yield increase of +0.80% year−1, and the yield increase was +0.35% year−1 estimated with Y3R. The significant change in length of the sowing to heading period assessed for Y1I and Y1R was −0.16 day year−1 (p = 0.012) and −0.08 day year−1 (p < 0.006). It was non-significant, however had the same sign assessed for Y2R and Y3R: −0.04 day year−1 (p = 0.261) and −0.05 day year−1 (p = 0.147), respectively.

3.1.4. Winter Hardiness/Effects of Low Temperature Stress

No visible frost damage was found in the Y1R and Y3R trials. Damage was observed in the two trials in which Tmin < −10 °C were reached when plots were not snow-covered. In Y1I only high frost survival scores were registered, while in Y2R frost survival was scored between 1 and 8 (Figure 5). Thus, plants in Y2R had the lowest frost survival although they were exposed to a lower number of frost days from sowing to heading than in Y1R and Y3R (62 vs. 77 and 83) and a lower sum of CDD than Y3R (−169 vs. −266). Grain yield in Y2R was correlated with frost survival, i.e., the remaining fraction of green leaves after frost damage, GLFfrost (r = 0.62, p < 0.001) mainly due to decreased yield at survival scores below 60. Fitted with a Gompertz function, 26.6% of the variation in GY was explained by the non-linear response to frost survival, GLFfrost.

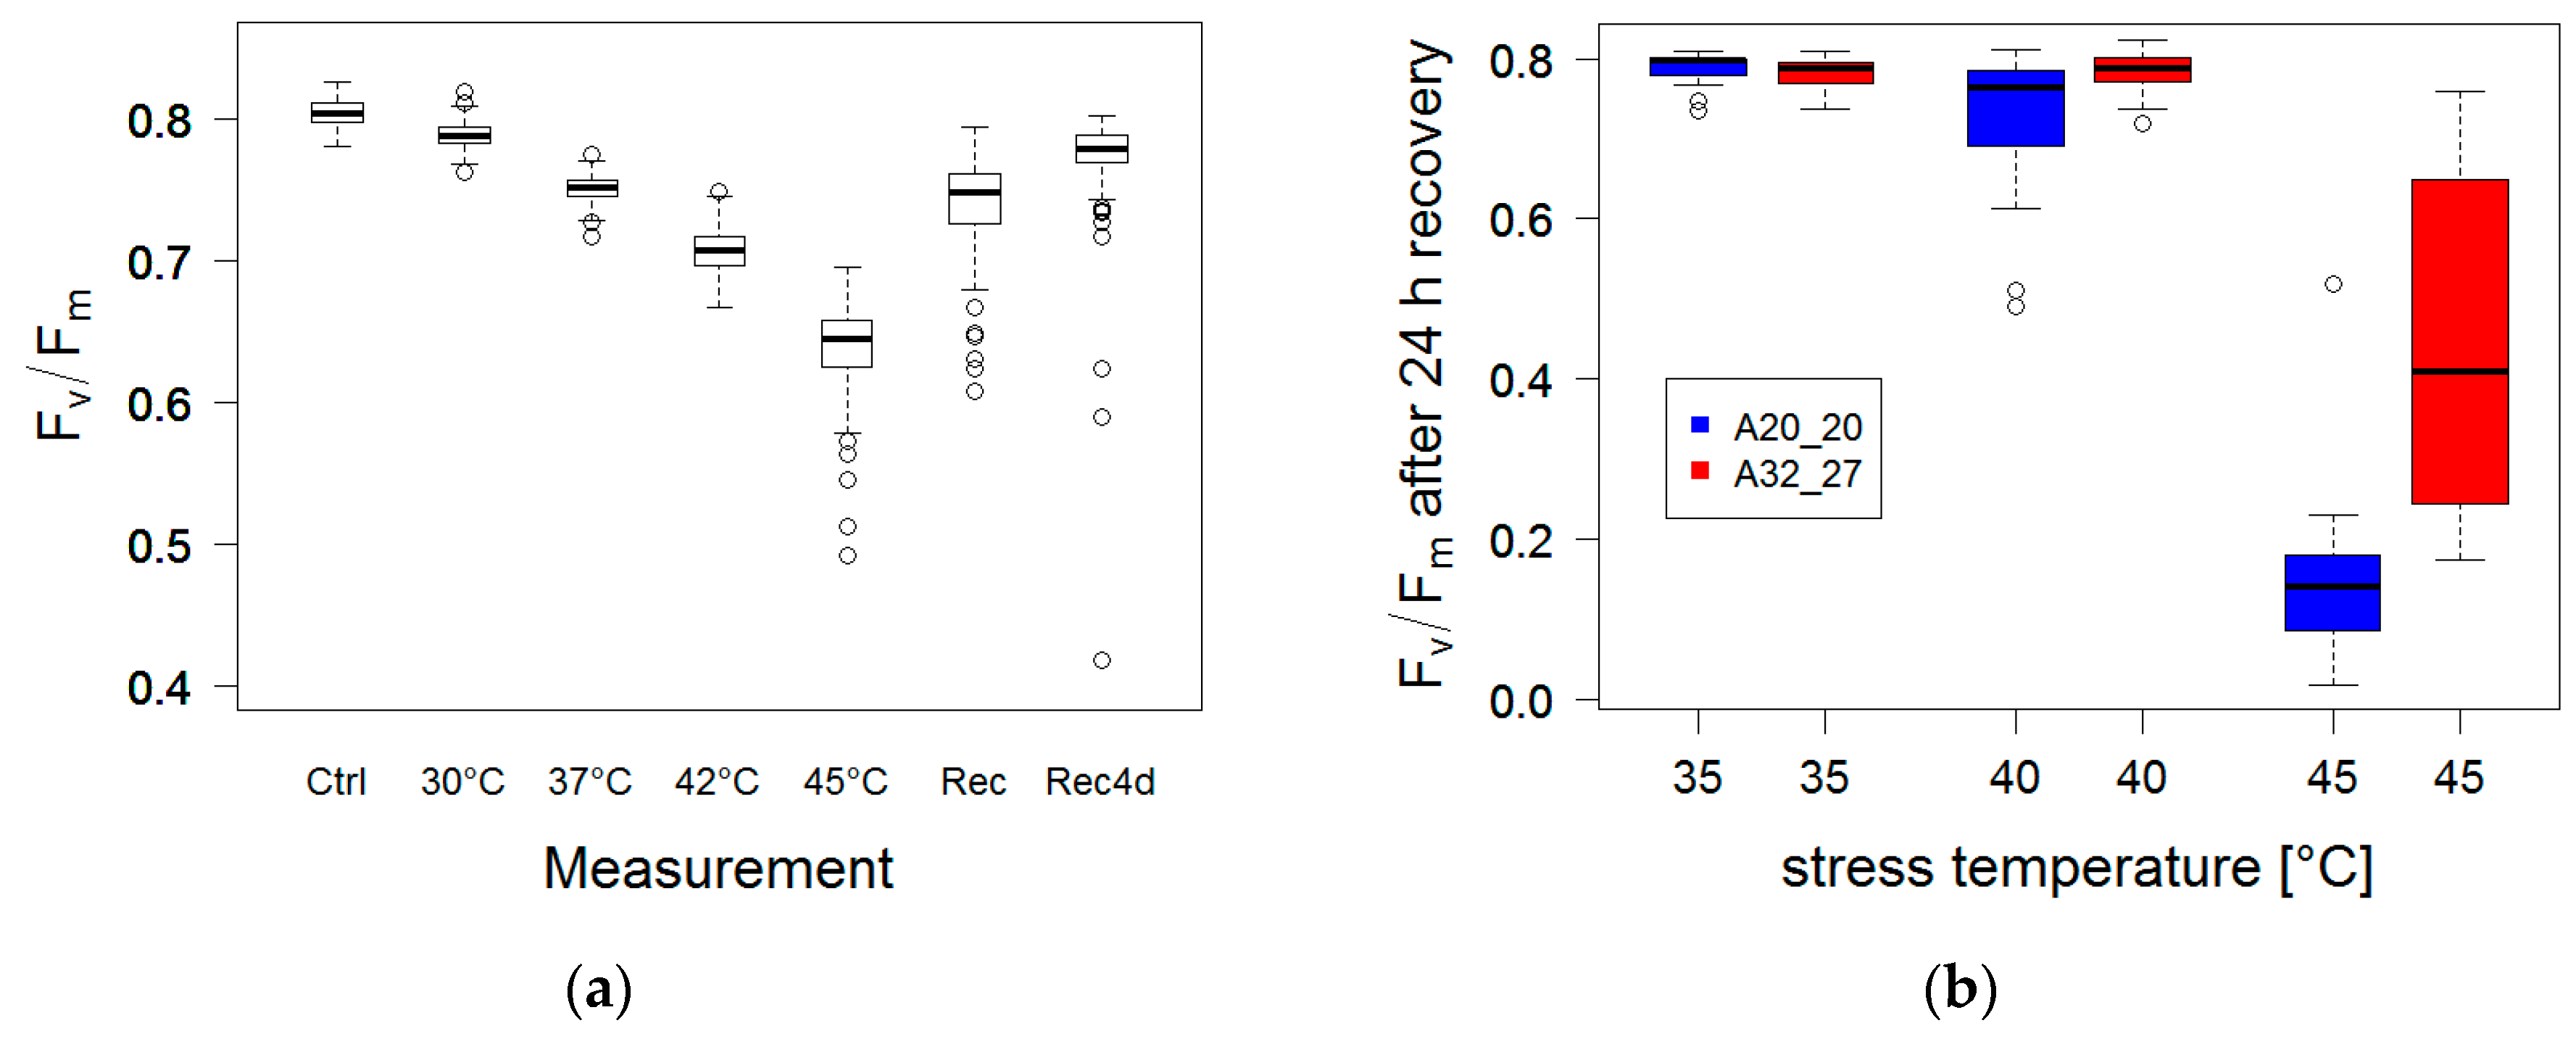
3.1.5. High Temperature Stress

The whole season climatic water balance, cWB, was positive in all four trials and the calculated water stress index, WSI, showed low values mainly due to water shortages that occurred only towards the end of seed ripening. Also the average air relative humidity during the grain filling (rHavehh) did not differ much between the trials (Y1I: 70.5, Y1R: 69.5, Y2R: 72.5, Y3R: 73.5%).
The number of days with maximum temperatures above 30 °C, hotdhh, varied between 12 in Y1I and 30 in Y2R with intermediate values of 20 in Y1R and 19 in Y3R. The stress indices calculated for the period between sowing and flowering did not indicate relevant stresses occurring during this developmental period. Grain yield was negatively correlated with the fraction of hot days in the period between heading and harvest, fhd (Figure 6). GY regressed on fhd separately for every cultivar also resulted in negative slopes that were significant at p < 0.05 for all cultivars except Madalin for which it was close to significant (p = 0.052).

3.2. Diversity in Laboratory Experiments

3.2.1. Low Temperature Stress

The laboratory freezing test revealed significant differences in frost tolerance of the cultivars under study (Figure 7). The Romanian cultivars had on average a higher frost tolerance (ANOVA, p < 0.001, Tukeys HSD test) than the Italian cultivars (Fv/Fm = 0.63 vs. Fv/Fm = 0.56, respectively) with an elevated diversity within both sets.
Cultivar averages of Fv/Fm measured after recovery in the freezing test performed at Fiorenzuola were correlated with frost survival assessed in the field in Y1I (r = 0.32, p < 0.03) and Y2R (r = 0.50, p < 0.001) (Table 3). Thus, the cultivars showing better frost resistance in the laboratory test also showed higher survival scores.
There was no significant correlation between year of release and frost damage in the field as well as damage in the laboratory test.

3.2.2. High Temperature Stress

Significant between cultivar differences in leaf high temperature tolerance resulted from the test on stress of elevated temperature applied after growth under 20/15 °C day/night temperatures (Figure 8). The Italian cultivars had on average a higher heat tolerance than the Romanian cultivars (Fv/Fm = 0.75 vs. Fv/Fm = 0.73, respectively, p < 0.001), with a high diversity within each set. Successively decreasing Fv/Fm after exposure to step-increases in temperature and subsequent recovery after 24 h and 4 days at 20/15 °C day/night temperatures showed a transient decrease in maximum yields of photosystem II for the given range of high temperature exposure (Figure 9a).
In the second high temperature stress experiment, one batch of plants was grown at 20/15 °C and another batch acclimated at 32/27 °C for the last four days prior to the stress treatment. Acclimation reduced the decrease in Fv/Fm after exposure to high temperatures (Figure 9b).
The laboratory experiments on leaf heat tolerance are a first preliminary characterisation of this trait, as the stress under field conditions does not appear when plants are young, but rather hits leaves during grain maturation. Extension of these experiments is required to link the laboratory results with damage deduced from field trials.

3.3. Association between Traits and Alleles of Vernalisation and Photoperiod Genes

In the laboratory freezing test, cultivars being of winter and facultative growth habit had a higher frost tolerance than spring cultivars (Table 4). They also were less damaged in the field in Y1I and Y2R where only low and moderate frost damage occurred, respectively. The dominant Ppd-H2 allele of PPD-H2 was associated with lower frost survival (Y2R) and lower frost tolerance in the laboratory test (Table 4). The two most severely damaged genotypes in the Y2R trial, Doria and Tidone, which also produced low GY, were spring types with Ppd-H2.
The response of Fv/Fm after recovery in the laboratory heat stress test was not correlated with the alleles of the vernalisation and day-length response genes.
The dominant allele Ppd-H2 was associated with earlier heading and lower yields (Table 5). The correlation with heading date was significant in Y1I and Y3R, while the correlation with yield was non-significant in these two trials. Vice versa a significant correlation with yield was found in Y1R and Y2R while it was non-significant for heading date in these two trials.
PPD-H2 was also significantly associated with the slope of GDDsh versus daylength at heading (Figure 4) and the slope of GY versus fhd (Figure 6). Heat sums required for heading of cultivars carrying Ppd-H2 responded more strongly (p < 0.003, ANOVA) to daylength (average slope = −469.3) than cultivars carrying ppd-H2 (average slope = −343.9). Also GY of cultivars carrying Ppd-H2 responded more strongly (p < 0.001, ANOVA) to the fraction of hot days after heading (average slope = −0.625) than cultivars carrying ppd-H2 (average slope = −0.455).

4. Discussion

Within the present study field and laboratory experiments were applied to characterise the level of diversity in two independent sets of barley cultivars bred during the last half century in two different environments in Northern Italy and Southern Romania. Phenotyping with a number of morphological and physiological traits was used to quantify stress tolerance and yield related traits and their correlation with climate indicators and genotypes. One aim of this approach is the identification of integrated methods that can be used in the future for breeding, especially for quantitative traits and contribute to reduce the “bottleneck effect” in omics studies related to the limited availability of phenotyping data [31,45].
A simple genotyping approach (low cost) based on a few genes with known functions was applied. These genes are implied in regulation of frost tolerance, especially adaptive traits vernalisation and photoperiod [9,30,46,47,48,49] and phenology [15,50]. In part they are already in use for Marker Assisted Selection in barley. Genotyping was partially adapted from our already published results [30] and completed with additional PCR. The applicability of this approach, as already applied for Mediterranean sites [16,17] was confirmed for the comparison of sites of different continentality.

4.1. Stress Frequencies Related to Continentality
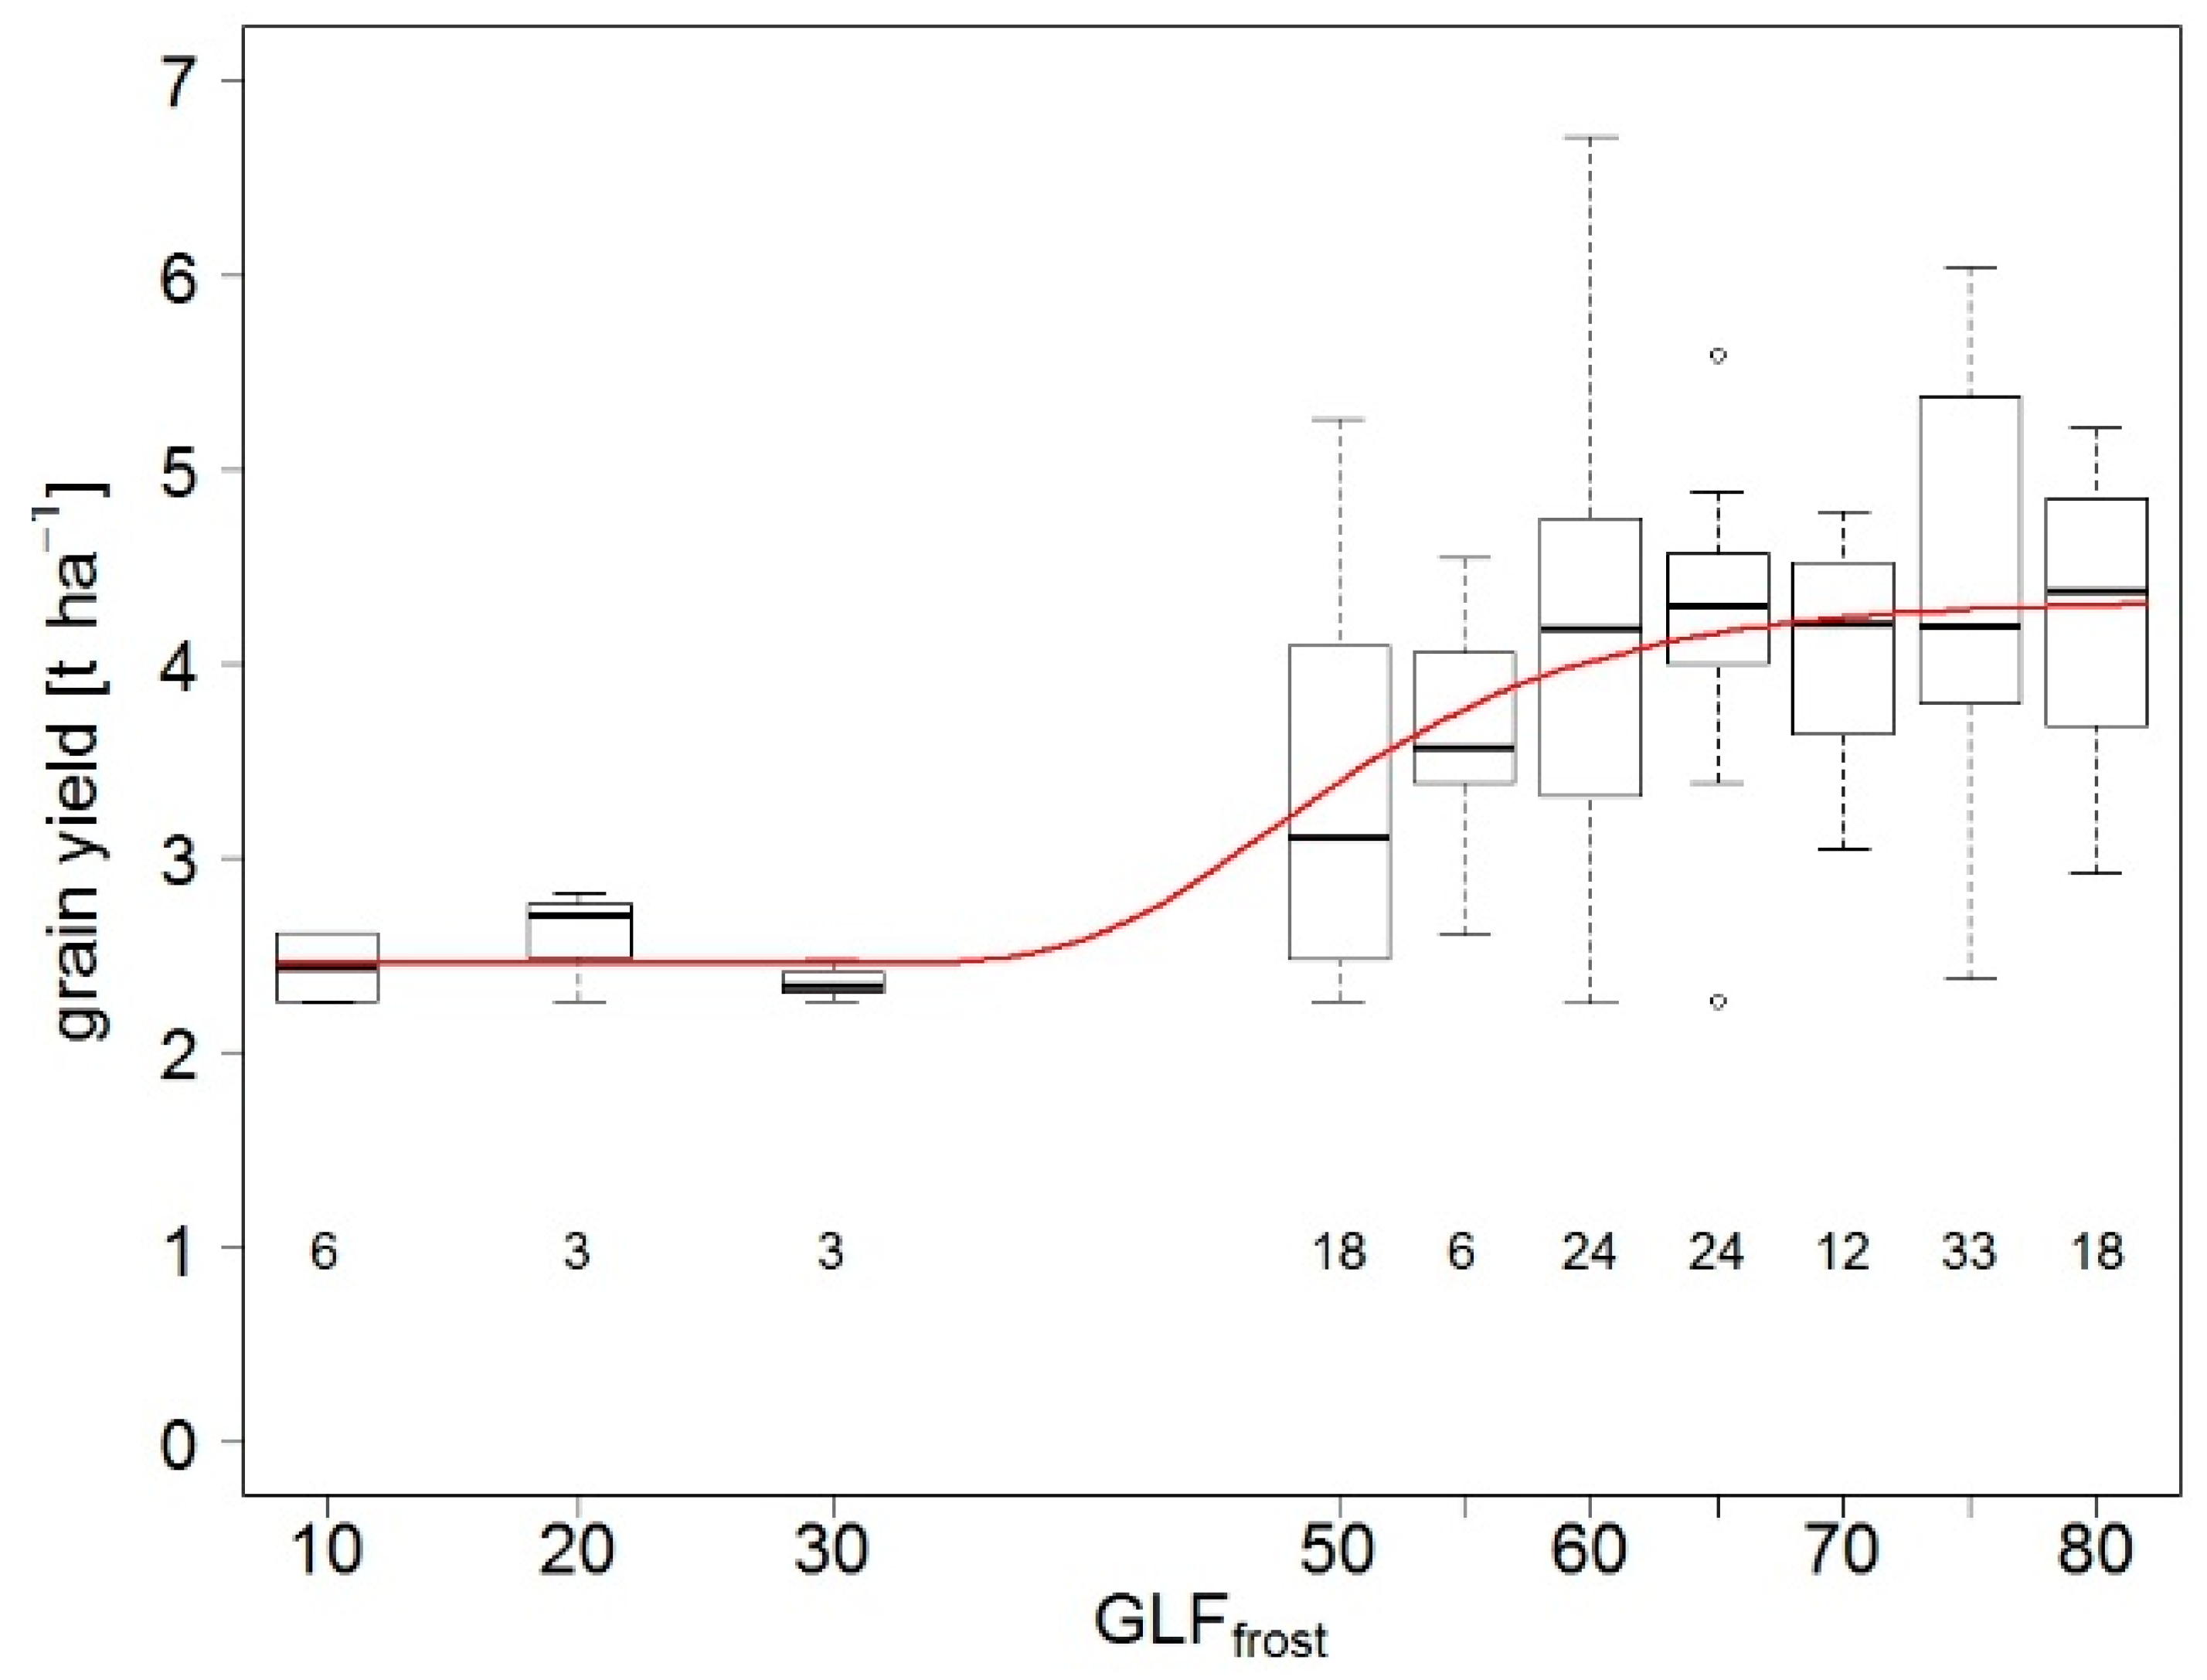
The two trial sites were situated at the same latitude and thus did not differ in the annual course of changes in day-length, but differed by continentality with the Romanian site Fundulea being more continental with a more pronounced annual temperature amplitude.

4.1.1. Frost

As a consequence, the plants grown at Fundulea are exposed to a higher risk of potentially damaging frost events (see Table S2 for lower winter Tmin at Fundulea). This was the case in the three experimental years, with lowest Tmin < −20 °C reached at Fundulea (Figure 2). When not protected by snow cover, the exposure to low freezing air temperatures can thus result in frost damages.
In Y2R ambient air temperatures were close to or below LT50 of barley cultivars [42,51] during a first pronounced frost period in January and before plants were covered and thus protected by snow. Frost survival was significantly correlated with grain yield (Figure 5), indicating a contribution of this early season abiotic stress to the low yields realised in this experiment. Spring types were more severely damaged. These results attest the usefulness of selection for cultivars with elevated frost tolerance for the environment under study.
As most of the cultivars included in the trial were of the winter type the set of cultivars was not best suited for studies of the effect of genetic causes of frost tolerance. However, significant differences were still found between cultivars carrying diverse haplotypes of vernalisation and photoperiod response genes (Table 4). Facultative and winter cultivars and cultivars carrying the recessive allele, ppd-H2 of the short day response gene PPD-H2 had a significantly higher frost tolerance than spring cultivars and cultivars with the dominant allele Ppd-H2 [7,8,30].

4.1.2. Heat

The lower winter temperatures at Fundulea also lead to a slower accumulation of heat sums, GDD. The resulting trend for later heading causes a more important contribution of the day-length forcing of plant development to the determination of heading dates. Late heading, in turn, shifts the maturation phases into periods of higher heat stress and drought risk.
The decrease in grain yield with the increase in the fraction of hot days during grain maturation, fhd, across all trials (Figure 6) hints to the negative impact of high temperatures on grain yield [19]. In Y1R and Y3R with an intermediate level of hot days this did not lead to a major impediment of grain filling, as evidenced by high TGW. In contrast, in the hottest experimental year, Y2R, the already low number of grains per square metre could not be filled to the same level as in the remaining trials (Table 2, Figure 10). These results are in accordance with the decreased barley GY in response to experimental warming reported by [52,53,54].

4.1.3. Other Stresses

The low and moderate levels of lodging in the trials Y1I and Y2R, respectively, did not lead to significant associations with grain yield. However, a weak, but significant negative correlation resulted between lodging and TGW (r = −0.51) in Y2R.

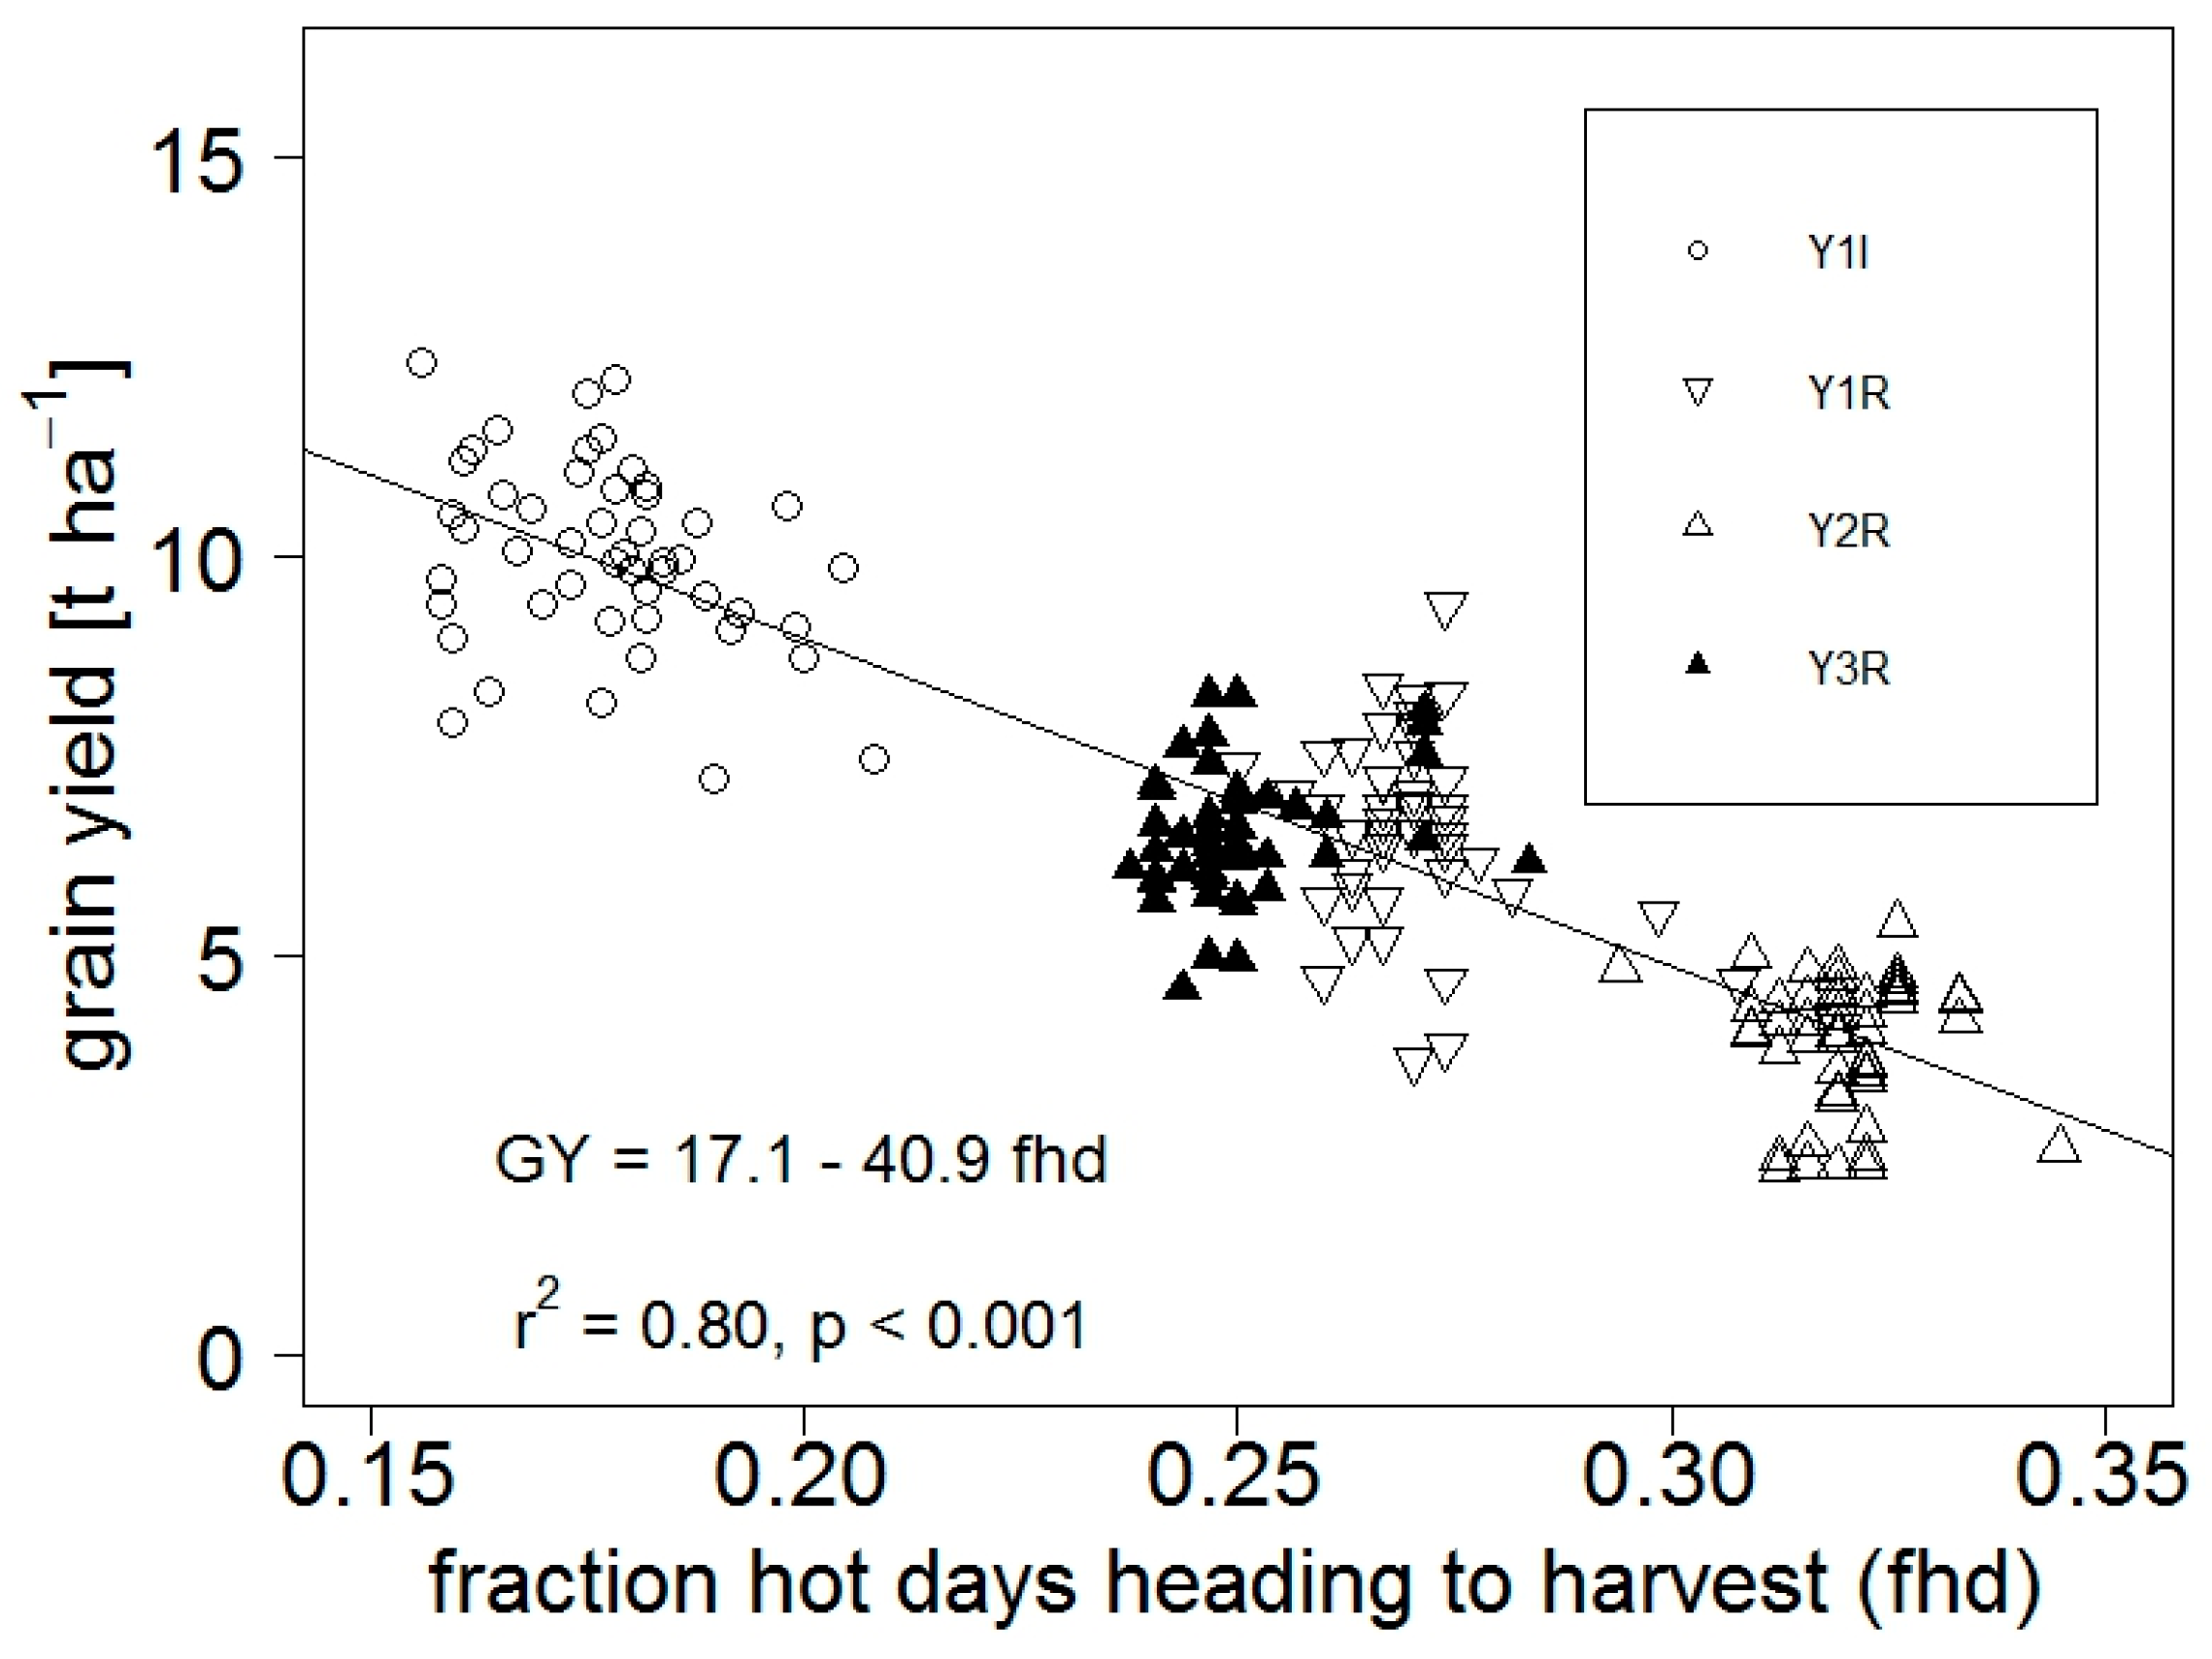
4.1.4. Limitations to Grain Yield

In both, the Italian and the Romanian site, the main limitation of GY resided in the production of potential sinks, i.e., grain numbers per square metre (r = 0.92 for GY—GN correlation across all trials), while grain filling contributed to a minor degree (r = 0.47 for GY—TGW correlation across all trials) to the differences in GY (Figure 10). These results are in accordance with the findings reported in [16,55] for Mediterranean environments. The phenotypic correlations reported in [16] were r = 0.948 and r = 0.559 for the association of GY with GN and TGW, respectively. In our study, the dominant effect of GN was also evidenced by the slight reduction in TGW of higher yielding cultivars relative to lower yielding cultivars in Y1I, Y1R and Y3R. The exception with generally a lower TGW was the trial in Y2R, as discussed above.
We hypothesise that the between trial differences in GN are related to the production of tillers that increases with accumulated temperatures during the vegetative growth phase, GDDsh and successive survival rates. If phyllochron is constant, lower temperatures lead to a lower number of meristems that produce leaves and tillers. This relationship would not hold for Y2R due to the frost damage. Across the remaining trials, GN and GDDsh were positively correlated with r = 0.61, p < 0.001. Another factor that may explain the difference in grain numbers between the Italian and the Romanian trials is the difference in nitrogen fertilization.

4.2. Differences in Agronomical Practice

The second difference between the Italian and Romanian sites resides in the different agronomic system in use. In Italy, abundant fertiliser application aims at the production of barley grain of high protein content used for animal feed. In contrast, in Romania a rather low input agronomic system was used in accordance with local practice. Lower nitrogen inputs, leading to lower GPC, are consistent with the quality requirements for malt production. The difference in total nitrogen input through fertilization between Y1I and the other trials may have contributed to the difference in productivity as it is know that improved nitrogen availability leads to higher tillering rates, tiller survival, number of grains per spike and thus GN [56,57,58]. As tiller numbers and grains per spike were not assessed with the current study, no conclusions can be drawn about the individual promoting and limiting factors. It is likely that higher fertilization contributed to the higher yields at Fiorenzuola. However, based on the yield response of barley to different N fertiliser doses found with a three year study at Fiorenzuola [59] we expect a yield reduction in the order of 6% only if the fertiliser dose applied at Fundulea would have been used at Fiorenzuola.

4.3. Genetic Diversity and Continentality

The heritability for GY, GN, TGW, HD and GPC with values above 0.6 indicated that a substantial fraction of the between genotype variability within the individual trials is due to heritable traits. This result is consistent with the significant trends in genetic gain for GY and for reduced plant height. The high differences in GY between the trials were related to more or less favourable climatic conditions for the production of sinks together with frost and heat stresses occurring during vegetative growth and grain maturation as discussed above. Substantially higher environmental variance relative to G and G × E variance components was also detected in Mediterranean environments [16,17]. Evaluating the combined effects of genotype and GDDsh and hotdhh with a GLM explained 77% of the total deviance in the complete data set with all single plot measurements, while genotype alone explained only 7.7%, GDDsh and hotdhh 69.6% of the deviance. Higher GDDsh was associated with increased GY and higher hotdhh with lower GY. An alternative model with genotype and nitrogen fertiliser and hotdhh as independent variables explained 79.1% of the total deviance. Disentangling the effects of favourable early season temperatures and fertilization would require further experiments with both agronomic treatments compared at both sites in order to evaluate the full Genotype (G) × Environment (E) × Management (M) interaction [31].
Adaptive traits for stress tolerance turned out to contribute to stable GY in the case of Y2R where the spring types with lower frost tolerance were more strongly penalised by a frost event occurring prior to snow cover. The prevalence of the alleles VRN-H1, VRN-H2 and ppd-H2 conferring elevated frost tolerance in the Romanian cultivars in accord with the results of [30] thus turned out to be a putative result of selection for the frequently harsh winters at the Romanian site of higher continentality.
A trend for early heading associated with Ppd-H2 came along with lower GY. We hypothesise that hastened pre heading development did not confer advantages in terms of escape from late season stresses. However, different results may be obtained in years with pronounced late season drought stresses as was the case in Mediterranean environments with substantial variation in late season drought stresses [16] were Ppd-H2 was associated with higher GY. Note that late season drought events can occur in both the Italian and the Romanian study site. For the climate station Calarasi, representative for Fundulea (Table S2), several years with Palmer Drought Stress Index values indicating moderate to severe drought were reported for the time period 1990–2016 [60]. Thus, also summer drought is a characteristic environmental cue for selection of barley at the study sites. Next steps towards individuation of further breeding options require the identification of the genetic background of heat stress tolerance. Then, the Romanian cultivars with an elevated frost tolerance and the Italian cultivars with elevated heat stress tolerance can be employed for cross-breeding.
When the factors determining GY, identified above, were combined with a multiple linear regression model substantial fractions of total variance in GY could be explained. Regression for the cultivar averages in the individual trials with the independent variables hotdhh, YoR, fertilizer dose and PPDH2 alleles explained 86% (p < 0.001) of the total variance. A higher number of hot days and the dominant PpdH2 led to lower GY while later cultivar release and a higher fertilizer dose were associated with higher GY. Adding the frost survival score did marginally increase the explained variance but the model based on four independent variables was retained as more parsimonious based on the Akaike Information Criterion (AIC).
In summary, in the current study later heading after cooler winters and subsequent exposure to elevated temperatures was related to lower GY in the more continental environment. In the trial year with damaging winter frost GY also was correlated to winter survival. Allelic variants of VRN-H1, VRN-H2 and PPD-H2 determined between cultivar differences in frost tolerance. The Romanian cultivars were all winter types and carrying ppd-H2 and thus more frequently had a higher frost tolerance than the Italian cultivars. Elevated genetic diversity was found in the Italian germplasm due to presence of Ppd-H2 and ppd-H2. The dominant Ppd-H2 was found in the Italian cultivars only, in accordance with its prevalence in the Southern European barley germplasm [9]. PPD-H2 was associated with between cultivar differences in HD and GY as well as with the sensitivity of heading to day-length and the sensitivity of GY to elevated temperature stress.

Supplementary Materials

The following are available online at https://www.mdpi.com/2073-4395/8/6/79/s1, Table S1: Classification of the barley cultivars analysed in this study on the basis of the DNA polymorphism for selected vernalisation and photoperiod genes, Table S2: Comparison between climates of Fundulea (Romania) and Fiorenzuola (Italia), Supplementary Information SI1: Molecular Markers.

Author Contributions

F.R., L.V. and V.T. conceived and designed the experiments. C.M. conducted the molecular analyses. F.-W.B. performed the statistical analyses. R.A., M.B., D.P., N.F., A.B., E.A. and E.P. performed the field trials and conducted analyses of grain traits. F.R., L.V. and F.-W.B. wrote the paper and all authors read and approved it.

Acknowledgments

Research was funded by the Italian Ministero delle politiche agricole alimentari e forestali (MiPAAF) through the project FAO-RGV Risorse Genetiche. We thank Ivana Tagliaferri for valuable assistance in field work. We thank the editor and two anonymous reviewers for their helpful comments and suggestions.

Conflicts of Interest

The authors declare no conflict of interest.

References

  1. Stanca, A.M.; Francia, E.; Tondelli, A.; Badeck, F.W.; Terzi, V. Progress in Small Grain Cereals: A Case Study. In More Food: Road to Survival; Pilu, R., Gavazzi, G., Eds.; Bentham: Sharjah, UAE, 2017; pp. 578–604. [Google Scholar]
  2. Saulescu, N.N.; Braun, H.J. Cold tolerance. In Application of Physiology in Wheat Breeding; Reynolds, M.P., Ortiz-Monasterio, J.I., McNab, A., Eds.; CIMMYT: Mexico DF, NM, USA, 2001; pp. 111–123. [Google Scholar]
  3. Dawson, I.K.; Russell, J.; Powell, W.; Steffenson, B.; Thomas, W.T.B.; Waugh, R. Barley: A translational model for adaptation to climate change. New Phytol. 2015, 206, 913–931. [Google Scholar] [CrossRef] [PubMed]
  4. Tang, Q.H.; Zhang, X.J.; Yang, X.H.; Francis, J.A. Cold winter extremes in northern continents linked to Arctic sea ice loss. Environ. Res. Lett. 2013, 8, 014036. [Google Scholar] [CrossRef]
  5. Olesen, J.E.; Carter, T.R.; Diaz-Ambrona, C.H.; Fronzek, S.; Heidmann, T.; Hickler, T.; Holt, T.; Minguez, M.I.; Morales, P.; Palutikof, J.P.; et al. Uncertainties in projected impacts of climate change on European agriculture and terrestrial ecosystems based on scenarios from regional climate models. Clim. Chang. 2007, 81, 123–143. [Google Scholar] [CrossRef]
  6. Rapacz, M.; Jurczyk, B.; Sasal, M. Deacclimation may be crucial for winter survival of cereals under warming climate. Plant Sci. 2017, 256, 5–15. [Google Scholar] [CrossRef] [PubMed]
  7. Sasani, S.; Hemming, M.N.; Oliver, S.N.; Greenup, A.; Tavakkol-Afshari, R.; Mahfoozi, S.; Poustini, K.; Sharifi, H.-R.; Dennis, E.S.; Peacock, W.J. The influence of vernalization and daylength on expression of flowering-time genes in the shoot apex and leaves of barley (Hordeum vulgare). J. Exp. Bot. 2009, 60, 2169–2178. [Google Scholar] [CrossRef] [PubMed]
  8. Karsai, I.; Meszaros, K.; Lang, L.; Hayes, P.M.; Bedo, Z. Multivariate analysis of traits determining adaptation in cultivated barley. Plant Breed. 2001, 120, 217–222. [Google Scholar] [CrossRef]
  9. Casao, M.C.; Karsai, I.; Igartua, E.; Gracia, M.P.; Veisz, O.; Casas, A.M. Adaptation of barley to mild winters: A role for PPDH2. BMC Plant Biol. 2011, 11. [Google Scholar] [CrossRef] [PubMed] [Green Version]
  10. Takahashi, R.; Yasuda, S. Genetics of earliness and growth habit in barley. In Barley Genetics II; Nilan, R.A., Ed.; Washington State University Press: Pullman, WA, USA, 1971; pp. 388–408. [Google Scholar]
  11. Laurie, D.A.; Pratchett, N.; Bezant, J.H.; Snape, J.W. Genetic analysis of a photoperiod response gene on the short arm of chromosome 2 (2H) of Hordeum vulgare (barley). Heredity 1994, 72, 619–627. [Google Scholar] [CrossRef]
  12. Laurie, D.A.; Pratchett, N.; Snape, J.W.; Bezant, J.H. RFLP mapping of five major genes and eight quantitative trait loci controlling flowering time in a winter × spring barley (Hordeum vulgare L.) cross. Genome 1995, 38, 575–585. [Google Scholar] [CrossRef] [PubMed]
  13. Fowler, D.B.; Byrns, B.M.; Greer, K.J. Overwinter low-temperature responses of cereals: Analyses and simulation. Crop Sci. 2014, 54, 2395–2405. [Google Scholar] [CrossRef]
  14. Cuesta-Marcos, A.; Munoz-Amatriain, M.; Filichkin, T.; Karsai, I.; Trevaskis, B.; Yasuda, S.; Hayes, P.; Sato, K. The relationships between development and low temperature tolerance in barley near isogenic lines differing for flowering behavior. Plant Cell Physiol. 2015, 56, 2312–2324. [Google Scholar] [CrossRef] [PubMed]
  15. Distelfeld, A.; Li, C.; Dubcovsky, J. Regulation of flowering in temperate cereals. Curr. Opin. Plant Biol. 2009, 12, 178–184. [Google Scholar] [CrossRef] [PubMed]
  16. Francia, E.; Tondelli, A.; Rizza, F.; Badeck, F.W.; Nicosia, O.L.D.; Akar, T.; Grando, S.; Al-Yassin, A.; Benbelkacem, A.; Thomas, W.T.B.; et al. Determinants of barley grain yield in a wide range of Mediterranean environments. Field Crops Res. 2011, 120, 169–178. [Google Scholar] [CrossRef]
  17. Rollins, J.A.; Drosse, B.; Mulki, M.A.; Grando, S.; Baum, M.; Singh, M.; Ceccarelli, S.; von Korff, M. Variation at the vernalisation genes Vrn-H1 and Vrn-H2 determines growth and yield stability in barley (Hordeum vulgare) grown under dryland conditions in Syria. Theor. Appl. Genet. 2013, 126, 2803–2824. [Google Scholar] [CrossRef] [PubMed]
  18. Zampieri, M.; Ceglar, A.; Dentener, F.; Toreti, A. Wheat yield loss attributable to heat waves, drought and water excess at the global, national and subnational scales. Environ. Res. Lett. 2017, 12, 064008. [Google Scholar] [CrossRef]
  19. Semenov, M.A.; Shewry, P.R. Modelling predicts that heat stress, not drought, will increase vulnerability of wheat in Europe. Sci. Rep. 2011, 1. [Google Scholar] [CrossRef] [PubMed]
  20. Porter, J.R.; Gawith, M. Temperatures and the growth and development of wheat: A review. Eur. J. Agron. 1999, 10, 23–36. [Google Scholar] [CrossRef]
  21. Tester, M.; Langridge, P. Breeding technologies to increase crop production in a changing world. Science 2010, 327, 818–822. [Google Scholar] [CrossRef] [PubMed]
  22. Pswarayi, A.; Van Eeuwijk, F.A.; Ceccarelli, S.; Grando, S.; Comadran, J.; Russell, J.R.; Pecchioni, N.; Tondelli, A.; Akar, T.; Al-Yassin, A. Changes in allele frequencies in landraces, old and modern barley cultivars of marker loci close to QTL for grain yield under high and low input conditions. Euphytica 2008, 163, 435–447. [Google Scholar] [CrossRef]
  23. Jones, H.; Civan, P.; Cockram, J.; Leigh, F.J.; Smith, L.M.J.; Jones, M.K.; Charles, M.P.; Molina-Cano, J.-L.; Powell, W.; Jones, G. Evolutionary history of barley cultivation in Europe revealed by genetic analysis of extant landraces. BMC Evolut. Boil. 2011, 11. [Google Scholar] [CrossRef] [PubMed]
  24. McNally, K.L.; Childs, K.L.; Bohnert, R.; Davidson, R.M.; Zhao, K.; Ulat, V.J.; Zeller, G.; Clark, R.M.; Hoen, D.R.; Bureau, T.E. Genomewide SNP variation reveals relationships among landraces and modern varieties of rice. Proc. Natl. Acad. Sci. USA 2009, 106, 12273–12278. [Google Scholar] [CrossRef] [PubMed]
  25. Cockram, J.; Horsnell, R.; Soh, E.-H.; Norris, C.; O’Sullivan, D.M. Molecular and phenotypic characterization of the alternative seasonal growth habit and flowering time in barley (Hordeum vulgare ssp. vulgare L.). Mol. Breed. 2015, 35, 165. [Google Scholar] [CrossRef]
  26. Meyer, R.S.; Purugganan, M.D. Evolution of crop species: Genetics of domestication and diversification. Nat. Rev. Genet. 2013, 14, 840–852. [Google Scholar] [CrossRef] [PubMed]
  27. Cavanagh, C.R.; Chao, S.; Wang, S.; Huang, B.E.; Stephen, S.; Kiani, S.; Forrest, K.; Saintenac, C.; Brown-Guedira, G.L.; Akhunova, A. Genome-wide comparative diversity uncovers multiple targets of selection for improvement in hexaploid wheat landraces and cultivars. Proc. Natl. Acad. Sci. USA 2013, 110, 8057–8062. [Google Scholar] [CrossRef] [PubMed]
  28. Stroia, I.; Begea, M.; Baron, E.; Musu, S.; Baldea, G.; Vladescu, M.; Begea, P.; Ion, R.A.; Vasilescu, L. Malting behaviour of barley varieties cultivated in Romania for brewing from the harvest 2004—Characteristics of biological material. J. Agroaliment. Process. Technol. 2006, 12, 307–312. [Google Scholar]
  29. Cattivelli, L.; Faccini, N.; Gianinetti, A.; Alberici, R.; Amato, G.; Anastasi, U.; Attene, G.; Baravelli, M.; Barbiani, G.; Baronchelli, M. Orzo: Buoni risultati produttivi nonostante i mesi siccitosi. L’Inf. Agrar. 2017, 29, 36–41. [Google Scholar]
  30. Rizza, F.; Karsai, I.; Morcia, C.; Badeck, F.-W.; Terzi, V.; Pagani, D.; Kiss, T.; Stanca, A.M. Association between the allele compositions of major plant developmental genes and frost tolerance in barley (Hordeum vulgare L.) germplasm of different origin. Mol. Breed. 2016, 36. [Google Scholar] [CrossRef]
  31. Großkinsky, D.K.; Svensgaard, J.; Christensen, S.; Roitsch, T. Plant phenomics and the need for physiological phenotyping across scales to narrow the genotype-to-phenotype knowledge gap. J. Exp. Bot. 2015, 66, 5429–5440. [Google Scholar] [CrossRef] [PubMed]
  32. Maxwell, K.; Johnson, G.N. Chlorophyll fluorescence—A practical guide. J. Exp. Bot. 2000, 51, 659–668. [Google Scholar] [CrossRef] [PubMed]
  33. Baker, N.R.; Rosenqvist, E. Applications of chlorophyll fluorescence can improve crop production strategies: An examination of future possibilities. J. Exp. Bot. 2004, 55, 1607–1621. [Google Scholar] [CrossRef] [PubMed]
  34. Barbagallo, R.P.; Oxborough, K.; Pallett, K.E.; Baker, N.R. Rapid, noninvasive screening for perturbations of metabolism and plant growth using chlorophyll fluorescence imaging. Plant Physiol. 2003, 132, 485–493. [Google Scholar] [CrossRef] [PubMed]
  35. Rizza, F.; Pagani, D.; Stanca, A.M.; Cattivelli, L. Use of chlorophyll fluorescence to evaluate the cold acclimation and freezing tolerance of winter and spring oats. Plant Breed. 2001, 120, 389–396. [Google Scholar] [CrossRef]
  36. Dai, F.; Zhou, M.; Zhang, G. The change of chlorophyll fluorescence parameters in winter barley during recovery after freezing shock and as affected by cold acclimation and irradiance. Plant Physiol. Biochem. 2007, 45, 915–921. [Google Scholar] [CrossRef] [PubMed]
  37. Briantais, J.-M.; Dacosta, J.; Goulas, Y.; Ducruet, J.-M.; Moya, I. Heat stress induces in leaves an increase of the minimum level of chlorophyll fluorescence, Fo: A time-resolved analysis. Photosynth. Res. 1996, 48, 189–196. [Google Scholar] [CrossRef] [PubMed]
  38. Sharma, D.K.; Fernandez, J.O.; Rosenqvist, E.; Ottosen, C.-O.; Andersen, S.B. Genotypic response of detached leaves versus intact plants for chlorophyll fluorescence parameters under high temperature stress in wheat. J. Plant Physiol. 2014, 171, 576–586. [Google Scholar] [CrossRef] [PubMed]
  39. Cajanek, M.; Stroch, M.; Lachetova, I.; Kalina, J.; Spunda, V. Characterization of the photosystem II inactivation of heat-stressed barley leaves as monitored by the various parameters of chlorophyll a fluorescence and delayed fluorescence. J. Photochem. Photobiol. B Biol. 1998, 47, 39–45. [Google Scholar] [CrossRef]
  40. Woo, N.S.; Badger, M.R.; Pogson, B.J. A rapid, non-invasive procedure for quantitative assessment of drought survival using chlorophyll fluorescence. Plant Methods 2008, 4. [Google Scholar] [CrossRef] [PubMed]
  41. Rizza, F.; Badeck, F.W.; Cattivelli, L.; Lidestri, O.; Di Fonzo, N.; Stanca, A.M. Use of a water stress index to identify barley genotypes adapted to rainfed and irrigated conditions. Crop Sci. 2004, 44, 2127–2137. [Google Scholar] [CrossRef]
  42. Rizza, F.; Pagani, D.; Gut, M.; Prasil, I.T.; Lago, C.; Tondelli, A.; Orru, L.; Mazzucotelli, E.; Francia, E.; Badeck, F.W.; et al. Diversity in the Response to Low Temperature in Representative Barley Genotypes Cultivated in Europe. Crop Sci. 2011, 51, 2759–2779. [Google Scholar] [CrossRef]
  43. R. Core Team. R: A Language and Environment for Statistical Computing. Vienna: R Foundation for Statistical Computing. Available online: http://www.R-project.org/ (accessed on 21 November 2014).
  44. Nazari, L.; Pattori, E.; Terzi, V.; Morcia, C.; Rossi, V. Influence of temperature on infection, growth, and mycotoxin production by Fusarium langsethiae and F. sporotrichioides in durum wheat. Food Microbial. 2014, 39, 19–26. [Google Scholar] [CrossRef] [PubMed]
  45. Miflin, B. Crop improvement in the 21st century. J. Exp. Bot. 2000, 51, 1–8. [Google Scholar] [CrossRef] [PubMed]
  46. Karsai, I.; Szücs, P.; Meszaros, K.; Filichkina, T.; Hayes, P.M.; Skinner, J.S.; Lang, L.; Bedo, Z. The Vrn-H2 locus is a major determinant of flowering time in a facultative winter growth habit barley (Hordeum vulgare L.) mapping population. Theor. Appl. Genet. 2005, 110, 1458–1466. [Google Scholar] [CrossRef] [PubMed]
  47. Casao, M.C.; Igartua, E.; Karsai, I.; Lasa, J.M.; Gracia, M.P.; Casas, A.M. Expression analysis of vernalization and day-length response genes in barley (Hordeum vulgare L.) indicates that VRNH2 is a repressor of PPDH2 (HvFT3) under long days. J. Exp. Bot. 2011, 62, 1939–1949. [Google Scholar] [CrossRef] [PubMed]
  48. Fisk, S.P.; Cuesta-Marcos, A.; Cistue, L.; Russell, J.; Smith, K.P.; Baenziger, S.; Bedo, Z.; Corey, A.; Filichkin, T.; Karsai, I.; et al. FR-H3: A new QTL to assist in the development of fall-sown barley with superior low temperature tolerance. Theor. Appl. Genet. 2013, 126, 335–347. [Google Scholar] [CrossRef] [PubMed] [Green Version]
  49. Hemming, M.N.; Fieg, S.; Peacock, W.J.; Dennis, E.S.; Trevaskis, B. Regions associated with repression of the barley (Hordeum vulgare) VERNALIZATION1 gene are not required for cold induction. Mol. Genet. Genom. 2009, 282, 107–117. [Google Scholar] [CrossRef] [PubMed]
  50. Trevaskis, B. The central role of the VERNALIZATION1 gene in the vernalization response of cereals. Funct. Plant Biol. 2010, 37, 479–487. [Google Scholar] [CrossRef]
  51. Prasil, I.T.; Prasilova, P.; Marik, P. Comparative study of direct and indirect evaluations of frost tolerance in barley. Field Crop. Res. 2007, 102, 1–8. [Google Scholar] [CrossRef]
  52. Garcia, G.A.; Dreccer, M.F.; Miralles, D.J.; Serrago, R.N.A. High night temperatures during grain number determination reduce wheat and barley grain yield: A field study. Glob. Chang. Biol. 2015, 21, 4153–4164. [Google Scholar] [CrossRef] [PubMed]
  53. Garcia, G.A.; Serrago, R.N.A.; Dreccer, M.F.; Miralles, D.J. Post-anthesis warm nights reduce grain weight in field-grown wheat and barley. Field Crop. Res. 2016, 195, 50–59. [Google Scholar] [CrossRef]
  54. Ugarte, C.; Calderini, D.F.; Slafer, G.A. Grain weight and grain number responsiveness to pre-anthesis temperature in wheat, barley and triticale. Field Crop. Res. 2007, 100, 240–248. [Google Scholar] [CrossRef]
  55. Cossani, C.M.; Slafer, G.A.; Savin, R. Yield and biomass in wheat and barley under a range of conditions in a Mediterranean site. Field Crop. Res. 2009, 112, 205–213. [Google Scholar] [CrossRef]
  56. Alzueta, I.; Abeledo, L.G.; Mignone, C.M.; Miralles, D.J. Differences between wheat and barley in leaf and tillering coordination under contrasting nitrogen and sulfur conditions. Eur. J. Agron. 2012, 41, 92–102. [Google Scholar] [CrossRef]
  57. Baethgen, W.E.; Christianson, C.B.; Lamothe, A.G. Nitrogen fertilizer effects on growth, grain yield, and yield components of malting barley. Field Crop. Res. 1995, 43, 87–99. [Google Scholar] [CrossRef]
  58. Sieling, K.; Schröder, H.; Finck, M.; Hanus, H. Yield, N uptake, and apparent N-use efficiency of winter wheat and winter barley grown in different cropping systems. J. Agric. Sci. 1998, 131, 375–387. [Google Scholar] [CrossRef]
  59. Delogu, G.; Cattivelli, L.; Pecchioni, N.; Defalcis, D.; Maggiore, T.; Stanca, A.M. Uptake and Agronomic Efficiency of Nitrogen in Winter Barley and Winter Wheat. Eur. J. Agron. 1998, 9, 11–20. [Google Scholar] [CrossRef]
  60. Laslo, L.; Ciobotaru, N.; Lupei, T.; Matei, M.; Velcea, A.M.; Boboc, M.; Badea, G.; Gyorgy, D. Drought and Irrigations of Romanian Agricultural Areas. RevCAD J. Geod. Cadastre 2017, 23, 117–124. [Google Scholar]
Figure 1. Average temperature (red line) and daily precipitation sum (blue bars) during the four growing seasons: Y1I (a), Y1R (b), Y2R (c), Y3R (d). Also shown: growing degree days from sowing to harvest, GDD; cold degree days from sowing to harvest: CDD and precipitation sum form sowing to harvest, Prec. Horizontal grey lines indicate snow cover. Note: y axis are not scaled uniformly.
Agronomy 08 00079 g001
Figure 2. Minimal, average and maximal daily temperatures during the four growing seasons: Y1I (a), Y1R (b), Y2R (c), Y3R (d). The vertical green lines indicate the date of earliest and latest heading cultivars. Note: y axis are not scaled uniformly.
Agronomy 08 00079 g002
Figure 3. Grain yield in the Y1I (a), Y1R (b), Y2R (c) and Y3R (d) trials. Romanian cultivars are shown in blue, Italian cultivars in green, German cultivars in grey. Yields for cultivars with common letters are not statistically different, Tukeys HSD test.
Agronomy 08 00079 g003
Figure 4. Frequency distribution of the regression slopes for all single cultivars across all four environments of GDD accumulated till day of heading versus day-length at day of heading (°C h−1) in blue the distribution for the Romanian cultivars.
Agronomy 08 00079 g004
Figure 5. Grain yield for different levels of frost survival scores taken in Y2R. The fit with a Gompertz function: y = 0.24582 + (0.18632 × e (−603.27214 × e (−0.1355 × GLFfrost))) is shown with a red line. Box and whisker plots were used to visualise distributions of results where the line within the box stands for the median. The box range includes the second and third quartile and the whiskers are located at the maximum and minimum values or at 1.5 times the interquartile range from the box. If more extreme values are present, these are then shown with circles. The numbers below the boxes denote the number of cultivars in the respective survival class.
Agronomy 08 00079 g005
Figure 6. Grain yield versus fraction of days between heading and harvest that are hot days (fhd) with Tmax > 30 °C. The regression equation and statistics of the regression of GY against fhd are shown within the figure.
Agronomy 08 00079 g006
Figure 7. Relative rank for frost tolerance assessed with the laboratory freezing test. Relative ranks of Fv/Fm measured after 24 h of recovery. Blue = Romanian cultivars, green = Italian cultivars, grey = additional checks (Merlot, DEU; Pamina, DEU). 48 cultivars, the Romanian cultivar Intensiv 2 is missing due to germination failure. Box and whisker plots were used to visualise distributions of results where the line within the box stands for the median. The box range includes the second and third quartile and the whiskers are located at the maximum and minimum values or at 1.5 times the interquartile range from the box. If more extreme values are present, these are then shown with circles.
Agronomy 08 00079 g007
Figure 8. Relative rank of heat tolerance assessed with the laboratory high temperature stress test. Relative ranks of Fv/Fm measured after 24 h of recovery. Experiment without acclimation, plants grown at 20/15 °C (Exp. 1). Blue = 18 Romanian cultivars, green = 25 Italian cultivars (4 cultivars missing due to germination failure), grey = additional checks (Merlot, DEU; Pamina, DEU). For cultivars Airone and Grivita only one plant successfully germinated. Box and whisker plots were used to visualise distributions of results where the line within the box stands for the median. The box range includes the second and third quartile and the whiskers are located at the maximum and minimum values or at 1.5 times the interquartile range from the box.
Agronomy 08 00079 g008
Figure 9. (a) Heat tolerance: Fv/Fm measured on plants (Exp. 1) before heat stress treatments (Ctrl) and after consecutive exposure to 30 °C, 37 °C, 42 °C, and 45 °C, followed by a measurement after 24 h of recovery (Rec) and after 4 days of recovery (Rec4d). (b) Response to high temperatures in 20 cultivars (18 Romanian, Sfera, Merlot, Exp. 2). One batch of plants was grown at 20 °C (in blue) and another batch acclimated at 32/27 °C for the last four days prior to the stress treatment (in red). Subsets of every batch were exposed to stress temperatures of 35, 40 or 45 °C and Fv/Fm measured after recovery in the dark. Box and whisker plots were used to visualise distributions of results where the line within the box stands for the median. The box range includes the second and third quartile and the whiskers are located at the maximum and minimum values or at 1.5 times the interquartile range from the box. If more extreme values are present, these are then shown with circles.
Agronomy 08 00079 g009
Figure 10. GY versus GN. Black lines indicate different levels of corresponding TGW.
Agronomy 08 00079 g010
Table 1. Agronomic treatments applied in the trials at Fiorenzuola d’Arda and Fundulea.
TreatmentY1IY1RY2RY3R
SiteFiorenzuolaFunduleaFunduleaFundulea
Agronomic year2014/20152014/20152015/20162016/2017
Sowing date3 November 20145 November 20149 October 201515 October 2016
Harvest date2 July 201520 July 201525 July 201620 July 2017
Nitrogen, pre-sowing45 kg N ha−1nonenonenone
Nitrogen, topdressing52 kg N ha−1100 kg urea (47 kg N ha−1) applied in March100 kg urea (47 kg N ha−1) applied in March100 kg urea (47 kg N ha−1) applied in March
herbicideAxial pronto + Trimmer SXtribenuron metil + fluroxipir-meptiltribenuron metil + fluroxipir-meptiltribenuron metil + fluroxipir-meptil
fungicidenonenonenonenone
insecticidenonenonenonenone
Table 2. Results of ANOVA and subsequent Tukey HSD test, results for grain yield, GY, number of grains per square metre, GN, thousand grain weight, TGW, days from sowing to heading, HD, grain protein content, GPC. Identical letters in the columns with trial means indicate means that were not significantly different.
TraitGY (t ha−1)GN (m−2)TGW (g)HD (DAS)GPC (%)
Cultivarp < 0.001p < 0.001p < 0.001p < 0.001p < 0.001
Environmentp < 0.001p < 0.001p < 0.001p < 0.001p < 0.001
C × Ep < 0.001p < 0.01p < 0.001p < 0.001p < 0.001
Mean Y1I10.02 a20525 a49.2 b174 d11.28 c
Mean Y1R6.53 b12803 b51.4 a184 c13.93 b
Mean Y2R3.94 c10990 c36.1 c197 b14.41 a
Mean Y3R6.53 b12732 b51.5 a202 a11.08 d
Table 3. Correlation between measures of frost tolerance and frost survival, correlation coefficients and p-values in parantheses. Fv/Fm recovery = Fv/Fm in the laboratory freezing test after 24 h of recovery, Frost damage Y1I = frost survival score in Y1I, Frost survival Y2R = frost survival score, GLFfrost, in Y2R.
TraitFv/Fm RecoveryFrost Survival Y1I
Fv/Fm recovery
Frost survival Y1I0.324 (0.023)
Frost survival Y2R0.496 (<0.001)−0.004 (0.975)
Table 4. Average frost survival scored in the field and Fv/Fm measured in the laboratory frost tolerance test for groups of cultivars being of facultative (F), winter (W) or spring (S) growth habit (Table S1, column: growth habit, VRN-H1/VRN-H2) or carrying the dominant Ppd-H2 or recessive ppd-H2 alleles and error levels (p) of between group difference. In parentheses: number of cultivars carrying the respective allele. Identical letters within rows indicate means that are not significantly different.
TraitF (2)W(44)S (3)pppd-H2 (38)Ppd-H2 (11)p
Frost survival Y1I7.67 a6.71 b5.89 c<0.026.68 a6.78 ans
GLF Y2R47.5 ab65.6 a28.3 b<0.00166.349.6<0.003
Fv/Fm0.540.620.21<0.0010.610.51<0.02
Table 5. ANOVA and successive LSD test for the effect of PPD-H2 alleles on the duration of the sowing to heading period and GY. In parentheses: number of cultivars carrying the respective allele. Identical letters within rows indicate means that are not significantly different.
Trialppd-H2 (38)Ppd-H2 (11)pTrialppd-H2 (38)Ppd-H2 (11)p
Heading Y1I175.8 a167.4 bp < 0.001GY Y1I10.28 a9.95 ap = 0.413
Heading Y1R183.8 a183.4 ap = 0.630GY Y1R6.81 a5.57 bp < 0.002
Heading Y2R197.1 a196.8 ap = 0.726GY Y2R4.17 a3.15 bp < 0.001
Heading Y3R203.4 a201.3 bp = 0.021GY Y3R6.62 a6.24 ap = 0.177

