Article

Exogenous Abscisic Acid Modulates Physiological and Sugar Metabolic Responses to Alleviate Low-Light Injury in Cherry Tomato

Institute of Facility Agriculture, Guangdong Academy of Agricultural Sciences, Guangzhou 510640, China
*
Author to whom correspondence should be addressed.
Agronomy 2026, 16(9), 928; https://doi.org/10.3390/agronomy16090928
Submission received: 26 March 2026 / Revised: 27 April 2026 / Accepted: 29 April 2026 / Published: 2 May 2026
(This article belongs to the Section Horticultural and Floricultural Crops)

Abstract

Low-light (LL) stress is a major abiotic limiting factor in protected cherry tomato production, adversely affecting vegetative growth, inducing oxidative damage, and disrupting fruit sugar metabolism. To clarify the regulatory role of exogenous abscisic acid (ABA) in mitigating LL stress, we examined the effects of varying ABA concentrations on plant growth, antioxidant capacity, and fruit sugar metabolism in cherry tomatoes under low-light conditions. A two-factor randomized complete block design, with two light regimes—normal light (NL, 100% natural sunlight) and low light (LL, 25% natural sunlight)—and three ABA concentrations (CK: 0 mg·L−1, T1: 10 mg·L−1, T2: 20 mg·L−1). Fruits were sampled at three typical ripening stages (green mature, breaker, and red ripe) to evaluate vegetative and reproductive physiological responses. The results showed that exogenous ABA application effectively suppressed LL-induced excessive stem elongation and alleviated LL-caused reductions in stem diameter and biomass accumulation. ABA treatment significantly increased peroxidase (POD) activity and reduced malondialdehyde (MDA) and hydrogen peroxide (H2O2) accumulation, thereby relieving LL-triggered oxidative damage. In addition, ABA regulated key sugar-metabolizing enzymes (soluble acid invertase (SAI), sucrose synthase (SS), sucrose phosphate synthase (SPS), and amylase (Amy)) and the transcript levels of related functional genes (HXK1, SPS, SS, AI), thereby mediating stage-dependent fruit sugar metabolism under LL stress. In conclusion, exogenous ABA effectively modulates vegetative growth, antioxidant homeostasis, and stage-specific fruit sugar metabolism, ultimately alleviating low-light stress damage in cherry tomato. Among the tested treatments, 20 mg·L−1 ABA exhibited the most pronounced mitigation effects, which can be recommended as an optimal foliar application concentration for cherry tomato cultivation in low-light protected facilities.

1. Introduction

Cherry tomatoes (Solanum lycopersicum var. cerasiforme) are high-value horticultural crops renowned for their nutritional density (e.g., vitamins, antioxidants) and distinctive flavor [1]. As a typical light-dependent species, adequate irradiance is indispensable for their photosynthetic efficiency, dry matter partitioning, and fruit quality development [2]. However, low-light (LL) stress, a major abiotic stress prevalent in protected cultivation systems (e.g., winter greenhouses) and cloudy regions, exerts a severe restrictive effect on cherry tomato yield and quality [3,4,5].
LL stress disrupts the balance of light energy absorption and utilization, leading to reduced photosynthetic capacity, altered dry matter allocation, and etiolated growth phenotypes (e.g., excessive stem elongation, decreased stem diameter, and suppressed biomass accumulation) [6,7]. Furthermore, LL perturbs reactive oxygen species (ROS) homeostasis, triggering the overaccumulation of O2− and H2O2, which induce membrane oxidative damage (elevated malondialdehyde (MDA)) and growth inhibition [8,9]. Critically, tomato plants exhibit differential sensitivity to low light across reproductive stages, leading to stage-specific declines in fruit sweetness and altered sugar composition under stress, which ultimately compromises market value [10]. Sugar metabolism in tomato fruits is centered on sucrose catabolism and utilization, with key enzymes including soluble acid invertase (SAI), neutral invertase (NI), sucrose synthase (SS), and sucrose phosphate synthase (SPS) governing sucrose synthesis, breakdown, and interconversion [11,12,13]. Dynamic changes in the activities of these enzymes and the resulting sugar flux are tightly coupled to fruit development and quality trait formation. Under LL stress, this intricate sucrose metabolic network is disrupted, leading to perturbed metabolic flux and impaired source–sink relationships. This imbalance ultimately reduces fruit taste and commercial quality [14,15].
As a vital stress-responsive phytohormone, exogenous abscisic acid (ABA) positively regulates tomato morphological adaptation, antioxidant defense, and sugar redistribution under adverse environments [16,17,18]. Studies [16] have shown that ABA regulates tomato plant architecture by coordinating the balance between cell division and elongation. Specifically, ABA restricts the excessive elongation of above-ground tissues to prioritize root system development; meanwhile, it can maintain basic plant growth by optimizing the distribution of photosynthetic products. In addition, ABA significantly enhances the activities of superoxide dismutase (SOD), peroxidase (POD), and catalase (CAT) in tomato leaves by systematically activating antioxidant enzyme synthesis pathways; it also alleviates membrane lipid peroxidation damage induced by ROS, reduces malondialdehyde (MDA) accumulation, and thus exerts a prominent regulatory effect on the tomato antioxidant defense system [17,19].
Sugar metabolism is essential for the development of tomato fruit quality. As a central regulatory factor, ABA controls the activities and transcript levels of major enzymes such as invertases and sucrose synthases, thus governing the conversion and accumulation of sucrose to glucose and fructose [13,18]. The ABA-responsive element binding protein (AREB) mediates the activation of acid invertase during tomato fruit development, which directly promotes hexose accumulation and thereby enhances fruit sweetness and commercial value [20]. Notably, the regulatory function of ABA exhibits distinct environmental dependence. Li et al. [21] demonstrated that ABA mediates the inhibition of tomato hypocotyl elongation via the SlPP2C.D—SlSAUR functional module, where ABA indirectly interferes with auxin signal transduction. This finding aligns with the regulatory pattern that ABA suppresses auxin-driven cell elongation in tomato seedlings under low-light (LL) conditions, thereby effectively mitigating etiolation and excessive growth.
Nevertheless, the regulatory network underlying this specific LL-responsive pathway remains incompletely elucidated. Furthermore, how exogenous ABA coordinately modulates vegetative growth, antioxidant homeostasis, and stage-dependent fruit sugar metabolism across distinct ripening stages in cherry tomatoes under continuous LL stress, as well as the crosstalk mechanism between ABA and light signaling pathways, remains poorly characterized and lacks systematic evidence. Therefore, this study aimed to evaluate the effects of exogenous ABA on cherry tomato growth (plant height, stem diameter, biomass) under LL stress, clarify its regulatory role in the antioxidant system to alleviate LL-induced oxidative damage, and explore its stage-specific impacts on fruit sugar metabolism at the mature green (MG), breaker (BR), and red ripe (RR) stages. The results of this work will reveal the coordinated regulation of ABA on vegetative growth, redox balance, and sugar metabolism across fruit developmental stages under low light, and complement the existing knowledge of hormone–light crosstalk in horticultural crops. Among the tested concentrations, the most effective ABA treatment was identified under our experimental conditions, providing insights into a promising foliar application strategy for protected cherry tomato production under low-light stress.

2. Materials and Methods

2.1. Experiment Set Up

This experiment was conducted in the greenhouse of the Institute of Facility Agriculture, Guangzhou, Guangdong Province, China. The natural photosynthetically active radiation (PAR) at noon during the experimental period was approximately 550–600 µmol·m−2·s−1 under normal light conditions. Average diurnal/nocturnal temperature and relative humidity during growth were 31 ± 2 °C/20 ± 2 °C and 65 ± 10%, respectively. Black shade nets (25% transmittance) were used to establish normal light (NL, 100% natural sunlight) and low-light (LL, 25% natural sunlight) regimes, with three exogenous ABA concentrations (CK (0 mg·L−1), T1 (10 mg·L−1), T2 (20 mg·L−1)) applied under each light condition. The concentration and treatment conditions of ABA were determined according to preliminary experiments. A total of six treatments were arranged in a completely randomized design, with eight biological replicate plants per treatment randomly selected from different greenhouse zones to reduce positional microclimate variation and ensure experimental homogeneity. A floating hydroponic system with staggered 40 cm × 100 cm boards was adopted; four-week-old cherry tomato seedlings (Solanum lycopersicum cv. Yuekeda 202) were transplanted into tanks (1.8 m row spacing, 0.33 m intra-row spacing) and uniformly allocated to NL/LL groups immediately after transplantation. Foliar ABA spraying (purity ≥ 99%, Yuanye Bio-Technology, Shanghai, China) was initiated at the primary inflorescence first flowering, conducted 6 times every 3 days (uniformly sprayed to complete leaf coverage with no solution dripping). Topping was performed during vegetative growth to retain 5 fruiting trusses per plant for optimizing photosynthate translocation to reproductive organs. All plants were harvested and the second truss fruits reached full red maturity.

2.2. Determination of Antioxidant Enzyme Activity, MDA, and H2O2 Measurements

The 3rd fully expanded leaf from the top of each plant was collected 3 days after the termination of ABA treatment for the determination of superoxide dismutase (SOD) activity, peroxidase (POD) activity, catalase (CAT) activity, malondialdehyde (MDA) content, and hydrogen peroxide (H2O2) content; SOD, POD, and CAT activities were assayed using specific enzyme activity assay kits (ProNet Biotech Co., Ltd., Nanjing, China), with 0.1 g of fresh leaf tissue homogenized in 1 mL of ice-cold extraction buffer for each assay, while MDA and H2O2 contents were determined using the corresponding assay kits (ProNet Biotech Co., Ltd., Nanjing, China) with 0.2 g of fresh sample per determination, where MDA content was measured via the thiobarbituric acid (TBA) colorimetric method at 532 nm and H2O2 content via the titanium sulfate method at 415 nm using a UV-2600 spectrophotometer (Shimadzu, Kyoto, Japan).

2.3. ABA Concentration Measurements

At the final harvest, the upper canopy fully expanded leaves were packed in aluminum foil, then stored at −80 °C for leaf ABA determination (µg·g−1 FW). The leaf ABA concentration was measured by enzyme-linked immunosorbent assay (ELISA) following the protocol of Asch [22].

2.4. Determination of Sugar Content, Titratable Acid Content, and Sugar Metabolism-Related Enzyme Activities

Fruits at three developmental stages from the second truss were sampled for sugar metabolism analysis: mature green (MG), breaker (BR), and red ripe (RR) stages. At each stage, 8 fruits per biological replication were collected. These 8 fruits were pooled into one composite sample to form a single biological replicate, thus reducing individual fruit variation. Soluble sugar content and titratable acid content were determined by high-performance liquid chromatography (HPLC) following the methods described by Yang et al. [23]. Soluble sugar content was analyzed by HPLC on a Metrosep Carb 1–150 column using 100 mM sodium hydroxide as eluent, while titratable acid content was determined on a Carbohydrate H+ column using 0.5 mM sulfuric acid and 10% acetone as eluent. Sugar metabolism-related enzymes, including soluble acid invertase (SAI), sucrose synthase (synthetic direction, SS-s), sucrose synthase (cleavage direction, SS-c), sucrose phosphate synthase (SPS), neutral invertase (NI), and amylase (Amy), were extracted according to the protocol of Wang and Zhang [24]: 0.2 g of fresh fruit tissue was homogenized in 2 mL of ice-cold extraction buffer (pH 7.5) containing 50 mmol·L−1 Tris-HCl, 10 mmol·L−1 MgCl2, and 1 mmol·L−1 EDTA, followed by centrifugation at 12,000× g for 15 min at 4 °C. The supernatant was used for enzyme activity assays, which were performed in three technical replicates using a UV-2600 spectrophotometer (Shimadzu, Kyoto, Japan) at specific wavelengths: 540 nm for SS-s, SS-c, and Amy, 595 nm for SPS, and 480 nm for SAI and NI. The mean value of technical replicates was used for subsequent statistical analysis to ensure measurement precision.

2.5. Determination of Sugar Metabolism-Related Gene Expression

Total RNA was extracted from the same fruit samples used for enzyme activity determination, using the Trizol reagent kit (ProNet Biotech Co., Ltd., Nanjing, China). Total RNA was digested with DNase I to eliminate genomic DNA contamination before reverse transcription. The concentration and purity of RNA were evaluated by a NanoDrop 2000 spectrophotometer (Thermo Fisher Scientific, Waltham, MA, USA) (A260/A280 ratio: 1.8–2.0) and 1.2% agarose gel electrophoresis, respectively. First-strand cDNA was synthesized from 1 μg of total RNA using the PrimeScript™ RT reagent kit (TaKaRa, Dalian, China) following the manufacturer’s instructions. Specific primers for target genes (sugar metabolism-related enzymes) were designed with Oligo 6.0 software based on their full-length sequences in the Solanum lycopersicum genome database (Table 1). Before formal qRT-PCR analysis, all primers were validated using serial dilutions of cDNA to confirm efficient and specific amplification suitable for the 2−ΔΔCq method. All qPCR assays were conducted with strict single-variable control. Except for cDNA templates, all reaction conditions remained unified to reduce deviations in amplification efficiency. Meanwhile, technical replicates showed minor Cq variation and high repeatability. All melting curves showed a single specific peak without non-specific amplification or primer dimers, indicating stable reaction performance and reliable quantification results. qRT-PCR was performed on a QuantReady K9600 instrument (Analytik Jena, Jena, Germany) using the TransStart Tip Green qPCR SuperMix kit (TransGen Biotech, Beijing, China), with a total reaction volume of 20 μL (10 μL of 2× SuperMix, 0.4 μL of each primer (10 μmol·L−1), 2 μL of cDNA template, and 7.2 μL of RNase-free water). The thermal cycling conditions were as follows: initial denaturation at 95 °C for 30 s, followed by 40 cycles of denaturation at 95 °C for 5 s and annealing/extension at 60 °C for 30 s, and a final melting curve analysis (65–95 °C) to verify primer specificity. The Actin gene (SlActin) was used as the reference gene for normalization, and relative gene expression levels were calculated using the above-mentioned 2−ΔΔCq method. Each sample was analyzed in three technical replicates (to assess measurement precision) and three biological replicates (to account for biological variation) to ensure data reliability. The gene primers used for qRT-PCR are listed in Table 1.

2.6. Statistical Analysis

All data were expressed as mean ± standard error of the mean (SEM). Prior to parametric analysis, the Shapiro–Wilk normality test was performed, and all data were confirmed to be normally distributed (p > 0.05). Two-way analysis of variance (ANOVA) was performed using GraphPad Prism 9.5 to examine differences in growth, physiological, and biochemical parameters. When significant interaction was detected between light intensity and ABA concentration, one-way ANOVA followed by an LSD test (p < 0.05) was used for pairwise comparisons. Pearson’s correlation analysis and principal component analysis (PCA) were conducted via Origin 2023 to determine index correlations and identify key indices driving treatment differences, respectively. For individual measurements, plant growth traits (height, diameter, biomass) and antioxidant physiological parameters (SOD, POD, CAT, MDA, H2O2) were determined with n = 8 biological replicates per treatment and stage, while fruit sugar content, sugar-metabolizing enzyme activities, and qRT-PCR-determined gene expression were analyzed with n = 3 biological replicates per treatment and stage. To comprehensively evaluate the overall treatment effects across the whole ripening period, data from three developmental stages (MG, BR, and RR) were integrated for unified correlation and PCA analyses, with a total of n = 9 biological replicates for all fruit-related indices. The PCA plot was generated using Origin 2023 (OriginLab Corporation, Northampton, MA, USA), while all other graphs were plotted using GraphPad Prism 9.5 (GraphPad Software, Inc., San Diego, CA, USA).

3. Results

The present study adopted a two-factor completely randomized experiment, including two light levels (normal light, NL; low light, LL) and three exogenous ABA concentrations (CK: 0 mg·L−1, T1: 10 mg·L−1, T2: 20 mg·L−1). Fruit samples were collected at three key developmental stages: mature green stage (MG), breaker stage (BR), and red ripe stage (RR), to systematically analyze the regulatory effects of ABA on cherry tomato under low-light stress.

3.1. Plant Growth Parameters

At the final harvest, plant height (PH) was significantly affected by Light and ABA, and plants grown under LL with CK treatment had higher PH than those of the other treatments. Moreover, there was an average of 10.1% increase in PH due to the low light without considering the ABA treatment (p < 0.001). Among the ABA treatments, T2 led to distinctly lower PH as compared to CK and T1 treatments (p < 0.001). The stem diameter (SD) was significantly affected by Light and Light × ABA, where SD in T1 supplied with LL was significantly lower than those in CK, T1, as well as T2 supplied with NL (p < 0.05), and LL notably reduced the SD compared to NL (p < 0.001). By contrast, leaf number (LN) was only significantly affected by Light, and plants grown under LL had an average of 7.8% lower LN than those grown under NL regardless of ABA regimes (Table 2).
Regarding internode length (IL), LL caused a notable increase in IL compared to NL (p < 0.01), and IL decreased with the increase in ABA application volume without considering the light condition. Both Light (p < 0.001) and ABA (p < 0.05) significantly affected leaf dry mass (LDM) and stem dry mass (SDM). Plants grown at NL had considerably greater LDM and SDM than those grown at LL, and the highest LDM and SDM both appeared significantly in the NL(CK) treatment (Table 2).
Collectively, low-light and ABA treatments showed distinct effects on cherry tomato growth parameters, with low light promoting etiolation-related traits and reducing biomass, while ABA application exhibited a concentration-dependent regulatory trend on these growth indicators.

3.2. Leaf ABA Content

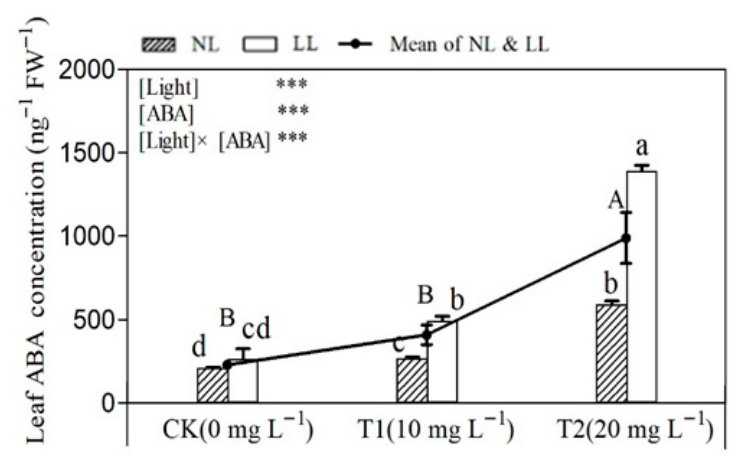
The leaf ABA concentration showed a significant increase under T2 treatment compared with the CK under both NL and LL environments. Specifically, the ABA concentration in NL + T2 and LL + T2 increased by 182.48% and 567.20% compared to NL(CK), respectively. Notably, plants grown under LL with T2 treatment had higher ABA concentration than any other treatments. Additionally, two-way ANOVA indicated that Light, ABA, and their interaction Light × ABA all had extremely significant effects on leaf ABA concentrations. The ABA concentration of plants in LL was 2.43 times that of plants in NL without considering the ABA treatment. Furthermore, excluding the light treatment, the variation in ABA concentration was primarily driven by ABA application gradients, and 76.85% and 327.34% increases were observed in T1 and T2 (across both light conditions), respectively, compared to CK (Figure 1).
Leaf ABA content exhibited a dose-dependent increase with exogenous ABA application, and the low-light environment further enhanced ABA accumulation, with the strongest response observed in the combination of LL and high ABA concentration.

3.3. Antioxidant Enzymes Activity, MDA, and H2O2 Content

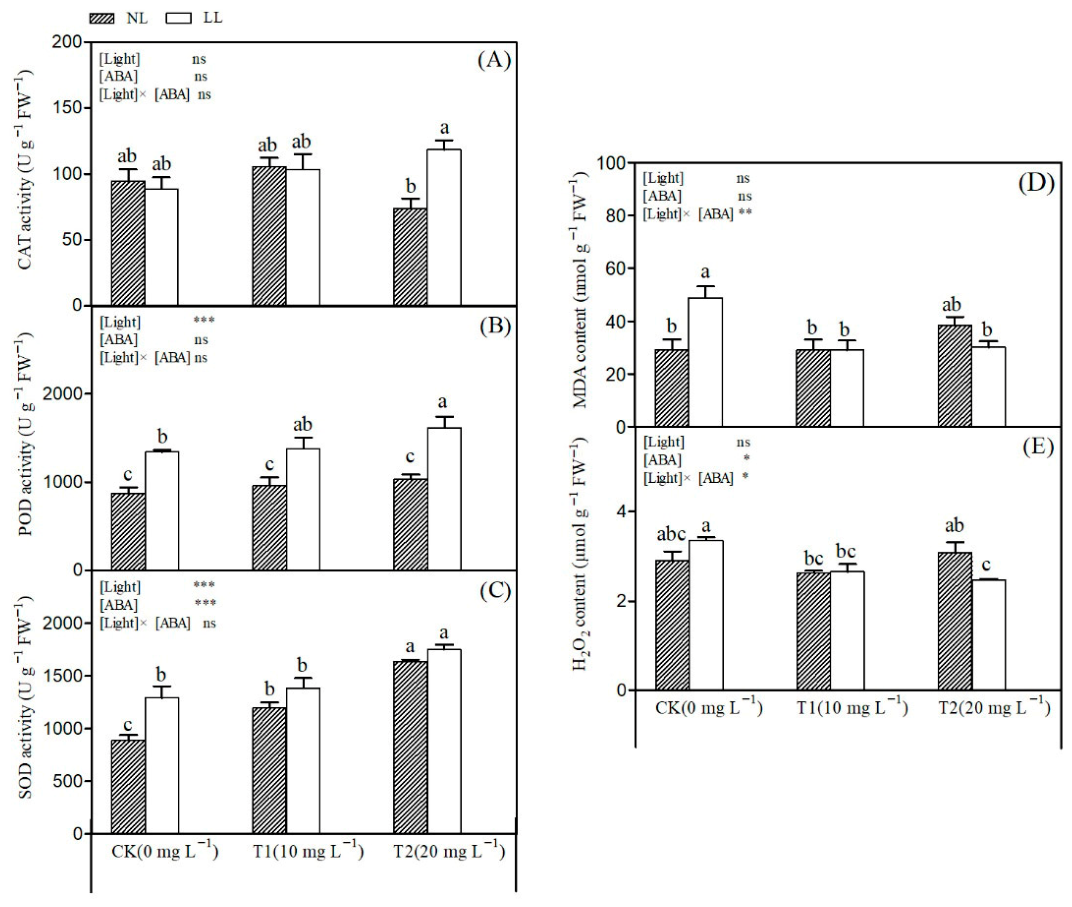
As shown in Figure 2A, Light, ABA, and Light × ABA had no significant effect on CAT activity. While leaf POD activity was significantly affected by light intensity (p < 0.001), that of cherry tomato across all treatments was markedly higher under LL conditions than under NL conditions. Among these treatments, the LL + T2 group exhibited the highest POD activity (Figure 2B). Furthermore, both Light and ABA affected the SOD activity, with the differences reaching a significant level (p < 0.001). Specifically, there was an average 19.20% increase in SOD activity when light intensity was reduced, regardless of ABA regimes. Additionally, SOD activity in NL + CK-treated plants was significantly lower than in other treatments. In addition, the interaction between Light and ABA significantly affected both MDA and H2O2 levels. Specifically, under LL, CK treatment led to higher MDA and H2O2 contents than T1 and T2 treatments (Figure 2D,E). Furthermore, a significant effect of ABA on leaf H2O2 content was observed; specifically, the application of ABA (T1 and T2 treatments) led to a notable reduction in H2O2 accumulation under LL (Figure 2E).
Low light significantly affected antioxidant enzyme activities and reactive oxygen species accumulation, while ABA application showed a regulatory effect on these indicators, with variations consistent with the differences observed among treatments.

3.4. Fruit Sugar Metabolism

The sugar metabolism of fruit was analyzed at fruit development stages, including mature green stage (MG), breaker stage (BR), and red ripe stage (RR). It is clear that glucose content (GluC) was notably affected by Light at MG (Table 3), and plants exposed to LL had greater GluC than those grown under NL among all treatments. While the GluC at BR and RR was only significantly influenced by Light × ABA, and GluC decreased significantly with increasing fruit maturity across all ABA and light treatments (p < 0.05).
Regarding fructose content (FruC), ABA, Light, and their interaction had a pronounced impact on FruC at MG, BR, and RR (p < 0.05). At MG, ABA-treated tomato fruits showed higher fructose content in LL + T1 and LL + T2 than those in NL + T1 and NL + T2, respectively (p < 0.05). At the BR stage, LL conditions resulted in significantly higher fructose content than NL conditions for the same ABA treatment; additionally, significantly higher FruC was recorded in fruits from T1 and T2 treatments compared with those under CK treatment under both NL and LL. Surprisingly, plants grown under NL with the CK treatment exhibited the highest FruC at the RR stage compared with those under all other treatments.
Regarding sucrose content (SucC), ABA, Light, and their interaction significantly affected SucC at MG and BR. In addition, plants exposed to T1 treatment under LL exhibited significantly higher SucC than those under NL at both MG and BR (p < 0.05). However, Light had no significant effect on SucC at RR. Notably, ABA application increased SucC in tomato fruit at RR under both NL and LL.
In addition, titratable acidity content (TAC) was also obviously affected by all factors at each fruit ripening stage (p < 0.05, Table 3). LL elevated TAC at both the BR and RR stages, while no such effect was observed at the MG stage. Under both NL and LL, the CK treatment resulted in significantly lower TAC in tomato fruit compared with T1 and T2 treatments at the BR and RR stages, with the highest TAC in the T2 treatment and the lowest in the CK treatment (p < 0.05). Moreover, TAC increased initially and then decreased during tomato fruit ripening, with significant differences among developmental stages; it peaked at BR, followed by the RR stage, and was the lowest at MG (p < 0.05).

3.5. Activities of Fruit Sugar Metabolism-Related Enzymes

Changes in the activities of enzymes concerned with sugar metabolism during the development of cherry tomatoes are illustrated in Table 4. The soluble acid invertase (SAI) activity was significantly affected by Light at BR and RR. In addition, individual ABA treatment and the Light × ABA interaction exerted stable and significant effects on SAI activity throughout all fruit developmental stages. Higher SAI activity was found in T2 as compared with CK and T1 among all treatments. The SAI activity was elevated with the progression of fruit maturity, with significant differences observed among the different treatment groups (p < 0.05).
Similarly, low light and exogenous ABA exerted independent and combined regulation on SS-s activity, with LL + T1 treatment showing markedly higher activity than other treatments at each fruit ripening stage. Furthermore, plants grown at RR had higher SS-s activity than those at MG and BR, irrespective of ABA and Light. Regarding the activity of sucrose cleavage direction (SS-c), Light only had a significant effect on fruit SS-c activity at BR. However, ABA and Light × ABA significantly influenced SS-c activity at each fruit development stage. SS-c activity, on average, rose progressively with fruit ripeness.
Sucrose phosphate synthase (SPS) activity was affected by Light, ABA, as well as Light × ABA, with significant differences (p < 0.001). Among them, light response showed obvious stage-specificity. Obviously, fruits exposed to LL had significantly higher SPS activity than those under NL at BR, whereas the opposite trend was observed at the RR stage. Furthermore, under LL, fruit SPS activity across all treatments changed significantly during ripening, with the highest value observed at BR, followed by MG, and the lowest at RR (p < 0.05).
Neutral invertase (NI) activity at MG was not affected by Light, while Light significantly influenced the NI activity both at BR and RR. Meanwhile, ABA and Light × ABA had obvious effects on NI activity in all fruit growth stages (p < 0.001). Light exhibited a stage-limited effect, while ABA and their interaction presented universal regulation on NI activity. With the exception of the LL + CK treatment, NI activity under all other treatments showed a clear stage-dependent pattern during fruit development, peaking at BR, followed by MG, and declining to the lowest level at RR (p < 0.05). In addition, Light, ABA, and their interaction all significantly regulated amylase (Amy) activity (p < 0.001). Meanwhile, under T1 and T2 treatments, LL increased Amy activity. The combination of LL and T2 resulted in significantly higher Amy activity than the other treatments at BR and RR (p < 0.05). Moreover, fruit Amy activity at RR was higher than at MG and BR.

3.6. Expression Levels of Sugar Metabolism-Related Genes

The results of the ANOVA for the expression levels of sugar metabolism-related genes in different fruit developmental stages are presented in Table 5.
At the MG stage, Light significantly affected the expression of PK1, SPS, SS, AI, NI, α-Amy, and β-Amy. NL upregulated PK1 expression in the CK treatment, while T1 application under NL upregulated SPS, SS, and AI expression, but downregulated NI and α-Amy expression. Exogenous ABA showed a widespread regulatory effect on most sugar metabolism-related genes at the MG stage, except for FBP. T2 downregulated the PK1 and SS expression, but upregulated α-Amy in both NL and LL conditions. Moreover, Light × ABA interaction also exerted obvious regulatory effects on the expression of PK1, HXK1, HXK2, PEPCK, SPS, SS, and NI at the MG stage.
At the BR stage, Light, ABA, and their interaction significantly regulated the expression of PK1, PK2, HXK2, PEPCK, SPS, SS, AI, NI, and β-Amy. Under NL, CK upregulated the expression of HXK2 and SPS; under LL, CK promoted the expression of HXK2, PEPCK, and NI. T2 inhibited PK1 and HXK1 expression in both NL and LL conditions, and downregulated FBP, SS, and NI expression under LL.
At the RR stage, Light, ABA, and their interaction significantly influenced PK1, HXK1, FBP, PEPCK, SS, AI, NI, α-Amy, and β-Amy expression. Under NL, CK upregulated HXK1, SPS, and α-Amy, but downregulated PEPCK expression; T2 upregulated the expression of PK2, SS, AI, NI, α-Amy, and β-Amy. Under LL, T2 showed opposite effects on SS and AI expression, while CK downregulated PK1 and FBP expression.
Moreover, gene expression presented regular changes along with fruit ripening. The transcription of PK1 and PK2 increased obviously at the RR stage, while most structural and metabolism-related genes were downregulated from the MG stage to later ripening stages. In contrast, genes related to sugar transformation and accumulation were upregulated during fruit development, and NI expression reached the highest level at the BR stage (Table 6).
Overall, these gene responses exhibited clear biological regularity: light exerted stage-specific regulation, while ABA further modified gene expression patterns under different light environments. Such coordinated changes at the transcriptional level were generally consistent with the variation in corresponding enzyme activities.

3.7. Relations Between Sugar Content, Sugar Metabolism-Related Enzymes, and Corresponding Gene Expression

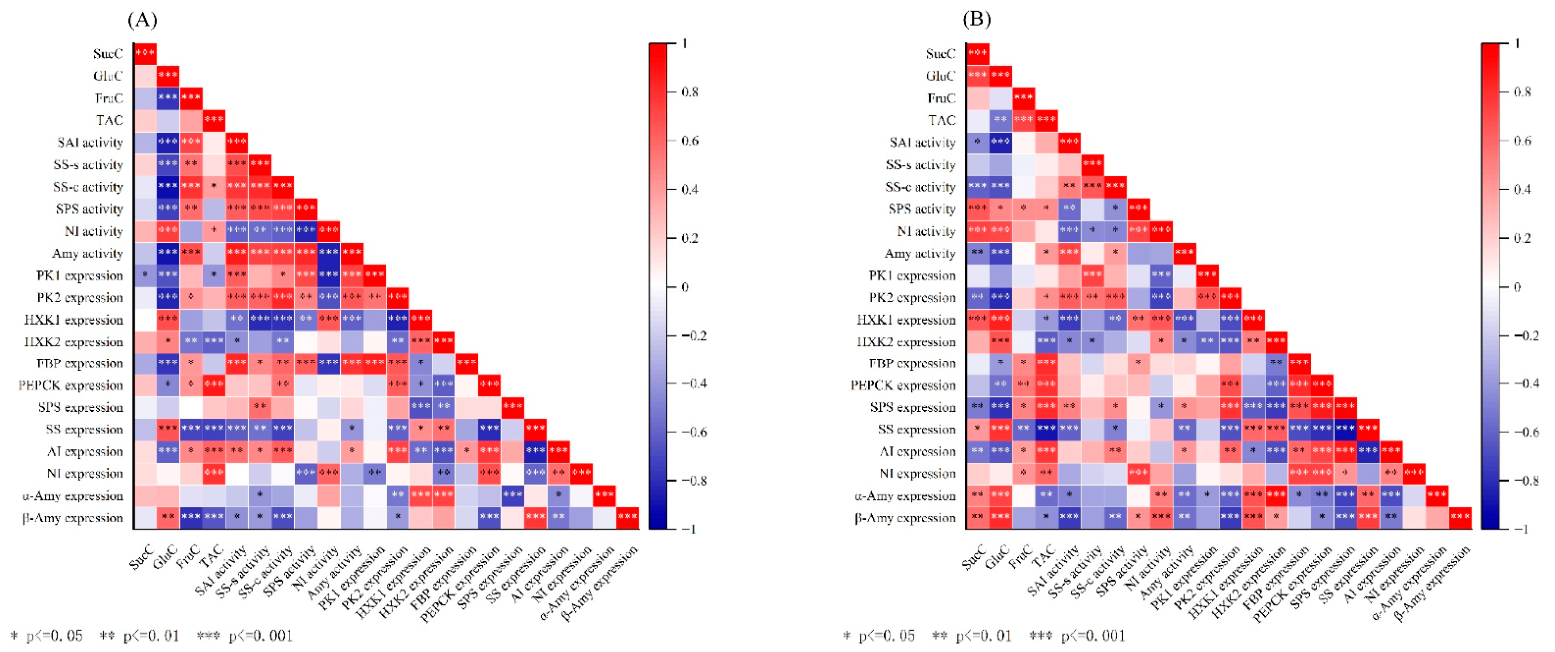
Correlation analysis revealed distinct relationships among sugar content, key metabolic enzyme activities, and related gene expression under NL and LL environments (Figure 3). Under NL (Figure 3A), SucC was negatively correlated with PK1 expression, while no such correlation was detected under LL (Figure 3B); instead, SucC was positively associated with SPS and NI activities, together with the transcript levels of HXK1, α-Amy, and β-Amy (Figure 3B). Across both light regimes, GluC presented consistent negative correlations with PK2, PEPCK, and AI, and a positive correlation with NI activity. In addition, the significant negative correlation between GluC and TAC and the positive correlation between GluC and α-Amy were only observed under LL (Figure 3B), whereas these correlations were absent under NL (Figure 3A). FruC was closely positively correlated with SAI, SS-s, SS-c, SPS, and Amy activities under NL (Figure 3A), and was mainly correlated with SPS, NI activity, and the expression levels of FBP, PEPCK, SPS, AI, and NI under LL (Figure 3B). Similarly, TAC exhibited differentiated correlation patterns with enzyme activities and gene expression in two light environments. Overall, the correlation networks governing sugar accumulation and metabolic regulation differed markedly with light intensity, and ABA application further reshaped these correlation characteristics in a light-dependent manner.

3.8. PCA of Fruit Sugar Metabolism Attributes

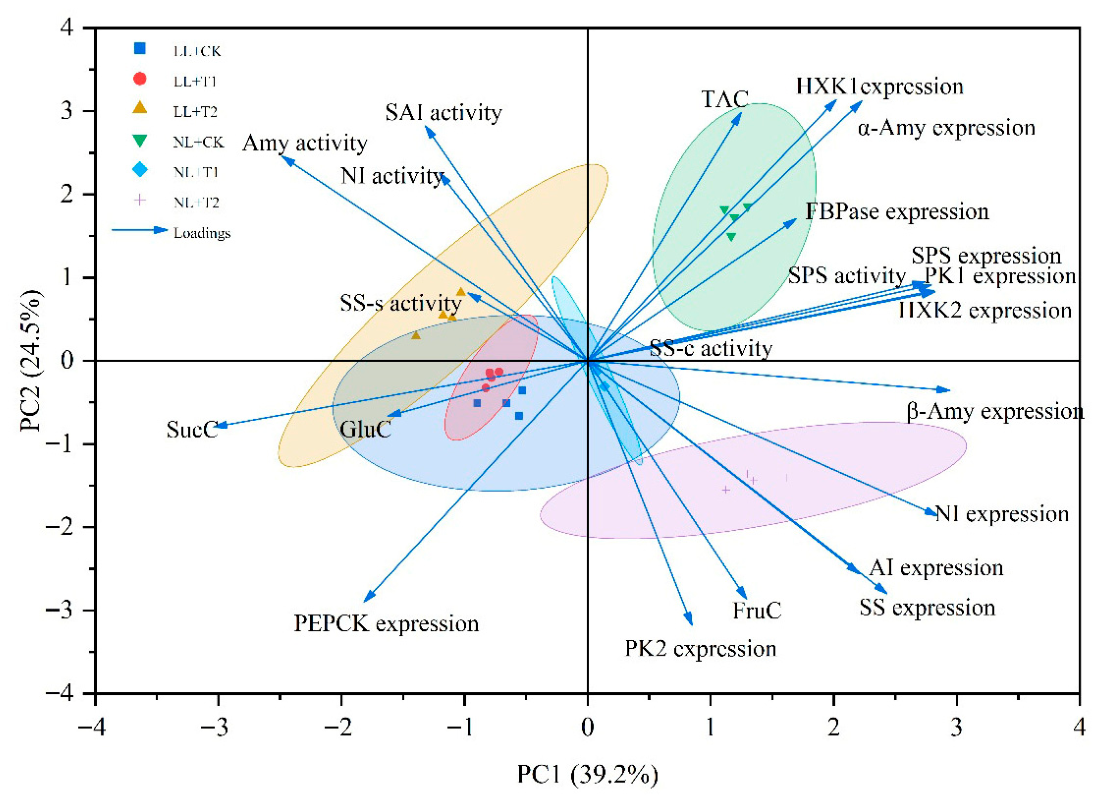
PCA plots of cherry tomato fruit attributes (including sugar contents, TAC, enzyme activities, and gene expression levels) are illustrated in Figure 4. PC1 and PC2 explained 39.2% and 24.5% of the total variation, respectively, with a cumulative contribution rate of 63.7%, indicating that these two principal components basically reflected the main phenotypic variation. A clear separation between normal light (NL) and low-light (LL) treatments was observed along PC1: all LL treatments (LL + CK, LL + T1, LL + T2) clustered on the negative side of PC1, while all NL treatments (NL + CK, NL + T1, NL + T2) clustered on the positive side of PC1, suggesting that light conditions exerted dominant statistical influence on fruit trait differentiation; specifically, the positive direction of PC1 was associated with TAC, FruC, and the expression of core sugar metabolism genes (PK1, HXK1, HXK2, SPS, FBP, α-Amy), which were enriched in NL treatments, whereas the negative direction of PC1 was associated with SucC, GluC, and PEPCK expression, which were enriched in LL treatments. Along PC2, the treatments were further differentiated by ABA effects: the positive direction of PC2 was associated with the activities of SAI, SS-s, NI, and Amy, which were clustered with the LL + T2 treatment, suggesting potential statistical associations between high-concentration ABA and these enzyme activities under low-light conditions, while the negative direction of PC2 was associated with FruC and the expression of AI, NI, SS, PK2, β-Amy, which were clustered with the NL + T2 treatment, indicating potential links between ABA application and fructose-related gene expression under normal light conditions; overall, the PCA plot reveals two distinct regulatory patterns, where fruits under LL exhibited higher levels of SucC, GluC, and PEPCK expression along with elevated SAI, SS-s, NI, and Amy activities (reflecting a stress-responsive sugar accumulation strategy), while those under NL displayed higher TAC, FruC, and most sugar metabolism gene expression levels (reflecting a more active sugar acid metabolism network).
Light intensity acted as the primary driving factor for the separation of fruit metabolic traits, while ABA application further differentiated sample distribution under identical light conditions. The relatively low cumulative explanatory rate of PC1 and PC2 indicated that partial physiological information could not be fully interpreted by the two principal components. Moreover, the sample separation in PCA reflected only statistical differences in multiple indicators, rather than direct causal relationships between sugar metabolism traits, enzyme activities, and gene expression.


4. Discussion

Light is a fundamental environmental factor governing plant growth and development, including morphogenesis, yield formation, and quality establishment. Meanwhile, abscisic acid (ABA), a key plant hormone and growth regulator, plays a vital role in plant growth and stress responses, exerting profound effects on mediating abiotic stress tolerance and improving plant adaptability to adverse environments. The present study systematically investigated the regulatory effects of exogenous ABA on vegetative growth, antioxidant capacity, and fruit sugar metabolism in cherry tomato under LL stress, and identified the appropriate ABA concentration to mitigate LL-induced injuries, to provide a theoretical and technical foundation for cherry tomato production in protected cultivation under low-light conditions.

4.1. Effects of Exogenous ABA on Plant Growth Parameters Under LL

Light is the most critical factor affecting dry matter accumulation and plant architecture in cherry tomato [25,26]. In the present study, LL stress triggered typical shade-avoidance responses, including increased PH and reduced SD (Table 2), which is consistent with previous reports on tomato seedlings under light-limited conditions [26]. This morphological adaptation is a common shade-avoidance strategy in tomato, whereby plants prioritize vertical growth to capture limited light resources [27]. Meanwhile, LL-induced morphological changes may be related to altered cell wall modification and hormone signaling balance, while the specific role of auxin (not measured in this study) remains speculative [6,28].
In this study, exogenous ABA effectively relieved the excessive elongation of tomato seedlings caused by low light, but its regulatory effect showed obvious concentration dependence and varied across different morphological indicators. These results agreed with previous reports [29], showing that exogenous ABA could inhibit auxin-induced cell elongation by suppressing the expression of cell expansion-related genes [30] and reallocate photosynthate to support radial growth rather than vertical elongation under shade conditions [31]. Moreover, ABA application did not fully reverse LL-induced reduction in LN, even at higher concentrations. This could be hypothesized to be associated with potential crosstalk with cytokinin, as ABA has been reported to antagonize cytokinin-induced meristem proliferation in tomato [32,33]. The non-significant Light × ABA interaction for PH demonstrated that ABA’s dwarfing effect on stem elongation remained stable across light conditions. In contrast, the significant interaction for SD (Table 2) suggests that ABA’s promotion of radial growth is context-dependent, with stronger effects observed under NL conditions. These findings highlight that ABA’s regulatory role in plant architecture is not uniformly positive, but rather modulated by its crosstalk with other hormones and the prevailing light environment.

4.2. Effects of Exogenous ABA on Plant Antioxidant Enzyme Activities, MDA, and H2O2 Content Under LL

LL triggers oxidative stress in plants by perturbing the equilibrium between ROS generation and scavenging processes. Consistent with established plant responses to light limitation, LL stress activates the antioxidant defense system to counteract excessive ROS accumulation [8]. SOD and POD, as key ROS-scavenging enzymes in tomato, coordinate to eliminate excess ROS and mitigate oxidative damage [5,6,34], which is consistent with their induction under LL stress observed in this study. In contrast, CAT activity remained unaffected by LL stress alone, and no evidence was found that Light, ABA, or their interaction affected CAT activity (Figure 2A). This difference may stem from subcellular localization: CAT acts mainly in peroxisomes, while SOD and POD are more active in chloroplasts and cytoplasm [35,36]. These results indicate that cherry tomatoes primarily rely on chloroplastic and cytosolic POD/SOD pathways, rather than peroxisomal CAT, to scavenge LL-induced ROS and mitigate oxidative damage.
Under LL, ABA further improved the antioxidant system. As a key stress signal molecule, ABA further upregulated the antioxidant defense system under LL, particularly enhancing SOD activity, which is consistent with its known function in promoting antioxidant enzyme gene expression [34]. The increased SOD activity strengthened superoxide scavenging and reduced oxidative damage [37,38]. Meanwhile, T1/T2 treatments significantly reduced H2O2 levels under LL conditions compared to the LL + CK group (Figure 2E). The enhanced SOD activity, coupled with reduced H2O2 levels in T1/T2 treatments (Figure 2E), suggests that ABA strengthens superoxide scavenging and alleviates oxidative stress, which aligns with reports that ABA maintains ROS homeostasis in tomato under stress [37,39], supporting that H2O2 acts as both a toxic product and a signal molecule [40,41]. Collectively, these findings confirm ABA’s multifaceted function in maintaining redox balance under LL stress by modulating the antioxidant defense system. However, it is important to note that ABA’s regulatory effect was not uniform across all indicators. The non-significant effect on CAT activity and context-dependent reduction in MDA suggest that ABA’s role in maintaining ROS homeostasis is trait-specific, modulated via the subcellular localization of enzymes and the prevailing light environment [34,37].

4.3. Effects of Exogenous ABA on Sugar Metabolism, Related Enzyme Activities, and Related Gene Expressions in Fruits Under LL

Under low-light (LL) conditions, cherry tomato fruits exhibited a stage-dependent reprogramming of sugar and organic acid metabolism (Table 3 and Table 4), a phenomenon well documented in tomato and other fleshy fruits [10,42]. In tomato, fruit metabolic responses to light stress are closely tied to developmental stage and sink–source carbon allocation, with LL-induced changes in sugar profiles likely mediated by altered activities of key sugar-metabolizing enzymes [42,43,44], which are critical for regulating sucrose metabolism and starch turnover in fruit. Similarly, the changes in TAC are consistent with reports that LL delays organic acid catabolism and maintains higher acid levels during ripening (Table 3) [10,45].
Furthermore, exogenous ABA regulated sugar metabolism under LL by affecting key enzyme activities and gene expression. Under LL, acid SAI activity was enhanced, and ABA application further upregulated this enzyme. This ABA-mediated promotion of vacuolar sucrose hydrolysis likely facilitates the accumulation of GluC and fructose FruC in fruit tissues, which is consistent with the role of ABA in regulating sugar transport and accumulation in tomato [13,46]. For SS, which functions in both SS-s and SS-c, LL enhanced SS-s activity at MG and RR, and T1 further promoted SS-s activity (Table 4). This suggests that ABA participates in modulating sucrose metabolic characteristics under low-light conditions, which may help maintain carbohydrate homeostasis in fruit tissues when source leaf photosynthate supply is restricted [12,13]. With regard to SPS, LL increased SPS activity at MG and BR, and ABA further modulated this activity (Table 4). A significant Light × ABA interaction for SPS activity indicated that ABA’s regulation of sucrose synthesis was light-dependent. Specifically, under LL, ABA upregulated SPS to partially offset declines in photosynthetic sucrose production, whereas this effect is minimal under NL (Table 4). This aligns with studies showing that ABA promotes sugar accumulation in tomato fruits by transcriptionally regulating key metabolic genes [13,47]. Furthermore, the observed increase in Amy activity under LL and high ABA (Table 4) suggests that ABA promotes the degradation of transient starch reserves. This remobilization of stored carbohydrates may provide an alternative carbon source for soluble sugar accumulation, helping maintain sink strength and fruit quality in tomato under light-limited conditions [12,48].
Notably, the expression of sugar metabolism genes was largely consistent with enzyme activities, though responses were dependent on the specific gene, developmental stage, and treatment. At the transcriptional level, the expression of key sugar metabolism genes closely mirrored the observed enzyme activity changes (Table 5). For instance, under LL, the expression of SPS and SS showed stage- and treatment-specific responses: SPS was significantly upregulated at MG, while SS induction varied with both stage and ABA concentration at BR (Table 5), which aligns with the changes in the activities of encoded enzymes [43,44]. Similarly, the expression of AI was upregulated, consistent with the increased SAI activity, reinforcing that ABA acts at the transcriptional level to modulate sucrose catabolism [47,48]. Moreover, the expression of HXK1 and HXK2 was significantly modulated by the Light × ABA (Table 5). Under LL, ABA did not exert a consistent inductive effect, and the changes were stage- and concentration-dependent, with induction, inhibition, or no obvious variation across treatments. These complex and non-linear expression patterns indicate that ABA mediated the fine regulation of sugar signaling under low-light conditions, in accordance with the universal ABA responsiveness of tomato HXK family genes involved in sugar signaling [49]. Meanwhile, ABA-dependent transcription factors have been reported to modulate the transcription of sugar metabolic genes in tomato fruit, which could be a potential regulatory pathway to be explored in future studies [20].
Subsequently, correlation analysis further validated the coordinated relationships between sugar content, enzyme activities, and gene expression (Figure 3). Under LL, correlation analysis revealed that sucrose accumulation was positively correlated with SPS, NI activities, and HXK1, SS, and α-Amy expression, while glucose accumulation was negatively correlated with AI, SS-c, and Amy activities—suggesting that sucrose and starch hydrolysis pathways may regulate glucose accumulation during tomato fruit ripening [11,12,50]. Fructose accumulation was positively correlated with NI activity and FBP, PEPCK, and SPS expression, indicating that ABA may promote stage-specific fructose accumulation by regulating these components [45].
PCA revealed a partial separation in fruit sugar metabolic characteristics across different light and ABA treatments (Figure 4). LL samples tended to cluster separately, associated with distinct soluble sugar levels and metabolic enzyme activities, while NL groups showed higher titratable acidity and variable gene expression patterns. In general, light regime and exogenous ABA application may partially reshape fruit sugar metabolism characteristics, which is in line with the regulatory role of ABA in modulating carbon metabolism and fruit quality in tomato [18].
Nevertheless, this study has some limitations. First, the experiment was performed under controlled hydroponic greenhouse conditions using a single cherry tomato cultivar and only three ABA concentrations. The observed regulatory patterns may not fully reflect the long-term effects of ABA on low-light tolerance under variable commercial greenhouse conditions. Furthermore, the proposed molecular mechanisms remain to be functionally validated. Future multi-cultivar trials, expanded dose screening, and functional studies are needed to optimize ABA application strategies for commercial production.

5. Conclusions

This study revealed that exogenous abscisic acid (ABA) alleviated low-light stress damage and modulated vegetative growth, antioxidant homeostasis, and fruit sugar metabolic responses under controlled low-light conditions. Specifically, ABA application inhibited LL-induced excessive stem elongation and alleviated oxidative damage by increasing peroxidase (POD) activity and decreasing the accumulation of malondialdehyde (MDA) and hydrogen peroxide (H2O2). Furthermore, ABA differentially modulated fruit sugar metabolism in a development-stage-specific manner by regulating the activities of key metabolic enzymes, including soluble acid invertase (SAI), sucrose synthase (SS), sucrose phosphate synthase (SPS), and amylase (Amy), as well as the transcript levels of critical genes such as HXK1. ABA exhibited more prominent regulatory effects on sugar accumulation, key enzyme activities, and related gene expression at the BR stage, while such responses were relatively weaker at the MG stage, showing obvious developmental stage-dependent characteristics. Among all treatments, the 20 mg·L−1 (T2) application exhibited relatively favorable regulatory effects within the tested concentration range under the present experimental conditions. However, these regulatory effects are condition-specific and demand additional validation across diverse cultivars and protected environments.

Author Contributions

X.Y.: Conceptualization, Methodology, Writing—Original Draft, Supervision, Funding Acquisition, Project Administration. J.N.: Investigation, Data Curation, Data Interpretation, Formal Analysis. Y.Y.: Data Curation, Validation, Visualization, Literature Search. Y.X.: Data Curation, Formal Analysis, Validation, Figures. L.S.: Investigation, Data Collection, Data Curation, Literature Search. Y.L.: Data Curation, Writing—Review and Editing. All authors have read and agreed to the published version of the manuscript.

Funding

This work was partly supported by the Guangdong Basic and Applied Basic Research Foundation (2023A1515110552), the National Natural Science Foundation of China (32573116), the Youth S&T Talent Support Programme of Guangdong Provincial Association for Science and Technology (SKXRC2025520), and the Guangdong Academy of Agricultural Sciences Special Funds Program for the Introduction of Scientific and Technological Talents (R2022YJ-YB3003).

Data Availability Statement

The original contributions presented in this study are included in the article. Further inquiries can be directed to the corresponding author.

Acknowledgments

Authors thank the research team for their assistance with the experiments and data management, as well as the editors and reviewers for their helpful comments.

Conflicts of Interest

The authors declare no conflict of interest.

Nomenclature

Symbols
PHPlant height (cm)
SDStem diameter (mm)
LNLeaf number (#)
ILInternode length (cm)
LDMLeaf dry mass (g·plant−1)
SDMStem dry mass (g·plant−1)
ABAAbscisic acid
LLLow light
NLNormal light
CKControl (0 mg·L−1)
Abbreviations
T1ABA treatment (10 mg·L−1)
T2ABA treatment (20 mg·L−1)
ROSReactive oxygen species
MDAMalondialdehyde
H2O2Hydrogen peroxide
PODPeroxidase
SODSuperoxide dismutase
CATCatalase
SAISoluble acid invertase
SSSucrose synthase
SS-sSucrose synthase
SS-cSucrose synthase
SPSSucrose phosphate synthase
NINeutral invertase
AmyAmylase
α-Amyα-Amylase
β-Amyβ-Amylase
HXKHexokinase
PKPyruvate kinase
FBPFructose-1,6-bisphosphatase
PEPCKPhosphoenolpyruvate carboxykinase
AREBABA-responsive element binding protein
APXAscorbate peroxidase
PARPhotosynthetically active radiation
MGMature green stage
BRBreaker stage
RRRed ripe stage
ELISAEnzyme-linked immunosorbent assay
HPLCHigh-performance liquid chromatography
RNARibonucleic acid
cDNAComplementary deoxyribonucleic acid
qRT-PCRQuantitative real-time polymerase chain reaction
ANOVAAnalysis of variance
LSDLeast significant difference
PCAPrincipal component analysis
SEMStandard error of the mean

References

  1. Raffo, A.; Leonardi, C.; Fogliano, V.; Ambrosino, P.; Salucci, M.; Gennaro, L.; Bugianesi, R.; Giuffrida, F.; Quaglia, G. Nutritional value of cherry tomatoes (Lycopersicon esculentum Cv. Naomi F1) harvested at different ripening stages. J. Agric. Food Chem. 2002, 50, 6550–6556. [Google Scholar] [CrossRef] [Scilit]
  2. Taiz, L.; Zeiger, E. Plant Physiology, 5th ed.; Sinauer Associates: Sunderland, MA, USA, 2010. [Google Scholar]
  3. Yang, Y.; Dong, L.; Shi, L.; Guo, J.; Jiao, Y.; Xiong, H. Effects of low temperature and low light on physiology of tomato seedlings. Am. J. Plant Sci. 2020, 11, 162–179. [Google Scholar] [CrossRef]
  4. Meng, Z.; Lu, T.; Zhang, G.; Qi, M.; Tang, W.; Li, L.; Liu, Y.; Li, T. Photosystem inhibition and protection in tomato leaves under low light. Sci. Hortic. 2017, 217, 145–155. [Google Scholar] [CrossRef] [Scilit]
  5. Zhu, H.; Li, X.; Zhai, W.; Liu, Y.; Gao, Q.; Liu, J.; Ren, L.; Chen, H.; Zhu, Y. Effects of low light on photosynthetic properties, antioxidant enzyme activity, and anthocyanin accumulation in purple pak-choi (Brassica campestris ssp. Chinensis Makino). PLoS ONE 2017, 12, e0179305. [Google Scholar] [CrossRef] [Scilit]
  6. Lu, T.; Yu, H.; Li, Q.; Chai, L.; Jiang, W. Improving Plant growth and alleviating photosynthetic inhibition and oxidative stress from low-light stress with exogenous GR24 in tomato (Solanum lycopersicum L.) seedlings. Front. Plant Sci. 2019, 10, 490. [Google Scholar] [CrossRef] [Scilit]
  7. Velitchkova, M.; Stefanov, M.; Popova, A.V. Effect of low light on photosynthetic performance of tomato plants—Ailsa craig and carotenoid mutant tangerine. Plants 2023, 12, 3000. [Google Scholar] [CrossRef] [Scilit] [PubMed]
  8. Luo, Q.; Wang, J.; Wang, P.; Liang, X.; Li, J.; Wu, C.; Fang, H.; Ding, S.; Shao, S.; Shi, K. Transcriptomic and genetic approaches reveal that low-light-induced disease susceptibility is related to cellular oxidative stress in tomato. Hortic. Res. 2023, 10, uhad173. [Google Scholar] [CrossRef] [Scilit] [PubMed]
  9. Xu, P.; Guo, Y.; Bai, J.; Shang, L.; Wang, X. Effects of long-term chilling on ultrastructure and antioxidant activity in leaves of two cucumber cultivars under low light. Physiol. Plant. 2008, 132, 467–478. [Google Scholar] [CrossRef] [Scilit]
  10. Tan, R.; Jia, T.; Chen, X.L.; Guo, W.Z. Low light during reproductive period of tomato affects the phenotypic characteristics and quality of fruit. Chin. J. Agrometeorol. 2022, 43, 902–911. [Google Scholar]
  11. Du, M.; Zhu, Y.; Nan, H.; Zhou, Y.; Pan, X. Regulation of sugar metabolism in fruits. Sci. Hortic. 2024, 326, 112712. [Google Scholar] [CrossRef] [Scilit]
  12. Ruan, Y.L. Sucrose metabolism: Gateway to diverse carbon use and sugar signaling. Annu. Rev. Plant Biol. 2014, 65, 33–67. [Google Scholar] [CrossRef] [Scilit]
  13. Xing, H.Y.; Yu, Y.; Zhang, X.K.; Zhang, Y.; Wang, T.T.; Zhang, Y.J.; Cui, N. Effect of exogenous abscisic acid on sugar metabolism in tomato fruits. Br. Biotechnol. J. 2021, 25, 1–7. [Google Scholar] [CrossRef] [Scilit]
  14. Wang, J.; Li, X.; Li, J.; Dong, H.; Hu, Z.; Xia, X. Manipulating the light systemic signal HY5 greatly improve fruit quality in tomato. Adv. Sci. 2025, 12, 2500110. [Google Scholar] [CrossRef] [Scilit] [PubMed]
  15. Wang, Y.; Ren, S.; Li, X.; Luo, X.; Deng, Q. Shading inhibits sugar accumulation in leaf and fruit of jujube (Ziziphus jujuba Mill.). Horticulturae 2022, 8, 592. [Google Scholar] [CrossRef] [Scilit]
  16. Fahad, K.; Reem, A. Exogenous Abscisic Acid (ABA) Enhanced drought tolerance by regulating morpho physiological attributes, osmotic adjustments, antioxidants, and ABA related genes in tomato. J. Plant Growth Regul. 2026, 45, 741–751. [Google Scholar] [CrossRef] [Scilit]
  17. Gao, W.; Yin, D.; Han, Z. Effects of ABA on Physiological Characteristics of Tomato under Waterlogging. E3S Web Conf. 2020, 189, 02007. [Google Scholar] [CrossRef] [Scilit]
  18. Bastías, A.; López-Climent, M.; Valcárcel, M.; Rosello, S.; Gómez-Cadenas, A.; Casaretto, J.A. Modulation of organic acids and sugar content in tomato fruits by an abscisic acid-regulated transcription factor. Physiol. Plant 2011, 141, 215–226. [Google Scholar] [CrossRef] [Scilit]
  19. Kaur, L.; Gupta, A.K.; Zhawar, V.K. ABA improvement of antioxidant metabolism under water stress in two wheat cultivars contrasting in drought tolerance. Ind. J. Plant Physiol. 2014, 19, 189–196. [Google Scholar] [CrossRef] [Scilit]
  20. Bastías, A.; Yañez, M.; Osorio, S.; Arbona, V.; Gómez-Cadenas, A.; Fernie, A.R.; Casaretto, J.A. The transcription factor AREB1 regulates primary metabolic pathways in tomato fruits. J. Exp. Bot. 2014, 65, 2351–2363. [Google Scholar] [CrossRef] [Scilit]
  21. Li, Y.; Zhang, X.; Wang, J.; Liu, H. Identification of the functional modules of SlPP2C.D—SlSAUR and their roles in abscisic acid-mediated inhibition of tomato hypocotyl elongation. Int. J. Mol. Sci. 2023, 14, 2542. [Google Scholar] [CrossRef] [Scilit]
  22. Asch, F. Determination of Abscisic Acid by Indirect Enzyme Linked Immuno Sorbent Assay (ELISA); Technical report; Laboratory for Agrohydrology and Bioclimatology, Department of Agricultural Sciences, The Royal Veterinary and Agricultural University: Taastrup, Denmark, 2000; p. 21. [Google Scholar]
  23. Yang, X.; Bornø, M.L.; Wei, Z.; Liu, F. Combined effect of partial root drying and elevated atmospheric CO2 on the physiology and fruit quality of two genotypes of tomato plants with contrasting endogenous ABA levels. Agric. Water Manag. 2021, 254, 106987. [Google Scholar] [CrossRef] [Scilit]
  24. Wang, Y.Z.; Zhang, D.P. Ethylene regulation of carbohydrate metabolism during fruit development of ‘Starkrimson’ apple. Acta Hortic. Sin. 2000, 27, 391–395. [Google Scholar]
  25. Wang, Y.C.; Deng, H.; Li, H.; Ma, L.; He, T.; Yao, Z.; Mu, Z.; Gu, S.; Mu, Y. Growing Tomato Seedlings Suitable for Mechanical Grafting under Regulated Light Regime. Agronomy 2024, 14, 2322. [Google Scholar] [CrossRef] [Scilit]
  26. Fan, X.X.; Xu, Z.G.; Liu, X.Y.; Tang, C.M.; Wang, L.W.; Han, X.L. Effects of light intensity on the growth and leaf development of young tomato plants grown under a combination of red and blue light. Sci. Hortic. 2013, 153, 50–55. [Google Scholar] [CrossRef] [Scilit]
  27. Schrager-Lavelle, A.; Herrera, L.A.; Maloof, J.N. Tomato phyE Is Required for Shade Avoidance in the Absence of phyB1 and phyB2. Front. Plant Sci. 2016, 7, 1275. [Google Scholar] [CrossRef] [Scilit]
  28. Wu, L.; Zhang, W.; Ding, Y.; Zhang, J. Shading Contributes to the Reduction of Stem Mechanical Strength by Decreasing Cell Wall Synthesis in Japonica Rice (Oryza sativa L.). Front. Plant Sci. 2017, 8, 881. [Google Scholar] [CrossRef] [Scilit]
  29. Agehara, S.; Leskovar, D.I. Growth suppression by exogenous abscisic acid and uniconazole for prolonged marketability of bell pepper transplants in commercial conditions. Sci. Hortic. 2015, 194, 118–125. [Google Scholar] [CrossRef] [Scilit]
  30. Lu, C.; Chen, M.X.; Liu, R.; Zhang, L.; Hou, X.; Liu, S.; Ding, X.; Jiang, Y.; Xu, J.; Zhang, J.; et al. Abscisic acid regulates auxin distribution to mediate maize lateral root development under salt stress. Front. Plant Sci. 2019, 10, 716. [Google Scholar] [CrossRef] [Scilit]
  31. Emenecker, R.J.; Cammarata, J.; Yuan, I.; Howard, C.; Naghani, S.E.; Robert, H.S.; Nambara, E.; Strader, L.C. Abscisic acid biosynthesis is necessary for full auxin effects on hypocotyl elongation. Development 2023, 150, 202106. [Google Scholar] [CrossRef] [Scilit]
  32. Takatsuka, H.; Umeda, M. ABA inhibits root cell elongation through repressing the cytokinin signaling. Plant Signal. Behav. 2019, 14, 1578632. [Google Scholar] [CrossRef] [Scilit] [PubMed]
  33. Humplík, J.F.; Turečková, V.; Fellner, M.; Bergougnoux, V. Spatio-temporal changes in endogenous abscisic acid contents during etiolated growth and photomorphogenesis in tomato seedlings. Plant Signal. Behav. 2015, 10, e1039213. [Google Scholar] [CrossRef] [Scilit]
  34. Guo, W.L.; Chen, R.G.; Gong, Z.H.; Yin, Y.X.; Ahmed, S.S.; He, Y.M. Exogenous abscisic acid increases an-tioxidant enzymes and related gene expression in pepper (Capsicum annuum) leaves subjected to chilling stress. Genet. Mol. Res. 2012, 11, 4063–4080. [Google Scholar] [CrossRef] [Scilit] [PubMed]
  35. Gill, S.S.; Tuteja, N. Reactive oxygen species and antioxidant machinery in abiotic stress tolerance in crop plants. Plant Physiol. Biochem. 2010, 48, 909–930. [Google Scholar] [CrossRef] [Scilit]
  36. Popova, A.V.; Stefanov, M.; Mihailova, G.; Borisova, P.; Georgieva, K. Response of Tomato Plants, Ailsa Craig and Carotenoid Mutant tangerine, to Simultaneous Treatment by Low Light and Low Temperature. Plants 2024, 13, 1929. [Google Scholar] [CrossRef] [Scilit]
  37. Deng, S.; Xing, P.; Peng, L.; Lu, J.; Wu, Y.; Zhang, Y.; He, Z.; Yao, X.; Liu, Y.; Tang, X. Exogenous application of abscisic acid enhanced 2-acetyl-1-pyrroline biosynthesis, accumulation, and antioxidant activities in aromatic rice. BMC Plant Biol. 2025, 25, 302. [Google Scholar] [CrossRef] [Scilit]
  38. Huang, K.; Liu, L.; Wang, T.; Lin, L.; Liao, M.; Yan, W.; Wang, J.; Huang, Y. Effects of Exogenous Abscisic Acid (ABA) on Growth and Selenium Uptake in Grape Seedlings. BIO Web Conf. 2024, 142, 02017. [Google Scholar] [CrossRef] [Scilit]
  39. Karimi, R.; Ershadi, A.; Nejad, A.R.; Khanizadeh, S. Abscisic acid alleviates the deleterious effects of cold stress on ‘Sultana’ grapevine (Vitis vinifera L.) plants by improving the antioxidant activity and photosynthetic capacity of leaves. J. Hortic. Sci. Biotechnol. 2016, 91, 386–395. [Google Scholar] [CrossRef] [Scilit]
  40. Rhoads, D.M.; Umbach, A.L.; Subbaiah, C.C.; Siedow, J.N. Mitochondrial reactive oxygen species. Contribution to oxidative stress and interorganellar signaling. Plant Physiol. 2006, 141, 357–366. [Google Scholar] [CrossRef] [Scilit] [PubMed]
  41. Xia, X.J.; Zhou, Y.H.; Shi, K.; Zhou, J.; Foyer, C.H.; Yu, J.Q. Interplay between reactive oxygen species and hormones in the control of plant development and stress tolerance. J. Exp. Bot. 2015, 66, 2839–2856. [Google Scholar] [CrossRef] [Scilit]
  42. Zhan, X.; Yang, Q.; Wang, S.; Wang, Y.; Fan, X.; Bian, Z. The Responses of Sucrose Metabolism and Carbon Translocation in Tomato Seedlings under Different Light Spectra. Int. J. Mol. Sci. 2023, 24, 15054. [Google Scholar] [CrossRef] [Scilit]
  43. Zhang, J.; Lyu, H.; Chen, J.; Cao, X.; Du, R.; Ma, L.; Wang, N.; Zhu, Z.; Rao, J.; Wang, J.; et al. Releasing a sugar brake generates sweeter tomato without yield penalty. Nature 2024, 635, 647–656. [Google Scholar] [CrossRef] [Scilit] [PubMed]
  44. Wang, H.; Yu, H.; Chai, L.; Lu, T.; Li, Y.; Jiang, W.; Li, Q. Exogenous Sucrose Confers Low Light Tolerance in Tomato Plants by Increasing Carbon Partitioning from Stems to Leaves. J. Agric. Food Chem. 2023, 71, 20625–20642. [Google Scholar] [CrossRef] [Scilit]
  45. Tang, W.; Chen, C.; Zhang, Y.; Chu, Y.; Yang, W.; Cui, Y.; Kou, G.; Chen, H.; Song, H.; Gong, R. Effect of Low-Light Stress on Sugar and Acid Accumulation during Fruit Development and Ripening of Sweet Cherry. Horticulturae 2023, 9, 654. [Google Scholar] [CrossRef] [Scilit]
  46. Pan, Q.H.; Li, M.J.; Peng, C.C.; Zhang, N.; Zou, X.; Zou, K.Q.; Wang, X.L.; Yu, X.C.; Wang, X.F.; Zhang, D.P. Abscisic acid activates acid invertases in developing grape berry. Physiol. Plant. 2005, 125, 157–170. [Google Scholar] [CrossRef] [Scilit]
  47. Tao, X.; Wu, Q.; Huang, S.; Zhu, B.; Chen, F.; Liu, B.; Cai, L.; Mao, L.; Luo, Z.; Li, L.; et al. Exogenous abscisic acid regulates primary metabolism in postharvest cherry tomato fruit during ripening. Sci. Hortic. 2022, 299, 111008. [Google Scholar] [CrossRef] [Scilit]
  48. Thalmann, M.; Pazmino, D.; Seung, D.; Horrer, D.; Nigro, A.; Meier, T.; Kölling, K.; Pfeifhofer, H.W.; Zeeman, S.C.; Santelia, D. Regulation of leaf starch degradation by abscisic acid is important for osmotic stress tolerance in plants. Plant Cell 2016, 28, 1860–1878. [Google Scholar] [CrossRef] [Scilit]
  49. Li, J.; Yao, X.; Zhang, J.; Li, M.; Xie, Q.; Yang, Y.; Chen, G.; Zhang, X.; Hu, Z. Genome-Wide Identification and Expression Analysis of Hexokinase Gene Family Under Abiotic Stress in Tomato. Plants 2025, 14, 441. [Google Scholar] [CrossRef] [Scilit]
  50. Kou, X.; Li, Y.; Zhang, Y.; Jiang, B.; Xue, Z. Gene Expression and Activity of Enzymes Involved in Sugar Metabolism and Accumulation During “Huangguan” and “Yali” Pear Fruit Development. Trans. Tianjin Univ. 2018, 24, 101–110. [Google Scholar] [CrossRef] [Scilit]
Figure 1. Effect of exogenous ABA treatments on leaf ABA concentration of cherry tomato under normal light (NL) and low light (LL). Each data point on the line graph denotes the mean of the NL and LL groups for each exogenous ABA treatment. Error bars indicate the standard error of the mean (n = 8). *** indicate significant levels at p < 0.001, respectively. Different lowercase letters denote statistically significant differences among all treatments (p < 0.05). Different uppercase letters indicate differences in leaf ABA concentrations among the three exogenous ABA treatments without considering the effect of light.
Agronomy 16 00928 g001
Figure 2. Effect of exogenous ABA treatments on antioxidant enzyme activities (CAT (A), POD (B), SOD (C)), MDA (D), and H2O2 (E) content of cherry tomato under normal light (NL) and low light (LL). Error bars indicate the standard error of the mean (n = 8). *, **, and *** indicate significant levels at p < 0.05, p < 0.01, and p < 0.001, respectively; “ns” denotes non-significant differences. Different lowercase letters denote statistically significant differences among all treatments (p < 0.05).
Agronomy 16 00928 g002
Figure 3. Correlation matrix (Pearson’s coefficients) of the sugar content, sugar metabolism-related enzyme activity, and corresponding gene expression parameters in cherry tomato fruits grown under normal light (NL) (A) and low-light (LL) (B) conditions. The red and blue colors correspond to negative and positive correlations, respectively. *, **, and *** indicate significant levels at p < 0.05, p < 0.01, and p < 0.001, respectively.
Agronomy 16 00928 g003
Figure 4. PCA plots of fruit sugar metabolism attributes in cherry tomato fruits under different ABA treatments, grown under normal light (NL) and low-light (LL) conditions. Each colored ellipse represents the 95% confidence interval of samples from the corresponding treatment group, as indicated in the legend: blue squares = LL+CK, red circles = LL + T1, yellow triangles = LL + T2, green triangles = NL + CK, light blue diamonds = NL + T1, and purple crosses = NL + T2. Arrows indicate the loading vectors of each variable.
Agronomy 16 00928 g004
Table 1. The gene primers used for qRT-PCR.
No.Gene NameForward Primer (5′→3′)Reverse Primer (5′→3′)
Solyc03g121070.2hexokinase 1GCACTATACAGAATACAGGATGAATGAGAGGCAGCAAGAA
Solyc06g066440.2hexokinase 2ATCCAATACCT CCTTGAAGAATACAATCCGCCATCCAT
Solyc01g106010.2fructose-1,6-bisphosphataseCTCTTGACACATCCTAACATCATTGCTACGCCACCATAT
Solyc01g049650.2pyruvate kinase 1CCTGCTGAGTCTACGAATATAATCTTAACCACCGATGC
Solyc01g106780.2pyruvate kinase 2TGGTCAGGTGGAAGTTATCCAGAATCTCGGAAGGTA
Solyc12g088160.1phosphoenolpyruvate carboxykinaseCTAAAACAGGGCGCTCTCCAAGGAGTGATAGGCTCTGGCA
Solyc07g045110.1sucrose-phosphate synthaseTATTCGT CCTTCCATTCTGAGTCTTCATCCTCAACAACAA
Solyc02g081300.2sucrose synthaseGCTCAAGGACAGGACTAAGCTCATACATCTTCTTCATCTC
Solyc03g083910.2acid invertaseCGGAATTGGATTGTGGAATCAGGT CAGCAGATTCACT
Solyc01g058010.2neutral invertaseGCGTATAATCACTGGTAGCGAATCCACTGCCTTCTTAG
Solyc03g095710.2alpha-amylaseGAAGAGTTATGGAGATTGAAGGCTGGATGAGTAAGAATGTATGC
Solyc07g052690.2beta-amylaseGCTCCGTTATCCATCCTATCACCACCTTCCTTCTTGA
Solyc03g078400.2ActinTGTCCCTATCTACGAGGGTTATGCAGTTAAATCACGACCAGCAAGAT
Table 2. Plant height (PH), stem diameter (SD), leaf number (LN), internode length (IL), leaf dry mass (LDM), and stem dry mass (SDM) of cherry tomato plants under normal light (NL) and low light (LL) combined with ABA treatments. The data in the table are mean ± standard error (n = 8).
TreatmentPH (cm)SD (mm)LN (#)IL (cm)LDM (g Plant−1)SDM (g Plant−1)
NL(CK)162.93 ± 0.64 d9.68 ± 0.25 a23.00 ± 0.27 a8.54 ± 0.15 bc110.82 ± 9.84 a40.31 ± 2.63 a
NL(T1)157.16 ± 0.81 e9.31 ± 0.58 ab22.00 ± 0.53 ab8.57 ± 0.14 bc89.19 ± 8.43 b33.92 ± 3.04 b
NL(T2)152.35 ± 0.98 f8.43 ± 0.26 b22.13 ± 0.35 ab8.12 ± 0.25 c80.73 ± 5.98 b32.24 ± 2.29 b
LL(CK)180.79 ± 1.25 a6.43 ± 0.23 c20.88 ± 0.35 c9.17 ± 0.15 a36.19 ± 4.27 c15.96 ± 1.58 c
LL(T1)171.89 ± 0.93 b5.64 ± 0.20 c20.00 ± 0.50 c8.72 ± 0.14 ab30.70 ± 3.78 c11.73 ± 0.76 c
LL(T2)167.43 ± 1.05 c6.37 ± 0.25 c21.00 ± 0.38 bc8.36 ± 0.23 bc34.91 ± 2.76 c15.34 ± 1.38 c
Light****************
ABA***nsns****
Light × ABAns*nsnsnsns
Note: One-way ANOVA p < 0.05; significant differences between treatments are indicated with different lowercase letters. Significance code for the two-way ANOVA: *, **, and *** indicate significant levels at p < 0.05, p < 0.01, and p < 0.001, respectively; “ns” denotes non-significant differences, which are the same below.
Table 3. Glucose content (GluC), fructose content (FruC), sucrose content (SucC), and titratable acid content (TAC) in tomato fruits at the mature green (MG), breaker (BR), and red ripe (RR) stages under normal light (NL) and low light (LL) combined with ABA treatments. The data in the table are mean ± standard error (n = 3).
ParametersStageNL(CK)NL(T1)NL(T2)LL(CK)LL(T1)LL(T2)LightABALight × ABA
GluCMG27.82 ± 0.77 c A28.41 ± 0.67 c A28.02 ± 0.69 c A33.10 ± 0.37 a A30.57 ± 0.63 b A31.99 ± 0.40 ab A***nsns
(mg·g−1)BR24.32 ± 0.33 ab B22.09 ± 0.79 c B25.36 ± 0.55 a B22.20 ± 0.56 c B25.93 ± 0.60 a B22.65 ± 0.59 bc Bnsns***
RR15.09 ± 0.47 b C16.53 ± 0.78 ab C17.50 ± 0.52 a C16.77 ± 0.51 a C14.86 ± 0.13 c C15.07 ± 0.20 bc Cnsns**
FruCMG19.18 ± 0.78 b B13.29 ± 0.49 d C14.86 ± 0.76 cd C15.92 ± 0.57 c C15.08 ± 0.20 c C25.65 ± 0.37 a A*********
(mg·g−1)BR18.71 ± 0.19 e B28.33 ± 0.57 b B23.96 ± 0.84 d A23.94 ± 0.40 d A33.65 ± 0.34 a A25.89 ± 0.96 c A*******
RR32.87 ± 0.70 a A31.6 ± 0.47 a A19.59 ± 0.63 c B21.66 ± 0.53 b B19.46 ± 0.37 c B22.72 ± 0.40 b B*********
SucCMG1.92 ± 0.05 d B2.32 ± 0.05 c B3.03 ± 0.03 b A3.25 ± 0.08 a A3.02 ± 0.03 b B2.98 ± 0.06 b A*********
(mg·g−1)BR3.03 ± 0.05 b A2.45 ± 0.03 cd B2.43 ± 0.04 d B2.58 ± 0.06 c B3.38 ± 0.07 a A2.98 ± 0.03 b A********
RR2.04 ± 0.07 c B2.68 ± 0.03 a A2.32 ± 0.04 b B2.21 ± 0.14 bc C2.32 ± 0.05 b C2.73 ± 0.08 a Bns******
TACMG0.40 ± 0.00 bc C0.45 ± 0.01 a C0.42 ± 0.00 b C0.41 ± 0.01 b C0.38 ± 0.01 c C0.44 ± 0.00 a C*****
(%)BR0.59 ± 0.00 f A0.73 ± 0.01 d A0.64 ± 0.00 e A0.81 ± 0.01 c A0.87 ± 0.00 b A0.91 ± 0.00 a A*********
RR0.46 ± 0.01 d B0.52 ± 0.01 c B0.53 ± 0.01 c B0.63 ± 0.01 b B0.64 ± 0.00 b B0.70 ± 0.00 a B********
Note: One-way ANOVA, p < 0.05; different lowercase letters indicate significant differences among treatments at the same growth stage (p < 0.05), and different uppercase letters indicate significant differences among growth stages for the same treatment (p < 0.05). Significance code for the two-way ANOVA: *, **, and *** indicate significant levels at p < 0.05, p < 0.01, and p < 0.001, respectively; “ns” denotes non-significant differences.
Table 4. Soluble acid invertase (SAI) activity, sucrose synthase synthetic direction (SS-s) activity, sucrose cleavage direction (SS-c) activity, sucrose phosphate synthase (SPS) activity, neutral invertase (NI) activity, and amylase (Amy) activity in tomato fruits at the mature green (MG), breaker (BR), and red ripe (RR) stages under normal light (NL) and low light (LL) combined with ABA treatments. The data in the table are mean ± standard error (n = 3).
ParametersStageNL(CK)NL(T1)NL(T2)LL(CK)LL(T1)LL(T2)LightABALight × ABA
SAI activityMG10.37 ± 0.40 b C5.84 ± 0.11 d C12.45 ± 0.71 a C10.08 ± 0.24 b C8.08 ± 0.19 c C8.84 ± 0.18 c Cns******
BR75.43 ± 0.90 d B58.83 ± 0.68 e B95.31 ± 1.25 b B34.39 ± 0.86 f B81.03 ± 1.33 c B121.71 ± 1.61 a B*******
RR278.41 ± 2.56 b A120.45 ± 2.03 f A132.55 ± 2.27 e A147.97 ± 1.83 d A240.27 ± 2.61 c A379.97 ± 2.40 a A *********
SS-s activityMG47.4 ± 1.53 f C137.23 ± 3.89 c B111.37 ± 0.89 e C158.03 ± 1.77 b B175.33 ± 2.73 a C124.13 ± 2.06 d B*********
BR134.18 ± 1.73 c B117.22 ± 1.42 d C122.17 ± 1.45 d B135.02 ± 2.55 c C203.05 ± 2.24 a B145.74 ± 2.37 b A*********
RR182.84 ± 1.88 c A190.76 ± 2.08 b A134.56 ± 1.68 f A173.89 ± 1.77 d A243.51 ± 2.43 a A143.43 ± 2.76 e A*********
SS-c activityMG8.76 ± 0.19 e C14.81 ± 0.38 b C13.14 ± 0.39 c C10.30 ± 0.27 d B10.71 ± 0.33 d C16.24 ± 0.54 a Bns******
BR15.64 ± 0.60 c B24.52 ± 0.67 a B19.39 ± 0.63 b B19.53 ± 0.53 b A15.69 ± 0.60 c B17.35 ± 0.47 c AB*********
RR28.35 ± 0.59 b A29.6 ± 0.69 b A25.93 ± 0.49 c A19.56 ± 0.55 d A45.29 ± 0.63 a A18.51 ± 0.58 d Ans******
SPS activityMG73.91 ± 1.57 e B109.4 ± 1.94 c B151.96 ± 2.03 a B143.46 ± 1.63 b B93.14 ± 1.44 d B72.98 ± 1.31 e B*********
BR34.42 ± 1.04 f C109.36 ± 1.59 d B76.53 ± 1.23 e C152.82 ± 1.98 c A199.71 ± 1.57 a A178.24 ± 2.17 b A*********
RR238.18 ± 2.59 a A241.27 ± 2.07 a A167.99 ± 1.35 b A51.15 ± 0.94 c C35.79 ± 0.91 d C23.03 ± 0.64 e C*********
NI activityMG227.71 ± 2.04 d B199.12 ± 2.07 e B249.53 ± 2.39 b B239.48 ± 2.62 c A150.35 ± 2.37 f B292.27 ± 2.09 a Bns******
BR293.82 ± 1.80 d A305.34 ± 1.82 c A338.23 ± 2.39 a A190.17 ± 2.18 f B232.25 ± 2.78 e A316.57 ± 2.63 b A*********
RR47.74 ± 1.33 d C52.79 ± 0.86 c C24.67 ± 0.69 e C12.66 ± 0.56 f C58.53 ± 0.98 b C68.79 ± 0.72 a C*********
Amy activityMG1.30 ± 0.04 a C1.04 ± 0.03 c B1.02 ± 0.03 c B1.10 ± 0.06 bc B1.18 ± 0.02 b B1.37 ± 0.02 a C********
BR1.59 ± 0.05 b B1.03 ± 0.01 c B 1.00 ± 0.03 c B1.02 ± 0.02 c B1.07 ± 0.04 c B2.29 ± 0.03 a B*********
RR4.46 ± 0.03 c A3.74 ± 0.03 d A2.73 ± 0.06 e A4.94 ± 0.05 b A4.36 ± 0.05 c A5.28 ± 0.08 a A*********
Note: One-way ANOVA, p < 0.05; different lowercase letters indicate significant differences among treatments at the same growth stage (p < 0.05), and different uppercase letters indicate significant differences among growth stages for the same treatment (p < 0.05). Significance code for the two-way ANOVA: *, **, and *** indicate significant levels at p < 0.05, p < 0.01, and p < 0.001, respectively; “ns” denotes non-significant differences.
Table 5. Two-way analysis of variance (ANOVA) results and means ± standard error of the mean (SEM, n = 3) for glycometabolism-related gene expression levels (including PK1 (pyruvate kinase 1), PK2 (pyruvate kinase 2), HXK1 (hexokinase 1), HXK2 (hexokinase 2), FBP (fructose-1,6-bisphosphatase), PEPCK (phosphoenolpyruvate carboxykinase), SPS (sucrose phosphate synthase), SS (sucrose synthase), AI (acid invertase), NI (neutral invertase), α-Amy (α-Amylase), and β-Amy (β-Amylase)) in cherry tomato fruits at the mature green stage (MG), breaker stage (BR), and red ripe stage (RR) under normal light (NL) and low-light (LL) conditions.
StageTreatmentPK1PK2HXK1HXK2FBPPEPCKSPSSSAINIα-Amyβ-Amy
MGNL(CK)1.00 ± 0.02 a1.04 ± 0.20 b1.00 ± 0.02 a1.00 ± 0.04 c1.01 ± 0.11 a1.00 ± 0.06 b1.00 ± 0.05 bc1.00 ± 0.04 a1.01 ± 0.08 b1.00 ± 0.01 b1.01 ± 0.09 c1.01 ± 0.08 cd
NL(T1)0.77 ± 0.04 c3.80 ± 0.29 a0.41 ± 0.07 e0.65 ± 0.02 d0.85 ± 0.02 a0.60 ± 0.04 d3.65 ± 0.21 a1.06 ± 0.03 a1.19 ± 0.02 a0.21 ± 0.02 f0.43 ± 0.03 e1.19 ± 0.10 b
NL(T2)0.97 ± 0.05 ab1.25 ± 0.09 b0.89 ± 0.01 b2.30 ± 0.10 a1.03 ± 0.10 a0.73 ± 0.00 c1.18 ± 0.05 b0.69 ± 0.03 c1.02 ± 0.03 b0.32 ± 0.02 e1.56 ± 0.04 a0.86 ± 0.03 d
LL(CK)0.89 ± 0.01 b1.32 ± 0.01 b1.01 ± 0.01 a1.01 ± 0.01 c1.01 ± 0.01 a1.21 ± 0.01 a0.70 ± 0.02 d0.63 ± 0.02 c0.80 ± 0.02 c1.30 ± 0.02 a1.24 ± 0.02 b1.10 ± 0.02 bc
LL(T1)0.97 ± 0.00 ab4.17 ± 0.01 a0.51 ± 0.00 d0.64 ± 0.01 d0.92 ± 0.01 a0.53 ± 0.01 d0.90 ± 0.02 cd0.81 ± 0.02 b1.00 ± 0.02 b0.40 ± 0.02 d0.57 ± 0.02 d1.37 ± 0.02 a
LL(T2)0.20 ± 0.00 d1.47 ± 0.01 b0.63 ± 0.00 c2.14 ± 0.01 b0.98 ± 0.00 a0.61 ± 0.01 d0.78 ± 0.02 cd0.54 ± 0.02 d0.78 ± 0.02 c0.46 ± 0.02 c1.61 ± 0.02 a0.97 ± 0.02 cd
Light***nsnsnsnsns*****************
ABA************ns*********************
Light × ABA***ns***nsns********ns**nsns
BRNL(CK)0.61 ± 0.03 c0.58 ± 0.01 ab0.39 ± 0.02 a1.01 ± 0.11 c5.99 ± 0.54 b6.78 ± 0.15 d2.76 ± 0.26 a0.05 ± 0.00 a24.27 ± 1.81 b2.11 ± 0.05 b0.81 ± 0.04 b0.89 ± 0.07 a
NL(T1)0.79 ± 0.08 b0.58 ± 0.01 ab0.32 ± 0.02 b0.85 ± 0.02 c6.29 ± 0.40 b8.48 ± 0.26 c1.93 ± 0.02 d0.03 ± 0.00 c14.23 ± 0.45 d1.74 ± 0.08 c1.10 ± 0.09 a0.39 ± 0.03 c
NL(T2)0.40 ± 0.03 d0.65 ± 0.06 a0.25 ± 0.00 c1.03 ± 0.10 c4.81 ± 0.12 c5.53 ± 0.11 de2.72 ± 0.17 ab0.02 ± 0.00 d29.46 ± 2.02 a2.10 ± 0.06 b0.68 ± 0.06 b0.60 ± 0.03 b
LL(CK)0.79 ± 0.02 b0.58 ± 0.05 ab0.31 ± 0.01 b2.27 ± 0.17 a8.81 ± 0.57 a13.86 ± 0.89 a2.35 ± 0.08 bc0.04 ± 0.00 bc22.00 ± 0.97 bc3.07 ± 0.08 a0.48 ± 0.03 c0.93 ± 0.05 a
LL(T1)1.28 ± 0.09 a0.52 ± 0.01 bc0.32 ± 0.01 b1.65 ± 0.01 b8.90 ± 0.09 a10.14 ± 0.4 b2.11 ± 0.05 cd0.04 ± 0.00 b14.71 ± 0.49 d2.02 ± 0.02 b0.78 ± 0.04 b0.67 ± 0.04 b
LL(T2)0.35 ± 0.01 d0.44 ± 0.01 c0.24 ± 0.01 c1.86 ± 0.21 b2.63 ± 0.05 d5.25 ± 0.21 e1.84 ± 0.06 d0.01 ± 0.00 e19.21 ± 0.04 c1.39 ± 0.03 d0.35 ± 0.02 c0.97 ± 0.08 a
Light***************************
ABA******ns************************
Light × ABA*********ns*************ns*
RRNL(CK)1.73 ± 0.01 a8.13 ± 0.54 c0.42 ± 0.01 a0.48 ± 0.04 a1.86 ± 0.04 a2.29 ± 0.06 d2.72 ± 0.23 a0.08 ± 0.01 b17.28 ± 0.95 d0.66 ± 0.00 b0.92 ± 0.03 a0.68 ± 0.03 b
NL(T1)1.00 ± 0.02 cd9.29 ± 0.62 c0.26 ± 0.00 b0.35 ± 0.02 bc1.21 ± 0.04 d5.90 ± 0.21 c2.33 ± 0.05 abc0.08 ± 0.01 b23.28 ± 0.58 b0.65 ± 0.05 b0.52 ± 0.03 bc0.47 ± 0.01 c
NL(T2)1.66 ± 0.02 a13.72 ± 0.47 a0.25 ± 0.02 b0.47 ± 0.02 a1.72 ± 0.01 ab6.84 ± 0.37 b2.49 ± 0.20 ab0.23 ± 0.00 a28.79 ± 0.67 a0.89 ± 0.01 a0.56 ± 0.02 b0.80 ± 0.05 a
LL(CK)0.89 ± 0.06 d8.93 ± 0.55 c0.25 ± 0.01 b0.29 ± 0.01 cd0.99 ± 0.04 e5.79 ± 0.07 c2.19 ± 0.18 bc0.08 ± 0.00 b19.63 ± 0.75 c0.51 ± 0.01 c0.41 ± 0.01 d0.40 ± 0.02 c
LL(T1)1.23 ± 0.08 b11.37 ± 0.58 b0.22 ± 0.02 b0.26 ± 0.02 d1.39 ± 0.06 c6.16 ± 0.24 c2.00 ± 0.02 c0.06 ± 0.0 c19.00 ± 1.04 cd0.59 ± 0.03 b0.44 ± 0.01 cd0.48 ± 0.01 c
LL(T2)1.06 ± 0.04 c9.52 ± 0.85 bc0.24 ± 0.04 b0.36 ± 0.01 b1.70 ± 0.07 b7.66 ± 0.20 a1.92 ± 0.11 c0.04 ± 0.0 d5.18 ± 0.32 e0.48 ± 0.01 c0.53 ± 0.05 b0.48 ± 0.04 c
Light***ns*****************************
ABA******************ns**************
Light × ABA********ns******ns***************
Note: One-way ANOVA (p < 0.05); different lowercase letters indicate significant differences among treatments within the same growth stage. Two-way ANOVA significance codes: *, **, and *** indicate significant levels at p < 0.05, p < 0.01, and p < 0.001, respectively; “ns” denotes non-significant differences.
Table 6. One-way analysis of variance (ANOVA) results and means ± standard error of the mean (SEM, n = 18) for glycometabolism-related gene expression levels (including PK1 (pyruvate kinase 1), PK2 (pyruvate kinase 2), HXK1 (hexokinase 1), HXK2 (hexokinase 2), FBP (fructose-1,6-bisphosphatase), PEPCK (phosphoenolpyruvate carboxykinase), SPS (sucrose phosphate synthase), SS (sucrose synthase), AI (acid invertase), NI (neutral invertase), α-Amy (α-Amylase), and β-Amy (β-Amylase)) in cherry tomato fruits at the mature green stage (MG), breaker stage (BR), and red ripe stage (RR) under normal light (NL) and low-light (LL) conditions.
Gene NameMGBRRRSignificance
PK1 (pyruvate kinase 1)0.80 ± 0.07 B0.70 ± 0.08 B1.26 ± 0.08 A***
PK2 (pyruvate kinase 2)2.17 ± 0.32 C6.24 ± 0.55 B10.16 ± 0.50 A***
HXK1 (Hexokinase 1)0.74 ± 0.06 A0.56 ± 0.02 B0.27 ± 0.02 C***
HXK2 (Hexokinase 2)1.29 ± 0.16 A0.31 ± 0.01 B0.37 ± 0.02 B***
FBP (fructose -1,6-bisphosphatase)0.97 ± 0.03 B1.44 ± 0.13 A1.48 ± 0.08 A***
PEPCK (phosphoenolpyruvate carboxykinase)0.78 ± 0.06 C8.34 ± 0.74 A5.77 ± 0.42 B***
SPS (sucrose phosphate synthase)1.37 ± 0.25 B2.28 ± 0.10 A2.27 ± 0.08 A***
SS (sucrose synthase)0.79 ± 0.05 A0.03 ± 0.00 B0.09 ± 0.01 B***
AI (acid invertase)0.97 ± 0.04 B20.65 ± 1.36 A18.86 ± 1.76 A***
NI (neutral invertase)0.62 ± 0.10 B2.07 ± 0.13 A0.63 ± 0.03 B***
α-Amy (αlphα-Amylase)1.07 ± 0.11 A0.70 ± 0.06 B0.56 ± 0.04 B***
β-Amy (beta-amylase)1.08 ± 0.04 A0.74 ± 0.05 B0.55 ± 0.04 C***
Note: One-way ANOVA (p < 0.05); different uppercase letters within the same row indicate significant differences among developmental stages (regardless of Light and ABA treatment). *** indicate significant levels at p < 0.001. Two-way ANOVA was not performed for this table.
Disclaimer/Publisher’s Note: The statements, opinions and data contained in all publications are solely those of the individual author(s) and contributor(s) and not of MDPI and/or the editor(s). MDPI and/or the editor(s) disclaim responsibility for any injury to people or property resulting from any ideas, methods, instructions or products referred to in the content.