Article

Effects of Reduced Irrigation on Growth, Yield and Water Use Efficiency of Potato Under Drip Irrigation with Plastic Mulch

1
State Key Laboratory of Aridland Crop Science (Gansu Agricultural University), Gansu Agricultural University, Lanzhou 730070, China
2
College of Agronomy, Gansu Agricultural University, Lanzhou 730070, China
3
College of Horticulture, Gansu Agricultural University, Lanzhou 730070, China
*
Authors to whom correspondence should be addressed.
Agronomy 2026, 16(9), 866; https://doi.org/10.3390/agronomy16090866
Submission received: 29 January 2026 / Revised: 16 April 2026 / Accepted: 21 April 2026 / Published: 24 April 2026

Abstract

Water scarcity is the primary constraint on the development of the potato industry in Northwest China. Improving water use efficiency (WUE) under limited water supply is, therefore, an urgent priority to promote the green and sustainable development of potato production in this region. This research was conducted from 2023 to 2024 in the rain shelter of the Agricultural Science Research Institute in Dingxi City, Gansu Province, using the potato cultivar ‘Gan Yin No. 9’ as the experimental material. Throughout the growing season, the control treatment (CK) was maintained at 75–85% of the field water capacity (FWC). Based on CK, three deficit-irrigation treatments were established: W75 (75% of the CK irrigation amount), W50 (50% of CK irrigation amount), and W25 (25% of CK irrigation amount), with three replicates per treatment. We evaluated the effects of different irrigation regimes on plant growth characteristics, physiological characteristics, tuber yield, and WUE. The results showed that the W75 treatment significantly (p < 0.05) promoted the growth of plant height and stem diameter, and significantly increased them by 8.70–10.20% and 13.03–18.70%, respectively, compared with CK. The total dry matter accumulation under W75 was significantly higher than CK (by 10.90–11.40%) and markedly higher than W50 and W25 (by 24.10–45.50%). No significant differences were observed in tuber yield, large tuber rate, and medium tuber rate between W75 and CK. Notably, W75 significantly improved WUE by 36.43–38.51% compared with CK. Overall, under the conditions of this study, W75 treatment was identified to be the optimal irrigation regime for potato cultivation, as it promoted plant growth, maintained tuber yield, and enhanced water use efficiency. This study aims to establish a definitive irrigation threshold for potato production in Northwest China. The findings provide a precise basis for formulating irrigation schedules, which can contribute to the development of water-efficient agriculture and support the sustainable development of the potato industry in the region.

1. Introduction

Potato (Solanum tuberosum L.) is the third most important food crop worldwide as a staple food and as a vegetable. Owing to its high nutritional value and strong environmental adaptability, potato plays a crucial role in ensuring food security and optimizing agricultural cropping systems [1]. In China, the northwest region is one of the major potato-producing areas [2]. However, annual precipitation in this region is generally around 400 mm, whereas potential evaporation reaches 1200–1800 mm, resulting in severe water scarcity that significantly constrains the sustainable development of the potato industry [3]. Therefore, under conditions of limited water resources, developing irrigation management strategies that maintain stable production while improving water use efficiency and reducing water consumption has become a critical challenge for potato production in Northwest China.
Mulched drip irrigation is a key water-saving technology that combines the water conservation effect of mulching with the precise application of drip irrigation, thereby reducing soil evaporation by 30–50% [4]. Specifically, plastic film covering can regulate radiation balance on the soil surface, creating a unique microclimate environment around the crop roots, which helps maintain the energy balance in the field and thereby improve crop quality [5]. The plastic film can significantly inhibit soil water evaporation and increase water supply in the root zone, causing changes in soil moisture conditions and increasing yield [6]. The combination of plastic film and straw covering can promote early soil warming, promote root growth, and stimulate the secretion of specific metabolites, thereby increasing potato yield [7]. Different covering materials will have a direct impact on the test results. Zhang et al. studied that under drip irrigation conditions, black plastic film covering is more suitable for large-scale potato tuber production, while transparent plastic film covering is more conducive for water conservation [8]. Furthermore, plastic film mulching has been shown to ameliorate continuous cropping obstacles and achieve precise delivery of water and nutrients, with demonstrated water-saving and yield-stabilizing effects in crops such as cotton and maize [9,10,11].
As a tuber crop, potatoes are extremely sensitive to soil moisture conditions. From the perspective of ‘threshold’, the response of potatoes to water deficit is not a simple linear relationship but exhibits a ‘threshold effect’. Previous studies have found that when the soil moisture content drops to below 60% of the field moisture holding capacity, it will lead to a decrease in yield [12]. Conversely, when the soil moisture content exceeds 85%, it will also cause a decrease in yield [13]. Through the comprehensive analysis by Niu Y et al., field experiments in different soil and growing environments in Northern China have shown that under the condition of not losing yield, reduced irrigation can improve the water use efficiency of potato plants [14]. And studies have also found that a 70% reduction in ETc through irrigation can significantly increase the yield of potato plants [15]. In irrigation practices in the northwest region, when the soil moisture content is 75%, it is possible to maintain yield while improving water use efficiency [16].
Appropriate irrigation reduction can mitigate adverse effects of water shortage on crop growth and enhance nutrient absorption and utilization [17,18]. Thus, optimizing irrigation management offers the potential to improve WUE while maintaining tuber yield [19]. A moderate water deficit does not simply inhibit growth but rather induces crops to optimize resource allocation.
In Northwestern China, ridge–furrow planting combined with plastic film mulching and drip irrigation has become the dominant cultivation practice for potato. Although numerous studies have examined drip irrigation management under mulching, irrigation amounts are typically calculated based on the total plot area [20,21]. This approach may cause a mismatch between applied and actual crop water requirements, potentially resulting in localized soil moisture surplus and reduced WUE.
To address this limitation, the present study incorporates an irrigation coefficient into the conventional irrigation amount calculation. Using the local main cultivar ‘Ganyin No. 9’ as the test material and four irrigation ratios as treatments, we systematically investigated the effects of reduced irrigation on potato growth traits (plant height, stem diameter, and dry matter accumulation), physiological characteristics (SPAD, photosynthetic parameters), tuber yield, and WUE to determine an appropriate irrigation coefficient for arid and semi-arid areas in Northwest China, improve WUE, and provide a theoretical basis and technical support for promoting the development of the potato industry in this region.

2. Material and Methods

2.1. Experimental Site

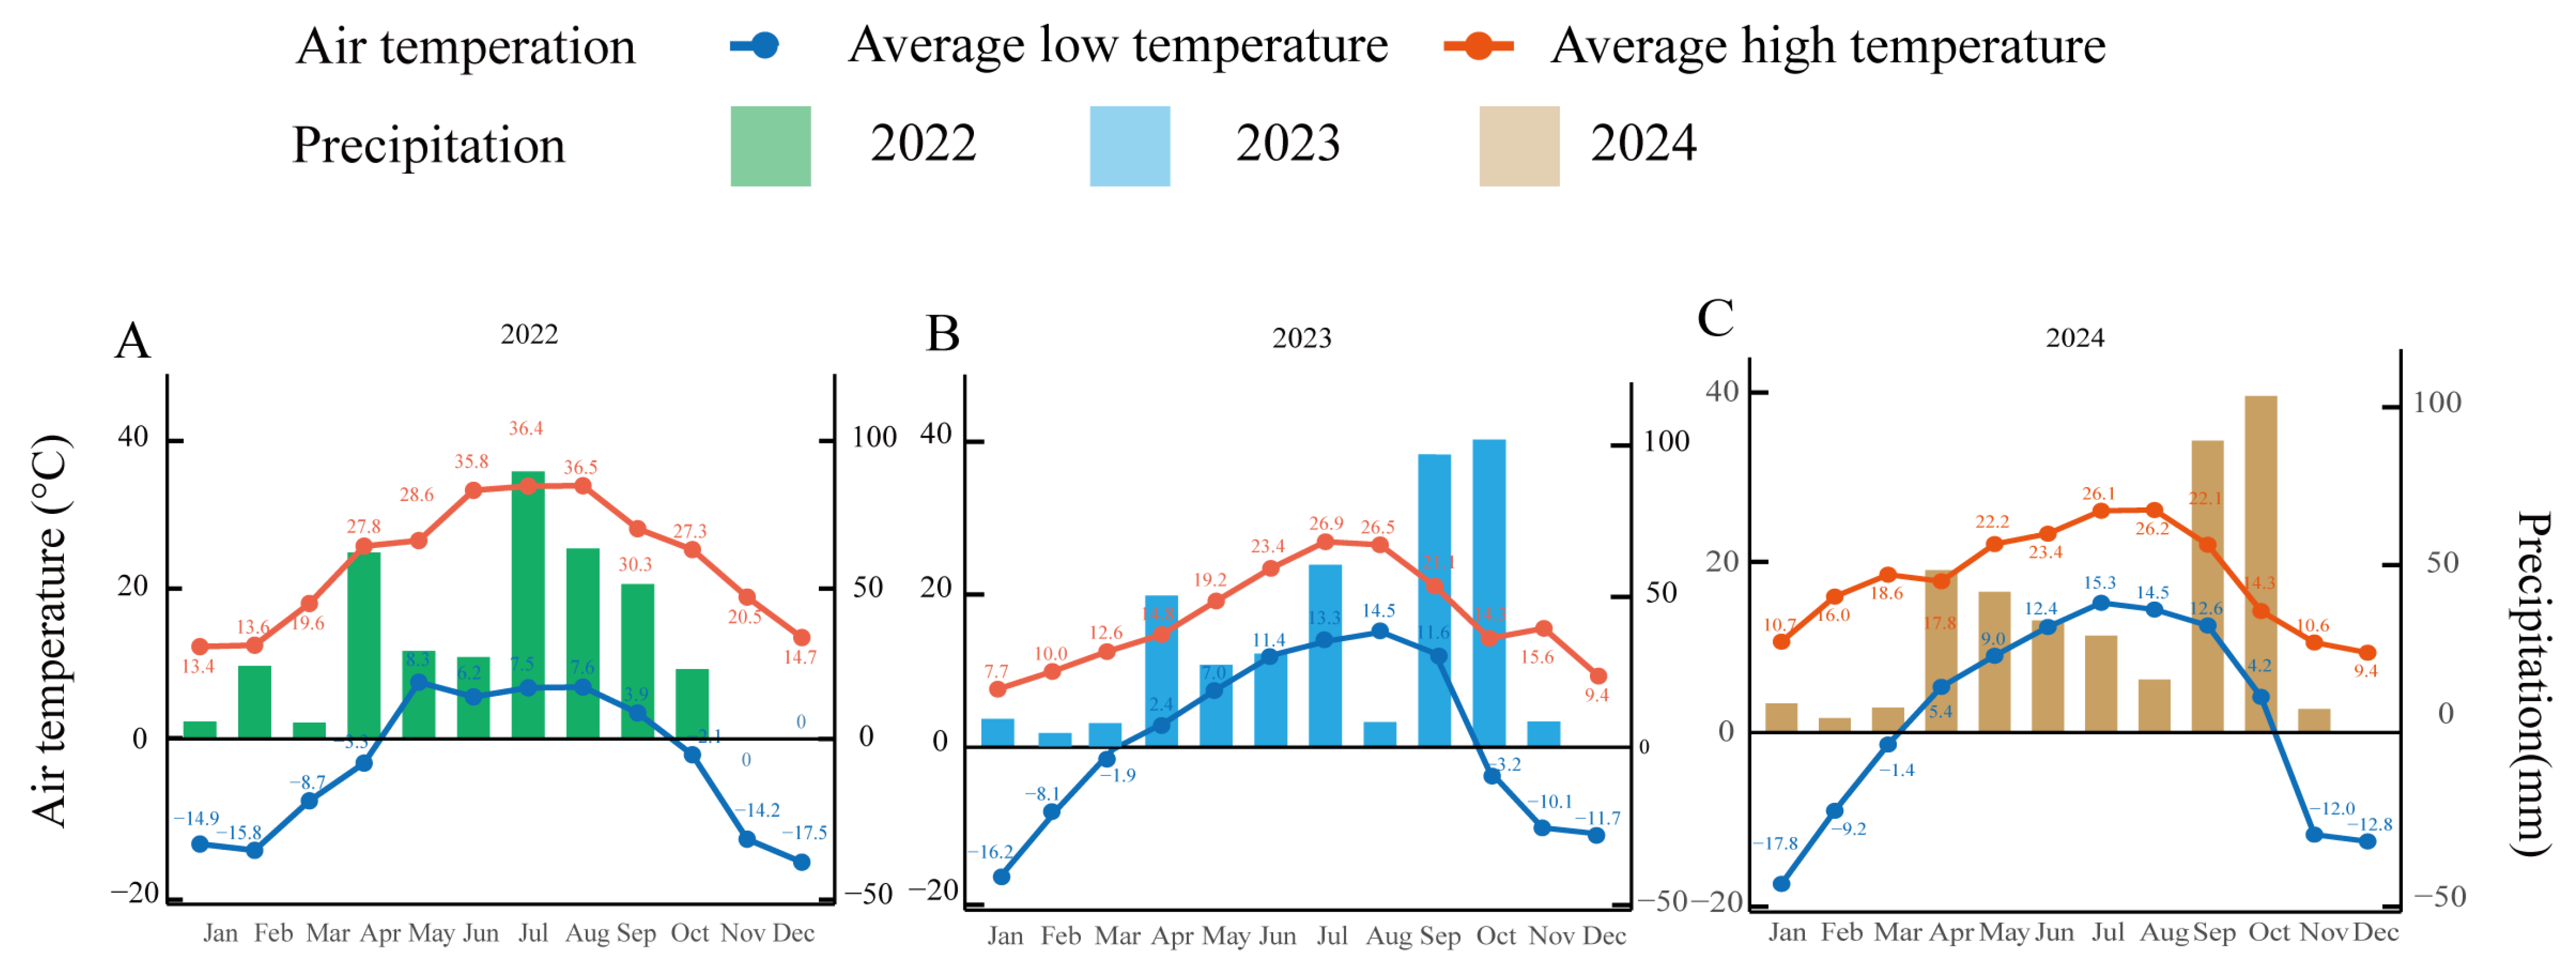
Field experiments were conducted in 2023 and 2024 at the Experimental Station of Dingxi Institute of Agricultural Science, Anding District, Dingxi City, Gansu Province (35°42′ N, 104°50′ E, altitude 1900 m). The site is situated in Northwestern China and features a typical semi-arid and arid climate. The long-term mean annual solar radiation is 141.4 kcal·cm−2, with 2500.1 h of sunshine per year (Figure S1). The mean annual air temperature is 6.3 °C, and the frost-free period is approximately 141 d. Over the past three years, the mean annual precipitation was 320 mm, with most rainfall occurring from May to September, whereas annual evaporation is approximately 1526 mm (Figure 1). The soil is classified as loamy yellow clay. Bulk density in the 0–200 cm layer is 1.31 g·cm−3. Soil nutrient analysis shows the following: organic matter 19.00 g·kg−1, alkaline hydrolyzable nitrogen 13.00 mg kg−1, available phosphorus 29.06 mg·kg−1, available potassium 143.74 mg·kg−1, and pH value of 8.48 (Table 1). Before the experiment, soil samples were collected from the 0–20 cm soil layer for the determination of basic physicochemical properties. Soil nutrient analyses were conducted by Pronetbio Inspection Company using standard analytical procedures.

2.2. Experimental Design and Treatments

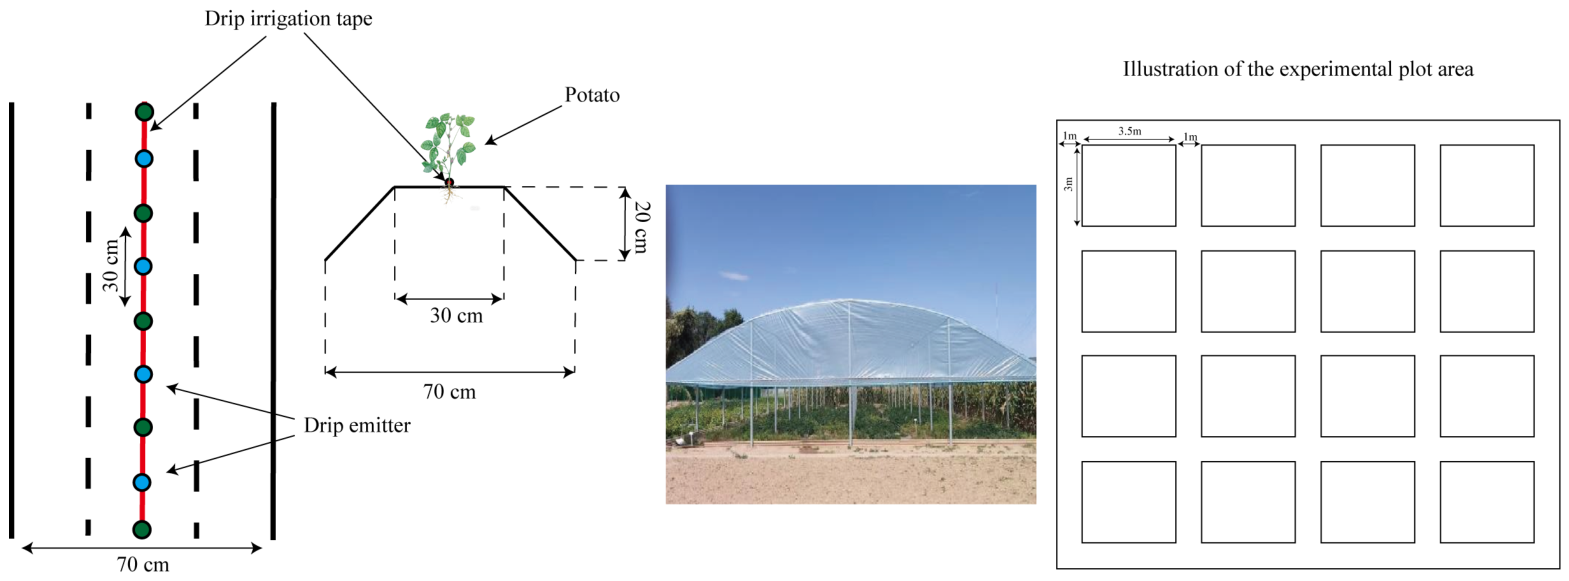
The field experiment was conducted under a rain shelter during the 2023 and 2024 growing seasons. Potato plants were grown using a ridge–furrow planting system with plastic film mulching and drip irrigation, and the irrigation treatments were initiated 15 days after seedling emergence. The cultivar ‘Ganyin No. 9’ was used. Potatoes were planted in single rows on ridges at a depth of 10–15 cm, with a row spacing of 70 cm, a plant spacing of 30 cm, and 50 plants per plot. Ridge width and ridge height were 70 cm and 20 cm, respectively (Figure 2).
Based on our previous research in the northwest region of China, soil moisture content was set at 75–85% of the field water holding capacity (FWC) throughout the growing period as the control treatment (CK). Three deficit-irrigation treatments were established: W75, W50, and W25, which received 75%, 50%, and 25% of the irrigation volume of the CK, respectively. The experiment adopted a randomized complete block design with three replicates and a total of 12 experimental plots. Each plot measured 3.5 m × 3.0 m (10.5 m2), and to achieve clear hydraulic separation between different treatments and prevent lateral water disturbance, a 1.0-meter-wide buffer zone was set between adjacent experimental plots. Under the loamy soil conditions of the northwest region, the horizontal radius of the wetting body formed by drip irrigation usually does not exceed 0.5 meters, and in the absence of rainfall, the lateral migration distance of soil moisture is extremely limited, sufficient to eliminate lateral water movement.
To reduce potential hydraulic interference between different treatments, each experimental plot was equipped with an independent electromagnetic valve, enabling individual control and application of irrigation through the drip irrigation system (Natafim Company, Guangzhou, China). The inner diameter of the drip pipe was 16.0 millimeters, the nozzle spacing was 300 millimeters, and the flow rate was 1.60 liters per hour. Additionally, the shading shed condition excluded the influence of natural rainfall, while the combination of buffer zone, independent irrigation control, ridge planting, and plastic film coverage was intended to minimize lateral water movement and interference between different experimental plots during the experiment.
The irrigation amount and duration applied to the CK treatment were calculated using the following formula:
M = 10 × ρ × H × ( β i β j ) S × k
h = M × S d × n
M represents the irrigation amount (mm), ρ denotes the soil bulk density in the wet layer (1.31 g·cm−3), H is the depth of the wetting layer (40 cm in this study), βi stands for the upper limit of the relative water content (18.1%), βj represents soil water content before irrigation, k represents the irrigation ratio, S is the area of the plot (m2), h signifies the irrigation duration in hours, d denotes the drip flow rate (1.60 L·h−1), n is the number of drips per plot (50), and factor 10 is used for unit conversion. The irrigation ratio k was set to 1.0 for CK, 0.75 for W75, 0.50 for W50, and 0.25 for W25. Irrigation volume is shown in Table 2.

2.3. Agronomic Practices

The experimental planting was conducted on 25 April 2023 and 20 April 2024. The experiment utilized a cultivation method that combined ridge planting with drip irrigation under plastic mulching. Throughout the experiment, a fertilizer ratio of 12–10–15 (N–P2O5–K2O) was applied. Pre-planting basal application included urea (46% N, 107.18 kg·ha−1), diammonium phosphate (18% N, 46% P2O5, 326.1 kg·ha−1), and potassium magnesium sulfate (24% K2O, 562.5 kg·ha−1). Ridges were formed with a width of 70 cm and a height of 20 cm, and potatoes were planted at the center of each ridge with a spacing of 30 cm. After planting, drip irrigation pipes were installed along the center of the ridges and covered with black plastic film (0.08 mm thickness) (Figure 1). Nitrogen was supplemented by urea topdressing (52.2 kg·ha−1) via hole placement during the 2–4-week period after emergence. Foliar application of potassium magnesium sulfate (57.7 kg·ha−1) was carried out at two critical growth stages: 5–6 weeks post-emergence and post-flowering. Following harvest, aboveground crop residues were removed from all plots. The 2023 experiment was harvested on 15 September, and the 2024 experiment on 19 September. Field management procedures were consistent with conventional practices.

2.4. Experimental Measurements

2.4.1. Growth Characteristics

Plant height and stem diameter were measured at the seedling 41 (40) days after planting (DAS), tuber formation 58 (60) DAS, tuber bulking 82 (81) DAS, and starch accumulation stages 110 (111) DAS. In each sample area, three representative plants were selected at intervals of 1 m, and collection was avoided within 0.5 m of the sample area edge. The height and stem diameter of the plants were measured repeatedly at each growth stage. Plant height was determined as the distance from the stem base to the apical growing point using a ruler. Stem diameter was measured at the thickest part of the stem base with a vernier caliper, and the mean of the longitudinal and transverse diameters was recorded. Dry matter accumulation was determined at five growth stages from the seedling stage to maturity. At each sampling time, three representative plants with uniform growth were randomly selected from the inner rows of each plot for dry matter determination to eliminate border effects. The sampled plants were separated into roots, stems, leaves, and tubers. All samples were baked in an oven at 105 °C for 30 min to deactivate enzymes and then dried at 85 °C to constant weight. The dry matter conversion rate is calculated using the following formula:
D M T e = ( W f     W r W y ) 100 %
DMTe represents the dry matter translocation rate; Wf represents the dry weight of each organ during the tuber enlargement period; Wr represents the dry weight of each organ during the mature stage; Wy represents the dry weight of the potato tuber.

2.4.2. Photosynthesis Characteristics

Relative chlorophyll content was measured at four growth stages: seedling, tuber formation, tuber bulking, and starch accumulation stages. The SPAD value of the youngest fully expanded leaf was determined using a SPAD-502 portable chlorophyll meter (Konica Minolta, Tokyo, Japan), with three fixed plants selected per plot and the average value calculated. Photosynthetic parameters were measured on clear days during the full flowering stage between 9:00 a.m. and 11:00 a.m. using a Li-6400-02 portable photosynthetic instrument (LI-COR, Lincoln, NE, USA). For each plot, three fixed plants were measured under two light intensities (850 µmol·m−2·s−1 and 1500 µmol·m−2·s−1). Net photosynthetic rate (Pn), transpiration rate (Tr), stomatal conductance (Gs), and intercellular CO2 concentration (Ci) were recorded. The stomatal limit value (Ls) was calculated by the following formula:
L s = 1     C i C a
where Ci is the intercellular CO2 concentration (µmol·mmol−1) and Ca is the ambient CO2 concentration (µmol·mol−1).

2.4.3. Tuber Yield and Its Components and Water Use Efficiency

Yield was determined by randomly selecting 15 plants from each plot. Each plant’s tuber count (units) and total tuber weight (g) were recorded, with the average value calculated and converted to hectare yield (Y) based on the plot area. For tuber quality evaluation, all harvested tubers were assessed. Those with a diameter exceeding twice that of the stolon are classified as viable. Fresh weights are measured using analytical balances and categorized into three sizes: large (>150 g), medium (75–150 g), and small (<75 g). The proportions of each size class were calculated to determine the large, medium, and small tuber rates.
Crop water use efficiency:
W U E = Y a / E t a
where WUE is the crop water use efficiency (kg·ha−1·mm−1), Ya refers to the economic yield per hectare (kg·ha−1), and ETa is the crop evapotranspiration during the growing period (mm).
E t a = E P + I Δ W
where EP (mm) is the precipitation during the experimental period (mm), I (mm) is the irrigation amount during the experimental period, and ΔW (mm) is the difference between the soil water storage between planting and harvest. Because the experiment was conducted under a rain shelter, EP was assumed to be 0.
Δ W = 10 × S H × ρ × Δ S W
where ρ is soil bulk density (1.31 g·cm−3), SH is the soil layer thickness (cm), and ΔSW (%) is the difference between the soil water storage during planting and harvest. Factor 10 is used for unit conversion.

2.5. Data Analyses

Data were initially organized and processed using Microsoft Excel 2010. Analysis of variance (ANOVA) was performed with SPSS 26.0 (IBM Corp., Armonk, NY, USA), and mean comparisons were conducted using Duncan’s multiple range test at a significance level of p < 0.05. Data visualization was accomplished using Origin 2021. A partial least squares path model (PLS-PM) was constructed using the PLS-PM package in R 4.2.3 to examine the relationships among variables and to identify key factors influencing potato yield and water use efficiency.

3. Results

3.1. Effects of Reduced Irrigation on Growth Characteristics of Potato

3.1.1. Effects of Reduced Irrigation on Plant Height of Potato

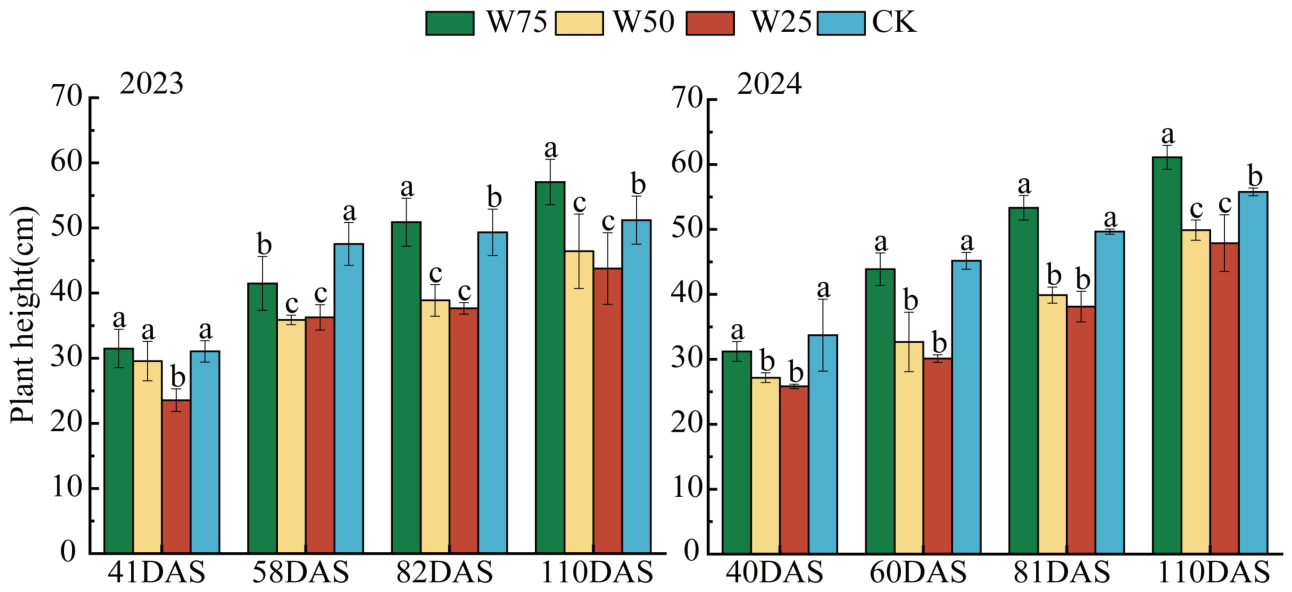
Figure 3 illustrates that plant heights increased gradually throughout the growing period under all irrigation treatments. In 2023, the plant heights of the W75, W50, and CK treatments were significantly greater than that of W25. Among these treatments, W75 had the highest plant height (31.50 cm), but there was no significant difference compared with CK or W50.
A similar trend was observed in 2024. At 40 DAS, the plant heights of the W75 and W50 treatments were significantly higher than that of W25. From 60 to 81 DAS, W75 consistently resulted in the highest plant height compared with other treatments, reaching a maximum of 43.89 cm at 60 DAS. By 111 DAS, plant height under W75 was significantly higher than that under other treatments and was 8.7% greater than that under CK.

3.1.2. Effects of Reduced Irrigation on the Stem Diameter of Potato

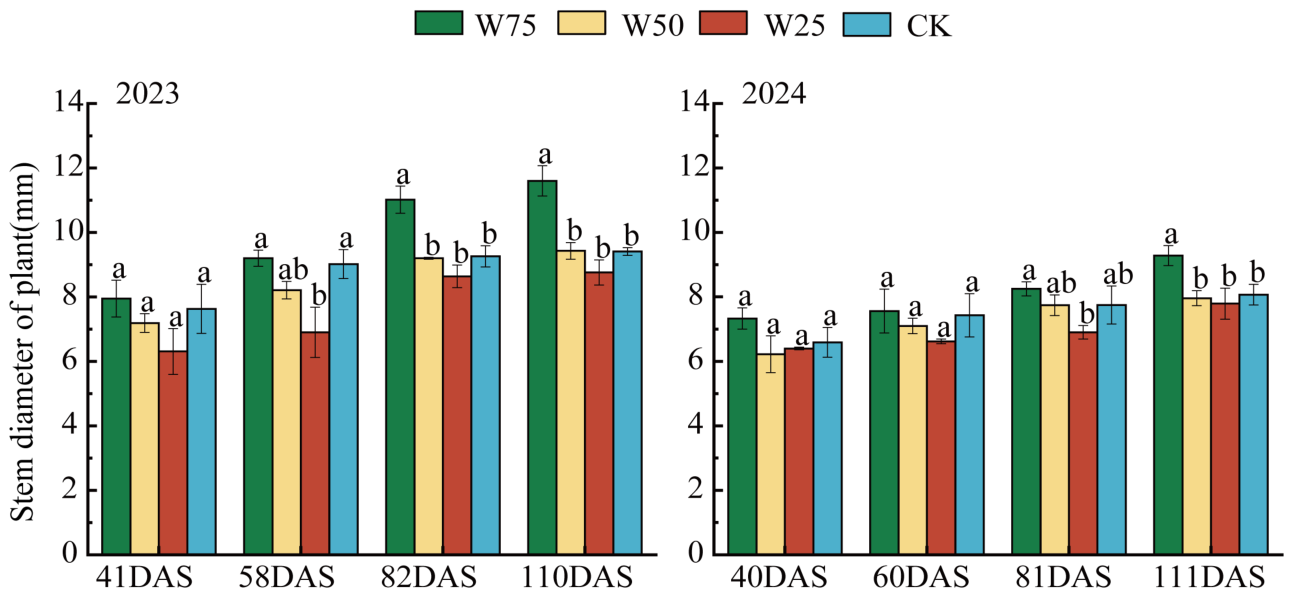
As shown in Figure 4, potato stem diameters increased progressively with increasing irrigation levels throughout the growing season in both experimental years. In 2023, stem diameters of the W75, W50, and CK treatments were significantly greater than those under the W25 treatment. Among these treatments, W75 exhibited the largest stem diameter (1.23 cm), although no significant differences were observed compared with CK and W50.
A similar trend was observed in 2024. At 40 DAS, the stem diameters under W75 and W50 were significantly greater than those under W25. As the growth period progressed from 60 to 81 DAS, W75 consistently produced larger stem diameters than the other treatments, reaching a maximum of 1.56 cm at 60 DAS. Even at 111 DAS, the stem diameters under W75 remained 0.15 cm greater than those under CK. These results indicated that a moderate reduction within an optimal range can promote stem diameter growth in potato plants.

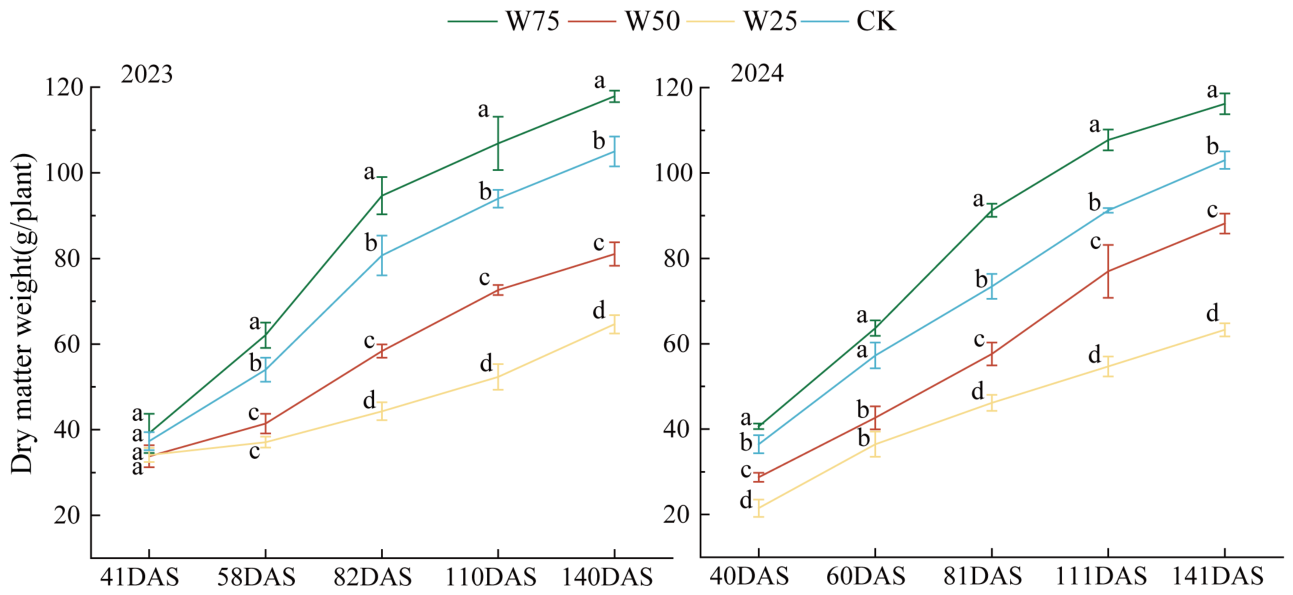
3.1.3. Effects of Reduced Irrigation on Dry Matter of Potato

As shown in Figure 5, dry matter accumulation per potato plant increased progressively throughout the growth period, peaking at maturity. In 2023, no significant differences among treatments were observed at 41 DAS. By 58 DAS, the W75 treatment had accumulated significantly more dry matter than the other treatments. At 82 DAS, significant differences were observed among all treatments, with W75 showing the most significant increase. This advantage for W75 continued, and by 110 DAS, its dry matter mass was 10.9% higher than that of CK. Ultimately, at 140 DAS, the dry matter accumulation in the W75 treatment was the highest among all treatments, exceeding CK by 12.2%. At maturity, the W50 and W25 treatments were significantly lower, with accumulation reaching only 77.2% and 37.5% of the CK level, respectively. A similar overall pattern was observed in 2024. The W75 treatment had the highest accumulation as early as 40 days after planting. By 141 DAS after planting, W75 again showed the highest value, surpassing CK by 11.3%, whereas that of the W50 and W25 treatments were significantly lower (16.8% and 62.8% below CK, respectively). By calculating the translocation rate of potato between the tuber bulking and maturity stages, we found that the translocation rate under the W75 treatment was higher than that under other treatments, increasing by 4.71–4.53% compared to CK (Table S1).

3.2. Effects of Reduced Irrigation on Physiological Characteristics of Potato

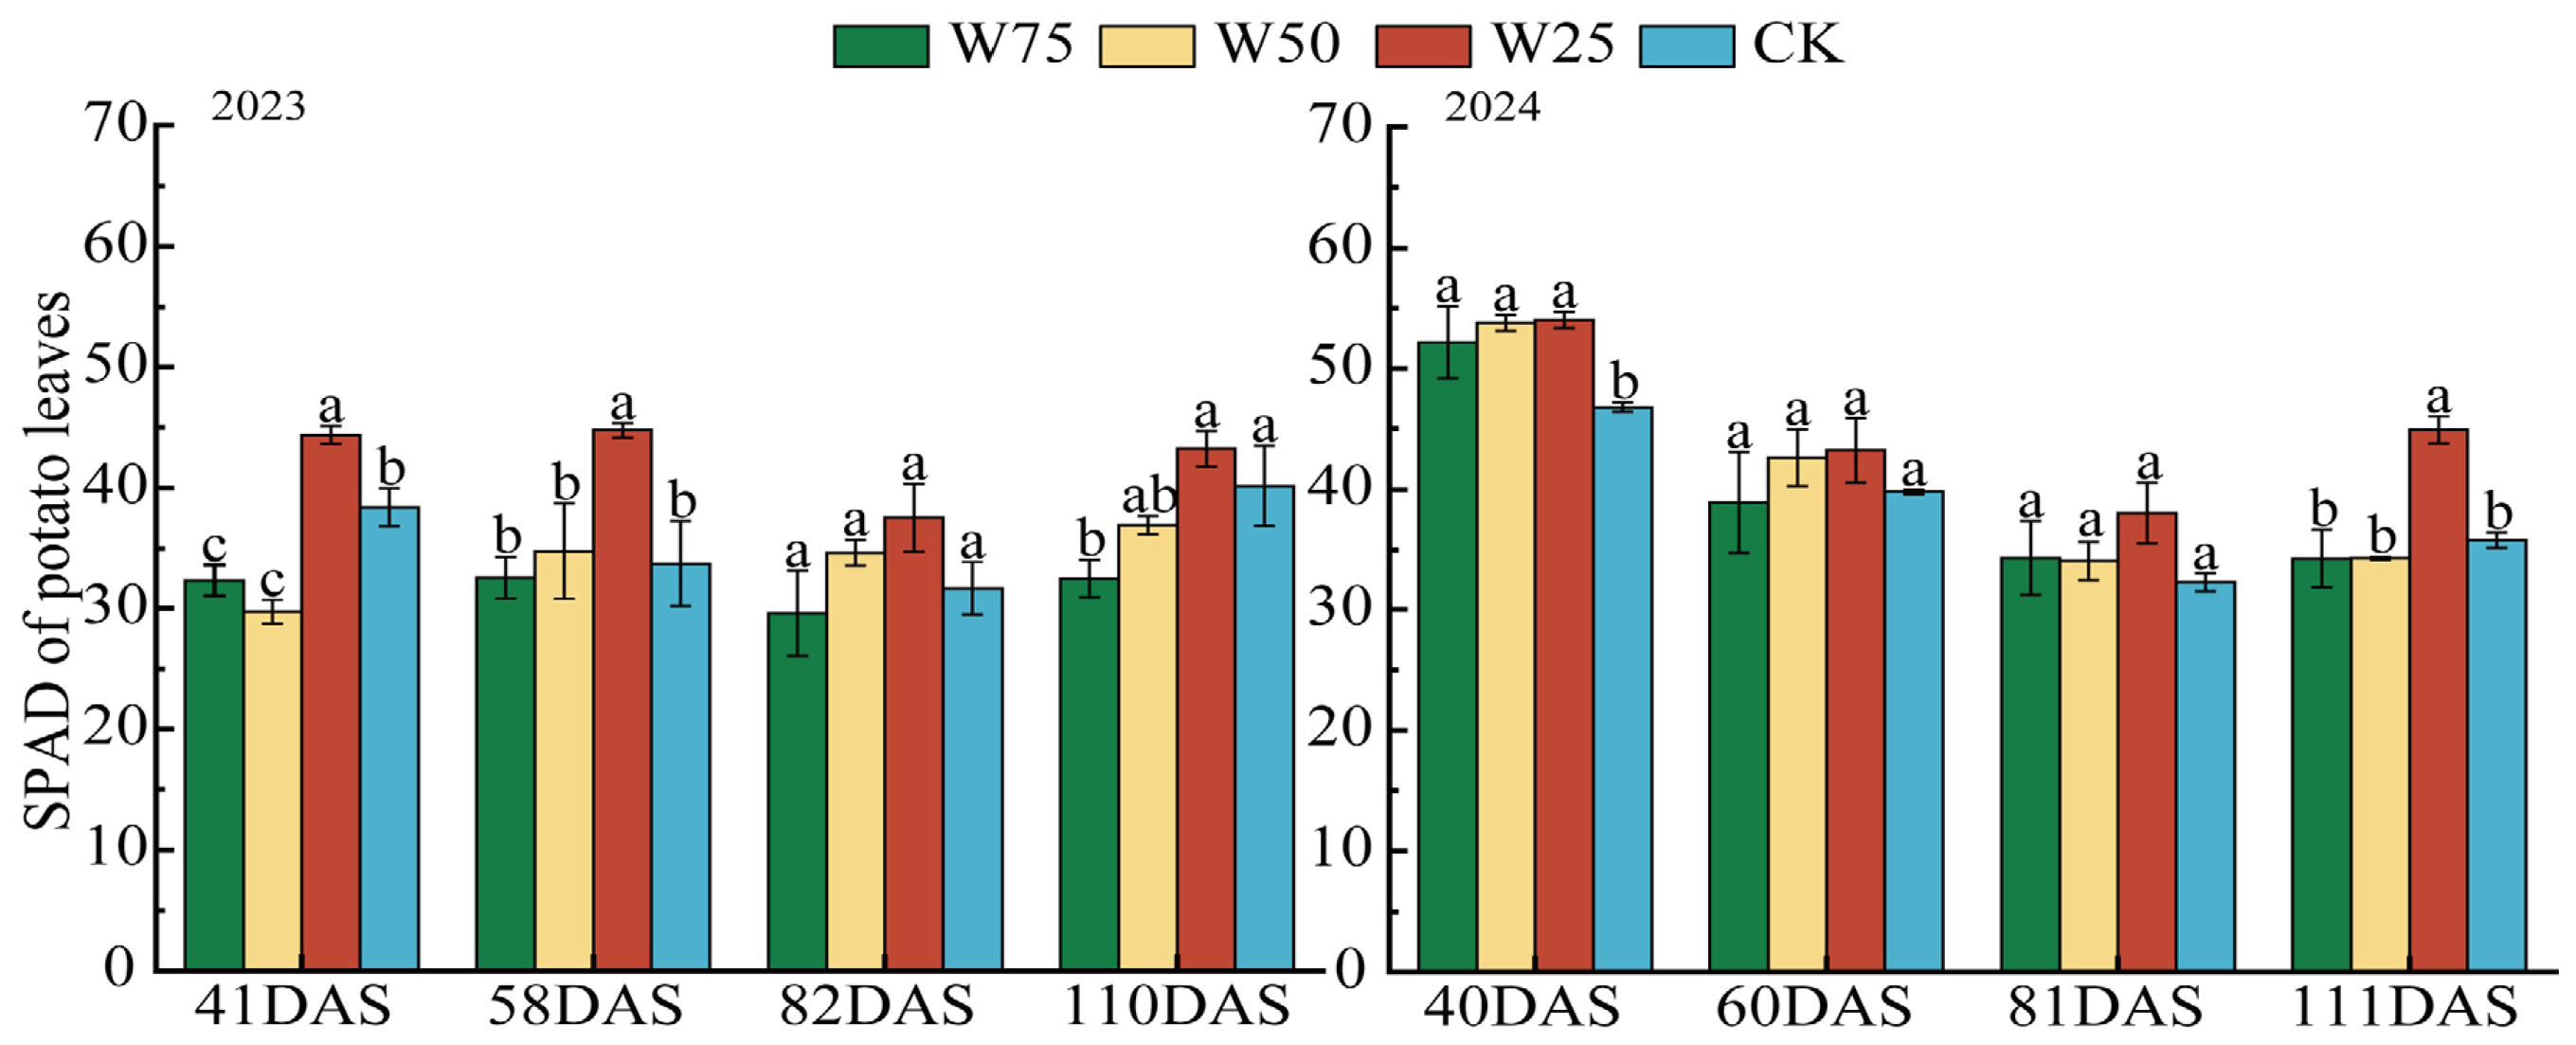
3.2.1. Effects of Reduced Irrigation on SPAD of Potato

As shown in Figure 6, at 40 DAS, the SPAD values in 2024 were generally higher than those in 2023, a difference that may be related to the environment. Specifically, 41–40 DAS after planting in 2023–2024, the SPAD value of the W25 treatment was 15.56–15.47% higher than that of the CK. At 58 DAS in 2023, the SPAD value of W25 treatment reached a maximum of 44.77, showing a significant 32.71% increase compared to the control (CK). In 2024, at 81 DAS, the SPAD value under W25 remained 17.82% higher than under CK. At 110–111 DAS in 2023–2024, the SPAD value of W25 treatment was 7.66–25.47% higher than that of CK. Throughout the entire growth period, SPAD values under W25 also differed markedly from those under W75 and W50, with consistently higher values under W25.

3.2.2. Effects of Reduced Irrigation on Photosynthetic Characteristics of Potato

Under different irrigation treatments, decreasing irrigation levels resulted in corresponding reductions in photosynthetic rate (Pn) and stomatal conductance (Gs) (Table 3). In contrast, intercellular CO2 concentration (Ci) initially decreased and then increased, whereas transpiration rate (Tr) first increased and then declined with decreasing irrigation. Stomatal limitation of photosynthesis (Ls) initially increased then decreased. At a light intensity of 850 μmol·m−2·s−1, the W75 treatment showed significantly higher Tr values than the W50 treatment. Relative to the CK, Pn decreased by 25.8–37.1% under W25, 50.3–55.4% under W50, and increased by 10.1–11.4% under W75. The Ls value of the W75 treatment was 5.7–21.4% higher than that of CK. Under 1500 μmol·m−2·s−1 light intensity, Pn values under W75 and CK were higher than those under W50, with Pn decreasing by 41.9–57.62% and 50.6–52.27%, respectively. There are differences in Ci under different treatments. The Ci values for the W75 and CK treatments ranged from 213.3 to 256.04 μmol·mol−1 and from 161.19 to 172.17 μmol·mol−1, respectively, and were significantly higher than those under the W50 and W25 treatments. Under different light intensities, the Ci of potato leaves showed a trend of first decreasing and then increasing with the increase in irrigation ratio. Moreover, for CK, W75, and W50 treatments, the change trends of Ci and Tr were the opposite. The Ls value of the W75 treatment was 11.1–1.7% higher than that of CK.

3.3. Effects of Reduced Irrigation on Yield and Composition of Potato

3.3.1. Effects of Reduced Irrigation on Potato Yield

Tuber yield declined consistently with decreasing irrigation amount in both 2023 and 2024 (Table 4). Yields under the CK and W75 treatments were significantly higher than those under the W50 and W25 treatments. The proportion of large tubers was highest under W75, followed by CK, W50, and W25, whereas the proportion of small tubers showed the opposite trend. Specifically, compared with W25, the W75 treatment reduced the proportion of small tubers. The proportion of medium-sized tubers ranged from 28.45% to 49.95% among treatments and reached the maximum under CK, although the differences among irrigation levels were not significant. In addition, there was no significant difference in tuber number per plant between the CK and W75 treatments, whereas the W75 treatment significantly increased tuber number per plant compared with the W50 and W25 treatments (0.77~1.23 and 2.1~2.57).

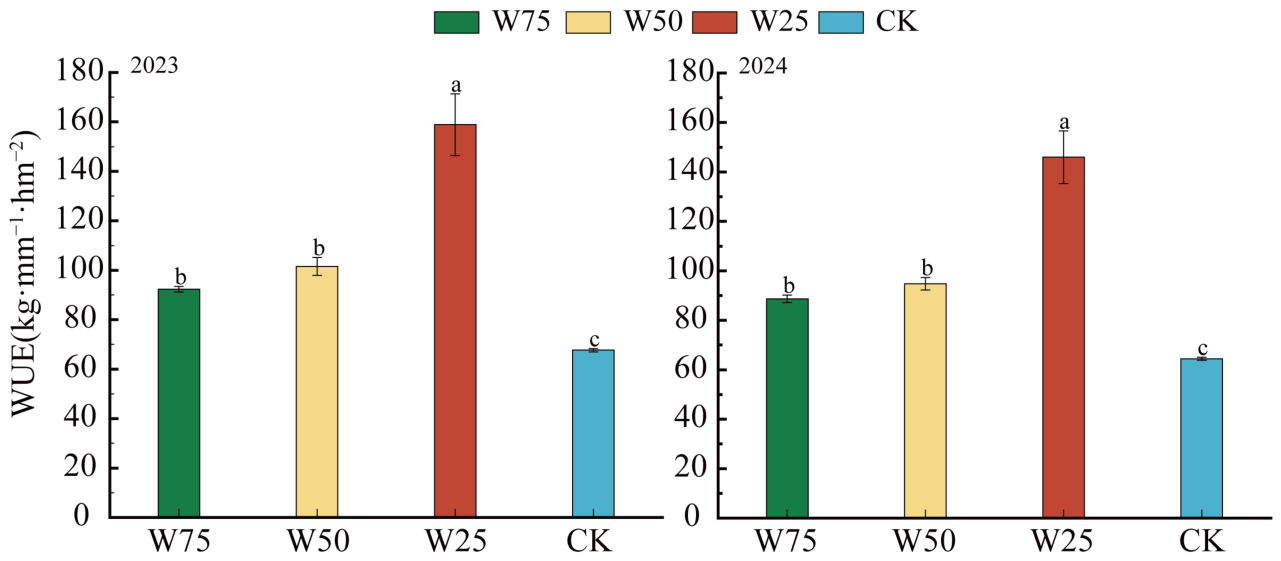
3.3.2. Effects of Reduced Irrigation on Water Use Efficiency of Potato

As shown in Figure 7, the results of two consecutive field experiments indicate that with the increase in irrigation water volume, the water use efficiencies of the three deficit-irrigation treatments were significantly higher than that of the control group (CK), increasing by 36.43–38.51%, 47.06–49.28%, and 124.91–129.4% respectively. Although the water use efficiency of the W25 treatment group was the highest, the tuber yield and the proportion of large tubers in the W25 treatment were significantly lower than those of the CK, decreasing by 46.15–49.57% (Table 4). In contrast, the W75 treatment maintained a high yield while improving water use efficiency. Considering both yield and water use efficiency, the W75 treatment is the “optimal” treatment option.

3.4. Correlation and PLS-SEM Analysis

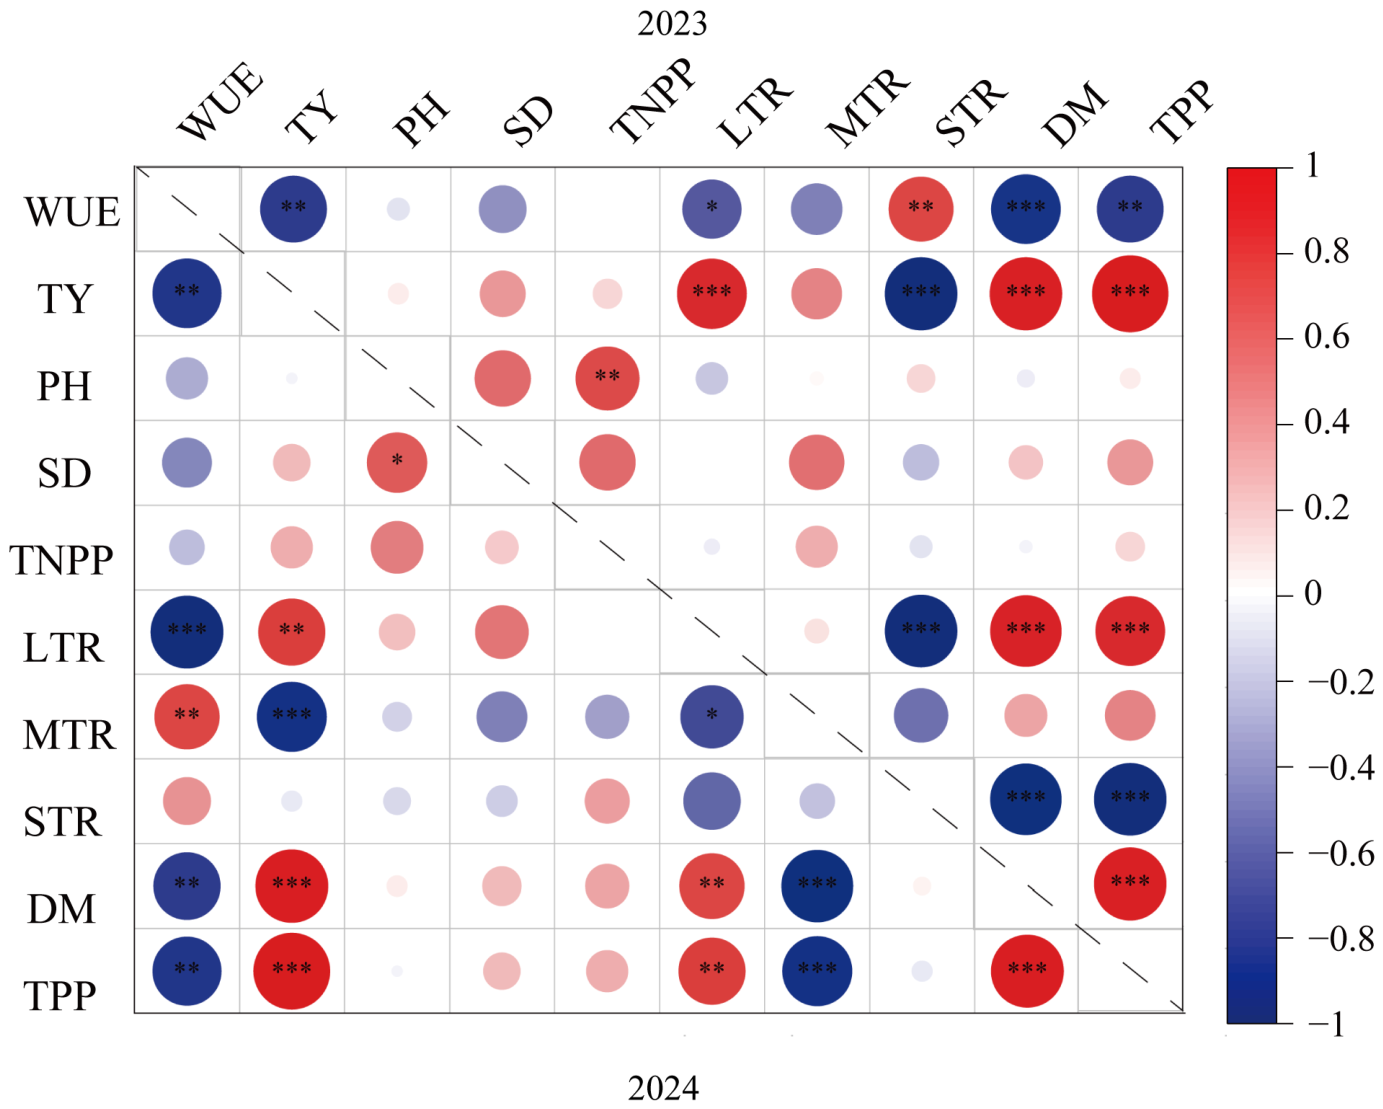
3.4.1. Correlation Analysis

As shown in Figure 8, in the experiments of 2023 and 2024, there was a significant positive correlation between the yield of individual tubers and the dry matter content. The proportion of small tubers was positively correlated with the tuber yield but negatively correlated with the tuber yield. Additionally, water use efficiency was negatively correlated with the dry matter content, and the dry matter content was also negatively correlated with the proportion of small tubers. Overall, under the experimental conditions of this study, there may be certain correlations among potato yield, dry matter accumulation, and the size distribution of tubers.

3.4.2. Regression Analysis

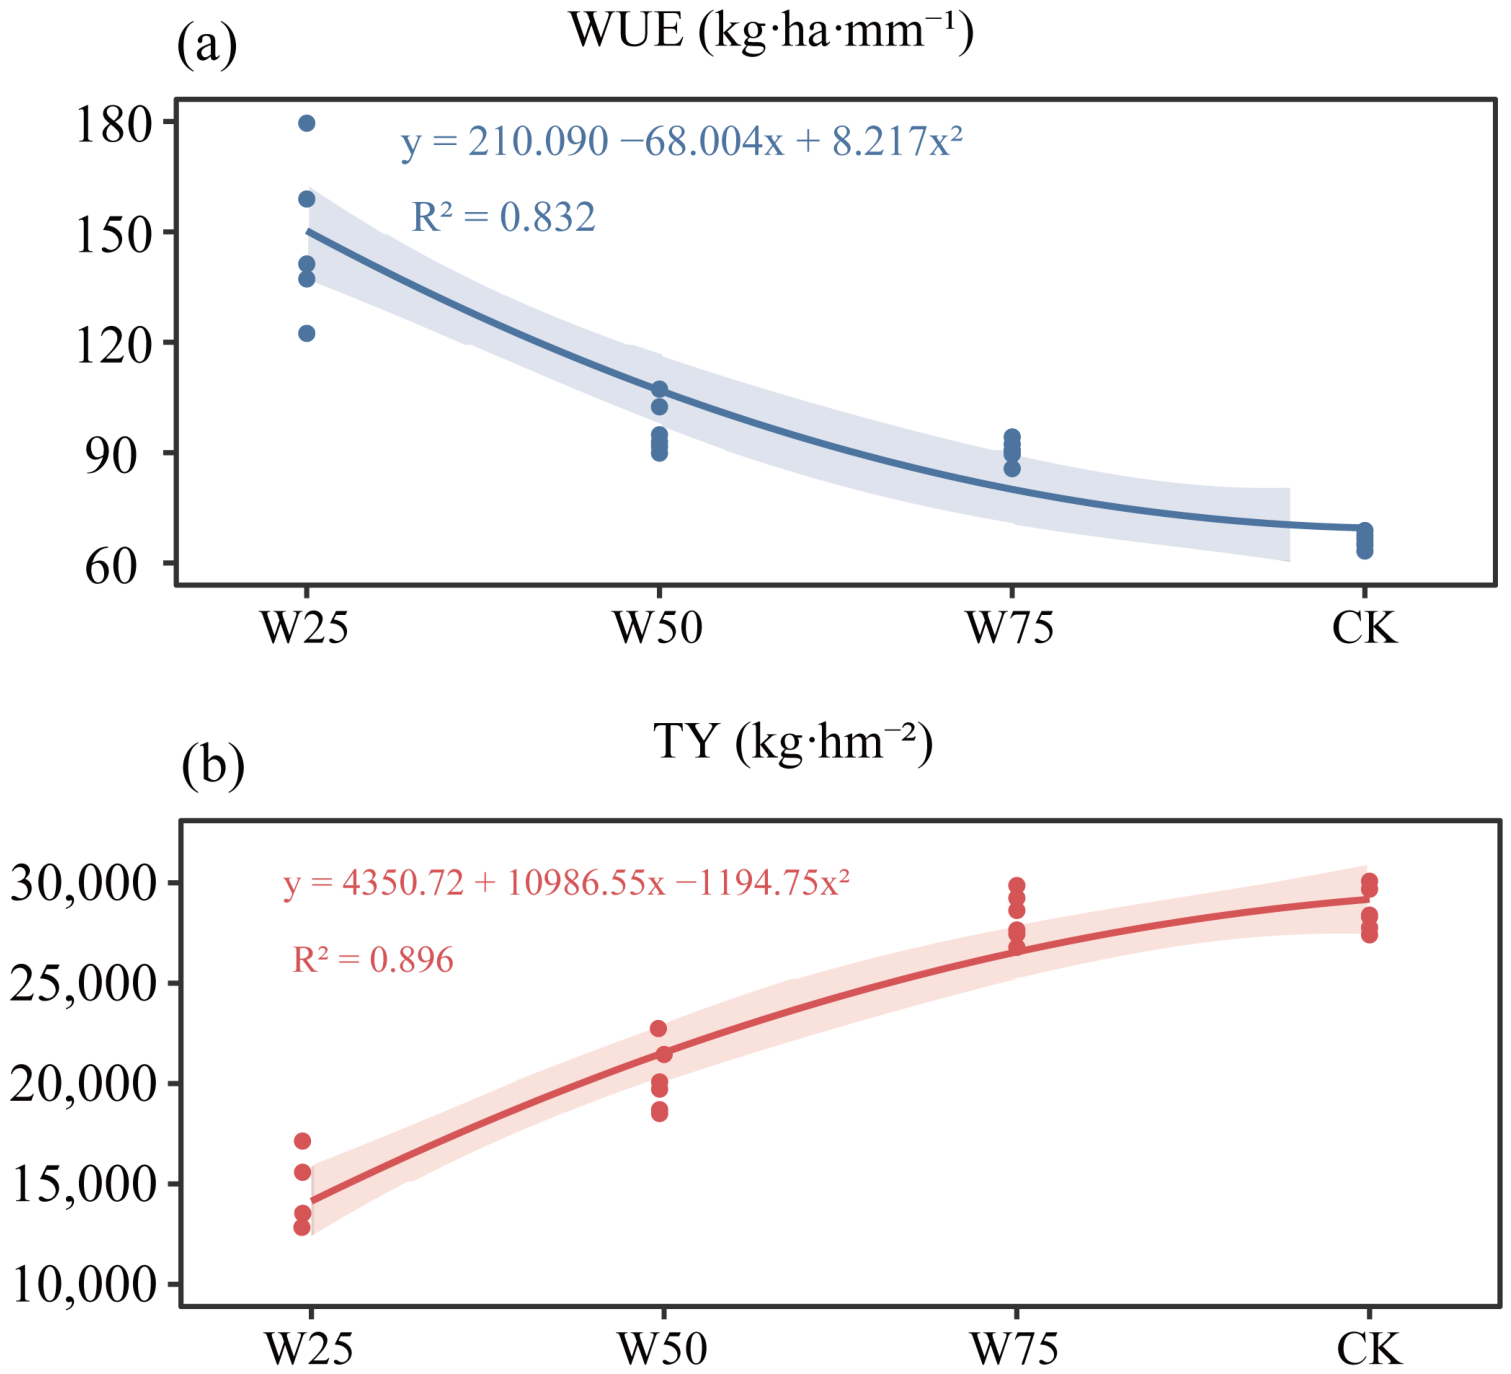
As shown in Figure 9, the regression analysis of the relationship between potato yield and water use efficiency indicates that as the irrigation water volume increases, the WUE of potatoes shows a continuously decreasing trend (WUE: R2 = 0.831), and the yield of potatoes shows a trend of first increasing and then decreasing (TY: R2 = 0.896). The W75 treatment only shows potential advantages in coordinating yield and WUE, and its reliability needs to be further verified through subsequent experiments.

3.4.3. PLS-SEM Analysis

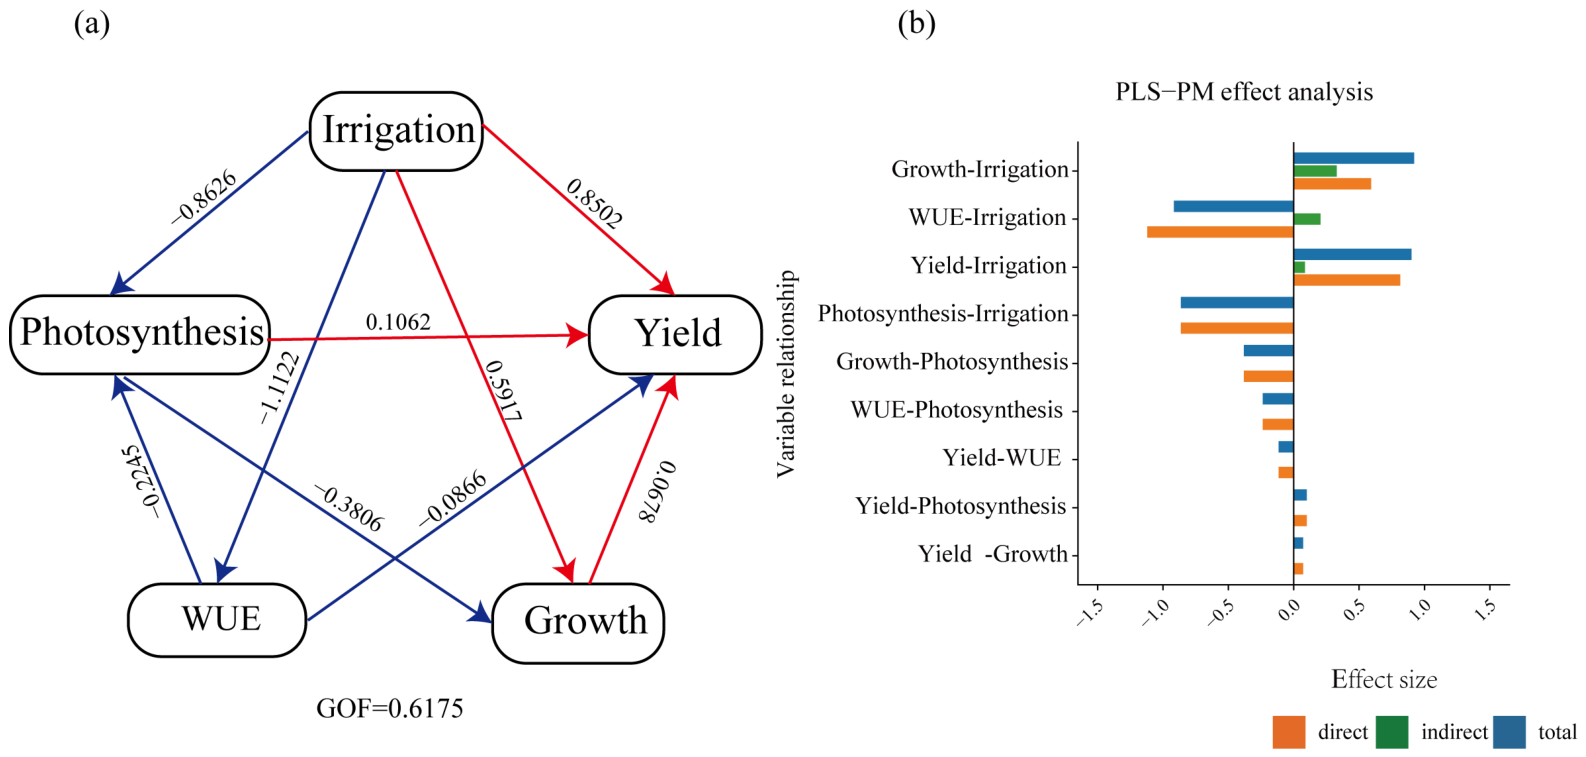
To explore the interrelationships among the various variables, this study employed the PLS-SEM. The five latent variables, irrigation amount, photosynthetic characteristics, water use efficiency (WUE), growth traits, and tuber yield, were analyzed using the PLSM method. The measurement model evaluation shows that the standardized loadings of the observed variables range from 0.792 to 0.994, and the composite reliability (CR) is all greater than 0.7. The average variance extracted (AVE) is greater than 0.5 except for growth traits (0.468). The structural model evaluation shows that the variance inflation factors (VIFs) of the endogenous latent variables are all below 3.0, and the R2 values are 0.243 for photosynthetic characteristics, 0.572 for WUE, 0.102 for growth traits, and 0.864 for tuber yield. The model goodness-of-fit (GOF) is 0.6175 (>0.6). The path analysis results show that irrigation amount has a significant negative impact on photosynthetic characteristics, and the direct effects on WUE, growth traits, and yield are not significant (p > 0.05, p > 0.05); photosynthetic characteristics have a positive impact on yield; WUE has a negative impact on photosynthetic characteristics and yield; from the standardized effect perspective, plant height, stem diameter, and tuber dry matter accumulation have a positive contribution to yield, while net photosynthetic rate has a negative total effect on yield. The standardized path coefficients are shown in Figure 10.

4. Discussion

4.1. Effects of Reduced Irrigation on Growth Characteristics of Potato

Plant height, stem diameter, and dry matter accumulation are key indicators of potato growth and development [22]. As the irrigation amount decreased, plant height, stem diameter, and aboveground dry matter accumulation were progressively inhibited. This response may be attributed to water deficit impairing root activity, thereby limiting the plant’s capacity for water and nutrient uptake [23]. As the main conduit for water and nutrient transport and a primary structural support, the stem plays a critical role in plant growth, and the influence of water availability on these traits generally intensified as the growth period progressed [24]. Plant height exhibited particular sensitivity to changes in irrigation amount. With decreasing irrigation ratio, the rate of height increase slowed significantly. The difference in plant height compared to the control (CK) gradually widened over the growth period. Under severe water deficit, plant height was the lowest and differed significantly from CK (p < 0.05). Stem diameter, which functions as both a central transport pathway and a structural support, also showed inhibited growth under reduced irrigation. This response is likely associated with water deficit restricting processes of cell division and elongation [25], and its trend closely paralleled that of plant height. Aboveground dry matter accumulation was substantially influenced by water regulation, increasing throughout the growth cycle and peaking at maturity. A moderate reduction in irrigation (W75 treatment) seems to have promoted the accumulation of dry matter during the later growth stage. Previous studies have shown that a well-coordinated source–sink relationship is the basis for high crop yields [26]. By calculating the transport rate of potatoes between the tuber expansion period and the maturity period, we found that the transport rate under the W75 treatment was higher than that of other treatments, and it was 4.71–4.53% higher than the control group (CK). CK may have expanded the source pool, but it reduced the allocation ratio to the sink pool and the root–stem ratio. Moderate water deficit irrigation (W75 treatment) appropriately optimized the source–sink balance. These research results on the optimization of the source–sink-flow dynamics of potatoes under the W75 treatment are consistent with the observations of Zhou M et al. [27], where a 75% ETc irrigation regime may significantly enhance the allocation of photosynthetic products to the storage roots, thereby achieving a source–sink balance and maximizing yield. In contrast, the CK treatment may have received excessive irrigation. For example, data from 2023 showed that the dry matter under the W75 treatment reached 117.2% of the control group. Severe water deficit (W25 treatment) led to a significant reduction in dry matter accumulation. The research results indicate that the impact of reduced irrigation on the growth traits of potatoes has a dual mechanism: moderate water supply reduction can coordinate root system function and promote the accumulation of assimilates in the later stage, while excessive water deficit continuously inhibits the overall development of the plant.

4.2. Effects of Reduced Irrigation on Physiological Characteristics of Potato

Leaf photosynthetic capacity is a fundamental determinant of crop carbon assimilation, and its response to water availability directly influences plant growth and yield formation [28]. Chlorophyll, as the primary plant photosynthetic pigment, plays a central role in capturing, transferring, and converting light energy [29]. Consequently, variations in chlorophyll content and leaf photosynthetic parameters serve as sensitive indicators of plant physiological status and senescence, providing valuable insight into crop development and productivity [30]. As irrigation amount decreased, Pn and Gs showed a gradual decline, whereas Ci and Tr exhibited an initial decrease followed by an increase. In contrast, Ci and Tr initially declined, then increased. Zhang et al. [31] reported that drought stress reduced net Pn while increasing Ci. In contrast, the present study showed that plants under W75 (75% of the CK irrigation amount) maintained relatively higher Pn and Ci, indicating improved photosynthetic performance under moderate irrigation reduction. Similarly, Mora-Sanhueza et al. found that Pn and Gs were significantly reduced under severe water deficit treatments (50% and 30% of full irrigation) [12]. Consistent with these findings, Pn and Gs under W50 (50% of the CK irrigation amount) in this study were significantly lower than those under W75 (75% of the CK irrigation amount) and the CK, whereas Tr was significantly higher. These results suggest that W50 (50% of the CK irrigation amount) imposed substantial water deficit, resulting in reduced photosynthetic activity. Water deficit can alter crop physiological traits, restrict gas exchange, and thus reduce photosynthesis [32]. In general, the reduction in photosynthetic rate is jointly regulated by stomatal and non-stomatal limitations [33]. In the present study, as the irrigation amount decreased, the stomatal limitation value (Ls) gradually increased, indicating that stomatal closure became stronger under water deficit. This response helps reduce water loss and relieve leaf water deficit. However, it also limits CO2 diffusion into the leaf, decreasing intercellular CO2 concentration (Ci) and, consequently, net photosynthetic rate (Pn). However, when the irrigation amount decreased further, below the level of the W50 treatment, Ls decreased while Ci increased. This pattern suggests that the main limitation to photosynthesis was no longer stomatal closure, but non-stomatal factors, such as damage to the photosynthetic apparatus or reduced biochemical activity. Previous studies have reported that potato leaves may show a non-functional stay-green phenomenon under drought stress [34]. Under such conditions, leaf expansion is inhibited, and chlorophyll concentration per unit leaf area may remain high or even increase, resulting in higher SPAD values. In our study, although SPAD values were highest under W25, yield was lowest under this treatment. This suggests that severe water deficit may have maintained leaf greenness while limiting photosynthetic activity and the supply of assimilates to tubers. In contrast, W75 maintained relatively stable SPAD values and supported improved photosynthetic performance and yield.

4.3. Effects of Different Irrigation Ratio on Potato Yield

The number of tubers per plant, tuber yield, and proportion of marketable tubers are key indicators of potato productivity [35]. Potato yield is significantly influenced by irrigation water amount. Niu Y et al. [36] reported that insufficient irrigation can reduce potato yield by approximately 25%, findings consistent with the present study, in which the W50 and W25 treatments resulted in substantial yield reductions. In contrast, optimal irrigation significantly enhanced yield: under the W75 treatment, tuber yield increased by 5.3% in 2023 and 7.5% in 2024, whereas yield declined sharply by 46.0% and 52.4% under the W50 and W25 treatments, respectively. These results confirm that appropriate irrigation amount plays a critical role in yield improvement, in agreement with the findings of Tang et al. [37], who reported that potato yield increases with irrigation water amount. However, the marginal benefit diminishes at higher levels.
Variations in potato yield were closely associated with changes in tuber number per plant. In the present study, the W75 (75% of the CK irrigation amount) produced more tubers per plant than the control (CK), while further reductions in irrigation amount significantly decreased tuber number by 8.2–13.4% under W50 (50% of the CK irrigation amount) and by 28.8–34.2% under W25 (25% of the CK irrigation amount). This decline is likely attributable to water deficit, which impairs tuber initiation and development, ultimately reducing total yield. Similar trends were reported by Badr MA et al. [38], who observed yield reductions of 25.7% and 42.7% following reductions of 40% and 60% in water supply, respectively.
Irrigation level also markedly affected the distribution of tuber sizes. Under the W75 treatment, the proportion of large and medium tubers were highest, while the proportion of small tubers was the lowest. In contrast, severe water deficit under W25 significantly increased the proportion of small tubers, reaching 33.47% in 2023 and 61.29% in 2024, accompanied by a pronounced decline in large tubers. These results indicate that severe water deficit not only reduces tuber number but also restricts tuber enlargement and dry matter accumulation. Overall, moderate irrigation can optimize the balance between water conservation and yield formation by maintaining tuber number and improving tuber size distribution. In contrast, excessive water restriction markedly compromises yield and quality. Collectively, these findings suggest that the W75 treatment (75% of the CK irrigation amount) represents a suitable irrigation strategy for achieving coordinated yield maintenance and water conservation in the arid and semi-arid regions of Northwest China.

4.4. Effects of Reduced Irrigation on Water Use Efficiency of Potato

WUE is a key indicator for evaluating the coordinated achievement of water conservation and yield maintenance in crop production. In the context of increasing water scarcity and intensifying supply–demand conflicts in the arid and semi-arid regions of Northwest China, improving crop WUE has become a critical pathway to enhance irrigation efficiency and promote the sustainable development of the potato industry [39]. Previous studies have shown that although total water consumption during the potato growing season increases with increasing irrigation, WUE typically exhibits a unimodal response, initially increasing and then gradually declining [40]. Accordingly, moderate reductions in irrigation have, therefore, been reported to improve WUE without causing substantial yield penalties [41]. Consistent with these findings, data from 2023 to 2024 showed that WUE under the W75 treatment increased significantly by 36.43–38.51% compared with the CK. Similar results have been reported under drip irrigation with plastic mulch conditions [42], suggesting the existence of an optimal irrigation range in which crop WUE is optimized In the present study, the relatively high water use efficiency observed under the W75 treatment may be attributed to reduced non-productive water losses. Camargo et al. [43] reported significant interannual differences in water use efficiency (WUE) in a two-year field experiment, with WUE in 2011 being 38.88% higher than that in 2012. This difference was likely attributable to the open-field experimental conditions, in which rainfall variability can strongly influence WUE. In the present study, experiments were conducted under a field rain shelter, and the WUE difference between 2023 and 2024 was relatively small (4.92%), thereby minimizing the confounding effects of rainfall. Overall, these results indicated that WUE was primarily influenced by irrigation amount and rainfall. In contrast, other environmental factors. Previous studies have shown that within a certain range, water use efficiency (WUE) increases progressively as irrigation volume decreases [44]. In this study, although W25 showed the highest WUE, its yield was significantly lower than that of the other treatments. These results indicated that the increase in WUE under severe deficit irrigation was achieved at the cost of substantial yield loss [45]. Therefore, the highest WUE observed under W25 should not be interpreted as the most efficient production strategy. In practical production, irrigation management should aim to achieve a balance between yield and water saving, rather than optimizing WUE alone. Compared with W25 and W50, the W75 treatment maintained a relatively high yield while also improving WUE, indicating better coordination between productivity and water use.
However, this study still has some limitations. The experiment was conducted under specific soil and climatic conditions and included only a limited number of cultivars, so the response to deficit irrigation may differ among genotypes. In particular, early- and late-maturing cultivars may vary in their sensitivity to water deficit and in their suitable irrigation levels. In addition, whether W75 is suitable for other potato production systems or other tuber crops remains to be further studied. Therefore, future research should include multi-year, multi-site, and multi-cultivar experiments to improve reliability and wider use of this irrigation recommendation.

4.5. The Feasibility of This Study

This experiment was conducted under rain shelters in the arid and semi-arid regions of Northwest China. The research data showed that the W75 irrigation scheme had the same yield as the control group (CK), but the water use efficiency increased by 36.43% to 38.51%. Although the WUE of the W25 scheme was the highest, its yield was relatively lower. Therefore, the W75 scheme performed better in terms of yield and water-saving effect and could be used as a reference irrigation level for potato production in similar environments. Its practical application requires drip irrigation conditions and adjustment of the implementation parameters of the W75 scheme according to the local soil texture, field water holding capacity, and precipitation conditions. It is recommended to establish an irrigation threshold based on soil moisture using soil moisture sensors or tension gauges, and make dynamic corrections based on real-time meteorological data. The W75 scheme has good application potential, but only the ‘Gan Yin 9’ variety was used for the experiment under this condition, and it has not been verified through years of multi-site experiments. Therefore, it cannot be widely used in actual production. In the future, multi-year, multi-site field experiments in different soil types and large-scale fields should be conducted to evaluate the stability of the W75 scheme in different regions by using different varieties and simulating natural rainfall interference conditions, thereby verifying its applicability in open-air environments and large-scale production scenarios, and improving the reliability of its practical application.

5. Conclusions

Under drip irrigation with plastic mulching in the arid and semi-arid regions of Northwest China, the W75 treatment, which applied 75% of the irrigation amount used in the control (with the control maintained at 75–85% field water capacity, FWC), promoted potato growth, enhanced leaf photosynthetic capacity, and increased dry matter accumulation. Across two growing seasons, W75 maintained tuber yield at a level comparable to the control and water use efficiency increased by 36.43–38.51% relative to the control. These results indicate that a 25% reduction in irrigation amount can maintain stable potato yield while significantly improving water use efficiency. The selection of W75 as the recommended treatment is based on the dual objective of yield stability and water use efficiency optimization; while further reductions in irrigation (e.g., W25) achieved higher water use efficiency, they compromised yield stability, making W75 the preferable balance for practical application in water-limited regions. These results indicated that a 25% reduction in irrigation amount markedly improved water use efficiency while maintaining stable potato yield, providing a theoretical basis for optimizing water-saving irrigation management in water-limited regions of Northwest China.

Supplementary Materials

The following supporting information can be downloaded at: https://www.mdpi.com/article/10.3390/agronomy16090866/s1, Figure S1: Location map of the test area; Table S1: Dry matter weight and transport efficiency in different organs of potato at the maturity stage and tuber bulking stage.

Author Contributions

Conceptualization, Z.L. (Zhen Liu) and Y.L. (Yuhui Liu); methodology, P.C., J.Z. and Y.L. (Yuhui Liu); software, P.C., Z.L. (Zhitao Li) and Z.L. (Zhen Liu); validation, J.Z., Z.L. (Zhitao Li), Y.L. (Yuhui Liu) and Z.L. (Zhen Liu); formal analysis, P.Y., Z.B. and Y.L. (Yuanming Li).; investigation, X.Q., M.B., P.Y., Z.B. and Y.L. (Yuanming Li); resources, Z.L. (Zhen Liu) and Y.L. (Yuhui Liu); data curation, X.Q. and M.B.; writing—original draft preparation, P.C.; writing—review and editing, P.C. and Z.L. (Zhen Liu); visualization, P.C. and Z.L. (Zhen Liu); supervision, Y.L. (Yuhui Liu); project administration, Z.L. (Zhen Liu) and Y.L. (Yuhui Liu); funding acquisition, Z.L. (Zhen Liu) and Y.L. (Yuhui Liu). All authors have read and agreed to the published version of the manuscript.

Funding

This study was supported by the Key Research and Development Program of Gansu Province (26YFNA030). The Research Program was sponsored by the Seed Industry Tackling Key Problems Project (ZYGG-2026-8), the National Natural Science Foundation Project (32460489), the Joint Research Fund Major Project of Gansu Province (24JRRA836), the University–Industry Support Program (2024CYZC-29), the Earmarked Fund for China Agriculture Research System (CARS-09-P14), and the Fuxi Talent Project of Gansu Agricultural University (Gaufx-02Y04).

Institutional Review Board Statement

Not applicable. This study did not involve human or animal tissue.

Informed Consent Statement

Not applicable. This study does not involve any individual person.

Data Availability Statement

The original contributions presented in this study are included in the article. Further inquiries can be directed to the corresponding authors.

Conflicts of Interest

The authors declare no conflicts of interest regarding the publication of this paper.

References

  1. Barillot, C.D.; Sarde, C.-O.; Bert, V.; Tarnaud, E.; Cochet, N. A standardized method for the sampling of rhizosphere and rhizoplan soil bacteria associated to a herbaceous root system. Ann. Microbiol. 2013, 63, 471–476. [Google Scholar] [CrossRef]
  2. Gan, Y.; Siddique, K.H.; Turner, N.C.; Li, X.-G.; Niu, J.-Y.; Yang, C.; Liu, L.; Chai, Q. Ridge-furrow mulching systems—An innovative technique for boosting crop productivity in semiarid rain-fed environments. Adv. Agron. 2013, 118, 429–476. [Google Scholar] [CrossRef]
  3. Wang, Z.; Yu, S.; Zhang, H.; Lei, L.; Liang, C.; Chen, L.; Su, D.; Li, X. Deficit mulched drip irrigation improves yield, quality, and water use efficiency of watermelon in a desert oasis region. Agric. Water Manag. 2023, 277, 108103. [Google Scholar] [CrossRef]
  4. Wang, F.-X.; Wu, X.-X.; Shock, C.C.; Chu, L.-Y.; Gu, X.-X.; Xue, X. Effects of drip irrigation regimes on potato tuber yield and quality under plastic mulch in arid Northwestern China. Field Crops Res. 2011, 122, 78–84. [Google Scholar] [CrossRef]
  5. He, F.; Tian, M.-B.; Duan, W.-P.; Yang, W.-M.; Mao, X.; Wang, J.; Duan, C.-Q. Effects of Inner-Row Ground Management on the Volatomics of ‘Cabernet Sauvignon’ Grapes and Wines in the Region of the Eastern Foothills of the Ningxia Helan Mountains in Northwest China. Foods 2023, 12, 2472. [Google Scholar] [CrossRef] [PubMed]
  6. Ramos, T.B.; Darouich, H.; Pereira, L.S. Mulching effects on soil evaporation, crop evapotranspiration and crop coefficients: A review aimed at improved irrigation management. Irrig. Sci. 2024, 42, 525–539. [Google Scholar] [CrossRef]
  7. Du, K.; Yang, X.; Deng, Z.; Lin, X.; Hu, M.; Jiang, R.; Zheng, G.; Yi, X.; Liu, X.; Lyu, C.; et al. Integrated plastic film and straw mulching enhances potato tuber yield in mountainous regions by optimizing rhizospheric metabolites and root–microbe interactions. Field Crops Res. 2026, 339, 110364. [Google Scholar] [CrossRef]
  8. Zhang, Y.-L.; Wang, F.-X.; Shock, C.C.; Yang, K.-J.; Kang, S.-Z.; Qin, J.-T.; Li, S.-E. Effects of plastic mulch on the radiative and thermal conditions and potato growth under drip irrigation in arid Northwest China. Soil Tillage Res. 2017, 172, 1–11. [Google Scholar] [CrossRef]
  9. Liu, Y.; Li, Z.; Li, Y.; Liu, Z.; Chen, F.; Bi, Z.; Sun, C.; Tang, C.; Yao, P.; Yuan, A.; et al. Impact of extended dryland crop rotation on sustained potato cultivation in Northwestern China. Resour. Conserv. Recycl. 2023, 197, 107114. [Google Scholar] [CrossRef]
  10. Ju, Z.; Li, D.; Cui, Y.; Sun, D. Optimizing the water and nitrogen management scheme to enhance potato yield and water–nitrogen use efficiency. Agronomy 2024, 14, 1651. [Google Scholar] [CrossRef]
  11. Ayars, J.; Phene, C.; Hutmacher, R.; Davis, K.; Schoneman, R.; Vail, S.; Mead, R. Subsurface drip irrigation of row crops: A review of 15 years of research at the Water Management Research Laboratory. Agric. Water Manag. 1999, 42, 1–27. [Google Scholar] [CrossRef]
  12. Mora-Sanhueza, R.; Tighe-Neira, R.; López-Olivari, R.; Inostroza-Blancheteau, C. Assessment of Different Irrigation Thresholds to Optimize the Water Use Efficiency and Yield of Potato (Solanum tuberosum L.) Under Field Conditions. Plants 2025, 14, 1734. [Google Scholar] [CrossRef] [PubMed]
  13. Yang, Y.; Zhao, H.; Tang, G.; Huang, X.; Wang, H. Effects of soil moisture threshold on photosynthetic physiological parameters of potato leaves in semi-arid region. Chin. J. Ecol. 2023, 42, 2622–2629. (In Chinese) [Google Scholar] [CrossRef]
  14. Niu, Y.; Zhang, K.; Khan, K.S.; Fudjoe, S.K.; Li, L.; Wang, L.; Luo, Z. Deficit Irrigation as an Effective Way to Increase Potato Water Use Efficiency in Northern China: A Meta-Analysis. Agronomy 2024, 14, 1533. [Google Scholar] [CrossRef]
  15. Gebremariam, H.L.; Welde, K.; Kahsay, K.D. Optimizing yield and water use efficiency of furrow-irrigated potato under different depth of irrigation water levels. Sustain. Water Resour. Manag. 2018, 4, 1043–1049. [Google Scholar] [CrossRef]
  16. Zhang, Y.; Feng, S.; Wang, F.; Feng, R.; Nie, W. Effects of drip discharge flux and soil wetted percentage on drip irrigated potato growth with film mulch. Agric. Water Manag. 2022, 272, 107847. [Google Scholar] [CrossRef]
  17. Phene, C.J.; Sanders, D.C. High-frequency Trickle Irrigation and Row Spacing Effects on Yield and Quality of Potatoes. Agron. J. 1976, 68, 602–607. [Google Scholar] [CrossRef]
  18. Mugo, J.N.; Karanja, N.N.; Gachene, C.K.; Dittert, K.; Nyawade, S.O.; Schulte-Geldermann, E. Assessment of soil fertility and potato crop nutrient status in central and eastern highlands of Kenya. Sci. Rep. 2020, 10, 7779. [Google Scholar] [CrossRef]
  19. Xiao, L.; Wang, Y.; Zhang, C.; Zhao, K.; Zhao, R.; Xie, Z. Crop rotation enhances yield and water productivity: Uncovering potential drivers through global field experiment synthesis. Agric. Water Manag. 2025, 317, 109644. [Google Scholar] [CrossRef]
  20. Ali, M.H.; Hoque, M.R.; Hassan, A.A.; Khair, A. Effects of deficit irrigation on yield, water productivity, and economic returns of wheat. Agric. Water Manag. 2007, 92, 151–161. [Google Scholar] [CrossRef]
  21. Liu, X.; Liu, J.; Huang, C.; Liu, H.; Meng, Y.; Chen, H.; Ma, S.; Liu, Z. The impacts of irrigation methods and regimes on the water and nitrogen utilization efficiency in subsoiling wheat fields. Agric. Water Manag. 2024, 295, 108765. [Google Scholar] [CrossRef]
  22. Wagg, C.; Hann, S.; Kupriyanovich, Y.; Li, S. Timing of short period water stress determines potato plant growth, yield and tuber quality. Agric. Water Manag. 2021, 247, 106731. [Google Scholar] [CrossRef]
  23. Feng, X.; Li, C.; He, F.; Xu, Y.; Li, L.; Wang, X.; Chen, Q.; Li, F. Genome-Wide Identification of Expansin Genes in Wild Soybean (Glycine soja) and Functional Characterization of Expansin B1 (GsEXPB1) in Soybean Hair Root. Int. J. Mol. Sci. 2022, 23, 5407. [Google Scholar] [CrossRef]
  24. Zhou, S.; Han, Y.-y.; Chen, Y.; Kong, X.; Wang, W. The involvement of expansins in response to water stress during leaf development in wheat. J. Plant Physiol. 2015, 183, 64–74. [Google Scholar] [CrossRef]
  25. Schuppler, U.; He, P.; John, P.; Munns, R. Effect of water stress on cell division and Cdc2-like cell cycle kinase activity in wheat leaves. Plant Physiol. 1998, 117, 667–678, Erratum in Plant Physiol. 1998, 117, 1528. [Google Scholar] [CrossRef] [PubMed]
  26. Liu, Z.; Gao, F.; Li, X.; Zhang, J. Source-sink coordinated peanut cultivar increases yield and kernel protein content through enhancing photosynthetic characteristics and regulating carbon and nitrogen metabolisms. Plant Physiol. Biochem. 2024, 206, 108311. [Google Scholar] [CrossRef]
  27. Zhou, M.; Sun, Y.; Wang, S.; Liu, Q.; Li, H. Photosynthesis Product Allocation and Yield in Sweet Potato in Response to Different Late-Season Irrigation Levels. Plants 2023, 12, 1780. [Google Scholar] [CrossRef]
  28. Garcia, A.; Gaju, O.; Bowerman, A.F.; Buck, S.A.; Evans, J.R.; Furbank, R.T.; Gilliham, M.; Millar, A.H.; Pogson, B.J.; Reynolds, M.P. Enhancing crop yields through improvements in the efficiency of photosynthesis and respiration. New Phytol. 2023, 237, 60–77. [Google Scholar] [CrossRef]
  29. Al-Gaadi, K.A.; Tola, E.; Madugundu, R.; Zeyada, A.M.; Alameen, A.A.; Edrris, M.K.; Edrees, H.F.; Mahjoop, O. Response of leaf photosynthesis, chlorophyll content and yield of hydroponic tomatoes to different water salinity levels. PLoS ONE 2024, 19, e0293098. [Google Scholar] [CrossRef] [PubMed]
  30. Slattery, R.A.; VanLoocke, A.; Bernacchi, C.J.; Zhu, X.-G.; Ort, D.R. Photosynthesis, light use efficiency, and yield of reduced-chlorophyll soybean mutants in field conditions. Front. Plant Sci. 2017, 8, 549. [Google Scholar] [CrossRef]
  31. Zhang, R.; Wang, Y.; Wang, X.; Jiao, S.; Lu, Y.; Du, Y.; Zhang, W.; Kang, Y.; Liu, Y.; Qin, S. Differential responses of microstructure, antioxidant defense, and plant hormone signaling regulation in potato (Solanum tuberosum L.) under drought, alkaline salt, and combined stresses. Sci. Hortic. 2025, 341, 114014. [Google Scholar] [CrossRef]
  32. Qiao, M.; Hong, C.; Jiao, Y.; Hou, S.; Gao, H. Impacts of Drought on Photosynthesis in Major Food Crops and the Related Mechanisms of Plant Responses to Drought. Plants 2024, 13, 1808. [Google Scholar] [CrossRef]
  33. Dewar, R.; Mauranen, A.; Mäkelä, A.; Hölttä, T.; Medlyn, B.; Vesala, T. New insights into the covariation of stomatal, mesophyll and hydraulic conductances from optimization models incorporating nonstomatal limitations to photosynthesis. New Phytol. 2017, 217, 571–585. [Google Scholar] [CrossRef]
  34. Rolando, J.L.; Ramírez, D.A.; Yactayo, W.; Monneveux, P.; Quiroz, R. Leaf greenness as a drought tolerance related trait in potato (Solanum tuberosum L.). Environ. Exp. Bot. 2015, 110, 27–35. [Google Scholar] [CrossRef]
  35. Xu, F.; Liu, Y.; Li, J.; Zhu, J.; Wu, N.; Meng, A. Effects of a novel fulvic acid-enriched water-soluble fertilizer on potato growth, yield, and water-fertilizer use efficiency under different drip irrigation regimes. Front. Plant Sci. 2025, 16, 1672560. [Google Scholar] [CrossRef] [PubMed]
  36. Niu, Y.; Wang, L.; Luo, Z.; Fudjoe Setor, K.; Palta, J.A.; Li, L.; Li, S. Effects of Irrigation Practices on Potato Yield and Water Productivity: A Global Meta-Analysis. Agronomy 2025, 15, 1942. [Google Scholar] [CrossRef] [PubMed]
  37. Tang, J.; Xiao, D.; Wang, J.; Fang, Q.; Zhang, J.; Bai, H. Optimizing water and nitrogen managements for potato production in the agro-pastoral ecotone in North China. Agric. Water Manag. 2021, 253, 106945. [Google Scholar] [CrossRef]
  38. Badr, M.A.; Hussein, S.D.A.; El-Tohamy, W.A.; Gruda, N. Efficiency of Subsurface Drip Irrigation for Potato Production Under Different Dry Stress Conditions. Gesunde Pflanz. 2010, 62, 63–70. [Google Scholar] [CrossRef]
  39. Jin, N.; He, J.; Fang, Q.; Chen, C.; Ren, Q.; He, L.; Yao, N.; Song, L.; Yu, Q. The responses of maize yield and water use to growth stage-based irrigation on the loess plateau in China. Int. J. Plant Prod. 2020, 14, 621–633. [Google Scholar] [CrossRef]
  40. Michelon, N.; Pennisi, G.; Ohn Myint, N.; Orsini, F.; Gianquinto, G. Strategies for Improved Water Use Efficiency (WUE) of Field-Grown Lettuce (Lactuca sativa L.) under a Semi-Arid Climate. Agronomy 2020, 10, 668. [Google Scholar] [CrossRef]
  41. Geerts, S.; Raes, D. Deficit irrigation as an on-farm strategy to maximize crop water productivity in dry areas. Agric. Water Manag. 2009, 96, 1275–1284. [Google Scholar] [CrossRef]
  42. Kaur, A.; Singh, K.B.; Gupta, R.K.; Alataway, A.; Dewidar, A.Z.; Mattar, M.A. Interactive effects of nitrogen application and irrigation on water use, growth and tuber yield of potato under subsurface drip irrigation. Agronomy 2022, 13, 11. [Google Scholar] [CrossRef]
  43. Camargo, D.C.; Montoya, F.; Ortega, J.F.; Córcoles, J.I. Potato Yield and Water Use Efficiency Responses to Irrigation in Semiarid Conditions. Agron. J. 2015, 107, 2120–2131. [Google Scholar] [CrossRef]
  44. Shrestha, B.; Stringam, B.L.; Darapuneni, M.K.; Lombard, K.A.; Sanogo, S.; Higgins, C.; Djaman, K. Effect of Irrigation and Nitrogen Management on Potato Growth, Yield, and Water and Nitrogen Use Efficiencies. Agronomy 2024, 14, 560. [Google Scholar] [CrossRef]
  45. Dalla Costa, L.; Delle Vedove, G.; Gianquinto, G.; Giovanardi, R.; Peressotti, A. Yield, water use efficiency and nitrogen uptake in potato: Influence of drought stress. Potato Res. 1997, 40, 19–34. [Google Scholar] [CrossRef]
Figure 1. Meteorological data for each month of 2022, 2023, and 2024. (A) Meteorological data for each month of 2022. (B) Meteorological data for each month of 2023. (C) Meteorological data for each month of 2024. x-axis represents the month, left y-axis represents the temperature, and right y-axis represents rainfall.
Agronomy 16 00866 g001
Figure 2. Schematic diagram of experimental planting.
Agronomy 16 00866 g002
Figure 3. Effect of deficit irrigation on potato plant height. x-axis represents the sampling time, and y-axis represents the plant height. a, b, c represent significance.
Agronomy 16 00866 g003
Figure 4. Effect of reduced irrigation on potato stem diameter. x-axis represents the sampling time, and y-axis represents Stem diameter of plant. a, b are used to represent the significant differences between processing steps.
Agronomy 16 00866 g004
Figure 5. Effect of deficit irrigation on potato dry matter. x-axis represents the sampling time, and y-axis represents dry matter weight. a, b, c, d are used to represent the significant differences between processing steps.
Agronomy 16 00866 g005
Figure 6. Effect of deficit irrigation on potato SPAD. x-axis represents the sampling time, and y-axis represents SPAD of potato leaves. a, b, c are used to represent the significant differences between processing steps.
Agronomy 16 00866 g006
Figure 7. Effect of deficit irrigation on water use efficiency of potatoes. x-axis represents the treatment, and y-axis represents WUE. a, b, c are used to represent the significant differences between processing steps.
Agronomy 16 00866 g007
Figure 8. Correlation analysis of growth and yield traits. Upper triangle represents the indicators for 2024, while lower triangle represents the indicators for 2023. TY is tuber yield, TNPP is number of tubers per plant, TPP is yield per plant, DM is dry matter, LTR is large tuber rate, MTR is medium tuber rate, STR is small tuber rate, PH is plant height, SD is stem diameter, WUE is water utilization efficiency. * is p < 0.05, ** is p < 0.01, *** is p < 0.001.
Agronomy 16 00866 g008
Figure 9. The correlation between TY and WUE during the potato ripening stage over two years. WUE is water utilization efficiency (a). TY is tuber yield (b). The x-axis represents treatment, and the y-axis represents WUE (a). x-axis represents treatment, and y-axis represents TY (b).
Agronomy 16 00866 g009
Figure 10. PLS-SEM analysis of irrigation ratio and potato growth (growth), water utilization efficiency (WUE), Photosynthesis, yield component, and tuber yield (yield) (a). Direct, indirect, and total effects of each variable according to PLS-PM. Yield represents tuber yield; WUE represents water utilization efficiency; growth represents plant height, stem diameter, and dry matter mass; photosynthesis represents net photosynthetic rate (b).
Agronomy 16 00866 g010
Table 1. Information on soil physical characteristics and nutrients in experimental plot.
Soil Depth
(cm)
Soil Bulk Density
(g·cm−3)
Maximum Field Water Capacity (%)pH ValueAvailable P (mg·kg−1)Available K (mg·kg−1)Alkaline N (mg·kg−1)Organic Matter
(g·kg−1)
0–201.31 27.78 8.48 18.41133.81 65.48 19.21
Table 2. Irrigation amount and frequency under different treatments.
TreatmentsIrrigation2023 Irrigation Amount (mm)2024 Irrigation Amount (mm)Irrigation Number
CK75–85% of the FWC360.97450.9916
W7575% of the CK irrigation amount278.23345.7416
W5050% of the CK irrigation amount195.49240.5016
W2525% of the CK irrigation amount112.74135.2516
Table 3. Effects of reduced irrigation on photosynthetic characteristics of potatoes.
YearLight Intensity
μ·mol·m−2·s−1
TreatmentPn
μmol CO2 m−2·s−1
Gs
mmol·m−2·s−1
Ci
μmol·mmol−1
Tr
mmol·H2O·m−2·s−1
Ls
2023850 W2516.83 ± 0.86 b0.13 ± 0.01 ab185.88 ± 10.04 ab4.15 ± 0.12 ab0.61 ± 0.04 a
W5011.34 ± 2.06 c0.08 ± 0.02 c145.88 ± 39.27 b2.92 ± 0.92 c0.64 ± 0.01 a
W7525.28 ± 2.14 a0.21 ± 0.02213.3 ± 8.33 ab5.86 ± 0.53 a0.51 ± 0.01 b
CK22.72 ± 1.71 a0.31 ± 0.04 a256.04 ± 8.02 a4.51 ± 1.01 ab0.42 ± 0.02 c
1500W2517.55 ± 0.59 b0.12 ± 0.01 bc156.79 ± 18.27 b4.11 ± 0.17 a0.69 ± 0.02 a
W5012.05 ± 2.48 b0.09 ± 0.04 c153.39 ± 42.8 b3.53 ± 1.32 a0.72 ± 0.01 a
W7528.46 ± 2.39 a0.22 ± 0.02 ab199.55 ± 9.67 ab6.61 ± 0.55 a0.55 ± 0.00 b
CK25.25 ± 1.70 a0.32 ± 0.04 a240.64 ± 8.82 a5.06 ± 1.07 a0.52 ± 0.01 b
2024850 W2513.01 ± 1.80 b0.1 ± 0.01 bc213.83 ± 35.21 a4.51 ± 0.65 a0.53 ± 0.33 b
W509.22 ± 1.2740.07 ± 0.01 c126.00 ± 28.77 b2.46 ± 0.48 b0.67 ± 0.65 a
W7523.06 ± 1.06 a0.24 ± 0.03 a193.68 ± 13.79 ab5.84 ± 0.45 a0.50 ± 0.10 b
CK20.69 ± 1.22 a0.17 ± 0.02 ab232.5 ± 12.32 a4.41 ± 0.57 a0.45 ± 0.06 b
1500 W256.06 ± 2.28 b0.09 ± 0.01 b125.52 ± 9.12 a1.82 ± 0.64 a0.65 ± 0.02 a
W505.36 ± 1.79 b0.04 ± 0.00 b118.92 ± 22.47 a2.06 ± 0.51 a0.69 ± 0.01 a
W7514.41 ± 3.31 a0.09 ± 0.03 b161.19 ± 38.93 a5.82 ± 0.92 a0.58 ± 0.04 b
CK9.7 ± 1.92 ab0.21 ± 0.00 a172.17 ± 34.15 a3.15 ± 1.67 ab0.57 ± 0.03 b
a, b, c are used to represent the significant differences between processing steps.
Table 4. The effects of reduced irrigation on potato yield.
YearTreatmentsTuber Yield/kg·hm−2Number of Potato Per PlantLarge Potato Rate/%Medium Potato Rate/%Small Potato Rate/%
2023CK27,831.83 ± 263.03 a6.46 ± 1.09 a38.37 ± 2.87 a28.82 ± 3.29 b32.81 ± 5.23 a
W7529,247.48 ± 358.69 a6.7 ± 0.75 a44.46 ± 2.35 a28.45 ± 1.16 b27.09 ± 2.00 a
W5021,256.35 ± 755.75 b5.93 ± 0.18 b34.95 ± 3.03 a39.67 ± 3.09 a25.38 ± 3.36 a
W2514,984.85 ± 1179.17 c4.6 ± 0.61 c22.48 ± 3.23 b44.05 ± 1.67 a33.47 ± 4.76 a
2024CK27,298.66 ± 262.38 a6.47 ± 0.17 a20.23 ± 4.24 b49.95 ± 3.40 a29.82 ± 2.70 c
W7529,386.97 ± 510.12 a6.83 ± 0.76 a41.76 ± 3.15 a41.73 ± 4.36 a16.51 ± 2.17 d
W5018,402.80 ± 497.34 b5.60 ± 0.23 b15.65 ± 2.81 b36.35 ± 2.86 a47.99 ± 5.06 b
W2513,765.15 ± 1002.75 c4.26 ± 0.26 c0.00 ± 0.00 c38.70 ± 4.83 a61.29 ± 4.83 a
a, b, c, d are used to represent the significant differences between processing steps.
Disclaimer/Publisher’s Note: The statements, opinions and data contained in all publications are solely those of the individual author(s) and contributor(s) and not of MDPI and/or the editor(s). MDPI and/or the editor(s) disclaim responsibility for any injury to people or property resulting from any ideas, methods, instructions or products referred to in the content.