Article

Comparisons of Soil C–N Pools and Microbial Communities Among Saline–Alkali, Straw-Returning, and Conventional Farmlands in the Ningxia Yellow River Irrigation District, China

1
National & Local Joint Engineering Research Center on Biomass Resource Utilization, Tianjin Engineering Research Center on Biomass Solid Waste Resource Utilization, College of Environmental Science and Engineering, Nankai University, Tianjin 300350, China
2
Institute of Agricultural Resources and Environment, Ningxia Academy of Agricultural and Forestry Sciences, Yinchuan 750002, China
3
Tianjin Eco-City Environmental Production Co., Ltd., Tianjin 300467, China
*
Author to whom correspondence should be addressed.
Agronomy 2026, 16(8), 833; https://doi.org/10.3390/agronomy16080833
Submission received: 16 March 2026 / Revised: 14 April 2026 / Accepted: 17 April 2026 / Published: 20 April 2026
(This article belongs to the Special Issue Risk Assessment of Heavy Metal Pollution in Farmland Soil)

Abstract

The Ningxia Yellow River Irrigation District in China has long been influenced by flood irrigation and intensive fertilizer input under its particular geological and climatic constraints, and this region is characterized by low soil organic matter, poor nutrient status, low permeability, high pH, and widespread salinization. This cross-sectional field study compared the soil physicochemical properties and microbial communities among saline–alkali soil (SAS), straw-returning farmland (SR), and traditionally managed farmland (FM). EC was higher in SAS (approximately 4.21 dS·m−1) than in SR and FM (approximately 0.23 and 0.30 dS·m−1, respectively), whereas TOC and C/N were higher in SR (approximately 1.00% and 10.58, respectively) than in FM (approximately 0.78% and 8.69) and SAS (approximately 0.43% and 8.81). Bacterial and fungal communities showed different distribution patterns among the three farmland types. Compared with fungi, bacterial community structure and richness varied more clearly across soils differing in salinity and organic matter status. Variations in microbial community composition were accompanied by differences in soil salinity and carbon- and nitrogen-related properties. Acidobacteriota was positively correlated with soil carbon and nitrogen variables and negatively correlated with pH and EC, while Ascomycota was positively correlated with total carbon (TC) and TOC. These results show that straw-returning farmland differed from saline–alkali soil and traditionally managed farmland in both soil properties and microbial community characteristics, highlighting potential soil–microbe associations in saline-affected agricultural systems.

1. Introduction

The Ningxia Yellow River Irrigation District is a typical arid-semiarid agricultural region in northwest China. Under its specific geological and climatic conditions, crop production has long depended on irrigation from the Yellow River. As a result, many farmlands in this region are characterized by low soil organic matter, poor nutrient conditions, low permeability, high pH levels (pH > 8.5), and widespread salinization [1]. Secondary soil salinization mainly involves the transport of soluble salts from soil and irrigation water into or within farmland soils through water movement. Under conditions of low precipitation, strong evaporation, shallow groundwater, and restricted drainage, water is gradually lost through evaporation and plant uptake, whereas salts are retained and concentrated in the surface soil, leading to progressive salt accumulation in the cultivated layer [2,3]. With the rapid development of crop cultivation and animal husbandry in Ningxia, traditional farming practices such as flood irrigation and intensive nitrogen fertilizer input remain common. At the same time, the proportion of major grain crops in the regional planting structure has declined, while the area under non-grain crops has increased, which may further increase fertilizer demand and intensify risks of non-point source pollution and salinization. Under high-salinity or high-alkalinity conditions, crop growth and root activity may be constrained, while soil structure, nutrient availability, and biological processes undergo alterations. These changes further impact carbon and nitrogen cycles, reshape microbial community composition, and weaken the resilience and recovery capacity of soil ecosystems, thereby becoming limiting factors for sustainable agricultural development [4]. Further assessment of soil quality in saline–alkali farmland within the Yellow River irrigation district indicates that salt stress frequently interacts with nutrient limitations and differences in agronomic management practices. Additionally, there exists a certain degree of coupling between water, salt, nutrients, and soil biological communities [5].
A large-scale meta-analysis of Chinese farmlands indicates that straw incorporation typically increases soil organic carbon content and is widely recognized as a key measure for improving soil quality [6]. Particularly in saline–alkali soils, straw incorporation may also lower soil pH and salinity while significantly altering fungal community structure and diversity [7]. Beyond contributing to carbon inputs, straw incorporation alters soil matrix availability, influences microbial community composition and metabolic processes, thereby regulating nutrient cycling [8]. For instance, straw incorporation affects soil C/N ratios: lower C/N ratios accelerate decomposition rates, and vice versa [9]. When soil C:N:P ratios deviate from microbial metabolic requirements, microorganisms must adjust corresponding metabolic functions to acquire limiting resources, thereby maintaining elemental stoichiometric homeostasis rather than growth. This process regulates carbon flux rates and nutrient cycling [10]. These findings suggest that straw incorporation may improve saline–alkali soils through physicochemical and biological pathways.
However, under the highly managed irrigation conditions of the Ningxia Yellow River Irrigation District, comparative information on soil physicochemical properties and microbial communities among saline-affected farmland under different farmland types remains limited. Although previous studies have highlighted the potential role of straw incorporation in improving saline–alkali soils, fewer field-based comparisons have simultaneously evaluated untreated saline–alkali soil, straw-returning farmland, and conventionally managed farmland within the same irrigated agricultural context. In 2025, we conducted an observational field survey in the Ningxia Yellow River Irrigation District under a maize-based cropping system to compare soil physicochemical properties and microbial communities among three farmland types. Particular attention was given to variation in bacterial and fungal community composition across different farmland types and to their associations with soil salinity background and exogenous organic matter status. Based on previous studies, it was expected that different farmland types would exhibit distinct soil property profiles and microbial community characteristics. This study aims to provide comparative field evidence for understanding soil-microbe relationships in saline-affected farmlands and to offer a basis for subsequent studies on farmland management in irrigated areas.

2. Materials and Methods

2.1. Overview of the Study Area and Site Selection

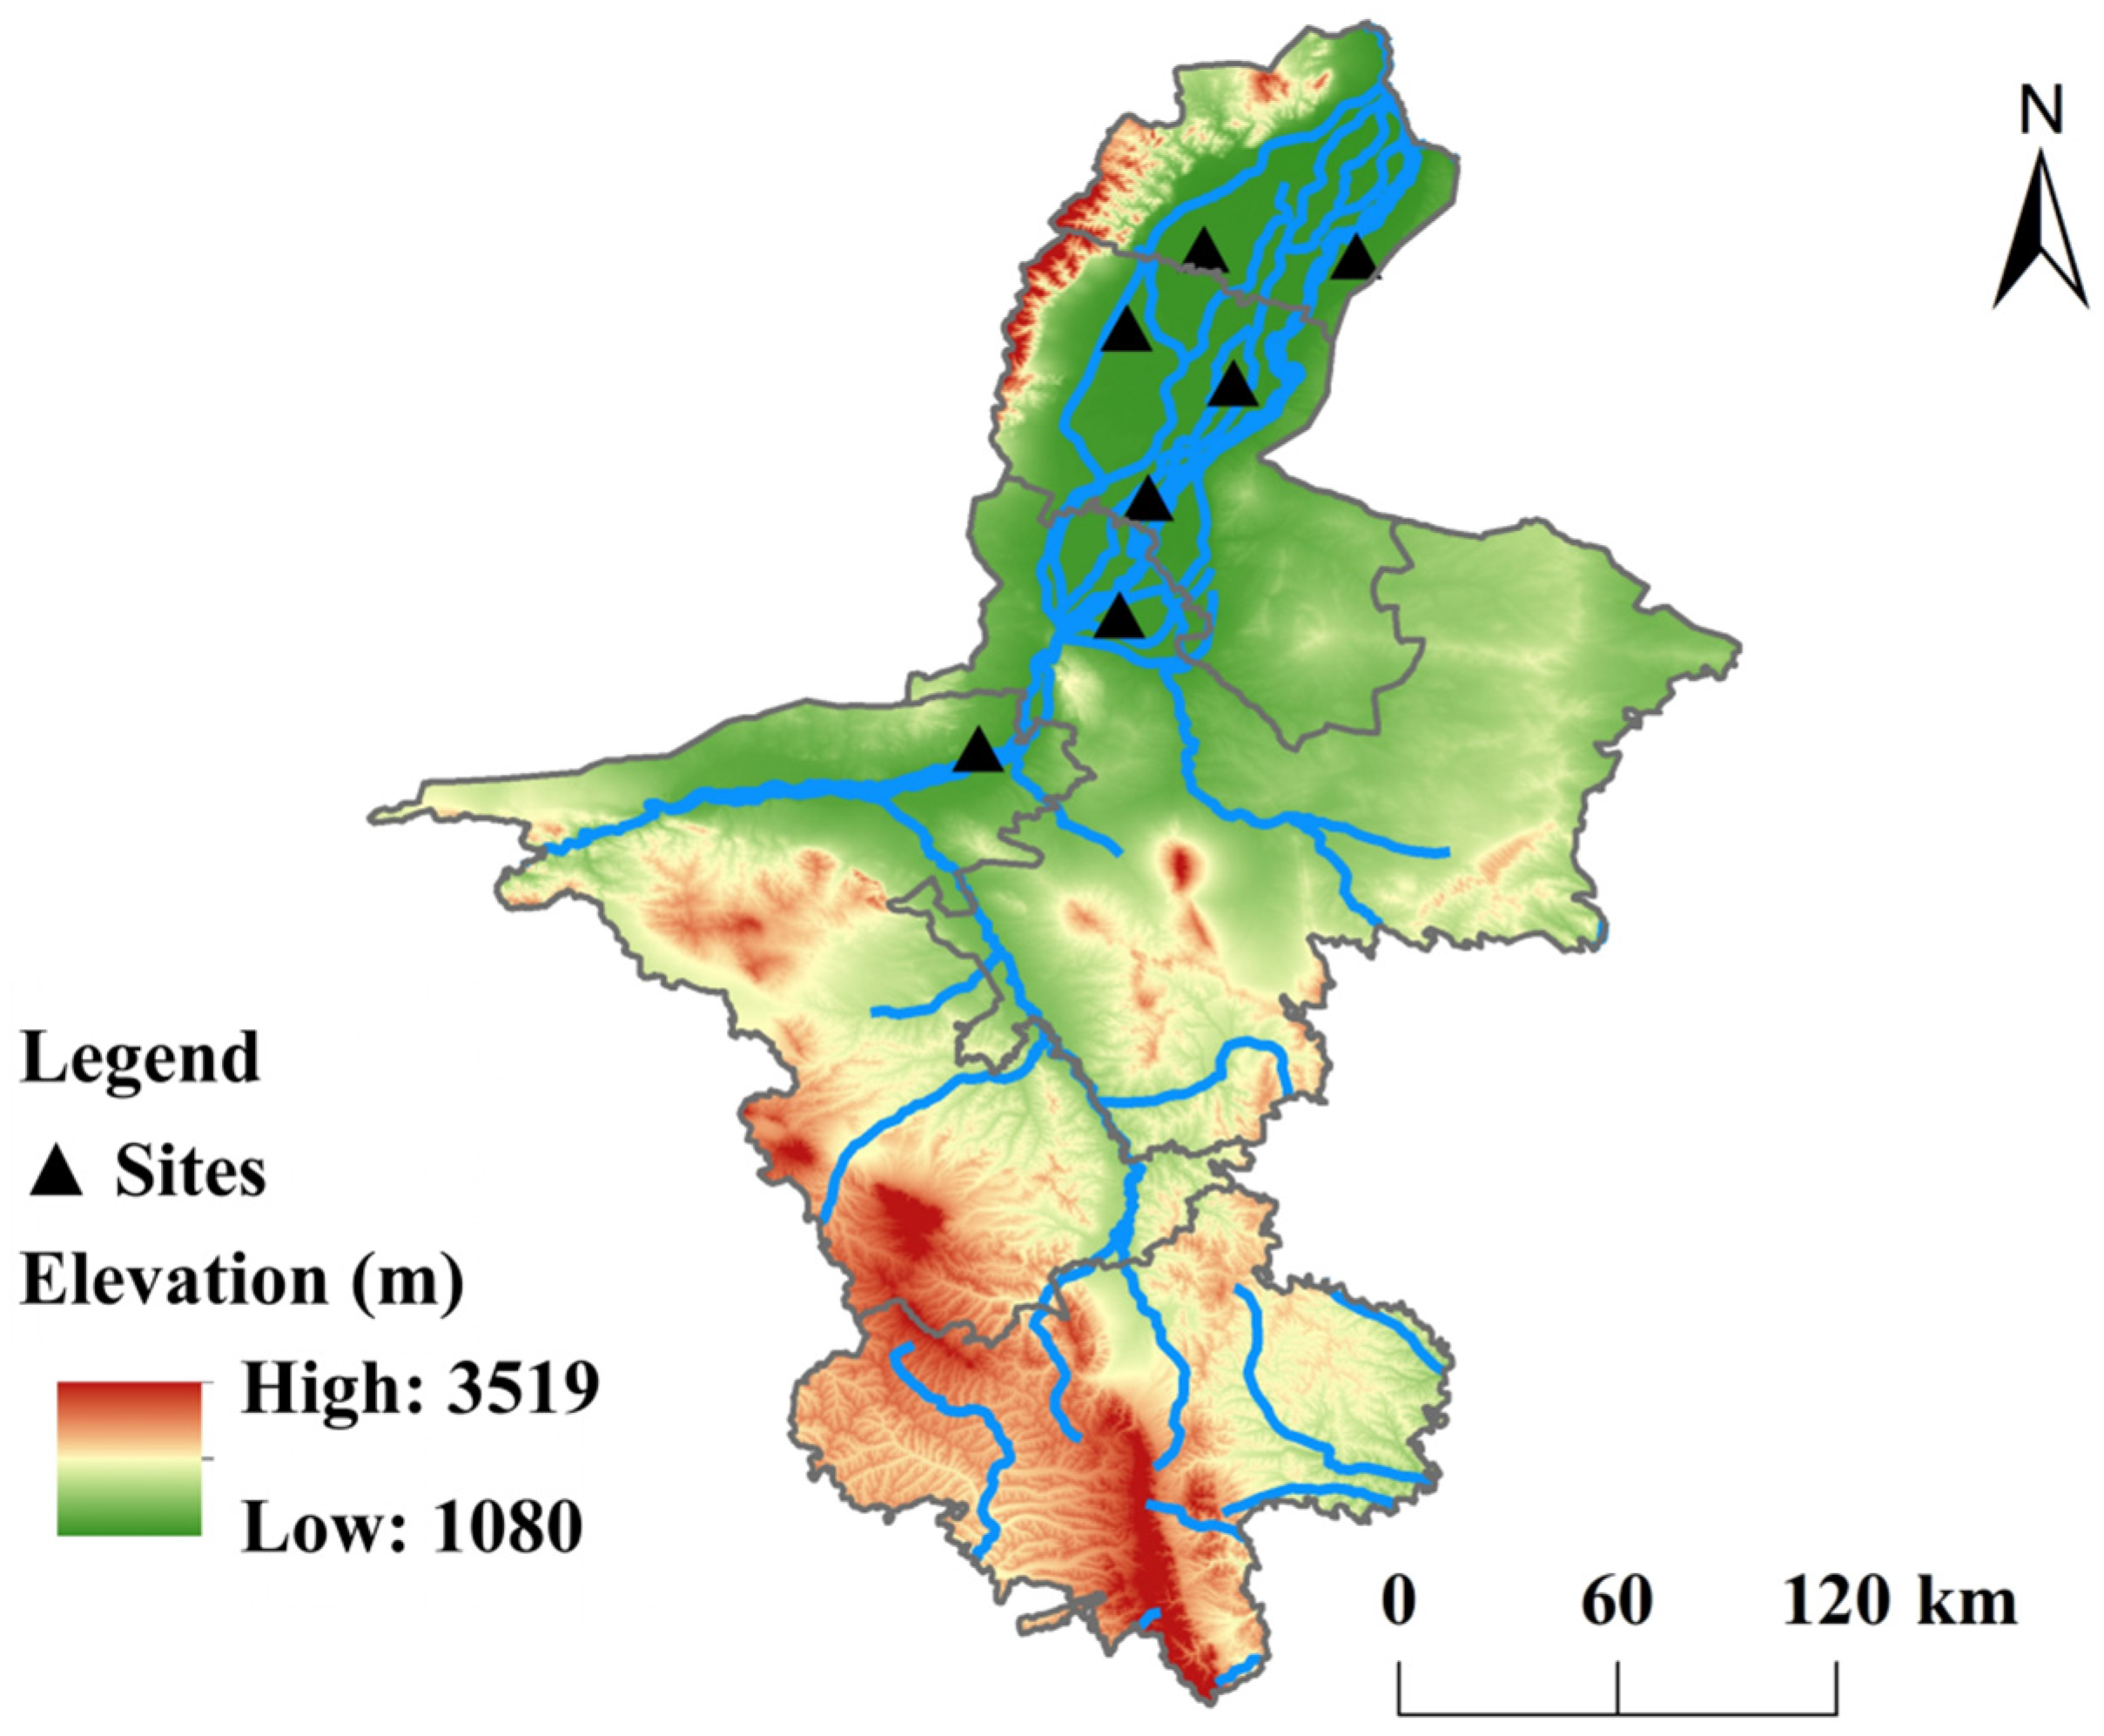
This study was conducted in the Yellow River diversion and irrigation areas of Ningxia (Figure 1). This region lies within the arid-semiarid transition zone, where agricultural production is highly dependent on irrigation conditions. The Ningxia Yellow River irrigation region has an average annual temperature of about 8–9 °C, annual precipitation of about 180–200 mm, and an altitude of approximately 1100–1300 m above sea level. Under long-term irrigation and drainage operations, there exists a risk of secondary salinization and soil alkalization. We conducted a one-time observational (cross-sectional) field survey on 3 July 2025 during the maize growing season, when the crop was in an active vegetative growth stage and the soil was under normal field conditions with moderate moisture, covering three representative farmland types: SAS (saline–alkali soil, long-term absence of organic amendment), FM (conventional farmer fields, routine tillage and fertilization management, nitrogen, phosphorus, and potassium fertilization rates: 433.7 kg·ha−1, 150 kg·ha−1, 60 kg·ha−1), and SR (straw-returning plots, crop straw returned to soil, nitrogen, phosphorus, and potassium fertilization rates: 360 kg·ha−1, 150 kg·ha−1, 60 kg·ha−1). Among these farmland types, SR and FM differed not only in organic amendment practice but also in nitrogen fertilization rate. Because this study was based on a one-time field survey, detailed information on fertilizer product type and application timing was not consistently available for all sampled farmlands; therefore, only the recorded N, P, and K fertilization rates are reported here. The sampling sites were selected to represent the typical management history and salinity status of each farmland type. Within each farmland type, independent sampling points were selected to obtain composite soil samples from the topsoil layer (0–20 cm) using a standardized multi-point composite sampling strategy, thereby reducing the influence of small-scale spatial heterogeneity.

2.2. Sampling Design and Sample Processing

This study set up seven independent sampling points, with two under SAS, two under SR, and three under FM. At each sampling point, five soil subsamples from the 0–20 cm layer were collected using a stainless-steel shovel from spatially separated positions within the same sampling point, thoroughly mixed to form one composite sample, and then divided into three parallel subsamples for analysis. The composite approach was used to better reflect spatial variability within the sampling area [11,12,13]. These parallel subsamples were used to evaluate analytical repeatability and within-point variability, but did not constitute independent biological replicates. Therefore, the seven sampling points were treated as the independent field units in subsequent comparative analyses.
For physicochemical analysis, one portion of each sample was naturally air-dried, then plant debris and stones were removed, and the soil was gently ground and passed through a 2 mm sieve before analysis [13,14]. For molecular biology analysis, the other portion was stored at −80 °C after collection to minimize DNA degradation [15,16].

2.3. Determination of Soil Physicochemical Properties

pH was determined using the glass electrode method with a soil:water ratio of 1:2.5 [14,17], following a commonly used protocol for agricultural soils in China. Electrical conductivity (EC) was measured using an EC meter in a 1:5 soil:water extract and converted to dS·m−1 [14,18]. The 1:5 extract is widely used for soil salinity assessment and facilitates comparison of EC values among saline-affected soils. Total carbon (TC) and total nitrogen (TN) were determined by dry combustion using an elemental analyzer (EA3000, EuroVector S.p.A., Pavia, Italy) [19,20,21]. Total organic carbon (TOC) was measured after removal of inorganic carbon by acid washing with 2 mol·L−1 HCl, followed by analysis with the same elemental analyzer [18].

2.4. Microbial Community DNA Extraction and 16S rRNA and ITS Amplicon Sequencing

Microbial DNA extraction and amplicon sequencing were performed by Biomarker Biotech (Beijing, China). Total genomic DNA was extracted from approximately 0.25–0.5 g of each soil sample using the TGuide S96 Magnetic Soil/Stool DNA Extraction Kit (TIANGEN Biotech (Beijing) Co., Ltd., Beijing, China) according to the manufacturer’s protocol. DNA integrity and concentration were assessed before PCR amplification.
The bacterial V3–V4 region of the 16S rRNA gene was amplified using primers 338F (5′-ACTCCTACGGGAGGCAGCA-3′) and 806R (5′-GGACTACHVGGGTWTCTAAT-3′) [22], whereas the fungal ITS1 region was amplified using primers ITS1F (5′-CTTGGTCATTTAGAGGAAGTAA-3′) and ITS2 (5′-GCTGCGTTCTTCATCGATGC-3′) [23,24]. After PCR amplification and library preparation, the purified amplicons were sequenced on the Illumina NovaSeq 6000 (Beijing Biomarker Technologies Co., Ltd., Beijing, China) platform with paired-end 2 × 250 bp reads [25]. Sequencing depth statistics for each sample, including raw reads, clean reads, and final effective reads, are provided in Table S1.

2.5. Sequence Data Preprocessing and Annotation

Raw sequencing reads were quality-filtered using Trimmomatic v0.33 (PE LEADING:3, TRAILING:3, SLIDINGWINDOW:50:20, MINLEN:100) and trimmed for primer sequences using Cutadapt v1.9.1 (-e 0.2, --overlap 15, --discard-untrimmed) [26,27]. High-quality reads were then denoised, merged, and screened for chimeras using DADA2 v1.20.0 with default parameters to generate amplicon sequence variants (ASVs) for downstream analyses [28]. ASVs with counts less than 2 in all samples were removed prior to community analysis.
Taxonomic annotation was performed using the Naive Bayes classifier implemented in QIIME2 (2020.6.0) [29,30]. Bacterial sequences were assigned against the SILVA database (release 138.1), and fungal sequences were annotated using the UNITE 8.0 database [31,32]. Taxonomic classification was conducted with a confidence threshold of 70%.

2.6. Statistical Analysis

Soil physicochemical properties were summarized at the sampling-point level using R 4.4.3 [33,34,35] and visualized in RStudio 2025. The corresponding R packages used for data processing and plotting, including ggplot2 and scales, were cited in the revised reference list. The seven sampling points were treated as the independent field units in the comparative analyses, whereas the three parallel subsamples from each composite sample were used only to reflect within-point variability and analytical repeatability. Microbial α- and β-diversity analyses were conducted on the BMKCloud platform (Biomarker Technologies, Beijing, China). Alpha diversity was evaluated using the Shannon index, and differences among farmland types were explored using the Wilcoxon rank-sum test. Given the limited number of independent sampling points, these comparisons were interpreted as exploratory. Beta diversity was assessed based on Bray–Curtis dissimilarity, and variation in microbial community composition among the three farmland types was examined by PERMANOVA, with R2 and p values reported. PERMANOVA was implemented on the BMKCloud platform, and the results were interpreted with caution because of the limited number of independent sampling points. To examine the relationships between microbial community variation and soil properties, distance-based redundancy analysis (db-RDA) was performed based on Bray–Curtis dissimilarity, with EC, pH, TC, TN, and TOC included as explanatory variables. This analysis was used to assess associations between community variation and measured soil properties rather than to infer causal drivers. For the correlation heatmap analysis, the top 10 dominant phyla at the phylum level were visualized using the platform settings, with both species clustering and sample clustering applied and thresholds of 0.3 for the correlation coefficient and 0.05 for significance.

3. Results

3.1. Intergroup Differences in Soil Electrical Conductivity (EC) and pH

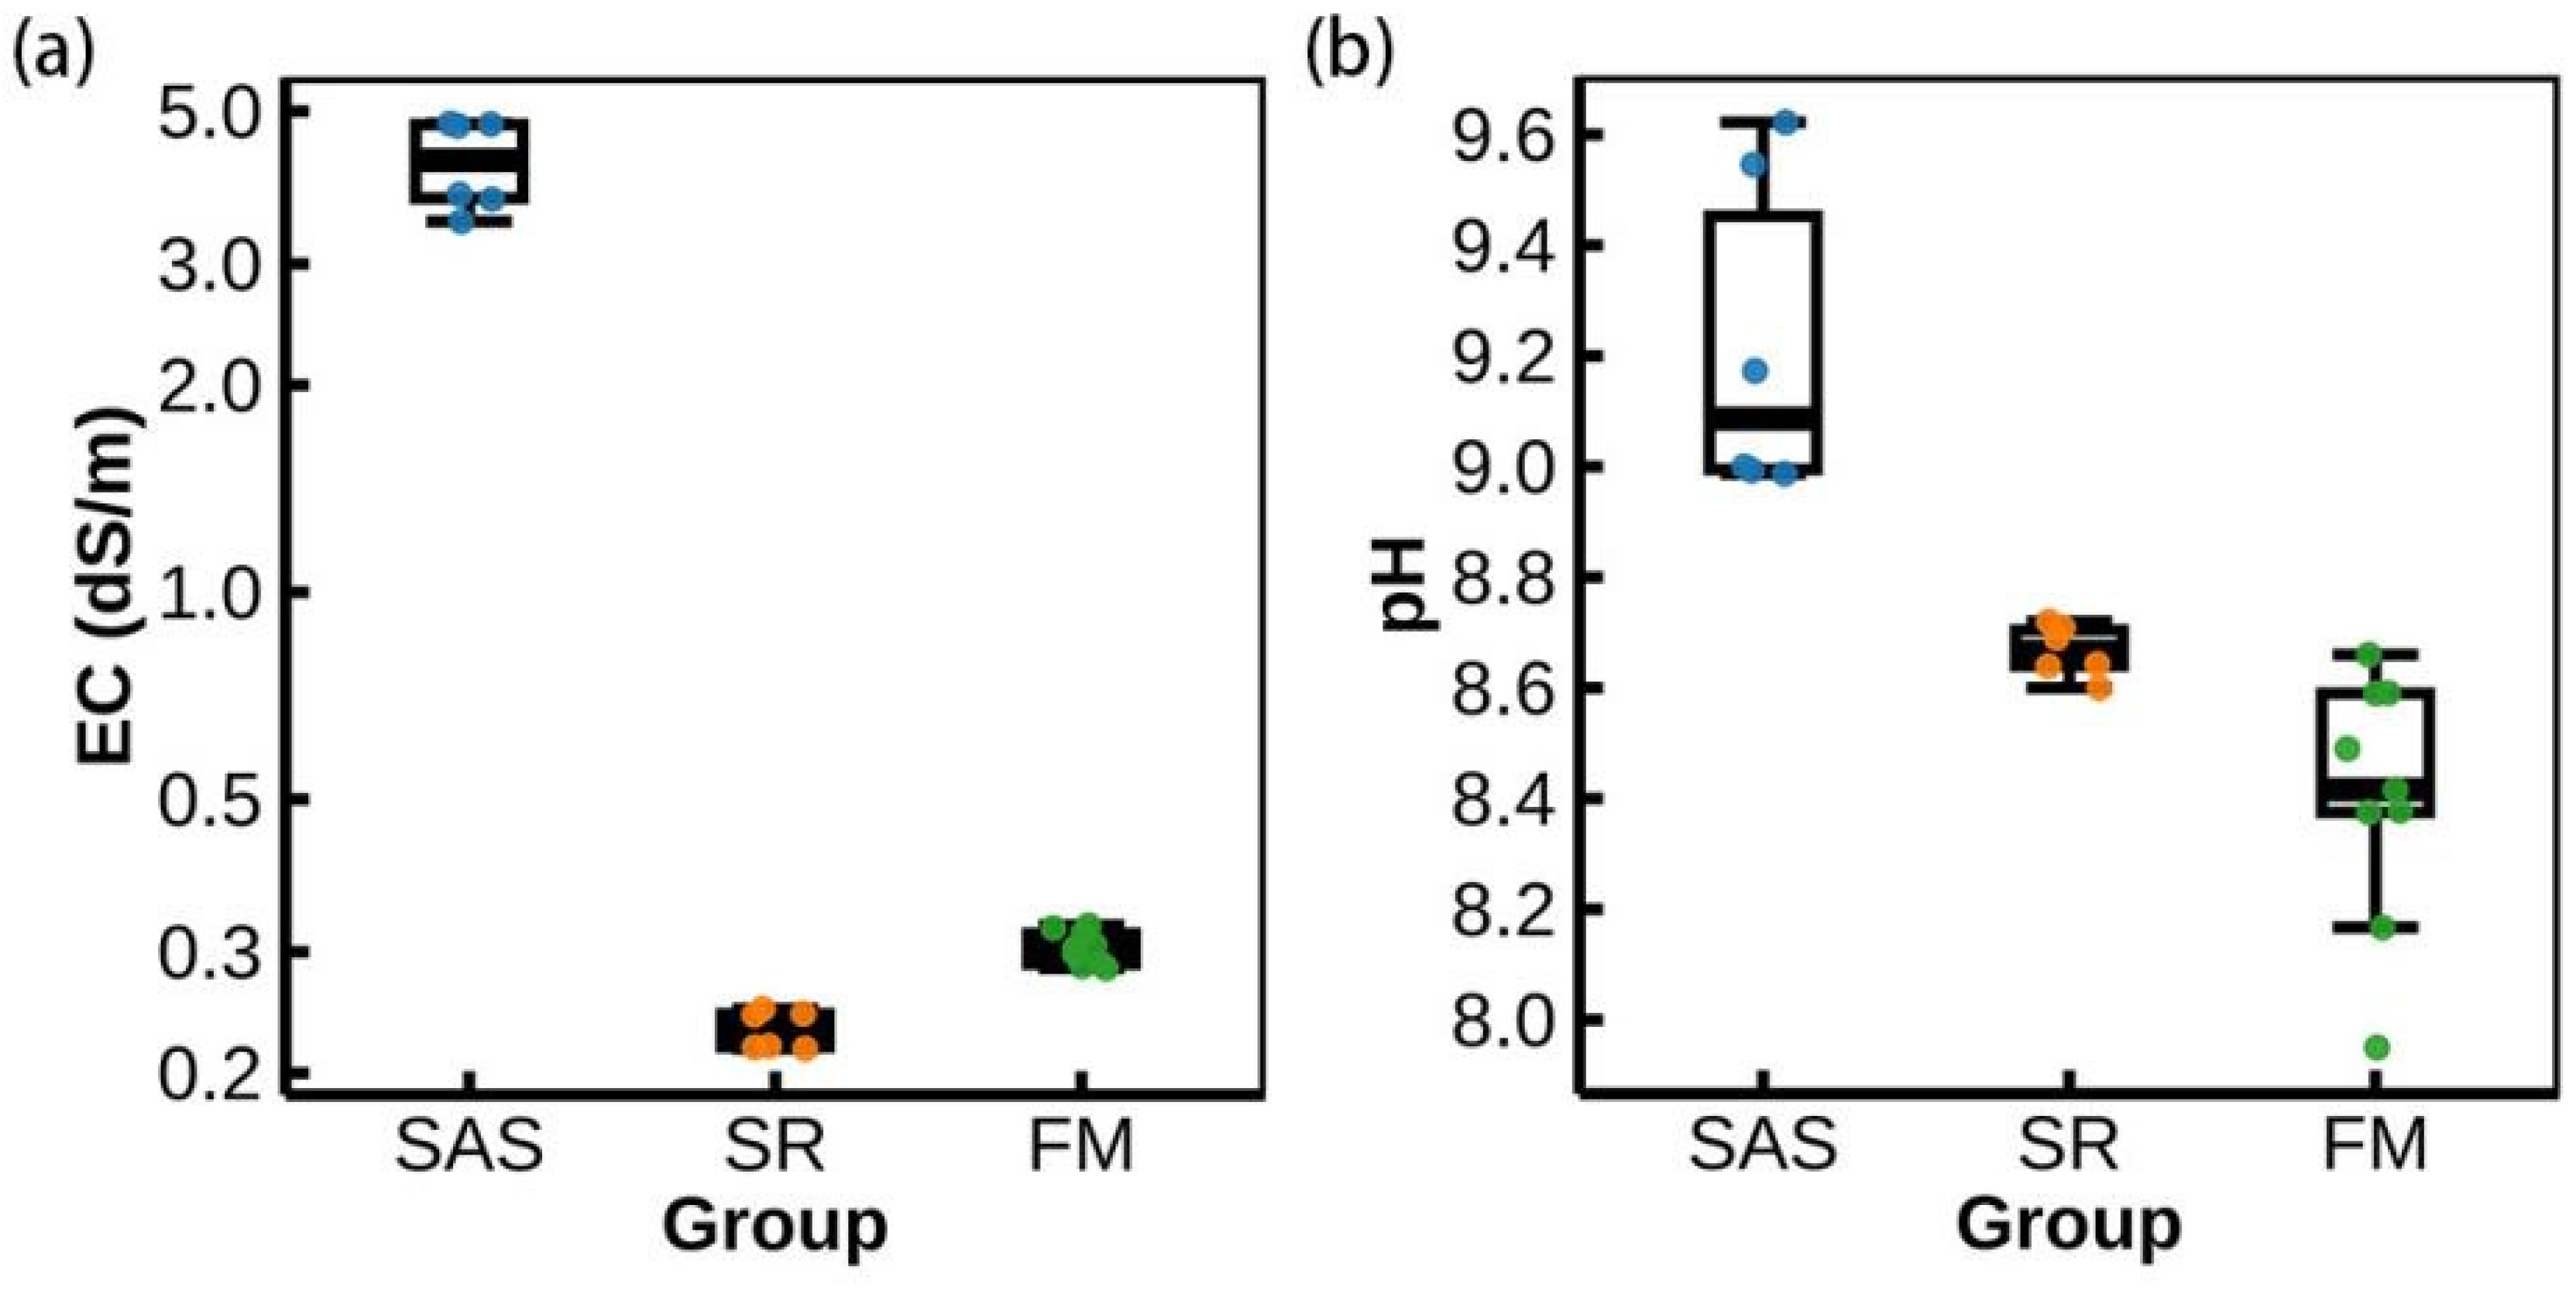
Soil electrical conductivity (EC) and pH exhibited distinct distribution patterns across the three farmland types (Figure 2). When plotted on a logarithmic scale, SAS is observed to be at the highest overall level (approximately 4.21 dS·m−1), with parallel measurements predominantly distributed in the high-value range. In contrast, both SR (approximately 0.23 dS·m−1) and FM (approximately 0.30 dS·m−1) fall within the low-value range. Their distribution ranges show almost no overlap with SAS, revealing distinct stratification between “high-salinity background” and “low-salinity background” conditions. Further comparison between SR and FM reveals that SR exhibits lower overall EC values with smaller dispersion at the parallel subsampling level. In contrast, FM shows relatively higher EC values and greater distribution variability, indicating greater variability in salinity status among the sampled FM points (Figure 2a).
pH (Figure 2b) also showed clear differences in distribution among the three farmland types. The pH values for SAS were generally higher overall and exhibited greater variability; The pH of SR was intermediate (approximately 8.67) and more concentrated, indicating a relatively concentrated distribution of sampled values; The pH of FM (approximately 8.4) was generally lower than SR, with some individual values being notably lower. The relative positions of EC and pH indicate that SAS plots are clearly distinguishable from SR/FM plots on both metrics (by approximately 9.22). Meanwhile, SR plots exhibit lower EC values relative to FM plots, yet their pH levels do not decrease synchronously (remaining relatively higher and more concentrated). This pattern suggests that variation in salinity and alkalinity did not occur synchronously across the sampled farmland types (Figure 2).

3.2. Differences in Soil C and N Contents and C:N Ratio

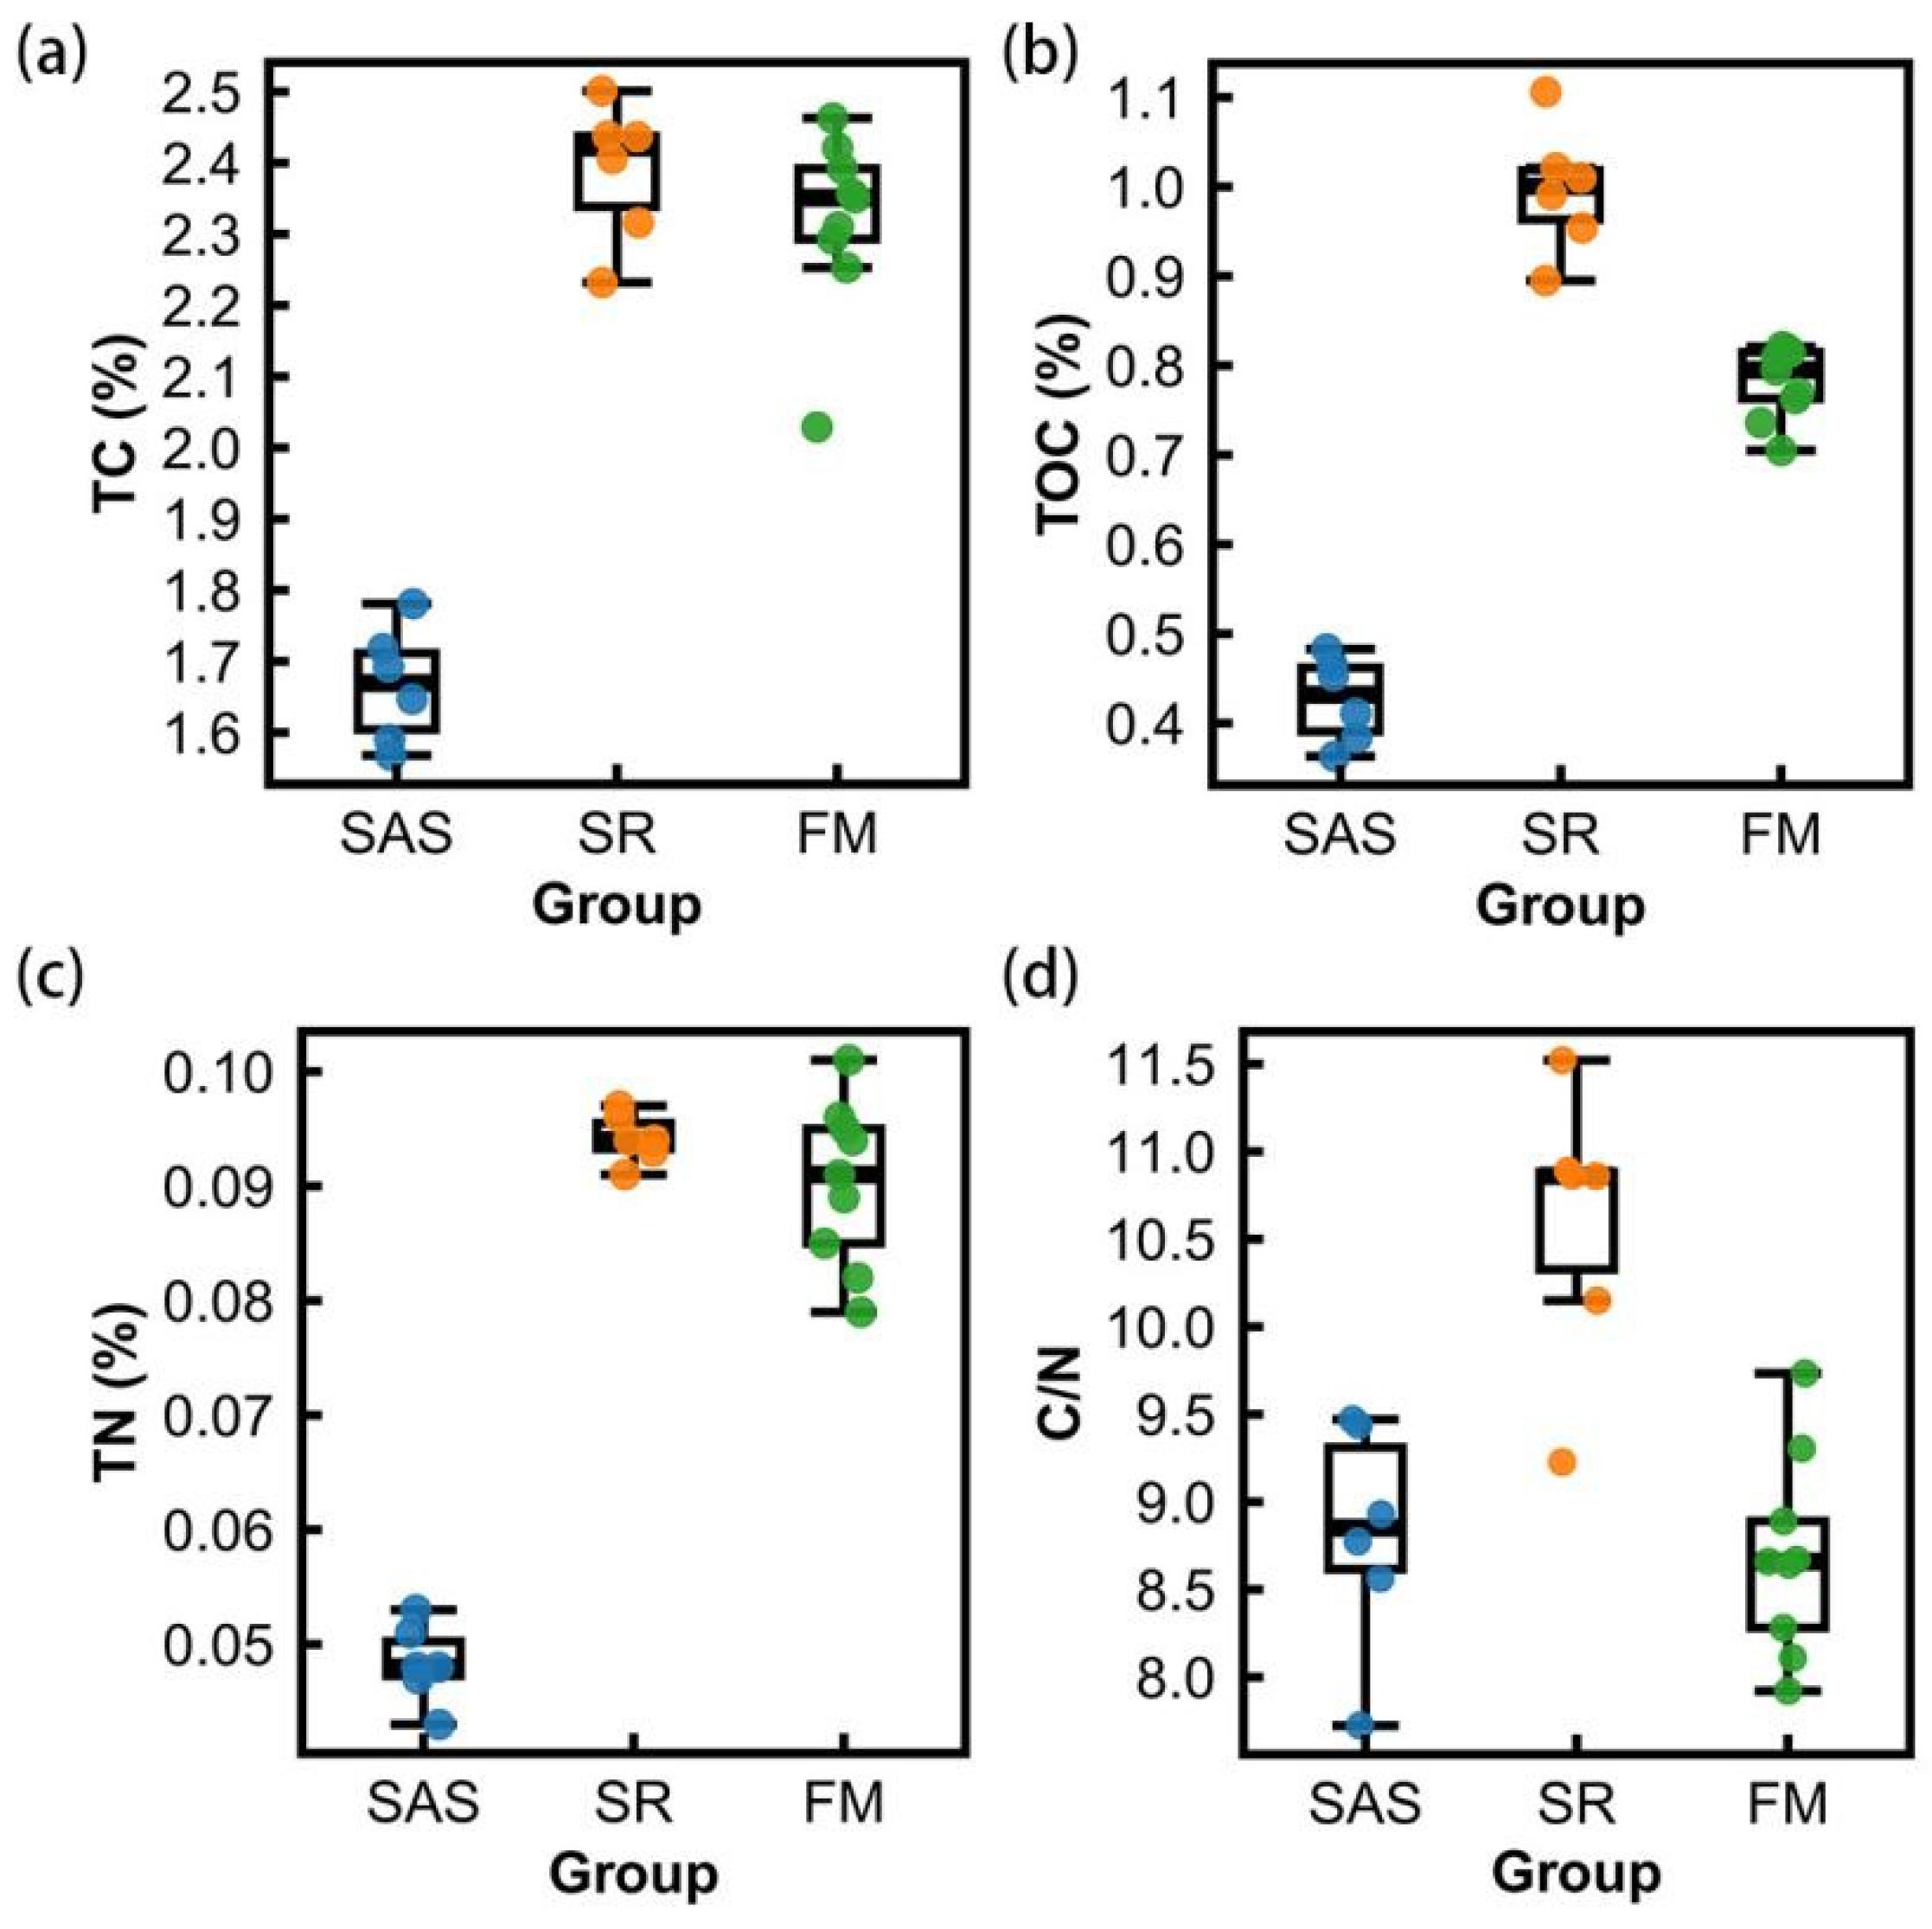
As shown in Figure 3a, total carbon (TC) exhibits clear stratification across different land parcel types: the SAS group shows the lowest level (approximately 1.66%), with scatter plots and box plots concentrated in the lower range; In contrast, both the SR (approximately 2.38%) and FM (approximately 2.32%) groups were higher than SAS overall in terms of TC. Their distribution ranges showed considerable overlap in the graph, suggesting that the TC levels of SR and FM are generally comparable. It should be noted that the individual point locations within the FM group exhibit a slightly larger span, indicating relatively higher intra-group variability.
Regarding total organic carbon (TOC) (Figure 3b), the differences among the three groups were more pronounced: The SR group exhibited the highest overall level (approximately 1.00%), followed by the FM group (approximately 0.78%), with the SAS group showing the lowest level (approximately 0.43%). Furthermore, the distribution ranges of SAS and SR/FM showed almost no overlap. Compared to the results from TC, TOC more clearly distinguishes the difference between SR and FM: SR exhibits higher levels in organic carbon components, while FM, though higher than SAS, remains overall lower than SR. However, comparisons between SR and FM should be interpreted with caution, as these two farmland types differed not only in straw return practice but also in nitrogen fertilization rate.
The trend in total nitrogen (TN) is similar to that of TOC (Figure 3c). The SAS TN value is clearly in the low range (approximately 0.048%), while SR (approximately 0.094%) and FM (approximately 0.090%) fall within the high range. These two categories show minimal overlap with SAS, indicating that sampled SAS points were clearly separated from SR and FM in terms of TN level. The scatter plot for the SR group shows relatively concentrated points and a narrower box, indicating a relatively concentrated distribution of sampled values. In contrast, the FM group exhibits a wider spread of points, suggesting more pronounced fluctuations in TN values across different sampling points and between replicates.
The C/N ratio (Figure 3d) further highlights the stoichiometric differences among the three land types. The SR group exhibited the highest overall C/N ratio (approximately 10.58), while the SAS (approximately 8.81) and FM (approximately 8.69) groups showed relatively lower values that were more closely clustered. Within the SAS group, a few unusually low observations were recorded, resulting in a broader distribution range. As shown in Figure 3, SAS exhibits the lowest values for TC, TOC, and TN, clearly distinguishing it from SR/FM. The differences between SR and FM are primarily reflected in higher TOC and C/N ratios, while TC shows relatively weaker differentiation between SR and FM. However, because SR and FM also differed in nitrogen fertilization rate, this contrast should be interpreted as a descriptive comparison rather than as evidence attributable solely to straw return.

3.3. Bacterial and Fungal α Diversity Characteristics

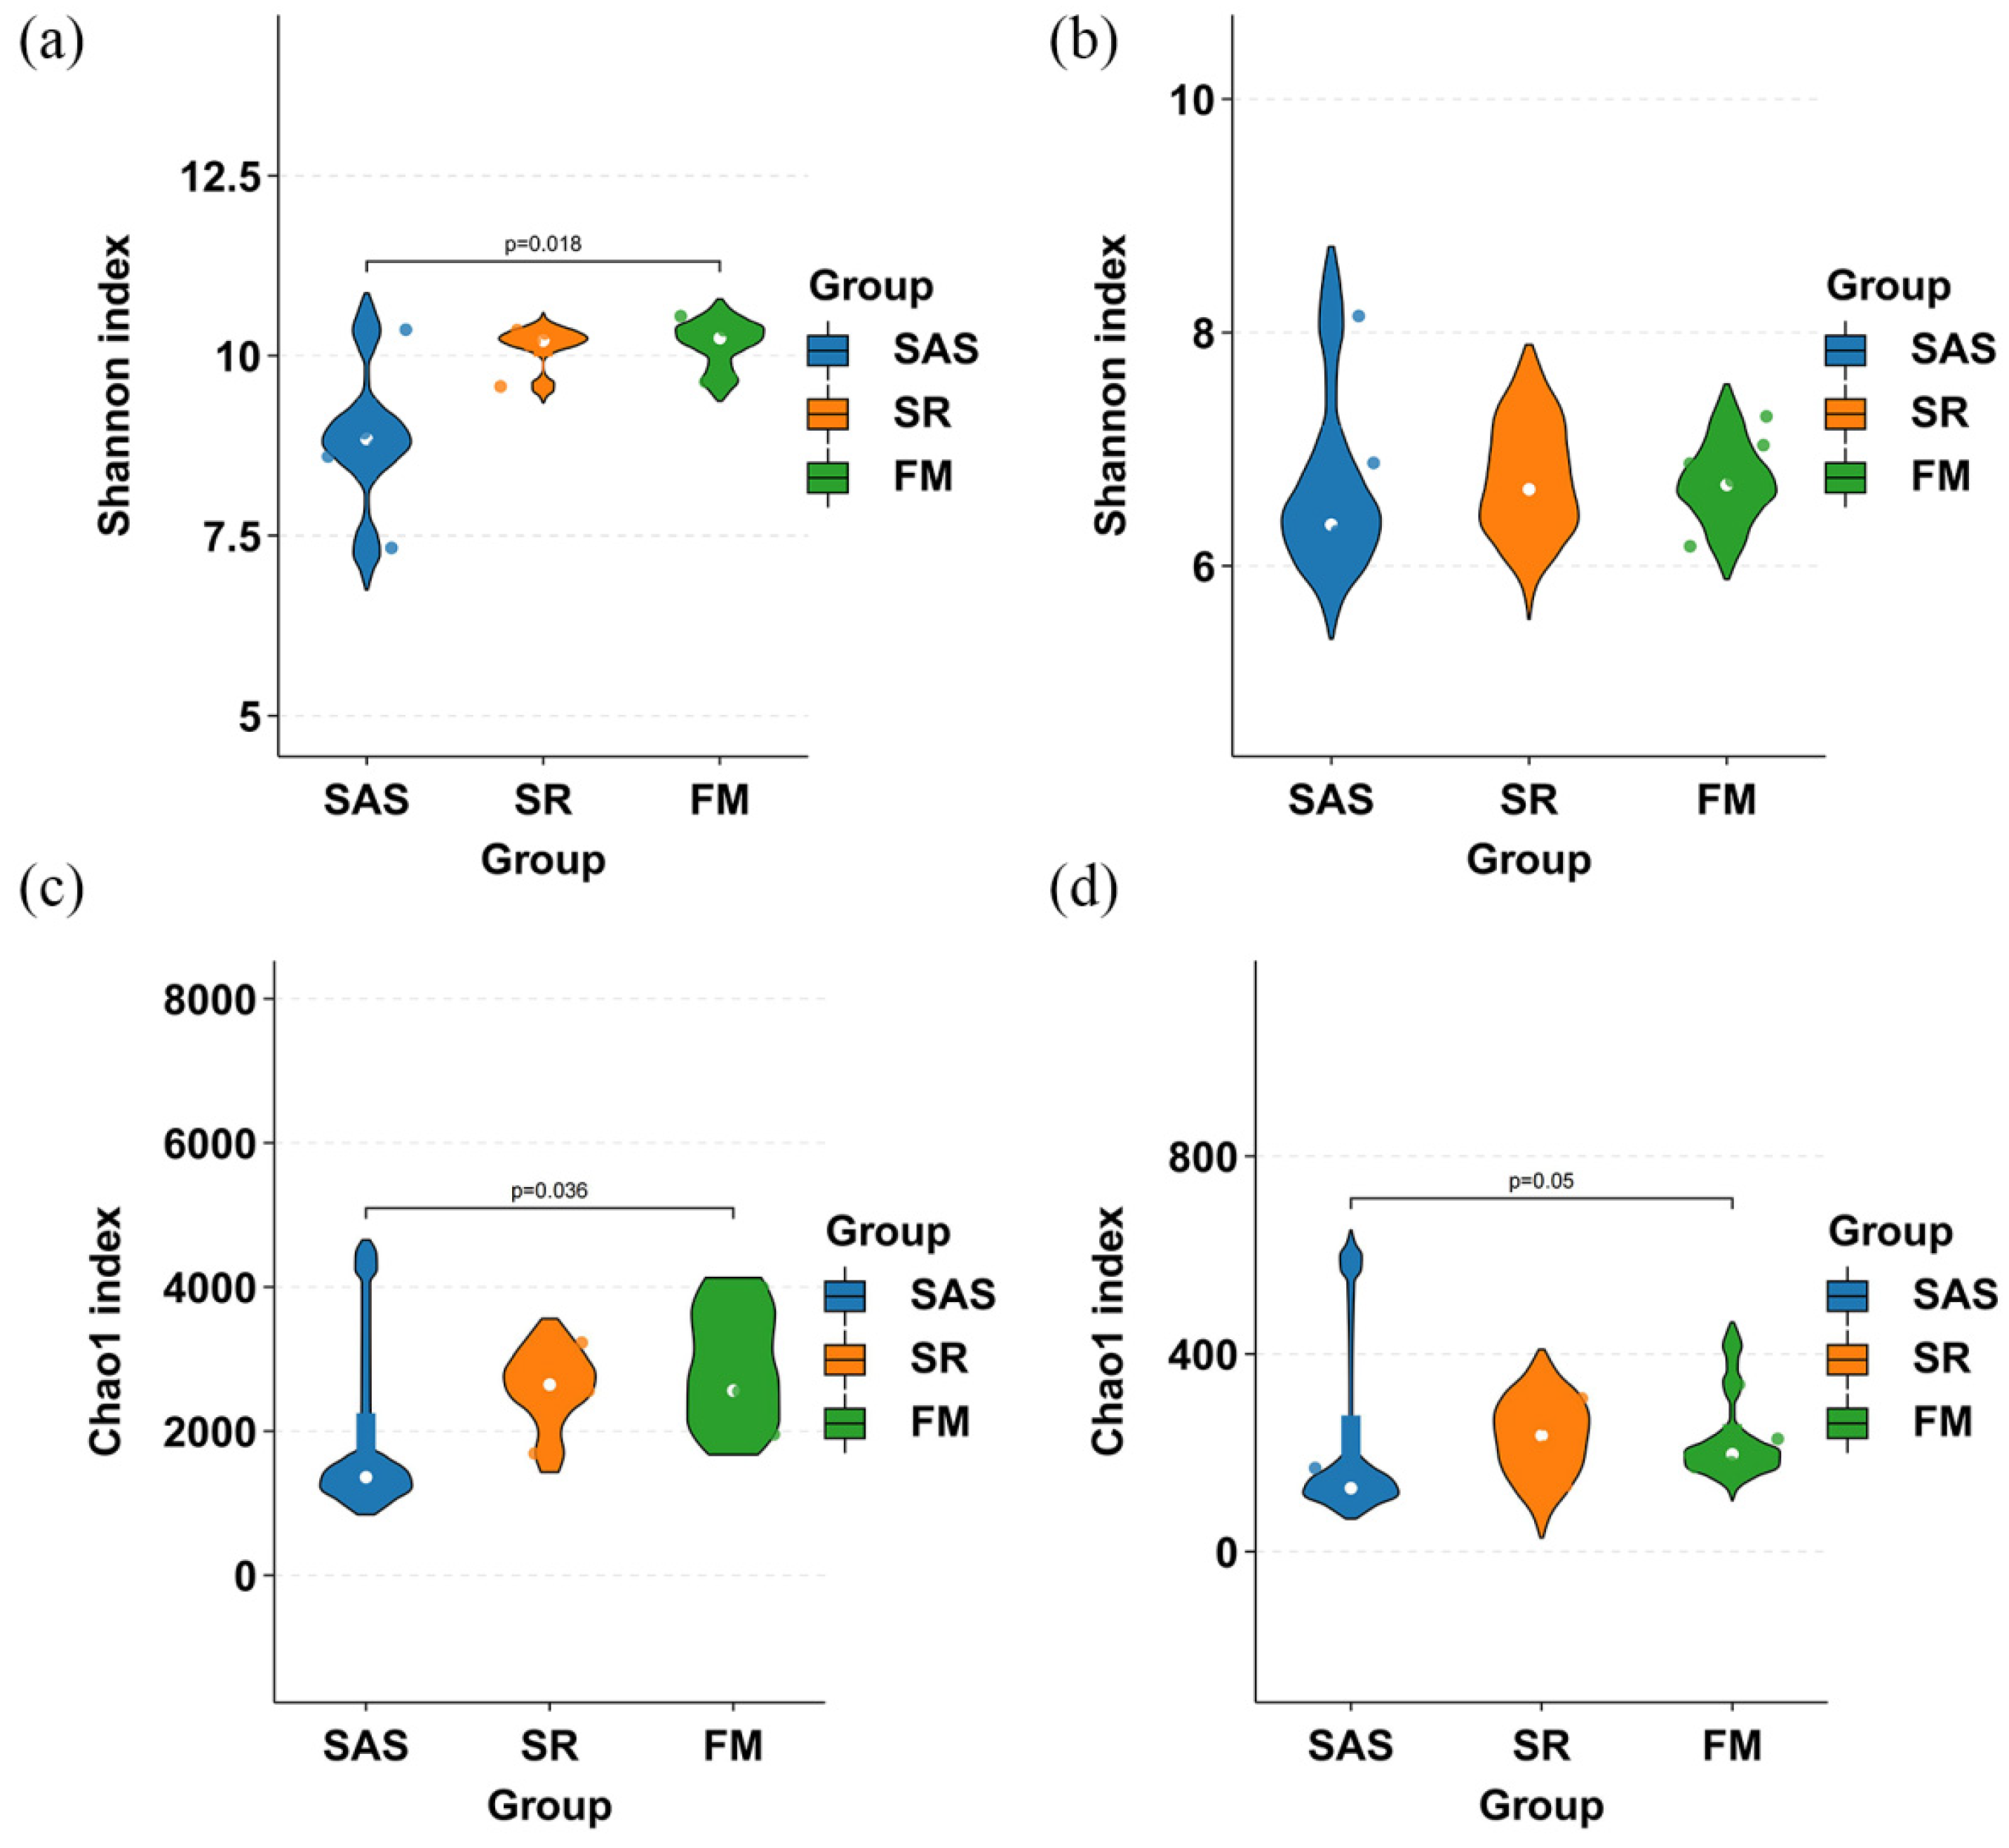
Alpha diversity under different farmland types showed different patterns between bacteria and fungi (Figure 4). The Shannon index for bacterial communities in SAS was generally low with considerable dispersion (central values ranging from approximately 8.6 to 9.2), whereas SR and FM exhibited more concentrated distributions and higher overall levels (SR ranging from approximately 9.9 to 10.3, FM ranging from approximately 10.1 to 10.5). The platform-based Wilcoxon rank-sum test suggested a difference signal between SAS and FM (p = 0.018) (Figure 4a). In contrast, the Shannon index for fungal communities showed greater overlap across the three farmland types, with no clear difference signal indicated by the platform in the figure (Figure 4b). This suggests that, at the sampling scale employed in this study and under current data conditions, variation in fungal community diversity was relatively limited. It should be noted that the parallel subsamples from the same sampling point in this study originated from the same composite sample. They were primarily used to reflect within-point variability and assess measurement repeatability. Therefore, the statistical test results here serve mainly as supplementary information to support the assessment of trends in intergroup differences.
To provide supplementary validation of the α diversity patterns from a richness dimension, we further compared the Chao1 index (Figure 4). The bacterial community Chao1 showed overall lower values in SAS, while SR and FM exhibited relatively higher ranges; platform testing suggested a difference signal between SAS and FM (p = 0.036) (Figure 4c). Fungal communities showed greater overlap among the three farmland types in Chao1 analysis, with the comparison between SAS and FM yielding a borderline signal (p = 0.05) (Figure 4d). The above results, together with the Shannon index, indicate that bacterial communities showed more pronounced variation in α diversity across different farmland types, whereas fungal communities showed relatively moderate variation.

3.4. Microbial Community Beta Diversity and Intergroup Differentiation

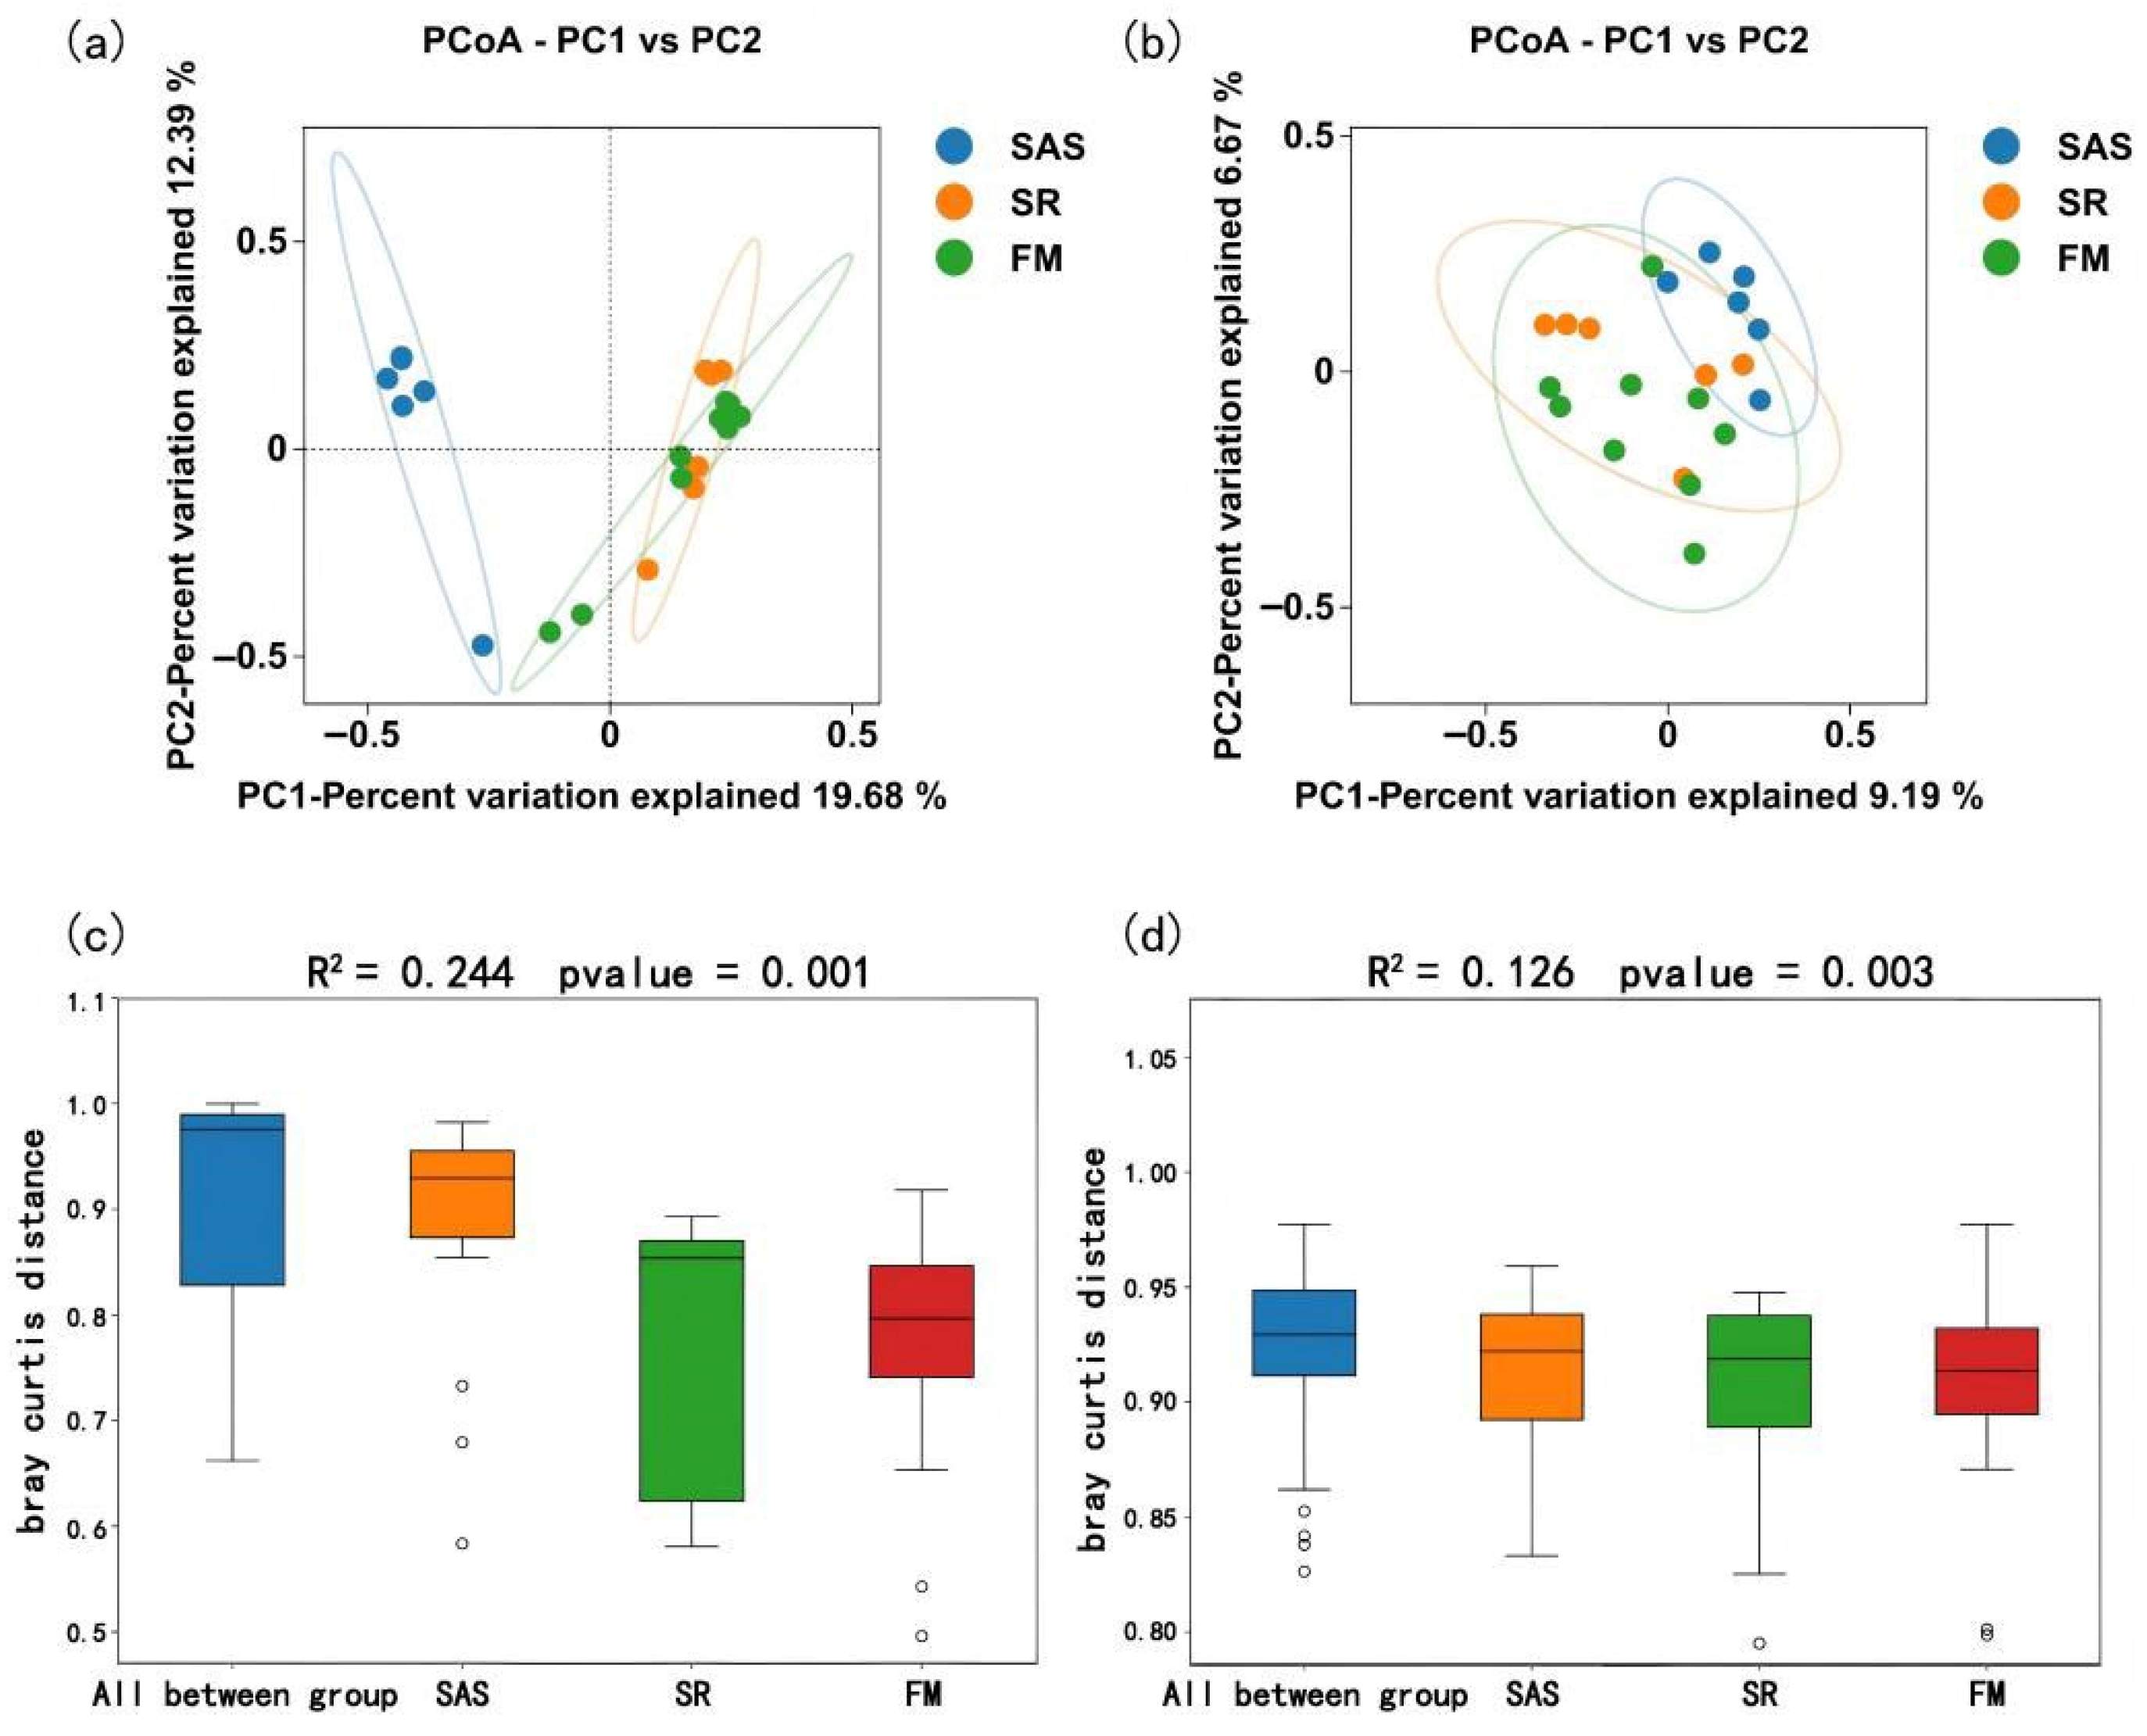
Principal coordinate analysis (PCoA) based on Bray–Curtis distance revealed visible separation among the three farmland types at the community structure level, with differing separation patterns observed between bacteria and fungi (Figure 5). In the bacterial community (16S), PC1 and PC2 explained 19.68% and 12.39% of the variance, respectively. Samples exhibited a relatively clear intergroup distribution in the ordination space: SAS samples predominantly clustered in the negative region of PC1, while SR and FM samples were more concentrated in the positive region of PC1. This pattern indicates clearer separation in bacterial community composition between SAS and the two lower-salinity farmland types (Figure 5a). In contrast, fungal community (ITS) PC1 and PC2 explained 9.19% and 6.67% of the variance, respectively. The confidence ellipses for the three farmland types showed more pronounced overlap, indicating relatively weak differentiation in fungal community structure at the current scale (Figure 5b).
PERMANOVA further suggested between-group differentiation among the three farmland types: bacterial community explained variance R2 = 0.244, p = 0.001 (Figure 5c), while fungal communities showed R2 = 0.126, p = 0.003 (Figure 5d). This suggests that differences among farmland types were associated with community structure variation, and this association appeared stronger in bacteria than in fungi. Meanwhile, differences in within-group dispersion were also observed for Bray–Curtis distances: distances were generally higher in the SAS and relatively lower in FM within bacterial communities, whereas SR showed a wider distribution range, suggesting greater within-group variability (Figure 5c). Intra-group distances within fungal communities showed little variation across the three land-use types (Figure 5d), consistent with the overlapping patterns observed in the PCoA analysis.

3.5. Environmental Constraints on Community Differentiation (db-RDA)

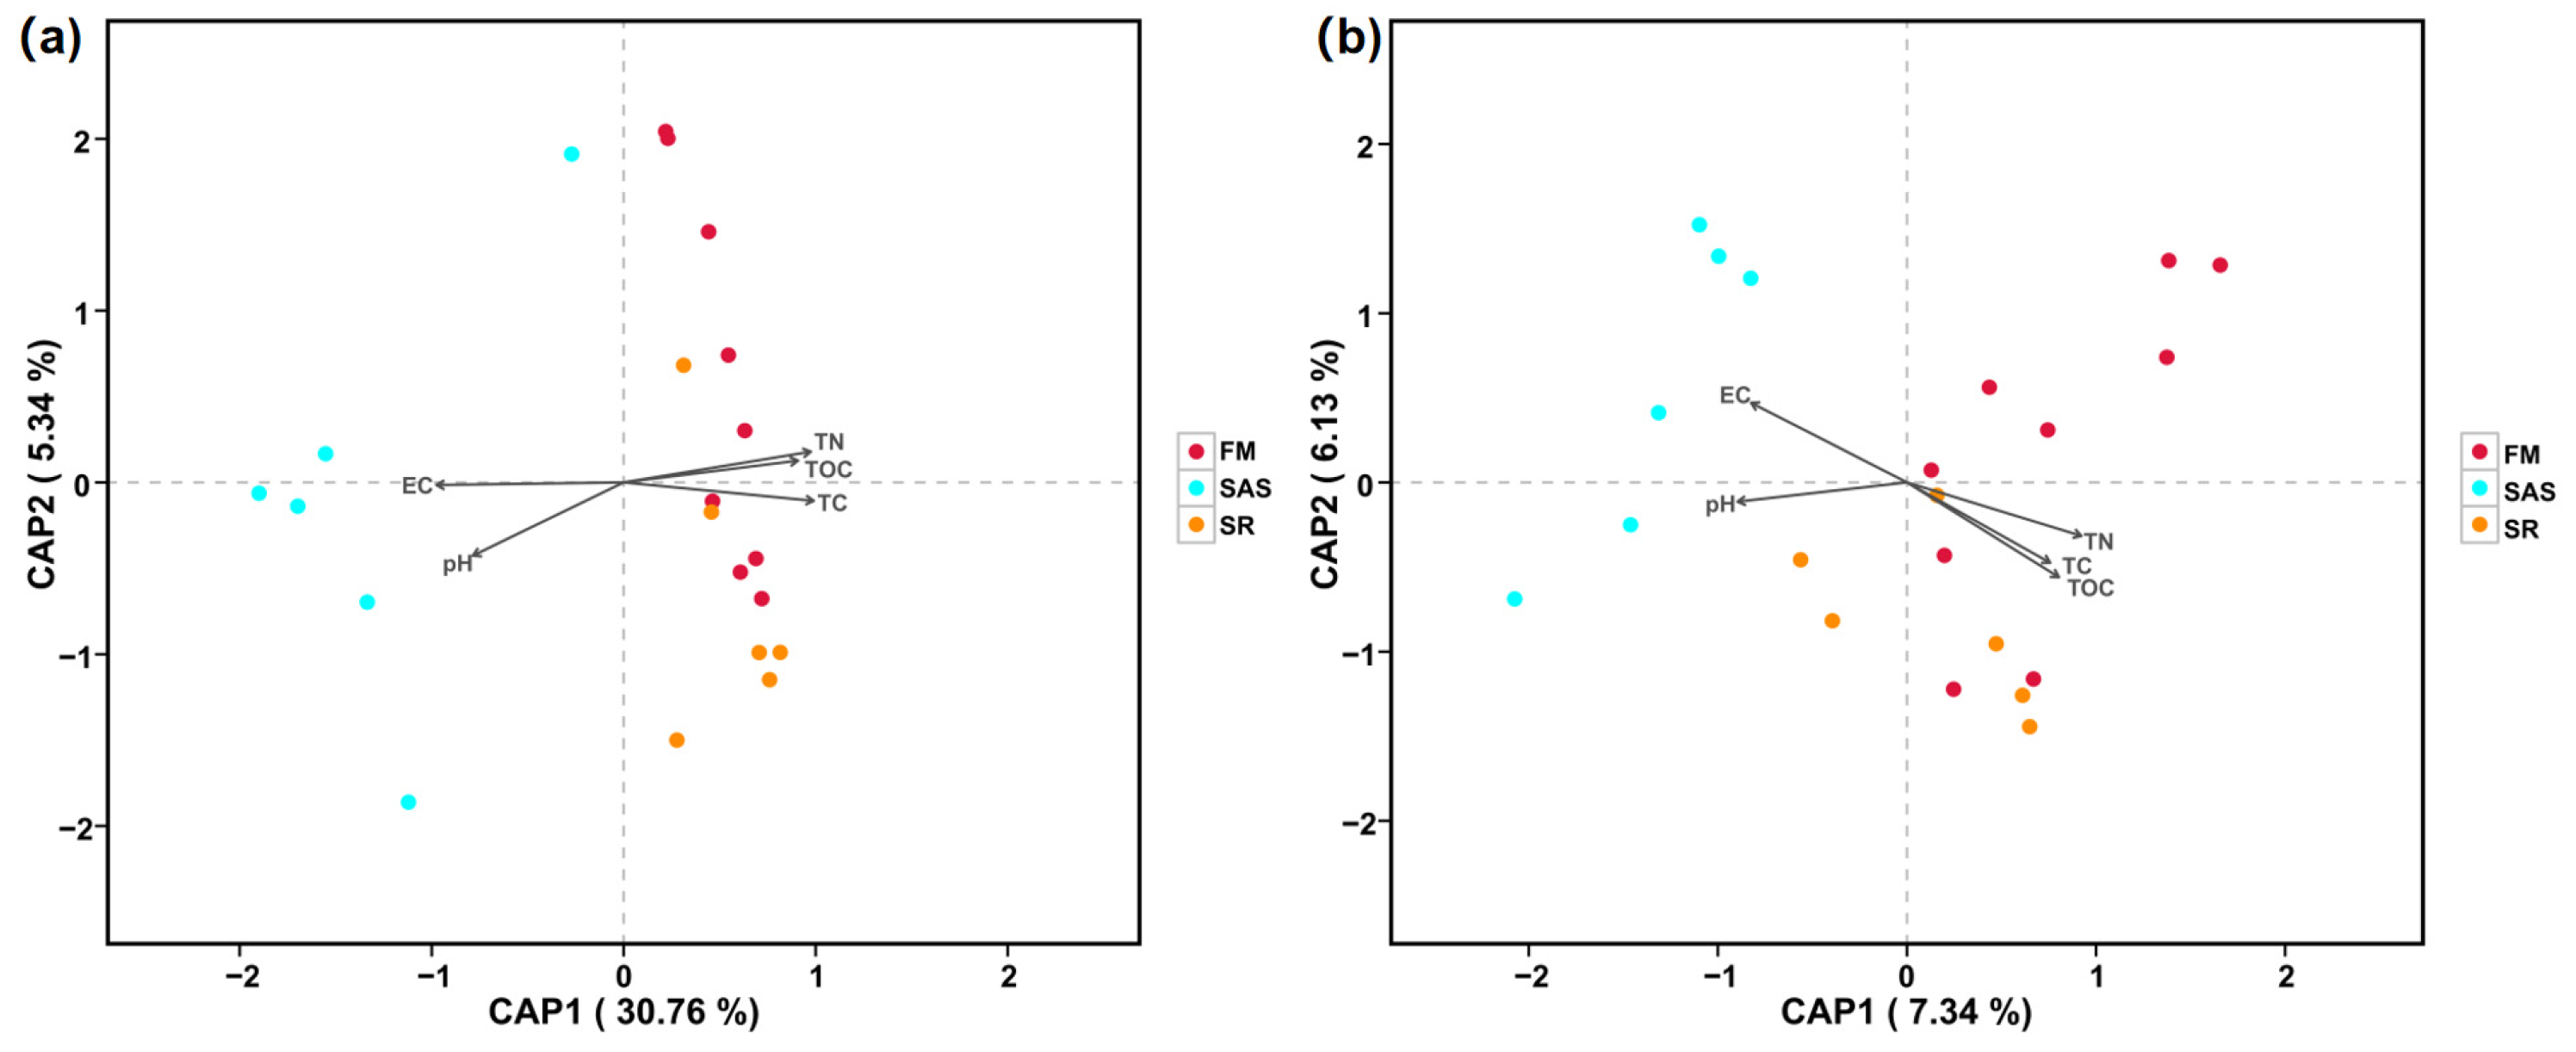
To characterize the relationship between community structure variation and soil physicochemical factors, db-RDA analysis was conducted based on Bray–Curtis distances (Figure 6). Within the bacterial community, constrained ordination revealed that CAP1 explained 30.76% of the variance, while CAP2 explained 5.34% (Figure 6a). The environmental vectors of EC and pH were oriented toward the negative side of CAP1 and corresponded to the main distribution area of SAS samples. Conversely, TC, TN, and TOC vectors collectively pointed positively toward CAP1, corresponding to the concentrated region of SR/FM samples. These results indicate that bacterial community variation was correlated with the joint variation in salinity-related factors and carbon–nitrogen-related properties. EC and pH were more closely aligned with the separation of SAS from SR and FM. TC, TN, and TOC were more closely associated with the distribution of SR and FM samples along the positive side of CAP1 (Figure 6a).
In the db-RDA analysis of fungal communities, CAP1 and CAP2 explained 7.34% and 6.13% of the variance, respectively (Figure 6b), indicating relatively limited explanatory power for the first two constrained axes. In terms of environmental factor vector directions, EC and pH were still oriented toward the negative side of CAP1, while TC, TN, and TOC were mainly oriented toward the positive side of CAP1, broadly consistent with the bacterial pattern (Figure 6b). However, overlap among fungal samples from the three farmland types was more pronounced in the ordination space, suggesting that, at the present sampling scale and under the measured soil properties included in this study, the association between fungal community structure and these physicochemical factors was comparatively weak. Taken together, the bacterial and fungal db-RDA results suggest that community differentiation among the three farmland types was more clearly reflected in bacterial communities, with a more consistent correspondence to variation in salinity-related factors (EC, pH) and carbon–nitrogen-related properties (TC, TN and TOC). In contrast, fungal communities showed weaker separation and lower constrained explanatory power under the current analytical framework (Figure 6).

3.6. Differences in Bacterial and Fungal Community Composition at the Phylum Level

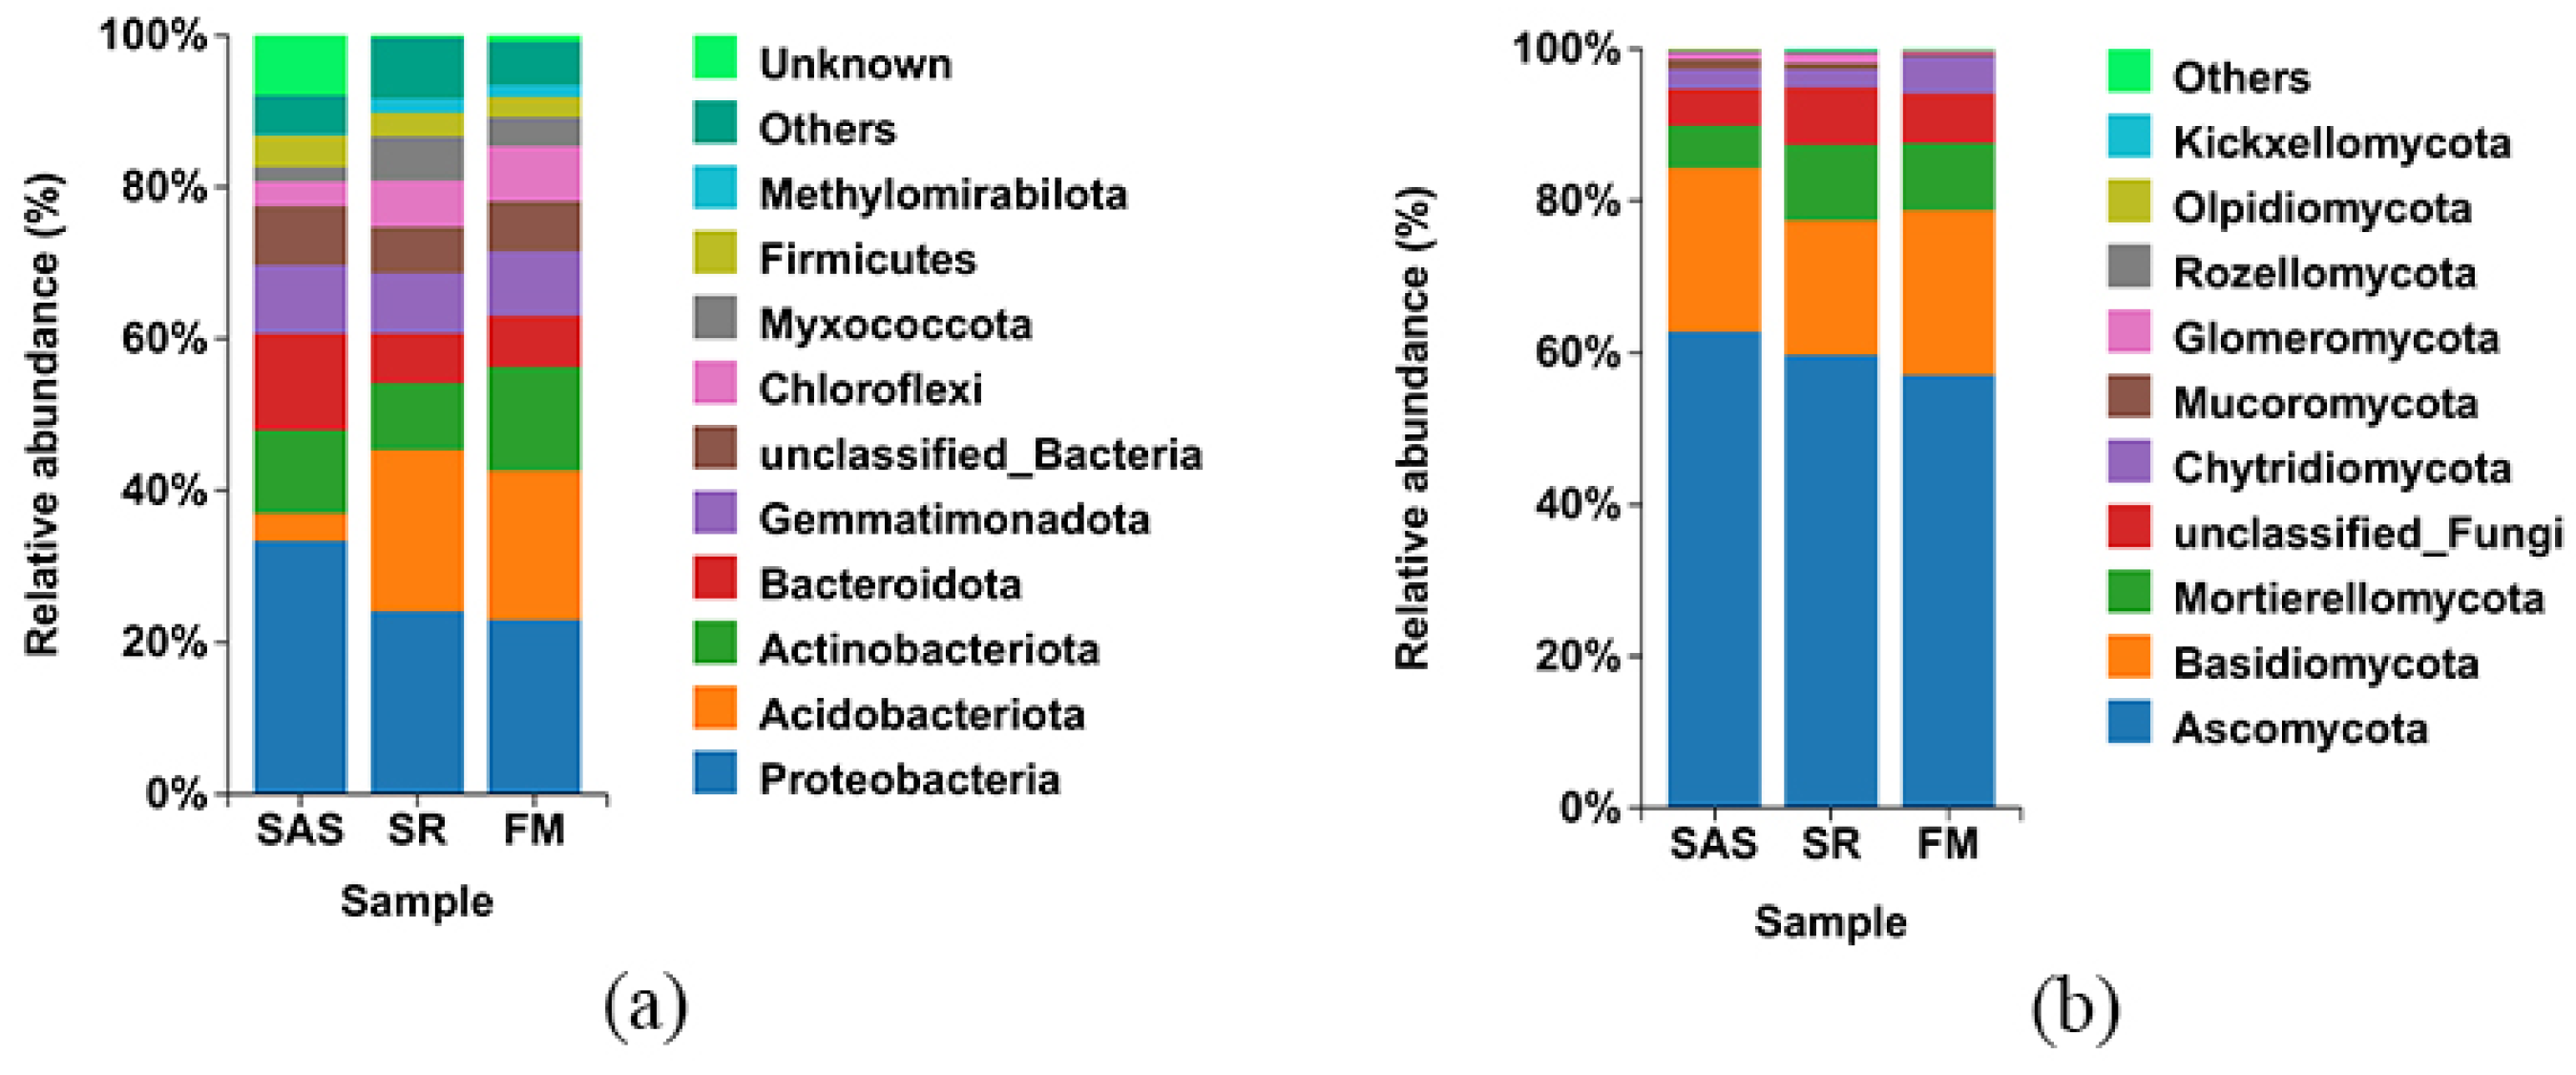
At the phylum level, bacterial communities across three farmland types were dominated by a small number of phyla (Figure 7a). Overall, Proteobacteria, Acidobacteriota, Actinobacteriota, Bacteroidota, and Gemmatimonadota constituted the major components, whereas other bacterial phyla and “Others/Unknown” accounted for relatively low proportions. Visual differences in the relative abundance of dominant phyla were observed among the three farmland types: SAS showed a compositional pattern distinct from SR and FM, while SR and FM were overall similar, although relative changes in certain phyla were still observable between SR and FM (Figure 7a).
Fungal communities at the phylum level also showed a pattern in which a few dominant phyla prevailed (Figure 7b). All three farmland types showed Ascomycota as the dominant phylum, followed by Basidiomycota as the second most abundant group. Additionally, they contained lower proportions of Mortierellomycota, unclassified_Fungi, Chytridiomycota, Mucoromycota, Glomeromycota, and other phyla. Across the three farmland types, the dominant fungal phyla generally remained stable, although fluctuations were still observed in the relative abundance of non-dominant phyla such as Mortierellomycota (Figure 7b).

3.7. Correlations Between Dominant Microbial Phyla and Soil Physicochemical Properties

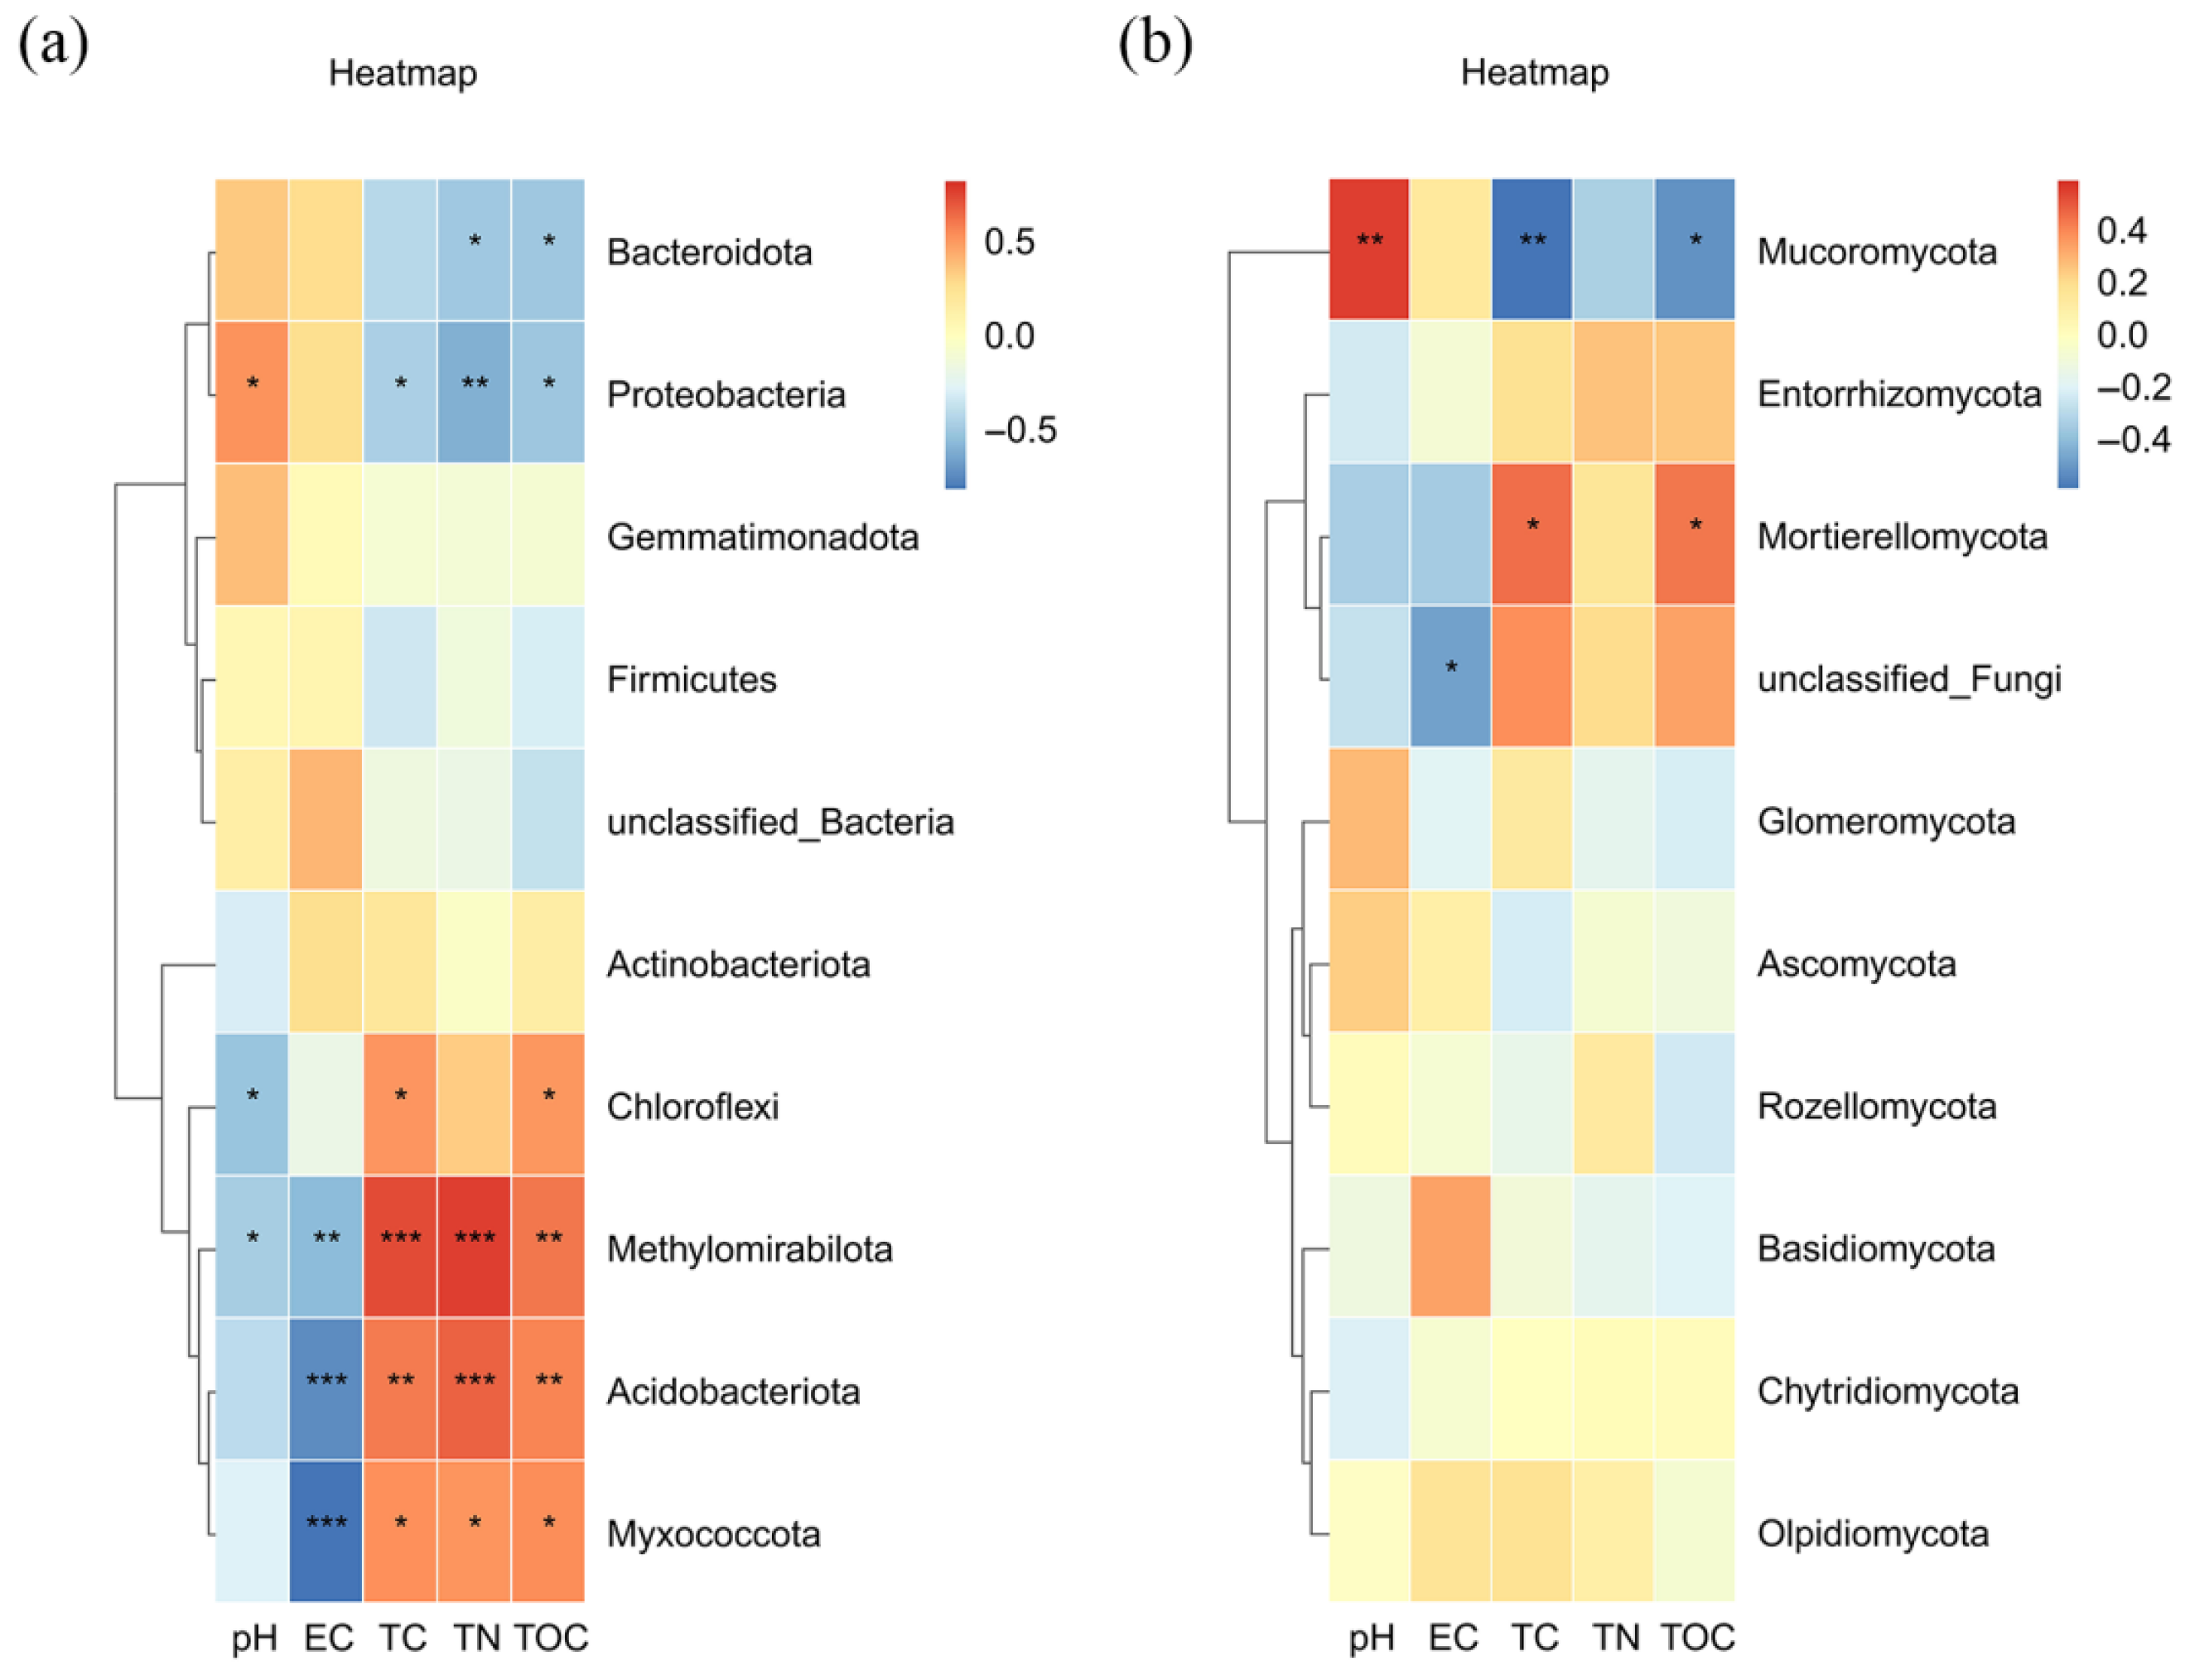
We assessed phylum-level associations between relative abundance and key soil variables, including pH, EC, TC, TN, and TOC, and visualized the correlation structure as a heatmap (Figure 8). Among bacteria, Acidobacteriota, Methylomirabilota, and Myxococcota generally showed positive associations with TC, TN, and TOC and negative associations with pH and EC., whereas Proteobacteria and Bacteroidota displayed an opposing pattern (Figure 8a). This pattern was broadly consistent with the orientation of environmental vectors in the db-RDA results. For fungi, Mucoromycota was more strongly related to pH and tended to decrease with TC and TOC, while Mortierellomycota tended to increase with TC and TOC (Figure 8b). This pattern was consistent with an association between carbon-related properties and variation in fungal phyla such as Mortierellomycota. As with any correlation-based summary, these results indicate covariation rather than causation.

4. Discussion

4.1. Associations of Straw-Returning Farmland with Soil Physicochemical Properties

Compared with SAS, both SR and FM showed lower soil EC and higher TC, TOC, and TN to varying degrees. Straw-returning farmland was correlated with relatively higher TOC and C/N values in the present comparison (Figure 3). The lower EC observed in both SR and FM relative to SAS may reflect the combined influence of long-term cultivation, irrigation-drainage regulation, and crop uptake, which may reduce salt accumulation in the surface soil under managed farmland conditions [4,5]. In SR, additional straw input may further contribute to reduced surface salt accumulation through improvements in soil structure and aggregation [7,36]. For instance, a previous study showed that applying wheat and rapeseed straw to saline–alkali soils may lower soil pH and total salinity while increasing organic matter, alkali-hydrolyzable nitrogen, available phosphorus, and total potassium content [7]. Another meta-analysis also reported that straw incorporation was correlated with an average 12.7% increase in soil organic carbon content in farmland [6]. As an external source of organic carbon, straw input has been reported to increase soil carbon stocks and promote carbon sequestration through improvements in soil structure and aggregate formation [36]. The higher C/N ratio observed in SR in this study may indicate greater carbon retention in soil, coupled with a relatively slower rate of nitrogen mineralization, which may favor the accumulation and stabilization of soil organic matter [37].

4.2. Microbial Community Differentiation in Relation to Salinity and Carbon–Nitrogen Properties

The db-RDA results in this study suggest that bacterial community variation was correlated with salinity-related factors and carbon–nitrogen-related properties (Figure 6). The ordination pattern showed that SAS samples were more closely aligned with EC and pH vectors, whereas SR and FM samples were more closely associated with TC, TN, and TOC vectors. The clear separation of SAS from SR and FM along salinity-related variables in this study is consistent with previous findings that soil pH is an important factor associated with microbial diversity variation under global change contexts [38]. In saline–alkali soils, salt-tolerant groups such as the Proteobacteria and Bacteroidota phyla typically exhibit higher relative abundances [39], consistent with the trends observed for these two microbial groups in SAS samples in this study (Figure 8a). In the present comparison, SR and FM were associated with higher carbon and nitrogen pools than SAS, and may therefore have provided more favorable resource conditions for microbial groups related to nutrient cycling. Acidobacteriota and Myxococcota were positively correlated with TC, TN, and TOC, and previous studies have shown that these groups are commonly enriched in organic-rich environments and participate in complex organic matter degradation [40]. Multiple studies indicate that after straw addition, changes in soil active carbon fractions (e.g., microbial biomass carbon, soluble organic carbon) are more sensitive than total organic carbon and directly correlate with microbial community shifts [37]. This may help explain why SR and FM, despite similar TC levels, still showed some degree of bacterial community differentiation in relation to TOC variation. However, this comparison should be interpreted with caution, because SR and FM differed not only in straw return practice but also in nitrogen fertilization rate.

4.3. Contrasting Patterns of Bacterial and Fungal Communities Among Farmland Types

Furthermore, bacterial and fungal communities showed contrasting patterns across the three farmland types. Bacterial α-diversity (Shannon and Chao1 indices) and β-diversity (PCoA separation, PERMANOVA R2 values) showed clearer variation than those of fungi (Figure 4 and Figure 5). This pattern suggests that bacterial community structure and diversity were more closely associated with differences in salinity and organic matter status. One possible explanation is that bacteria may respond more rapidly than fungi to resource fluctuations and environmental stresses because of their shorter generation times [41]. In contrast, fungal communities showed relatively weaker variation across the three farmland types. Fungal α-diversity showed no clear difference signal, and β-diversity separation was comparatively weaker (Figure 4b and Figure 5b,d). However, at the phylum level, Ascomycota and Basidiomycota remained dominant, whereas the relative abundance of Pezizomycota was positively correlated with carbon-to-nitrogen ratios (Figure 7b and Figure 8b). This suggests that although the overall fungal community structure was relatively stable, variation in some functionally specialized groups (e.g., Ascomycota associated with organic matter decomposition) may still have been associated with resource-related properties. Previous studies indicate that fungi, particularly rare taxa with low sequence counts and low relative abundance in sequencing datasets, may be more sensitive than bacteria to changes in abiotic factors like soil moisture [41]. However, in the present study, variation in salinity and carbon-related properties may have been more closely associated with bacterial community differentiation. Another study on organic fertilizer management similarly found that fungal communities sometimes respond more sensitively to fertilization regimes than bacterial communities, exhibiting more pronounced diversity changes [42]. Such inconsistencies may stem from differences in study systems, stress types, and management histories.

4.4. Correlations of Key Microbial Phyla with Soil Physicochemical Properties and Their Potential Ecological Implications

Correlation analysis showed associations between specific microbial phyla and key soil physicochemical properties (Figure 8). Within bacterial communities, Acidobacteriota and Methylomirabilota showed positive correlations with TC, TN, and TOC, while exhibiting negative correlations with pH and EC. In contrast, Proteobacteria showed an opposite pattern. This pattern is broadly consistent with ecological differentiation among microbial groups in saline–alkali soils. Acidobacteriota are often associated with soils of relatively low pH and high organic matter content and are involved in soil carbon cycling [11], whereas certain Proteobacteria groups (e.g., γ-Proteobacteria) are known for broad salt tolerance [7]. For fungal communities, Mortierellomycota showed strong positive correlations with TC and TOC. This phylum includes many important organic matter decomposers and plant symbionts, and its increased abundance has often been associated with higher soil fertility and more active carbon transformation in previous studies [7]. The positive correlation between Mucoromycota and pH may be consistent with its adaptation to alkaline environments. These associations suggest that phyla such as Acidobacteriota and Ascomycota may have potential as candidate biological indicators of enhanced carbon and nitrogen resources and microbial functional shifts during saline–alkali soil remediation. This aligns with findings from a European soil microbiome study, which concluded that the abundance of specific microbial groups such as Actinomycetota, Acidobacteriota, and Ascomycota can serve as context-dependent biomarkers for predicting ecosystem multifunctionality [11].

4.5. Limitations of the Present Study

This study should be interpreted in light of several limitations. First, the field investigation was based on a one-time observational comparison rather than a randomized controlled design; therefore, the differences observed among SAS, SR, and FM should be interpreted as associations rather than direct causal effects. Second, the number of independent sampling points was limited, and the three parallel subsamples from each sampling point originated from the same composite sample; accordingly, these parallel subsamples were used primarily to reflect within-point variability and analytical repeatability rather than as independent biological replicates. Third, comparisons between SR and FM require particular caution because these two farmland types differed not only in straw return practice but also in nitrogen fertilization rate, which may have introduced confounding effects in the interpretation of intergroup differences. In addition, alternative explanations related to site history and small-scale spatial heterogeneity cannot be fully excluded. Therefore, the present findings are best regarded as descriptive and hypothesis-generating, and further controlled studies with greater replication are needed to verify the proposed ecological interpretations.

5. Conclusions

This study found that compared with SAS, straw-returning farmland was correlated with lower soil EC and higher TC, TOC, and TN levels. SR also showed relatively higher C/N values, which may be consistent with greater organic matter retention. Microbial community differentiation in this study was correlated with variation in salinity-related factors and carbon–nitrogen-related properties. Among the two major microbial groups, bacterial communities showed clearer variation than fungal communities across the three farmland types, and bacterial community variation showed a more consistent association with salinity-related factors and carbon–nitrogen-related properties. Phyla such as Acidobacteriota and Ascomycota showed associations with key environmental factors and may have potential as candidate ecological indicators. Taken together, these findings suggest that straw-returning farmland differed from SAS in both soil physicochemical properties and microbial community characteristics, and that these differences may be related to variation in salinity status and resource conditions. Bacterial communities may be more suitable than fungal communities as candidate indicators of early microbial variation during saline–alkali soil remediation. In contrast, variation in some fungal groups may be related to longer-term ecological processes such as soil organic matter transformation. Overall, the present study provides comparative field evidence for understanding soil-microbe associations in saline-affected farmlands. Given the observational design and limited number of independent sampling points, these findings should be regarded as descriptive and hypothesis-generating, and further controlled studies are needed to verify the proposed ecological interpretations and management implications.

Supplementary Materials

The following supporting information can be downloaded at: https://www.mdpi.com/article/10.3390/agronomy16080833/s1, Table S1. Sequencing depth statistics and ASV numbers for each sample.

Author Contributions

H.Z.: Conceptualization, Writing—Original draft, Data Curation. T.C.: Conceptualization, Writing—Original draft and Investigation. C.Y.: Writing—Original draft and Validation. X.Z.: Resources and Validation. M.W.: Resources and Validation. T.Z.: Data Curation and Methodology. X.D.: Validation, Supervision. P.W.: Resources and Validation. Q.Y.: Validation, Supervision, Writing—Reviewing and Editing. F.W.: Validation, Supervision. J.L.: Validation, Supervision, Writing—Reviewing and Editing, and Funding acquisition. All authors have read and agreed to the published version of the manuscript.

Funding

This study was supported by the Joint Funds of the National Natural Science Foundation of China (U23A20158), the Key Research and Development Program of Tianjin (24YFXTHZ00050; 23JCYBJC01180; 23YFZCSN00400), the National Fire and Rescue Administration Science and Technology Program Research and Development (2024XFCX22), and the Fundamental Research Funds for the Central Universities (Nankai University).

Data Availability Statement

The raw data supporting the conclusions of this article will be made available by the authors on request.

Acknowledgments

Thanks to the valuable comments from the anonymous reviewers and editors. During the preparation of this manuscript, the author(s) used DeepL Translator (web version; available at https://www.deepl.com/translator; accessed on 16 April 2026) for translation and language editing. The authors have reviewed and edited the output and take full responsibility for the content of this publication.

Conflicts of Interest

Author Jinpeng Liu was employed by the company Tianjin Eco-City Environmental Production Co., Ltd. The remaining authors declare that the research was conducted in the absence of any commercial or financial relationships that could be construed as a potential conflict of interest.

References

  1. Wei, W.; Xiao, Q.; Bai, Y.; Wang, W.; Wang, H.; Yang, W.; Liu, Y.; Wu, K.; Wu, D.; Zhao, Y.; et al. Soil quality and its determinants in saline-alkali land of northwest China. Front. Environ. Sci. 2025, 13, 1687358. [Google Scholar] [CrossRef]
  2. Du, W. Current Issues and Countermeasures for the Remediation of Saline-Alkali Lands in the Yellow River Irrigation Districts of Ningxia. South China Agric. 2025, 19, 141–143. [Google Scholar] [CrossRef]
  3. Li, W.; Kang, S.; Du, T.; Ding, R.; Zou, M. Optimal groundwater depth and irrigation amount can mitigate secondary salinization in water-saving irrigated areas in arid regions. Agric. Water Manag. 2024, 302, 109007. [Google Scholar] [CrossRef]
  4. Wang, W.; Jing, H.; Guo, X.; Dou, B.; Zhang, W. Analysis of Water and Salt Spatio-Temporal Distribution along Irrigation Canals in Ningxia Yellow River Irrigation Area, China. Sustainability 2023, 15, 12114. [Google Scholar] [CrossRef]
  5. Zhang, J.; Ding, Q.; Wang, Y.; He, M.; Jia, K. Soil quality assessment and constraint diagnosis of salinized farmland in the Yellow River irrigation area in northwestern China. Geoderma Reg. 2023, 34, e00684. [Google Scholar] [CrossRef]
  6. Xin, J.; Yan, L.; Cai, H. Response of soil organic carbon to straw return in farmland soil in China: A meta-analysis. J. Environ. Manag. 2024, 359, 121051. [Google Scholar] [CrossRef] [PubMed]
  7. Ma, W.; Ma, L.; Jiao, J.; Fahim, A.M.; Wu, J.; Tao, X.; Lian, Y.; Li, R.; Li, Y.; Yang, G.; et al. Impact of Straw Incorporation on the Physicochemical Profile and Fungal Ecology of Saline–Alkaline Soil. Microorganisms 2024, 12, 277. [Google Scholar] [CrossRef]
  8. Liu, X.; Liu, H.; Zhang, Y.; Chen, G.; Li, Z.; Zhang, M. Straw return drives soil microbial community assemblage to change metabolic processes for soil quality amendment in a rice-wheat rotation system. Soil Biol. Biochem. 2023, 185, 109131. [Google Scholar] [CrossRef]
  9. Zhang, D.; Hui, D.; Luo, Y.; Zhou, G. Rates of litter decomposition in terrestrial ecosystems: Global patterns and controlling factors. J. Plant Ecol. 2008, 1, 85–93. [Google Scholar] [CrossRef]
  10. Finn, D.; Page, K.; Catton, K.; Kienzle, M.; Robertson, F.; Armstrong, R.; Dalal, R. Ecological stoichiometry controls the transformation and retention of plant-derived organic matter to humus in response to nitrogen fertilisation. Soil Biol. Biochem. 2016, 99, 117–127. [Google Scholar] [CrossRef]
  11. Romero, F.; Labouyrie, M.; Orgiazzi, A.; Ballabio, C.; Panagos, P.; Jones, A.; Tedersoo, L.; Bahram, M.; Eisenhauer, N.; Sünnemann, M.; et al. The soil microbiome as an indicator of ecosystem multifunctionality in European soils. Nat. Commun. 2025, 17, 705. [Google Scholar] [CrossRef]
  12. Chen, S.; Zhang, X.; Shao, L.; Sun, H.; Niu, J.; Liu, X. Effects of straw and manure management on soil and crop performance in North China Plain. CATENA 2020, 187, 104359. [Google Scholar] [CrossRef]
  13. Chen, X.; Tang, Z.; Weng, Y.; Cai, H.; Wu, Y.; Zheng, B.; Li, J. Effects of 15-year straw incorporation on soil carbon composition and microbial community under wheat-maize rotation system in the Huang-Huai-Hai Plain. BMC Plant Biol. 2025, 25, 522. [Google Scholar] [CrossRef]
  14. Cui, Y.; Ning, Z.; Li, M.; Qin, X.; Yue, X.; Chen, X.; Zhu, C.; Sun, H.; Huang, Y. Microbial network-driven remediation of saline-alkali soils by salt-tolerant plants. Front. Microbiol. 2025, 16, 1565399. [Google Scholar] [CrossRef] [PubMed]
  15. Zhao, X.-Y.; Gao, J.-L.; Yu, X.-F.; Borjigin, Q.-G.; Qu, J.; Zhang, B.-Z.; Zhang, S.-N.; Li, Q.; Guo, J.-A.; Li, D.-B. Evaluation of the microbial community in various saline alkaline-soils driven by soil factors of the Hetao Plain, Inner Mongolia. Sci. Rep. 2024, 14, 28931. [Google Scholar] [CrossRef] [PubMed]
  16. in ‘t Zandt, D.; Kolaříková, Z.; Cajthaml, T.; Münzbergová, Z. Plant community stability is associated with a decoupling of prokaryote and fungal soil networks. Nat. Commun. 2023, 14, 3736. [Google Scholar] [CrossRef] [PubMed]
  17. Hu, L.; Ge, Y.; Zhou, L.; Li, Z.; Li, A.; Deng, H.; He, T. The Effects of Different Straw-Returning Methods on Soil Organic Carbon Transformation in Rice–Rape Rotation Systems. Agriculture 2025, 15, 1468. [Google Scholar] [CrossRef]
  18. Chen, R.; Zhang, J.; Wang, J.; Zhang, J.; Li, W.; Wang, Z. Carbon mineralization and microbial responses to saline-water irrigation in a drip-irrigated oasis cotton field: Variations across soil aggregate fractions. Agric. Water Manag. 2025, 320, 109852. [Google Scholar] [CrossRef]
  19. Bai, T.; Ran, C.; Ma, Q.; Miao, Y.; Li, S.; Lan, H.; Li, X.; Chen, Q.; Zhang, Q.; Shao, X. The Application of Straw Return with Nitrogen Fertilizer Increases Rice Yield in Saline–Sodic Soils by Regulating Rice Organ Ion Concentrations and Soil Leaching Parameters. Agronomy 2024, 14, 2807. [Google Scholar] [CrossRef]
  20. Chen, X.; Ma, X.; Liu, Z.; Gu, H.; Fang, H.; Shen, Z.; Zhang, H.; Wan, S.; Li, W.; Hao, X.; et al. Organic fertilizers increase microbial community diversity and stability slowing down the transformation process of nutrient cycling. Environ. Microbiome 2025, 20, 130. [Google Scholar] [CrossRef]
  21. Domnariu, H.; Trippe, K.M.; Botez, F.; Partal, E.; Postolache, C. Long-term impact of tillage on microbial communities of an Eastern European Chernozem. Sci. Rep. 2025, 15, 642. [Google Scholar] [CrossRef]
  22. Wang, R.; Zhang, H.; Sun, L.; Qi, G.; Chen, S.; Zhao, X. Microbial community composition is related to soil biological and chemical properties and bacterial wilt outbreak. Sci. Rep. 2017, 7, 343. [Google Scholar] [CrossRef] [PubMed]
  23. Gardes, M.; Bruns, T.D. ITS primers with enhanced specificity for basidiomycetes--application to the identification of mycorrhizae and rusts. Mol. Ecol. 1993, 2, 113–118. [Google Scholar] [CrossRef]
  24. White, T.J. Amplification and Direct Sequencing of Fungal Ribosomal RNA Genes for Phylogenetics; Academic Press: New York, NY, USA, 1990. [Google Scholar]
  25. Kozich, J.J.; Westcott, S.L.; Baxter, N.T.; Highlander, S.K.; Schloss, P.D. Development of a dual-index sequencing strategy and curation pipeline for analyzing amplicon sequence data on the MiSeq Illumina sequencing platform. Appl. Environ. Microbiol. 2013, 79, 5112–5120. [Google Scholar] [CrossRef]
  26. Bolger, A.M.; Lohse, M.; Usadel, B. Trimmomatic: A flexible trimmer for Illumina sequence data. Bioinformatics 2014, 30, 2114–2120. [Google Scholar] [CrossRef]
  27. Martin, M. Cutadapt removes adapter sequences from high-throughput sequencing reads. EMBnet J. 2011, 17, 10–12. [Google Scholar] [CrossRef]
  28. Callahan, B.J.; McMurdie, P.J.; Rosen, M.J.; Han, A.W.; Johnson, A.J.A.; Holmes, S.P. DADA2: High-resolution sample inference from Illumina amplicon data. Nat. Methods 2016, 13, 581–583. [Google Scholar] [CrossRef] [PubMed]
  29. Altschul, S.F.; Gish, W.; Miller, W.; Myers, E.W.; Lipman, D.J. Basic local alignment search tool. J. Mol. Biol. 1990, 215, 403–410. [Google Scholar] [CrossRef] [PubMed]
  30. Wang, Q.; Garrity, G.M.; Tiedje, J.M.; Cole, J.R. Naïve Bayesian Classifier for Rapid Assignment of rRNA Sequences into the New Bacterial Taxonomy. Appl. Environ. Microbiol. 2007, 73, 5261–5267. [Google Scholar] [CrossRef]
  31. Quast, C.; Pruesse, E.; Yilmaz, P.; Gerken, J.; Schweer, T.; Yarza, P.; Peplies, J.; Glöckner, F.O. The SILVA ribosomal RNA gene database project: Improved data processing and web-based tools. Nucleic Acids Res. 2013, 41, D590–D596. [Google Scholar] [CrossRef]
  32. Nilsson, R.H.; Larsson, K.-H.; Taylor, A.F.S.; Bengtsson-Palme, J.; Jeppesen, T.S.; Schigel, D.; Kennedy, P.; Picard, K.; Glöckner, F.O.; Tedersoo, L.; et al. The UNITE database for molecular identification of fungi: Handling dark taxa and parallel taxonomic classifications. Nucleic Acids Res. 2018, 47, D259–D264. [Google Scholar] [CrossRef]
  33. R Core Team. R: A Language and Environment for Statistical Computing; R Foundation for Statistical Computing: Vienna, Austria, 2025. [Google Scholar]
  34. Wickham, H. ggplot2: Elegant Graphics for Data Analysis; Springer: New York, NY, USA, 2016. [Google Scholar]
  35. Wickham, H.; Pedersen, T.L.; Seidel, D. scales: Scale Functions for Visualization, R package version 1.4.0; The Comprehensive R Archive Network: Vienna, Austria, 2025. [Google Scholar]
  36. Lian, H.; Wang, Z.; Li, Y.; Xu, H.; Zhang, H.; Gong, X.; Qi, H.; Jiang, Y. Straw Strip Return Increases Soil Organic Carbon Sequestration by Optimizing Organic and Humus Carbon in Aggregates of Mollisols in Northeast China. Agronomy 2022, 12, 784. [Google Scholar] [CrossRef]
  37. Chen, L.; Sun, S.; Zhou, Y.; Zhang, B.; Peng, Y.; Zhuo, Y.; Ai, W.; Gao, C.; Wu, B.; Liu, D.; et al. Straw and straw biochar differently affect fractions of soil organic carbon and microorganisms in farmland soil under different water regimes. Environ. Technol. Innov. 2023, 32, 103412. [Google Scholar] [CrossRef]
  38. Zhou, Z.; Wang, C.; Luo, Y. Meta-analysis of the impacts of global change factors on soil microbial diversity and functionality. Nat. Commun. 2020, 11, 3072. [Google Scholar] [CrossRef] [PubMed]
  39. Ma, B.; Gong, J. A meta-analysis of the publicly available bacterial and archaeal sequence diversity in saline soils. World J. Microbiol. Biotechnol. 2013, 29, 2325–2334. [Google Scholar] [CrossRef] [PubMed]
  40. Zhang, M.; Dang, P.; Haegeman, B.; Han, X.; Wang, X.; Pu, X.; Qin, X.; Siddique, K.H.M. The effects of straw return on soil bacterial diversity and functional profiles: A meta-analysis. Soil Biol. Biochem. 2024, 195, 109484. [Google Scholar] [CrossRef]
  41. Kaisermann, A.; Maron, P.A.; Beaumelle, L.; Lata, J.C. Fungal communities are more sensitive indicators to non-extreme soil moisture variations than bacterial communities. Appl. Soil Ecol. 2015, 86, 158–164. [Google Scholar] [CrossRef]
  42. Zhu, J.; Wen, H.; Su, X.; Tan, S.; Fang, Z.; Li, R.; Wang, W.; Zhang, J. Effects of Different Short-term Organic Fertilizer Management on Bacterial and Fungal Communities in a Sweet Potato Soil. J. Soil Sci. Plant Nutr. 2025, 25, 8360–8374. [Google Scholar] [CrossRef]
Figure 1. Location of the study area and sampling points. The blue lines represent the major river network in the study area.
Agronomy 16 00833 g001
Figure 2. Distribution characteristics of soil electrical conductivity (EC) and pH across three land categories (SAS, SR, FM). (a) Electrical conductivity (EC, soil:water = 1:5, dS·m−1; log10 scale); (b) pH (soil:water = 1:2.5). Boxplots display median and interquartile range (IQR), with whiskers extending to 1.5× IQR. This study employed a single sampling event, with results presented as descriptive comparisons. Colored dots represent parallel subsamples within each sampling point. The seven sampling points (SAS = 2, SR = 2, FM = 3) were treated as the independent field units, whereas parallel subsamples were used only to reflect within-point variability.
Agronomy 16 00833 g002
Figure 3. Distribution Characteristics of Soil Carbon and Nitrogen Indicators and Stoichiometric Ratios Across Different Farmland Types of Plots. (a) Total carbon (TC, %); (b) Total organic carbon (TOC, %); (c) Total nitrogen (TN, %); (d) Carbon-to-nitrogen ratio (C/N). Box plots display the median and interquartile range (IQR), with the whiskers extending to 1.5 times the IQR. Colored dots represent parallel subsamples within each sampling point. The seven sampling points (SAS = 2, SR = 2, FM = 3) were treated as the independent field units, whereas parallel subsamples were used only to reflect within-point variability.
Agronomy 16 00833 g003
Figure 4. Microbial α diversity (Shannon index) of bacterial and fungal communities in different farmland types. (a) Bacteria Shannon (16S rRNA); (b) Fungi Shannon (ITS); (c) Bacteria Chao 1 (16S rRNA); (d) Fungi Chao 1 (ITS). The brackets and p-values represent the Wilcoxon rank-sum test results output by the platform at the ASV level; non-significant comparisons for the fungal portion are not displayed. Because parallel subsamples from the same sampling point originated from the same composite sample, the displayed p-values are provided as supplementary information for descriptive comparison. The dots represent the corresponding data within each group.
Agronomy 16 00833 g004
Figure 5. Diversity and Community Segregation (Bray–Curtis—PCoA, 0–20 cm) (a) Bacterial communities; (b) Fungal communities; (c) Bray–Curtis distance distribution of bacterial communities among groups; (d) Bray–Curtis distance distribution of fungal communities among groups. The axes represent the explanatory variance (%) of the first two principal coordinates, with ellipses denoting the 95% confidence regions for group centers. The dotted lines indicate the zero positions of the two principal coordinates. Note: Distance metrics in this figure are based on Bray–Curtis at the ASV level. Because the seven sampling points were treated as the independent field units and parallel subsamples originated from the same composite sample, the ordination and associated statistical results are presented mainly for descriptive and exploratory comparison.
Agronomy 16 00833 g005
Figure 6. Relationships between microbial community variation and soil physicochemical factors based on db-RDA (0–20 cm) (a) Bacterial community; (b) Fungal community. The axes represent the explanatory variance (%) of the first two constrained axes. Distance metrics in this figure were calculated based on Bray–Curtis dissimilarity at the ASV level. Because the seven sampling points were treated as the independent field units and parallel subsamples originated from the same composite sample, the ordination results are presented mainly for descriptive and exploratory comparison.
Agronomy 16 00833 g006
Figure 7. Community composition at the phylum level (relative abundance %) (a) Bacteria; (b) Fungi. Each sample column was normalized to 100% relative abundance, with “unclassified/Others/Unknown” representing a combined category for unknown, low-abundance, and unclassified sequences. Results are presented as descriptive comparisons based on a single sampling event.
Agronomy 16 00833 g007
Figure 8. Heatmap of correlations between soil physicochemical properties and the relative abundance of dominant phyla (0–20 cm) (a) Bacteria; (b) Fungi. Rows: Top 10 dominant phyla; Columns: pH, EC, TC, TN, TOC. Species clustering and sample clustering were applied using the platform settings. Colors indicate the direction and relative strength of correlations, and only cells meeting the threshold of |r| ≥ 0.3 and p < 0.05 are displayed; “*” denotes the platform’s significance annotation and is presented here as supplementary information for exploratory reference (* indicates p < 0.05; ** indicates p < 0.01; *** indicates p < 0.001); “unclassified/Others/Unknown” represents a combined category of unclassified, low-abundance. and unknown sequences.
Agronomy 16 00833 g008
Disclaimer/Publisher’s Note: The statements, opinions and data contained in all publications are solely those of the individual author(s) and contributor(s) and not of MDPI and/or the editor(s). MDPI and/or the editor(s) disclaim responsibility for any injury to people or property resulting from any ideas, methods, instructions or products referred to in the content.