Article

QTL Mapping of Grain Quality Traits in Bread Wheat Using the Avalon × Cadenza Double Haploid Mapping Population Across Three Contrasting Regions of Kazakhstan


1
Institute of Plant Biology and Biotechnology, Almaty 050040, Kazakhstan
2
John Innes Centre, Norwich NR4 7UH, UK
3
Kazakh Research Institute of Agriculture and Plant Growing, Almalybak 040909, Kazakhstan
*
Author to whom correspondence should be addressed.
Agronomy 2026, 16(8), 832; https://doi.org/10.3390/agronomy16080832
Submission received: 11 March 2026 / Revised: 15 April 2026 / Accepted: 16 April 2026 / Published: 18 April 2026

Abstract

Grain quality in bread wheat is a complex trait determined by multiple genetic factors and their interaction with environmental conditions. This study investigated the genetic architecture of key grain quality traits in the Avalon × Cadenza double haploid (DH) population under contrasting climatic conditions in Kazakhstan. A set of 101 spring-type DH lines was evaluated over three years in three major wheat-growing regions of Kazakhstan, representing northern, central, and southern environments. Grain yield and nine grain quality traits were assessed, including amylose content (Amc, %), test weight per liter (TWL, g/L), grain protein content (GPC, %), gliadin content (Gli, %), glutenin content (Glu, %), grain hardness (GH, %), grain vitreousness (GV, %), falling number (FN, s), and sedimentation value determined in a 2% acetic acid solution (SV, mL). The objectives were to characterize phenotypic variation, examine trait relationships, and identify major and environmentally stable quantitative trait loci (QTLs) controlling grain quality. QTL mapping identified 89 QTLs associated with the nine studied traits, including 82 major QTLs explaining more than 10% of phenotypic variation and 16 stable QTLs detected in two or more environments. The largest numbers of QTLs were found for GPC, SV, and TWL. Stable QTLs were distributed across all three wheat genomes, with important regions detected on chromosomes 1A, 1B, 2D, 4A, 4D, 5A, 6A, and 7D. Several stable QTLs co-localized with genomic regions previously associated with grain quality and developmental regulation, including loci near Wx-B1, Rht-D1, and Ppd-D1, suggesting biologically meaningful links among gluten composition, starch biosynthesis, plant development, and grain physical properties. These results improve understanding of the genetic control of wheat grain quality across diverse environments in Kazakhstan and provide promising targets for marker-assisted selection to combine improved end-use quality with wide environmental adaptation.

1. Introduction

Bread wheat (Triticum aestivum L.) is one of the most important cereal crops worldwide and represents a major source of calories and protein for human nutrition [1]. In addition to grain yield, grain quality is a key target in wheat breeding programs, as it determines the suitability of wheat for various end uses, including bread making, pasta production, and other processed food products [2,3]. Grain quality traits are complex and are controlled by multiple genetic factors while being strongly influenced by environmental conditions such as temperature, water availability, and soil fertility [4,5].
Wheat grain quality is determined by an integrated set of biochemical, physical, and technological characteristics. Biochemical traits include grain protein content and composition, starch-related parameters, enzyme activity, lipids, ash, and moisture content. Physical traits comprise kernel size and shape, thousand-kernel weight, test weight, hardness, and vitreousness, while technological traits include water absorption, dough development time and stability, extensibility, gluten strength, flour yield, falling number, sedimentation value, and loaf volume [6]. Among these, protein-related traits play a central role in determining dough strength and viscoelastic properties, whereas starch composition influences grain texture, processing behavior, and baking performance [7,8,9,10].
The genetic regulation of grain quality traits is highly complex and predominantly polygenic, involving numerous quantitative trait loci (QTLs) distributed throughout the wheat genome [11]. Numerous QTLs have been identified for grain protein content [12,13], gluten strength [14], sedimentation value [15], grain hardness [16,17], and starch-related traits [18], with individual loci explaining variable proportions of phenotypic variance. A well-characterized example is the Gpc-B1 locus on chromosome 6BS, which encodes the NAC transcription factor NAM-B1, enhances nutrient remobilization during grain filling, and has been successfully utilized in breeding programs [12,19]. Gluten strength is largely determined by allelic variation at the Glu-1 loci, particularly Glu-B1 and Glu-A1 [20]. Grain hardness is primarily controlled by the Ha locus on chromosome 5DS, including the Pina-D1 and Pinb-D1 genes [21,22]. Starch functionality is strongly influenced by Wx genes encoding granule-bound starch synthase [23,24]. However, the expression of many QTLs is environment-dependent, resulting in significant genotype × environment interactions that complicate breeding applications [25].
In Kazakhstan, wheat is cultivated across diverse agro-climatic zones, ranging from the cooler, more humid northern regions to arid southern regions. These contrasting conditions lead to substantial variation in both grain yield and quality traits. Extensive research has demonstrated that Kazakh wheat germplasm exhibits considerable genetic diversity in protein content, gluten strength, sedimentation value, vitreousness, and falling number, particularly in northern production regions with sharply continental climates [26,27,28,29,30,31].
In addition to technological parameters, increasing attention has been paid to the nutritional quality, particularly the relationship between protein content and micronutrient accumulation [32]. Grain protein content is often positively associated with the concentrations of iron (Fe) and zinc (Zn), both of which are essential for human health [30]. Studies conducted under Kazakhstan conditions have revealed significant genetic variation in protein concentration and mineral composition, including analyses of a double-haploid mapping population, Chinese Spring × SQ1, tested in southern Kazakhstan [33]. More recently, QTL mapping of locally adapted populations, such as Pamyati Azieva × Paragon, identified genomic regions associated with agronomic traits, protein content, gluten-related traits, and starch parameters, providing molecular tools for marker-assisted selection under Kazakhstan environments [34,35]. These findings highlight the potential of Kazakh germplasm to simultaneously improve technological and nutritional quality.
Double-haploid (DH) mapping populations represent powerful tools for dissecting the genetic architecture of complex traits due to their complete homozygosity and enhanced mapping precision [36]. The Avalon × Cadenza DH population, derived from parents that differ in growth habit, photoperiod sensitivity, and vernalization requirement, provides an excellent resource for identifying QTLs that control grain quality traits across diverse environments [37,38,39,40,41,42,43,44]. Differences in developmental genes between parental lines may indirectly influence grain-filling dynamics and grain quality formation under contrasting climatic conditions.
Therefore, the objectives of the present study were to (1) evaluate phenotypic variation in grain quality including grain protein content, gliadin and glutenin contents, amylose content, grain hardness, vitreousness, falling number, sedimentation value, and test weight in the Avalon × Cadenza DH population grown in three contrasting regions of Kazakhstan; (2) analyze relationships among grain quality traits and yield; and (3) identify major and environmentally stable QTLs associated with these traits. Identification of stable genomic regions controlling grain quality will facilitate marker-assisted selection and support the development of wheat cultivars with improved quality and broad environmental adaptation.

2. Materials and Methods

2.1. Plant Materials and Experimental Design

A double haploid (DH) mapping population derived from the cross Avalon × Cadenza (A × C) was used in this study. The population consisted of 201 DH lines, including 100 winter-type and 101 spring-type genotypes, and was developed from two widely cultivated British bread wheat cultivars: Avalon (winter wheat) and Cadenza (spring wheat) [39]. The A × C DH population was generated within the framework of the Wheat Genetic Improvements Network (WGIN) program [45]. The parental cultivars Avalon and Cadenza differ in key developmental and agronomic genes associated with adaptation and plant architecture. In particular, they contrast in photoperiod sensitivity loci (Ppd-A1, Ppd-B1, and Ppd-D1) and vernalization genes (Vrn-A1, Vrn-B1, and Vrn-D1 in Avalon; Vrn-A1a in Cadenza). In addition, the parents differ in reduced height alleles, with Avalon carrying the semi-dwarfing allele Rht-D1b, whereas Cadenza carries the wild-type allele Rht-D1a [42]. Avalon is a UK semi-dwarf winter wheat cultivar (NABIM Group 1) released in 1979 and characterized by high bread-making quality and relatively short plant height (~65.6 cm). In contrast, Cadenza is a UK spring wheat cultivar (NABIM Group 2), released in 1991, characterized by a taller plant stature (~75.1 cm), high grain quality, and distinct stem structural traits, including a higher wall-thickness-to-stem-diameter ratio [40]. The parental lines also differ in canopy architecture traits such as plant height, leaf size, and leaf angle [37]. For the grain quality analysis, only the spring-type DH lines of the A × C population were selected, together with the parental cultivar Cadenza. Field trials were conducted over three growing seasons (2013–2015) in three contrasting regions of Kazakhstan: the Karabalyk Agricultural Experimental Station (North Kazakhstan, KB), the Karaganda Agricultural Experimental Station named after A.F. Khristenko (Central Kazakhstan, KA), and the Kazakh Scientific Research Institute of Rice Cultivation named after Ibray Zhakhaev (Kyzylorda region, South Kazakhstan, KO). In addition, field trials were conducted in 2012 at the Karaganda Agricultural Experimental Station (Table S1). At each location, all genotypes were evaluated in two replicates using a randomized experimental design with 1 m2 plots. Row spacing was 15 cm, and the distance between plants within rows was 5 cm, in accordance with standard field trial procedures [46]. Climatic conditions at experimental sites during the study period have been described previously [47].

2.2. Evaluation of Variation in Studied Traits in DH

Phenotypic assessment was performed for grain yield and nine grain quality-related traits: amylose content (Amc, %), test weight per liter (TWL, g/L), grain protein content (GPC, %), gliadin content (Gli, %), glutenin content (Glu, %), grain hardness (GH, %), grain vitreousness (GV, %), falling number (FN, s), and sedimentation value determined in a 2% acetic acid solution (SV, mL). Grain quality traits were evaluated using samples collected from a single field replicate. Each sample was analyzed in triplicate, and mean values were calculated and used for subsequent analysis. For QTL analysis, both individual-year data and year-mean values were used for each genotype. All grain and flour quality analyses were conducted in the grain quality laboratory of the Kazakh Research Institute of Agriculture and Plant Growing (KRIAPG, Almaty, Kazakhstan).
Analytical procedures followed interstate standards (GOST), the standards of a regional standards organization operating under the auspices of the Commonwealth of Independent States and maintained by the Euro-Asian Council for Standardization, Metrology, and Certification, and the guidelines of the American Association of Cereal Chemists (AACC), and the International Organization for Standardization (ISO) [48,49]. The specific national and international standards applied for each trait are summarized in Table 1.
Test weight per liter was determined in accordance with GOST 10840-2017 using the standard method for hectoliter weight assessment [50]. Grain protein content was measured using the Kjeldahl method with near-infrared spectroscopy (NIRS) on a DS2500 Grain Analyzer (FOSS, Hillerød, Denmark). Sedimentation value was assessed using a 2% acetic acid solution, and wheat samples were classified as weak (0–30 mL), filler (31–50 mL), valuable (51–70 mL), or strong (>70 mL) based on sedimentation volume [54]. Protein fractionation was carried out following the Osborne sequential extraction procedure, with gliadins extracted using 70% ethanol and glutenins extracted with NaOH [55]. Grain hardness was evaluated using a Single Kernel Characterization System (SKCS 4100; Perten Instruments, Hägersten, Sweden). Based on the hardness index (HI), kernels were classified as soft (HI < 40), mixed (HI = 40–60), or hard (HI > 60). Grain vitreousness was expressed as the proportion of kernels exhibiting a translucent, non-starchy endosperm. Falling number, also referred to as the Hagberg-Perten number, was measured according to internationally standardized procedures (ICC 107/1, ISO 3093-2004, and AACC 56-81B) and used as an indicator of α-amylase activity and sprouting damage.
Interpretation of grain quality parameters was conducted in accordance with the State Standard for bread wheat classification (GOST) [56]. This classification system considers multiple quality indicators, including grain protein content, gluten characteristics, test weight, falling number, and vitreousness. Threshold values relevant to the traits analyzed in this study are presented in Table 2.
In addition to grain quality traits, yield per square meter (YM2) was recorded to evaluate relationships between grain quality and productivity. Grain yield was measured from a 1 m2 plot for each genotype and replication.

2.3. Linkage Mapping and QTL Analysis

The genetic linkage map used for quantitative trait locus (QTL) analysis was previously constructed for the A × C mapping population and has been described in detail elsewhere [37,38]. Briefly, the map comprises 3647 polymorphic DNA markers [47]. The total genetic length of the map is 3246.9 cM, with individual chromosome lengths ranging from 16.8 cM (chromosome 6D) to 264.8 cM (chromosome 5B).
QTL detection was performed using the composite interval mapping (CIM) approach implemented in Windows QTL Cartographer version 2.5 [57]. Genome-wide significance thresholds were determined separately for each trait using permutation tests (1000 permutations) implemented in the R/qtl package in R version version 4.3.0 (POSIT, Boston, MA, USA) at p = 0.05. Trait-specific LOD thresholds were then applied to declare significant QTLs. Most detected QTLs substantially exceeded this threshold, indicating robust genetic effects. For each detected QTL, the proportion of phenotypic variance explained (R2) and the corresponding additive effect were estimated based on the CIM output. Graphical representations of linkage groups and identified QTLs were generated using MapChart version 2.32 [58], and significant markers were analyzed to identify any genes overlapping with the Wheat Chinese Spring IWGSC RefSeq version 1.0 genome using Ensembl Plants BLAST (https://plants.ensembl.org/Triticum_aestivum/Tools/Blast, accessed on 6 October 2024 [59]. Statistical analyses, including Pearson’s correlation coefficients and boxplot visualization, were conducted using the R version 4.3.0 (POSIT, Boston, MA, USA) statistical environment [60].

3. Results

3.1. Phenotypic Variation of Grain Quality and Yield-Related Traits

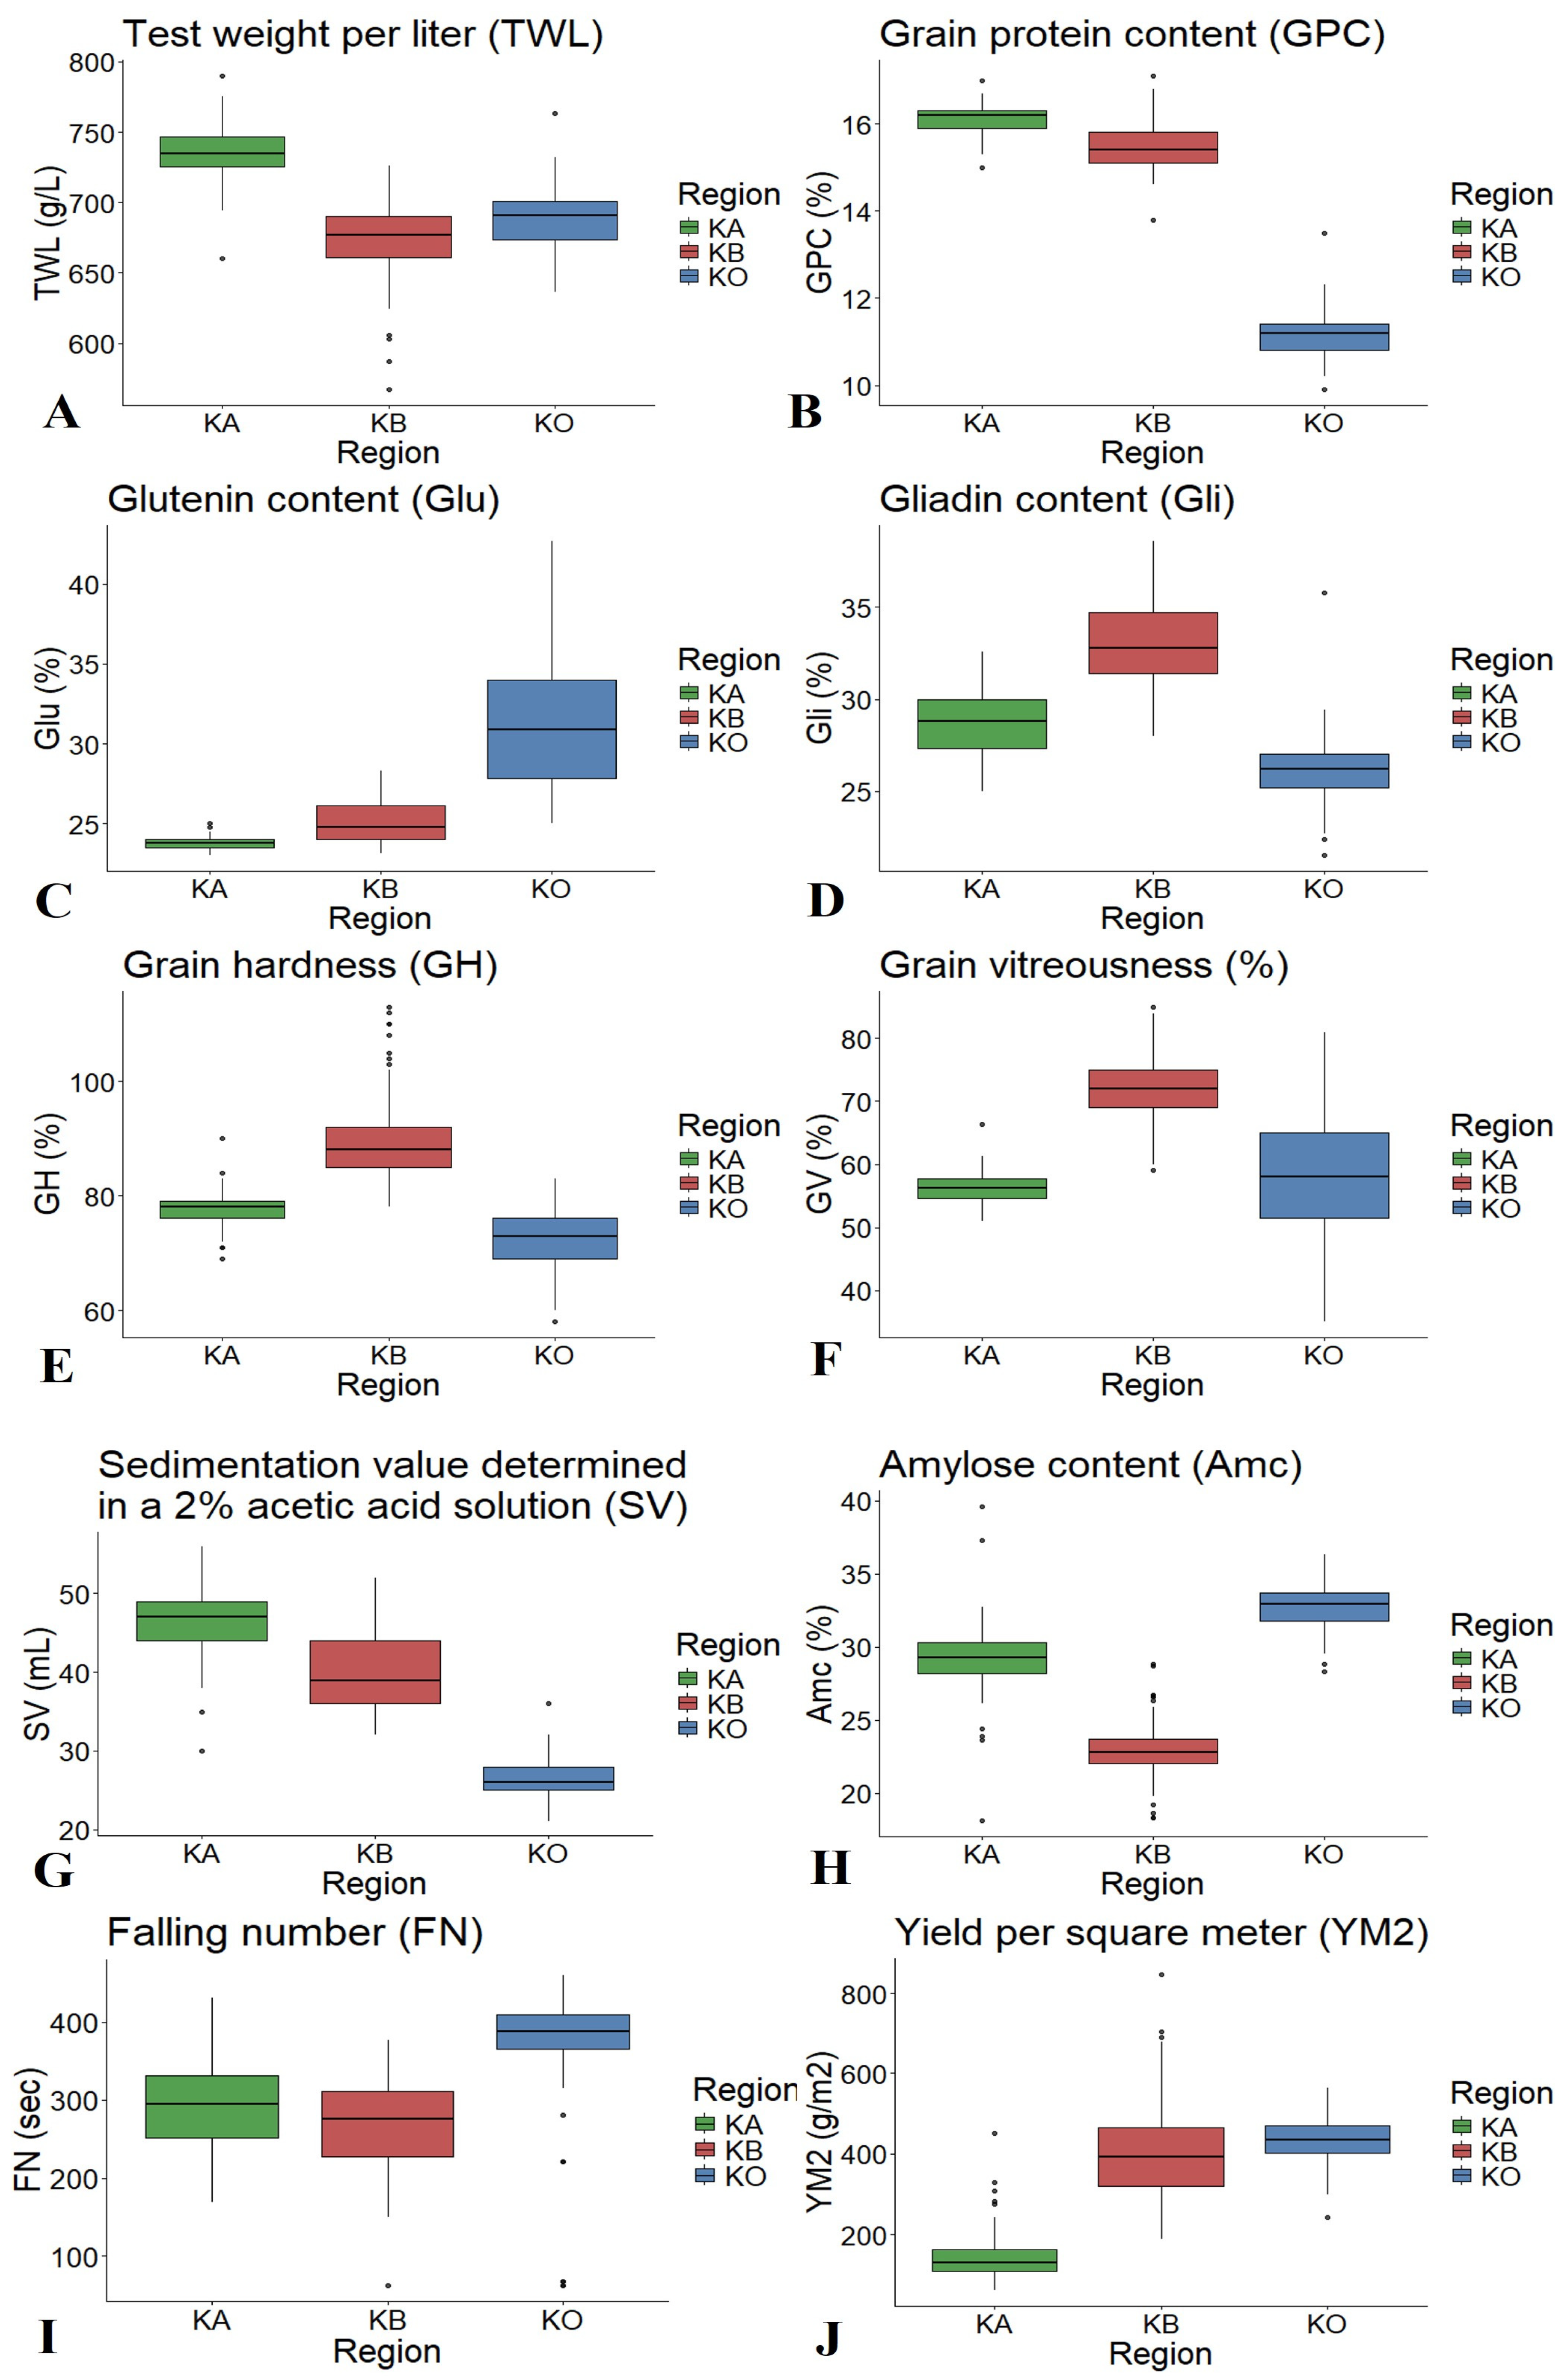
Nine grain quality traits were evaluated in 101 spring-type double haploid (DH) lines of the A × C mapping population grown in three contrasting regions of Kazakhstan: the northern region (KB), the central region (KA), and the southern region (KO) (Figure 1, Table S1). In addition, yield per square meter (YM2) was recorded to assess regional differences in productivity. The analysis revealed significant regional variation for all evaluated traits. TWL ranged from 673.99 ± 2.72 g/L in KB to 737.22 ± 1.67 g/L in KA, with intermediate values observed in KO (687.85 ± 2.40 g/L). GPC followed a similar pattern, reaching its highest mean value in KA (16.10 ± 0.04%), slightly lower values in KB (15.50 ± 0.05%), and notably reduced levels in KO (11.08 ± 0.06%) (Figure 1).
Protein composition traits exhibited contrasting regional trends. Gli was highest in KB (32.97 ± 0.24%) and lowest in KO (26.15 ± 0.19%), whereas Glu showed the opposite distribution, with the highest mean value recorded in KO (31.23 ± 0.42%) and lower values observed in KA (23.77 ± 0.04%) and KB (25.11 ± 0.13%) (Figure 1).
Substantial differences were also observed for SV, which was highest in KA (46.37 ± 0.44 mL) and lowest in KO (26.22 ± 0.24 mL). In contrast, Amc was significantly higher in KO (32.87 ± 0.17%) than in KA (29.16 ± 0.24%) and KB (22.88 ± 0.19%). FN followed a trend similar to amylose, with the highest values observed in KO (371.45 ± 8.00 s), compared with KA (295.69 ± 5.88 s) and KB (266.10 ± 5.74 s) (Figure 1).
YM2 showed an inverse regional distribution compared with most protein-related traits, with the lowest values recorded in KA (147.31 ± 5.79 g/m2) and substantially higher yields in KB (401.63 ± 11.36 g/m2) and KO (432.54 ± 5.82 g/m2).
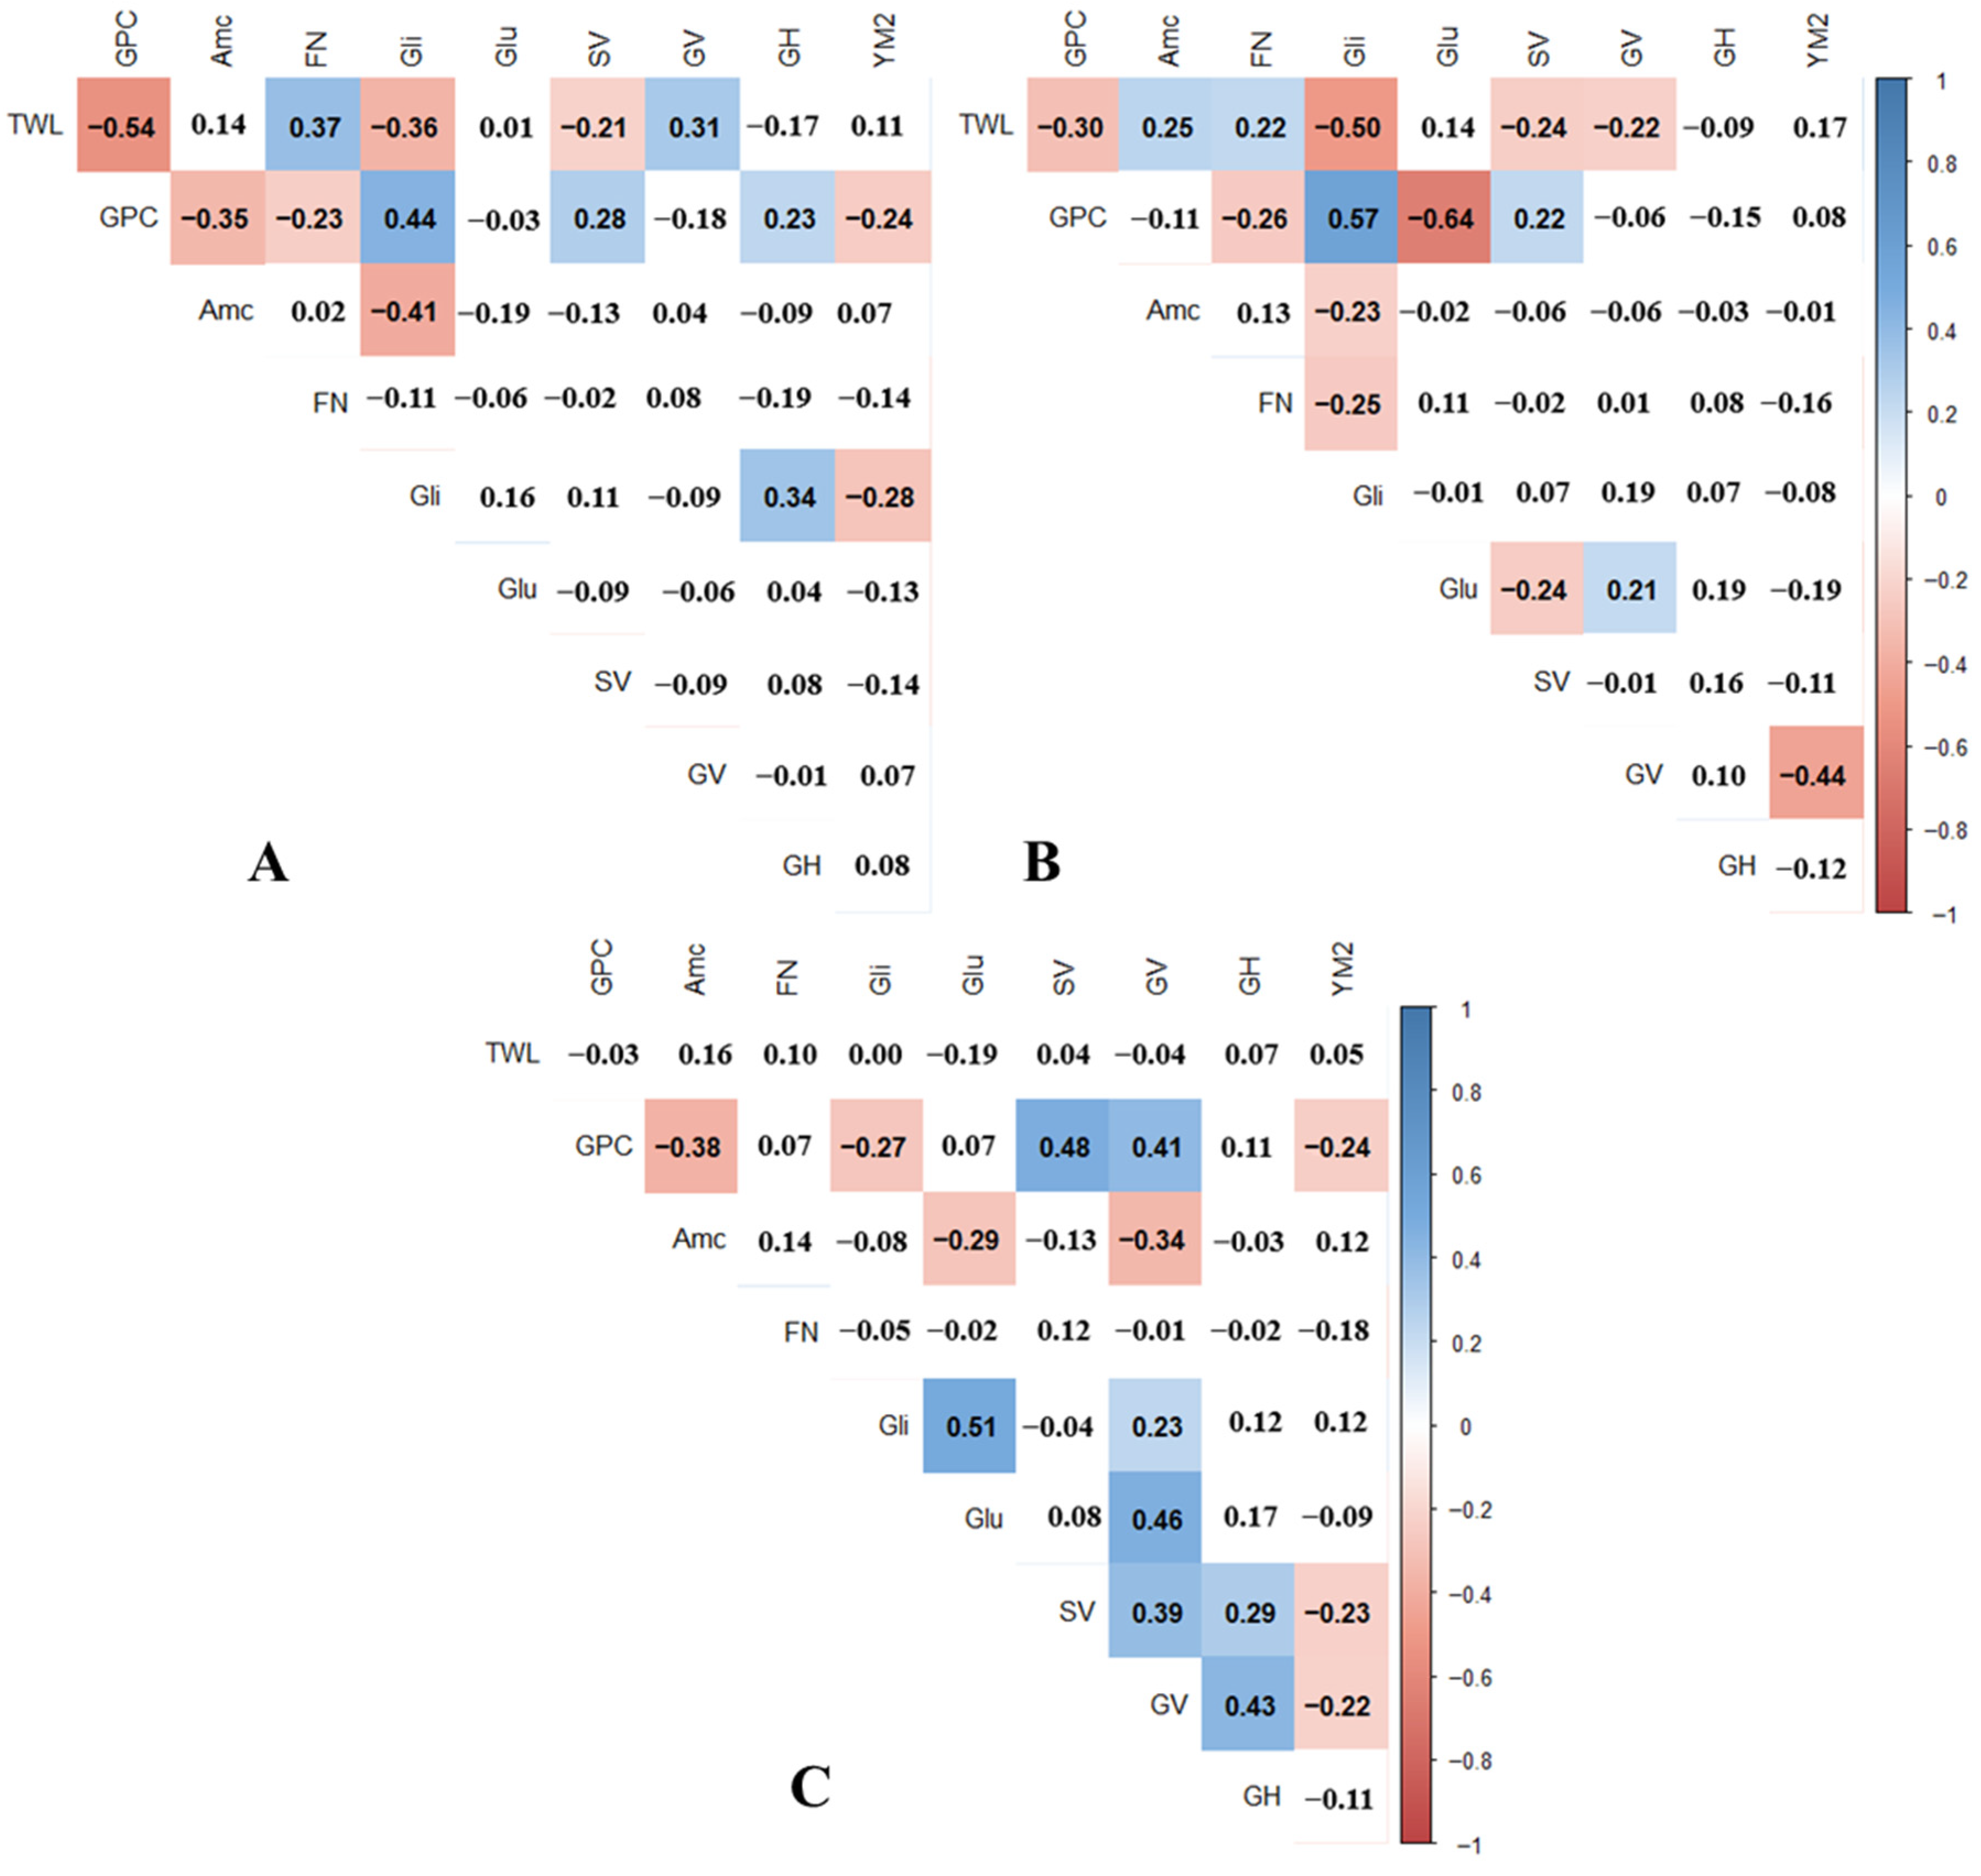
Pearson’s correlation analysis revealed significant associations among grain quality traits and between quality traits and yield across the three regions (Figure 2).
Correlation analysis revealed several environment-dependent relationships among grain quality traits and yield components (Figure 2). In the northern region (KB), a strong negative correlation was observed between TWL and GPC. GPC was positively correlated with Gli, SV, GH, and negatively associated with Amc, FN, and YM2. In the central region (KA), stronger relationships were detected. GPC showed a strong positive correlation with Gli and a strong negative correlation with FN. GV was negatively correlated with YM2. In the southern region (KO), GPC was positively correlated with SV and GV, while negatively correlated with Amc and Gli. A strong positive association was observed between Gli and Glu. Yield showed negative correlations with GPC, SV, and GV. Across all regions, several consistent trends were observed. Grain protein content tended to be negatively associated with yield, while protein-related traits (Gli, Glu, SV) were generally positively interrelated (Figure 2). In contrast, starch-related traits, particularly amylose content, frequently showed inverse relationships with protein parameters. These common patterns, together with region-specific differences, indicate a stable trade-off between protein accumulation and yield, which is modulated by environmental conditions.
Classification of the A × C lines according to interstate wheat quality standards revealed pronounced regional differences for all six evaluated grain quality traits (Table 3). For GPC, all lines grown in the northern (KB) and central (KA) regions were assigned to the first quality class (14.5–19.0%), indicating consistently high protein levels under these environments. In contrast, lines grown in the southern region (KO) were predominantly classified into lower-quality classes, with the majority assigned to the fourth class (8–11%), whereas only a small number of lines met the thresholds for the second and third classes (Table 3). A similar regional contrast was observed for SV. In KB and KA, most lines were classified as fillers (31–50 mL), with a few in the valuable class (51–70 mL). In contrast, the KO environment was characterized by a predominance of weak-class lines (0–30 mL), indicating substantially reduced gluten strength, with only a few lines classified as fillers (Table 3).
For GV, all lines grown in KB and KA met the criteria for the first- or second-quality classes (≥60%), whereas in KO, only part of the population met this threshold. More than half of the lines in KO were classified as third class (40%), and several lines remained unclassified, reflecting increased variability in endosperm structure under southern conditions (Table 3). GH showed comparatively high and stable performance across environments. All lines grown in KB and KA were classified as hard wheat (>65 units). In KO, the majority of lines also fell into the hard class, although a small proportion exhibited intermediate hardness values or remained unclassified (Table 3). The FN classification indicated generally favorable resistance to pre-harvest sprouting across regions. Most lines in KB, KA, and KO were assigned to the first- or second-quality classes (≥200 s). However, a higher number of unclassified lines was observed in KO, suggesting increased variability in α-amylase activity under southern conditions (Table 3). The TWL showed the strongest environmental dependence. In KA, a substantial proportion of lines were classified into the first, second, and third quality classes, whereas in KB and KO, the majority of lines remained unclassified, indicating reduced grain density under these environments (Table 3).
Overall, the classification results demonstrate that the northern and central regions favor the formation of high-quality grain across multiple traits, whereas the southern region is associated with a shift toward lower-quality classes and increased phenotypic variability.

3.2. Identification of Quantitative Trait Loci for Grain Quality Traits

Permutation-derived genome-wide LOD thresholds at p = 0.05 varied across traits, ranging from 2.67 to 3.90 (Table S2). The relatively moderate LOD thresholds may reflect the population size and trait-specific genetic architecture. Only QTLs exceeding these thresholds were retained as significant. A total of 89 significant quantitative trait loci (QTLs) associated with nine grain quality traits were identified across the three environments (Table 4 and Table S3). All reported QTLs exceeded the corresponding trait-specific permutation-derived LOD thresholds. Among these, 82 QTLs had a major effect (R2 > 10%), and 16 QTLs were detected as stable across two or more environments. The largest numbers of QTLs were identified for GPC (18), SV (17), and TWL (16).
14 QTLs associated with TWL were identified and mapped on 10 chromosomes. The LOD values ranged from 3.2 to 14.0 and exceeded the corresponding permutation thresholds, explaining between 6.4% and 39% of the phenotypic variance. Among the 11 major QTLs, three (Qtwl-A × C.ipbb-2D.1, Qtwl-A × C.ipbb-2D.2, and Qtwl-A × C.ipbb-4D) were stable across multiple years and/or regions. Notably, Qtwl-A × C.ipbb-4D was detected in all environments, with additive effects ranging from 5.84 to 19.0 g/L contributed by the Cadenza allele (Table 5 and Table S3), indicating strong and consistent genetic control of TWL at this locus.
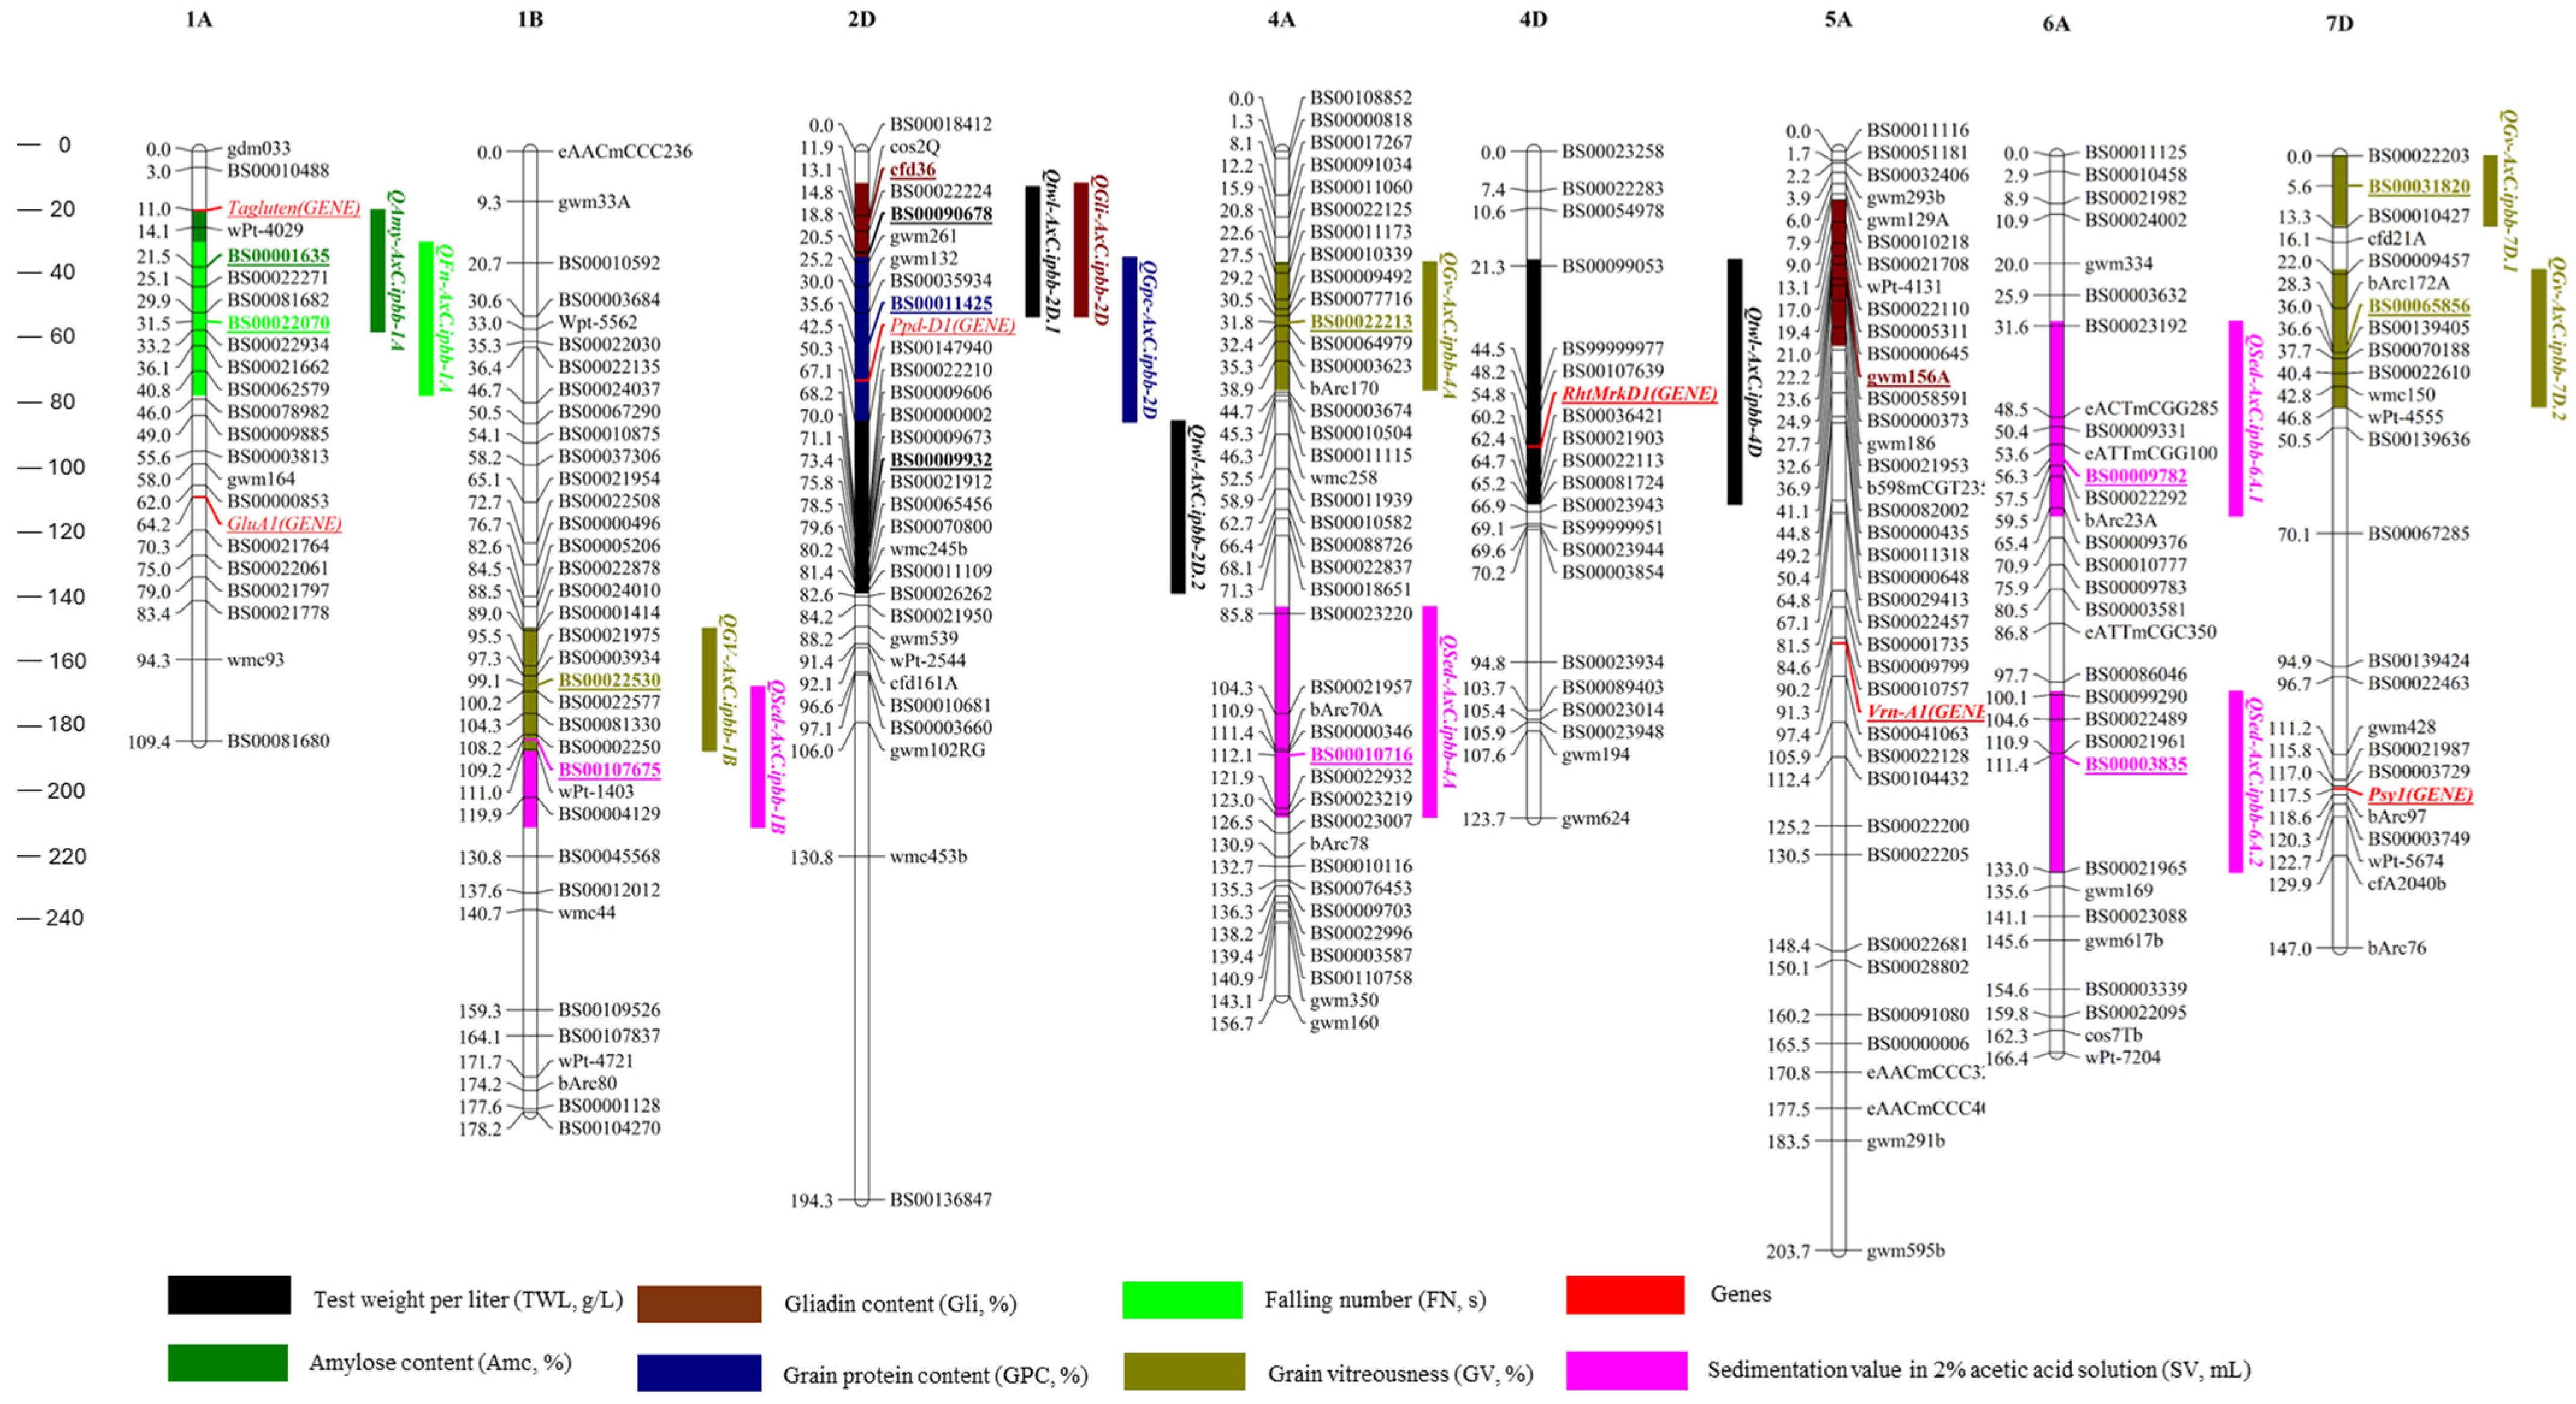
The detected stable QTLs were distributed across all three wheat genomes, with chromosomes 1A, 1B, 1D, 2D, 3B, 4A, 4D, 5A, 6A, and 7D harboring multiple loci (Figure 3).
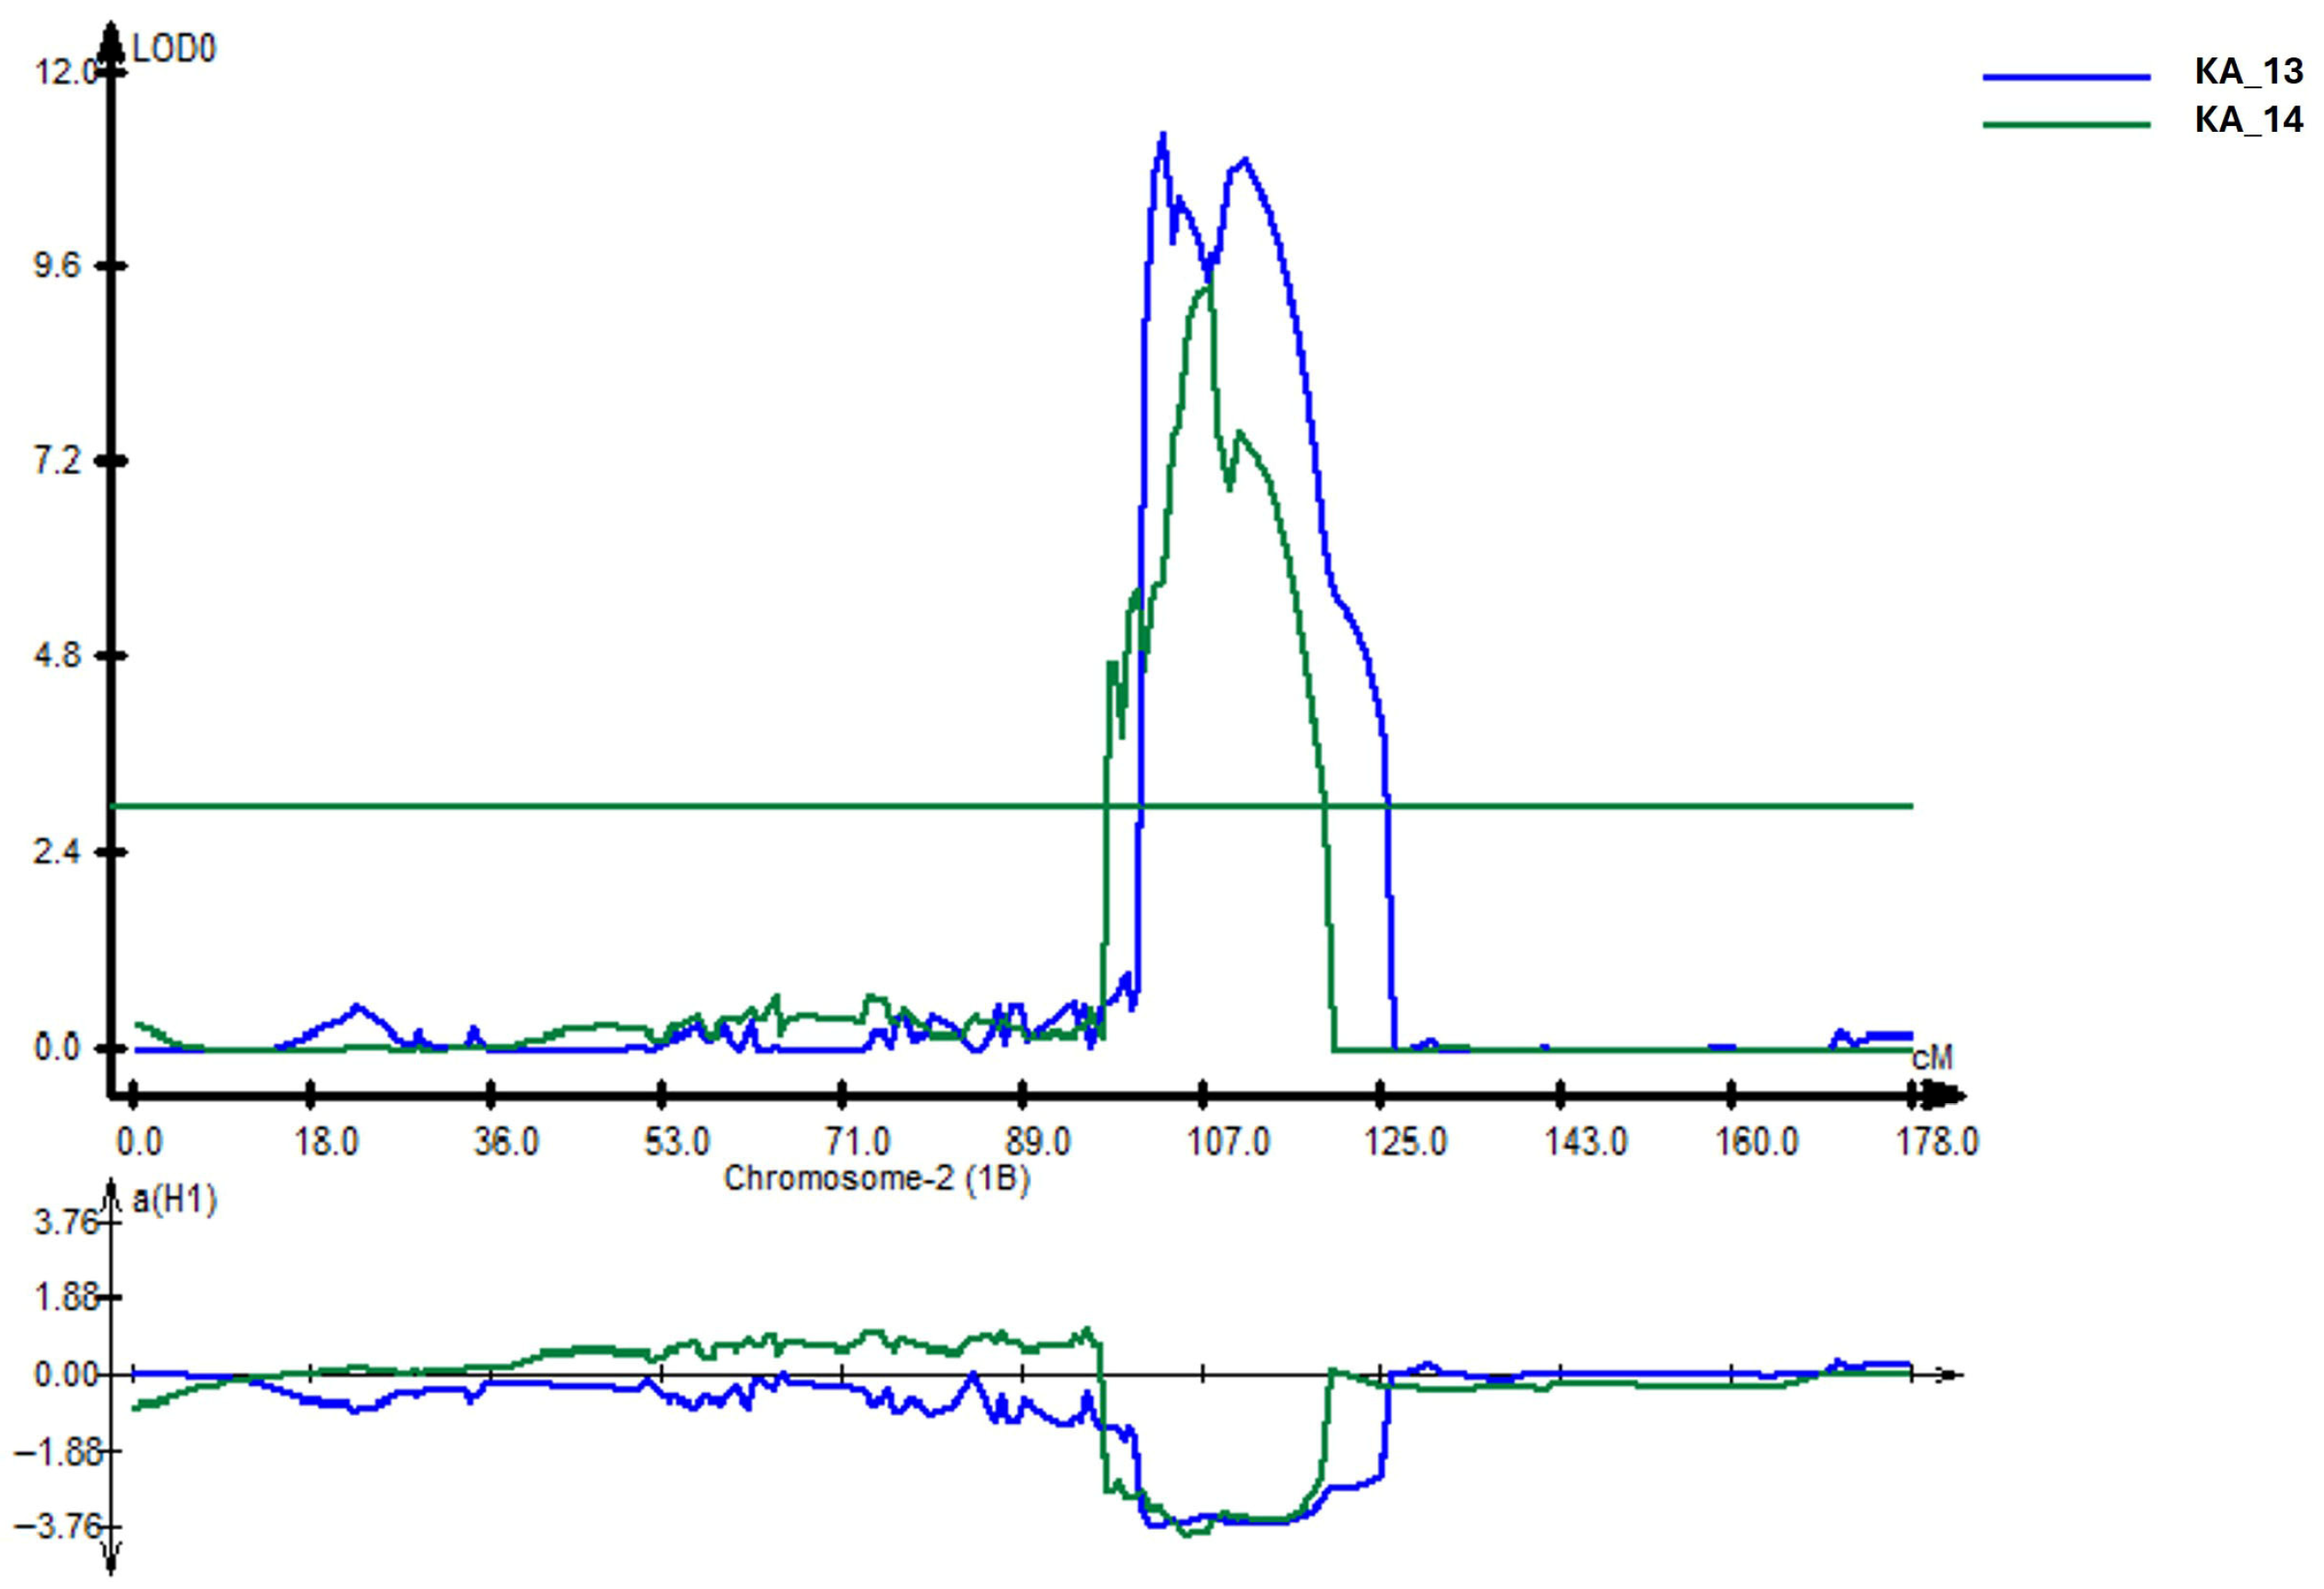
Fourteen major QTLs (R2 > 10%) for GPC were identified on 11 chromosomes, including 1D, 2A, 2B, 2D, 3A (3 QTLs), 3B, 4A, 4D, 5B, 7B, and 7D (2 QTLs). The locus QGpc-A × C.ipbb-2D was detected in both northern and central regions, with LOD values ranging from 3.4 to 8.4. This QTL explained up to 38% of phenotypic variance and showed a positive additive effect associated with the Avalon allele, highlighting its strong contribution to protein accumulation (Table 5 and Table S3). For Gli, 9 QTLs were identified across 8 chromosomes, with most major loci located on 2A, 2B, 2D, 3A (2 QTLs), 4D, 5A, 7B, and 7D. Two loci, QGli-A × C.ipbb-2D and QGli-A × C.ipbb-5A, were stable across northern and central regions. Both exhibited positive additive effects (1.22 and 0.99, respectively) associated with the Avalon allele (Table 5 and Table S3). For Glu, QTLs were identified on chromosomes 1B, 2B, 3B, 6A, and 6B. The strongest effect was detected on chromosome 6B (R2–16%). Ten significant QTLs for amylose content were identified across chromosomes 1A, 2D, 3B, 4B, 4D, 5A, 5B, 6A, 7A, and 7B. The highest phenotypic variance was explained by QAmy-A × C.ipbb-6A (R2–22%) and QAmy-A × C.ipbb-7B (R2–21%). The locus QAmy-A × C.ipbb-2D exhibited the largest additive effect (−2.04%), contributed by the Cadenza allele (Table S2). Seven QTLs for grain hardness were mapped on six chromosomes. Eleven QTLs controlling GV were identified on seven chromosomes. Four loci (QGv-A × C.ipbb-1B, QGv-A × C.ipbb-4A, QGv-A × C.ipbb-7D.1, and QGv-A × C.ipbb-7D.2) were stable across multiple environments. The locus QGv-A × C.ipbb-7D.2 showed the highest LOD values (3.6–6.0), while QGv-A × C.ipbb-1B exhibited the largest additive effect (−5.29%) and explained up to 25% of phenotypic variance (Table 5 and Table S3). Twelve QTLs for sedimentation value were mapped on 8 chromosomes. Four loci (QSed-A × C.ipbb-1B, QSed-A × C.ipbb-4A, QSed-A × C.ipbb-6A.1, and QSed-A × C.ipbb-6A.2) were classified as stable. Among them, QSed-A × C.ipbb-1B showed the highest LOD score (10.8) and explained up to 28% of phenotypic variance (Figure 4). This locus was consistently detected under central region (KA) conditions and exhibited an additive effect of −3.56% contributed by the Cadenza allele.
Seven QTLs for falling number were identified on chromosomes 1A, 2B, 2D, 5B (2 QTLs), 5D, and 6B. Only one locus, QFn-A × C.ipbb-1A, was stable across environments. It exhibited LOD values ranging from 3.8 to 5.2 and an additive effect of −32.3 s associated with the Cadenza allele (Table 5 and Table S3).

4. Discussion

4.1. Environmental Effects on Grain Quality Traits in the Avalon × Cadenza Population

The results of this study demonstrate that grain quality traits in the A × C DH population are strongly influenced by environmental conditions across the contrasting agro-climatic regions of Kazakhstan. Significant differences among the northern (KB), central (KA), and southern (KO) regions indicate that temperature regime, precipitation patterns, and soil properties play a critical role in determining grain composition and technological quality. Similar environmental sensitivity of wheat grain quality traits has been widely reported in diverse wheat-growing regions worldwide [34,35,47,61]. Higher values of GPC, SV, GH, and GV observed in the northern and central regions suggest that relatively cooler growing conditions favor protein accumulation and gluten strength (Figure 1; Table 3). Comparable environmental effects on wheat quality traits have been reported previously, where lower temperatures during grain filling enhance protein deposition and improve gluten functionality [62]. In contrast, the southern environment was associated with higher yield per unit area but lower values of several quality parameters. This inverse relationship between yield and grain quality traits has been widely documented and reflects a well-known physiological trade-off between carbohydrate accumulation and nitrogen allocation during grain filling [63,64,65].
Correlation analyses further revealed both stable and environment-dependent relationships among grain quality traits and yield (Figure 2). Across regions, GPC was negatively associated with YM2, indicating a recurring trade-off between protein accumulation and productivity. This trade-off is frequently attributed to dilution effects at high yield potential, as well as to physiological constraints governing carbon–nitrogen partitioning during grain development [66]. Protein-related traits such as gliadin content, glutenin content, and sedimentation value were generally positively correlated, consistent with the central role of storage protein composition in determining gluten strength and dough quality [6]. At the same time, the strength and direction of several relationships varied across environments. In the northern region, GPC showed positive associations with sedimentation value and grain hardness, but negative correlations with amylose content, falling number, and yield. In the central region, GPC exhibited a particularly strong positive correlation with gliadin content and a negative relationship with falling numbers. In the southern region, GPC was positively correlated with sedimentation value and vitreousness, but negatively correlated with amylose and gliadin contents, while yield was negatively associated with several protein-related traits.
These results highlight the strong influence of genotype-by-environment interactions on wheat grain quality traits. Consequently, the concept of an “ideal quality cultivar” may vary among environments, and breeding strategies should therefore be tailored to specific regional conditions [67]. Furthermore, the consistently observed inverse association between protein-related traits and starch parameters suggests an underlying physiological trade-off between nitrogen accumulation and carbohydrate deposition during grain filling [68]. Simultaneous improvement of protein functionality and starch-related traits may therefore require carefully balanced breeding strategies that account for these physiological constraints [69].
In particular, higher temperatures and reduced moisture availability in the southern region likely accelerated grain filling and limited nitrogen accumulation, resulting in lower protein content and weaker gluten-related traits. In contrast, cooler conditions in the northern and central regions may prolong grain filling, thereby promoting protein accumulation and improving technological quality. These environmental effects also influence the expression and detectability of QTLs, highlighting the importance of multi-environment trials for identifying stable loci.

4.2. Genetic Architecture of Grain Quality Traits and QTL Stability

The multi-environment analysis across three contrasting regions of Kazakhstan identified 89 QTLs associated with nine grain quality traits in the A × C mapping population. The use of permutation-based thresholds increases the robustness and reliability of QTL detection compared to fixed LOD criteria. Among these loci, 82 were classified as major QTLs explaining more than 10% of phenotypic variance, while 16 QTLs were detected consistently across multiple environments. These stable loci represent genomic regions with relatively robust effects under diverse environmental conditions and therefore constitute valuable targets for marker-assisted selection. Stable QTLs were identified for several key grain quality traits, including test weight per liter (TWL), sedimentation value (SV), grain vitreousness (GV), and gliadin content (Gli) (Table 5 and Table S4). In contrast, fewer stable loci were detected for traits such as grain protein content (GPC), amylose content (Amc), and falling number (FN). This pattern likely reflects stronger genotype-by-environment interactions affecting these traits, as well as the complex polygenic architecture underlying many wheat quality characteristics.
Comparison with previously published studies revealed that several stable QTLs identified in this study co-localized with genomic regions reported earlier (Table S5) [15,70,71,72,73,74]. In particular, stable QTLs for TWL detected on chromosomes 2D correspond to genomic regions previously associated with grain density and kernel characteristics in wheat populations [74,75]. Similarly, the QGpc-A × C_ipbb-2D locus detected in northern and central environments coincides with genomic regions previously associated with grain protein accumulation (Table S5) [70,71,72]. The agreement with earlier studies supports the reliability and biological significance of these genomic regions.
Several stable loci were identified near well-characterized genes that control wheat grain quality. For example, the QSed-A × C_ipbb-4A locus on chromosome 4A was detected near the Wx-B1 gene, which is involved in starch biosynthesis (Figure 3) [75]. These associations suggest that variation in both glutenin composition and starch biosynthesis pathways contributes to differences in gluten functionality among genotypes. The co-occurrence of QTLs controlling GV and SV on chromosomes 1B and 4A further supports the close relationship between protein matrix formation and grain texture. Grain vitreousness reflects the structural interactions between starch granules and storage proteins within the endosperm; therefore, genomic regions that affect protein composition are expected to influence both traits simultaneously [76].
In addition to genes directly related to grain composition, several loci were located near major developmental regulators. For example, the stable QTL for TWL on chromosome 4D was mapped close to the Rht-D1 locus (Figure 3), suggesting a possible connection between plant architecture and grain physical properties [77]. Likewise, QTLs affecting glutenin and grain protein content on chromosome 2D were located near the Ppd-D1 gene, which controls photoperiod sensitivity (Figure 3) [78]. Developmental genes influencing phenology may indirectly affect grain quality by altering the duration and environmental conditions of the grain filling period. Pleiotropic genomic regions were also detected for several grain quality traits. On chromosome 1A, QTLs associated with Amc and GH were located within a relatively narrow genetic interval, suggesting shared regulatory mechanisms affecting multiple grain properties Table S6. Additional clusters were detected on chromosomes 1B and 2D, where QTLs for gliadin, glutenin, grain protein content, sedimentation value, vitreousness, and test weight per liter co-localized Table S6. These genomic hotspots may represent integrated regulatory regions controlling protein accumulation, starch metabolism, and grain physical characteristics. Overall, the identification of stable QTLs controlling sedimentation value, grain vitreousness, and grain density provides promising targets for marker-assisted selection to improve wheat technological quality. In particular, loci located near major functional genes such as Wx-B1, Rht-D1, and Ppd-D1 represent attractive candidates for further validation and functional characterization in wheat breeding programs (Figure 3).
Taken together, the results of this study provide new insights into the complex interplay between environmental factors and the genetic regulation of wheat grain quality traits. The pronounced regional differences observed across Kazakhstan environments highlight the strong influence of climatic conditions on protein accumulation, grain composition, and technological quality. At the same time, the identification of stable QTLs across multiple environments indicates that several genomic regions exert consistent effects on key quality traits despite environmental variability. The co-localization of these loci with major functional genes involved in gluten composition, starch biosynthesis, and developmental regulation further supports their biological relevance. Collectively, these findings improve our understanding of the genetic architecture underlying wheat grain quality and provide valuable genomic targets for marker-assisted breeding to develop cultivars that combine stable technological quality with adaptation to diverse environmental conditions.
However, the relatively small size of the mapping population (101 DH lines) may limit the power to detect minor-effect QTLs, particularly for traits strongly influenced by environmental conditions. Therefore, while major and stable QTLs identified in this study are considered reliable, minor loci require further investigation and validation in independent populations.

5. Conclusions

This study showed that grain quality traits in the A × C double haploid population are strongly influenced by environmental variation across the contrasting wheat-growing regions of Kazakhstan. The northern and central environments were generally more favorable for superior grain quality, whereas the southern region was characterized by lower technological quality and greater trait variability. These findings confirm the importance of multi-environment evaluation in identifying wheat genotypes and genomic regions that perform reliably under diverse agro-climatic conditions. A total of 89 QTLs associated with nine grain quality traits were identified, including 82 major QTLs and 16 stable QTLs detected across multiple environments. Comparison with previously published studies showed that 3 of the 16 stable QTLs co-localized with loci reported earlier. In addition, 13 novel QTLs identified for TWL, Gli (2 QTLs), SV (4 QTLs), Amc and GV (4 QTLs), and FN represent promising targets for MAS to improve wheat grain quality and yield potential. The co-localization of stable QTLs with known functional genes, such as Wx-B1, Rht-D1, and Ppd-D1, further supports their biological relevance and highlights the connection among grain composition, developmental regulation, and end-use quality. Overall, the identified stable genomic regions represent valuable candidates for validation and subsequent use in marker-assisted breeding. The findings are primarily applicable to spring wheat germplasm. The results provide a useful foundation for developing bread wheat cultivars with improved grain quality and adaptation to Kazakhstan’s diverse production environments.

Supplementary Materials

The following supporting information can be downloaded at: https://www.mdpi.com/article/10.3390/agronomy16080832/s1, Table S1. Raw field data from Karabalyk Agricultural Experimental Station (North Kazakhstan, KB), Karaganda Agricultural Experimental Station named after A.F. Khristenko (Central Kazakhstan, KA), and the Kazakh Scientific Research Institute of Rice Cultivation named after Ibray Zhakhaev (Kyzylorda region, South Kazakhstan, KO). Table S2. Trait-specific permutation-derived LOD thresholds (p = 0.05). Table S3. All QTLs identified for grain quality traits in the Avalon × Cadenza doubled haploid mapping population across three environments. Table S4. Stable QTLs identified in the Avalon × Cadenza doubled haploid mapping population across three experimental locations. Table S5. Identified QTLs for grain quality traits in the Avalon × Cadenza doubled haploid mapping population and their comparison with QTLs reported in previous studies. Table S6. List of pleiotropic loci associated with grain quality traits identified in the Avalon × Cadenza doubled haploid mapping population.

Author Contributions

Conceptualization: Y.T.; Formal analysis: A.A. (Akerke Amalova); Funding acquisition: Y.T.; Investigation: A.A. (Akerke Amalova), S.G., A.A. (Aigul Abugalieva), S.A. and Y.T.; Methodology: S.G., A.A. (Aigul Abugalieva), Y.T. and S.A.; Project administration: S.A.; Resources, S.G.; Supervision: Y.T.; Visualization: A.A. (Akerke Amalova); Writing—original draft: A.A. (Akerke Amalova), S.G., S.A. and Y.T.; Writing—review and editing: A.A. (Akerke Amalova), S.G., S.A. and Y.T. All authors have read and agreed to the published version of the manuscript.

Funding

This research was funded by the Science Committee of the Ministry of Science and Higher Education (former Ministry of Education and Science) of the Republic of Kazakhstan (Program No. BR24992903 «Practical implementation of modern molecular genetic, physiological, biochemical, biotechnological methods and digital phenotyping in the breeding of economically important agricultural crops»). The publication costs were covered by ZALMA Ltd. (Almaty, Kazakhstan), which had no role in the study design, data collection and analysis, decision to publish, or preparation of the manuscript.

Data Availability Statement

The original contributions presented in this study are included in the article/Supplementary Materials. Further inquiries can be directed to the corresponding author.

Conflicts of Interest

The authors declare no conflicts of interest.

References

  1. Shewry, P.R.; Hey, S.J. The contribution of wheat to human diet and health. Food Energy Secur. 2015, 4, 178–202. [Google Scholar] [CrossRef]
  2. Kong, L.G.; Si, J.S.; Zhang, B.; Feng, B.; Wang, F.H. Environmental modification of wheat grain protein accumulation and associated processing quality: A case study of China. Aust. J. Crop Sci. 2013, 7, 173–181. [Google Scholar]
  3. Subedi, M.; Ghimire, B.; Bagwell, J.W.; Buck, J.W.; Mergoum, M. Wheat end-use quality: Genetics and future prospects. Front. Genet. 2023, 13, 1032601. [Google Scholar] [CrossRef]
  4. Babalola, K.O.; Monacelli, N.; Gozzi, M.; Ceccarelli, S.; Folloni, S.; Galaverna, G. Genetic diversity and climate change adaptation in wheat: A systematic review of landraces, composite cross populations, and evolutionary populations. Front. Sustain. Food Syst. 2025, 9, 1504922. [Google Scholar] [CrossRef]
  5. Li, N.; Miao, Y.; Ma, J.; Zhang, P.; Chen, T.; Liu, Y.; Che, Z.; Shahinnia, F.; Yang, D. Consensus genomic regions for grain quality traits in wheat revealed by Meta-QTL analysis and in silico transcriptome integration. Plant Genome 2023, 16, e20336. [Google Scholar] [CrossRef]
  6. Khalid, A.; Hameed, A.; Tahir, M.F. Wheat quality: A review on chemical composition, nutritional attributes, grain anatomy, types, classification, and function of seed storage proteins in bread making quality. Front. Nutr. 2023, 10, 1053196. [Google Scholar] [CrossRef]
  7. Shewry, P.R.; Halford, N.G. Cereal seed storage proteins. J. Exp. Bot. 2002, 53, 947–958. [Google Scholar] [CrossRef] [PubMed]
  8. Wieser, H. Chemistry of gluten proteins. Food Microbiol. 2007, 24, 115–119. [Google Scholar] [CrossRef] [PubMed]
  9. Muqaddasi, Q.H.; Brassac, J.; Ebmeyer, E.; Kollers, S.; Korzun, V.; Argillier, O.; Stiewe, G.; Plieske, J.; Röder, M.S. Prospects of GWAS and predictive breeding for European winter wheat’s grain protein content, grain starch content, and grain hardness. Sci. Rep. 2020, 10, 12541. [Google Scholar] [CrossRef] [PubMed]
  10. Ye, L.; Zheng, W.; Li, X.; Han, W.; Shen, J.; Lin, Q.; Hou, L.; Liao, L.; Zeng, X.A. The role of gluten in food products and dietary restriction: Exploring the potential for restoring immune tolerance. Foods 2023, 12, 4179. [Google Scholar] [CrossRef]
  11. Scott, M.F.; Fradgley, N.; Bentley, A.R.; Brabbs, T.; Corke, F.; Gardner, K.A.; Horsnell, R.; Howell, P.; Ladejobi, O.; Mackay, I.; et al. Limited haplotype diversity underlies polygenic trait architecture across 70 years of wheat breeding. Genome Biol. 2021, 22, 137. [Google Scholar] [CrossRef]
  12. Uauy, C.; Distelfeld, A.; Fahima, T.; Blechl, A.; Dubcovsky, J. A NAC gene regulating senescence improves grain protein, zinc, and iron content in wheat. Science 2006, 314, 1298–1301. [Google Scholar] [CrossRef] [PubMed]
  13. Saini, P.; Sheikh, I.; Saini, D.K.; Mir, R.R.; Dhaliwal, H.S.; Tyagi, V. Consensus genomic regions associated with grain protein content in hexaploid and tetraploid wheat. Front. Genet. 2022, 13, 1021180. [Google Scholar] [CrossRef] [PubMed]
  14. Kai, L.I.U.; Zhang, Y.; Zhang, K.R. Conditional and unconditional QTLs mapping of gluten strength in common wheat (Triticum aestivum L.). J. Integr. Agric. 2017, 16, 2145–2155. [Google Scholar] [CrossRef]
  15. Deng, Z.; Zhao, L.; Liu, B.; Zhang, K.; Chen, J.; Qu, H.; Sun, C.; Zhang, Y.; Tian, J. Conditional QTL mapping of sedimentation volume on seven quality traits in common wheat. J. Integr. Agric. 2013, 12, 2125–2133. [Google Scholar] [CrossRef]
  16. Liu, X.; Xu, Z.; Feng, B.; Zhou, Q.; Guo, S.; Liao, S.; Ou, Y.; Fan, X.; Wang, T. Dissection of a novel major stable QTL on chromosome 7D for grain hardness and its breeding value estimation in bread wheat. Front. Plant Sci. 2024, 15, 1356687. [Google Scholar] [CrossRef] [PubMed]
  17. Hou, J.; Sun, P.; Yan, P.; Geng, S.; Li, W.; Qin, M.; Dai, Z.; Tian, B.; Wu, Z.; Zhou, Z.; et al. Dissection of the genetic loci for grain hardness and variation of the key genes in common wheat (Triticum aestivum L.). Curr. Plant Biol. 2025, 41, 100451. [Google Scholar] [CrossRef]
  18. Sun, H.; Lü, J.; Fan, Y.; Zhao, Y.; Kong, F.; Li, R.; Wang, H.; Li, S. Quantitative trait loci (QTLs) for quality traits related to protein and starch in wheat. Prog. Nat. Sci. 2008, 18, 825–831. [Google Scholar] [CrossRef]
  19. Distelfeld, A.; Cakmak, I.; Peleg, Z.; Ozturk, L.; Yazici, A.M.; Budak, H.; Saranga, Y.; Fahima, T. Multiple QTL-effects of wheat Gpc-B1 locus on grain protein and micronutrient concentrations. Physiol. Plant. 2007, 129, 635–643. [Google Scholar] [CrossRef]
  20. Payne, P.I.; Nightingale, M.A.; Krattiger, A.F.; Holt, L.M. The relationship between HMW glutenin subunit composition and the bread-making quality of British-grown wheat varieties. J. Sci. Food Agric. 1987, 40, 51–65. [Google Scholar] [CrossRef]
  21. Giroux, M.J.; Morris, C.F. A glycine to serine change in puroindoline b is associated with wheat grain hardness and low levels of starch-surface friabilin. Theor. Appl. Genet. 1997, 95, 857–864. [Google Scholar] [CrossRef]
  22. Morris, C.F.; Geng, H.; Beecher, B.S.; Ma, D. A review of the occurrence of Grain softness protein-1 genes in wheat (Triticum aestivum L.). Plant Mol. Biol. 2013, 83, 507–521. [Google Scholar] [CrossRef]
  23. Yamamori, M.; Nakamura, T.; Endo, T.; Nagamine, T. Waxy protein deficiency and chromosomal location of coding genes in common wheat. Theor. Appl. Genet. 1994, 89, 179–184. [Google Scholar] [CrossRef]
  24. Kumar, S.; Li, Y.; Zheng, J.; Liu, J.; Xu, Q.; Zhang, Y.; Tang, H.; Qi, P.; Deng, M.; Ma, J.; et al. The impact of GBSSI inactivation on starch structure and functionality in EMS-induced mutant lines of wheat. BMC Genom. 2025, 26, 501. [Google Scholar] [CrossRef]
  25. Mao, H.; Jiang, C.; Tang, C.; Nie, X.; Du, L.; Liu, Y.; Cheng, P.; Wu, Y.; Liu, H.; Kang, Z.; et al. Wheat adaptation to environmental stresses under climate change: Molecular basis and genetic improvement. Mol. Plant 2023, 16, 1564–1589. [Google Scholar] [CrossRef] [PubMed]
  26. Abugalieva, S.; Ledovskoy, Y.; Abugalieva, A.; Turuspekov, Y. Mapping of quantitative traits loci for grain protein content in common wheat. Asian Australas. J. Plant Sci. Biotechnol. 2010, 4, 21–26. [Google Scholar]
  27. Abugalieva, A.I.; Abugalieva, S.I.; Chudinov, V.A.; Turuspekov, Y.K. Phenotyping of spring soft wheat varieties of Kazakhstan based on grain quality indicators. Exp. Biol. 2016, 67, 34–49. (In Russian) [Google Scholar]
  28. Abugalieva, A.I.; Morgunov, A.I.; Pena, R.H.; Volkovinskaya, N.B.; Savin, T.V. Identification of spring wheat genotypes by glutenin and gliadin subunit composition within the Kazakhstan-Siberia network of nurseries. Russ. J. Genet. Appl. Res. 2016, 6, 44–53. [Google Scholar] [CrossRef]
  29. Abugaliyeva, A.I.; Morgounov, A.I. Genetic potential of winter wheat grain quality in Central Asia. Int. J. Environ. Sci. Educ. 2016, 11, 4869–4884. [Google Scholar]
  30. Helguera, M.; Abugalieva, A.; Battenfield, S.; Békés, F.; Branlard, G.; Cuniberti, M.; Hüsken, A.; Johansson, E.; Morris, C.F.; Nurit, E. Grain Quality in Breeding. In Wheat Quality for Improving Processing and Human Health; Igrejas, G., Ikeda, T.M., Guzmán, C., Eds.; Springer Nature: Cham, Switzerland, 2020; pp. 273–307. [Google Scholar]
  31. Tobolova, G.V.; Loginov Yu, P. Grain quality of spring soft wheat in the North Kazakhstan region of the Republic of Kazakhstan. Agrar. Bull. Ural. 2024, 24, 472–481. (In Russian) [Google Scholar] [CrossRef]
  32. Abugalieva, A.; Flis, P.; Shamanin, V.; Savin, T.; Morgounov, A. Ionomic analysis of spring wheat grain produced in Kazakhstan and Russia. Commun. Soil Sci. Plant Anal. 2021, 52, 704–711. [Google Scholar] [CrossRef]
  33. Abugalieva, A.I.; Abugalieva, S.I.; Quarri, S.A.; Turuspekov, Y.K.; Chakmak, I.; Savin, T.V.; Ganeev, V.A. Fe, Zn and S content in doubled haploid lines of Chinese spring× SQ1 wheat population. Vavilov J. Genet. Breed. 2014, 16, 894–901. [Google Scholar]
  34. Amalova, A.; Griffiths, S.; Abugalieva, A.; Abugalieva, S.; Turuspekov, Y. Identification of quantitative trait loci for grain quality traits in a Pamyati Azieva × Paragon bread wheat mapping population grown in Kazakhstan. Plants 2025, 14, 1728. [Google Scholar] [CrossRef] [PubMed]
  35. Amalova, A.; Yermekbayev, K.; Griffiths, S.; Abugalieva, S.; Babkenov, A.; Fedorenko, E.; Abugalieva, A.; Turuspekov, Y. Identification of quantitative trait loci of agronomic traits in bread wheat using a Pamyati Azieva × Paragon mapping population harvested in three regions of Kazakhstan. PeerJ 2022, 10, e14324. [Google Scholar] [CrossRef] [PubMed]
  36. Collard, B.C.; Jahufer, M.Z.Z.; Brouwer, J.B.; Pang, E.C.K. An introduction to markers, quantitative trait loci (QTL) mapping and marker-assisted selection for crop improvement: The basic concepts. Euphytica 2005, 142, 169–196. [Google Scholar] [CrossRef]
  37. Griffiths, S.; Simmonds, J.; Leverington, M.; Wang, Y.; Fish, L.; Sayers, L.; Alibert, L.; Orford, S.; Wingen, L.; Herry, L.; et al. Meta-QTL analysis of the genetic control of ear emergence in elite European winter wheat germplasm. Theor. Appl. Genet. 2009, 119, 383–395. [Google Scholar] [CrossRef] [PubMed]
  38. Piñera-Chavez, F.J.; Berry, P.M.; Foulkes, M.J.; Sukumaran, S.; Reynolds, M.P. Identifying quantitative trait loci for lodging-associated traits in the wheat doubled-haploid population Avalon × Cadenza. Crop Sci. 2021, 61, 2371–2386. [Google Scholar] [CrossRef]
  39. Allen, A.M.; Barker, G.L.; Berry, S.T.; Coghill, J.A.; Gwilliam, R.; Kirby, S.; Robinson, P.; Brenchley, R.C.; D’Amore, R.; McKenzie, N.; et al. Transcript-specific, single-nucleotide polymorphism discovery and linkage analysis in hexaploid bread wheat (Triticum aestivum L.). Plant Biotechnol. J. 2011, 9, 1086–1099. [Google Scholar] [CrossRef]
  40. Bai, C.; Liang, Y.; Hawkesford, M.J. Identification of QTLs associated with seedling root traits and their correlation with plant height in wheat. J. Exp. Bot. 2013, 64, 1745–1753. [Google Scholar] [CrossRef]
  41. Ma, J.; Wingen, L.; Orford, S.; Fenwick, P.; Wang, J.; Griffiths, S. Using the UK reference population Avalon × Cadenza as a platform to compare breeding strategies in elite Western European bread wheat. Mol. Breed. 2015, 35, 70. [Google Scholar] [CrossRef]
  42. Farré, A.; Sayers, L.; Leverington-Waite, M.; Goram, R.; Orford, S.; Wingen, L.; Mumford, C.; Griffiths, S. Application of a library of near isogenic lines to understand context dependent expression of QTL for grain yield and adaptive traits in bread wheat. BMC Plant Biol. 2016, 16, 161. [Google Scholar] [CrossRef] [PubMed]
  43. Coulton, A.; Przewieslik-Allen, A.M.; Burridge, A.J.; Shaw, D.S.; Edwards, K.J.; Barker, G.L.A. Segregation distortion: Utilizing simulated genotyping data to evaluate statistical methods. PLoS ONE 2020, 15, e0228951. [Google Scholar] [CrossRef]
  44. Thirkell, T.J.; Pastok, D.; Field, K.J. Carbon for nutrient exchange between arbuscular mycorrhizal fungi and wheat varies according to cultivar and changes in atmospheric carbon dioxide concentration. Glob. Change Biol. 2020, 26, 1725–1738. [Google Scholar] [CrossRef]
  45. Wheat Genetic Improvement Network. Available online: http://www.wgin.org.uk/ (accessed on 25 February 2025).
  46. Dospekhov, B. Methods of Field Experience; Kolos: Moscow, Russia, 1985; p. 351. (In Russian) [Google Scholar]
  47. Amalova, A.; Abugalieva, S.; Chudinov, V.; Sereda, G.; Tokhetova, L.; Abdikhalyk, A.; Turuspekov, Y. QTL mapping of agronomic traits in wheat using the UK Avalon × Cadenza reference mapping population grown in Kazakhstan. PeerJ 2021, 9, e10733. [Google Scholar] [CrossRef]
  48. American Association of Cereal Chemists. Available online: https://www.cerealsgrains.org/resources/methods/Pages/default.aspx (accessed on 25 March 2025).
  49. International Organization for Standardization. Available online: https://www.iso.org/standards.html (accessed on 10 February 2026).
  50. GOST 10840-2017; Grain. Methods for Determining Test Weight Per Liter. National Body for Standards and Metrology: Moscow, Russia, 2019; pp. 1–21. (In Russian)
  51. GOST 10846-91; Grain and Its Processed Products. Method for Determination of Grain Protein Content. National Body for Standards and Metrology: Moscow, Russia, 2009; pp. 1–8. (In Russian)
  52. GOST 10987-76; Grain. Methods for determination of vitreousness. StandardInform: Moscow, Russia, 2009; pp. 1–4. (In Russian)
  53. ICC 107/1; Determination of the Falling Number According to Hagberg-Perten. ICC: Vienna, Austria, 1968. Available online: https://icc.or.at/icc-standards/standards-overview/107-1-standard-method (accessed on 20 March 2025).
  54. Sinitsyn, S.S.; Zelova, L.A. Mass two-fold determination of the strength of wheat flour, grain sample from 0.5 to 0.15 g. Sib. Bull. Agric. Sci. 1978, 3, 39–44. (In Russian) [Google Scholar]
  55. Osborne, T.B. The Vegetable Proteins; Longmans Green and Co.: London, UK, 1924. [Google Scholar]
  56. GOST 9353-2016; Wheat. Technical Conditions. National Body for Standards and Metrology: Moscow, Russia, 2016; pp. 1–15. (In Russian)
  57. Wang, S.; Basten, C.J.; Zeng, Z.B.; Windows, Q.T.L. Cartographer 2.5; Department of Statistics, North Carolina State University: Raleigh, NC, USA, 2012; Available online: http://statgen.ncsu.edu/qtlcart/WQTLCart.htm (accessed on 20 October 2025).
  58. Voorrips, R.E. MapChart: Software for the graphical presentation of linkage maps and QTLs. J. Hered. 2002, 93, 77–78. [Google Scholar] [CrossRef]
  59. Ensembl Plants. Available online: http://plants.ensembl.org/Triticum_aestivum/Info/Index (accessed on 6 October 2024).
  60. RStudio Team. RStudio: Integrated Development for R; RStudio, PBC: Boston, MA, USA, 2025; Available online: http://www.rstudio.com/ (accessed on 11 February 2025).
  61. Turuspekov, Y.; Baibulatova, A.; Yermekbayev, K.; Tokhetova, L.; Chudinov, V.; Sereda, G.; Ganal, M.; Griffiths, S.; Abugalieva, S. GWAS for plant growth stages and yield components in spring wheat (Triticum aestivum L.) harvested in three regions of Kazakhstan. BMC Plant Biol. 2017, 17, 190. [Google Scholar] [CrossRef] [PubMed]
  62. Mkhabela, M.; Bullock, P.; Sapirstein, H.; Courcelles, J.; Abbasi, S.; Koksel, F. Exploring the influence of weather on gluten strength of hard red spring wheat (Triticum aestivum L.) on the Canadian Prairies. J. Cereal Sci. 2022, 104, 103410. [Google Scholar] [CrossRef]
  63. Peng, Y.; Zhao, Y.; Yu, Z.; Zeng, J.; Xu, D.; Dong, J.; Ma, W. Wheat quality formation and its regulatory mechanism. Front. Plant Sci. 2022, 13, 834654. [Google Scholar] [CrossRef]
  64. Zhang, X.; Guo, Z.; Xu, J.; Huang, C.; Dang, H.; Mu, W.; Zhang, L.; Hou, S.; Huang, N.; Li, C.; et al. Nutrient requirements determined by grain yield and protein content to optimize N, P, and K fertilizer management in China. Sci. Total Environ. 2024, 946, 174187. [Google Scholar] [CrossRef]
  65. Guo, A.; Ren, H.; Yang, H.; Liang, Z.; Li, Y.; Dou, T.; Ma, Y.; Shen, H. Physiological and molecular mechanisms of nitrogen regulation on grain quality in cereal crops at later stages. Int. J. Mol. Sci. 2026, 27, 2125. [Google Scholar] [CrossRef]
  66. Geyer, M.; Mohler, V.; Hartl, L. Genetics of the inverse relationship between grain yield and grain protein content in common wheat. Plants 2022, 11, 2146. [Google Scholar] [CrossRef]
  67. Martínez-Peña, R.; Rezzouk, F.Z.; del Carmen Díez-Fraile, M.; Nieto-Taladriz, M.T.; Araus, J.L.; Aparicio, N.; Vicente, R. Genotype-by-environment interaction for grain yield and quality traits in durum wheat: Identification of ideotypes adapted to the Spanish region of Castile and León. Eur. J. Agron. 2023, 151, 126951. [Google Scholar] [CrossRef]
  68. Gorinoiu, G.; Petolescu, C.; Agapie, A.L.; Buzna, C.; Rain, P.; Horablaga, N.M.; Horablaga, A.; Samfira, I.; Boldea, M.V.; Petrescu, I.; et al. Yield, Protein, and Starch Equilibrium of Indigenous Varieties: An Open Door for Computational Breeding in Enhancing Selection Strategies. Agronomy 2025, 15, 1280. [Google Scholar] [CrossRef]
  69. Fradgley, N.S.; Gardner, K.; Kerton, M.; Swarbreck, S.M.; Bentley, A.R. Trade-offs in the genetic control of functional and nutritional quality traits in UK winter wheat. Heredity 2022, 128, 420–433. [Google Scholar] [CrossRef] [PubMed]
  70. Kulwal, P.; Kumar, N.; Kumar, A.; Gupta, R.K.; Balyan, H.S.; Gupta, P.K. Gene networks in hexaploid wheat: Interacting quantitative trait loci for grain protein content. Funct. Integr. Genom. 2005, 5, 254–259. [Google Scholar] [CrossRef]
  71. Maphosa, L.; Langridge, P.; Taylor, H.; Chalmers, K.J.; Bennett, D.; Kuchel, H.; Mather, D.E. Genetic control of processing quality in a bread wheat mapping population grown in water-limited environments. J. Cereal Sci. 2013, 57, 304–311. [Google Scholar] [CrossRef]
  72. Echeverry-Solarte, M.; Kumar, A.; Kianian, S.; Simsek, S.; Alamri, M.S.; Mantovani, E.E.; Mergoum, M. New QTL alleles for quality-related traits in spring wheat revealed by RIL population derived from supernumerary × non-supernumerary spikelet genotypes. Theor. Appl. Genet. 2015, 128, 893–912. [Google Scholar] [CrossRef]
  73. Huang, X.Q.; Cloutier, S.; Lycar, L.; Radovanovic, N.; Humphreys, D.G.; Noll, J.S.; Brown, P. Molecular detection of QTLs for agronomic and quality traits in a doubled haploid population derived from two Canadian wheats (Triticum aestivum L.). Theor. Appl. Genet. 2006, 113, 753–766. [Google Scholar] [CrossRef]
  74. McCartney, C.A.; Somers, D.J.; Lukow, O.; Ames, N.; Noll, J.; Cloutier, S.; McCallum, B.D. QTL analysis of quality traits in the spring wheat cross RL4452 × ‘AC Domain’. Plant Breed. 2006, 125, 565–575. [Google Scholar] [CrossRef]
  75. Sung, Y.; Kim, K.; Park, J.; Kang, S.; Park, C.; Cho, S.; Kim, C. Identification and characterization of a novel Wx-B1 allele in a waxy wheat (Triticum aestivum L.). Plant Biotechnol. Rep. 2024, 18, 719–733. [Google Scholar] [CrossRef]
  76. Sieber, A.N.; Würschum, T.; Longin, C.F.H. Vitreosity, its stability and relationship to protein content in durum wheat. J. Cereal Sci. 2015, 61, 71–77. [Google Scholar] [CrossRef]
  77. Thomas, S.G. Novel Rht-1 dwarfing genes: Tools for wheat breeding and dissecting the function of DELLA proteins. J. Exp. Bot. 2017, 68, 354–358. [Google Scholar] [CrossRef] [PubMed]
  78. Seki, M.; Chono, M.; Matsunaka, H.; Fujita, M.; Oda, S.; Kubo, K.; Kato, K. Distribution of photoperiod-insensitive alleles Ppd-B1a and Ppd-D1a and their effect on heading time in Japanese wheat cultivars. Breed. Sci. 2011, 61, 405–412. [Google Scholar] [CrossRef]
Figure 1. The distribution of grain quality and yield-related traits of double-haploid lines from the Avalon × Cadenza population was observed across three regions: northern (KB), central (KA), and southern (KO). Note: (A)—test weight per liter (g/L), (B)—grain protein content (%), (C)—gliadin content (%), (D)—glutenin content (%), (E)—grain hardness (%), (F)—grain vitreousness (%), (G)—sedimentation value in a 2% acetic acid solution (mL), (H)—amylose content (%), (I)—falling number (s); (J)—yield per square meter (g/m2). Boxes represent the interquartile range, whiskers indicate the range, and dots represent outliers.
Agronomy 16 00832 g001
Figure 2. Pearson’s correlation index among average data of eight studied traits associated with yield and grain quality traits for 101 DHLs of the Avalon × Cadenza population grown in three regions in the north (KB (A)), central (KA (B)), and the south (KO (C)). Note: TWL—test weight per liter (g/L), GPC—grain protein content (%), Gli—gliadin content (%), Glu—glutenin content (%), GH—grain hardness (%), GV—grain vitreousness (%), FN—falling number (s), SV—sedimentation value in a 2% acetic acid solution (mL), Amc—amylose content (%), YM2—yield per square meter (g/m2). Correlations with p < 0.05 are highlighted in color. The color indicates a positive (blue) or negative (red) correlation.
Agronomy 16 00832 g002
Figure 3. Genetic map of the Avalon × Cadenza doubled-haploid mapping population showing QTLs associated with grain quality traits. Note: Gene names are presented in italics, and markers indicate the positions of peaks.
Agronomy 16 00832 g003
Figure 4. QTL mapping of QSed-A × C.ipbb-1B for sedimentation value for 2% acetic acid under the conditions of central Kazakhstan (2013–2014).
Agronomy 16 00832 g004
Table 1. Standards for determining grain quality traits.
Grain Quality Trait Standards
Interstate International
Test weight per liter (TWL, g/L)GOST 10840-2017 [50]AACC 55-10 [48]
Grain protein content (GPC, %)GOST 10846-91 [51]ISO 1871:2009 [49]
Grain hardness (GH, %)GOST 10846-91 [51]AACC 3970 [48]
AACC 55-30 [48]
Grain vitreousness (GV, %)GOST 10987-76 [52]
Falling number (FN, s) ICC 107/1 [53],
ISO 3093-2004 [49]
AACC 56-81B [48]
Table 2. Interstate standard requirements for determining the quality of bread wheat grain [56].
Name of the TraitsCharacteristics of Bread Wheat by Classes
Class1st2nd3rd4th5th
Grain protein content, %≥14.5≥13.5≥12.0≥10.0Not limited
Falling number, s20015080Not limited
Grain vitreousness, %6040Not limited
Test weight per liter, g/L≥750≥730≥710Not limited
Table 3. Characterization of samples in the Avalon × Cadenza mapping population using five grain quality traits.
Grain Protein Content (GPC, %)
ClassesKBKAKO
1 class (14.5–19.0%)101 DHL101 DHL
2 class (13.5%)1 DHL
3 class (12.0%)4 DHL
4 class (8–11%)95 DHL
Unclassified1 DHL
Sedimentation value in a 2% acetic acid solution (SV, mL)
Classes KBKAKO
Strong (>70 mL)
Valuable (51–70 mL)1 DHL14 DHL
Filler (31–50 mL),100 DHL86 DHL5 DHL
Weak (0–30 mL) 1 DHL95 DHL
Unclassified1 DHL
Grain vitreousness (GV, %)
Classes KBKAKO
1/2 class (60%)101 DHL101 DHL43 DHL
3 class (40%)53 DHL
Unclassified5 DHL
Grain hardness (GH, %)
Classes KBKAKO
Hard (>65 unit)101 DHL101 DHL88 DHL
Mixed (40–60 unit)8 DHL
Unclassified5 DHL
Falling number (FN, s)
1/2 class (200 s)88 DHL98 DHL89 DHL
3 class (150 s)12 DHL3 DHL-
4 class (80 s)---
Unclassified1 DHL-12 DHL
Test weight per liter (TWL, g/L)
Classes KBKAKO
1/2 class (750 g/L)20 DHL1 DHL
3 class (730 g/L)43 DHL3 DHL
4 class (710 g/L)10 DHL35 DHL13 DHL
Unclassified91 DHL3 DHL84 DHL
Note: KB—Karabalyk Agricultural Experimental Station (North Kazakhstan); KA—Karaganda Agricultural Experimental Station named after A.F. Khristenko (Central Kazakhstan); KO—Kazakh Scientific Research Institute of Rice Cultivation named after Ibray Zhakhaev (Kyzylorda region, South Kazakhstan).
Table 4. Number of identified quantitative trait loci in Avalon × Cadenza double haploid mapping population in three study locations.
TraitsAll QTLMajor
QTL 1
Stable
QTL 2
Stable QTL
KBKAKO
Test weight per liter (TWL, g/L)14113222
Grain protein content (GPC, %)14141110
Amylose content (Amc, %)10101010
Gliadin content (Gli, %)982121
Glutenin content (Glu, %)550122
Grain hardness (GH, %)770000
Grain vitreousness (GV, %) 1184122
Falling number (FN, s)771110
Sedimentation value (SV, mL)12124231
Total8982169148
Note: 1—major QTLs (R2 > 10%), 2—stable QTLs detected in two or more environments; KB—Karabalyk Agricultural Experimental Station (North Kazakhstan); KA—Karaganda Agricultural Experimental Station named after A.F. Khristenko (Central Kazakhstan); KO—Kazakh Scientific Research Institute of Rice Cultivation named after Ibray Zhakhaev (Kyzylorda region, South Kazakhstan) Numbers in columns KB, KA, and KO indicate the number of stable QTLs detected in each region.
Table 5. List of identified stable QTLs for grain quality traits of the mapping population Avalon × Cadenza in three regions of Kazakhstan.
QTLChromosomeInterval
cM
LODMax.
R2%
AdditiveConditions (Region, Year)
EffectAllele
Qtwl-A × C_ipbb-2D.12D6.5–30.76.415−9.74CadenzaKB-13, KO-15, KO-mean
Qtwl-A × C_ipbb-2D.22D50.0–82.07.322−8.03CadenzaKA-13, KA-mean
Qtwl-A × C_ipbb-4D4D20.1–65.59.626−19.0CadenzaKB-13, KB-mean, KA-13, KA-mean, KO-15, KO-mean
QGpc-A × C_ipbb-2D2D19.6–50.38.42738AvalonKB-13, KB-mean, KA-14
QAmc-A × C_ipbb-1A1A10.8–33.56.615−1.2CadenzaKA-14, KA-15
QGli-A × C_ipbb-2D2D5.9–30.74.9131.22AvalonKB-14, KA-13, KA-mean
QGli-A × C_ipbb-5A5A9.0–36.14.5150.99AvalonKA-14, KO-15
QGv-A × C_ipbb-1B1B88.5–111.39.325−5.29CadenzaKO-14, KO-mean
QGv-A × C_ipbb-4A4A20.5–44.35.715−1.38CadenzaKA-14, KA-mean
QGv-A × C_ipbb-7D.17D0.0–13.14.814−2.46CadenzaKB-14, mean
QGv-A × C_ipbb-7D.27D21.1–46.7621−1.59CadenzaKA-13, KO-14,15, mean
QFn-A × C_ipbb-1A1A16.8–45.35.217−32.3CadenzaKB-14, KA-14
Qsed-A × C_ipbb-1B1B99.3–125.510.828−3.56CadenzaKA-13, KA-14
Qsed-A × C_ipbb-4A4A84.5–123.64.2142.2AvalonKB-15, KB-mean
Qsed-A × C_ipbb-6A.16A30.7–66.96.114−2.99CadenzaKA-14, KO-14
Qsed-A × C_ipbb-6A.26A99.4–133.03.814−1.35CadenzaKB-13, KA-13
Note: KB—Karabalyk Agricultural Experimental Station (North Kazakhstan); KA—Karaganda Agricultural Experimental Station named after A.F. Khristenko (Central Kazakhstan); KO—Kazakh Scientific Research Institute of Rice Cultivation named after Ibray Zhakhaev (Kyzylorda region, South Kazakhstan).
Disclaimer/Publisher’s Note: The statements, opinions and data contained in all publications are solely those of the individual author(s) and contributor(s) and not of MDPI and/or the editor(s). MDPI and/or the editor(s) disclaim responsibility for any injury to people or property resulting from any ideas, methods, instructions or products referred to in the content.