Article

Biochar and Nitrogen Synergistically Regulate Soil Carbon Mineralization by Enhancing Aggregate Stability and Altering Microbial Function in Intensive Vegetable Systems

1
Key Laboratory of Agro-Environment in Downstream of Yangtze Plain, Ministry of Agriculture and Rural Affairs, Institute of Agricultural Resources and Environment, Jiangsu Academy of Agricultural Sciences, Nanjing 210014, China
2
College of Resources and Environmental Sciences, Nanjing Agricultural University, Nanjing 211800, China
3
School of Agriculture, Yunnan University, Kunming 650504, China
*
Author to whom correspondence should be addressed.
Agronomy 2026, 16(8), 825; https://doi.org/10.3390/agronomy16080825
Submission received: 18 March 2026 / Revised: 11 April 2026 / Accepted: 15 April 2026 / Published: 17 April 2026

Abstract

Intensive nitrogen (N) fertilization in greenhouse vegetable systems degrades soil structure and accelerates soil carbon (C) mineralization. Biochar application can alleviate these adverse effects by enhancing aggregate stability and mediating microbially driven nutrient cycling, yet its effects across aggregate fractions remain poorly understood. Here, we investigated how biochar (0, 20, 40 t ha−1) and N interact to affect aggregate stability, C mineralization, nutrient status, and microbial properties in bulk soil and four aggregate classes (large macroaggregates: LMA, > 2000 μm; small macroaggregates: SMA, 250–2000 μm; microaggregates: MA, 53–250 μm; silt + clay: S + C, < 53 μm) in vegetable soil after a 60-day incubation. Results showed that biochar–N co-application increased mean weight diameter by 27.4–30.5% and elevated soil total organic C (TOC) in LMA by 9.11–12.0% and in MA by 8.77–20.2% relative to the N-only treatment. It also reduced β-glucosidase and oxidase activities, as well as fungal and G-bacterial abundance. Biochar amendment suppressed TOC mineralization by 2.7–24.6% in bulk soil and aggregate fractions, while boosting potentially mineralizable C pools by 12.5–155.7%, and thereby increasing overall mineralization potential. Structural equation modeling revealed the size-dependent regulatory mechanisms underlying these observations. Aggregate stability directly inhibited CO2 emissions in bulk soil and SMA, while the effects in MA and S + C fractions were mediated by shifts in nutrient stoichiometry and hydrolase activities. Our findings clarified the size-dependent mechanisms by which biochar–N co-application promoted soil C sequestration, providing a theoretical basis for the sustainable management of intensive vegetable systems.

1. Introduction

The intensification of global agriculture is essential to feed a growing population, yet it has also triggered severe environmental challenges [1]. Intensive vegetable cropping systems, characterized by high nitrogen (N) inputs, frequent tillage, and rapid crop turnover, boost short-term yields but aggravate soil acidification, disrupt aggregate structure, increase greenhouse gas emissions, and deplete soil organic carbon (SOC) stocks [2,3]. These issues are amplified under enclosed greenhouse conditions, which accelerate microbial decomposition of SOC and further weaken soil structural stability [4].
As the fundamental units of soil structure, soil aggregates govern porosity, water retention, and nutrient cycling. Crucially, they physically protect SOC from mineralization by restricting microbial and enzymatic access via pore-size exclusion and hydrophobicity [5,6,7]. The stability of different aggregate size classes directly influences SOC dynamics. Although macroaggregates (>250 μm) serve as important reservoirs for initial SOC storage, they are generally more susceptible to disruption than microaggregates (MA, 53–250 μm) under agricultural disturbance. The breakdown of macroaggregates not only releases physically protected SOC but also amplifies mineralization [8,9]. This process is especially evident in intensive vegetable systems, where frequent tillage, wetting-drying cycles, and high N inputs markedly reduce aggregate stability [10]. Therefore, stabilizing aggregates has become a critical target for mitigating SOC loss, maintaining soil fertility, and enhancing aggregate resistance to disturbance in intensive vegetable systems.
Biochar, a carbon-rich pyrolysis material, has emerged as a promising soil amendment for sustainable agriculture [11]. Its porous structure, high C content and cation exchange capacity can (1) stabilize aggregates by acting as a physical binder and stimulating the microbial production of binding agents [12,13]; (2) regulate soil total organic C (TOC) mineralization via priming effects linked to microbial C:N stoichiometry [12,14]; (3) improve nutrient retention by reducing leaching [15]; and (4) provide habitats for microorganisms [16]. Studies report that biochar can increase the mean weight diameter (MWD) of aggregates by 20.0–52% at an application rate of 22.5–60 t ha−1 [17,18], sequester C by lowering TOC mineralization [19,20], and reduce nitrate leaching by 26–32% via organic coating and organic acid adsorption in agricultural soils [21]. Additionally, biochar can shift microbial community composition via labile C inputs, with consequences for SOC cycling [22].
Despite these advances, the functional link between biochar-induced aggregate stabilization and TOC mineralization remains controversial, particularly in high-N vegetable systems. The existing findings report both suppression and stimulation of TOC mineralization within different aggregate fractions following biochar addition, reflecting complex interactions among soil and biochar properties and environmental conditions [23,24,25,26]. Moreover, biochar-induced changes in physicochemical and microbial properties may vary among aggregate fractions and help explain fraction-specific mineralization responses [18,23,27]. This contradiction highlights a key mechanistic gap: it is unclear whether biochar’s effects are driven primarily by enhanced physical protection across the aggregate spectrum or mediated mainly by microbial shifts within distinct aggregate-scale niches. This issue is especially pertinent in intensively managed vegetable soils, where tillage and high N inputs profoundly affect microbial activity and biochar stability, altering its interaction with soil aggregates [28].
To investigate the synergistic effects of a N fertilizer and biochar on aggregate stability and TOC mineralization, we fractionated a typical vegetable soil into four aggregate sizes and conducted a parallel 60-day incubation experiment on bulk soil and each fraction. We integrated aggregate fractionation with enzyme assays, microbial community profiling, and incubation-based C mineralization modeling to resolve aggregate size-specific mechanisms. We specifically aimed to (1) quantify the synergistic effects of biochar and N on TOC mineralization across different aggregate fractions; and (2) elucidate the relationship between biochar-enhanced aggregate stability and TOC mineralization under N amendment. Based on our prior observations in field conditions [29], we hypothesized that biochar would suppress TOC mineralization through mechanisms involving enhanced physical protection within stable aggregates and a microbial community shift toward traits conducive to C sequestration. Our findings provide critical insights for designing biochar-based strategies to enhance C sequestration and improve sustainability in intensive vegetable production systems.

2. Materials and Methods

2.1. Study Site and Soil Sampling

An in situ field experiment was initiated in November 2016 in a vegetable cropping rotation in Haplic Luvisol in Doucun, Nanjing, Jiangsu Province, China (32°01′ N, 118°52′ E). The region has a subtropical climate with mean annual rainfall of 1050 mm and temperature of 15.4 °C. The experiment used a randomized complete block design with four treatments and three replicates per treatment, each plot measuring 4 m2 (2 m × 2 m): (i) N0C0 (no urea or biochar), (ii) N1C0 (urea only), (iii) N1C1 (urea + 20 t ha−1 biochar), and (iv) N1C2 (urea + 40 t ha−1 biochar). To avoid edge effects and cross-contamination from biochar particle migration, each plot was enclosed by impermeable plastic barriers inserted to a 40 cm depth, and 30 cm-wide buffer zones were established between adjacent plots. Nitrogen (urea, 46.0% N), phosphorus (calcium magnesium phosphate, 14.0% P2O5), and potassium (potassium chloride, 63.2% K2O) were applied at equal rates of 240 kg ha−1 per crop season to all fertilized plots (N1C0, N1C1, N1C2); the N0C0 control received no urea. Wheat straw-derived biochar (Henan Sanli New Energy Co., Ltd., Shangqiu, China), produced by pyrolysis at 400–500 °C for 6 h, was thoroughly incorporated once into the 0–20 cm layer in November 2016. The biochar had a pH of 9.74, total C content of 751 g kg−1, total N content of 11.6 g kg−1, C/N ratio of 64.8, specific surface area of 11.52 m2 g−1, and average pore size of 3.92 nm. Initial topsoil properties are provided in Table S1 of the Supplementary Materials. Consecutive vegetable crops, including Baby bok choy, Tung choy, Amaranth, Spinach and Coriander herb, were grown following local conventional practices, with detailed information provided in Table S2 of the Supplementary Materials [29]. Notably, standalone biochar-only treatments without N fertilization were not included, as such a practice is not agronomically feasible in intensive vegetable production systems where synthetic N fertilization is routinely implemented to meet the high nutrient demands of vegetable crops.
Undisturbed soil cores (0–20 cm) were collected at crop harvest in June 2020. Within each plot, five cores were taken along an S-shaped transect, extracted vertically, placed in sterile containers, and transported to the laboratory. Samples were gently broken along natural planes by hand to pass an 8 mm sieve for soil aggregate stability analysis [28]. The remaining soil samples were sieved and subdivided into two parts: one portion was stored at 4 °C for incubation, and the other was air-dried for physicochemical analyses. Biochar aging and surface oxidation inevitably occurred over the 3.5-year field period, which may have modified its surface functional groups and carbon stability; however, this study focused on the overall net effects of biochar within the soil system under realistic field conditions.

2.2. Aggregate Size Distribution

Aggregate fractions were obtained by a modified wet-sieving procedure into four size classes [30]: large macroaggregates (LMA, >2000 μm), small macroaggregates (SMA, 250–2000 μm), microaggregates (MA, 53–250 μm), and Silt + clay fractions (S + C fractions, <53 μm). Briefly, 100 g of field-moist soil was placed on a 2 mm sieve, submerged in deionized water to a 1 cm depth, and equilibrated for 5 min. The sieve was then moved up and down 50 times over 2 min at a 3 cm amplitude. Unbound floating materials (>2000 μm), mainly residual plastic film fragments common in mulched vegetable systems, were gently siphoned and removed to avoid interference with aggregate analysis. The soil remaining on the 2 mm sieve was collected as LMA. The slurry passing through the sieve was transferred sequentially through 250 μm and 53 μm sieves, with the sieving process repeated at each stage to obtain SMA and MA, respectively. The final slurry (<53 μm) was centrifuged at 2500 rpm for 2 min to recover the S + C fractions [31]. All fractions were freeze-dried, weighed, and stored for subsequent analysis. Aggregate stability was expressed as mean weight diameter (MWD), calculated according to the method of Fungo et al. [32].
M W D = i = 1 n w i · x i  
where xi represents the average diameter between two adjacent sieves, and wi denotes the mass fraction of aggregates retained on the ith sieve. Aggregate size distribution was determined by computing the proportion of aggregate mass on each sieve relative to the total aggregate mass.

2.3. Incubation Experiment and CO2 Monitoring

A 60-day aerobic incubation was conducted on bulk soil and four aggregate fractions to determine TOC mineralization. No additional biochar was supplemented during laboratory preparation, as all soil materials were directly sampled from field plots with pre-established biochar treatments. For each treatment, triplicate samples equivalent to 25 g dry-weight soil were placed in 125 mL serum bottles and incubated at 25 °C in the dark. Soil moisture was maintained at 60% water-holding capacity (WHC) throughout the incubation by adding deionized water as needed, with a headspace volume of approximately 97 mL in each bottle. All bulk soil and aggregate fractions were incubated under identical conditions to ensure consistency across all samples. After a 7-day pre-incubation, headspace CO2 was monitored 21 times over 60 days (days 1, 2, 3, 4, 5, 6, 7, 8, 10, 12, 14, 16, 18, 20, 23, 26, 29, 34, 40, 50, and 60). Before each sampling, bottles were flushed with high-purity air (Nanjing Special Gas Factory, Nanjing, China) with a CO2 concentration of 50 μmol mol−1 for 10 min and then sealed with butyl rubber stoppers for 4 h. CO2 concentrations at 0 and 4 h were measured using an Agilent 7890A gas chromatograph (Agilent Ltd., Shanghai, China). The 4 h closure period was chosen to minimize CO2 accumulation and avoid inhibitory effects on microbial respiration. After incubation, soils were collected for subsequent analyses. One portion was stored at −80 °C for microbial analysis, and the other was kept at 4 °C for analysis of dissolved organic C and N (DOC and DON), microbial biomass C and N (MBC and MBN), and enzyme activities within one week.

2.4. Soil Chemical Analyses and Enzyme Activities

The TOC content was measured by wet digestion using potassium dichromate, and total N was determined by the Kjeldahl method. Soil DOC and DON were extracted with deionized water at a 5:1 water-to-soil ratio and quantified using a multi N/C analyzer (Analytic Jena, TOC Analyzer, Jena, Germany). Soil MBC and MBN were determined by the chloroform fumigation–extraction method to estimate the total size of the living microbial pool [33,34]. Briefly, MBC and MBN were extracted with 0.5 M K2SO4 (1:5, soil/solution) for 30 min and measured using a TOC analyzer. Conversion coefficients of 0.45 (MBC) and 0.54 (MBN) were used, respectively [35].
Potential activities for β-glucosidase (BG), N-acetyl-β-glucosaminidase (NAG) and leucine aminopeptidase (LAP) were measured fluorometrically using 96-well microplate assays [29,36]. Soil catalase (CAT) and phenol oxidase (PPO) activities were assessed spectrophotometrically using L-3, 4-dihydroxyphenylalanine (L-DOPA) as a substrate [37]. All enzyme activities were expressed as nmol h−1 g−1 dry soil. To ensure the accuracy and reproducibility of enzymatic activity data, each experimental replicate sample was subjected to three technical repeats, and the average value of the three technical repeats was used for subsequent statistical analysis. Detailed methods are supplied in Text S1 of the Supplementary Materials.

2.5. PLFA Analysis

PLFA analysis was used to profile the relative abundance of specific microbial groups and assess shifts in community composition. Phospholipid fatty acids (PLFAs) were extracted from 5.0 g freeze-dried soil using a chloroform–methanol–citrate buffer (pH = 4.0, v/v/v = 2:1:0.8) single-phase extraction, followed by ultrasonication and centrifugation. Phospholipids were purified using solid-phase extraction columns with chloroform, acetone, and methanol, then quantified after adding 19:0 fatty acid as an internal standard and converted to fatty acid methyl esters. These derivatives were then separated and quantified using a gas chromatograph (Agilent 6850, Agilent Technologies, Santa Clara, CA, USA) coupled with the MIDI Sherlock Microbial Identification System (MIDI Inc., Newark, DE, USA). PLFA analysis was performed once per sample, as the extraction and detection protocol was highly stable and reproducible [36]. Total PLFA (nmol g−1 dry soil) was used as an indicator of microbial biomass. Biomarker PLFAs were used to identify major microbial groups and to calculate the ratios of Gram-positive (G+) to Gram-negative (G) bacterial PLFAs (G+:G ratio) and fungal to bacterial PLFAs (F:B ratio), respectively [36].

2.6. Statistics

Cumulative TOC mineralization (Cm) was calculated as CO2 production rate and sequentially cumulated from two consecutive samples [38]. The first-order kinetic model was fitted to evaluate the potentially mineralizable C pool (C0) and the mineralization rate constant (k). Based on C0, k, and TOC content, TOC mineralization efficiency (CME) and TOC mineralization potential (CMP) were further calculated. The TOC mineralization contribution (CMC) of each aggregate fraction was calculated from its mass proportion and mineralization amount [9]. Detailed calculations are provided in Text S2 of the Supplementary Materials.
Data were analyzed using SPSS 25.0 (IBM, Chicago, IL, USA) and OriginPro v.9.0 (OriginLab, Northampton, MA, USA). Results were presented as mean ± standard deviation (n = 3). Differences in soil aggregates, TOC mineralization characteristics, soil properties, enzyme activities, and microbial community structures were evaluated using one-way analysis of variance (ANOVA) with Tukey’s HSD test (p < 0.05). Two-way ANOVA was used to analyze the effects of treatment (Tre), aggregate size classes (ASC), and their interactions (Tre × ASC) on TOC mineralization parameters, soil properties, enzyme activities, and microbial community variables (p < 0.05). Structural equation modeling (SEM), constructed using AMOS 21.0 (Amos Development Corporation, Chicago, IL, USA), was employed to evaluate direct and indirect effects of nutrient stoichiometry, oxidase, hydrolase, and the microbial community on CO2 emissions in bulk soil and aggregate fractions. The model-fitting criteria used in the study included the following thresholds: chi-square (0 ≤ CHI/DF ≤ 3), p-value (>0.05), root mean square error of approximation (RMSEA) (0 ≤ RMSEA ≤ 0.05), and comparative fit index (CFI) (>0.95).

3. Results

3.1. Distribution and Stability of Soil Aggregates

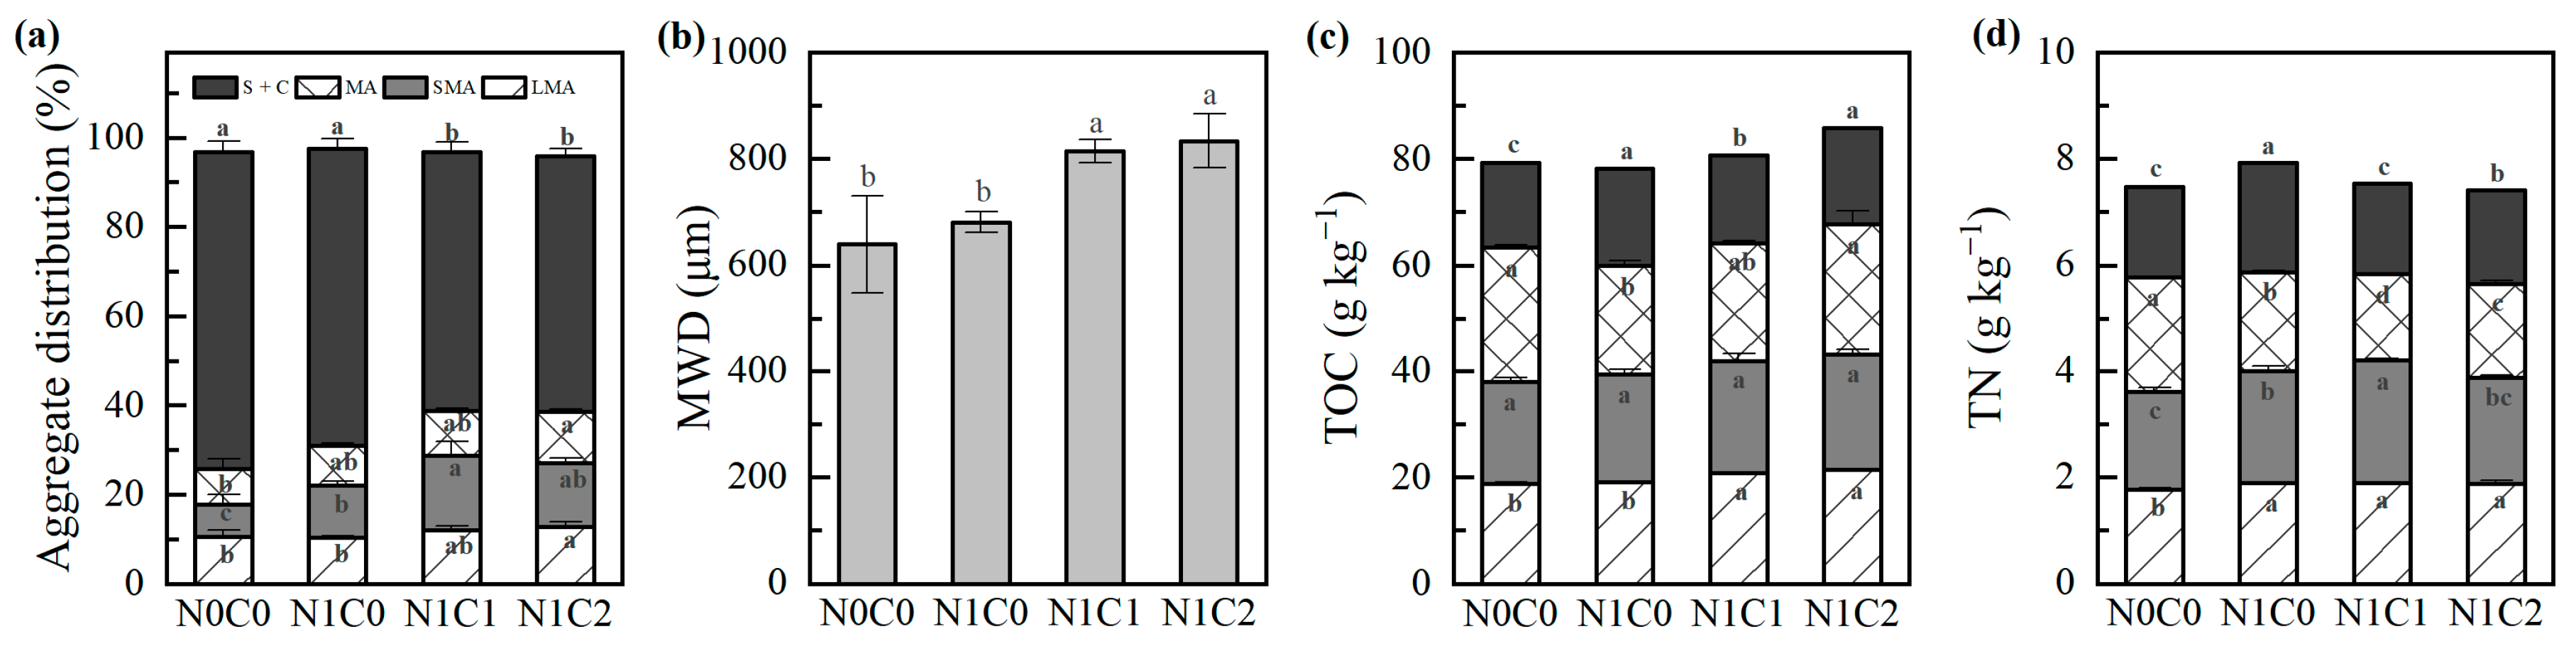
Satisfactory mass recovery (>95.8%) was obtained throughout the analysis (Figure 1a). The S + C fractions dominated across treatments, followed by SMA, LMA, and MA (Figure 1a). Relative to N0C0, N fertilization significantly increased the proportion of macroaggregates by 23.9–62.0%. Compared with N1C0, biochar addition significantly reduced the S + C proportion by 12.9–13.9% (p < 0.05). Mean weight diameter (MWD) increased by 6.51–30.5% with N addition relative to N0C0, and increased further with biochar–N co-application (Figure 1b, p < 0.05). There was no significant difference between the 20 and 40 t ha−1 biochar rates.

3.2. TOC and TN Distribution in Aggregates

Treatment (Tre), aggregate size classes (ASC), and their interaction significantly affected TOC and TN contents (Table S3, p < 0.001). The TOC content was highest in the MA fraction and lowest in the S + C fractions (Figure 1c). Relative to N1C0, biochar significantly increased TOC in LMA by 9.11–12.0% and in MA by 8.77–20.2% (p < 0.05). Although the 40 t ha−1 biochar rate generally showed higher TOC than the 20 t ha−1 rate, this difference was significant only in the S + C fractions. Relative to N0C0, N fertilizer significantly increased TN content in macroaggregates (LMA and SMA) but decreased TN in MA by 13.5–24.7% (Figure 1d, p < 0.05). Co-application of biochar with N further reduced TN in the MA and S + C fractions compared with N1C0.

3.3. Aggregate Size Influenced TOC Mineralization

3.3.1. Cumulative Mineralization and Kinetics

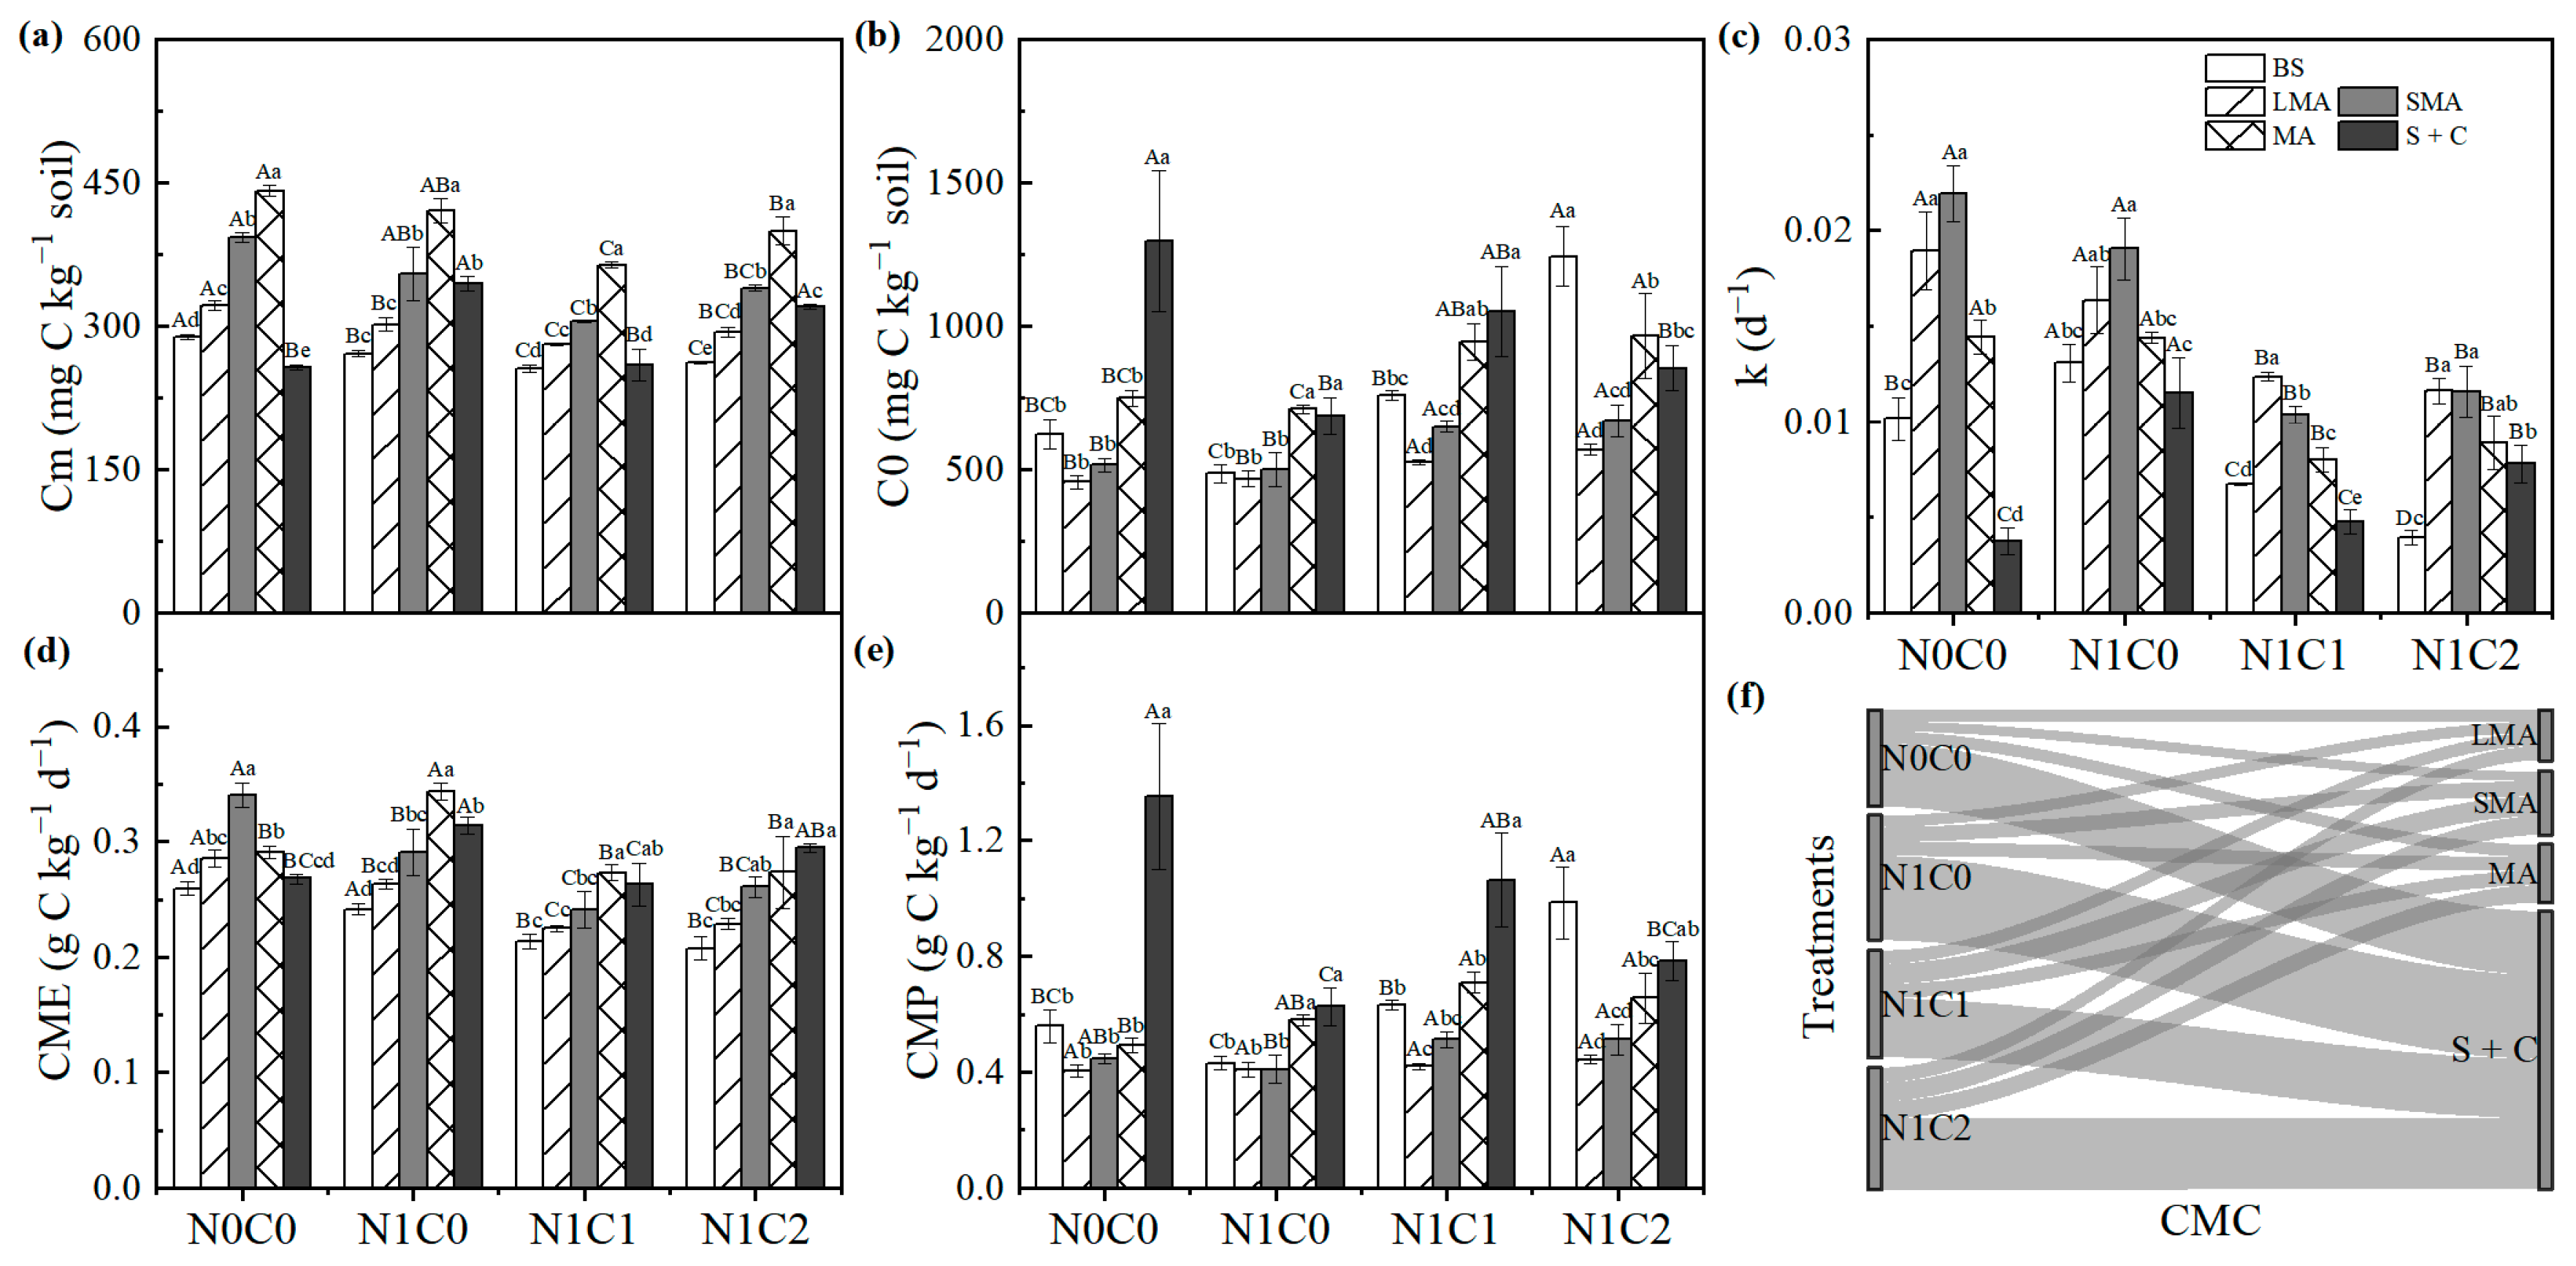
The CO2 release rate from bulk soil and all aggregate fractions declined rapidly during the first 2 weeks of incubation, then stabilized at low levels across all treatments (Figure S1). Cumulative CO2 mineralization (Cm) was significantly affected by Tre, ASC, and their interaction (Table S3; p < 0.001). The Cm values followed the order MA > SMA > LMA across treatments, with S + C exhibiting variable rankings (Figure 2a; p < 0.05). Relative to N0C0, N fertilization reduced Cm values in bulk soil, as well as in the LMA, SMA, and MA fractions (Figure 2a). Compared with N1C0, biochar addition further decreased Cm by 2.7–24.6% in bulk soil and all aggregate fractions, with the lowest values under N1C1 (p < 0.05).
Soil mineralization kinetics were well described by a first-order kinetic model (R2 = 0.956–0.999). The MA and S + C fractions exhibited higher potential mineralizable carbon (C0) values than macroaggregates across treatments (Figure 2b). Relative to N1C0, C0 values increased by 12.5–56.0% under N1C1 and by 21.8–155.7% under N1C2 across bulk soil and all aggregate fractions (Figure 2b; p < 0.05). The mineralization rate constant (k) was higher in macroaggregates than in bulk soil, MA, and S + C (Figure 2c). Biochar substantially reduced k values in bulk soil and all aggregate fractions by 24.4–58.7% (N1C1) and 29.0–69.9% (N1C2) relative to N1C0 (Figure 2c; p < 0.05).

3.3.2. Mineralization Efficiency, Potential and Contribution from Soil Aggregates

The MA and S + C fractions showed higher TOC mineralization efficiency (CME) than macroaggregates and bulk soil under N fertilization (Figure 2d; p < 0.05). Biochar suppressed CME, reducing it by 11.4% (N1C1) and 14.0% (N1C2) in bulk soil, and by 14.6–20.5% (N1C1) and 5.99–20.5% (N1C2) in aggregate fractions, compared with N1C0 (Figure 2d). TOC mineralization potential (CMP) was likewise higher in the MA and S + C fractions than in macroaggregates under N addition (Figure 2e; p < 0.05). Relative to N1C0, biochar–N co-application significantly increased CMP by 46.8–129% in bulk soil and by 25.4–70.0% in the S + C fractions (Figure 2e; p < 0.05).
The S + C fractions contributed more to TOC mineralization than LMA, SMA, and MA across treatments (Figure 2f; p < 0.05). Relative to N1C0, N1C1 and N1C2 increased the contribution of LMA by 14.1% and 26.6%, SMA by 33.4% and 24.5%, and MA by 3.73% and 27.1%, while decreasing the contribution of S + C by 29.7% and 15.5%, respectively (Figure 2f).

3.4. Aggregate-Scale Variation in Chemical Properties and Enzyme Activities

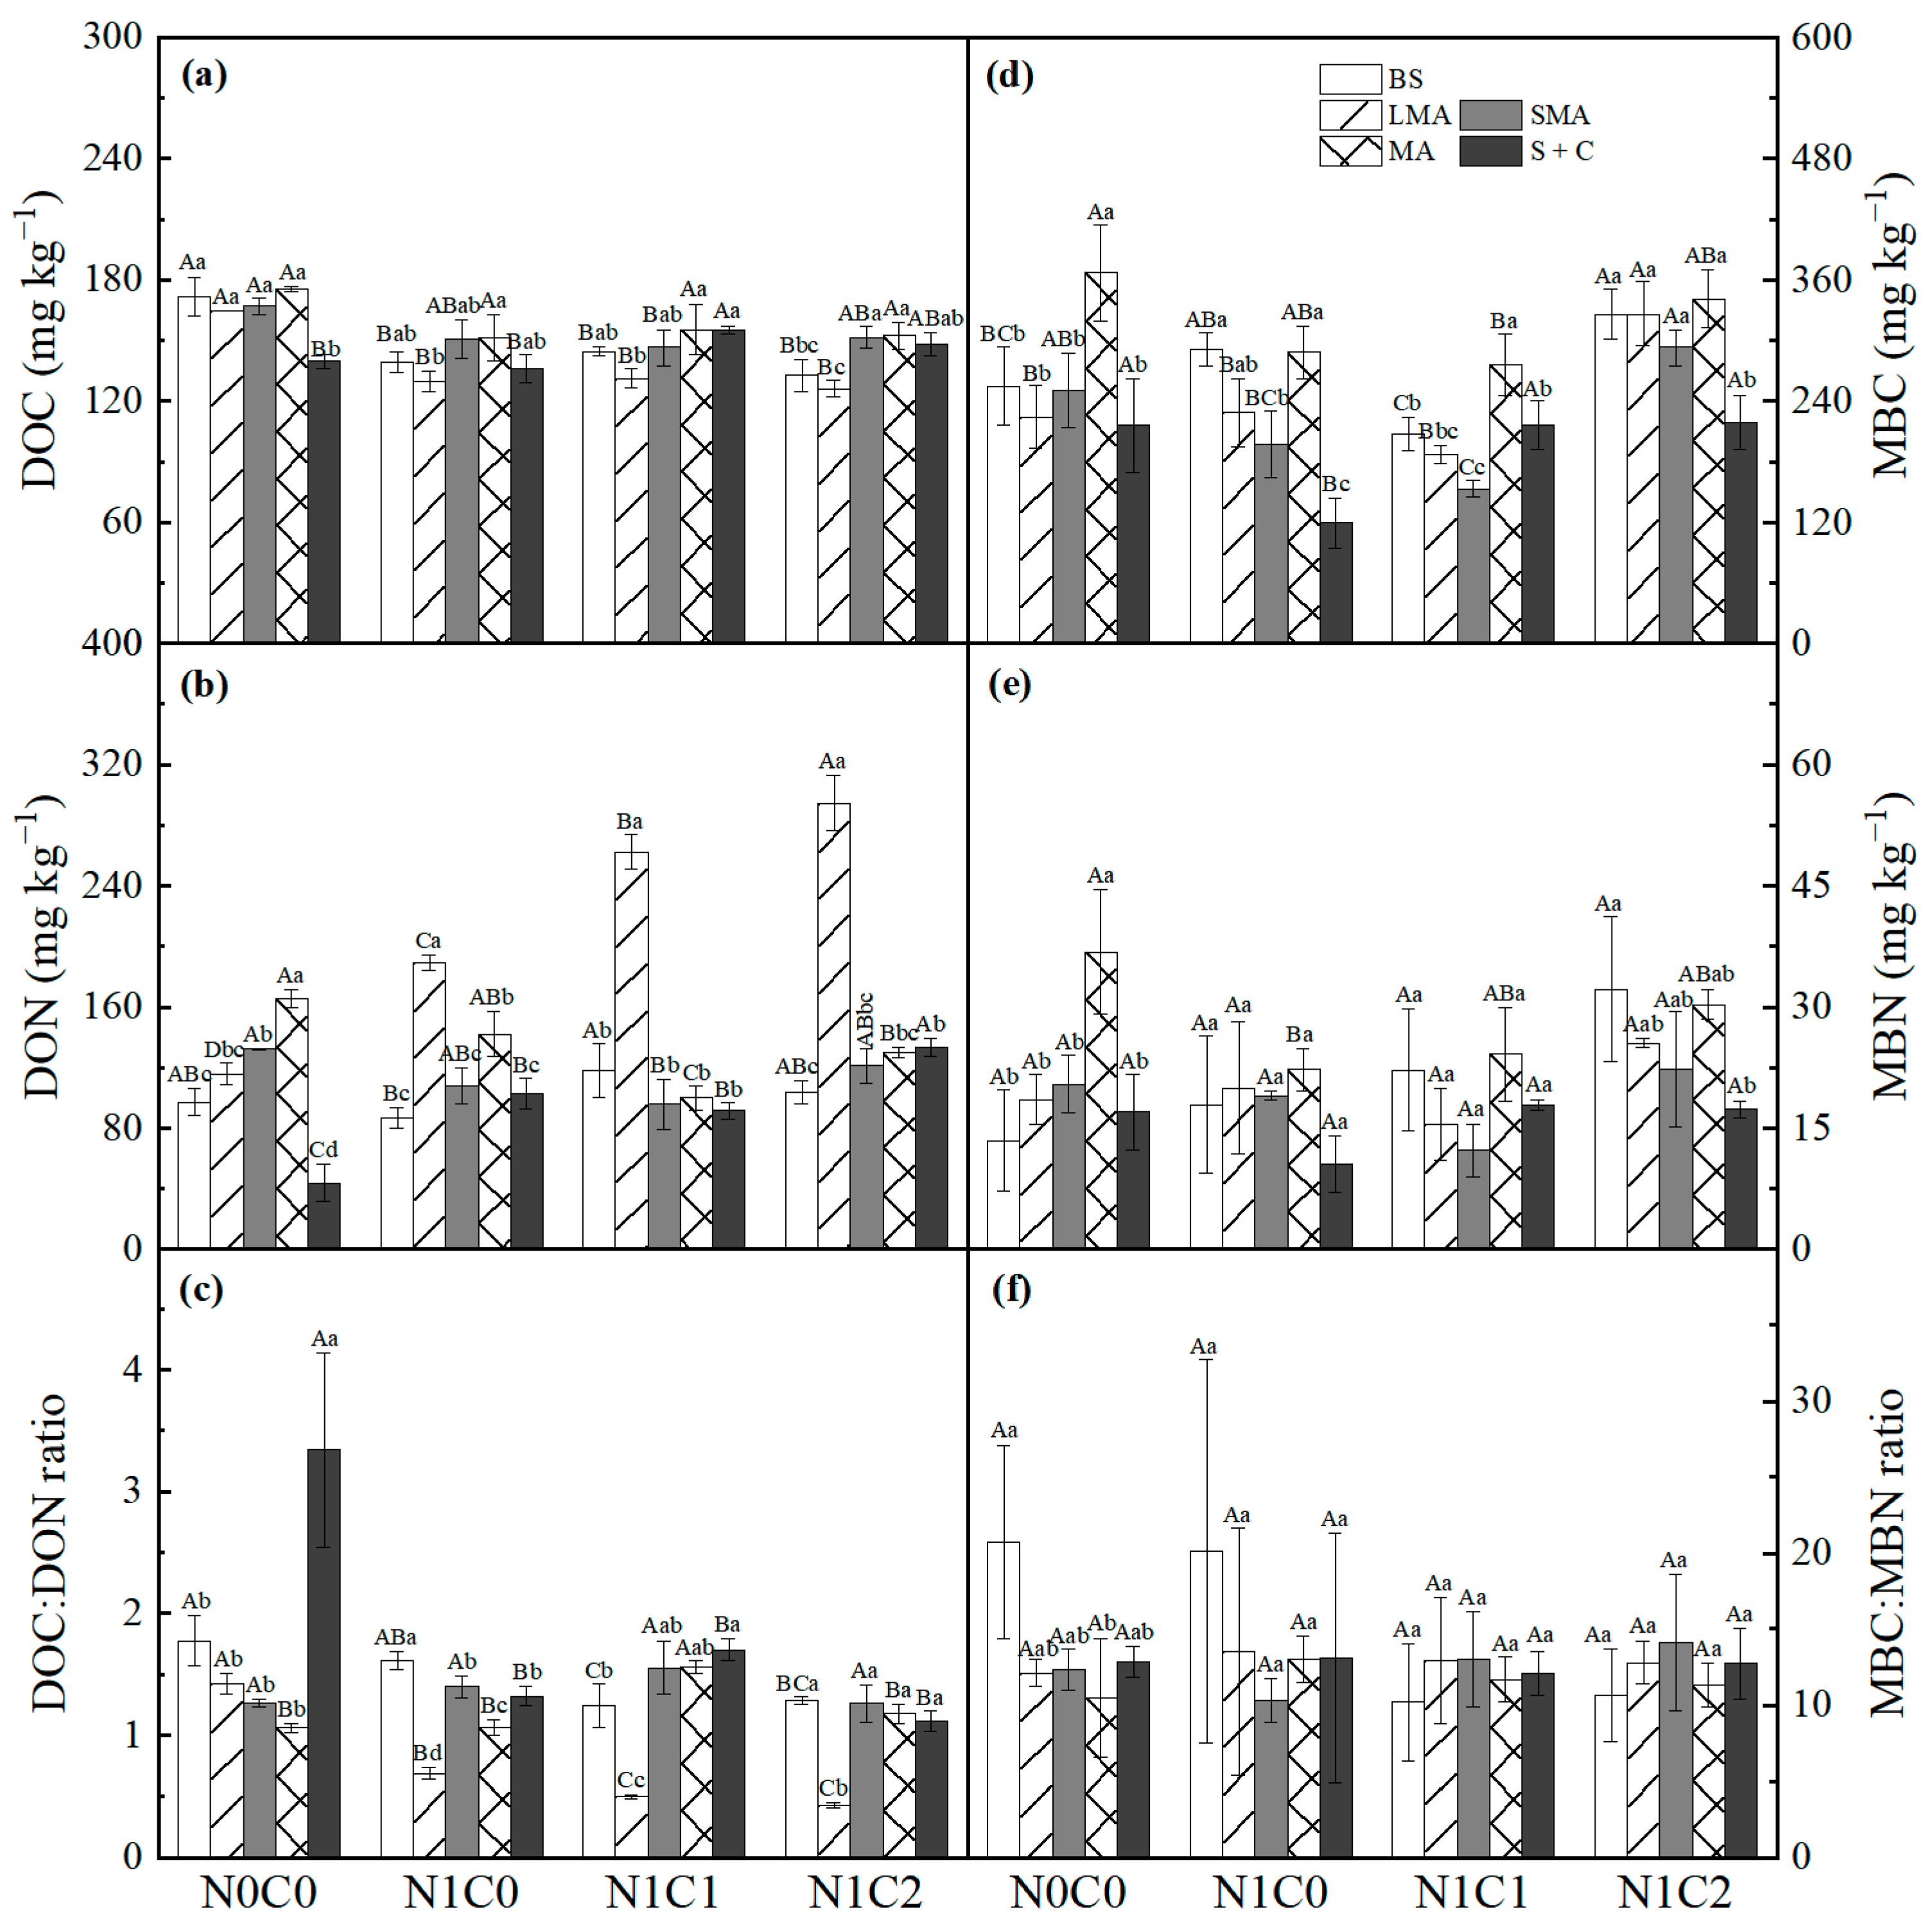
Tre, ASC, and their interaction significantly affected DOC, DON, MBC and MBN (Table S3; p < 0.05). Soil DOC showed minimal variation across treatments, with the highest levels in MA (Figure 3a). N addition increased DON in LMA (further boosted by biochar) and in S + C, but decreased DON in MA, and concurrently reduced the DOC:DON ratio in bulk soil, LMA, and S + C. The LMA fraction consistently had the lowest DOC:DON ratio (Figure 3b,c). The MA fraction contained the highest MBC and MBN (Figure 3d,e). Notably, MBC in the LMA and SMA fractions peaked under N1C2, whereas MBN and the MBC:MBN ratio responded minimally to treatments (Figure 3d–f).
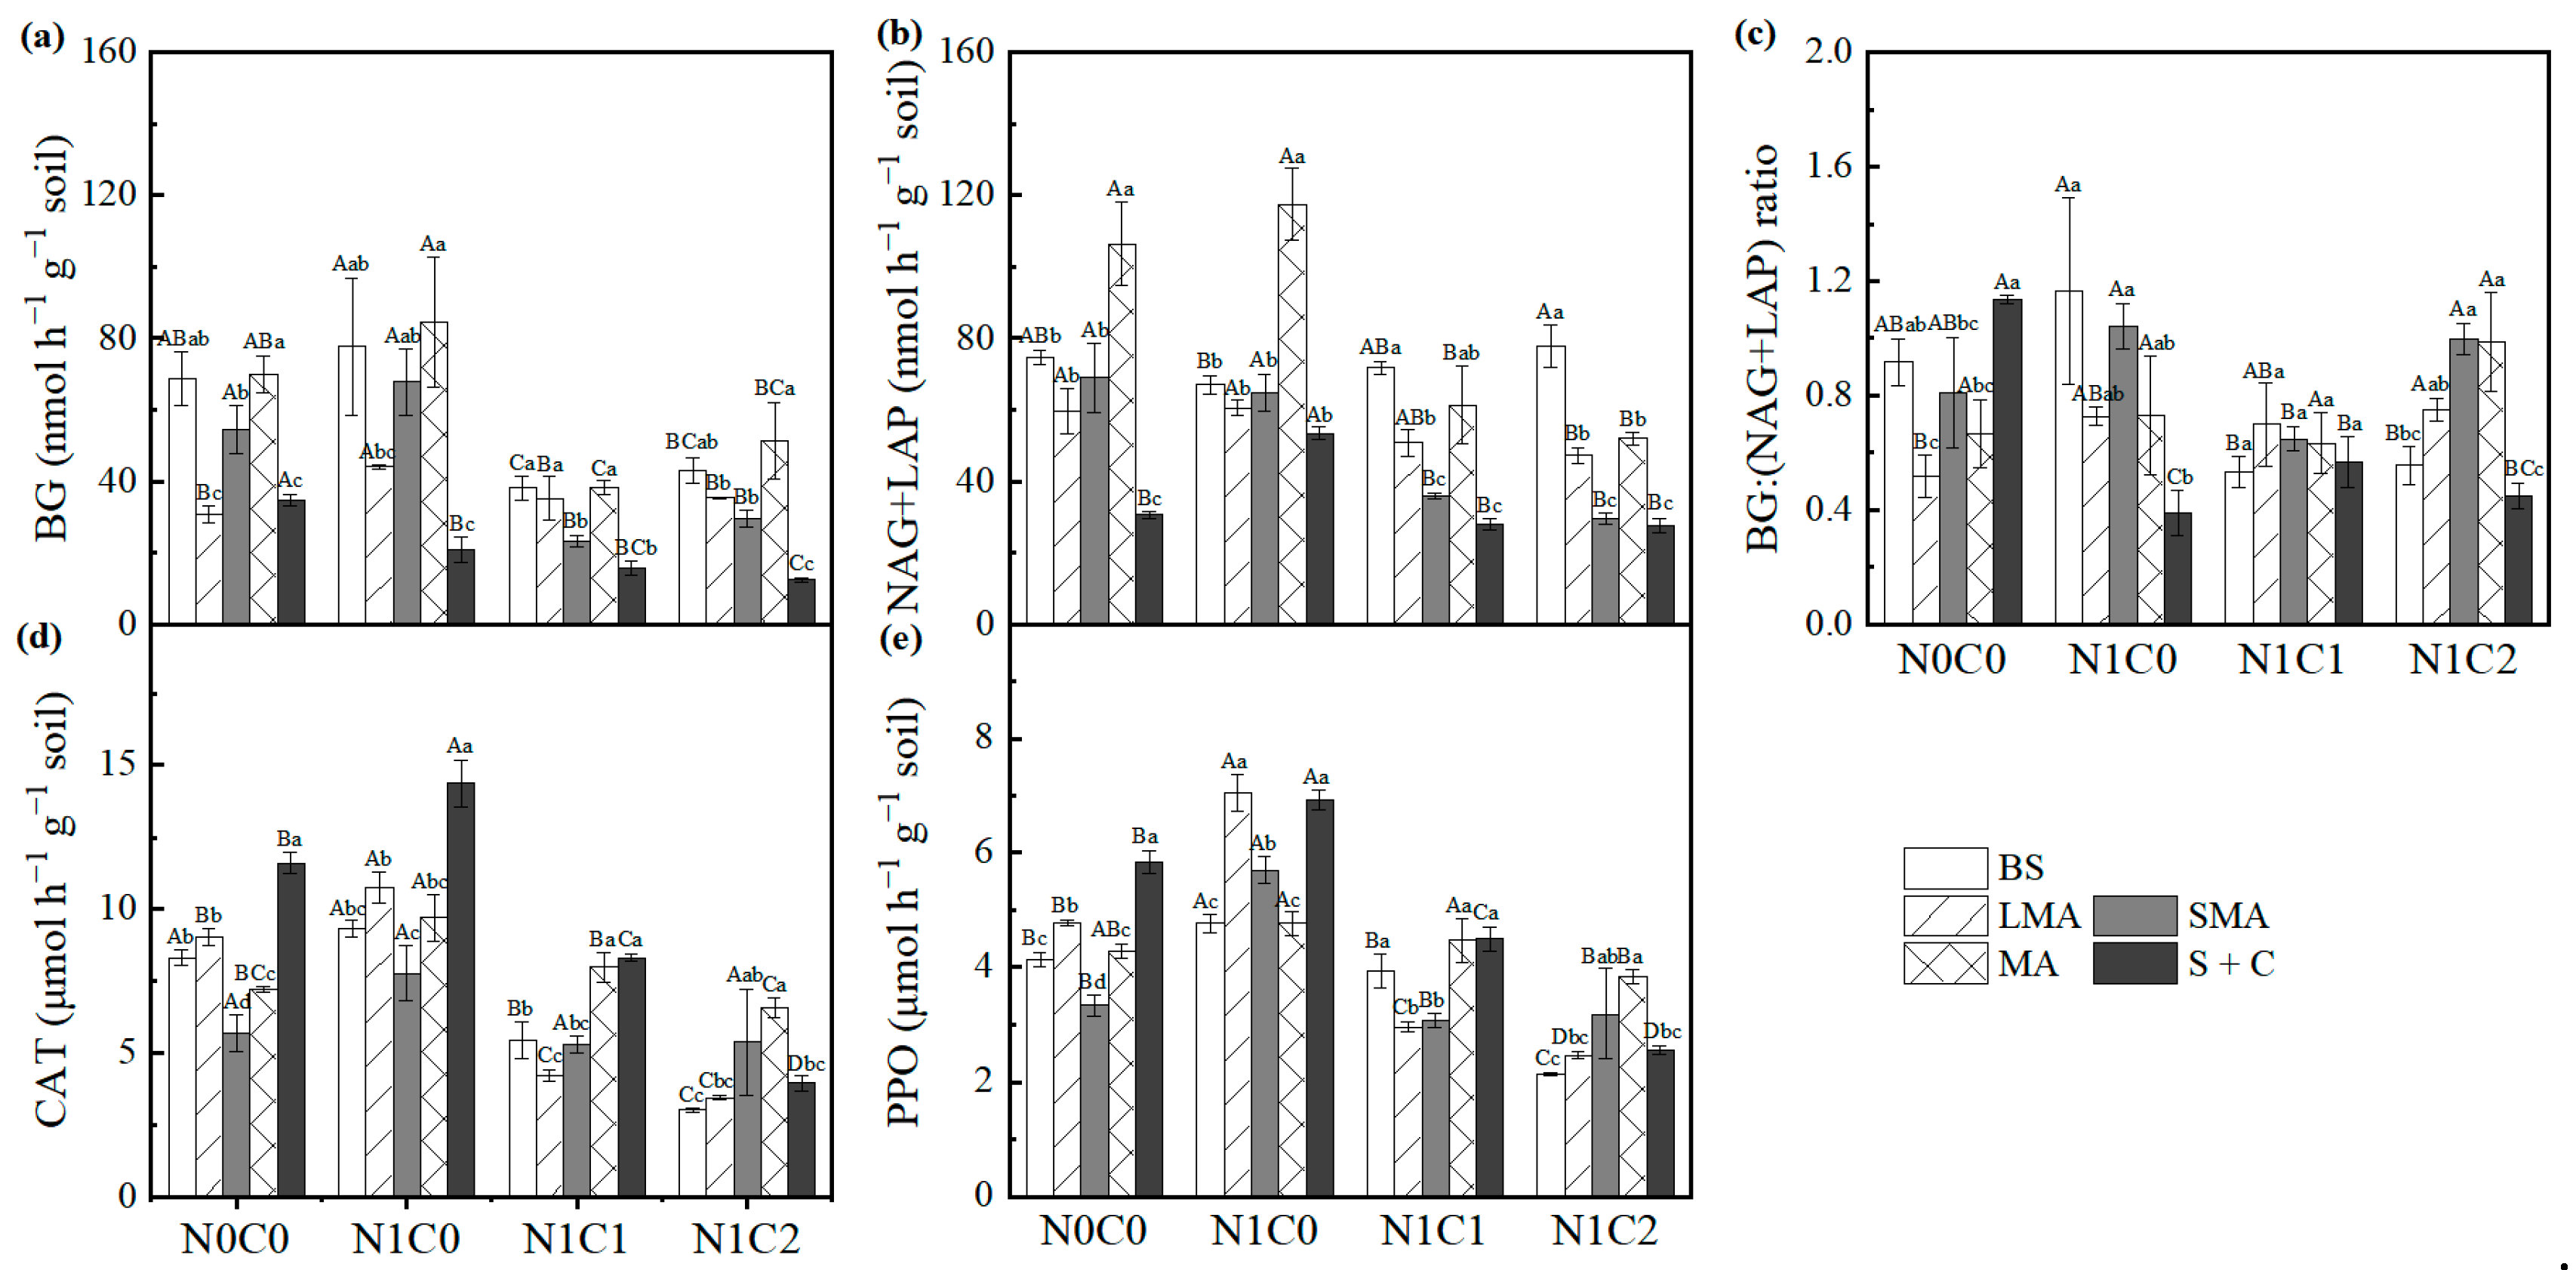
The BG activity was highest in the MA fraction (Figure 4a). N fertilization alone had little effect on BG, while biochar co-application significantly suppressed BG in bulk soil and all aggregate fractions (Figure 4a; p < 0.05). The activities of NAG + LAP were significantly reduced by biochar, but not by N alone, across all aggregate fractions (Figure 4b; p < 0.05). Biochar also significantly lowered the BG:(NAG + LAP) ratio in bulk soil (Figure 4c; p < 0.05). In contrast, N fertilization alone significantly increased catalase (CAT) and polyphenol oxidase (PPO) activities across all fractions, and these increases were reversed by biochar co-application (Figure 4d,e; p < 0.05).

3.5. Microbial Community Compositions in Bulk Soil and Aggregate Fractions

Total PLFAs were influenced by aggregate size alone, while the abundances of fungi, G+-bacteria, and G-bacteria were affected by both Tre and ASC individually, with a significant interaction observed only for fungi (Table S3; p < 0.001). Total PLFAs exhibited a non-significant increasing trend with N addition in bulk soil relative to N0C0, with generally higher abundances in SMA and MA among treatments (Table 1; p < 0.001). Fungal abundance was lowest in the S + C fractions and was significantly reduced by N1C1 and N1C2 across all fractions relative to N1C0. All aggregate fractions had higher G+-bacterial abundances than bulk soil. G+-bacteria increased significantly with N addition, especially under N1C2, whereas G-bacteria decreased under N1C1 and N1C2 across all fractions compared with N1C0 (Table 1; p < 0.001).

3.6. Driving Factors of TOC Mineralization

TOC mineralization was positively correlated with TOC, DOC, MBC, BG activity and microbial abundance, but negatively associated with soil structure (Figure S2; p < 0.05). CME was negatively related to soil structure and TN, but positively correlated with DOC, oxidase, total PLFAs, fungi and G-bacteria (Figure S2; p < 0.05).
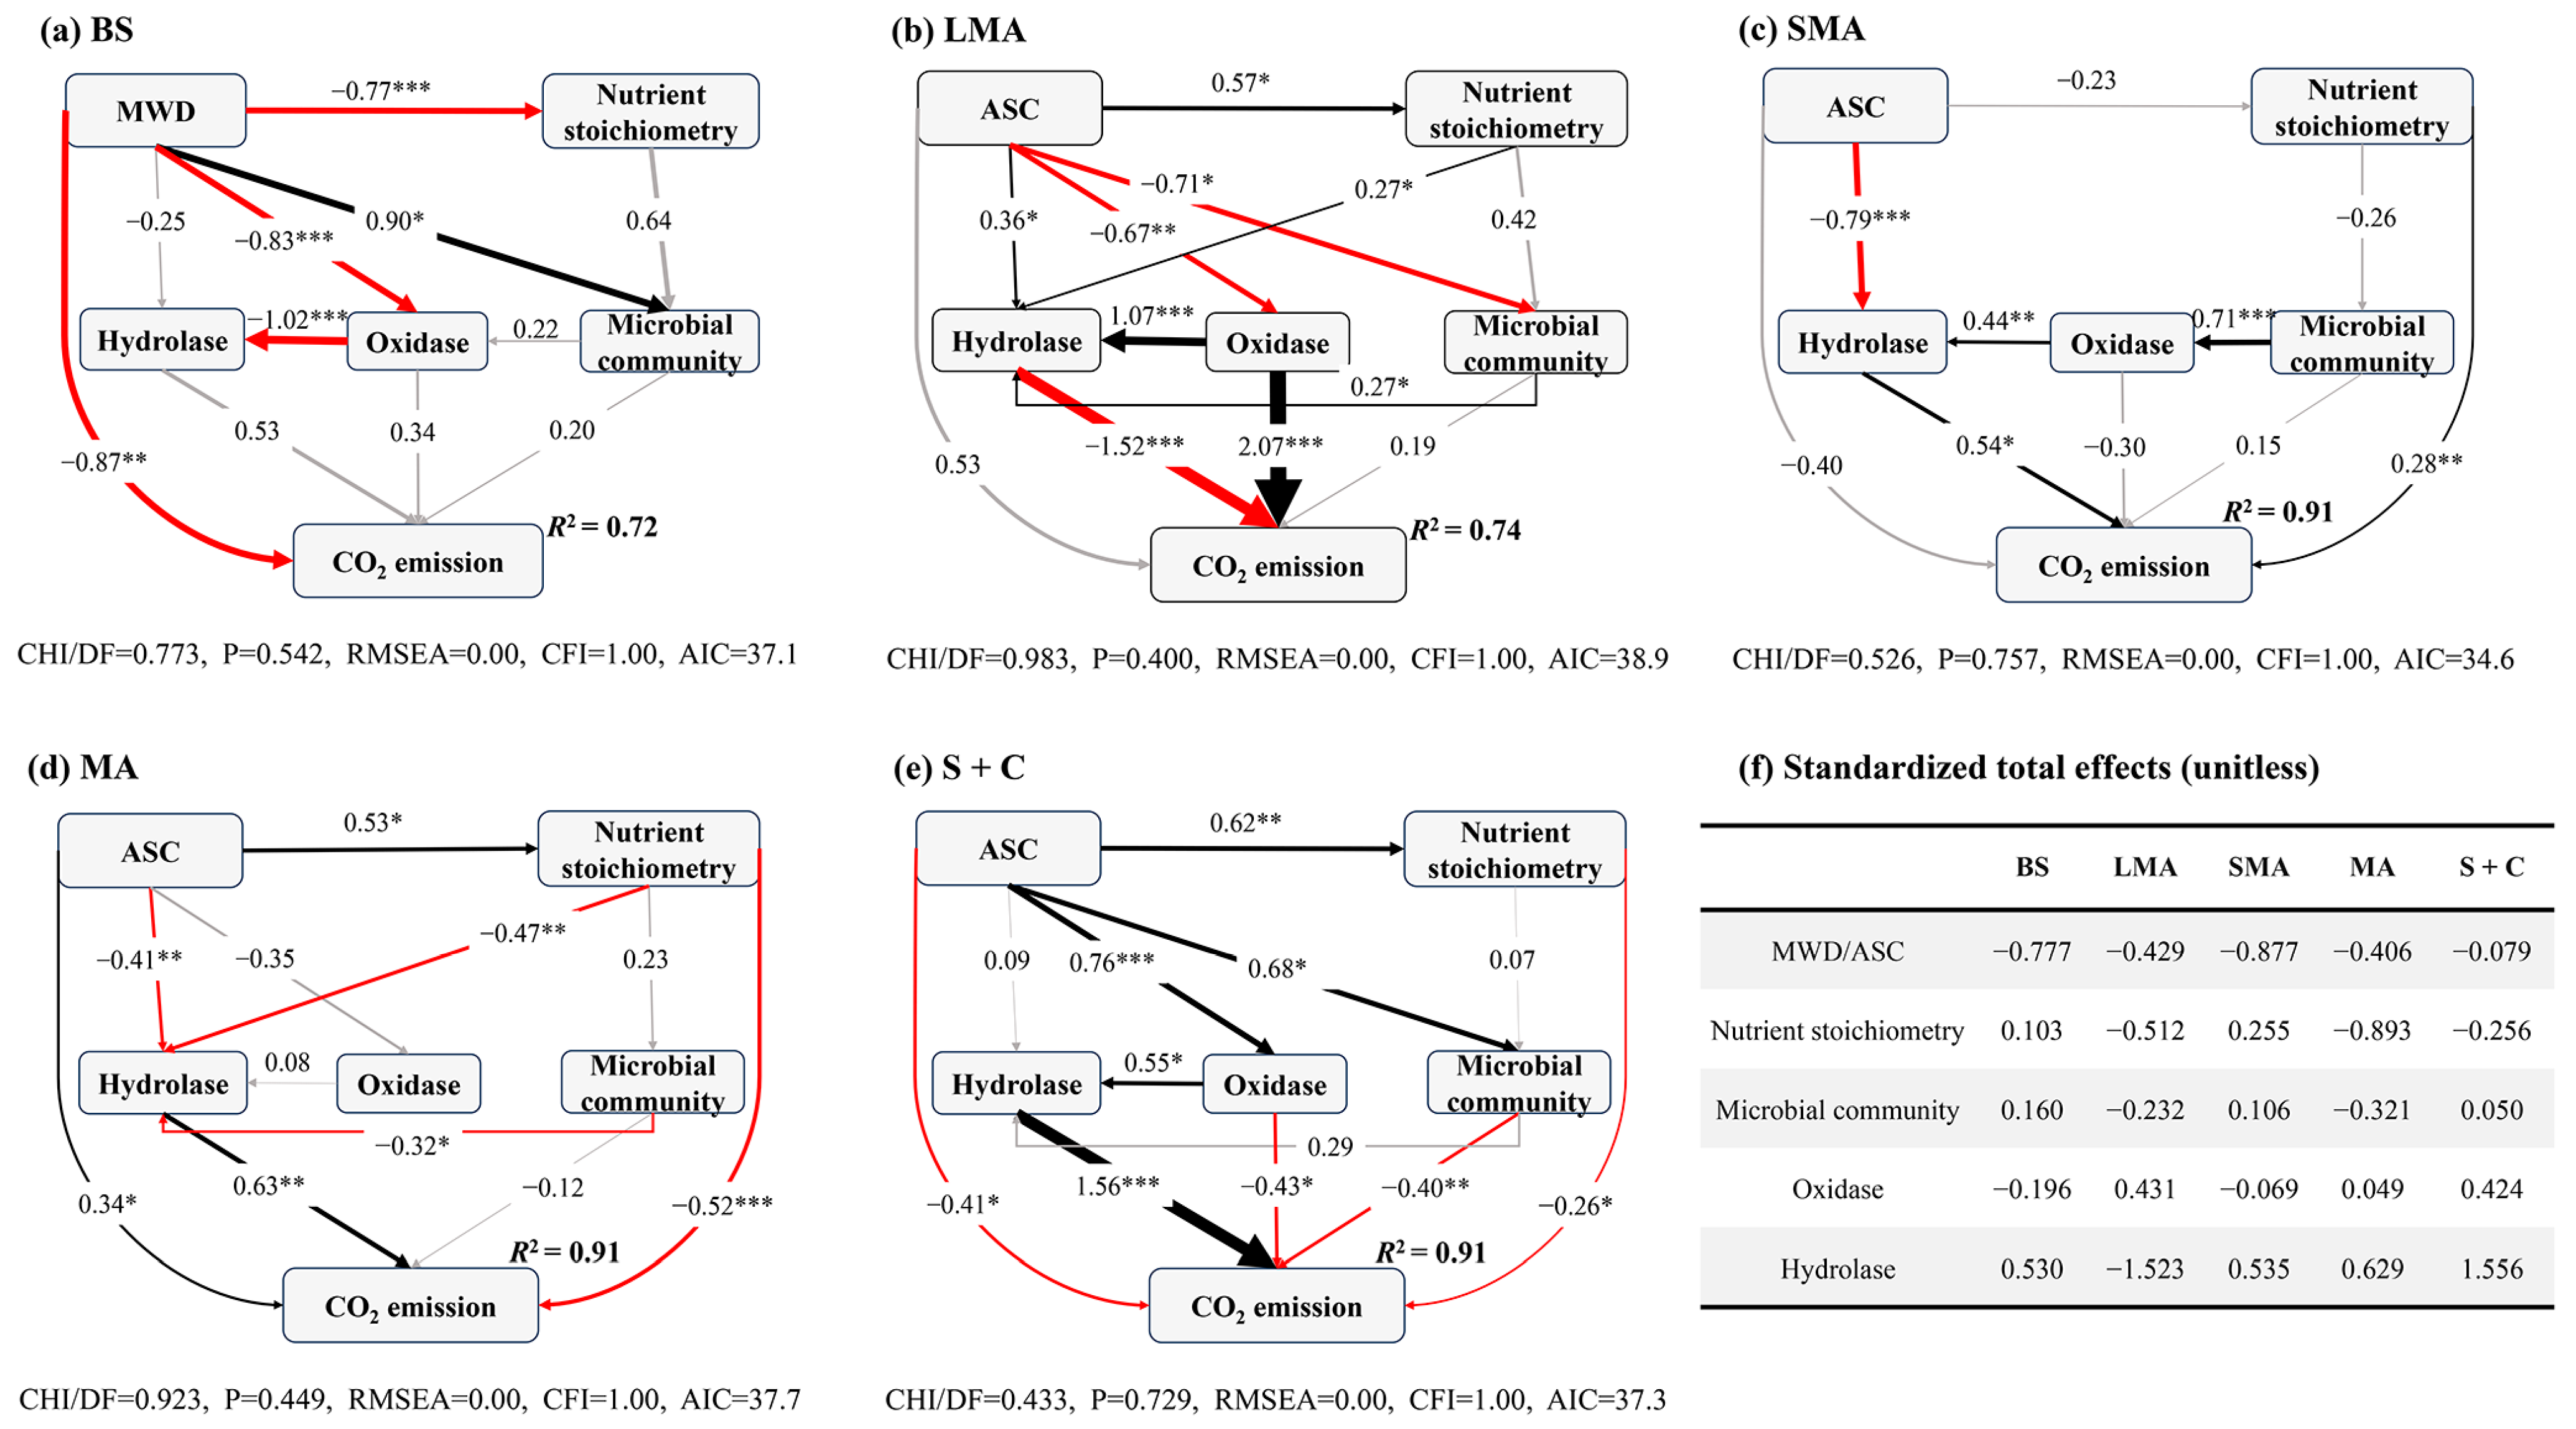
The SEM analysis explained 72–91% of the variation in CO2 emissions from bulk soil and four aggregate fractions (Figure 5). In bulk soil, increased aggregate stability reduced CO2 emissions through both direct and indirect (via oxidase inhibition) pathways, respectively (Figure 5a). In LMA, the increase in ASC indirectly inhibited CO2 emission, primarily by inhibiting oxidase activity, and also influenced hydrolase activity via its positive effect on nutrient stoichiometry and negative effect on oxidase (Figure 5b). In SMA, increased ASC inhibited CO2 emissions by directly suppressing hydrolase activity and reducing oxidase activity via changes in nutrient stoichiometry and microbial community (Figure 5c). In MA, the increase in ASC reduced CO2 emission through a dual mechanism involving direct positive effects and strong biochemical inhibition by increasing nutrient stoichiometry and suppressing hydrolase activity (Figure 5d). In the S + C fractions, a decrease in ASC strongly affected CO2 emissions via synergistic regulatory pathways. It exerted a direct negative effect and further indirectly influenced emissions by reducing nutrient stoichiometry, decreasing microbial abundance, and suppressing oxidase activity (Figure 5e).

4. Discussion

4.1. Biochar–N Co-Application Enhanced Aggregate Stability

Soil aggregates are fundamental structural units controlling C sequestration, nutrient cycling, and erosion resistance [7]. Our results show that the N fertilizer alone or combined with biochar significantly improved topsoil structure after 3.5 years, as indicated by the increase in macroaggregates and decrease in S + C proportions under N1C1 and N1C2 (Figure 1a). This finding was in agreement with Zhang et al. [39], who reported that wheat straw biochar increased macroaggregate proportions but reduced S + C fractions in a rice–wheat rotation field. A recent meta-analysis also confirmed that biochar input promoted the formation of macroaggregates and improved the water stability of aggregates [40].
As a key indicator of aggregate stability, MWD significantly increased by 27.4–30.5% in the N1C1 and N1C2 treatments compared to N0C0, consistent with findings in upland red soils [41]. In our study, biochar combined with N fertilizer produced a greater effect on MWD than N input alone, which could be attributed to complementary mechanisms. First, N input likely stimulated plant root growth and microbial activity, increasing the production of root exudates (e.g., mucilage) and microbial derivatives (e.g., glomalin-related soil proteins, extracellular polymeric substances), which served as binding agents to cement microaggregates into macroaggregates [42]. Second, biochar addition further intensified aggregation. The porous structure and large specific surface area of biochar provided physical nuclei for aggregation and adsorbed organic molecules, moisture, nutrients, and fine particles, creating microbial “hotspots” [43,44]. This, in turn, promoted the production of microbial derivatives that are crucial for forming stable aggregates [45,46,47]. Moreover, oxygen-containing functional groups (e.g., carboxyl, hydroxyl) on biochar may form “biochar–organic matter–soil particle” complexes with soil minerals (e.g., clays, iron oxides) and organic materials through hydrogen bonding, electrostatic interactions, or coordination bonds [12]. These complexes acted as a core framework for macroaggregates, enhancing overall soil aggregate stability. Collectively, these findings underscored the dual role of biochar in promoting aggregate stability through both physical cementation and chemical bridging [12,26].
Notably, no significant difference in MWD was observed between the 20 and 40 t ha−1 biochar rates (Figure 1b), indicating that increasing biochar application beyond 20 t ha−1 provided no additional benefit for improving aggregate stability under these experimental conditions. Similarly, our previous study in a rice–wheat rotation system found that the 40 t ha−1 biochar application did not significantly enhance MWD relative to the 20 t ha−1 [39]. We speculated that this observation may be attributed to soil texture, as the tested soil is dominated by silt and clay particles. A low-dose biochar (20 t ha−1) might provide sufficient “core sites” for aggregation, whereas excessive biochar could hinder further aggregation by (i) increasing interparticle repulsion (e.g., electrostatic repulsion), (ii) creating physical barriers that suppress microbial turnover of S + C-associated C, and (iii) promoting competitive adsorption between biochar and soil colloids that saturates carbon–mineral binding sites [43,48,49]. This pattern implied that targeted, moderate biochar application can effectively improve soil aggregate stability, without requiring excessive application rates.
It is important to note that biochar performance under field conditions was shaped by long-term aging driven by repeated tillage and irrigation [11,12]. Our measurements of field-aged biochar after 3.5 years revealed declines in pH, total C, specific surface area, and pore size (Figure S3, Table S4), indicating widespread oxidation and loss of labile C fractions. These changes altered the porous structure and nutrient retention capacity of biochar, thereby modifying its role in aggregate formation. Accordingly, the observed improvement in aggregate stability reflects the prolonged influence of field-aged biochar, highlighting the importance of considering its long-term persistent effects.

4.2. Biochar–N Co-Application Reduced TOC Mineralization in Bulk Soil and Aggregates

Biochar–N co-application suppressed Cm values but increased C0 values in bulk soil and aggregates, aligning with previous studies and meta-analyses [19,24,26]. This decoupling of C storage capacity from C loss risk is central to understanding biochar’s role in climate-smart agriculture [50]. The significant increase in C0 values across aggregate fractions under N1C1 and N1C2 indicated that enhanced aggregate architecture effectively entrapped and safeguarded labile organic compounds [51], likely including fresh, N-enriched root exudates and microbial metabolites whose production was stimulated by N addition but whose subsequent decomposition was physically impeded. Thus, stable aggregates formed under N1C1 and N1C2 played a dual role, not only preserving old and recalcitrant C, but actively sequestering the C forms most susceptible to rapid loss [52].
Conversely, the suppression of Cm and k values highlighted biochar’s multifaceted role in regulating the soil biogeochemical environment through an interplay of physical protection, biochemical inhibition, and microbial community restructuring. On the one hand, enhanced aggregate stability directly reduced TOC mineralization by limiting substrate accessibility to microbes and enzymes [6,9], as evidenced by strong negative correlations between mineralization metrics and aggregate stability (Figure S2). On the other hand, biochar addition induced a broad downregulation of hydrolytic and oxidative enzyme activities (Figure 4), creating a biochemical environment less conducive to organic matter decomposition [53]. Notably, the observed change in the BG:(NAG + LAP) ratio, alongside stable DOC:DON and MBC:MBN ratios, suggested a metabolic reallocation towards N acquisition (Figure 3 and Figure 4). This shift likely reflected a strong microbial demand for N, driven by a reduction in N bioavailability following biochar addition. The stable DOC:DON and MBC:MBN ratios suggest that the total substrate N pool was not diminished, but biochar-induced immobilization or sorption likely rendered a portion of this N less immediately accessible to microbes. Consequently, microbes may have reallocated resources to enhance N-acquiring enzyme activity to overcome this constrained N availability, rather than responding to a bulk stoichiometric imbalance [15]. Within this context, increasing absolute enzyme production would be ineffective due to enzyme adsorption or diffusion barriers. Consequently, the microbial community adopted a strategy of resource reallocation to cope with the most critical resource bottleneck. This biochemical adjustment was coupled with a fundamental ecological restructuring, marked by an increase in the G+:G ratio and a decrease in the F:B ratio (Table 1). Such a community shift may tentatively favor microorganisms with oligotrophic, K-strategist traits (consistent with the characteristics of G+-bacteria), which were adapted to the slower turnover of stabilized carbon, over R-strategist decomposers (typically associated with G-bacteria and fungi) that drive the rapid mineralization of fresh residues [54,55]. Consistently, Simonin et al. [56] reported that microbial communities with a higher G+:G ratio exhibited a greater resistance to elevated atmospheric CO2, thereby enhancing C sequestration capacity. However, we noted that PLFA biomarkers primarily resolve broad phylogenetic groups and biomass, not direct functional attributes. Therefore, while our data are consistent with a community shift towards putative K-strategists, definitive assignment of copiotrophic versus oligotrophic functional guilds requires confirmation through metagenomic or transcriptomic analyses.
Therefore, the co-application strategy achieved a critical dual benefit. It enhanced the soil’s capacity to sequester labile C by improving its physical incorporation into stable aggregates, while concurrently imposing a suite of interconnected physical, biochemical, and ecological constraints that slowed its mineralization rate [50]. This integrated mechanistic understanding moved beyond a simple protection narrative and positioned combined biochar and nutrient management as a strategic tool for engineering soil systems toward long-term C sequestration.

4.3. Differential Regulation of C Mineralization Processes at the Aggregate Scale

Differences in C mineralization among aggregate fractions are pivotal for understanding soil C cycling, because aggregates function as distinct “biogeochemical reactors” and micro-environments for C transformation [9,26]. The SEM analysis provided mechanistic insights into how C mineralization depended on aggregate size classes, revealing that the pathways by which aggregate stability regulated CO2 emissions differed fundamentally across size classes, with each class showing a distinct response to management (Figure 5).
For N-fertilized treatments, mineralization suppression in LMA and SMA was governed mainly by enhanced physical protection and enzyme adsorption. The increased proportion of LMA and SMA, along with elevated MWD under N1C1 and N1C2 (Figure 1a,b), indicated that biochar fostered more stable, occluded structures that limited the access of encapsulated organic matter to microbes and extracellular enzymes [9]. Concurrently, strong suppression of enzyme activities indicated a complementary mechanism (Figure 4). Enzymes are adsorbed onto biochar surfaces within aggregates, thereby preventing their effective access to substrates and diminishing C-degrading function [12]. The SEM for LMA and SMA confirmed that soil structure acted as a central driver of CO2 emissions, partly through the suppression of enzyme activities (Figure 5b,c).
The MA fraction displayed the highest Cm, while both the MA and S + C fractions showed higher C0, CME, and CMP (Figure 2). This pattern challenged the conventional view that macroaggregates are the primary sites of TOC decomposition due to higher porosity, weaker physical protection, and greater microbial accessibility [57,58]. Given its intermediate size and relatively loose structure, the MA fraction may encapsulate poorly protected particulate organic matter, forming an organic-matter-rich, yet vulnerable, “active-stable” pool, where physical and biochemical controls synergistically converge [5]. Consistently, the MA fraction contained the highest concentrations of TOC, DOC, and microbial biomass (Figure 1 and Figure 3), indicating that this fraction is substrate-enriched on a unit mass basis. Despite this inherent reactivity, the SEM revealed that biochar induced strong biochemical inhibition within MA. Increased ASC was linked to elevated nutrient stoichiometry, which in turn strongly suppressed hydrolase activity. This suggested that biochar, by modulating nutrient availability, triggered a microbial metabolic shift from decomposition towards nutrient mining, thereby curtailing labile C mineralization in this otherwise active fraction (Figure 5d). Meanwhile, the concurrent shift towards a higher G+:G ratio likely reflected this stabilized, less bioavailable environment that favored slower-growing oligotrophic microorganisms (Table 1).
However, when evaluating contributions to the whole-soil C flux, the mass proportion of each fraction is paramount. Despite its low TOC content, this fraction contributed most to total CO2 emissions (Figure 1c and Figure 2f), highlighting its role as a high-flux mineralization hotspot due to its large mass proportion (57.3–70.9% of soil mass) and high surface area, which intensified microbe–substrate contact [59,60]. This resolved an apparent paradox: the MA fraction is the most concentrated and reactive pool per unit mass, while the S + C fractions are the largest overall emitter due to its overwhelming mass dominance. For this fraction, the regulatory mechanism shifted from physical protection to biochemical and microbial metabolism. Unlike in macro- and microaggregates, the total effect of soil structure on cumulative CO2 mineralization was minimal (Figure 5f). Biochar primarily exerted indirect effects by altering nutrient stoichiometry, reducing microbial biomass (especially fungi and G-bacteria; Table 1), and reversing the N-stimulated rise in oxidative enzyme activities (Figure 4d,e), thereby creating a biochemical environment less conducive to the breakdown of complex organic matter. The SEM path analysis highlighted that soil structure affected CO2 emissions mainly by depleting the microbial community and suppressing oxidase activity (Figure 5e). Thus, in the S + C fractions, biochar acted less as a physical shield and more as a metabolic moderator, slowing C turnover by altering the decomposer community’s function and capacity.
In summary, the divergence in CO2 production pathways across aggregate sizes was shaped by spatially heterogeneous interactions among physical architecture, chemical bonding environments, and localized microbial ecology, all modulated by biochar amendment. These findings underscored the necessity of aggregate size-specific analyses to unravel biochar’s regulatory role in soil C dynamics. It should be noted that the causal pathways inferred from SEM represent statistical correlations rather than definitive experimental evidence from manipulative studies, and further experimental validation is warranted to confirm these mechanistic relationships.

4.4. Implications and Future Research

This study demonstrated that biochar–N co-application enhanced soil C sequestration by integrating the physical protection afforded by aggregates with microbially mediated biochemical regulation, thereby effectively suppressing CO2 emissions. However, these insights are based on a short-term incubation, which cannot replicate key field dynamics such as wet–dry cycles or continuous root input, representing a primary limitation [42,61]. In addition, our study focused on realistic agronomic scenarios with continuous N fertilization; thus, biochar-only treatments were not included, and the observed effects should be interpreted under N-supplied conditions typical of intensive vegetable systems. Our findings are also specific to subtropical Haplic Luvisol, and cannot be directly extrapolated to other soil types or agroclimatic conditions, so future studies should prioritize long-term field verification to assess the synergy’s stability and the generalizability of our results. Employing advanced techniques such as 13C-labeled biochar isotope tracing and metagenomic sequencing would help distinguish biochar-derived C from native SOC and identify the key microbial taxa and genes governing C turnover within aggregates [24,62]. Furthermore, systematic evaluation of how biochar properties (e.g., feedstock, pyrolysis temperature) differentially influence aggregation and nutrient cycling would be crucial for designing targeted functional biochars [50]. Ultimately, our findings underscore the importance of a multi-scale and multi-process perspective for soil C management, positioning biochar–N co-application as a promising climate-smart agriculture strategy.

5. Conclusions

This study demonstrated that biochar–N co-application enhanced C sequestration in intensive vegetable systems by integrating distinct mechanisms across aggregate size classes. This practice not only improved soil structure, but also decoupled C storage from mineralization losses, increasing potentially mineralizable C pools by 12.5–155.7% while suppressing cumulative mineralization by 2.7–24.6% across bulk soil and four aggregate fractions. The SEM analysis revealed that TOC mineralization suppression was mediated by aggregate-specific pathways. Enhanced physical protection was the dominant mechanism in LMA and SMA. In contrast, the pronounced biochemical inhibition of enzyme activities played a critical role within MA, which contained the highest TOC content. In the S + C fractions, which accounted for the largest mass proportion and was the largest contributor to total CO2 emissions, the suppression was primarily driven by shifts in nutrient stoichiometry and hydrolase activities. Collectively, these findings underscored biochar’s role as a multi-scale soil amendment, with its efficacy depending on aggregate-specific processes. Thus, biochar–N co-application represented a targeted and promising strategy for enhancing C sequestration in climate-smart agricultural systems. However, as this study was based on short-term laboratory incubations, future long-term in situ studies are required to validate these mechanisms under actual field conditions.

Supplementary Materials

The following supporting information can be downloaded at https://www.mdpi.com/article/10.3390/agronomy16080825/s1, [9,36,37,63] Figure S1: Temporal dynamics of CO2 emissions (a–d) during incubation under different treatments. N0C0, no urea or biochar; N1C0, soil with urea only; N1C1, urea with 20 t ha−1 biochar; N1C2, urea with 40 t ha−1 biochar; Figure S2: Pearson’s correlation analysis between soil characteristics and cumulative CO2 emissions (Cm) and TOC mineralization efficiency (CME) in bulk soil and aggregate fractions across different treatments. Significance levels: * p < 0.05, ** p < 0.01, *** p < 0.001. Soil structure was represented by the mean weight diameter (MWD) for bulk soil and by the proportion of each aggregate size class (ASC) for aggregate fractions; Figure S3: Scanning electron microscope (SEM) images of fresh biochar (a) and field-aged biochar (b) and FTIR spectra; Table S1: Initial properties of the soil in our study (mean ± SD, n = 3); Table S2: Cultivation and fertilization management practices in the vegetable field from 2016 to 2020; Table S3: Two-way ANOVA for soil chemical properties, enzyme activities, microbial properties and TOC mineralization parameters across aggregate size fractions under different treatments; Table S4: Properties of the fresh biochar and field-aged biochar in the experiment.

Author Contributions

Conceptualization, X.Z. and Z.X.; methodology, C.X. and X.L.; software, X.Z. and X.L.; validation, X.Z., C.X. and X.L.; formal analysis, C.X.; investigation, C.X. and X.L.; resources, L.X. and Z.X.; data curation, X.L.; writing—original draft preparation, X.Z. and C.X.; writing—review and editing, L.X. and Z.X.; visualization, X.Z. and X.L.; supervision, C.X.; project administration, X.Z. and Z.X.; funding acquisition, L.X. and Z.X. All authors have read and agreed to the published version of the manuscript.

Funding

This research was funded by the National Natural Science Foundation of China (42377292,42407454) and the Natural Science Foundation of Jiangsu Province (BK20241173).

Data Availability Statement

The original contributions presented in this study are included in the article/Supplementary Material. Further inquiries can be directed to the corresponding author.

Acknowledgments

We are grateful to Qianqian Zhang for his contribution to the collection and analysis of experimental samples.

Conflicts of Interest

The authors declare no conflicts of interest.

References

  1. Abdo, A.I.; Sun, D.; Shi, Z.; Abdel-Fattah, M.K.; Zhang, J.; Kuzyakov, Y. Conventional agriculture increases global warming while decreasing system sustainability. Nat. Clim. Change 2025, 15, 110–117. [Google Scholar] [CrossRef]
  2. Wang, H.; Guan, D.; Zhang, R.; Chen, Y.; Hu, Y.; Xiao, L. Soil aggregates and organic carbon affected by the land use change from rice paddy to vegetable field. Ecol. Eng. 2014, 70, 206–211. [Google Scholar] [CrossRef]
  3. Kalkhajeh, Y.K.; Huang, B.; Hu, W.; Ma, C.; Gao, H.; Thompson, M.L.; Bruun Hansen, H.C. Environmental soil quality and vegetable safety under current greenhouse vegetable production management in China. Agric. Ecosyst. Environ. 2021, 307, 107230. [Google Scholar] [CrossRef]
  4. Sun, Y.; Chen, H.Y.H.; Chen, X.; Hisano, M.; Chen, X.; Reich, P.B. Rising global temperatures reduce soil microbial diversity over the long term. Proc. Natl. Acad. Sci. USA 2025, 122, e2426200122. [Google Scholar] [CrossRef] [PubMed]
  5. Totsche, K.U.; Amelung, W.; Gerzabek, M.H.; Guggenberger, G.; Klumpp, E.; Knief, C.; Lehndorff, E.; Mikutta, R.; Peth, S.; Prechtel, A.; et al. Microaggregates in soils. J. Plant Nutr. Soil. Sci. 2018, 181, 104–136. [Google Scholar] [CrossRef]
  6. Kan, Z.; Virk, A.L.; He, C.; Liu, Q.; Qi, J.; Dang, Y.P.; Zhao, X.; Zhang, H. Characteristics of carbon mineralization and accumulation under long-term conservation tillage. Catena 2020, 193, 104636. [Google Scholar] [CrossRef]
  7. Yudina, A.; Kuzyakov, Y. Dual nature of soil structure: The unity of aggregates and pores. Geoderma 2023, 434, 116478. [Google Scholar] [CrossRef]
  8. Zhang, X.; Shen, S.; Xue, S.; Hu, Y.; Wang, X. Long-term tillage and cropping systems affect soil organic carbon components and mineralization in aggregates in semiarid regions. Soil. Till. Res. 2023, 231, 105742. [Google Scholar] [CrossRef]
  9. Liu, X.; Li, R.; Lv, Y.; Zhang, X.; Zhang, Y.; Gao, Q.; Ma, Y.; Bizimana, F.; Liu, L.; Han, H.; et al. Two pathways for reducing soil aggregate organic carbon mineralisation via minimum tillage under a long-term field experiment. J. Environ. Manag. 2025, 381, 125195. [Google Scholar] [CrossRef] [PubMed]
  10. Wang, F.; Liu, Y.; Liang, B.; Liu, J.; Zong, H.; Guo, X.; Wang, X.; Song, N. Variations in soil aggregate distribution and associated organic carbon and nitrogen fractions in long-term continuous vegetable rotation soil by nitrogen fertilization and plastic film mulching. Sci. Total Environ. 2022, 835, 155420. [Google Scholar] [CrossRef]
  11. Schmidt, H.P.; Kammann, C.; Hagemann, N.; Leifeld, J.; Bucheli, T.D.; Sánchez Monedero, M.A.; Cayuela, M.L. Biochar in agriculture–A systematic review of 26 global meta-analyses. GCB Bioenergy 2021, 13, 1708–1730. [Google Scholar] [CrossRef]
  12. Han, L.; Sun, K.; Yang, Y.; Xia, X.; Li, F.; Yang, Z.; Xing, B. Biochar’s stability and effect on the content, composition and turnover of soil organic carbon. Geoderma 2020, 364, 114184. [Google Scholar] [CrossRef]
  13. Kayoumu, M.; Wang, H.; Duan, G. Interactions between microbial extracellular polymeric substances and biochar, and their potential applications: A review. Biochar 2025, 7, 62. [Google Scholar] [CrossRef]
  14. Bekchanova, M.; Kuppens, T.; Cuypers, A.; Jozefczak, M.; Malina, R. Biochar’s effect on the soil carbon cycle: A rapid review and meta-analysis. Biochar 2024, 6, 88. [Google Scholar] [CrossRef]
  15. Hossain, M.Z.; Bahar, M.M.; Sarkar, B.; Donne, S.W.; Ok, Y.S.; Palansooriya, K.N.; Kirkham, M.B.; Chowdhury, S.; Bolan, N. Biochar and its importance on nutrient dynamics in soil and plant. Biochar 2020, 2, 379–420. [Google Scholar] [CrossRef]
  16. Lehmann, J.; Rillig, M.C.; Thies, J.; Masiello, C.A.; Hockaday, W.C.; Crowley, D. Biochar effects on soil biota–A review. Soil Biol. Biochem. 2011, 43, 1812–1836. [Google Scholar] [CrossRef]
  17. Dong, X.; Guan, T.; Li, G.; Lin, Q.; Zhao, X. Long-term effects of biochar amount on the content and composition of organic matter in soil aggregates under field conditions. J. Soil. Sediment. 2016, 16, 1481–1497. [Google Scholar] [CrossRef]
  18. Zhang, S.; Cui, J.; Wu, H.; Zheng, Q.; Song, D.; Wang, X.; Zhang, S. Organic carbon, total nitrogen, and microbial community distributions within aggregates of calcareous soil treated with biochar. Agric. Ecosyst. Environ. 2021, 314, 107408. [Google Scholar] [CrossRef]
  19. Wang, J.; Xiong, Z.; Kuzyakov, Y. Biochar stability in soil: Meta-analysis of decomposition and priming effects. GCB Bioenergy 2016, 8, 512–523. [Google Scholar] [CrossRef]
  20. Kalu, S.; Seppänen, A.; Mganga, K.Z.; Sietiö, O.M.; Glaser, B.; Karhu, K. Biochar reduced the mineralization of native and added soil organic carbon: Evidence of negative priming and enhanced microbial carbon use efficiency. Biochar 2024, 6, 7. [Google Scholar] [CrossRef]
  21. Borchard, N.; Schirrmann, M.; Cayuela, M.L.; Kammann, C.; Wrage-Mönnig, N.; Estavillo, J.M.; Fuertes-Mendizábal, T.; Sigua, G.; Spokas, K.; Ippolito, J.A.; et al. Biochar, soil and land-use interactions that reduce nitrate leaching and N2O emissions: A meta-analysis. Sci. Total Environ. 2019, 651, 2354–2364. [Google Scholar] [CrossRef]
  22. Dai, Z.; Xiong, X.; Zhu, H.; Xu, H.; Leng, P.; Li, J.; Tang, C.; Xu, J. Association of biochar properties with changes in soil bacterial, fungal and fauna communities and nutrient cycling processes. Biochar 2021, 3, 239–254. [Google Scholar] [CrossRef]
  23. Zheng, H.; Wang, X.; Luo, X.; Wang, Z.; Xing, B. Biochar-induced negative carbon mineralization priming effects in a coastal wetland soil: Roles of soil aggregation and microbial modulation. Sci. Total Environ. 2018, 610–611, 951–960. [Google Scholar] [CrossRef]
  24. Zhang, Q.; Duan, P.; Gunina, A.; Zhang, X.; Yan, X.; Kuzyakov, Y.; Xiong, Z. Mitigation of carbon dioxide by accelerated sequestration from long-term biochar amended paddy soil. Soil Till. Res. 2021, 209, 104955. [Google Scholar] [CrossRef]
  25. Chen, Y.; Sun, K.; Yang, Y.; Gao, B.; Zheng, H. Effects of biochar on the accumulation of necromass-derived carbon, the physical protection and microbial mineralization of soil organic carbon. Crit. Rev. Env. Sci. Tec. 2024, 54, 39–67. [Google Scholar] [CrossRef]
  26. Chen, Y.; Kuzyakov, Y.; Ma, Q.; Du, Z.; Sun, K.; Xiao, K.; Liang, X.; Li, Y.; Zhang, Y.; Lai, X.; et al. Aggregate size mediates the stability and temperature sensitivity of soil organic carbon in response to decadal biochar and straw amendments. Soil Biol. Biochem. 2025, 211, 109969. [Google Scholar] [CrossRef]
  27. Wang, D.; Fonte, S.J.; Parikh, S.J.; Six, J.; Scow, K.M. Biochar additions can enhance soil structure and the physical stabilization of C in aggregates. Geoderma 2017, 303, 110–117. [Google Scholar] [CrossRef] [PubMed]
  28. Yu, Q.; Xu, L.; Wang, M.; Xu, S.; Sun, W.; Yang, J.; Shi, Y.; Shi, X.; Xie, X. Decreased soil aggregation and reduced soil organic carbon activity in conventional vegetable fields converted from paddy fields. Eur. J. Soil. Sci. 2022, 73, e13222. [Google Scholar] [CrossRef]
  29. Zhang, X.; Zhang, Q.; Zhan, L.; Xu, X.; Bi, R.; Xiong, Z. Biochar addition stabilized soil carbon sequestration by reducing temperature sensitivity of mineralization and altering the microbial community in a greenhouse vegetable field. J. Environ. Manag. 2022, 313, 114972. [Google Scholar] [CrossRef] [PubMed]
  30. Feng, J.; Wu, J.; Zhang, Q.; Zhang, D.; Li, Q.; Long, C.; Yang, F.; Chen, Q.; Cheng, X. Stimulation of nitrogen-hydrolyzing enzymes in soil aggregates mitigates nitrogen constraint for carbon sequestration following afforestation in subtropical China. Soil Biol. Biochem. 2018, 123, 136–144. [Google Scholar] [CrossRef]
  31. Smith, A.P.; Marín-Spiotta, E.; de Graaff, M.A.; Balser, T.C. Microbial community structure varies across soil organic matter aggregate pools during tropical land cover change. Soil Biol. Biochem. 2014, 77, 292–303. [Google Scholar] [CrossRef]
  32. Fungo, B.; Lehmann, J.; Kalbitz, K.; Thionģo, M.; Okeyo, I.; Tenywa, M.; Neufeldt, H. Aggregate size distribution in a biochar-amended tropical Ultisol under conventional hand-hoe tillage. Soil. Till. Res. 2017, 165, 190–197. [Google Scholar] [CrossRef]
  33. Shen, H.; Zhang, Q.; Zhu, S.; Duan, P.; Zhang, X.; Wu, Z.; Xiong, Z. Organic substitutions aggravated microbial nitrogen limitation and decreased nitrogen-cycling gene abundances in a three-year greenhouse vegetable field. J. Environ. Manag. 2021, 288, 112379. [Google Scholar] [CrossRef]
  34. Wang, B.; Bi, R.; Xu, X.; Shen, H.; Zhang, Q.; Xiong, Z. General patterns of soil nutrient stoichiometry, microbial metabolic limitation and carbon use efficiency in paddy and vegetable fields along a climatic transect of eastern China. Agric. Ecosyst. Environ. 2025, 378, 109322. [Google Scholar] [CrossRef]
  35. Joergensen, R.G.; Mueller, T. The fumigation-extraction method to estimate soil microbial biomass: Calibration of the kEN value. Soil Biol. Biochem. 1996, 28, 33–37. [Google Scholar] [CrossRef]
  36. Xu, X.; Zhang, Q.; Song, M.; Zhang, X.; Bi, R.; Zhan, L.; Dong, Y.; Xiong, Z. Soil organic carbon decomposition responding to warming under nitrogen addition across Chinese vegetable soils. Ecotox. Environ. Safe 2022, 242, 113932. [Google Scholar] [CrossRef] [PubMed]
  37. DeForest, J.L. The influence of time, storage temperature, and substrate age on potential soil enzyme activity in acidic forest soils using MUB-linked substrates and L-DOPA. Soil Biol. Biochem. 2009, 41, 1180–1186. [Google Scholar] [CrossRef]
  38. Liu, Z.; Zhu, M.; Wang, J.; Liu, X.; Guo, W.; Zheng, J.; Bian, R.; Wang, G.; Zhang, X.; Cheng, K.; et al. The responses of soil organic carbon mineralization and microbial communities to fresh and aged biochar soil amendments. GCB Bioenergy 2019, 11, 1408–1420. [Google Scholar] [CrossRef]
  39. Zhang, Q.; Song, Y.; Wu, Z.; Yan, X.; Gunina, A.; Kuzyakov, Y.; Xiong, Z. Effects of six-year biochar amendment on soil aggregation, crop growth, and nitrogen and phosphorus use efficiencies in a rice-wheat rotation. J. Clean. Prod. 2020, 242, 118435. [Google Scholar] [CrossRef]
  40. Yuan, X.; Ban, G.; Luo, Y.; Wang, J.; Peng, D.; Liang, R.; He, T.; Wang, Z. Biochar effects on aggregation and carbon-nitrogen retention in different-sized aggregates of clay and loam soils: A meta-analysis. Soil. Till. Res. 2025, 247, 106365. [Google Scholar] [CrossRef]
  41. Liu, Z.; Chen, X.; Jing, Y.; Li, Q.; Zhang, J.; Huang, Q. Effects of biochar amendment on rapeseed and sweet potato yields and water stable aggregate in upland red soil. Catena 2014, 123, 45–51. [Google Scholar] [CrossRef]
  42. Bai, T.; Wang, P.; Ye, C.; Hu, S. Form of nitrogen input dominates N effects on root growth and soil aggregation: A meta-analysis. Soil Biol. Biochem. 2021, 157, 108251. [Google Scholar] [CrossRef]
  43. Du, Z.; Zhao, J.; Wang, Y.; Zhang, Q. Biochar addition drives soil aggregation and carbon sequestration in aggregate fractions from an intensive agricultural system. J. Soil. Sediment. 2017, 17, 581–589. [Google Scholar] [CrossRef]
  44. Tian, L.; Wang, Y.; Jin, D.; Zhou, Y.; Mukhamed, B.; Liu, D.; Feng, B. The application of biochar and organic fertilizer substitution regulates the diversities of habitat specialist bacterial communities within soil aggregates in proso millet farmland. Biochar 2025, 7, 6. [Google Scholar] [CrossRef]
  45. Six, J.; Bossuyt, H.; Degryze, S.; Denef, K. A history of research on the link between (micro)aggregates, soil biota, and soil organic matter dynamics. Soil Till. Res. 2004, 79, 7–31. [Google Scholar] [CrossRef]
  46. Rötzer, M.; Prechtel, A.; Ray, N. Pore scale modeling of the mutual influence of roots and soil aggregation in the rhizosphere. Front. Soil. Sci. 2023, 3, 1155889. [Google Scholar] [CrossRef]
  47. Witzgall, K.; Steiner, F.A.; Hesse, B.D.; Riveras-Muñoz, N.; Rodríguez, V.; Teixeira, P.P.C.; Li, M.; Oses, R.; Seguel, O.; Seitz, S.; et al. Living and decaying roots as regulators of soil aggregation and organic matter formation—From the rhizosphere to the detritusphere. Soil Biol. Biochem. 2024, 197, 109503. [Google Scholar] [CrossRef]
  48. Islam, M.U.; Jiang, F.; Guo, Z.; Peng, X. Does biochar application improve soil aggregation? A meta-analysis. Soil. Till. Res. 2021, 209, 104926. [Google Scholar] [CrossRef]
  49. Ghorbani, M.; Amirahmadi, E. Insights into soil and biochar variations and their contribution to soil aggregate status–A meta-analysis. Soil. Till. Res. 2024, 244, 106282. [Google Scholar] [CrossRef]
  50. Bo, X.; Zhang, Z.; Wang, J.; Guo, S.; Li, Z.; Lin, H.; Huang, Y.; Han, Z.; Kuzyakov, Y.; Zou, J. Benefits and limitations of biochar for climate-smart agriculture: A review and case study from China. Biochar 2023, 5, 77. [Google Scholar] [CrossRef]
  51. Even, R.J.; Francesca Cotrufo, M. The ability of soils to aggregate, more than the state of aggregation, promotes protected soil organic matter formation. Geoderma 2024, 442, 116760. [Google Scholar] [CrossRef]
  52. Soares de Souza, D.C.; Vieira de Assis Freire, J.; Fernandes da Silva, L.; Pinheiro da Silva, P.; de Sousa Antunes, L.F.; de Luna Souto, A.G.; Dantas Valença, R.; Chaves Fernandes, B.C.; de Oliveira Lima, A.E.; Sousa dos Santos, J.C.; et al. Carbon sequestration with biochar: Global trends, knowledge gaps, and future directions. ACS ES&T Water 2025, 5, 6479–6502. [Google Scholar] [CrossRef]
  53. Filimonenko, E.; Kuzyakov, Y. Activation energy of organic matter decomposition in soil and consequences of global warming. Glob. Change Biol. 2025, 31, e70472. [Google Scholar] [CrossRef]
  54. Luo, Y.; Lin, Q.; Durenkamp, M.; Dungait, A.J.; Brookes, P.C. Soil priming effects following substrates addition to biochar-treated soils after 431 days of pre-incubation. Biol. Fertil. Soils 2017, 53, 315–326. [Google Scholar] [CrossRef]
  55. Wu, H.; Cui, H.; Fu, C.; Li, R.; Qi, F.; Liu, Z.; Yang, G.; Xiao, K.; Qiao, M. Unveiling the crucial role of soil microorganisms in carbon cycling: A review. Sci. Total Environ. 2024, 909, 168627. [Google Scholar] [CrossRef] [PubMed]
  56. Simonin, M.; Nunan, N.; Bloor, J.M.G.; Pouteau, V.; Niboyet, A. Short-term responses and resistance of soil microbial community structure to elevated CO2 and N addition in grassland mesocosms. FEMS Microbiol. Lett. 2017, 364, fnx077. [Google Scholar] [CrossRef]
  57. Bonifacio, E.; Said-Pullicino, D.; Stanchi, S.; Potenza, M.; Belmonte, S.A.; Celi, L. Soil and management effects on aggregation and organic matter dynamics in vineyards. Soil. Till. Res. 2024, 240, 106077. [Google Scholar] [CrossRef]
  58. Hu, P.; Zhang, W.; Nottingham, A.T.; Xiao, D.; Kuzyakov, Y.; Xu, L.; Chen, H.; Xiao, J.; Duan, P.; Tang, T.; et al. Lithological controls on soil aggregates and minerals regulate microbial carbon use efficiency and necromass stability. Environ. Sci. Technol. 2024, 58, 21186–21199. [Google Scholar] [CrossRef]
  59. Regelink, I.C.; Stoof, C.R.; Rousseva, S.; Weng, L.; Lair, G.J.; Kram, P.; Nikolaidis, N.P.; Kercheva, M.; Banwart, S.; Comans, R.N.J. Linkages between aggregate formation, porosity and soil chemical properties. Geoderma 2015, 247–248, 24–37. [Google Scholar] [CrossRef]
  60. Wang, W.; Zhang, H.; Vinay, N.; Wang, D.; Mo, F.; Liao, Y.; Wen, X. Microbial functional genes within soil aggregates drive organic carbon mineralization under contrasting tillage practices. Land. Degrad. Dev. 2023, 34, 3618–3635. [Google Scholar] [CrossRef]
  61. Liu, S.; Huang, X.; Gan, L.; Zhang, Z.; Dong, Y.; Peng, X. Drying-wetting cycles affect soil structure by impacting soil aggregate transformations and soil organic carbon fractions. Catena 2024, 243, 108188. [Google Scholar] [CrossRef]
  62. Shi, J.; Deng, L.; Gunina, A.; Alharbi, S.; Wang, K.; Li, J.; Liu, Y.; Shangguan, Z.; Kuzyakov, Y. Carbon stabilization pathways in soil aggregates during long-term forest succession: Implications from δ13C signatures. Soil Biol. Biochem. 2023, 180, 108988. [Google Scholar] [CrossRef]
  63. German, D.P.; Weintraub, M.N.; Grandy, A.S.; Lauber, C.L.; Rinkes, Z.L.; Allison, S.D. Optimization of hydrolytic and oxidative enzyme methods for ecosystem studies. Soil Biol. Biochem. 2011, 43, 1387–1397. [Google Scholar] [CrossRef]
Figure 1. Effects of different treatments on the distribution of soil water-stable aggregates (a), mean weight diameter (MWD, (b)), soil total organic carbon (TOC, (c)) and total nitrogen (TN, (d)). Lowercase letters indicate significant differences for each treatment at p < 0.05. Large macroaggregates (LMA); small macroaggregates (SMA); microaggregates (MA); silt + clay fractions (S + C).
Agronomy 16 00825 g001
Figure 2. Cumulative CO2 emissions (Cm, (a)), potential mineralization C (C0, (b)), rate constant (k, (c)), TOC mineralization efficiency (CME, (d)), TOC mineralization potential (CMP, (e)), soil total organic C mineralization contribution (CMC, (f)) from bulk soil and aggregate size classes under different treatments. Lowercase letters indicate significant differences among different soil aggregate size for each treatment at p < 0.05. Capital letters indicate significant differences among treatments for each soil aggregate size at p < 0.05. Bulk soil (BS), large macroaggregates (LMA); small macroaggregates (SMA); microaggregates (MA); silt + clay fractions (S + C).
Agronomy 16 00825 g002
Figure 3. Effects of different treatments on soil chemical properties ((a), DOC; (b), DON; (d), MBC; and (e), MBN), and their ratios (c), DOC:DON ratio; (f), MBC:MBN ratio)) in bulk soil and aggregate size classes. Lowercase letters indicate significant differences among different soil aggregate sizes for each treatment at p < 0.05. Capital letters indicate significant differences among treatments for each soil aggregate size at p < 0.05.
Agronomy 16 00825 g003
Figure 4. Effects of different treatments on hydrolase ((a), BG; (b), NAG + LAP; (c), BG: LAP + NAG) and oxidase ((d), CAT; (e), PPO) activities in bulk soil and aggregate size classes. Lowercase letters indicate significant differences among different soil aggregate sizes for each treatment at p < 0.05. Capital letters indicate significant differences among treatments for each soil aggregate size at p < 0.05.
Agronomy 16 00825 g004
Figure 5. Structural equation modeling indicating the direct and indirect effects of aggregate-size classes (ASC), nutrient stoichiometry (TOC:TN, DOC:DON, MBC:MBN), microbial community (total PLFAs, fungi, and G- and G+-bacterial PLFA), hydrolase (BG, NAG, LAP), and oxidase (CAT and PPO) on cumulative CO2 emissions. Bulk soil (BS, (a)), large macro-aggregates (LMA, (b)); small macro-aggregates (SMA, (c)); micro-aggregates (MA, (d)); silt + clay fractions (S + C, (e)) and the total standardized effects of these factors on CO2 emissions (f). Values along the arrows represent significant standardized path coefficients. Red arrows indicate negative significant effects, black arrows indicate positive significant effects, and gray arrows indicate non-significant effects. Arrow width is proportional to the magnitude of the path coefficient. R2 indicates squared multiple correlations. Significance levels: * p < 0.05, ** p < 0.01, *** p < 0.001.
Agronomy 16 00825 g005
Table 1. The abundance of total PLFAs, fungi, Gram-positive (G+) bacteria, Gram-negative (G) bacteria, G+:G ratio and F:B ratio in bulk soil and four aggregate fractions under different treatments. Lowercase letters indicate significant differences among different soil aggregate sizes for each treatment at p < 0.05. Capital letters indicate significant differences among treatments for each soil aggregate size at p < 0.05.
TreatmentsAggregate SizeTotal PLFAs
nmol g−1 Soil
Fungi
nmol g−1 Soil
G+-Bacteria
nmol g−1 Soil
G-Bacteria
nmol g−1 Soil
G+:G RatioF:B Ratio
N0C0BS69.9 ± 21.5 Ab5.25 ± 4.39 Ab13.4 ± 4.47 Bb11.9 ± 5.33 Aa1.18 ± 0.33 BCab0.19 ± 0.11 Aa
LMA108 ± 27.5 Aab6.38 ± 1.06 ABab21.1 ± 5.03 Aab17.8 ± 2.39 ABa1.18 ± 0.12 Cab0.16 ± 0.01 Aa
SMA114 ± 17.6 Bab10.2 ± 0.73 Bab24.6 ± 1.89 Ba22.0 ± 3.52 ABa1.13 ± 0.10 Bb0.22 ± 0.01 Aa
MA124 ± 10.3 Aa12.0 ± 1.65 Aa21.8 ± 4.04 Bab20.6 ± 4.53 Aa1.07 ± 0.13 Cb0.30 ± 0.10 Aa
S + C112 ± 7.47 Aab5.05 ± 0.81 Ab24.4 ± 3.27 Ba13.3 ± 1.98 Aa1.88 ± 0.46 Ba0.14 ± 0.03 Aa
N1C0BS87.8 ± 13.2 Ab5.53 ± 0.57 Acd17.0 ± 2.30 ABc15.1 ± 1.87 Ab1.12 ± 0.03 Cc0.17 ± 0.01 Ab
LMA134 ± 7.52 Aa8.39 ± 0.80 Abc28.0 ± 1.61 Aab24.8 ± 1.33 Aa1.13 ± 0.01 Cc0.16 ± 0.01 Ab
SMA150 ± 4.89 Aa13.0 ± 1.83 Aa32.3 ± 2.54 Aab29.5 ± 4.48 Aa1.10 ± 0.09 Bc0.21 ± 0.02 Aa
MA143 ± 9.18 Aa10.3 ± 1.00 Aab34.1 ± 2.48 Aa24.6 ± 2.22 Aa1.39 ± 0.1 Bb0.17 ± 0.01 ABb
S + C99.9 ± 12.9 Ab4.25 ± 0.74 ABd25.9 ± 3.52 Bb14.9 ± 2.46 Ab1.75 ± 0.14 Ba0.10 ± 0.00 ABc
N1C1BS88.4 ± 13.1 Ab4.57 ± 0.77 Ab25.2 ± 3.75 Aa13.2 ± 2.73 Aab1.94 ± 0.14 Ab0.12 ± 0.00 Ab
LMA112 ± 19.2 Aab3.89 ± 0.88 Bb28.6 ± 5.62 Aa13.4 ± 2.83 Bab2.14 ± 0.11 Ab0.09 ± 0.00 Bc
SMA115 ± 4.93 Bab4.52 ± 0.07 Cb28.7 ± 0.64 ABa13.8 ± 0.97 Cab2.09 ± 0.16 Ab0.11 ± 0.00 Bb
MA138 ± 8.08 Aa6.99 ± 0.72 Ba34.1 ± 2.51 Aa18.1 ± 1.79 Aa1.89 ± 0.11 Ab0.13 ± 0.00 Ba
S + C127 ± 28.5 Aab3.37 ± 0.70 ABb33.1 ± 4.87 ABa10.1 ± 3.74 Ab3.45 ± 0.79 Aa0.08 ± 0.00 Bd
N1C2BS99.3 ± 5.93 Ab4.42 ± 0.38 Abc23.4 ± 1.17 Ab14.1 ± 1.54 Aab1.68 ± 0.22 ABb0.12 ± 0.01 Aa
LMA123 ± 21.5 Aab4.58 ± 1.16 Bbc29.5 ± 5.66 Aab17.4 ± 4.77 ABab1.73 ± 0.18 Bb0.10 ± 0.00 Bb
SMA123 ± 5.63 Bab5.83 ± 0.61 Cab31.8 ± 2.55 Aab17.8 ± 2.37 BCab1.79 ± 0.11 Ab0.12 ± 0.00 Ba
MA149 ± 14.3 Aa6.84 ± 0.63 Ba38.3 ± 3.90 Aa19.1 ± 1.93 Aa2.01 ± 0.04 Ab0.12 ± 0.01 Ba
S + C120 ± 22.1 Aab3.29 ± 0.30 Bc36.4 ± 3.70 Aa11.2 ± 0.72 Ab3.27 ± 0.39 Aa0.07 ± 0.00 Bc
The G+:G and F:B ratios were significantly affected by Tre, ASC and their interaction (Table S3; p < 0.001). The G+:G ratio was highest in the S + C fractions and increased under biochar treatments in bulk soil and all aggregate fractions relative to N1C0. Conversely, the F:B ratio was lowest in S + C and decreased in bulk soil and all fractions under N1C1 and N1C2 (Table 1; p < 0.001).
Disclaimer/Publisher’s Note: The statements, opinions and data contained in all publications are solely those of the individual author(s) and contributor(s) and not of MDPI and/or the editor(s). MDPI and/or the editor(s) disclaim responsibility for any injury to people or property resulting from any ideas, methods, instructions or products referred to in the content.