Article

The Combined Application of Organic Fertilizer and Chemical Fertilizer Increases Alfalfa Yield, Enhances Soil Nutrient Availability, and Improves Soil Biological Properties

1
College of Grassland Science, Xinjiang Agricultural University, Urumqi 830052, China
2
Xinjiang Key Laboratory of Grassland Resources and Ecology, Urumqi 830052, China
3
Postdoctoral Research Station in Grassland Resources and Ecology, Urumqi 830052, China
*
Author to whom correspondence should be addressed.
These authors contributed equally to this work.
Agronomy 2026, 16(8), 795; https://doi.org/10.3390/agronomy16080795
Submission received: 17 February 2026 / Revised: 3 April 2026 / Accepted: 10 April 2026 / Published: 13 April 2026

Abstract

This study focused on alfalfa (Medicago sativa cv. Xinmu No. 4) as the experimental material, and a two-year field plot controlled experiment was conducted to compare the effects of different co-application ratios of organic and chemical fertilizers on alfalfa yield, soil nutrient status, and soil biological characteristics. The six fertilization treatments were as follows: CM0 (100% cattle manure), CM1 (75% cattle manure + 25% chemical fertilizer), CM2 (50% cattle manure + 50% chemical fertilizer), CM3 (25% cattle manure + 75% chemical fertilizer), CM4 (100% chemical fertilizer), and CK (no fertilizer application). The results showed that alfalfa hay yield was highest under the CM3 treatment in both 2024 and 2025, representing increases of 38.03% and 40.85%, respectively, compared with the control (CK). Relative to the other treatments, CM3 significantly increased soil total nitrogen, alkali-hydrolyzable nitrogen, available phosphorus, readily available potassium, and organic matter contents. In addition, CM3 markedly enhanced the activities of soil nitrate reductase (NR), nitrite reductase (NiR), and the root enzymes glutamate synthase (GOGAT) and glutamine synthase (GS). The combined application of organic and chemical fertilizers significantly reshaped the soil bacterial community structure associated with alfalfa. Under the CM3 treatment, Chao1, Shannon, and ACE indices of soil bacterial diversity increased, whereas the Simpson index decreased. Moreover, the CM3 treatment was associated with higher relative abundances of several key bacterial phyla and genera. The 25% cattle manure plus 75% chemical fertilizer (CM3) treatment exhibited the strongest overall effects, significantly increasing total alfalfa hay yield, enhancing soil macronutrient availability and key enzyme activities, improving soil microbial α-diversity, and optimizing soil bacterial community structure. This treatment consistently outperformed the no-fertilizer control (CK) and all other organic–inorganic fertilizer combinations. Collectively, these findings provide robust scientific evidence supporting strategies to increase forage productivity, mitigate environmental impacts, and promote the sustainable development of the grassland industry.

1. Introduction

Livestock farming represents a cornerstone of the “Holistic Food Concept” and a pivotal contributor to the construction of diversified food systems. As a foundational industrial sector, it ensures the stable supply of animal-derived protein to meet national nutritional requirements and bolsters the implementation of national food security strategies. Following the strategic deployment of rural revitalization, China’s livestock industry has undergone rapid expansion [1,2]. However, this growth has simultaneously exacerbated environmental pressures, including pollution and ecosystem degradation. Notably, fertilizer consumption in China currently represents more than one-third of the global total [3]. Addressing these critical challenges by enhancing the ecological sustainability of livestock systems and optimizing their eco-efficiency has therefore emerged as an imperative strategic priority.
Xinjiang represents China’s second-largest pastoral region, encompassing approximately 52 million hectares of expansive grasslands and diverse germplasm resources [4]. Animal husbandry serves as a foundational industry in the region, playing a pivotal role in both social production and regional economic development [5]. However, the continuous expansion of high-input agrochemical fertilization regimes, coupled with progressive arable land degradation, poses significant threats to the stability of livestock feed supplies. These environmental pressures have precipitated declines in grassland productivity and forage nutritional quality, necessitating the breeding and cultivation of high-yield, high-quality forage cultivars to meet the demands of modern livestock production [6]. Currently, excessive long-term fertilizer application and suboptimal fertilization management remain prevalent in forage cultivation. These practices induce soil degradation and suppress soil biological activity, ultimately undermining the ecological integrity and long-term sustainability of Xinjiang’s grassland-livestock ecosystems [7,8].
Alfalfa (Medicago sativa L.), widely recognized as the “king of forage grasses”, is the most extensively cultivated leguminous forage crop globally. Its deep root system and robust biological nitrogen fixation (BNF) capacity play an indispensable role in maintaining soil fertility and enhancing soil structure [9]. Consequently, nitrogen management has become critical for achieving high-yield, high-quality alfalfa production [10]. Currently, nitrogen inputs in alfalfa cultivation systems rely predominantly on synthetic nitrogen fertilizers. However, excessive application of chemical fertilizers not only limits further gains in biomass yield and nutritional quality but also induces soil compaction, aquatic eutrophication, greenhouse gas emissions, and associated risks to human health [11]. Therefore, the implementation of optimized, ecologically sustainable fertilization strategies is of paramount importance for the long-term viability of alfalfa cultivation.
As an alternative to chemical fertilizers, organic amendments are enriched with bioactive components, including plant growth regulators, enzymatic substances, and functional microorganisms. These amendments not only stimulate the metabolic activity of soil microbial communities but also enhance nutrient acquisition efficiency by modulating root architecture, thereby maintaining the dynamic equilibrium of soil ecosystems [12,13,14]. Consequently, the co-application of organic and inorganic fertilizers represents a critical strategy for safeguarding ecological integrity and optimizing resource use efficiency. This integrated management practice ensures high-yield, high-quality crop production while substantially enhancing soil fertility and nitrogen use efficiency (NUE), reducing mineral fertilizer dependency, mitigating environmental risks, and promoting soil microbial diversity [15,16]. Wu et al. [13] reported that substituting 30% of chemical fertilizer inputs with organic amendments decreased soil bulk density by 1.3–17.1%, while elevating soil organic matter, available phosphorus, and available potassium (AK) contents to variable extents. Concurrently, soil pH shifted toward neutrality, thereby further improving overall soil fertility. Lu et al. [17] observed that an organic nitrogen substitution rate of 18–24% enhanced soil available nutrient contents and fertilizer use efficiency, while sustaining high and stable crop yields. Ren et al. [18] found that partial replacement of chemical fertilizers with organic counterparts not only elevated total soil nutrient pools but also improved nutrient bioavailability, ultimately increasing maize (Zea mays L.) grain yields. Ma Zhao et al. [19] conducted research in six major production areas of alfalfa, including Shandong Province, Tianjin City, Hebei Province, and Heilongjiang Province. The results showed that the soil treated with organic–inorganic compound fertilizer had higher alkaline nitrogen, available phosphorus, available potassium, and organic matter content than the soil treated with chemical fertilizer alone. Liu et al. [20] demonstrated that long-term partial replacement of chemical fertilizers with organic materials increased the relative abundance of beneficial soil microbiota, indirectly promoting rice (Oryza sativa L.) yields via augmented soil enzyme activity and improved nutrient availability. Wang and colleagues [21] further verified that reducing chemical fertilizer inputs by 20–40% in combination with diverse organic amendments in cotton (Gossypium hirsutum Linn.) cropping systems significantly enhanced multiple soil enzyme activities, increased the diversity of beneficial soil microorganisms, and stimulated cotton growth and aboveground dry matter accumulation. Collectively, integrated organic–inorganic fertilization substantially boosts crop productivity and improves soil physicochemical and biological quality. Nevertheless, the optimal organic-to-chemical substitution ratio is crop-specific, and systematic investigations targeting alfalfa production in the Xinjiang region remain comparatively limited.
This study investigated the effects of combined organic and chemical fertilizer application on the yield of alfalfa, soil nutrient status, and soil microbial properties. The primary objective was to identify the optimal fertilization ratio that maximizes nitrogen use efficiency in alfalfa cultivation within the Xinjiang region, and evaluate the effects of different organic–inorganic fertilization ratios on alfalfa yield, soil nutrient status, and microbial community characteristics under local experimental conditions. The results aim to provide a scientific basis for rational fertilization management in alfalfa production and support further research on nutrient utilization mechanisms in forage legumes.

2. Materials and Methods

2.1. Study Area

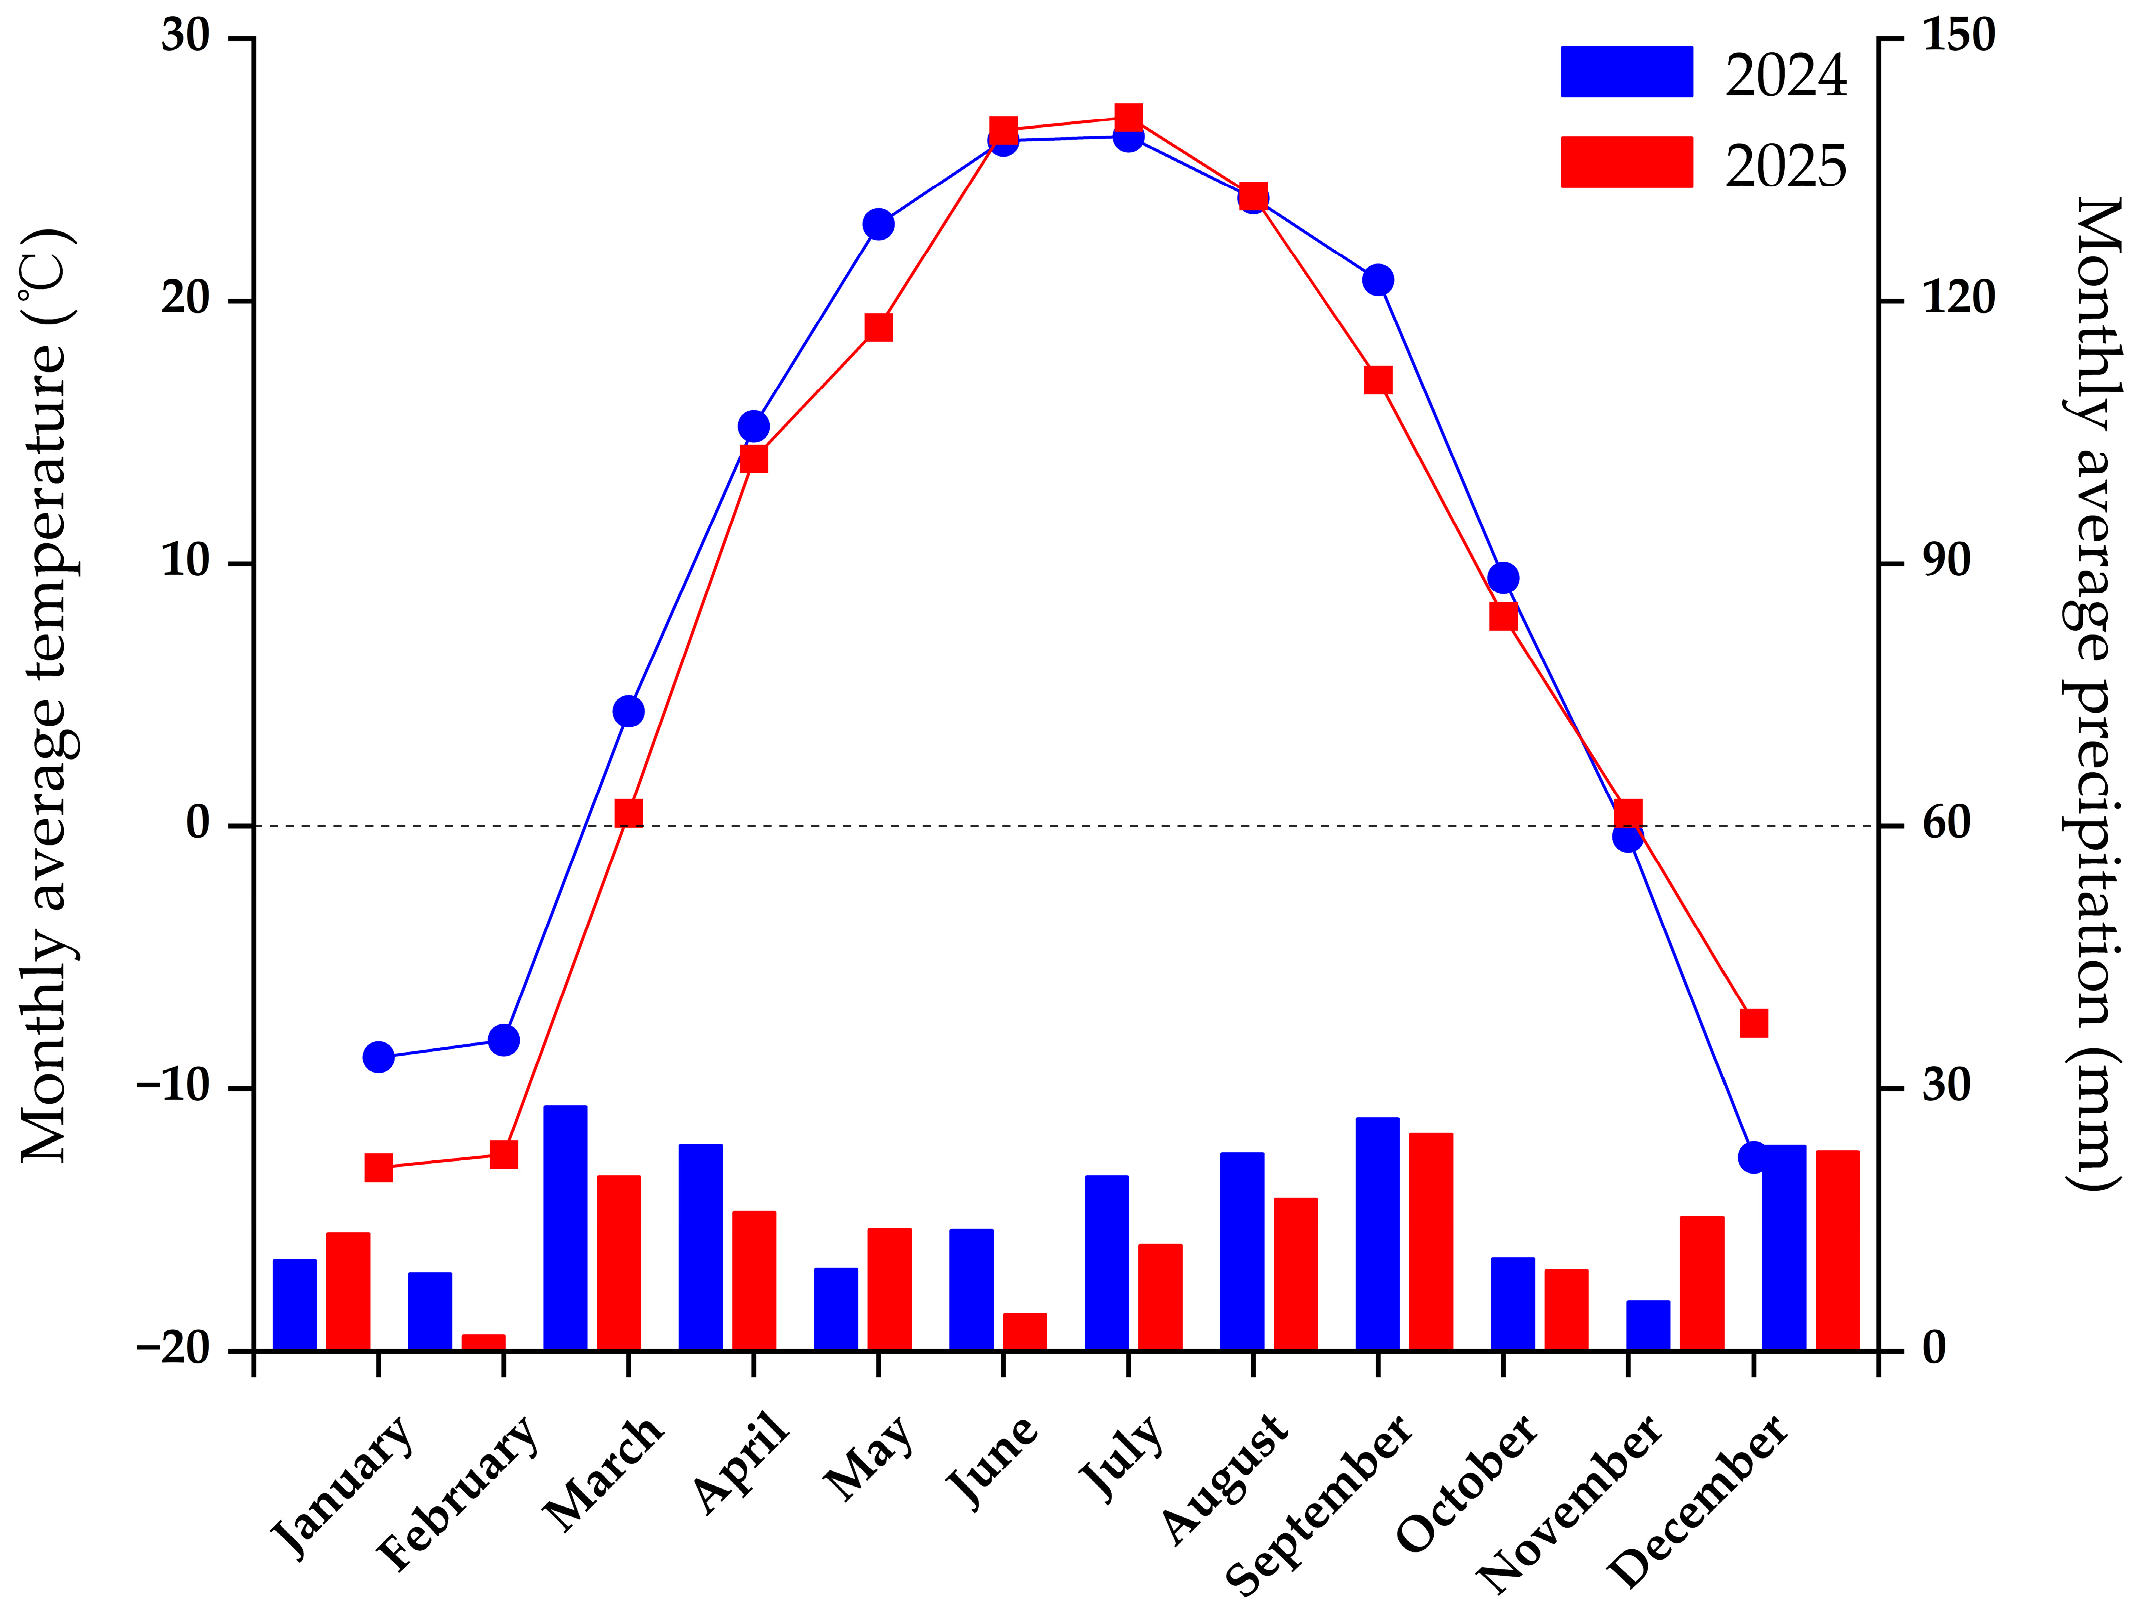
The experimental site was located at the Sanping Farm Comprehensive Experimental Station of Xinjiang Agricultural University (87°21′13″ E, 43°56′58″ N), situated on the southern edge of the Junggar Basin at an elevation of 580 m above sea level. The site features a temperate continental semi-arid climate with abundant solar radiation. The annual average temperature is 7.2 °C, with a total annual sunshine duration of 2829.4 h, annual precipitation of 228.8 mm, and annual evaporation of 2647 mm. The frost-free period extends for 163 days. The monthly average temperature and precipitation in the experimental area are shown in Figure 1. The chemical properties of the experimental soil and organic fertilizer (cow dung) are shown in Table 1.

2.2. Experimental Design

Randomized complete block design. Six treatments (based on nitrogen contents) were set as: (1) CM0, 100% cattle manure; (2) CM1, 75% cattle manure + 25% chemical fertilizer; (3) CM2, 50% cattle manure + 50% chemical fertilizer; (4) CM3, 25% cattle manure + 75% chemical fertilizer; (5) CM4, 100% chemical fertilizer; (6) CK, blank control (no fertilizer application). All treatments received a consistent total nitrogen (N) application rate of 150 kg·ha−1 [22]. The organic fertilizer used was well-decomposed cattle manure, sourced from the cattle farm at Sanping Farm. Applied as a basal fertilizer, it was broadcast uniformly once into the experimental plots prior to alfalfa seeding and regreening in both 2024 and 2025. Prior to application, the cattle manure was subjected to comprehensive chemical analysis (Table 1). The chemical fertilizer employed was locally purchased urea (containing approximately 46.67% N), which was applied using fertilizer tanks. The topdressing schedules varied between years: In 2024, a two-topdressing regime was adopted, with applications conducted after mowing at the late budding to early flowering stage of each alfalfa crop; in 2025, the regimen was adjusted to three topdressing events, completed after cutting during the late budding to early flowering stage for the first three alfalfa crops.
The experimental material was alfalfa (Medicago sativa cv. ‘Xinmu No. 4’) supplied by the College of Grassland Science, Xinjiang Agricultural University. Each treatment included five replications, yielding a total of 30 experimental plots. Individual plots were 3 m × 4 m in dimension, with an inter-row spacing of 0.3 m. Phosphorus and potassium fertilizer application rates were uniform across all plots. Potassium dihydrogen phosphate (H2KO4P) was used as the phosphorus source, and potassium sulfate (K2SO4) was used as the potassium source. The alfalfa seeding rate was set at 15 kg·hm−2. Manual row seeding was conducted at a sowing depth of 1–2 cm. Fertilizer application rates for each treatment were calculated according to the nitrogen concentrations of chemical fertilizers and cattle manure, as detailed in Table 2.
Alfalfa sowing was conducted in April 2024. Two harvests were performed in 2024: the first in July and the second in September. Four harvests were implemented in the subsequent year (2025): the first in May, the second in July, the third in August, and the fourth in September.

2.3. Measurement Indicators and Methods

2.3.1. Yield

During the 2024–2025 growing seasons, growth indicators were measured at the early flowering stage of each alfalfa crop. Subsequent to these measurements, plants were cut flush with the soil surface and weighed immediately, and fresh forage yield was recorded. Three fresh forage samples (approximately 500 g each) were randomly collected from each plot for laboratory analysis. Samples were placed in a 105 °C oven for 30 min to deactivate enzymes (kill green). Subsequently, samples were transferred to a 65 °C oven and dried for 48 h to ensure complete water removal and stability of the sample. Dry matter yield was calculated from fresh yield and moisture content as follows:
Dry matter yield = Fresh yield × (1 − Moisture content/100)
Root sampling for belowground biomass determination: Following the final alfalfa harvest in both 2024 and 2025, one row was randomly selected from each plot. A 30 cm segment of this row was excavated, and the root system along with the surrounding soil was collected as a single composite sample. After thorough rinsing with deionized water to remove adhering soil particles, the alfalfa roots were collected, blanched in a 105 °C oven for 30 min to deactivate enzymes, and then dried in a 65 °C oven for 48 h. Alfalfa belowground biomass (kg·hm−2) was calculated based on the dry weight of the roots.
Belowground biomass (kg·hm−2) = (Root dry mass (kg)/Sampling area (m2)) × 10,000

2.3.2. Soil Samples

Soil samples were collected using the five-point sampling method with an “S”—shaped distribution. In September 2024 and October 2025, soil cores were obtained from the 0–20 cm and 20–40 cm soil layers, respectively, using a soil auger. Soil from the five sampling points was thoroughly mixed to form one composite sample per plot. After the removal of visible plant debris and stones, samples were air-dried at room temperature. The dried soil was ground, homogenized, and passed through 10-mesh and 100-mesh sieves for subsequent analysis of soil nutrient indicators. Basic soil physicochemical properties were determined as described in the methodology section [23]. Total soil nitrogen was quantified using the Kjeldahl method. Soil alkali-hydrolyzable nitrogen was measured by the alkali diffusion method. Soil available phosphorus was determined via spectrophotometry, and soil available potassium (AK) was analyzed by ammonium acetate extraction coupled with atomic absorption flame photometry. The organic carbon content was measured using the potassium dichromate volumetric method [24].
Soil microbial diversity was assessed by collecting rhizosphere soil (soil adhering to alfalfa roots) using the five-point sampling method. First, the topsoil layer (0–5 cm) attached to the root system was carefully removed. Subsequently, soil adhering tightly to the root surface was gently brushed off with a sterile brush. The brushed rhizosphere soil was thoroughly mixed and transferred into sterile self-sealing bags. A subsample of the rhizosphere soil was immediately placed in an ice box for cryopreservation and transported back to the laboratory promptly for microbial analysis to minimize microbial community changes.
The species composition and functional characteristics of the soil microbial community were analyzed by Wekemo Technology Group Co., Ltd., Shenzhen, Chian, using metagenomic sequencing technology. This approach was employed to quantify microbial community composition, biodiversity indices (α-diversity and β-diversity), and the relative abundance of individual microbial taxa [25]. For β-diversity analysis, non-metric multidimensional scaling (NMDS) was performed based on the Bray–Curtis distance matrix using the metaMDS function in the R package vegan (v2.6-0). The stress value was calculated to evaluate the goodness of fit of the ordination, with values < 0.2 indicating a reliable representation of community differences. Permutational multivariate analysis of variance (PERMANOVA) was conducted with 999 permutations to test for significant differences in bacterial community composition among fertilization treatments. Venn diagrams were generated using the R package VennDiagram (v1.7.3) to visualize the number of shared and unique operational taxonomic units (OTUs) across different fertilization treatments, reflecting the specificity and overlap of soil bacterial communities under each regime. Soil nitrate reductase (NR) and nitrite reductase (NiR) activities were determined using an enzyme-linked immunosorbent assay (ELISA) reader, following the manufacturer’s standard operating procedures (SOPs) [26].

2.3.3. Plant Samples

Root sampling for enzyme activity determination: Collect another batch of fresh root samples during the first flowering period of the last crop of alfalfa in 2024 and 2025 (consistent with the aboveground yield sampling period). The plant roots were placed in a basin containing pre-chilled distilled water. The roots were gently agitated to remove loosely adhering soil particles, then blotted dry with absorbent filter paper. The samples were immediately flash-frozen in liquid nitrogen for 10 min, then transferred to a −80 °C ultra-low temperature freezer for storage. These root samples were used for the determination of glutamine synthase (GS) and glutamate synthase (GOGAT) activities, which were quantified using a commercial assay kit following the manufacturer’s protocols [26].

2.4. Data Processing and Statistical Methods

All data were tested for normality using the Shapiro–Wilk test and for homogeneity of variances using Levene’s test prior to statistical analysis. One-way analysis of variance (ANOVA) was performed to evaluate the effects of different fertilization treatments. When significant differences were detected, multiple comparisons were conducted using Tukey’s honestly significant difference (HSD) test at the 0.05 significance level. Independent-samples t-tests were used to compare differences between years (2024 and 2025) under the same treatment. Microbial community β-diversity was assessed using non-metric multidimensional scaling (NMDS) based on Bray–Curtis distance matrices, and differences among treatments were evaluated using permutational multivariate analysis of variance (PERMANOVA) with 999 permutations. All statistical analyses were conducted using IBM SPSS 27.0 and R software (v2.6-0). Detailed statistical procedures are provided in the Supplementary Materials.

3. Results

3.1. Yield

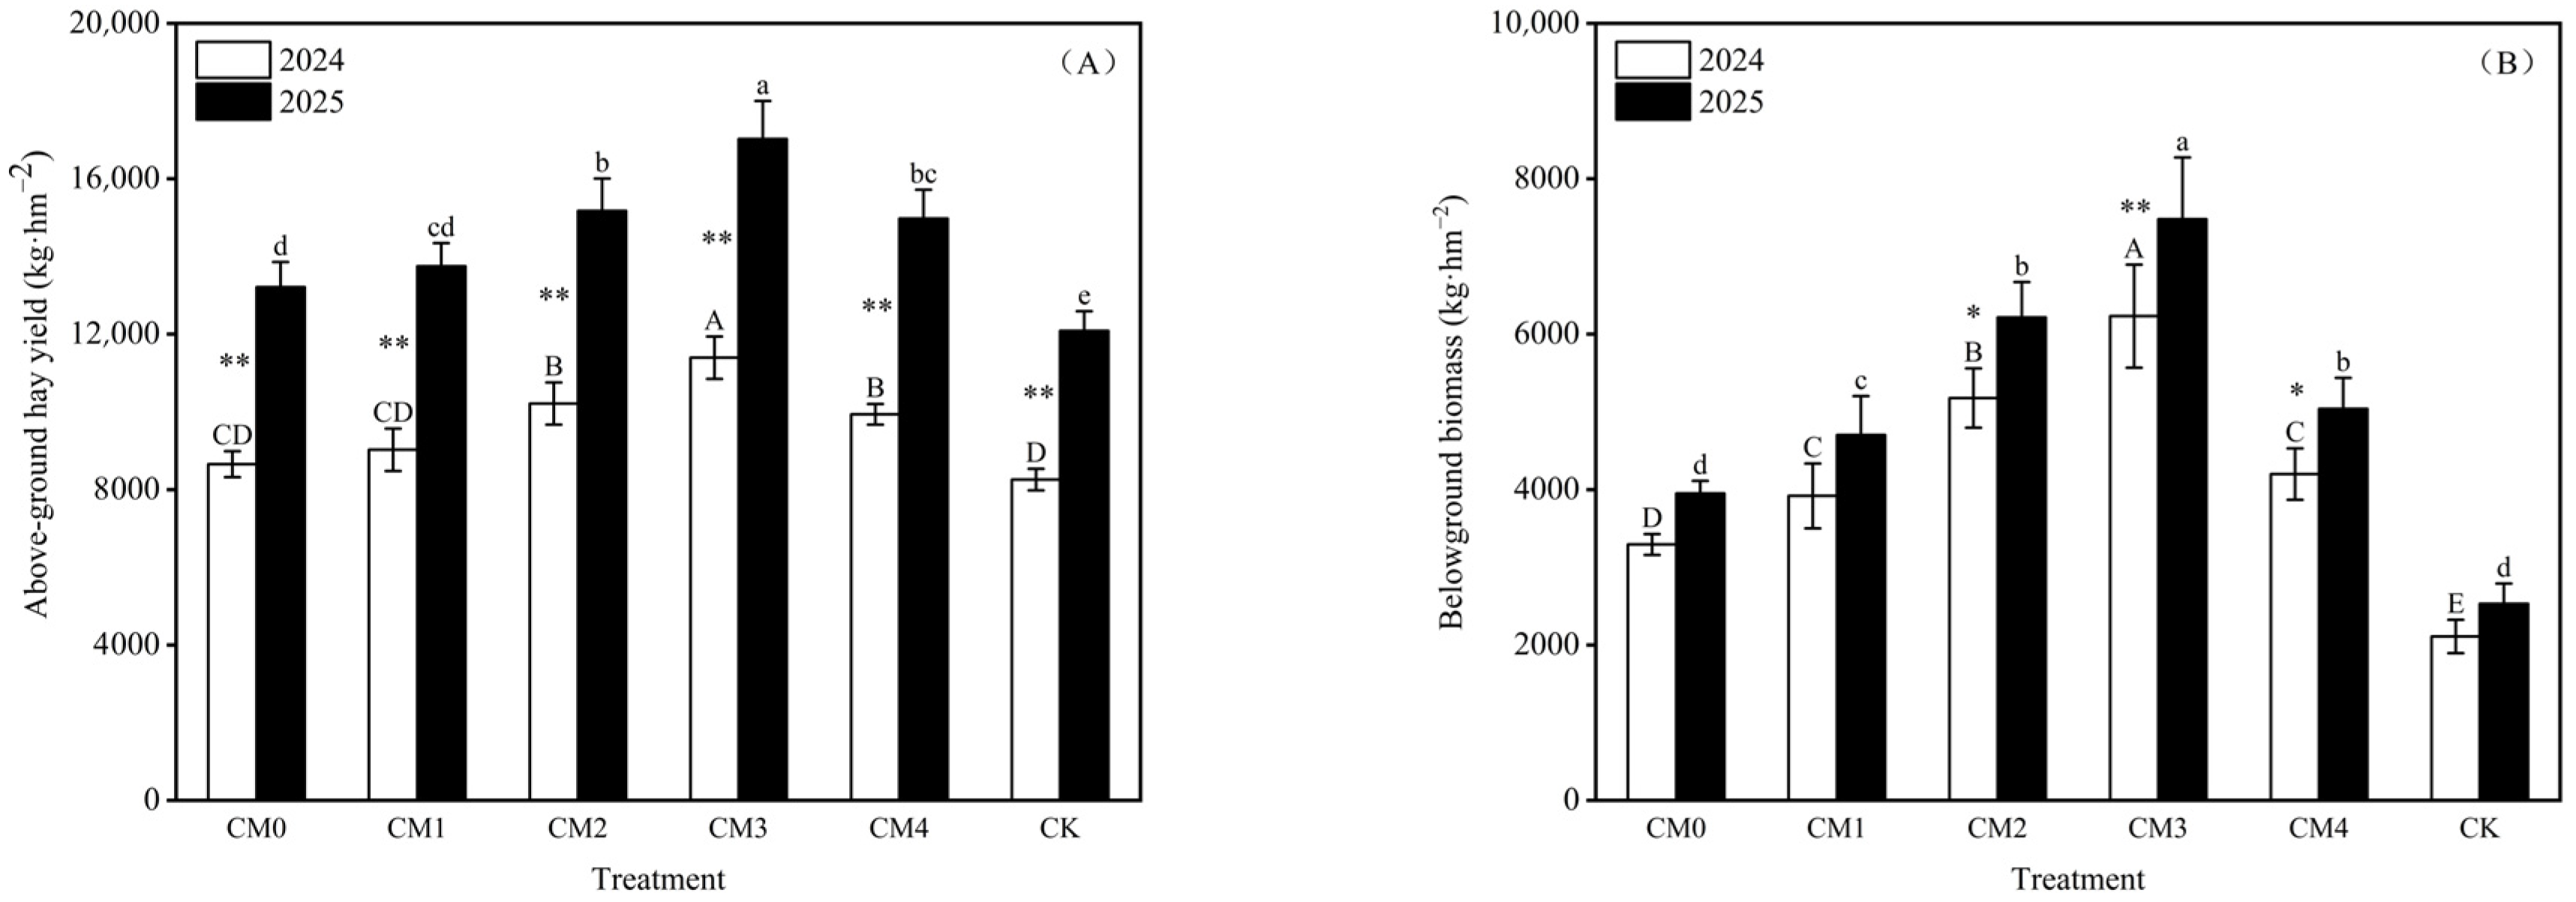
Different ratios of cattle manure organic fertilizer combined with chemical fertilizer exerted distinct effects on alfalfa yield. As shown in Figure 2A, in 2024, alfalfa hay yield under the CM3 treatment was 11,395.72 kg·hm−2, which was significantly higher than that under other treatments (p < 0.05). No significant differences were observed between CM2 and CM4; However, both produced significantly higher yields than the CK (p < 0.05). In contrast, no significant difference was detected between CM0 and CM1. In 2025, hay yield again peaked under CM3, reaching 17,023.54 kg·hm−2. No significant differences were found between CM0 and CM1, nor between CM2 and CM4, whereas both groups yielded significantly more than CK (p < 0.05). Relative to CK, the hay yield under CM3 increased by 38.03% in 2024 and 40.85% in 2025. Moreover, compared with 2024, hay yields under all treatments increased extremely significantly in 2025 (p < 0.01).
As shown in Figure 2B, in 2024, belowground biomass of alfalfa was highest under CM3 (6232.00 kg·hm−2), significantly exceeding that of all other treatments (p < 0.05). No significant difference was observed between CM1 and CM4, although both were significantly higher than CK (p < 0.05). In 2025, CM3 again produced the highest belowground biomass, reaching 7478.91 kg·hm−2. No significant difference was detected between CM2 and CM4, both of which were significantly higher than CK (p < 0.05). Compared with 2024, belowground biomass under CM2 and CM4 increased significantly in 2025, whereas CM3 exhibited an extremely significant increase (p < 0.01). No significant interannual differences were observed for the remaining treatments. The combined application of organic and chemical fertilizers can improve the hay yield and underground biomass of alfalfa. The treatment with 25% cow manure and 75% chemical fertilizer is the most effective.

3.2. Effects of Organic Fertilizer Combined with Chemical Fertilizer on Soil Nutrients

3.2.1. Soil Total Nitrogen and Alkali-Hydrolyzable Nitrogen

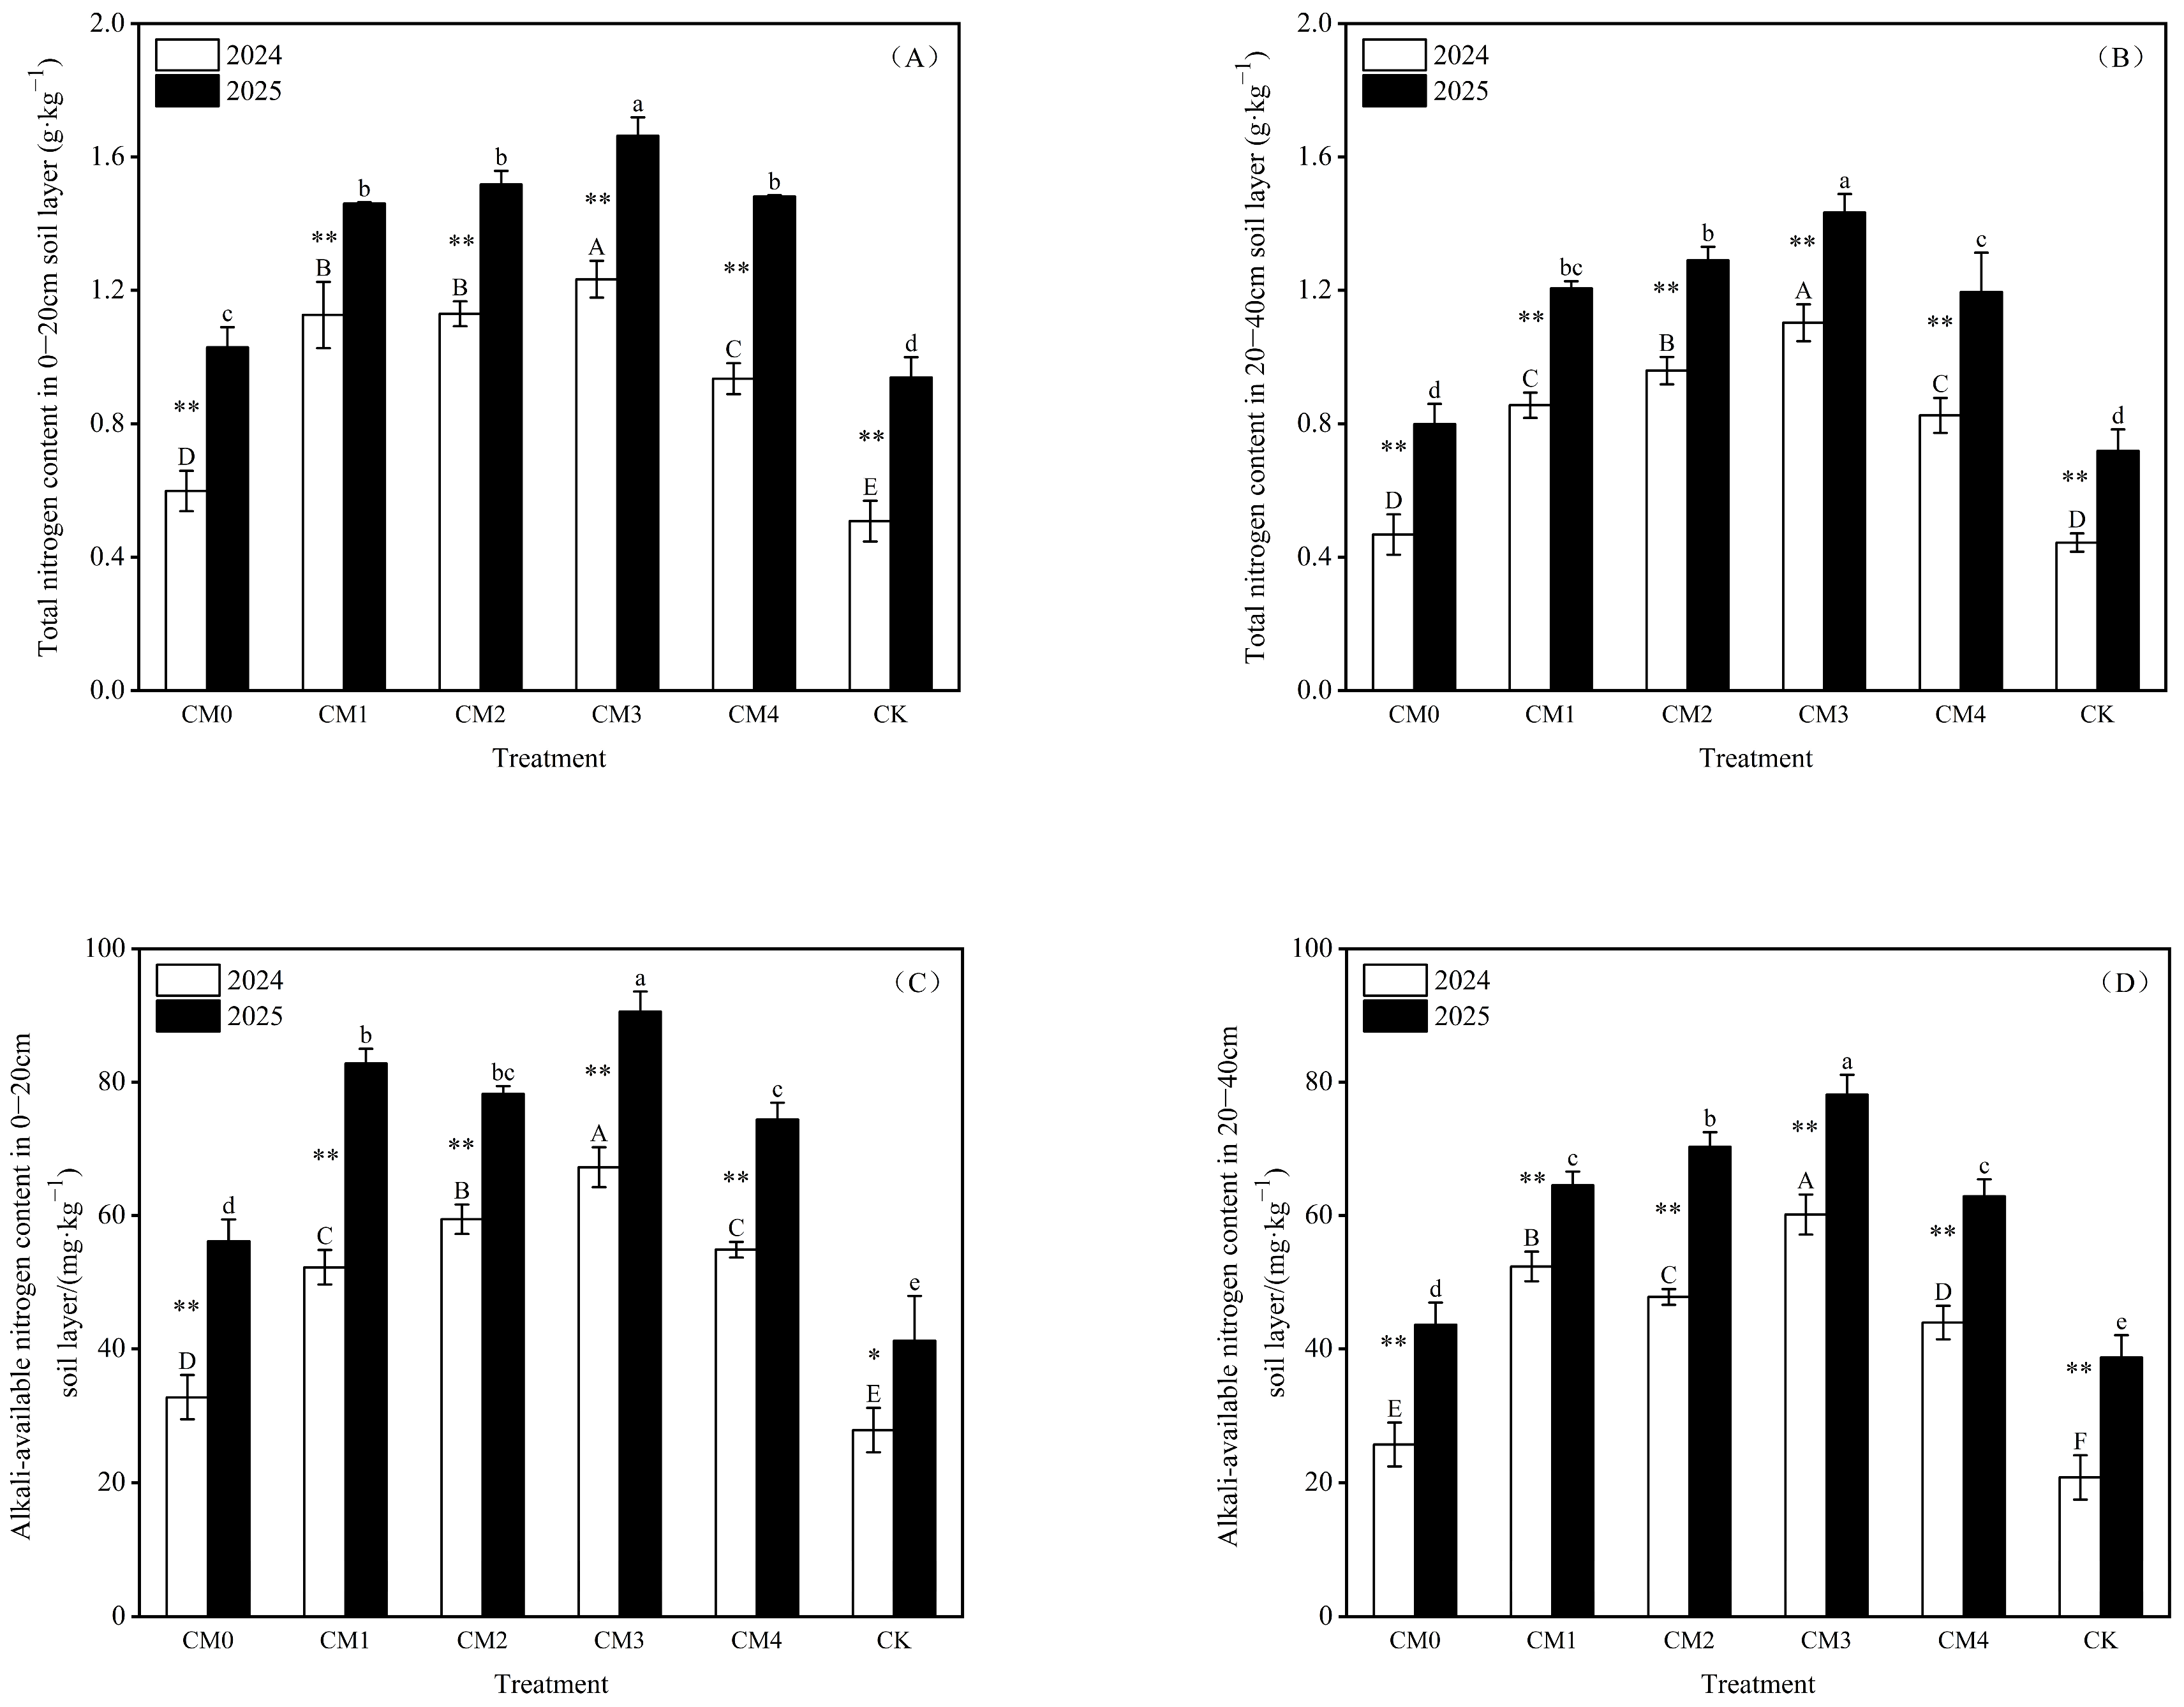
The effects of different ratios of cattle manure organic fertilizer combined with chemical fertilizer on soil total nitrogen and alkali-hydrolyzable nitrogen contents varied significantly (Figure 3). In the 0–20 cm soil layer, soil total nitrogen content was highest under the CM3 treatment in both years, reaching 1.23 and 1.66 g·kg−1 in 2024 and 2025, respectively, and was significantly higher than that under all other treatments (p < 0.05). In 2024, no significant difference in soil total nitrogen content was observed between CM1 and CM2. However, both were significantly higher than CK, CM0, and CM4, with CK exhibiting the lowest value. In 2025, no significant differences were detected among CM1, CM2, and CM4, although all three were significantly higher than CK and CM0 (Figure 3A). In the 20–40 cm soil layer, the CM3 treatment also exhibited significantly higher soil total nitrogen contents than the other treatments in both years (p < 0.05), with values of 1.10 and 1.43 g·kg−1 in 2024 and 2025, respectively. No significant differences were observed between CM0 and CK, and CK consistently showed the lowest soil total nitrogen content (Figure 3B). Compared with 2024, soil total nitrogen contents in both the 0–20 cm and 20–40 cm soil layers increased extremely significantly across all treatments in 2025 (p < 0.01), indicating a cumulative increase in total nitrogen with successive years of fertilizer application.
As shown in Figure 3C, in the 0–20 cm soil layer, soil alkali-hydrolyzable nitrogen content was significantly higher under CM3 than under all other treatments in both years (p < 0.05), reaching 67.24 and 90.59 mg·kg−1 in 2024 and 2025, respectively. In 2024, no significant difference was observed between CM1 and CM4 treatments; however, both exhibited significantly higher alkali-hydrolyzable nitrogen contents than CM0 and CK (p < 0.05). In 2025, no significant differences were detected between CM1 and CM2, or between CM2 and CM4, whereas all three treatments had significantly higher values than CM0 and CK (p < 0.05). In the 20–40 cm soil layer, alkali-hydrolyzable nitrogen content was also highest under CM3 in both 2024 and 2025, reaching 60.15 and 78.10 mg·kg−1, respectively, and was significantly greater than that under the other treatments (p < 0.05) (Figure 3D). In 2025, no significant difference was observed between the CM1 and CM4 treatments, although both were significantly higher than CK (p < 0.05). Compared with 2024, alkali-hydrolyzable nitrogen content in the 0–20 cm soil layer increased extremely significantly across all fertilization treatments in 2025 (p < 0.01), whereas the CK showed a significant increase (p < 0.05). In addition, alkali-hydrolyzable nitrogen content in the 20–40 cm soil layer increased extremely significantly across all treatments (p < 0.01). Overall, alkali-hydrolyzable nitrogen content increased with the number of fertilizer application years. The combined application of organic and chemical fertilizers enhanced both soil total nitrogen and alkali-hydrolyzable nitrogen contents, with the 25% cattle manure plus 75% chemical fertilizer (CM3) treatment producing the most pronounced effects. These results demonstrate that the rational combined application of organic and inorganic fertilizers can effectively increase soil total nitrogen and available nutrient contents, with a positive cumulative effect over consecutive years. The optimal application ratio of 25% organic manure plus 75% chemical fertilizer not only improves soil nitrogen supply capacity but also helps maintain the stability and sustainability of the soil nitrogen pool, providing a practical basis for rational fertilization in local production.

3.2.2. Soil Available Phosphorus and Available Potassium

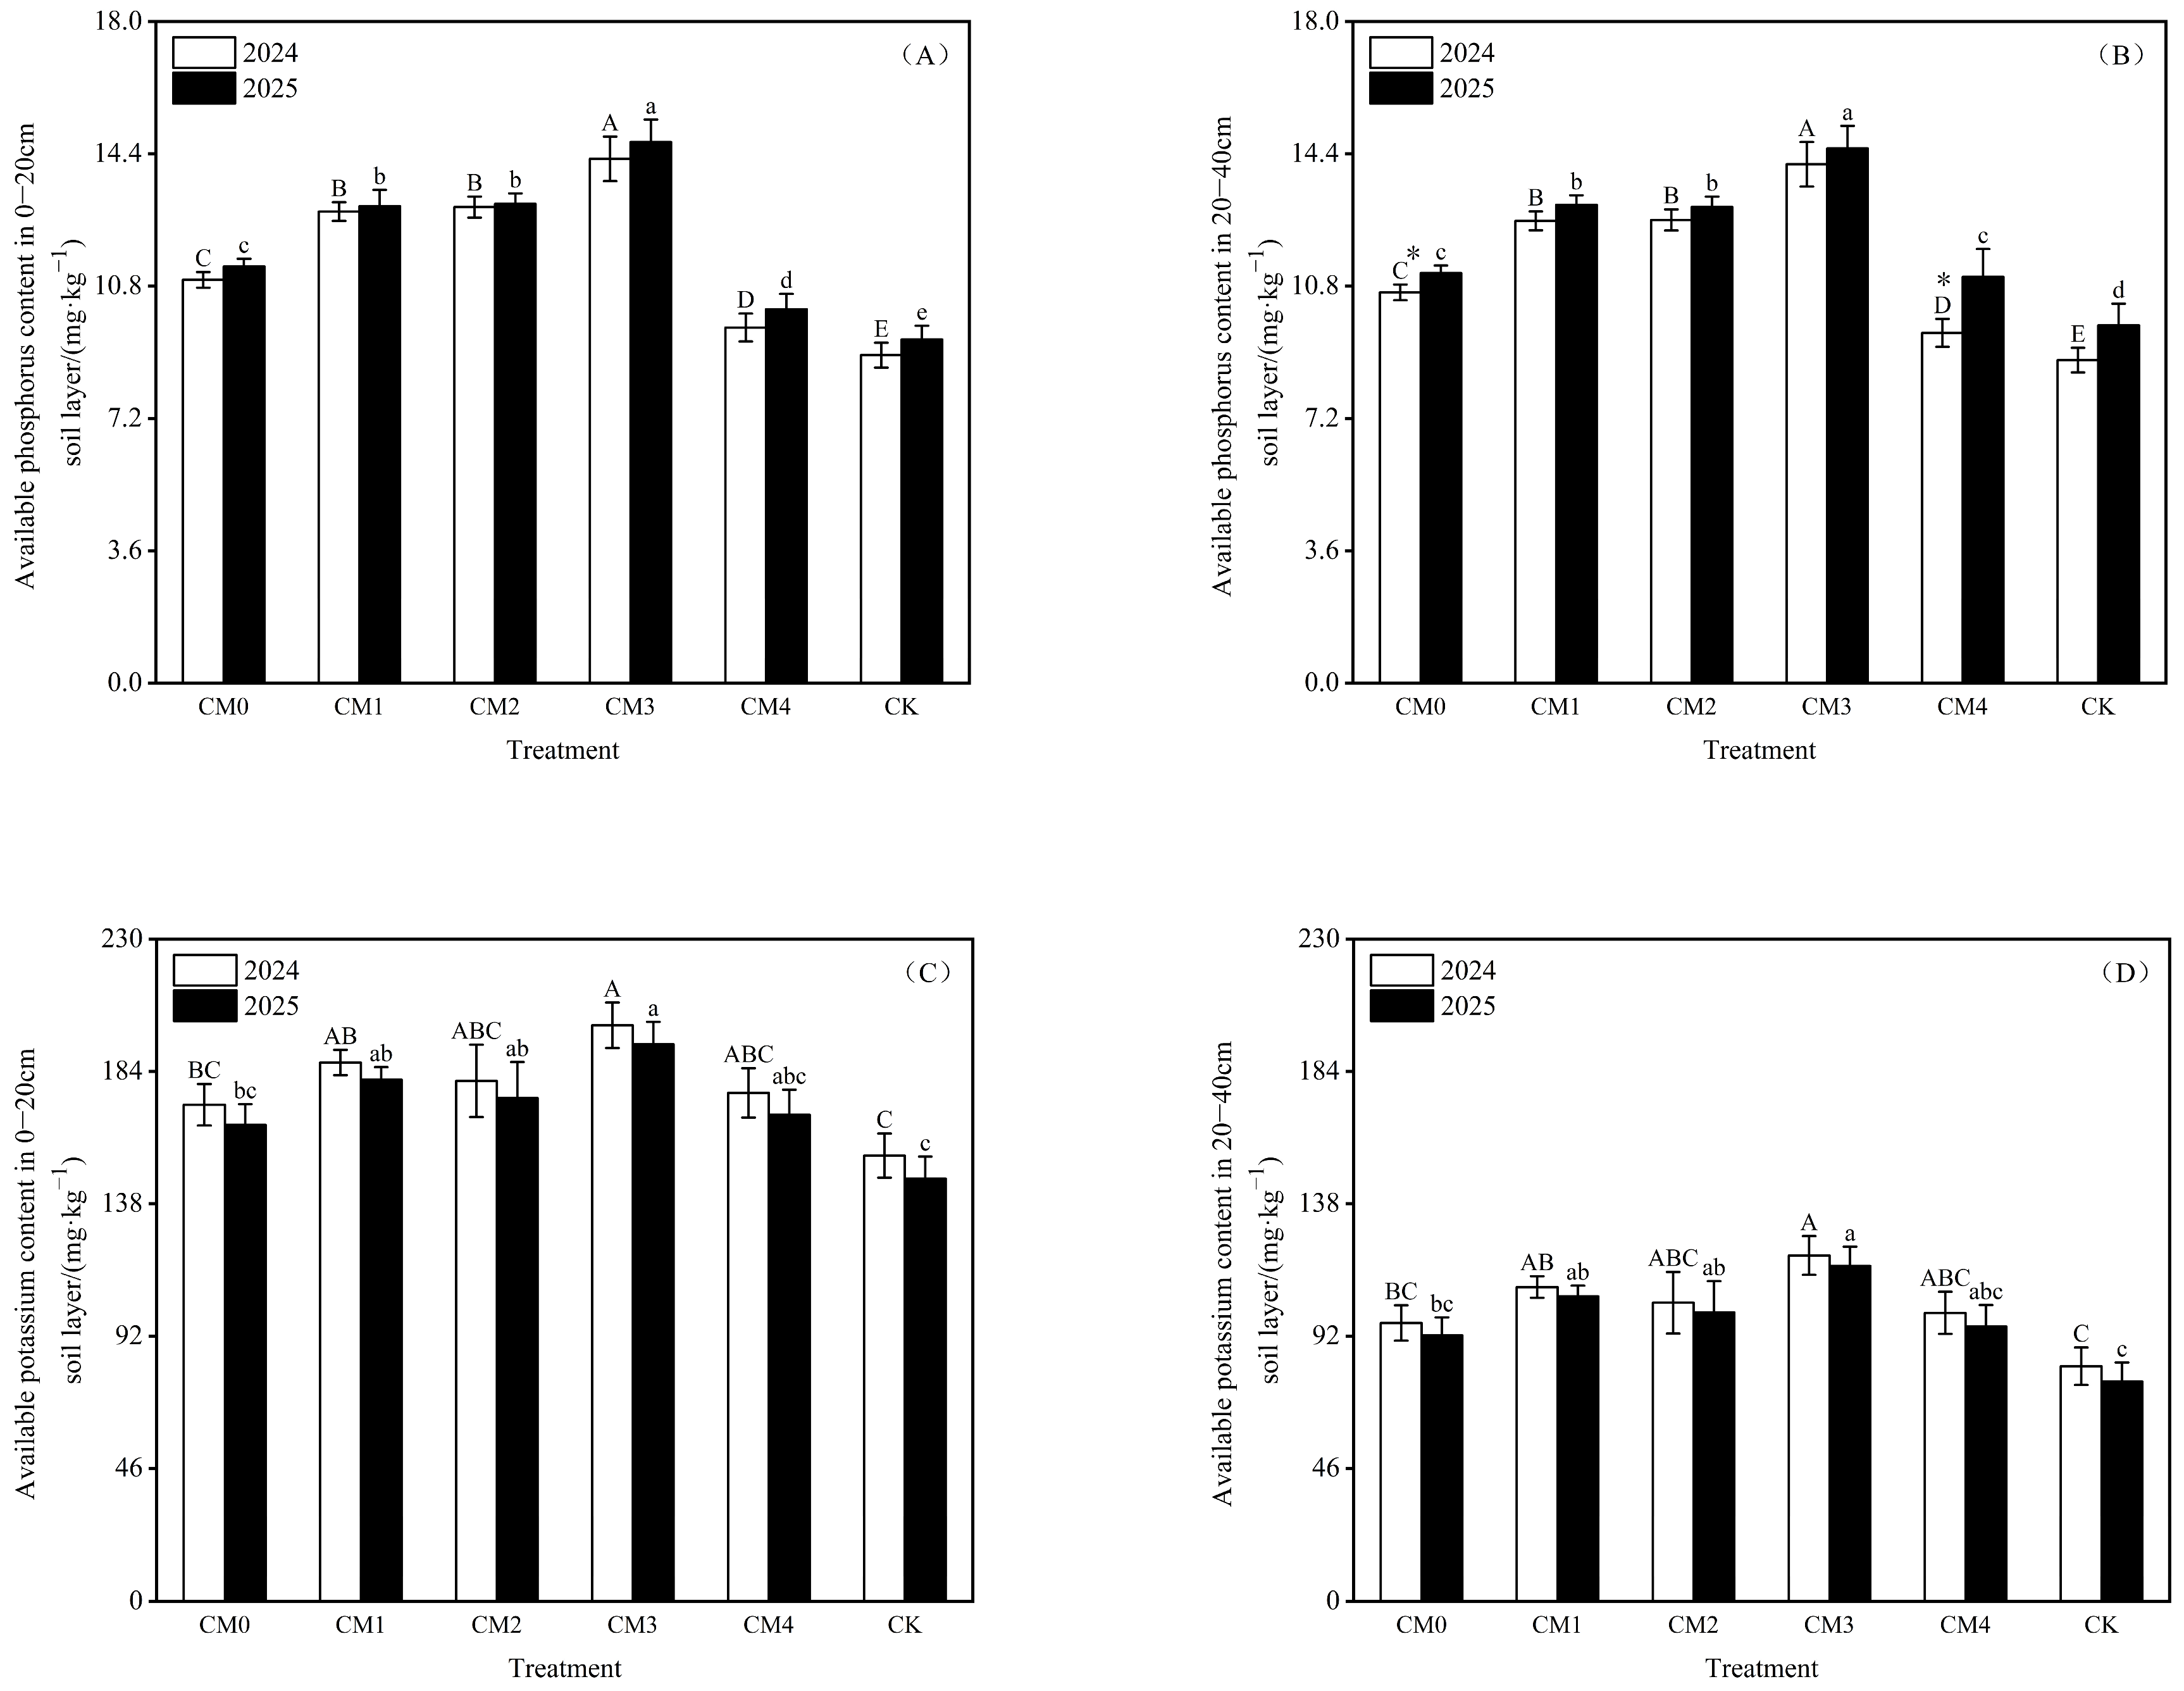
The effects of different ratios of cattle manure organic fertilizer combined with chemical fertilizer on soil available phosphorus and available potassium contents in alfalfa varied significantly. As shown in Figure 4A, in the 0–20 cm soil layer, soil available phosphorus content under CM3 was significantly higher than that under all other treatments in both years (p < 0.05), reaching 14.26 and 14.72 mg·kg−1 in 2024 and 2025, respectively. No significant difference was observed between CM1 and CM2; However, both exhibited significantly higher available phosphorus contents than CM0, CM4, and CK (p < 0.05). In the 20–40 cm soil layer, the CM3 treatment also showed the highest soil available phosphorus content in both years (14.11 and 14.55 mg·kg−1), whereas the CK consistently exhibited the lowest values (Figure 4B). Compared with 2024, soil available phosphorus content in CM0 and CM4 increased significantly in 2025.
As shown in Figure 4C, in the 0–20 cm soil layer, soil available potassium content was highest under the CM3 treatment in both years, reaching 200.03 and 193.43 mg·kg−1, respectively, and lowest under the CK (154.72 and 146.72 mg·kg−1, respectively). A similar pattern was observed in the 20–40 cm soil layer, where the CM3 treatment yielded the highest available potassium contents in both years (120.02 and 116.35 mg·kg−1), while the CK showed the lowest values (Figure 4D). Overall, the combined application of organic and chemical fertilizers enhanced soil available phosphorus and available potassium, with the 25% cattle manure plus 75% chemical fertilizer (CM3) treatment demonstrating the most pronounced effect. These results clearly demonstrate that the combined application of organic and chemical fertilizers effectively improves soil available nutrient contents. Among all treatments, CM3 (25% cattle manure + 75% chemical fertilizer) exhibits the most significant improvement in soil available phosphorus and available potassium, indicating that this ratio is optimal for enhancing soil fertility and nutrient supply capacity in the present study.

3.2.3. Soil Organic Matter Content

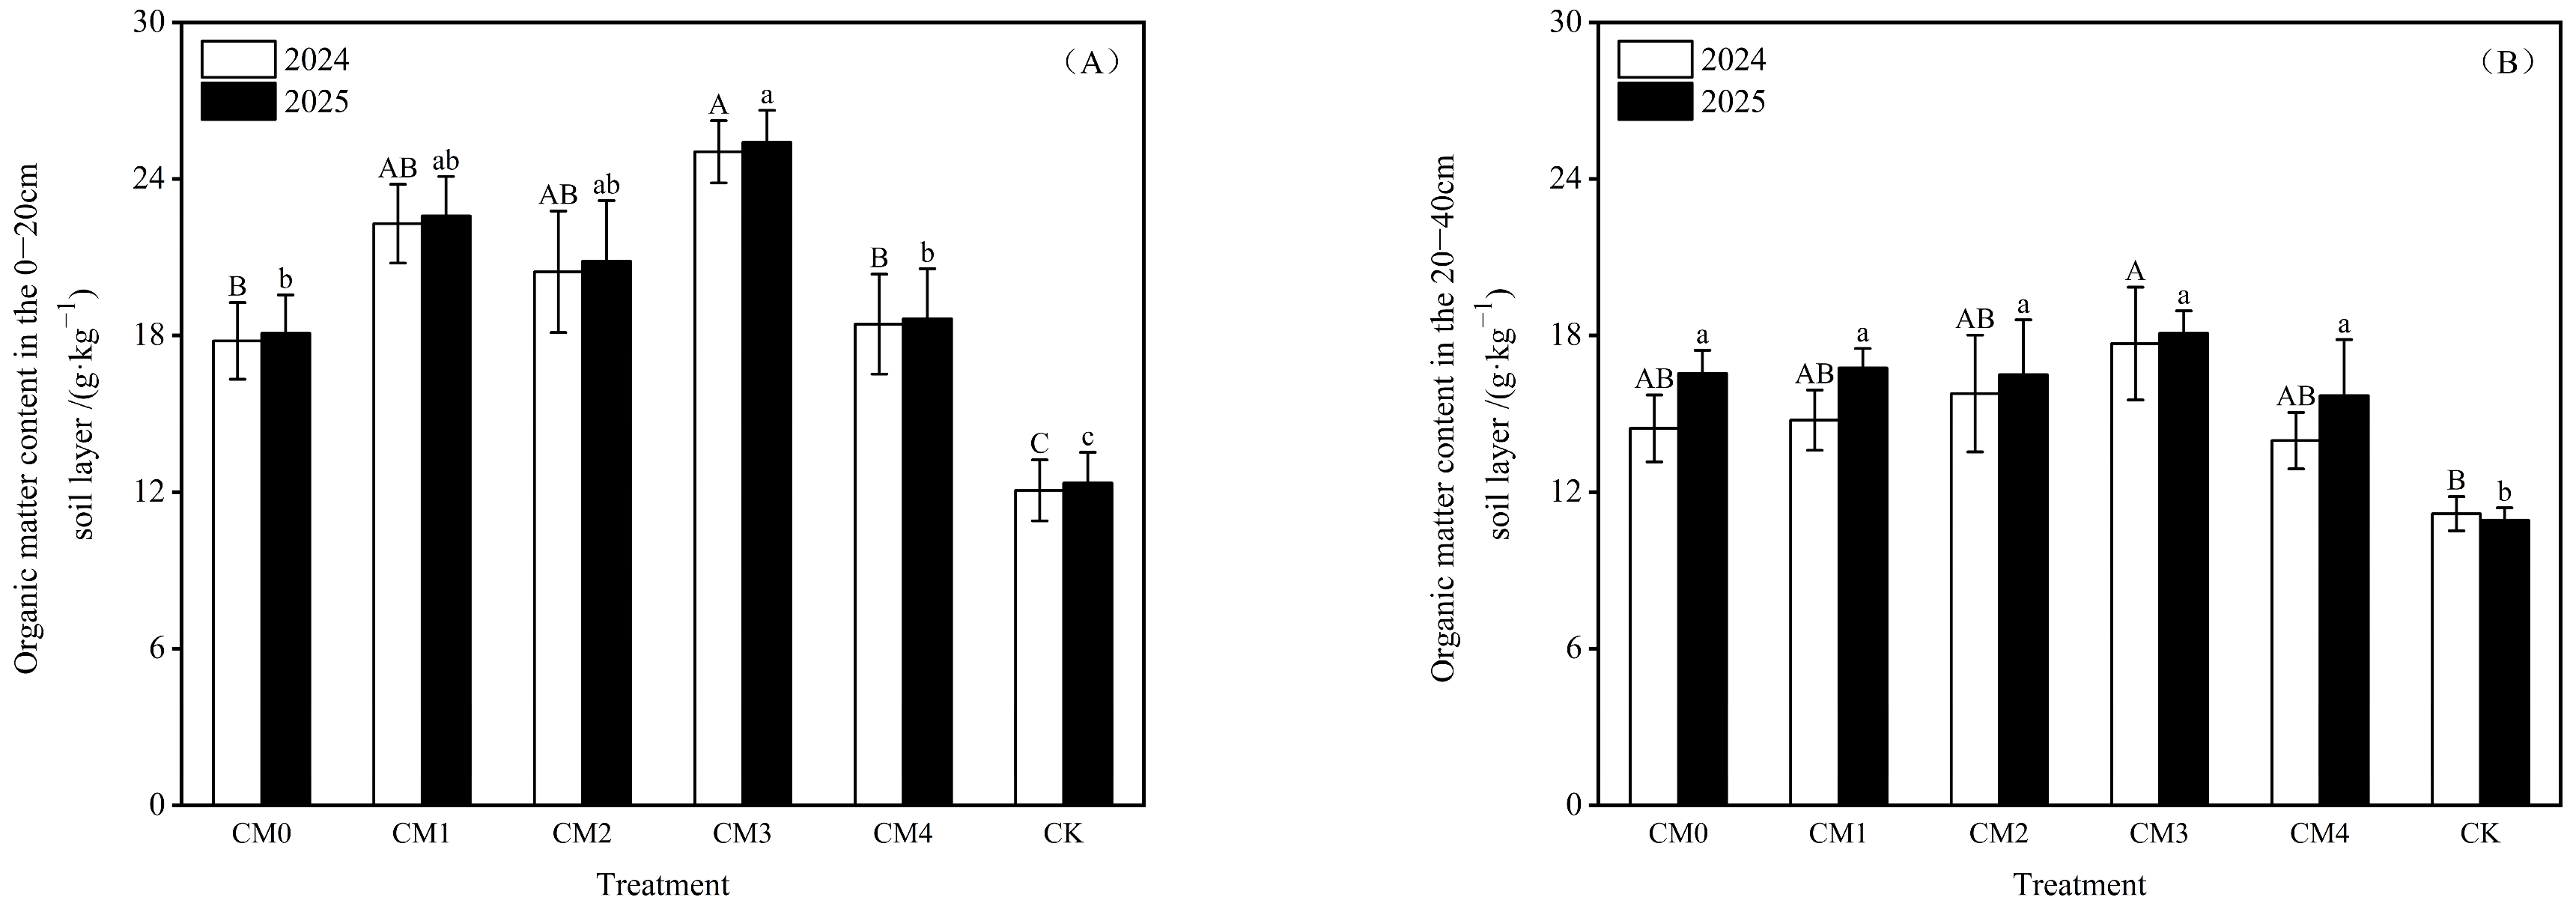
The application of different ratios of cattle manure organic fertilizer combined with chemical fertilizer had significant effects on soil organic matter content in alfalfa (Figure 4). In the 0–20 cm soil layer, the CM3 treatment resulted in the highest soil organic matter content in both years, reaching 25.04 and 25.40 g·kg−1 in 2024 and 2025, respectively. Soil organic matter contents under all fertilization treatments were significantly higher than those under the CK treatment (p < 0.05) (Figure 5A).
As shown in Figure 5B, in the 20–40 cm soil layer, no significant differences in soil organic matter content were observed among the CM3, CM0, CM1, CM2, and CM4 treatments in either year. However, in 2025, all fertilization treatments exhibited significantly higher soil organic matter content than the CK (p < 0.05). Overall, the combined application of organic and chemical fertilizers effectively increased soil organic matter content, with the 25% cattle manure plus 75% chemical fertilizer (CM3) treatment showing the most pronounced improvement.

3.3. Effects of Organic Fertilizer Combined with Chemical Fertilizer on Enzyme Activity

3.3.1. Soil Enzyme Activity

The application of different ratios of cattle manure organic fertilizer combined with chemical fertilizer had significant effects on soil nitrate reductase (NR) and nitrite reductase (NiR) activities (Table 3). In 2024, soil NR activity was highest under CM3, reaching 0.49 μmol·g−1·24 h−1. No significant differences were observed among CM0, CM1, CM2, and CM4; however, all fertilization treatments exhibited significantly higher NR activity than the CK (p < 0.05). In 2025, soil NR activity further increased, with the highest value recorded under the CM3 treatment (0.65 μmol·g−1·24 h−1). No significant differences were detected among the CM0, CM1, CM2, and CM4 treatments, while the CK consistently showed the lowest activity. Compared with 2024, soil NR activity increased extremely significantly (p < 0.01) across all treatments in 2025.
In 2024, soil NiR activity was highest in the CM3 treatment, reaching 14.49 μmol·g−1·24 h−1. No significant differences were observed among the CM0, CM1, CM2, CM3, and CM4 treatments, but all fertilization treatments showed significantly higher NiR activity than the CK (p < 0.05). In 2025, soil NiR activity under the CM3 treatment was significantly higher than that under all other treatments (p < 0.05), reaching 10.16 μmol·g−1·24 h−1. All fertilization treatments exhibited significantly higher NiR activity than the CK (p < 0.05). Compared with 2024, soil NiR activity across all treatments decreased extremely significantly (p < 0.01) in 2025. These results demonstrate that rational combined application of organic and chemical fertilizers effectively improves soil nitrogen metabolism enzyme activities, and the CM3 treatment presents the best comprehensive performance.

3.3.2. Root Enzyme Activity

Different ratios of cattle manure organic fertilizer combined with chemical fertilizer exerted significant effects on glutamate synthase (GOGAT) and glutamine synthase (GS) activities in alfalfa root systems (Table 3). In 2024, root GOGAT activity was highest under CM3, reaching 132.32 U·g−1 fresh weight, and was higher than that of the CK under CM1, CM2, and CM3. In 2025, GOGAT activity under the CM3 treatment increased markedly to 699.84 U·g−1 fresh weight, significantly exceeding all other treatments (p < 0.05). Compared with 2024, GOGAT activity increased extremely significantly (p < 0.01) across all treatments in 2025.
In 2024, root GS activity did not differ significantly among treatments, with the highest value of 10.16 U·g−1 fresh weight observed under CM3. In 2025, GS activity peaked under CM3 at 12.24 U·g−1 fresh weight, significantly higher than all other treatments (p < 0.05). Compared with 2024, GS activity increased significantly under CM2 and CM3, whereas it decreased significantly under the remaining treatments (p < 0.05). Overall, the combined application of organic and chemical fertilizers significantly enhanced the activity of key enzymes involved in root nitrogen metabolism, thereby strengthening nitrogen uptake, reduction, and assimilation processes. Among all treatments, the 25% cattle manure plus 75% chemical fertilizer (CM3) treatment demonstrated the most pronounced effects on enzyme activation and nitrogen metabolic efficiency.

3.4. The Effect of Fertilization on Soil Microbial Properties

3.4.1. Alpha Diversity

The application of different ratios of cattle manure organic fertilizer combined with chemical fertilizer had significant effects on soil microbial α-diversity (Table 4). The Shannon and Simpson indices were employed to characterize species diversity and reflect community evenness. In 2024, CM3 presented the highest Shannon and Simpson values, at 7.52 and 0.98, respectively. No significant differences were detected among the CM0, CM1, CM2, and CM4 treatments. The CK showed the lowest Shannon and Simpson indices (6.86 and 0.94, respectively), indicating that the absence of fertilization reduced microbial community evenness. In 2025, CM3 again achieved the highest Shannon and Simpson indices, at 6.23 and 0.89, respectively, with no significant differences observed among the other fertilization treatments. The CK again yielded the lowest diversity levels. Relative to 2024, the Shannon index decreased extremely significantly across all treatments in 2025 (p < 0.01). The Simpson index declined significantly in CM4 (p < 0.05) and extremely significantly in all remaining treatments (p < 0.01). Overall, the combined application of organic and chemical fertilizers enhanced the stability and diversity of soil microbial communities, with the 25% cattle manure + 75% chemical fertilizer (CM3) treatment performing optimally in maintaining community structural evenness.
The Ace and Chao1 indices were used to evaluate soil microbial species richness. In 2024, CM3 exhibited the greatest species richness, with Ace and Chao1 values of 2848.74 and 2910.03, respectively, followed by CM2 and CM1. The CK displayed the lowest species richness, suggesting that fertilization significantly enlarged the soil microbial species pool. In 2025, the highest species richness was still recorded in CM3, with Ace and Chao1 indices of 2526.30 and 2573.56, respectively. No significant differences were found among the CM0, CM1, CM2, and CM4 treatments. The CK maintained the lowest richness, with Ace and Chao1 values of 2091.52 and 2145.51, respectively. Compared with 2024, both the Ace and Chao1 indices in CM3 decreased significantly in 2025 (p < 0.05). Long-term application of chemical fertilizer alone or no fertilization is detrimental to sustaining the stability of the soil microbial species pool. The combined application of organic and chemical fertilizers significantly improved the α-diversity of the soil microbial community in the alfalfa system, including enhanced community diversity, optimized community structure, and elevated species richness. Among all treatments, the 25% cattle manure plus 75% chemical fertilizer (CM3) regime showed the most beneficial effect in improving soil microbial α-diversity. A reasonable organic–chemical fertilizer ratio establishes a more favorable soil microenvironment, which supports the proliferation and development of soil microbial communities. In conclusion, the combined application of organic and chemical fertilizers significantly improves soil microbial α-diversity, and the CM3 ratio of 25% organic plus 75% chemical fertilizer performs the best in optimizing soil microbial community structure and stability.

3.4.2. Beta Diversity

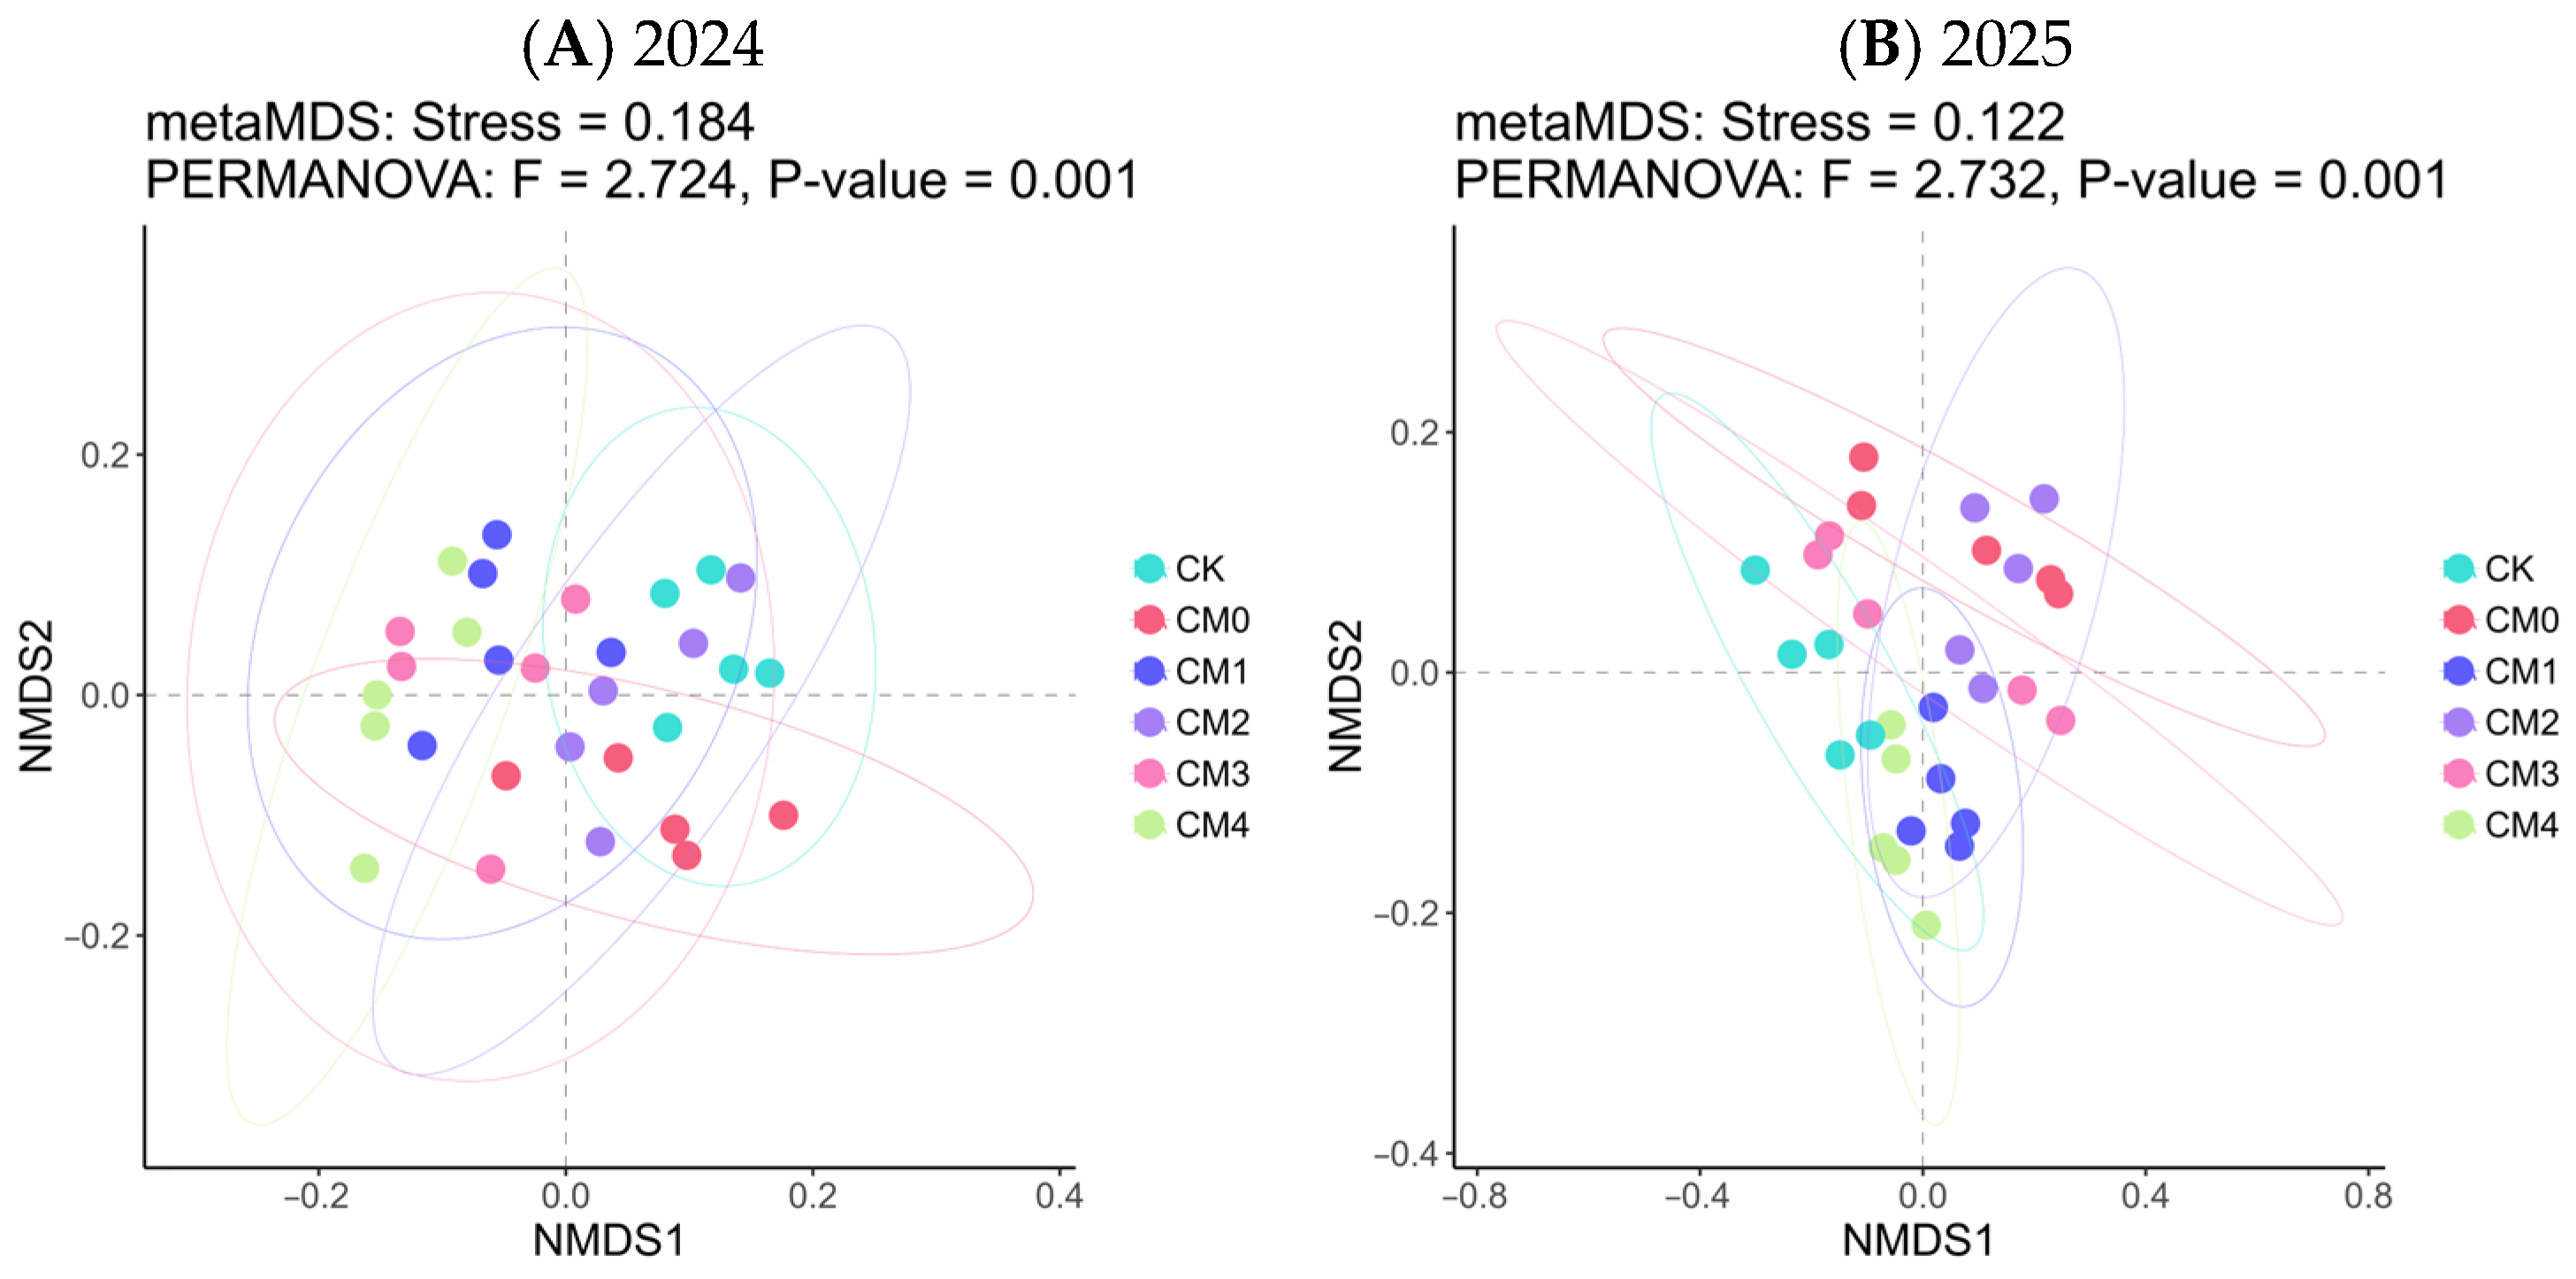
β-diversity reflects the degree of variation in species composition among biological communities across different fertilization treatments. As depicted in Figure 6A, the stress value of non-metric multidimensional scaling (NMDS) ordination in 2024 was 0.184, which fell within the range of 0.1 to 0.2, indicating acceptable ordination reliability. Permutational multivariate analysis of variance (PERMANOVA) revealed an F-value of 2.724 and a p-value of 0.001 (p < 0.05), confirming significant differences in soil bacterial community structure among the different fertilizer application treatments.
Among the six treatments, sample points of CK were distinctly isolated from those of the other fertilization treatments, concentrating in the upper-right quadrant of the ordination space. In contrast, sample points of the CM0, CM1, CM2, CM3, and CM4 treatments were relatively clustered in the middle to lower-left quadrant of the ordination space, showing clear separation from the CK. Compared with 2024, the NMDS ordination plot in 2025 revealed a significant shift in bacterial community structure. The stress value of NMDS ordination in 2025 decreased to 0.122, indicating more accurate and reliable data representation than that in 2024. The PERMANOVA test yielded an F-value of 2.732 and a p-value of 0.001, confirming extremely significant differences in community structure among the treatments (Figure 6B). Additionally, the aggregation of sampling points within each treatment group generally increased, suggesting that after one year of continuous cropping, the soil microbial community structures under the same fertilization treatment became more similar and stable.

3.4.3. Soil Bacterial Composition

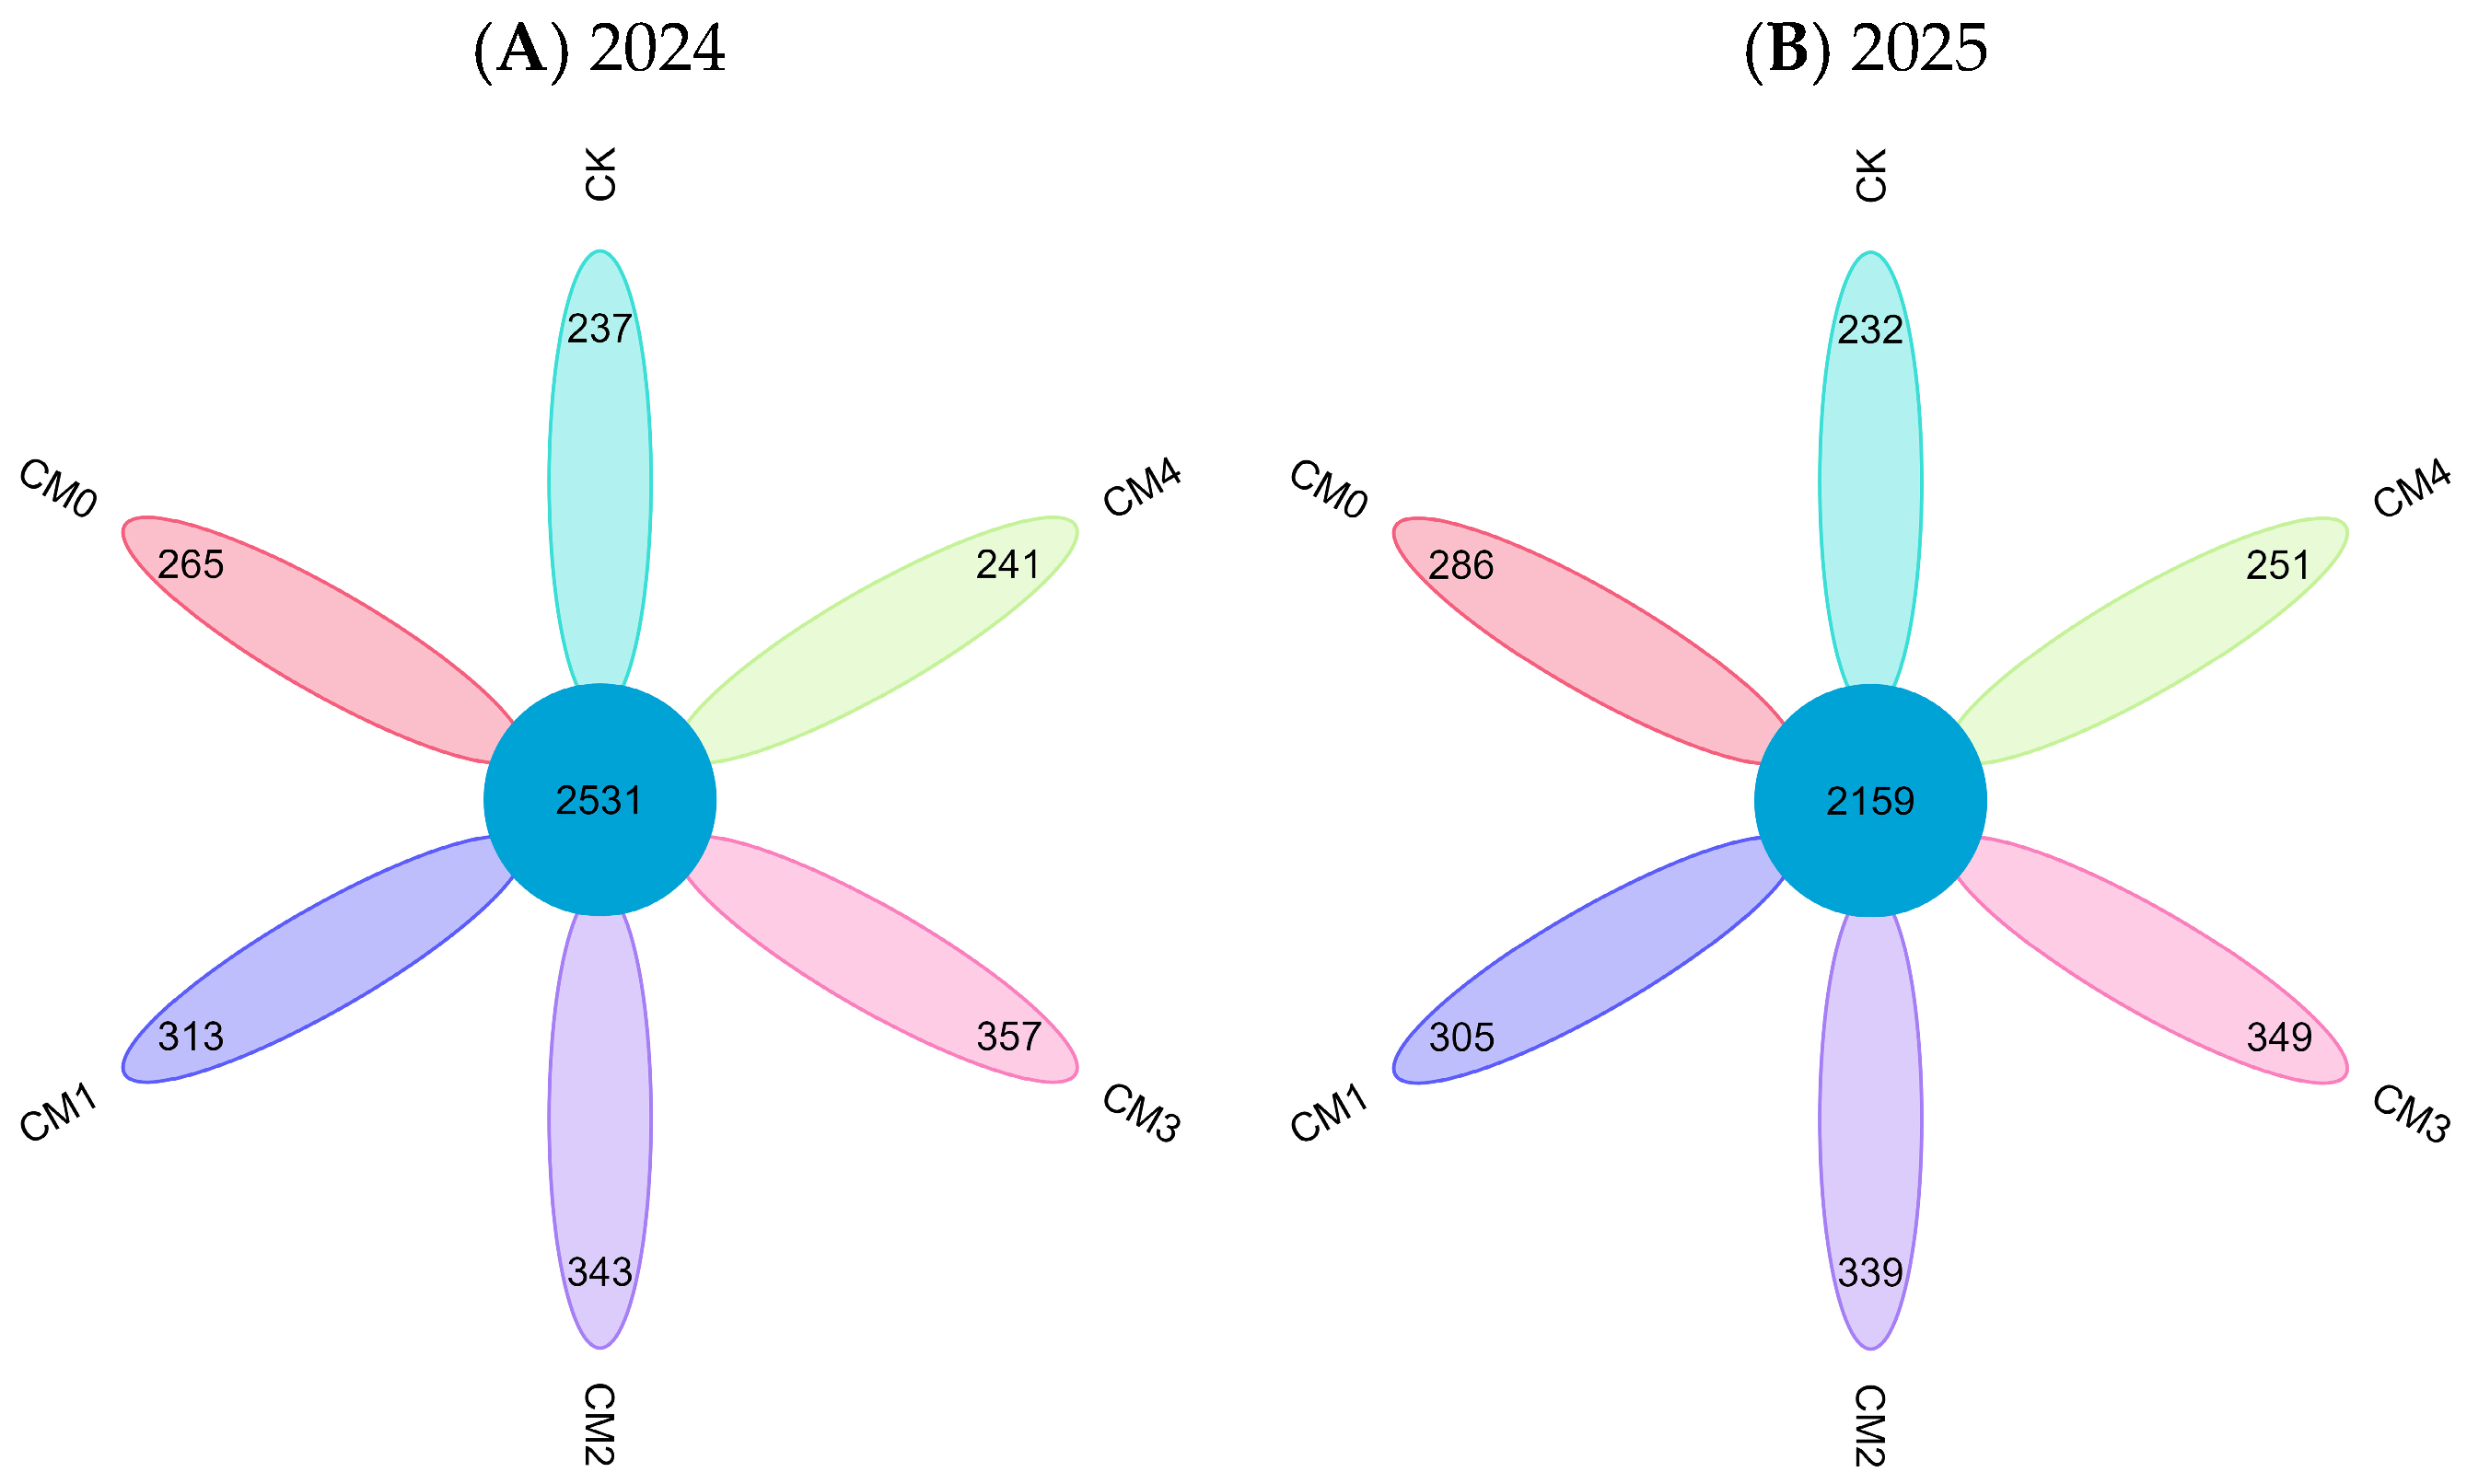
Venn diagram analysis was performed to characterize soil bacterial community composition in alfalfa fields under different fertilization treatments. In Figure 7, distinct colors represent the number of operational taxonomic units (OTUs) within each treatment, and overlapping regions denote shared OTUs across groups. For post-harvest soil samples collected in 2024, a total of 2531 OTUs were shared by all six treatments. The CK possessed the lowest number of unique OTUs (237), whereas CM3 had the highest (357), followed by CM2. These results demonstrated that the combined organic and chemical fertilizer treatments (CM3 and CM2) significantly elevated the quantity of soil unique bacterial OTUs (Figure 7A). Relative to 2024, the number of OTUs shared by the six treatments in 2025 post-harvest soils decreased to 2159. The number of unique OTUs for CM4, CM3, CM2, CM1, CM0, and CK was 251, 349, 339, 305, 286, and 232, respectively. Consistently, the CM3 treatment harbored the greatest number of unique OTUs, while CK displayed the lowest. Compared with CK, CM0, and CM4, the combined fertilization treatments significantly increased OTU richness (Figure 7B). These findings suggested that fertilization regimes enhanced the number of unique taxa in soil bacterial communities, with the application of 25% cow manure combined with 75% chemical fertilizer (CM3) exerting the most prominent effect.

3.4.4. Soil Microbial Community Structure

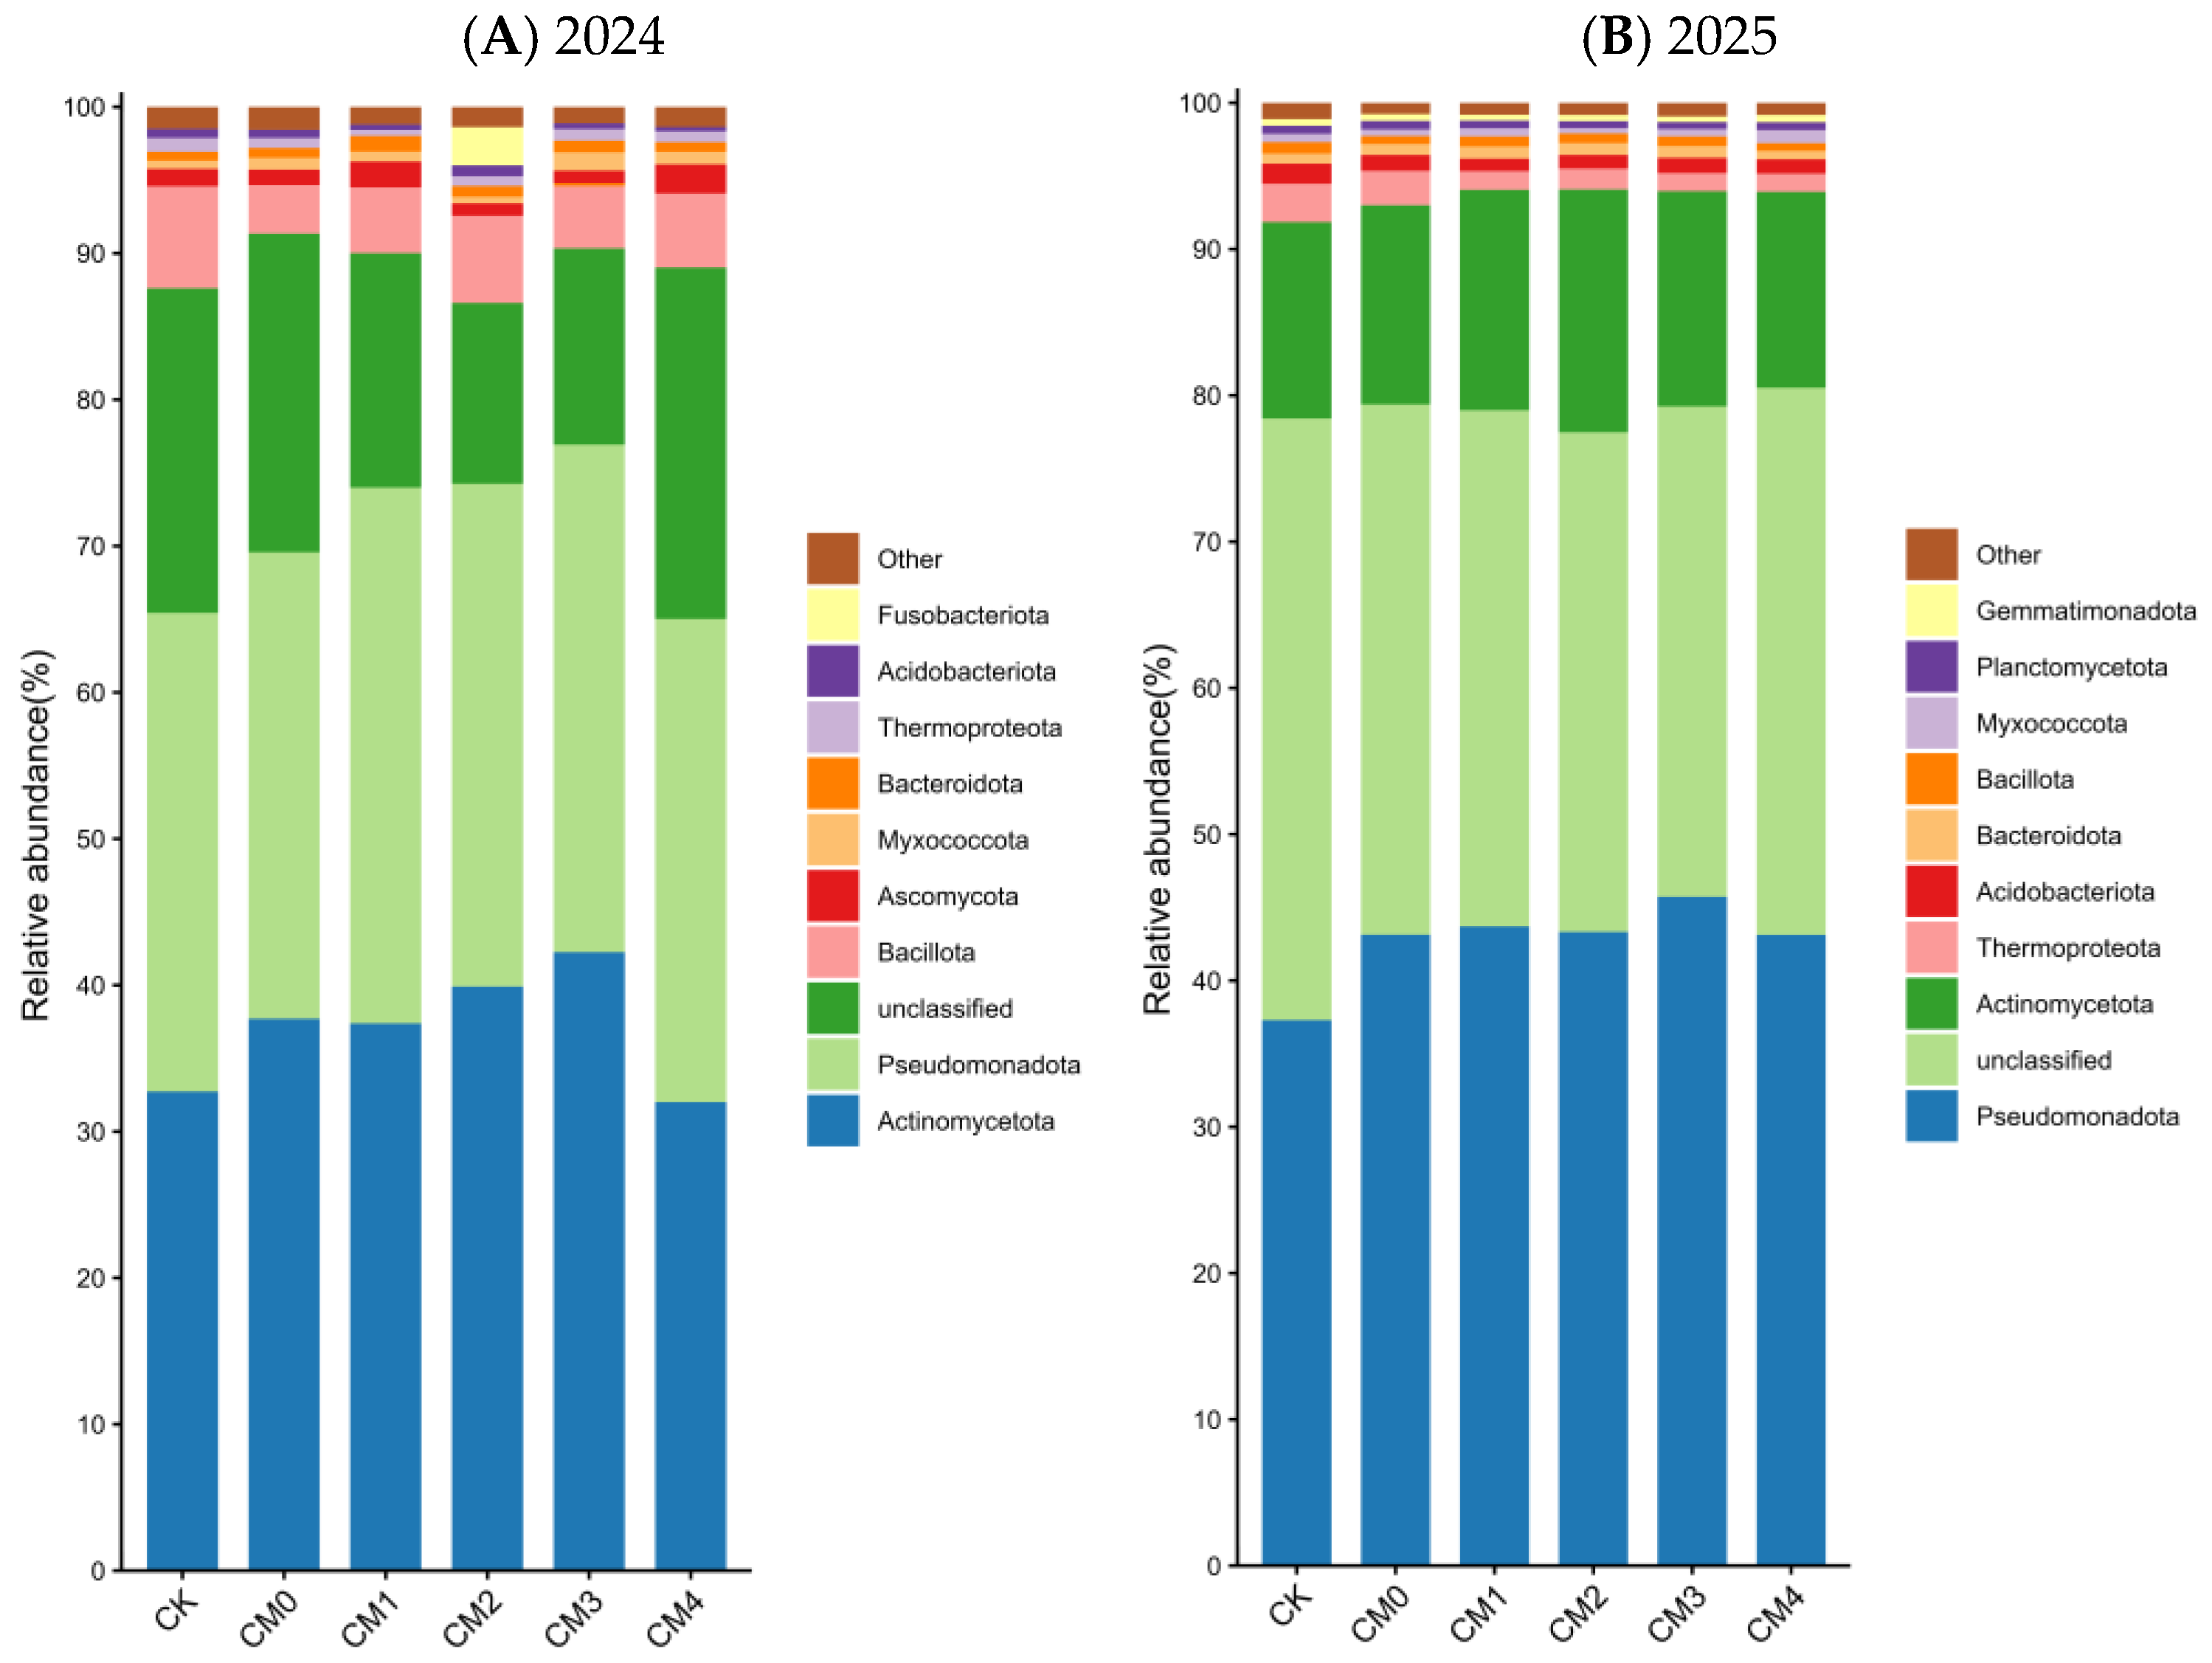
The application of organic fertilizer combined with chemical fertilizer significantly influenced the community structure of soil bacterial communities at the phylum level, with pronounced variations in relative abundance across treatments. Across both years, the dominant phyla were Actinomycetota, Pseudomonadota, Bacteroidota, and Bacillota. In 2024 (Figure 8A), Actinomycetota exhibited the highest relative abundance under the CM3 treatment (42.25%), followed by CM1 (39.90%) and CM2 (37.39%). Pseudomonadota showed the highest relative abundance in CM3 (35.34%) and CM2 (34.35%). Bacillota was most abundant in the CK treatment (7.47%), followed by CM2 (6.96%) and CM3 (4.48%). Bacteroidota showed the highest relative abundance in CM1 (0.81%), followed by CM3 (0.75%). In 2025 (Figure 8B), Pseudomonadota dominated across all treatments, with the highest relative abundance observed in CM3. Actinomycetota were most abundant in CM2 (16.60%), followed by CM1 (15.06%) and CM3 (14.71%). Bacillota and Bacteroidota displayed relatively uniform abundances across treatments, with no significant differences. These results indicate that fertilization strategy significantly affects the relative abundance of dominant microbial phyla in alfalfa soils. Among the treatments, the 25% cattle manure plus 75% chemical fertilizer (CM3) consistently promoted higher relative abundances of multiple key microbial phyla, suggesting that this combination fosters a more functionally diverse and balanced microbial community.
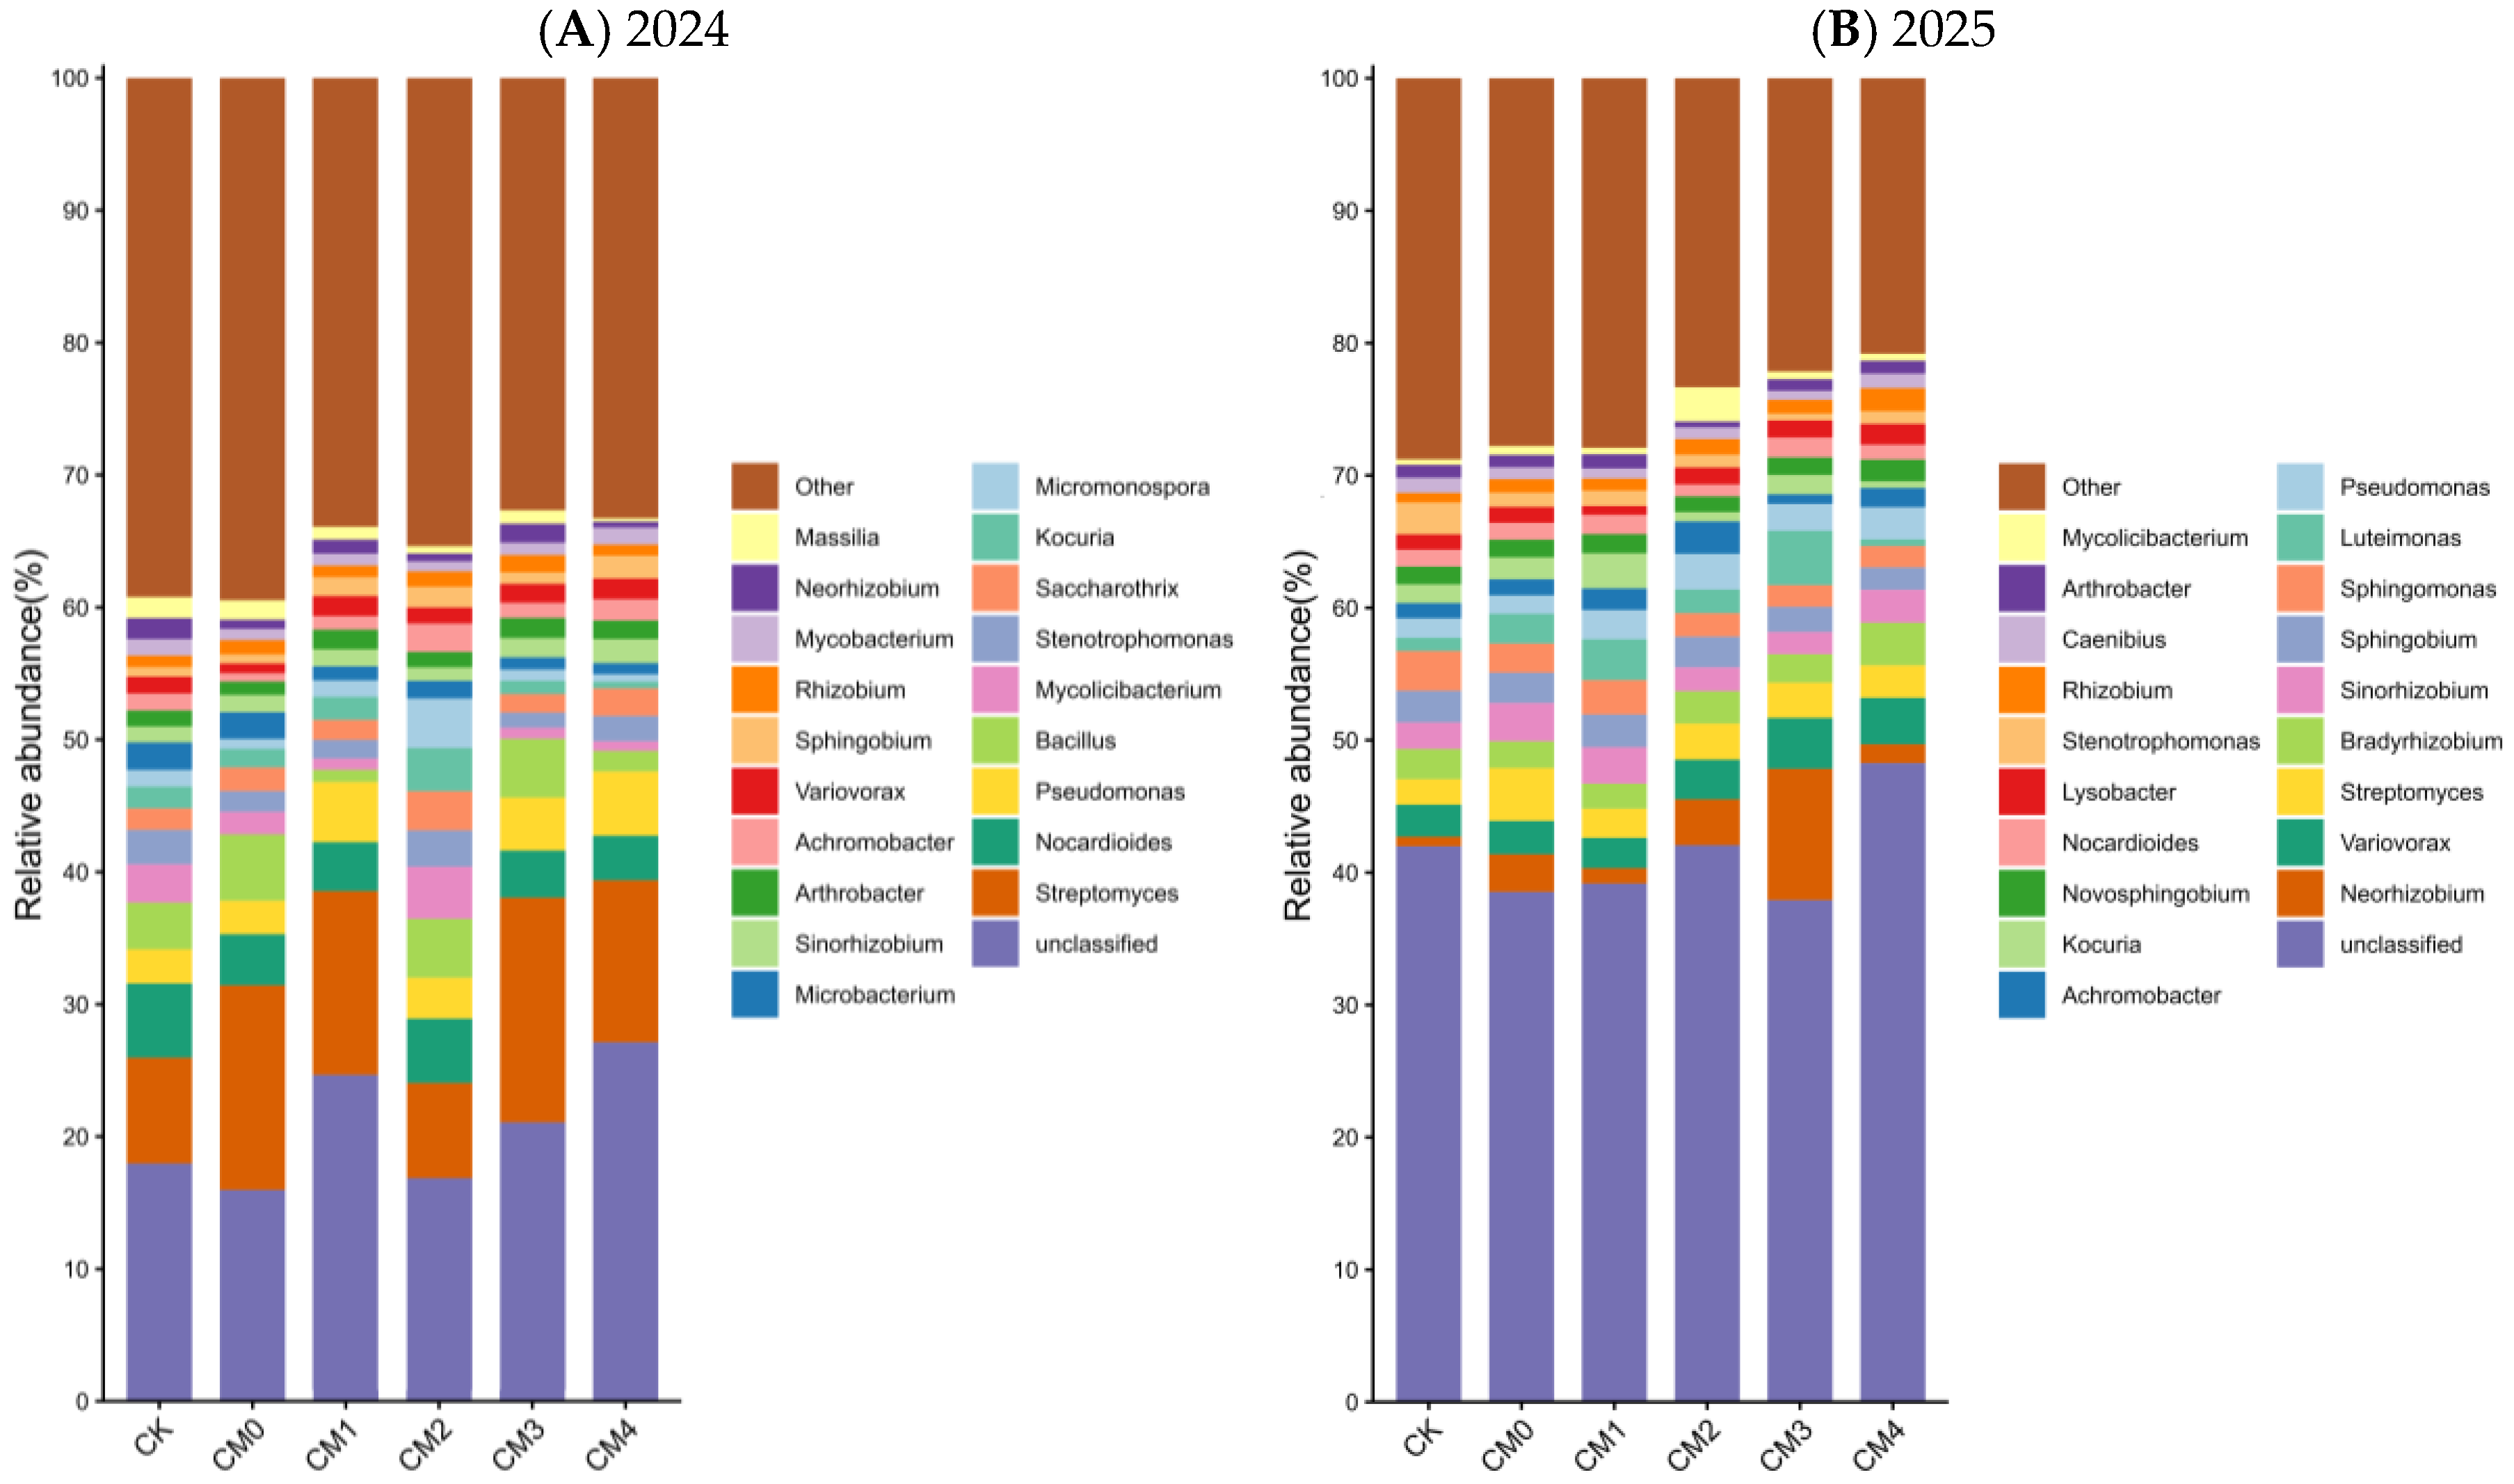
The combined application of organic and chemical fertilizers significantly influenced the genus-level composition of soil microbial communities in alfalfa, resulting in notable differences in relative abundance among dominant taxa. In 2024 (Figure 9A), the bacterial genera Streptomyces, Bacillus, Pseudomonas, and Neorhizobium were dominant across treatments. Streptomyces exhibited the highest relative abundance in CM3 (16.93%). Bacillus showed relatively high abundances in CM0, CM2, and CM3 (5.01%, 3.37%, and 3.52%, respectively), but the lowest in CK (2.33%). Pseudomonas had elevated abundances in CM1, CM3, and CM4 (4.85%, 4.01%, and 4.55%, respectively), while Neorhizobium peaked in CM3 (1.59%) and was lowest in CM4 (0.46%). In 2025 (Figure 9B), Neorhizobium, Streptomyces, Bradyrhizobium, Sinorhizobium, and Pseudomonas remained abundant across treatments. Neorhizobium had the highest relative abundance under CM3 (9.92%), while Streptomyces peaked in CM0 (3.99%), with no significant differences among other treatments. Bradyrhizobium and Sinorhizobium showed no significant differences across treatments, whereas Pseudomonas was abundant in CM1, CM2, CM3, and CM4. Overall, the 25% cattle manure plus 75% chemical fertilizer (CM3) treatment consistently enhanced the relative abundance of several key bacterial and fungal genera, suggesting that this fertilization strategy supports both microbial diversity and ecosystem function in alfalfa soils.

4. Discussion

4.1. The Combined Application of Organic and Chemical Fertilizers Significantly Enhances Alfalfa Yield

In this study, the rational combination of organic and chemical fertilizers significantly improved alfalfa hay yield, with the 25% cow manure plus 75% chemical fertilizer (CM3) treatment showing the most prominent effect. Specifically, the hay yields under the CM3 treatment were 11,395.72 kg·hm−2 and 17,023.54 kg·hm−2 in 2024 and 2025, respectively, which were 38.03% and 40.85% higher than those in the control group (CK). Hay yield is an important indicator for evaluating forage growth performance [27]. Fertilization is a key factor affecting forage growth; appropriate fertilization regimes can supply necessary nutrients for forage plants and effectively promote their growth and development [28]. Previous studies have consistently demonstrated that organic–inorganic fertilization can enhance alfalfa yield. For example, Yang et al. [29] reported in their study on alfalfa production in Hebei Province that, compared with the no-fertilization control, the application of chemical fertilizers alone or organic–inorganic mixed fertilizers significantly increased the dry matter yield of alfalfa. Similarly, Bai et al. [30] demonstrated that organic–inorganic fertilization significantly improved alfalfa plant height and hay yield relative to the no-fertilization control. In the western Songnen Plain, the combined application of 70% organic fertilizer and 30% chemical fertilizer was also found to significantly enhance alfalfa hay yield [31].
Our results are consistent with these previous findings, confirming that the rational combination of organic and chemical fertilizers exerts a significant positive effect on alfalfa yield. However, the optimal ratio of organic to inorganic fertilizers for promoting alfalfa growth varies considerably across different regions. In our study, the CM3 treatment (25% organic + 75% chemical) was most effective, whereas other studies reported optimal ratios ranging from 30% to 70% organic fertilizer [29,31]. This discrepancy may be attributed to regional differences in soil type and climatic conditions. Notably, soils in Xinjiang are predominantly sandy or sandy loam, which have good aeration but poor water and fertilizer retention capacities. This soil characteristic requires alfalfa plants to efficiently utilize water and nutrients, thereby highlighting the importance of optimizing the organic–inorganic fertilization ratio to match the local soil conditions and maximize alfalfa hay yield. The superior performance of the CM3 treatment (25% organic fertilizer + 75% chemical fertilizer) can be attributed to the synergistic effects of organic and inorganic nutrient sources. Chemical fertilizers provide readily available nutrients that can be rapidly absorbed by plants, thereby supporting early growth and biomass accumulation. In contrast, organic fertilizers release nutrients more gradually through microbial decomposition, improving long-term nutrient availability and soil fertility [32]. In addition, organic amendments enhance soil structure, increase water retention capacity, and stimulate microbial activity. The combination of these effects creates a more favorable soil environment for root development and nutrient uptake [33]. Therefore, the CM3 treatment achieves an optimal balance between immediate nutrient supply and sustained nutrient release, leading to enhanced alfalfa productivity.

4.2. Effects of Organic and Chemical Fertilizer Application on Soil Nutrients

In the present study, the combined application of organic and chemical fertilizers significantly improved soil nutrient availability in the alfalfa cultivation system, with the CM3 treatment (25% cattle manure + 75% chemical fertilizer) exerting the most pronounced effect. Specifically, in the 0–20 cm soil layer, relative to 2024, the CM3 treatment increased total nitrogen, alkali-hydrolyzable nitrogen, available phosphorus, readily available potassium, and soil organic matter contents by 38.47%, 29.85%, 3.22%, 3.41%, and 1.44%, respectively, in 2025. These results indicated that a rational organic–inorganic fertilizer combination could effectively enhance the accumulation of soil organic matter and key macronutrients, and its improvement effect on soil nutrient status was superior to single chemical fertilizer application (CM4) and the no-fertilizer control (CK), laying a nutrient foundation for alfalfa growth and yield improvement.
Soil nutrients are critical determinants of crop growth, with the three primary macronutrients—nitrogen (N), phosphorus (P), and potassium (K)—directly influencing soil fertility and crop yield [34]. Nitrogen is essential for plant growth, participating in the synthesis of proteins, enzymes, and chlorophyll, thereby playing a central role in development. Phosphorus is a key element for energy transfer, contributing to root development, pollen formation, and stress tolerance. Potassium regulates plant water balance and enhances resilience to adverse conditions [35,36,37,38]. Optimizing the availability of these nutrients is therefore crucial for improving crop yield and quality.
Previous studies have widely confirmed the positive effects of organic–inorganic fertilizer combinations on improving soil nutrient status. Wang et al. [14] reported that the application of 75% chemical fertilizer combined with 25% organic fertilizer significantly improved soil quality indices of cotton fields. Yang et al. [39] found that a 50:50 organic–inorganic fertilizer ratio achieved the best comprehensive benefits in terms of soil nutrient accumulation and crop growth. Ma Zhao et al. [19], in a study across six major alfalfa-producing regions in China, observed that soils applied with organic–inorganic compound fertilizers had higher contents of available N, P, K, and organic matter than those receiving chemical fertilizer alone. Li et al. [40] also showed that partial replacement of chemical fertilizer with organic fertilizer effectively improved soil nutrient status, increasing soil organic matter, total nitrogen, total phosphorus, and available phosphorus by 21.77%, 4.08%, 14.29%, and 25%, respectively, compared with full chemical fertilization. Our results are consistent with these previous findings, further verifying that the combined application of organic and chemical fertilizers is an effective measure to improve soil nutrient availability. The superior performance of the CM3 treatment in our study is closely related to the synergistic effect of organic and inorganic fertilizers: chemical fertilizers provide rapidly available nutrients for alfalfa and soil microbes, while cattle manure supplements organic matter, optimizes soil structure, and promotes the slow release of nutrients, thus realizing the continuous supply of soil nutrients. Notably, while nitrogen, phosphorus, and organic matter remained relatively stable across soil depths, potassium exhibited a distinct depletion in the 20–40 cm horizon compared to the 0–20 cm surface layer. This phenomenon can be attributed to several key factors: Plant uptake and leaching characteristics: Potassium is a highly mobile nutrient in soil–plant systems. Alfalfa, as a deep-rooted perennial forage, has a strong demand for potassium and can actively absorb K+ from both surface and subsoil layers [41]. Additionally, excessive rainfall or irrigation may drive soluble potassium leaching from the 0–20 cm layer into deeper horizons, but subsequent uptake by deep roots or fixation by clay minerals in the 20–40 cm layer leads to its net depletion relative to the surface [42].
Organic matter and nutrient retention: The surface layer (0–20 cm) accumulates more organic matter from fertilization and crop residues, which forms stable complexes with potassium and reduces its leaching loss. In contrast, the 20–40 cm layer has lower organic matter content and weaker nutrient retention capacity, making potassium more susceptible to leaching or fixation, resulting in lower available potassium levels [43]. Fertilizer placement effect: In this study, fertilizers were primarily applied to the surface soil (0–20 cm), leading to higher potassium input and accumulation in the top layer. The subsoil (20–40 cm) received little direct nutrient input, and its potassium pool was mainly replenished via leaching from the surface, which was insufficient to offset plant uptake and fixation, thus causing depletion [44]. This vertical gradient in potassium availability highlights the importance of considering soil depth when evaluating nutrient management strategies for alfalfa systems.

4.3. Effects of Organic and Chemical Fertilizer Application on Enzyme Activity

In the present study, the combined application of organic and chemical fertilizers significantly enhanced the activities of key enzymes involved in nitrogen metabolism in alfalfa roots and soil, with the CM3 treatment (25% cattle manure + 75% chemical fertilizer) exhibiting the most pronounced effect. Specifically, in 2024, the activities of glutamate synthase (GOGAT) and glutamine synthase (GS) in alfalfa roots under the CM3 treatment reached 132.32 and 10.16 U·g−1 fresh weight, respectively, which were substantially higher than those in the unfertilized control (CK). By 2025, these activities further increased to 699.84 and 12.24 U·g−1 fresh weight, respectively, indicating that the rational organic–inorganic fertilization regime effectively activated root nitrogen-metabolizing enzymes and promoted nitrogen uptake, reduction, and assimilation in alfalfa. Enzyme activity is a critical physiological indicator reflecting soil nutrient transformation and plant nitrogen metabolism efficiency, which directly affects crop nutrient absorption and utilization [45,46]. In root nitrogen assimilation, glutamate synthase (GOGAT) and glutamine synthase (GS) play central roles in incorporating inorganic nitrogen into organic compounds, while soil nitrate reductase (NR) and nitrite reductase (NiR) are key enzymes catalyzing the reduction of nitrate to ammonium, thereby linking soil nitrogen availability to plant uptake [47,48].
Previous studies have consistently demonstrated that the combined application of organic and chemical fertilizers can effectively enhance soil and plant enzyme activities related to nitrogen metabolism. For example, applying 30% cattle and chicken manure combined with 70% chemical fertilizer increased rice root GS activity by 10–12% and GOGAT activity by 11–13%, thereby improving soil quality and grain yield [49]. Similarly, Ju J. 2021 [50] found that 40% organic fertilizer (chicken manure, earthworm castings, or rapeseed cake) combined with 60% chemical fertilizer significantly increased soil mineral nitrogen content and enhanced NR and NiR activities, promoting efficient nitrate reduction through optimized nitrogen supply. Ding, W.T. 2021 [51] also observed that full organic fertilization or partial replacement of chemical fertilizer with organic fertilizer markedly improved soil enzyme activities related to nutrient cycling. Our results are consistent with these findings, further confirming that the organic–inorganic fertilization regime can synergistically activate key enzymes in soil nitrogen transformation and root nitrogen assimilation, which is an important mechanism underlying the improved alfalfa growth and yield observed in this study.

4.4. Effects of Organic and Chemical Fertilizer Application on Soil Microbial Communities

Soil microorganisms are critical indicators of soil quality and ecological function, contributing to the maintenance and sustainability of soil ecosystems through the synthesis, decomposition, and transformation of organic matter [52]. Long-term application of organic fertilizers provides soil microbes with abundant exogenous organic substrates and nutrients, stimulating microbial growth and promoting the formation of distinct microbial communities [53]. In this study, the combined application of 25% cattle manure with 75% chemical fertilizer (CM3) most effectively enhanced the alpha diversity of the alfalfa soil microbial community. In both 2024 and 2025, Shannon and Simpson indices under CM3 were significantly higher than those under other treatments, indicating that this fertilization strategy improves microbial diversity, evenness, and community stability. In contrast, treatments with chemical fertilizer alone or no fertilizer significantly reduced community evenness, with lower Shannon and Simpson indices. These results are consistent with Xiao X. 2022 [54], who reported that combined organic–inorganic fertilization significantly increased bacterial alpha diversity, enriched beneficial taxa such as Proteobacteria and Actinobacteria, and enhanced soil enzyme activity and nutrient availability, whereas sole chemical fertilization or unfertilized controls reduced microbial diversity.
Proteobacteria are critical for nitrogen fixation and the degradation of complex compounds. Bacteroidetes contribute to organic carbon mineralization and play major roles in soil carbon and nitrogen cycling, and Actinobacteria decompose organic matter into small-molecule nutrients, improving soil structure and enhancing water and nutrient retention, making them key drivers of soil organic matter mineralization [55,56]. In this study, Proteobacteria, Bacteroidetes, and Actinobacteria were the dominant bacterial groups, and the combined application of organic and chemical fertilizers significantly increased their relative abundance in the rhizosphere, supporting the functional stability of the soil micro-ecosystem. These findings align with Fang Hairui et al. [57], who demonstrated that well-decomposed organic fertilizers provide readily available small-molecule carbon sources, balancing the soil carbon-to-nitrogen ratio. Consequently, combining organic and chemical fertilizers enhances microbial community diversity and richness more effectively than organic fertilizer alone. In conclusion, the rational application of organic and chemical fertilizers markedly improves the diversity, richness, and structural stability of alfalfa soil microbial communities. Among all treatments, 25% cattle manure combined with 75% chemical fertilizer (CM3) exhibited the greatest enhancement of soil microbial alpha diversity, species richness, and community structural evenness.
Our findings are consistent with previous studies reporting that integrated organic–inorganic fertilization significantly enhances crop yield and soil quality. However, the optimal ratio of organic to chemical fertilizer varies across regions, soil types, and crop species. In the present study, the CM3 treatment (25% organic substitution) produced the best results, whereas other studies have reported optimal substitution rates ranging from 30% to 70%. These discrepancies may be attributed to differences in climatic conditions, soil properties, and management practices. In arid and semi-arid regions such as Xinjiang, limited soil moisture and low organic matter content may restrict nutrient mineralization from organic sources, thereby necessitating a higher proportion of chemical fertilizers to ensure adequate nutrient availability [58]. This highlights the importance of region-specific fertilization strategies.
From a practical perspective, the results of this study provide important implications for sustainable forage production in arid regions. The combined application of organic and chemical fertilizers not only improves alfalfa yield but also enhances soil fertility and microbial diversity, contributing to the long-term sustainability of agroecosystems. The CM3 treatment, in particular, demonstrates that a partial substitution of chemical fertilizers with organic amendments can reduce excessive reliance on synthetic inputs while maintaining high productivity. This strategy may help mitigate environmental risks associated with intensive fertilization, such as soil degradation and nutrient leaching, and support the development of environmentally friendly and resource-efficient agricultural practices.

5. Conclusions

Fertilization significantly enhanced alfalfa hay yield, improved soil essential nutrient contents, stimulated key soil enzyme activities, increased soil microbial alpha diversity, and optimized soil bacterial community structure. The application of 25% cow manure combined with 75% chemical fertilizer (CM3) produced the highest alfalfa hay yield in this study, accompanied by substantial improvements in soil total nitrogen, available nitrogen, available phosphorus, available potassium, and organic matter. This treatment also enhanced soil nitrate reductase and nitrite reductase activities, as well as glutamate synthase and glutamine synthase activities in alfalfa roots. Moreover, CM3 increased the Chao1, Shannon, and Ace indices and decreased the Simpson index, indicating improved soil microbial diversity and community stability. NMDS analysis based on Bray–Curtis distance revealed significant shifts in soil bacterial community structure, accompanied by increased OTU numbers and enhanced relative abundances of dominant phyla and genera, including Actinomycetota, Pseudomonadota, Bacteroidota, Bacillota, Streptomyces, Bacillus, Pseudomonas, and Neorhizobium. The results showed that under the two-year field trial conditions, the combination of 25% cow manure and 75% chemical fertilizer (CM3) exhibited the best comprehensive performance and can be recommended as a favorable fertilization system for alfalfa production in the study area. It is necessary to conduct multi-site and long-term research in the future to further verify its applicability and sustainability within the Xinjiang region.

Supplementary Materials

The following supporting information can be downloaded at: https://www.mdpi.com/article/10.3390/agronomy16080795/s1.

Author Contributions

Conceptualization, X.M. and L.W.; methodology, X.M., Z.X. and Y.Q.; data analysis and Visualization, X.M., Q.W. and Z.X.; writing—original draft preparation, X.M. and L.W.; experimental procedure guidance, L.C. and A.Y.; writing—review and editing, all authors. X.M. and L.W. made equal contributions to this study. All authors have read and agreed to the published version of the manuscript.

Funding

This research was funded by Xinjiang Uygur Autonomous Region University Research Program, grant number XJEDU2024P032.

Data Availability Statement

The data that support the findings of this study are available from the corresponding author, L.W., upon reasonable request.

Acknowledgments

We sincerely thank Lan Wang, Yihan Qian, Zhuang Xue, and all the students from the research group for their assistance during the field experiments. During the preparation of this work, the authors used Gemini 3 Pro to search for and translate professional terms to improve language and readability. After using this tool/service, the authors reviewed and edited the content as needed and take full responsibility for the content of the publication.

Conflicts of Interest

The authors declare no conflicts of interest.

References

  1. Rapiya, M.; Mndela, M.; Ramoelo, A. Sustainable Food Systems Through Livestock–Pasture Integration. Agriculture 2025, 15, 967. [Google Scholar] [CrossRef]
  2. Herrero, M.; Mason-D’Croz, D.; Thornton, P.; Fanzo, J.; Rushton, J.; Godde, C.; Bellows, A.; Groot, A.D.; Palmer, J.; Chang, J. Livestock and Sustainable Food Systems: Status, Trends, and Priority Actions; University of Bonn: Bonn, Germany, 2021. [Google Scholar] [CrossRef]
  3. Wan, L.J.; Tian, Y.; He, M.; Zheng, Y.Q.; Qiang, L.; Xie, R.J.; Ma, Y.Y.; Deng, L.; Yi, S.L. Effects of chemical fertilizer combined with organic fertilizer application on soil properties, citrus growth physiology, and yield. Agriculture 2021, 11, 1207. [Google Scholar] [CrossRef]
  4. Zhao, J.; Li, K.; Shao, Q.; Bai, J.; Gong, Y.; Liu, Y. Combining In Situ and Remote-Sensing Data to Assess the Spatial Pattern and Changes of Major Grassland Types in Xinjiang, China, Under Climate Change Scenarios. Remote Sens. 2026, 18, 152. [Google Scholar] [CrossRef]
  5. Sun, Y.; Sun, J.; Wang, X.; Cartmill, A.D.; López, I.F.; Ma, C.; Zhang, Q. Nitrogen and phosphorus fertilizer use efficiency improves alfalfa (Medicago sativa L.) production and performance in alkaline desert soil. Front. Plant Sci. 2025, 16, 1526648. [Google Scholar] [CrossRef]
  6. Sattari, S.Z.; Bouwman, A.F.; Martinez Rodríguez, R.; Beusen, A.H.W.; Ittersum, M.K.V. Negative global phosphorus budgets challenge sustainable intensification of grasslands. Nat. Commun. 2016, 7, 10696. [Google Scholar] [CrossRef]
  7. Ma, L.; Zheng, J.; Pen, J.; Xiao, X.; Liu, Y.; Liu, L.; Han, W.; Li, G.; Zhang, J. Monitoring and influencing factors of grassland livestock overload in Xinjiang from 1982 to 2020. Front. Plant Sci. 2024, 15, 1340566. [Google Scholar] [CrossRef]
  8. Wang, P. Core Bacterial Taxa Determine Formation of Forage Yield in Fertilized Soil. Microorganisms 2024, 12, 1679. [Google Scholar] [CrossRef] [PubMed]
  9. Desta, A.G. The role of alfalfa (Medicago sativa L.) in soil health and greenhouse gas mitigation in integrated crop-livestock systems: A review. Arch. Agron. Soil Sci. 2026, 72, 1–16. [Google Scholar] [CrossRef]
  10. Liu, X.J.; Zhao, Y.J.; Hao, F. Development of nitrogen efficiency screening system in alfalfa (Medicago sativa L.) and analysis of alfalfa nitrogen efficiency types. PeerJ 2022, 10, e13343. [Google Scholar] [CrossRef] [PubMed]
  11. Hansen, L.B.; Termansen, M.; Hasler, B. The potential for nitrogen abatement trading in agriculture-A hypothetical market experiment. J. Agric. Econ. 2019, 70, 812–839. [Google Scholar] [CrossRef]
  12. Gao, R.; Duan, Y.; Zhang, J.; Ren, Y.; Li, H.; Liu, X.; Zhao, P.; Jing, Y. Effects of long-term application of organic manure and chemical fertilizer on soil properties and microbial communities in the agro-pastoral ecotone of North China. Front. Environ. Sci. 2022, 10, 993973. [Google Scholar] [CrossRef]
  13. Jiang, F.; Han, S.; Cheng, W.; Song, L.; Tang, S.; Wang, H.; Bu, R.; Li, M.; Zhu, R.; Islam, M.U. Soil quality, elemental stoichiometry and crop yield under partial substitution of chemical fertilizers with organic inputs in Vertisols: A six-site field study. Front. Plant Sci. 2025, 16, 1742932. [Google Scholar] [CrossRef]
  14. Wang, N.; Zhan, J.; Feng, K.; Qi, J.; Nan, H. Higher yield sustainability and soil quality by reducing chemical fertilizer with organic fertilizer application under a single-cotton cropping system. Front. Plant Sci. 2024, 15, 1494667. [Google Scholar] [CrossRef]
  15. Wang, Z.; Zhao, X.; Sun, Y.; Liu, W.; Zhao, G.; Dang, Z. Advancing sustainable agriculture: The role of integrated soil-crop management in maize production. Front. Environ. Sci. 2024, 12, 1426956. [Google Scholar] [CrossRef]
  16. Dai, Y.; Wu, X.; Li, S.; Li, Y.; Wang, L.; Hu, Y.; Liu, K.; Yang, Z.; Cai, L.; Xu, K. Optimizing Resource Management with Organic Fertilizer and Microbial Inoculants to Enhance Soil Quality, Microbial Diversity, and Crop Productivity in Newly Cultivated Land. Plants 2025, 14, 3032. [Google Scholar] [CrossRef] [PubMed]
  17. Lu, W.; Li, J.; Luo, T.; Chen, L.; Zhang, L.; Liu, S. Effects of different organic fertilizer replacement rates on wheat yield and soil nutrients over three consecutive years. J. Plant Nutr. Fertil. 2021, 27, 1330–1338. [Google Scholar]
  18. Ren, J.; Liu, X.; Yang, W.; Yang, X.; Li, W.; Xia, Q.; Li, J.; Gao, Z.; Yang, Z. Rhizosphere soil properties, microbial community, and enzyme activities: Short-term responses to partial substitution of chemical fertilizer with organic manure. J. Environ. Manag. 2021, 299, 113650. [Google Scholar] [CrossRef]
  19. Ma, Z.; Zheng, G.-L.; He, F.; Tong, Z.-Y.; Ji, J.-J.; Xu, H.-Y.; Li, Z.-S.; Cao, J.; Wan, L.-Q.; Li, X.-L.; et al. Effects of Applying Organic-Inorganic Compound Fertilizer on Production Performance, Nutritional Quality and Soil Nutrient Content of Alfalfa in Saline-Alkali Soil. Acta Agrestia Sin. 2019, 27, 466–472. [Google Scholar]
  20. Liu, J.; Shu, A.; Song, W.; Shi, W.; Gao, Z. Long-term organic fertilizer substitution increases rice yield by improving soil properties and regulating soil bacteria. Geoderma 2021, 404, 115287. [Google Scholar] [CrossRef]
  21. Wang, N.; Nan, H.Y.; Feng, K.Y. Effects of reduced chemical fertilizer with organic fertilizer application on soil microbial biomass, enzyme activity and cotton yield. Chin. J. Appl. Ecol. 2020, 31, 173–181. [Google Scholar] [CrossRef]
  22. Xu, L.L.; Wang, X.J. The effect of replacing chemical fertilizers with organic fertilizers and other nitrogen sources on soil nutrients and enzyme activity. Soil Fertil. Sci. China 2023, 1, 23–29. [Google Scholar] [CrossRef]
  23. Wilke, B.M. Determination of chemical and physical soil properties. In Monitoring and Assessing Soil Bioremediation; Springer: Berlin/Heidelberg, Germany, 2005; pp. 47–95. [Google Scholar]
  24. Walkley, A.; Black, I.A. An examination of the Degtjareff method for determining soil organic matter, and a proposed modification of the chromic acid titration method. Soil Sci. 1934, 37, 29–38. [Google Scholar] [CrossRef]
  25. Villar, E.; Farrant, G.K.; Follows, M.; Garczarek, L.; Speich, S.; Audic, S.; Bittner, L.; Blanke, B.; Brum, J.R.; Brunet, C.; et al. Environmental characteristics of Agulhas rings affect interocean plankton transport. Science 2015, 348, 1261447. [Google Scholar] [CrossRef] [PubMed]
  26. Ito, K.; Murphy, D. Application of ggplot2 to pharmacometric graphics. CPT Pharmacomet. Syst. Pharmacol. 2013, 2, e79. [Google Scholar] [CrossRef] [PubMed]
  27. Cao, J. Evaluation on the Growth of Alfalfa and Mn2+ Toxicity in Guizhou. Master’s Thesis, Chinese Academy of Agricultural Sciences, Beijing, China, 2018. [Google Scholar]
  28. Li, J.W.; Zhang, Y.Y.; Wang, T.F.; Wang, B.; Ma, J.P.; Wang, X.B.; Du, J.M.; Lan, J. Effects of nitrogen, phosphorus and potassium fertilizer rationing on production performance and nutritional value of forage oats in rainfed farming areas of Ningxia China. Pratacult. Sci. 2025, 42, 3164. [Google Scholar] [CrossRef]
  29. Yang, Y.Y.; Gao, Z.L.; Wang, X.J. The effects of organic and inorganic nitrogen fertilizer application on alfalfa yield, soil nitrate nitrogen, and greenhouse gas emissions. Chin. J. Appl. Ecol. 2016, 27, 822–828. [Google Scholar] [CrossRef]
  30. Bai, L.; Cheng, L.-X.; Li, Y.-H.; Feng, Y.; Yue, L.-F.; Chang, J.; Bao, H.; Wang, Z.-M.; Yu, Z.-H.; Li, J.-S. Effect of Combinative Application of Organic Fertilizer and Chemical Fertilizer on Yield and Nutritional Quality of Alfalfa. Anim. Husb. Feed. Sci. 2021, 42, 72–79. [Google Scholar] [CrossRef]
  31. Li, S.S.; Yang, Z.; Li, H.; Yang, W.G.; Xu, Y.X.; Wang, X.L.; Chai, H.; Gou, Z.H. The effect of combined application of organic fertilizer and chemical fertilizer on the yield, quality, and soil physicochemical properties of purple clover. Heilongjiang Anim. Sci. Vet. Med. 2021, 10, 109–113. [Google Scholar] [CrossRef]
  32. Xing, Y.; Xie, Y.; Wang, X. Enhancing soil health through balanced fertilization: A pathway to sustainable agriculture and food security. Front. Microbiol. 2025, 16, 1536524. [Google Scholar]
  33. Iqbal, A.; He, L.; Ali, I.; Yuan, P.; Khan, A.; Hua, Z.; Wei, S.Q.; Jiang, L. Partial Substitution of Organic Fertilizer with Chemical Fertilizer Improves Soil Biochemical Attributes, Rice Yields and Restores Bacterial Community Diversity in a Paddy Field. Front. Plant Sci. 2022, 13, 895230. [Google Scholar] [CrossRef]
  34. Wei, T.J.; Li, G.; Cui, Y.R.; Xie, J.; Teng, X.; Wang, Y.J.; Li, Z.H.; Guan, F.C.; Liang, Z.W. Compost mediates the recruitment of core bacterial communities in alfalfa roots to enhance their productivity potential in saline-sodic soils. Front. Microbiol. 2024, 15, 1502536. [Google Scholar] [CrossRef] [PubMed]
  35. Fang, X.; Yang, Y.; Zhao, Z.; Zhou, Y.; Liao, Y.; Guan, Z.; Chen, S.; Fang, W.; Chen, F.; Zhao, S. Optimum nitrogen, phosphorous, and potassium fertilizer application increased chrysanthemum growth and quality by reinforcing the soil microbial community and nutrient cycling function. Plants 2023, 12, 4062. [Google Scholar] [CrossRef]
  36. Usherwood, N.R.; Segars, W.I. Nitrogen interactions with phosphorus and potassium for optimum crop yield, nitrogen use effectiveness, and environmental stewardship. Sci. World J. 2001, 1, 57–60. [Google Scholar] [CrossRef]
  37. Liu, Y.; Gao, J.; Zhong, M.; Chen, L.; Zhang, W. Effects of phosphorus and potassium supply on photosynthetic nitrogen metabolism, nitrogen absorption, and nitrogen utilization of hydroponic rice. Agronomy 2024, 14, 1726. [Google Scholar] [CrossRef]
  38. Ma, J.; Chen, T.; Lin, J.; Fu, W.; Feng, B.; Li, G.; Li, H.; Li, J.; Wu, Z.; Tao, L.; et al. Functions of Nitrogen, Phosphorus and Potassium in Energy Status and Their Influences on Rice Growth and Development. J. Rice Science. 2021, 29, 166–178. [Google Scholar] [CrossRef]
  39. Yang, F.; Song, X.; Yang, R.; Li, X. Application of Organic Fertilization and Chemical Fertilization Enhances the Coupled and Coordinated Degree of Soil Fertility and Economic Benefits in Corn Farmland. Agriculture 2025, 16, 9. [Google Scholar] [CrossRef]
  40. Li, Q.S.; Zhao, H.; Wang, Z.P.; Yang, K.; Li, H.X.; Jiao, J.G. The impact of substituting a portion of chemical fertilizer with organic fertilizer on soil nutrient utilization and enzyme activity in rice-wheat rotation. Chin. J. Soil Sci. 2020, 51, 912–919. [Google Scholar] [CrossRef]
  41. Hinsinger, P.; Bell, M.J.; Kovar, J.L.; White, P.J. Rhizosphere processes and root traits determining the acquisition of soil potassium. In Improving Potassium Recommendations for Agricultural Crops; Springer International Publishing: Berlin/Heidelberg, Germany, 2020; pp. 99–117. [Google Scholar]
  42. Ozanne, P.G.; Asher, C.J.; Kirton, D.J. Root distribution in a deep sand and its relationship to the uptake of added potassium by pasture plants. Aust. J. Agric. Res. 1965, 16, 785–800. [Google Scholar] [CrossRef]
  43. Wang, F.L.; Huang, P.M. Effects of organic matter on the rate of potassium adsorption by soils. Can. J. Soil Sci. 2001, 81, 325–330. [Google Scholar] [CrossRef]
  44. Song, X.; Fang, C.; Yuan, Z.; Li, F. Long-term growth of alfalfa increased soil organic matter accumulation and nutrient mineralization in a semi-arid environment. Front. Environ. Sci. 2021, 9, 649346. [Google Scholar] [CrossRef]
  45. Le Roux, X.; Schmid, B.; Poly, F.; Barnard, R.L.; Niklaus, P.A.; Guillaumaud, N.; Habekost, M.; Oelmann, Y.; Philippot, L.; Salles, J.F.; et al. Soil environmental conditions and microbial build-up mediate the effect of plant diversity on soil nitrifying and denitrifying enzyme activities in temperate grasslands. PLoS ONE 2013, 8, e61069. [Google Scholar] [CrossRef]
  46. Chang, W.; Ma, W.; Song, L.; Tang, Y.; Long, Y.; Xu, G.; Yuan, J. Responses of soil N-cycle enzyme activities to vegetation degradation in a wet meadow on the Qinghai-Tibet Plateau. Front. Ecol. Evol. 2023, 11, 1210643. [Google Scholar] [CrossRef]
  47. Balotf, S.; Kavoosi, G.; Kholdebarin, B. Nitrate reductase, nitrite reductase, glutamine synthetase, and glutamate synthase expression and activity in response to different nitrogen sources in nitrogen-starved wheat seedlings. Biotechnol. Appl. Biochem. 2016, 63, 220–229. [Google Scholar] [CrossRef]
  48. Sahay, S.; Robledo-Arratia, L.; Glowacka, K.; Gupta, M. Root NRT, NiR, AMT, GS, GOGAT and GDH expression levels reveal NO and ABA-mediated drought tolerance in Brassica juncea L. Sci. Rep. 2021, 11, 7992. [Google Scholar] [CrossRef] [PubMed]
  49. Iqbal, A.; He, L.; Ali, I.; Ullah, S.; Khan, A.; Khan, A.; Akhtar, K.; Wei, S.; Zhao, Q.; Zhang, J.; et al. Manure combined with chemical fertilizer increases rice productivity by improving soil health, post-anthesis biomass yield, and nitrogen metabolism. PLoS ONE 2020, 15, e0238934. [Google Scholar] [CrossRef] [PubMed]
  50. Ju, J.; Gu, Q.; Zhou, H.; Zhang, H.; Mao, W.; Yang, H.; Mi, W.; Zhao, H. Effects of organic fertilizer combined with chemical fertilizer on nutrients, enzyme activities, and rice yield in reclaimed soil. Commun. Soil Sci. Plant Anal. 2022, 53, 3060–3071. [Google Scholar] [CrossRef]
  51. Ding, W.T.; Fang, J.J.; Wu, X.Q.; Zhang, J.Z.; Zhang, J.M.; Zhang, J.Z.; Liu, Y.D.; Song, X.J.; Li, J.Y.; Zheng, F.J.; et al. Effects of different ratios of organic fertilizers instead of chemical fertilizers on black soil microbiological properties and spring wheat yield and quality. Soil Fertil. Sci. China 2021, 2, 44–52. [Google Scholar]
  52. Raza, T.; Qadir, M.F.; Khan, K.S.; Eash, N.S.; Yousuf, M.; Chatterjee, S.; Manzoor, R.; Rehman, S.; Oetting, J.N. Unraveling the potential of microbes in decomposition of organic matter and release of carbon in the ecosystem. J. Environ. Manag. 2023, 344, 118529. [Google Scholar] [CrossRef]
  53. Luo, J.; Liao, G.; Banerjee, S.; Gu, S.; Liang, J.; Guo, X.; Zhao, H.; Liang, Y.; Li, T. Long-term organic fertilization promotes the resilience of soil multifunctionality driven by bacterial communities. Soil Biol. Biochem. 2023, 177, 108922. [Google Scholar] [CrossRef]
  54. Xiao, X.; Li, J.; Lyu, J.; Feng, Z.; Zhang, G.; Yang, H.; Gao, C.; Jin, L.; Yu, J. Chemical fertilizer reduction combined with bio-organic fertilizers increases cauliflower yield via regulation of soil biochemical properties and bacterial communities in Northwest China. Front. Microbiol. 2022, 13, 922149. [Google Scholar] [CrossRef]
  55. Chen, S.X.; Zhang, W.; Ma, D.W.; Yang, S.H.; Peng, W.F.; Zhang, H.; Nie, S.M. Effects of rhizosphere environment on the competitive ability of extremely small population of Cynanchum forrestii Schltr under alpine conditions. Acta Ecol. Sin. 2023, 43, 2555–2567. [Google Scholar] [CrossRef]
  56. Li, S.J.; Wang, F.X.; Cong, W.Q.; Wei, M.; Wang, J.Q.; Wang, Z.H. Microbial community structure and environmental response of desert soil in hexi corrido. Acta Pedol. Sin. 2022, 59, 1718–1728. [Google Scholar] [CrossRef]
  57. Fang, H.R.; Liu, J.J.; Chen, X.L.; Jiang, Y.; Liu, Z.X.; Gu, H.D.; Wan, S.M.; Xiao, Y. Effects of long-term combined application of organic and chemical fertilizers on bacterial community characteristics and soybean yields. Chin. J. Eco-Agric. 2024, 32, 804–815. [Google Scholar] [CrossRef]
  58. Liu, Q.; Xu, H.; Yi, H. Impact of fertilizer on crop yield and C: N: P stoichiometry in arid and semi-arid soil. Int. J. Environ. Res. Public Health 2021, 18, 4341. [Google Scholar] [CrossRef] [PubMed]
Figure 1. Monthly average precipitation and temperature. The line chart represents the temperature, and the histogram represents the precipitation.
Agronomy 16 00795 g001
Figure 2. The yield of alfalfa under different fertilizer treatments. Values are presented as mean ± standard error (n = 5). (A) Aboveground hay yield. (B) Belowground biomass. Different uppercase letters indicate significant differences among treatments within 2024; Different lowercase letters indicate significant differences among treatments within 2025. * indicates significant differences between 2024 and 2025 under the same treatment (p < 0.05), ** indicates significant differences between 2024 and 2025 under the same treatment (p < 0.01). CM0, 100% cattle manure; CM1, 75% cattle manure + 25% chemical fertilizer; CM2, 50% cattle manure + 50% chemical fertilizer; CM3, 25% cattle manure + 75% chemical fertilizer; CM4, 100% chemical fertilizer; CK, blank control (no fertilizer application).
Agronomy 16 00795 g002
Figure 3. Soil total nitrogen and alkali-hydrolyzable content under different fertilizer application treatments. Values are presented as mean ± standard error (n = 5). (A) Total nitrogen content in the 0–20 cm soil layer; (B) total nitrogen content in the 20–40 cm soil layer. (C) Alkali-hydrolyzable nitrogen content in the 0–20 cm soil layer; (D) alkali-hydrolyzable nitrogen contents in the 20–40 cm soil layer. Different uppercase letters indicate significant differences among treatments within 2024 (p < 0.05); different lowercase letters indicate significant differences among treatments within 2025 (p < 0.05). * indicates significant differences between 2024 and 2025 under the same treatment (p < 0.05); ** indicates significant differences between 2024 and 2025 under the same treatment (p < 0.01). CM0, 100% cattle manure; CM1, 75% cattle manure + 25% chemical fertilizer; CM2, 50% cattle manure + 50% chemical fertilizer; CM3, 25% cattle manure + 75% chemical fertilizer; CM4, 100% chemical fertilizer; CK, blank control (no fertilizer application).
Agronomy 16 00795 g003
Figure 4. Soil available phosphorus and available potassium content under different fertilizer application treatments. Values are presented as mean ± standard error (n = 5). (A) Available phosphorus content in the 0–20 cm soil layer; (B) available phosphorus content in the 20–40 cm soil layer. (C) Available potassium content in the 0–20 cm soil layer; (D) available potassium content in the 20–40 cm soil layer. Different uppercase letters indicate significant differences among treatments within 2024 (p < 0.05); different lowercase letters indicate significant differences among treatments within 2025 (p < 0.05). * indicates significant differences between 2024 and 2025 under the same treatment (p < 0.05). CM0, 100% cattle manure; CM1, 75% cattle manure + 25% chemical fertilizer; CM2, 50% cattle manure + 50% chemical fertilizer; CM3, 25% cattle manure + 75% chemical fertilizer; CM4, 100% chemical fertilizer; CK, blank control (no fertilizer application).
Agronomy 16 00795 g004
Figure 5. Soil organic matter content under different fertilizer application treatments. Values are presented as mean ± standard error (n = 5). (A) Organic matter content in the 0–20 cm soil layer; (B) organic matter content in the 20–40 cm soil layer. Different uppercase letters indicate significant differences among treatments within 2024 (p < 0.05); different lowercase letters indicate significant differences among treatments within 2025 (p < 0.05). CM0, 100% cattle manure; CM1, 75% cattle manure + 25% chemical fertilizer; CM2, 50% cattle manure + 50% chemical fertilizer; CM3, 25% cattle manure + 75% chemical fertilizer; CM4, 100% chemical fertilizer; CK, blank control (no fertilizer application).
Agronomy 16 00795 g005
Figure 6. Non-metric multidimensional scaling (NMDS) analysis of soil bacterial community composition under different fertilization treatments. (A) NMDS analysis of soil bacterial community in 2024. (B) NMDS analysis of soil bacterial community in 2025. CM0, 100% cattle manure; CM1, 75% cattle manure + 25% chemical fertilizer; CM2, 50% cattle manure + 50% chemical fertilizer; CM3, 25% cattle manure + 75% chemical fertilizer; CM4, 100% chemical fertilizer; CK, blank control (no fertilizer application).
Agronomy 16 00795 g006
Figure 7. Venn analysis of soil samples. (A) Venn analysis of soil samples in 2024. (B) Venn analysis of soil samples in 2025. CM0, 100% cattle manure; CM1, 75% cattle manure + 25% chemical fertilizer; CM2, 50% cattle manure + 50% chemical fertilizer; CM3, 25% cattle manure + 75% chemical fertilizer; CM4, 100% chemical fertilizer; CK, blank control (no fertilizer application).
Agronomy 16 00795 g007
Figure 8. Microbial community composition at the phylum level. (A) The composition of the microbial community in 2024. (B) The composition of the microbial community in 2025. CM0, 100% cattle manure; CM1, 75% cattle manure + 25% chemical fertilizer; CM2, 50% cattle manure + 50% chemical fertilizer; CM3, 25% cattle manure + 75% chemical fertilizer; CM4, 100% chemical fertilizer; CK, blank control (no fertilizer application).
Agronomy 16 00795 g008
Figure 9. Microbial community composition at the genus level. (A) The composition of the microbial community in 2024. (B) The composition of the microbial community in 2025. CM0, 100% cattle manure; CM1, 75% cattle manure + 25% chemical fertilizer; CM2, 50% cattle manure + 50% chemical fertilizer; CM3, 25% cattle manure + 75% chemical fertilizer; CM4, 100% chemical fertilizer; CK, blank control (no fertilizer application).
Agronomy 16 00795 g009
Table 1. Chemical properties of organic fertilizer (cow dung) and cultivated soil.
TypepHTN/(g/kg)TP/(g/kg)TK/(g/kg)AN/(mg/kg)AP/(mg/kg)AK/(mg/kg)SOM/(g/kg)
Soil7.910.710.4213.2236.5010.25123.1513.28
Cow dung8.120.460.891.2465.2326.71132.0042.20
Note: TN: total nitrogen; TP: total phosphorus; TK: total potassium; AN: alkaline nitrogen; AP: available phosphorus; AK: available potassium; SOM: organic matter.
Table 2. Treatment-wise organic and chemical fertilizer application rate for the field experiment.
Fertilizer Application TreatmentsCow Dung/(t·ha−1)Chemical Fertilizer/(t·ha−1) (Urea)
CM032.450.00
CM124.330.08
CM216.220.16
CM38.110.24
CM40.000.32
CK0.000.00
Note: CM0, 100% cattle manure; CM1, 75% cattle manure + 25% chemical fertilizer; CM2, 50% cattle manure + 50% chemical fertilizer; CM3, 25% cattle manure + 75% chemical fertilizer; CM4, 100% chemical fertilizer; CK, blank control (no fertilizer application).
Table 3. Effects of organic fertilizer combined with chemical fertilizer on changes in soil and alfalfa root enzyme activity.
YearTreatmentSoilRoot
Nitrate Reductase/
(μmol/g. 24 h)
Nitrite Reductase/
(μmol/g. 24 h)
Glutamate Synthase/
(U/g)
Glutamine Synthetase/
(U/g)
2024CM00.27 ± 0.58 BC **12.91 ± 0.40 AB **116.86 ± 4.36 AB **9.14 ± 0.89 A *
CM10.38 ± 0.34 AB **14.26 ± 0.65 A **131.005 ± 7.09 A **9.99 ± 1.73 A *
CM20.32 ± 0.29 BC **13.91 ± 0.39 A **130.29 ± 7.43 A **9.77 ± 1.17 A *
CM30.49 ± 0.28 A **14.49 ± 0.65 A **132.32 ± 6.46 A **10.16 ± 0.94 A *
CM40.28 ± 0.30 BC **12.93 ± 1.14 AB **123.61 ± 5.34 AB **9.46 ± 1.13 A *
CK0.21 ± 0.44 C **11.70 ± 0.93 B **108.37 ± 8.08 B **8.97 ± 1.62 A *
2025CM00.55 ± 0.10 BC8.39 ± 0.77 B535.42 ± 21.64 CD8.98 ± 0.37 C
CM10.55 ± 0.05 BC8.46 ± 0.28 B563.47 ± 21.74 BC9.46 ± 0.36 C
CM20.58 ± 0.05 ABC8.71 ± 0.60 B618.75 ± 16.26 B10.63 ± 0.33 B
CM30.65 ± 0.06 A10.16 ± 0.31 A699.84 ± 29.05 A12.24 ± 0.14 A
CM40.62 ± 0.03 AB8.66 ± 0.45 B589.87 ± 22.19 BC9.44 ± 0.38 C
CK0.51 ± 0.06 C6.82 ± 0.56 C475.86 ± 15.32 D8.94 ± 0.35 C
Note: Different letters indicate significant differences among treatments within each year (p < 0.05). Values are presented as mean ± standard error (n = 5). * indicates significant differences between 2024 and 2025 under the same treatment (p < 0.05); ** indicates significant differences between 2024 and 2025 under the same treatment (p < 0.01). CM0, 100% cattle manure; CM1, 75% cattle manure + 25% chemical fertilizer; CM2, 50% cattle manure + 50% chemical fertilizer; CM3, 25% cattle manure + 75% chemical fertilizer; CM4, 100% chemical fertilizer; CK, blank control (no fertilizer application).
Table 4. Sample alpha diversity table.
Treatment20242025
Shannon
Index
Simpson
Index
AceChao1Shannon
Index
Simpson
Index
AceChao1
CM07.16 ± 0.45 abc **0.95 ± 0.02 abc **2543.49 ± 131.80 ab2579.71 ± 137.54 bc5.56 ± 0.33 B0.87 ± 0.02 A2301.70 ± 70.47 AB2352.75 ± 70.26 AB
CM17.24 ± 0.15 abc **0.96 ± 0.01 abc **2592.28 ± 98.01 ab2622.98 ± 105.96 abc5.96 ± 0.10 AB0.87 ± 0.03 A2313.89 ± 163.33 AB2375.78 ± 167.41 AB
CM27.47 ± 0.23 ab **0.97 ± 0.01 ab **2751.57 ± 41.85 a2797.83 ± 61.85 ab6.03 ± 0.07 AB0.88 ± 0.01 A2418.40 ± 142.42 AB2458.67 ± 147.77 AB
CM37.52 ± 0.19 a **0.98 ± 0.01 a **2848.74 ± 88.09 a *2910.03 ± 79.19 a *6.23 ± 0.04 A0.89 ± 0.01 A2526.30 ± 54.13 A2573.56 ± 47.41 A
CM47.12 ± 0.32 bc **0.95 ± 0.03 bc *2535.11 ± 122.20 ab2518.56 ± 80.57 bc5.87 ± 0.18 AB0.86 ± 0.06 A2236.82 ± 85.82 AB2283.33 ± 87.03 AB
CK6.86 ± 0.20 c **0.94 ± 0.02 c **2410.11 ± 108.19 b2441.38 ± 106.46 c5.64 ± 0.14 B0.84 ± 0.02 A2091.52 ± 93.94 B2145.41 ± 98.72 B
Note: Different lowercase letters indicate significant differences among treatments within 2024 (p < 0.05); different uppercase letters indicate significant differences among treatments within 2025 (p < 0.05). Values are presented as mean ± standard error (n = 5). * indicates significant differences between 2024 and 2025 under the same treatment (p < 0.05); ** indicates significant differences between 2024 and 2025 under the same treatment (p < 0.01). CM0, 100% cattle manure; CM1, 75% cattle manure + 25% chemical fertilizer; CM2, 50% cattle manure + 50% chemical fertilizer; CM3, 25% cattle manure + 75% chemical fertilizer; CM4, 100% chemical fertilizer; CK, blank control (no fertilizer application).
Disclaimer/Publisher’s Note: The statements, opinions and data contained in all publications are solely those of the individual author(s) and contributor(s) and not of MDPI and/or the editor(s). MDPI and/or the editor(s) disclaim responsibility for any injury to people or property resulting from any ideas, methods, instructions or products referred to in the content.