1. Introduction
Bothriochloa ischaemum is a tufted, perennial forage grass with outstanding agronomic and ecological characteristics. It exhibits strong tolerance to cold, drought, and poor soil conditions, as well as high leaf biomass, rich nutritional value, and good trampling resistance. This species serves not only as a high-quality forage resource but also plays an important role in improving the ecological environment and conserving soil and water resources [
1,
2].
Although China has largely achieved full coverage of improved grain crop varieties, the breeding of new forage grass varieties still lags behind. Similar to most grass species, the availability and quality of improved B. ischaemum (B. ischaemum serves as the abbreviated form of Bothriochloa ischaemum) germplasm remain limited. Consequently, the domestication and application of wild B. ischaemum are of great significance for the development of grassland animal husbandry and the prevention of soil erosion.
A critical step in the breeding of improved
B. ischaemum varieties is the accurate quantification of both the number of spikes and the number of seeds per spike. Traditionally, seed yield estimation involves cutting the spikes at seed maturity, bagging them, air-drying, threshing, cleaning, and manually counting the seeds to estimate the final yield [
3]. This manual counting process is time-consuming, labor-intensive, and inefficient, consuming substantial human and material resources.
To enhance breeding efficiency and accelerate yield estimation, there is an urgent need for a rapid and accurate method to count B. ischaemum spikes and seeds in their natural state. Such an approach would improve calculation efficiency, reduce labor costs, and provide technical support for large-scale breeding and ecological restoration efforts.
Object detection is a key technology in the field of computer vision. It aims to automatically identify specific target objects in images or videos, accurately localize their positions, and classify their categories. Deep learning–based object detection relies on large amounts of annotated image data, enabling models to iteratively adjust their parameters and learn feature representations of different objects across diverse scenarios. Object detection algorithms can be roughly divided into two categories, one is a single-stage object detection algorithm that directly classifies and regresses without generating candidate regions, and the other is a two-stage object detection algorithm that generates candidate regions, and then classifies and regresses the candidate regions and regresses bounding boxes. Typical representatives of the former include the YOLO series [
4] and SSD [
5].Typical examples of the latter include R-CNN [
6] and Mask R-CNN [
7]. Two-stage detectors, such as Faster R-CNN, first generate candidate regions containing potential targets through a region proposal network and then classify and refine the bounding boxes of these regions. This approach achieves high detection accuracy but is relatively slow, making it more suitable for applications requiring high precision [
8]. To address the low efficiency of two-stage detectors, Redmon and colleagues proposed the first one-stage detection algorithm, YOLO, in 2015. YOLO scales the input image, applies convolutional processing, and directly predicts results without the complex intermediate steps, significantly improving the detection speed [
9,
10,
11]. Comparative evaluations of Faster R-CNN, YOLOv3, and SSD (Single Shot MultiBox Detector) by Li, Zhang, and others showed that YOLOv3 achieved the best performance in terms of mean average precision (mAP), frames per second (FPS), and visual inspection [
12]. After years of development, in 2025, teams from New York University, the University of Chinese Academy of Sciences, and the University at Buffalo jointly released YOLOv12, a new framework that integrates attention mechanisms into YOLO. YOLOv12 incorporates the A2 regional attention module and residual efficient layer aggregation network (R-ELAN), improving performance by leveraging attention without sacrificing speed, thereby achieving high computational efficiency [
13].
The rapid development of deep learning and object detection has opened new opportunities for agriculture and plant breeding. For example, Zhang et al. improved YOLOv8 by replacing the CIOU loss with Focal-IOU to detect soybean and maize seeds more effectively [
14]. Pang et al. introduced an attention mechanism and modified the loss function to develop the YOLOX-P model based on YOLOX, enabling automatic seed counting and improving thousand-seed weight measurement [
15]. Huang et al. replaced the backbone of YOLOv5 with MobileNetV3 and integrated K-Means++ clustering and Alpha-IoU loss to achieve lightweight detection while improving performance on overlapping and small strawberry targets [
16]. Zhang et al. proposed an improved potato seed tuber eye detection model based on YOLOv7 by integrating Contextual Transformer, replacing ELAN-H with InceptionNeXt, and adopting NWD loss to mitigate background confusion and improve convergence efficiency [
17]. Gong et al. proposed a lightweight variant of YOLOv5s for fast and accurate detection of small apple leaf disease targets [
18]. Xu et al. improved YOLOv5s with OTA and WIoU functions for rapid detection of Sichuan pepper clusters [
19]. Jakub et al. used image processing and YOLOv8 to analyze the location, size, and type of coffee and white bean seeds, achieving automated seed selection [
20]. Sun et al. applied YOLOv8 to lightweight pest detection in tobacco and other crops, enabling real-time, high-precision pest identification [
21]. Meng et al. developed a YOLOv7-MA model for accurate detection and counting of wheat spikelets under complex field conditions [
22], while Lu et al. improved object detection performance by reducing background interference [
23]. Deng et al. combined Faster R-CNN with feature pyramid networks (FPN) to automatically identify and count rice grains with 99.4% accuracy [
24]. Wu et al. applied transfer learning to a wheat grain counting task, significantly reducing the required dataset size and accelerating training, achieving 91% average accuracy on 178 post-threshing images [
25]. Sun et al. used YOLOv7 to detect rice grains and combined object detection, classification, and regression to achieve precise counting across five panicle categories [
26]. Similar work on wheat spike recognition was reported by Wang [
27], Liu [
28], Jiang [
29], and Li [
30], with models based on Faster R-CNN or YOLOv5 achieving high accuracy, fast inference, and strong robustness.
At present, there have been no published studies focusing on spike detection and seed yield estimation of Bothriochloa ischaemum. Previous research on millet and wheat spike and grain counting provides valuable theoretical and methodological foundations for this work. This study focuses on the precise detection of B. ischaemum spikes and seed counting under natural field conditions using deep learning–based object detection algorithms. We develop spike and seed detection models and integrate them into a mobile application for efficient and accurate field-based spike and seed quantification. This approach provides breeders with a practical tool for harvesting and yield estimation, thereby supporting the development of the forage breeding industry.
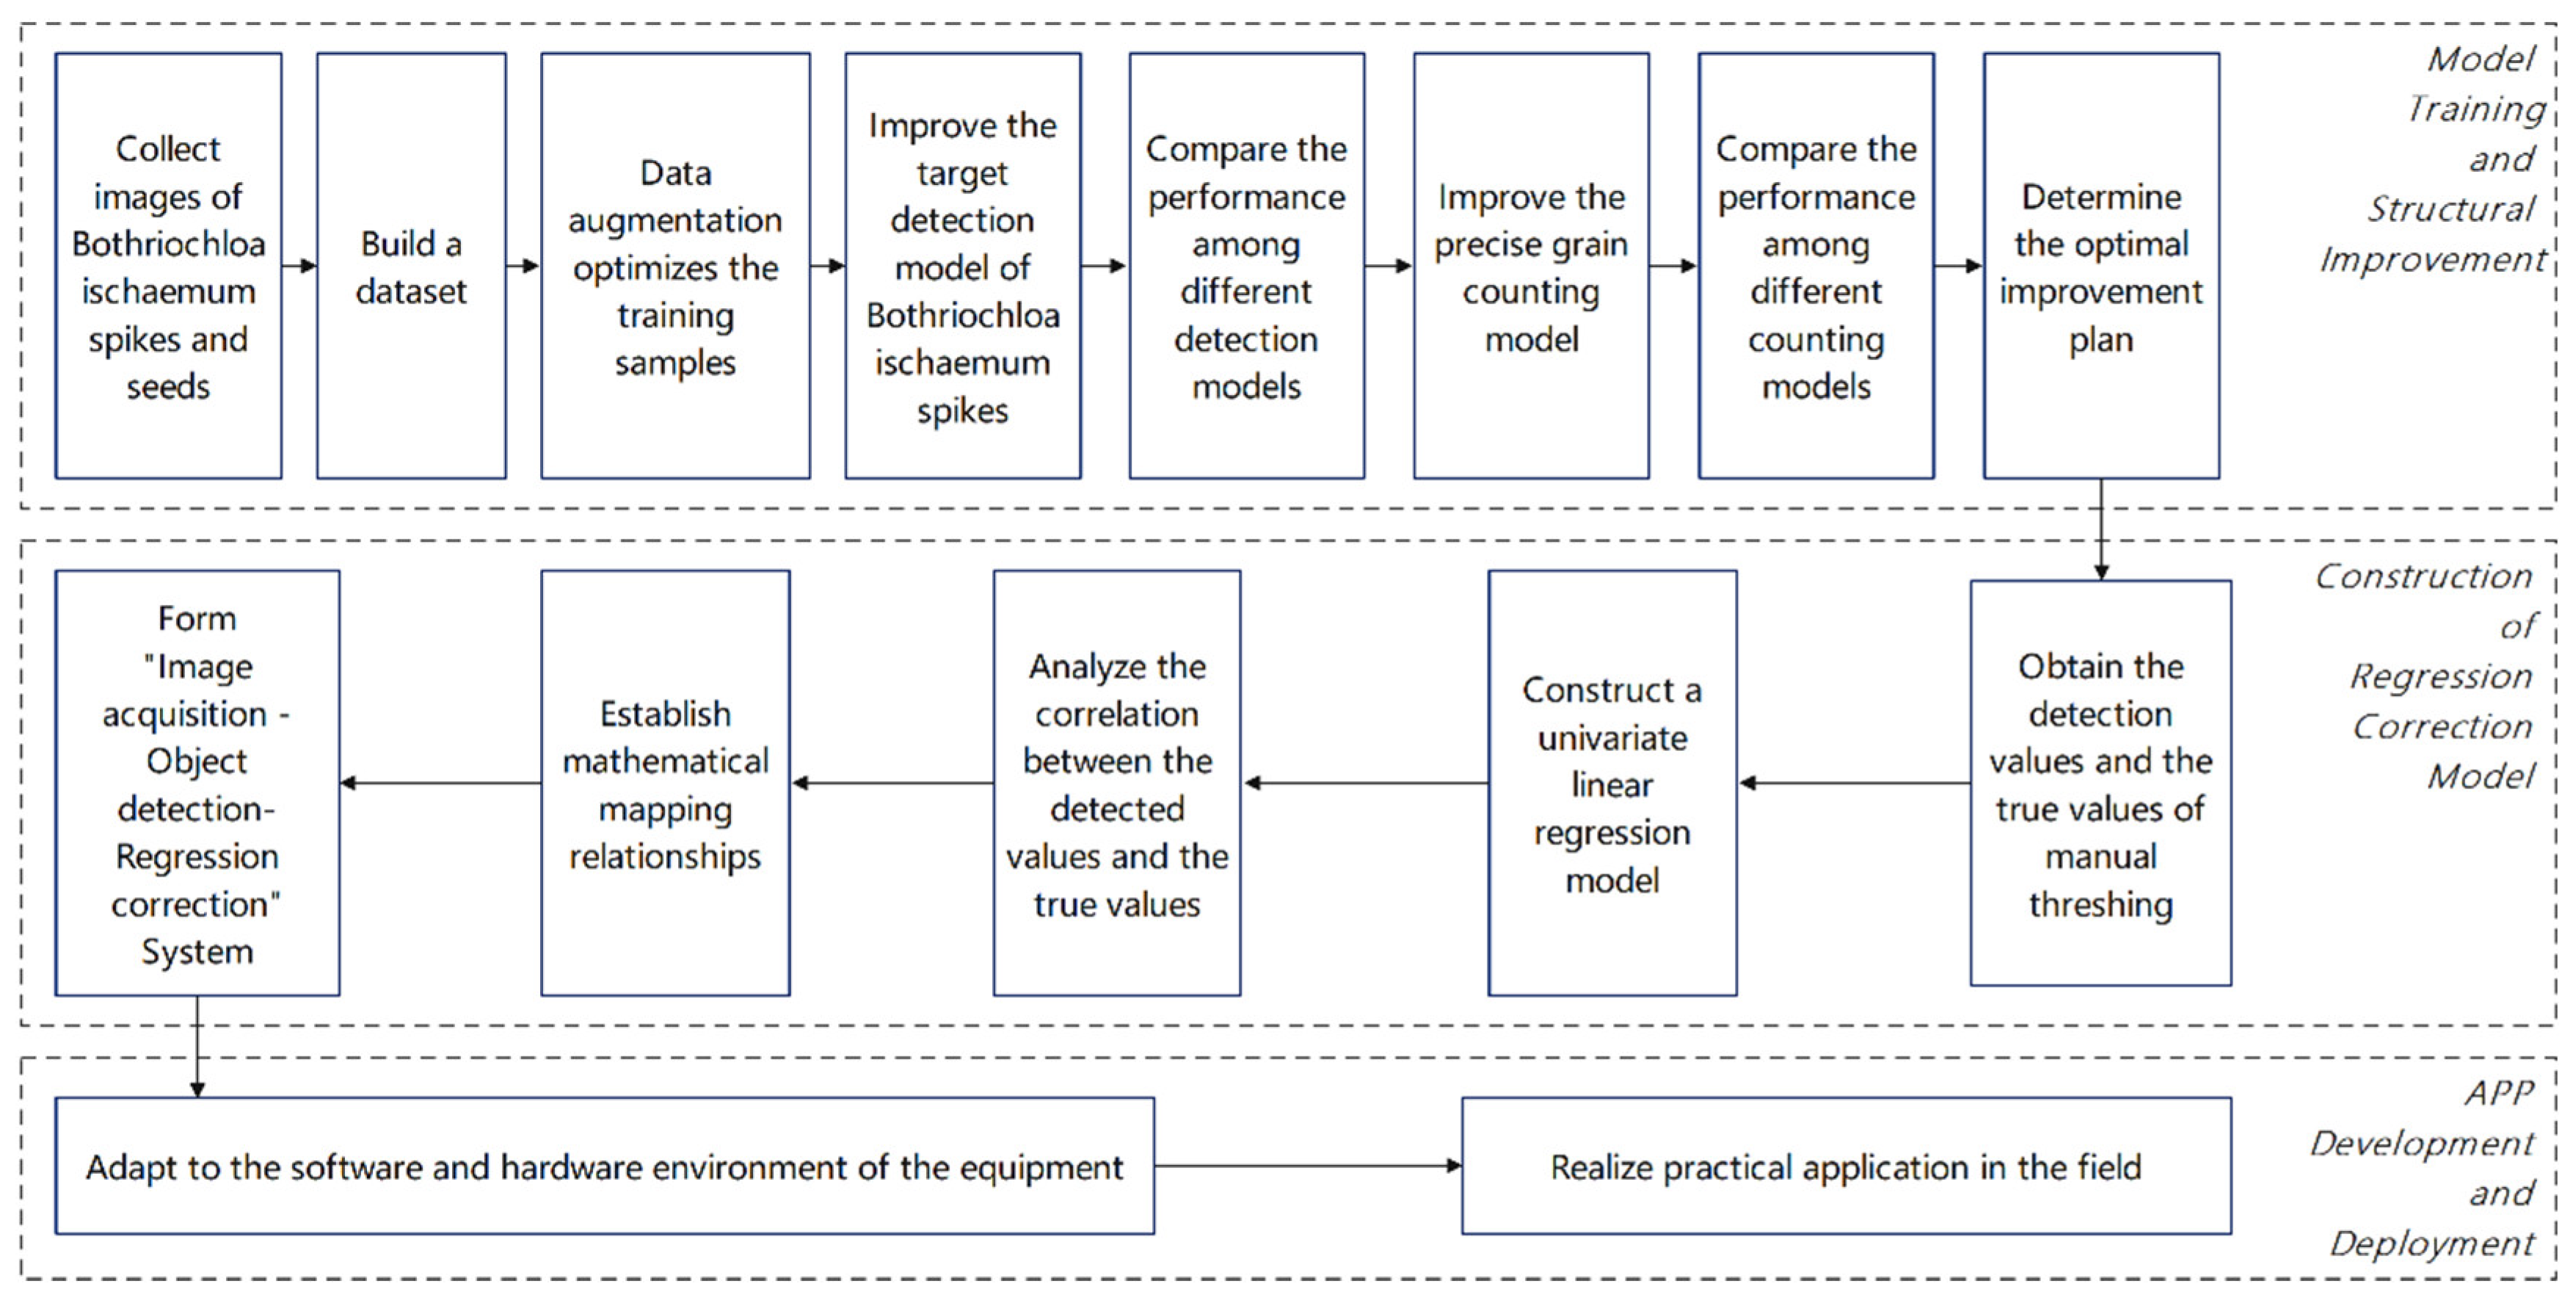
The proposed framework includes the entire workflow from data acquisition to model development and APP deployment. As illustrated in
Figure 1, the study is divided into three main components.
(1) Model training and structural optimization: Images of B. ischaemum spikes were collected in the experimental field, and a spike dataset was constructed through data augmentation. The dataset was used to train and optimize the spike detection model YOLOv12-DAN. Spike samples were then bagged, labeled, and photographed under controlled conditions to annotate seed locations, forming the dataset for the seed detection model YOLOv12-EVC, which outputs predicted seed counts.
(2) Seed count regression model: The same spikes were threshed manually in the laboratory, and the true seed counts were recorded. A regression equation was established between predicted and actual seed counts to calibrate the detection results.
(3) Mobile APP deployment: The optimized YOLO models and regression equations were packaged into a mobile application. Users can take a photo in the field, and the system automatically outputs spike and seed counts for rapid yield estimation.
This framework forms a complete “image acquisition–object detection–regression correction” counting pipeline, enabling high-throughput and accurate estimation of forage seed yield.
This paper centers on addressing the issues of low efficiency and high labor intensity associated with traditional manual counting methods by integrating object detection and regression analysis techniques to construct a non-destructive, high-precision automated phenotypic analysis framework. In
Section 1, the paper elucidates the research background and significance, highlighting the importance of
Bothriochloa ischaemum as a key forage resource in germplasm evaluation and yield prediction. It also analyzes the technical challenges posed by the dense distribution, small target characteristics, and occlusion of spikes under natural conditions for detection. Subsequently,
Section 2 provides a detailed description of the sample collection and image acquisition process, methods for obtaining the true number of seeds, performance evaluation metrics, and the architectural design of YOLOv12-DAN (spike detection model) and YOLOv12-EVC (seed counting model). This includes the innovative application of DySample dynamic upsampling, the ASFF feature fusion module, the NWD loss function, and the EVC module. In
Section 3, the paper validates the significant improvements of the proposed method in terms of precision, recall, and mean average precision through ablation experiments, comparisons with mainstream models, and performance evaluations of the seed counting model. Additionally, regression analysis is employed to further correct seed counting errors, and the real-time detection and dynamic computational resource switching capabilities of the mobile application are demonstrated. Finally, in
Section 4, the paper summarizes the method’s innovation, technical advantages, and application prospects, emphasizing the driving role of the non-destructive automated process in forage breeding and ecological restoration. This forms a complete research loop from problem identification to technological realization and practical application, meeting the high demands for method innovation and result completeness in the field of precision agriculture.
2. Materials and Methods
This chapter establishes a dual-environment image acquisition system utilizing multi-type mobile devices to collect data from both natural field and laboratory settings, providing a foundational dataset for the YOLOv12-DAN spike detection model and YOLOv12-EVC seed counting model. To address the challenges of dense spike distribution and minute seed size in Bothriochloa ischaemum, technical innovations including DySample dynamic upsampling, ASFF feature fusion, NWD loss function adaptation, and the EVC visual center module were introduced to enhance feature representation. By integrating regression analysis, a mathematical mapping model was developed to correlate predicted values with ground-truth measurements, enabling systematic correction of seed counting errors. This design achieves full automation across the entire pipeline from raw image acquisition to precise phenotypic quantification, offering an efficient and non-destructive solution for forage germplasm resource evaluation.
2.1. Bothriochloa ischaemum Spike Materials and Image Acquisition
All
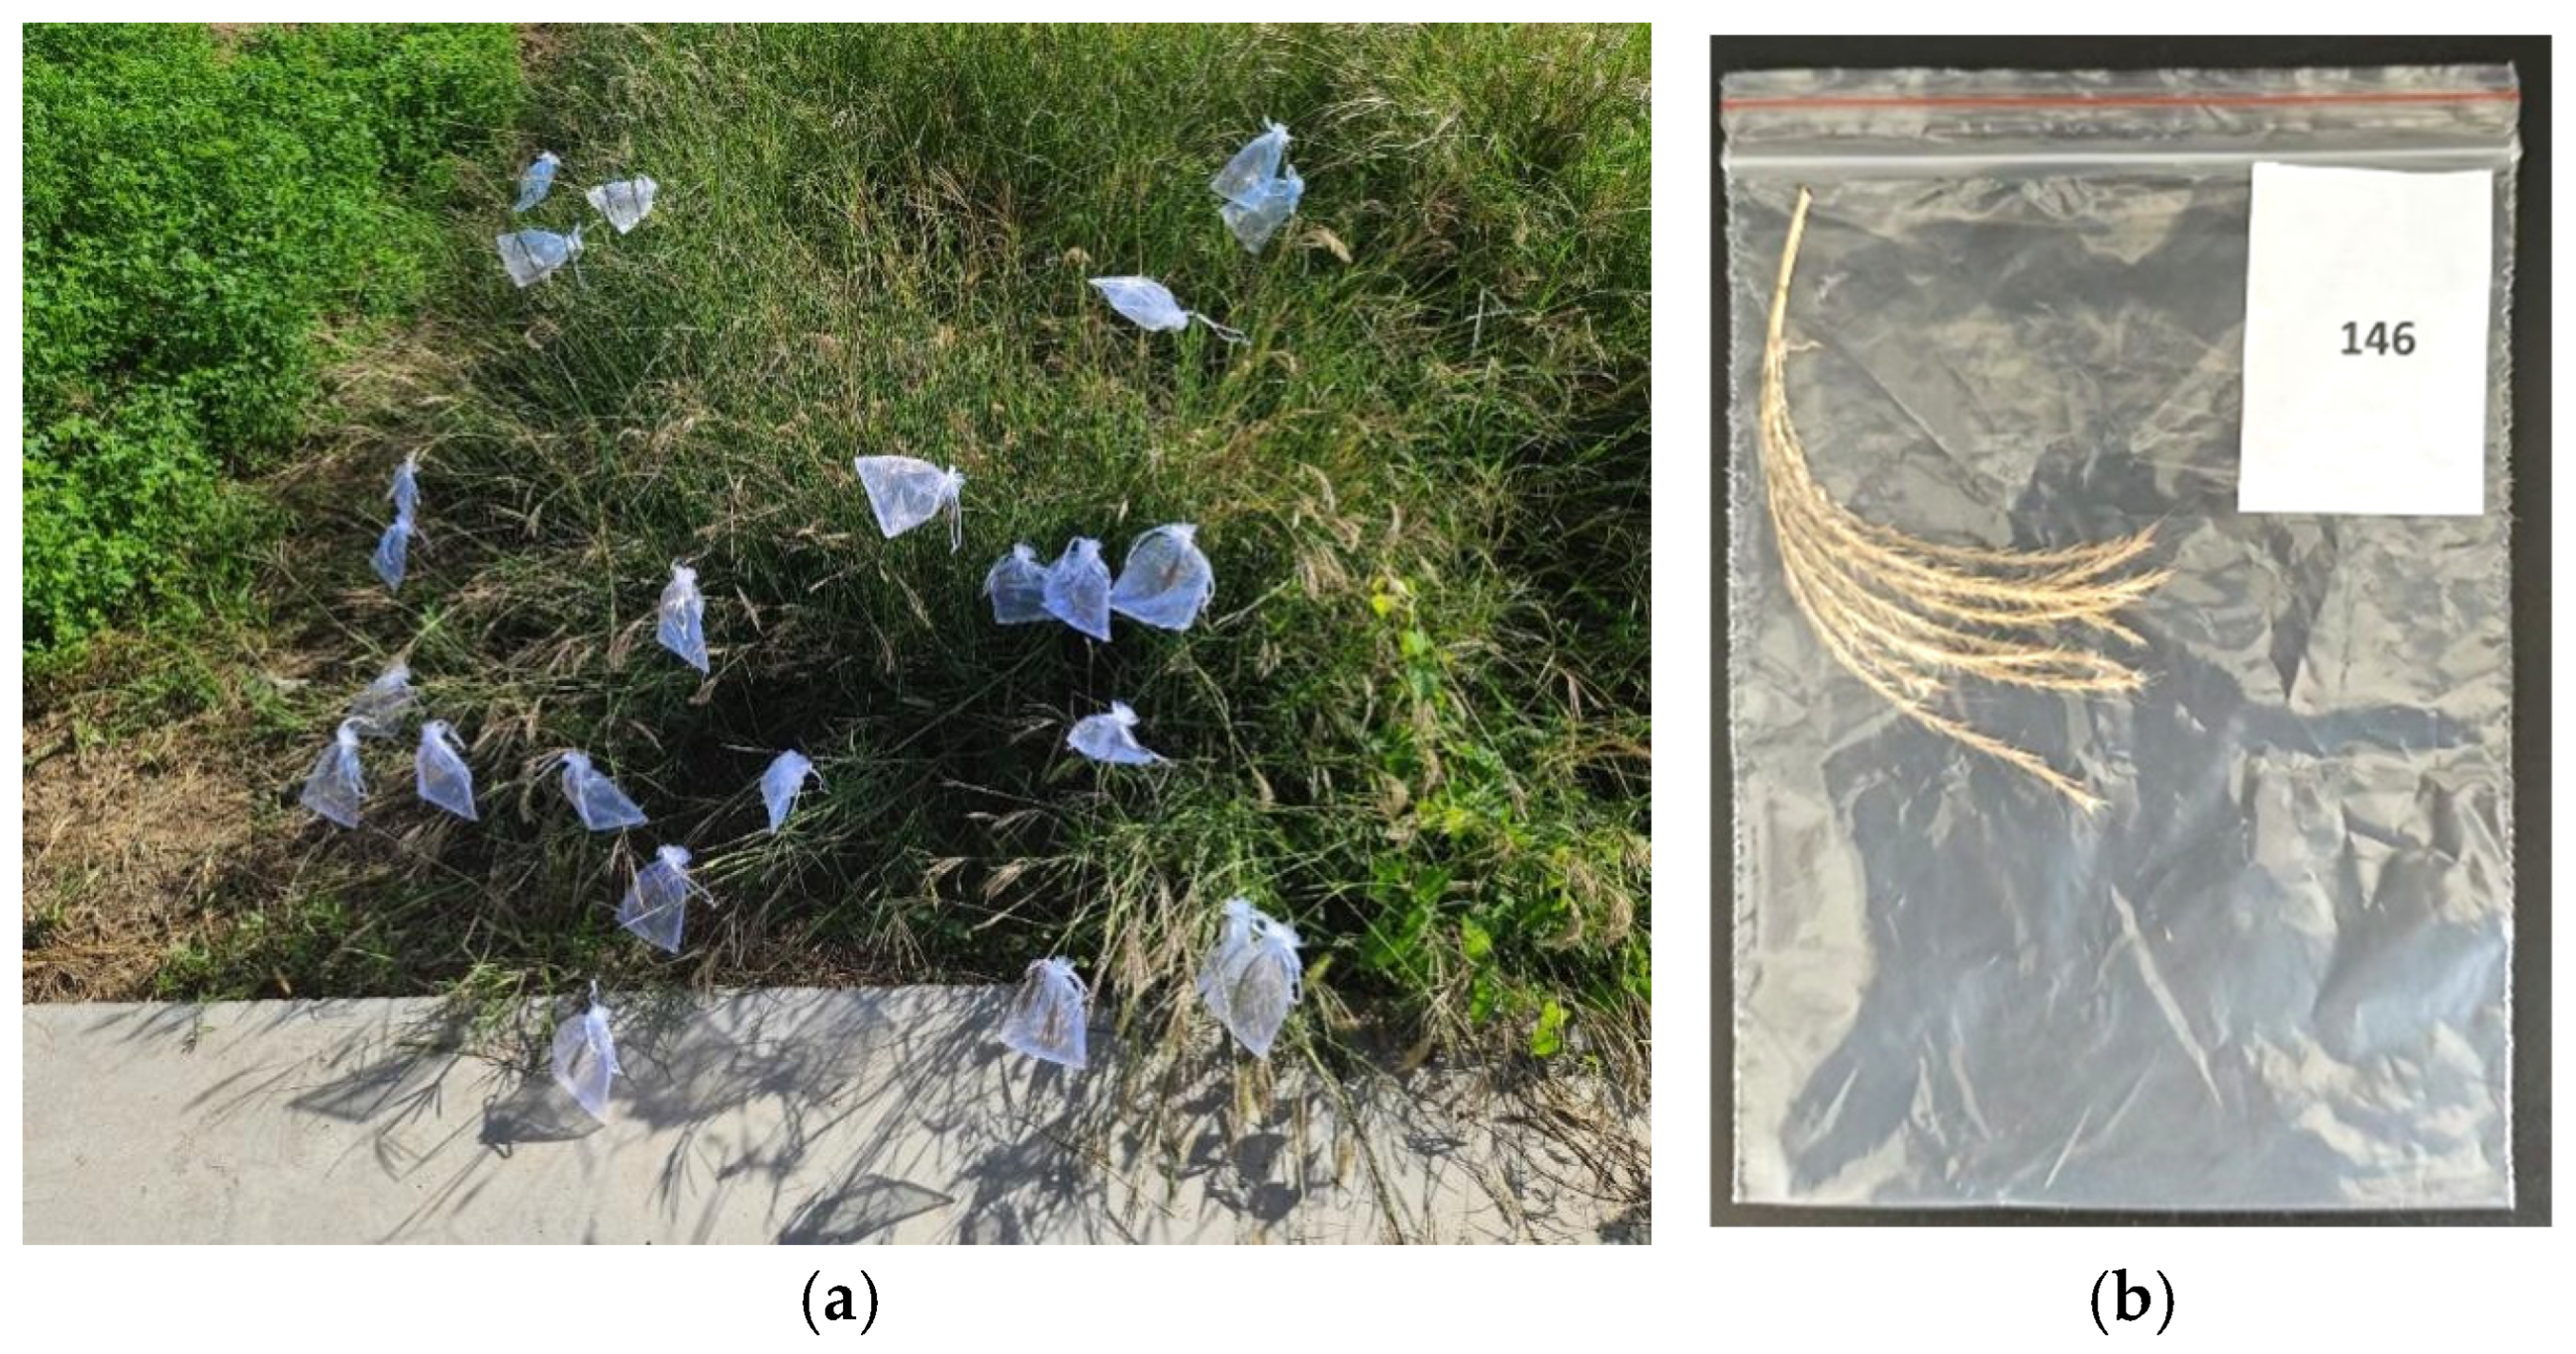
Bothriochloa ischaemum spikes and images used in this study were collected from the Forage Research Station of Shanxi Agricultural University, located in Taigu District, Jinzhong City, Shanxi Province, China (37.4° N, 112.5° E). To ensure the samples are representative of the morphological and phenotypic variations of the target species, we adopted a stratified random sampling strategy. Researchers divided the experimental field into 9 small regions by growth stage and, within each region, stratified sampling was conducted based on plant density. Subsequently, simple random sampling was employed to select samples within each stratum. The sampling results covered multi-dimensional heterogeneous conditions, including phenotypic indicators such as different growth stages, various spike lengths, and different seed numbers, as well as overlapping gradients of varying plant densities. The spikes were harvested in October 2024. To ensure accurate seed counting and minimize seed loss, individual spikes were bagged before maturity to prevent seed shedding. After reaching full maturity, the spikes were cut at the peduncle and placed in transparent plastic bags labeled with unique identification numbers. As illustrated in
Figure 2, the images show the bagged spikes before harvest and their condition after collection.
Outdoor spike images of
B. ischaemum were collected using multiple mobile devices, including iPhone 15 Pro Max (Apple, Cupertino, CA, USA), iQOO Neo7 (iQOO/vivo, Dongguan, China), Xiaomi 10 (Xiaomi, Beijing, China), iQOO Z5 (iQOO/vivo, Dongguan, China), and iPhone 12 (Apple, Cupertino, USA). A total of 1640 images were acquired. After removing blurry and low-quality images, 1347 images in JPG format were retained for subsequent processing. According to the explanations from experts in the field of grassland science, the spikes of
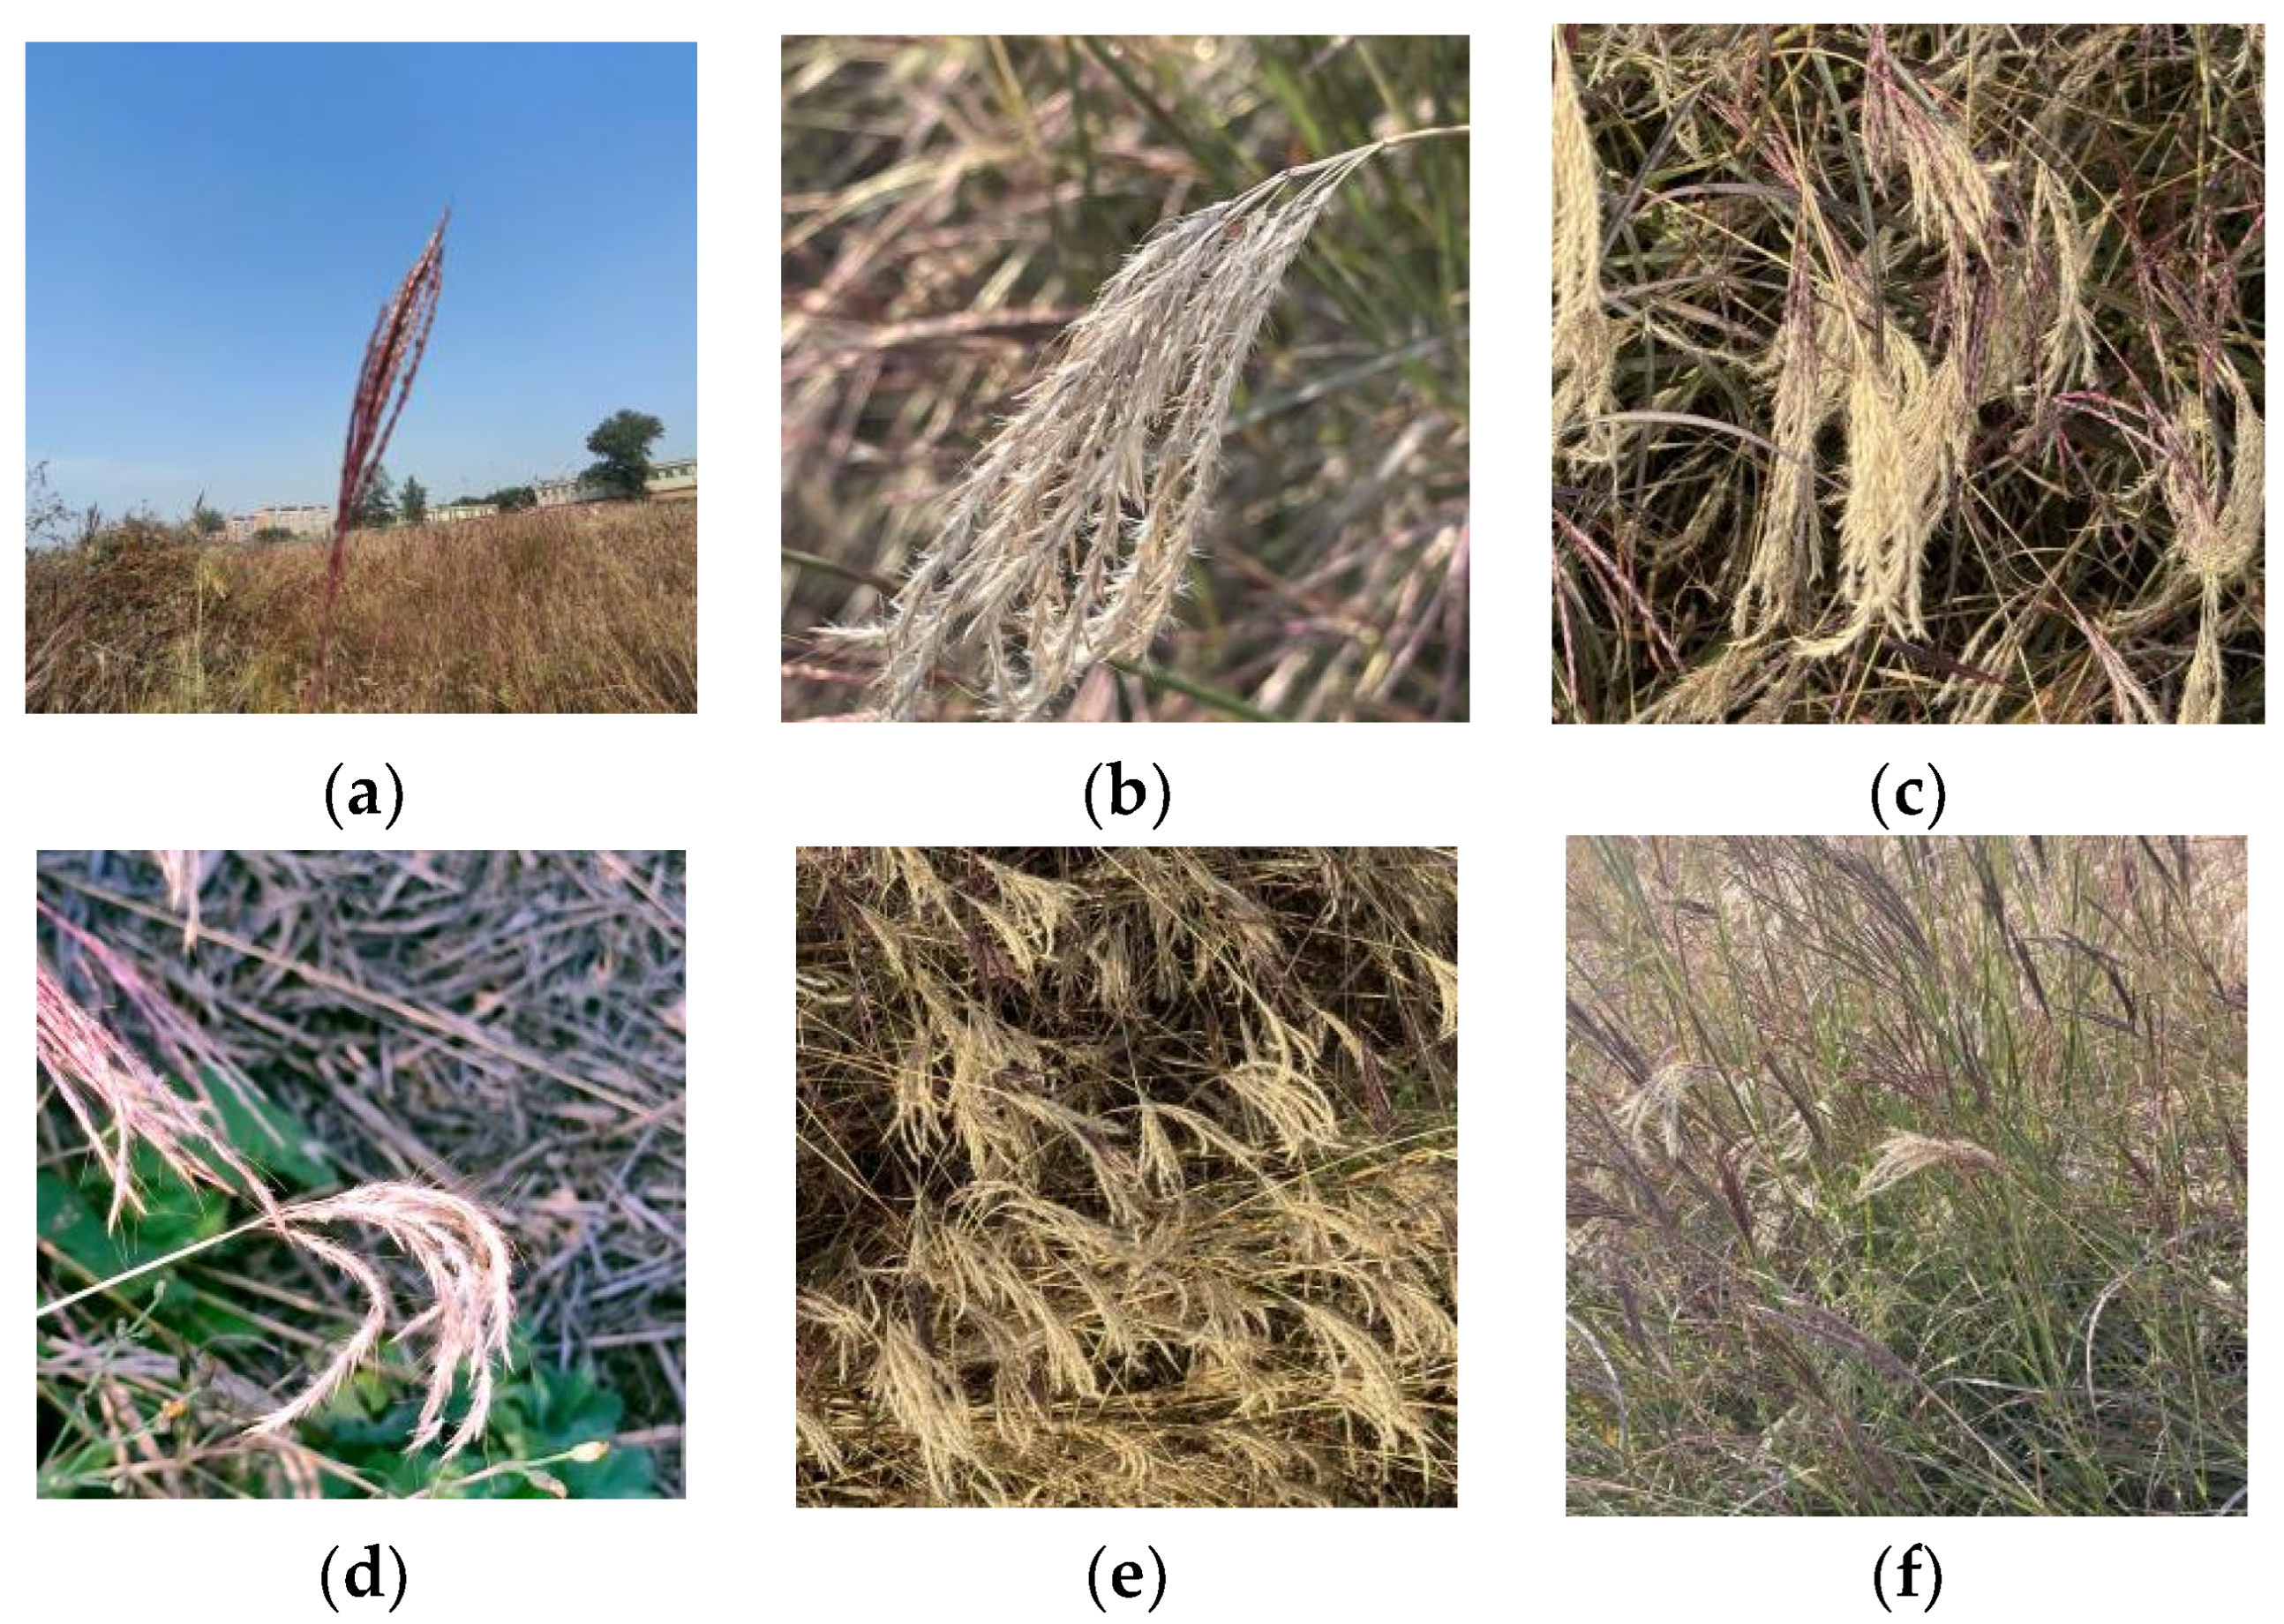
B. ischaemum can be classified as mature or immature. Immature spikes typically exhibit a green or greenish-blue hue, with a relatively vibrant color. These spikes tend to be compact, with tightly arranged inflorescences. As the maturity level increases, the color of the spikes gradually changes, transitioning from green to yellowish-green or light yellow. The spikes become looser, with inflorescences arranged more sparsely, and the overall spike may display a certain degree of curvature or drooping. According to spike maturity, the collected samples were categorized into two classes: “Mature” and “Immature.” During data collection, several challenging characteristics of
B. ischaemum spikes were observed, including mutual occlusion, complex and dense backgrounds, and a high proportion of small targets (
Figure 3). The dataset was manually annotated using the LabelImg tool (Tzutalin, San Francisco, CA, USA) [
31]. Each spike was labeled according to its maturity stage: “Mature” and “Immature.” To improve the diversity and representativeness of the dataset, this study adopted data augmentation techniques to expand the dataset and enhance the model’s robustness, with two specific augmentation operations implemented: contrast adjustment and horizontal flipping. To avoid data leakage, the non-augmented dataset was split into the training set, validation set, and test set at a ratio of 7:2:1. Finally, the split and augmented training set contains 2828 images, the validation set contains 808 images, and the test set contains 405 images.
To investigate the number of seeds on individual inflorescences, images of
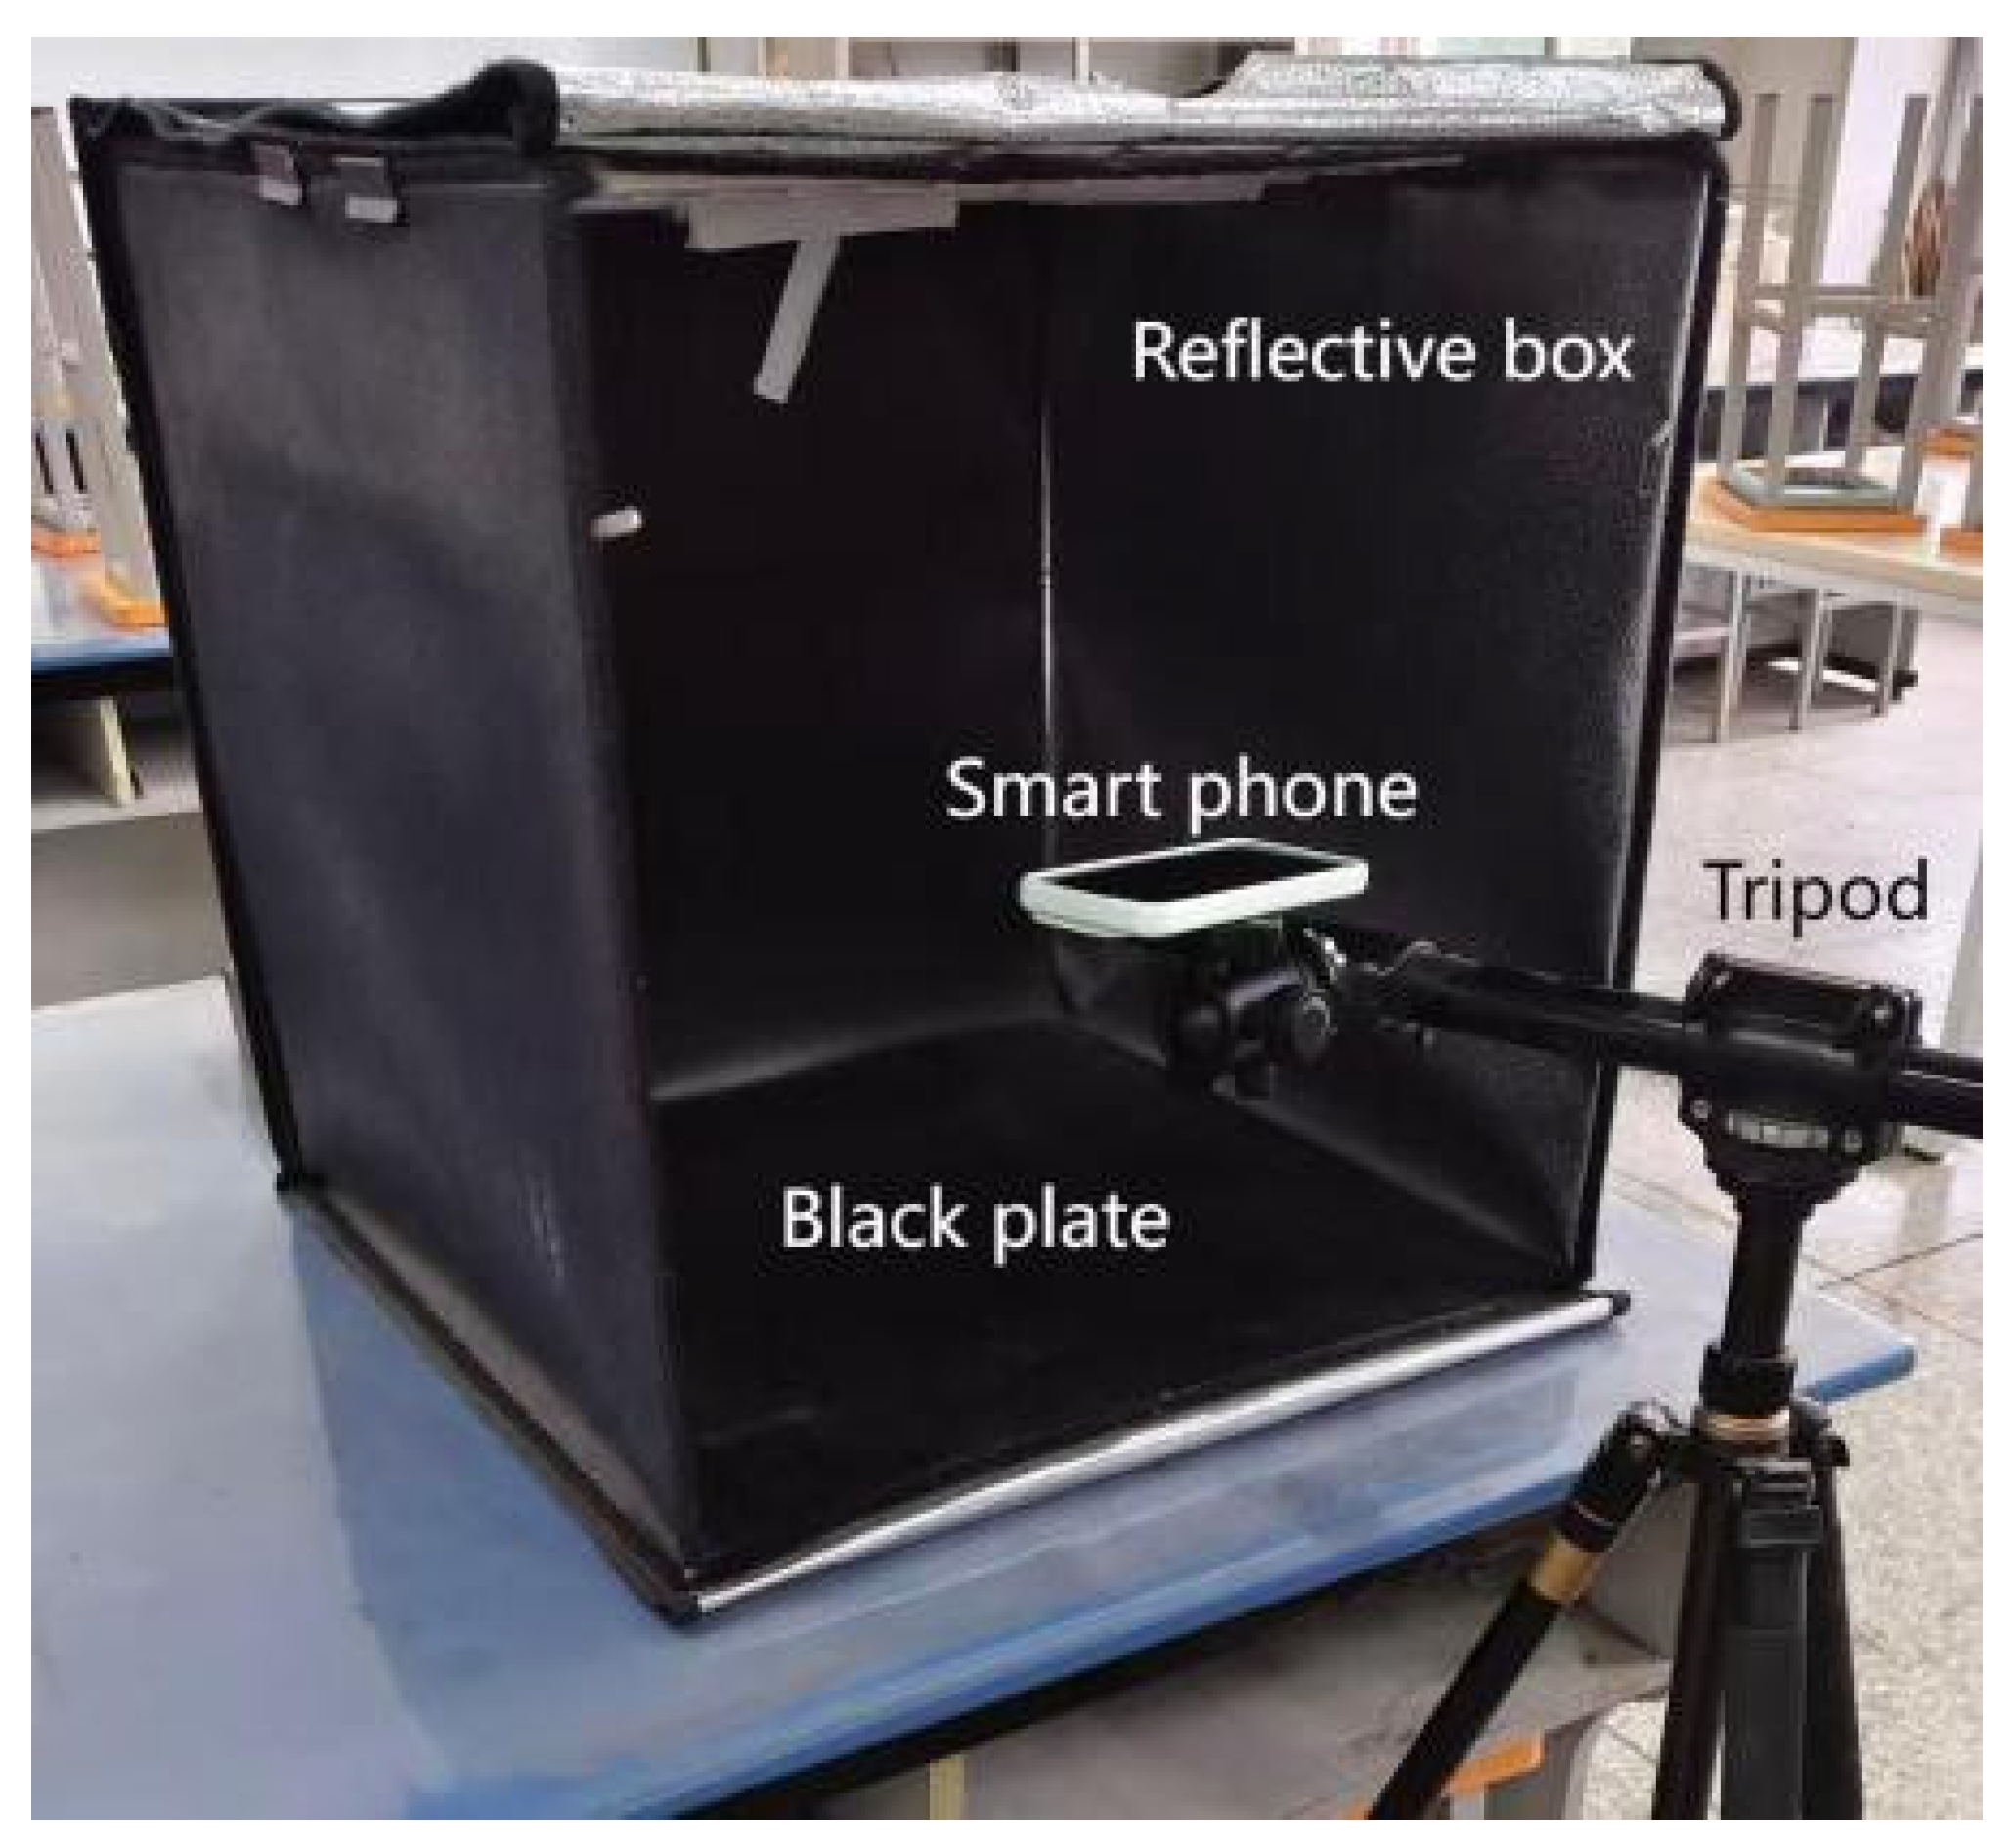
B. ischaemum seeds in their natural state were collected indoors. As shown in
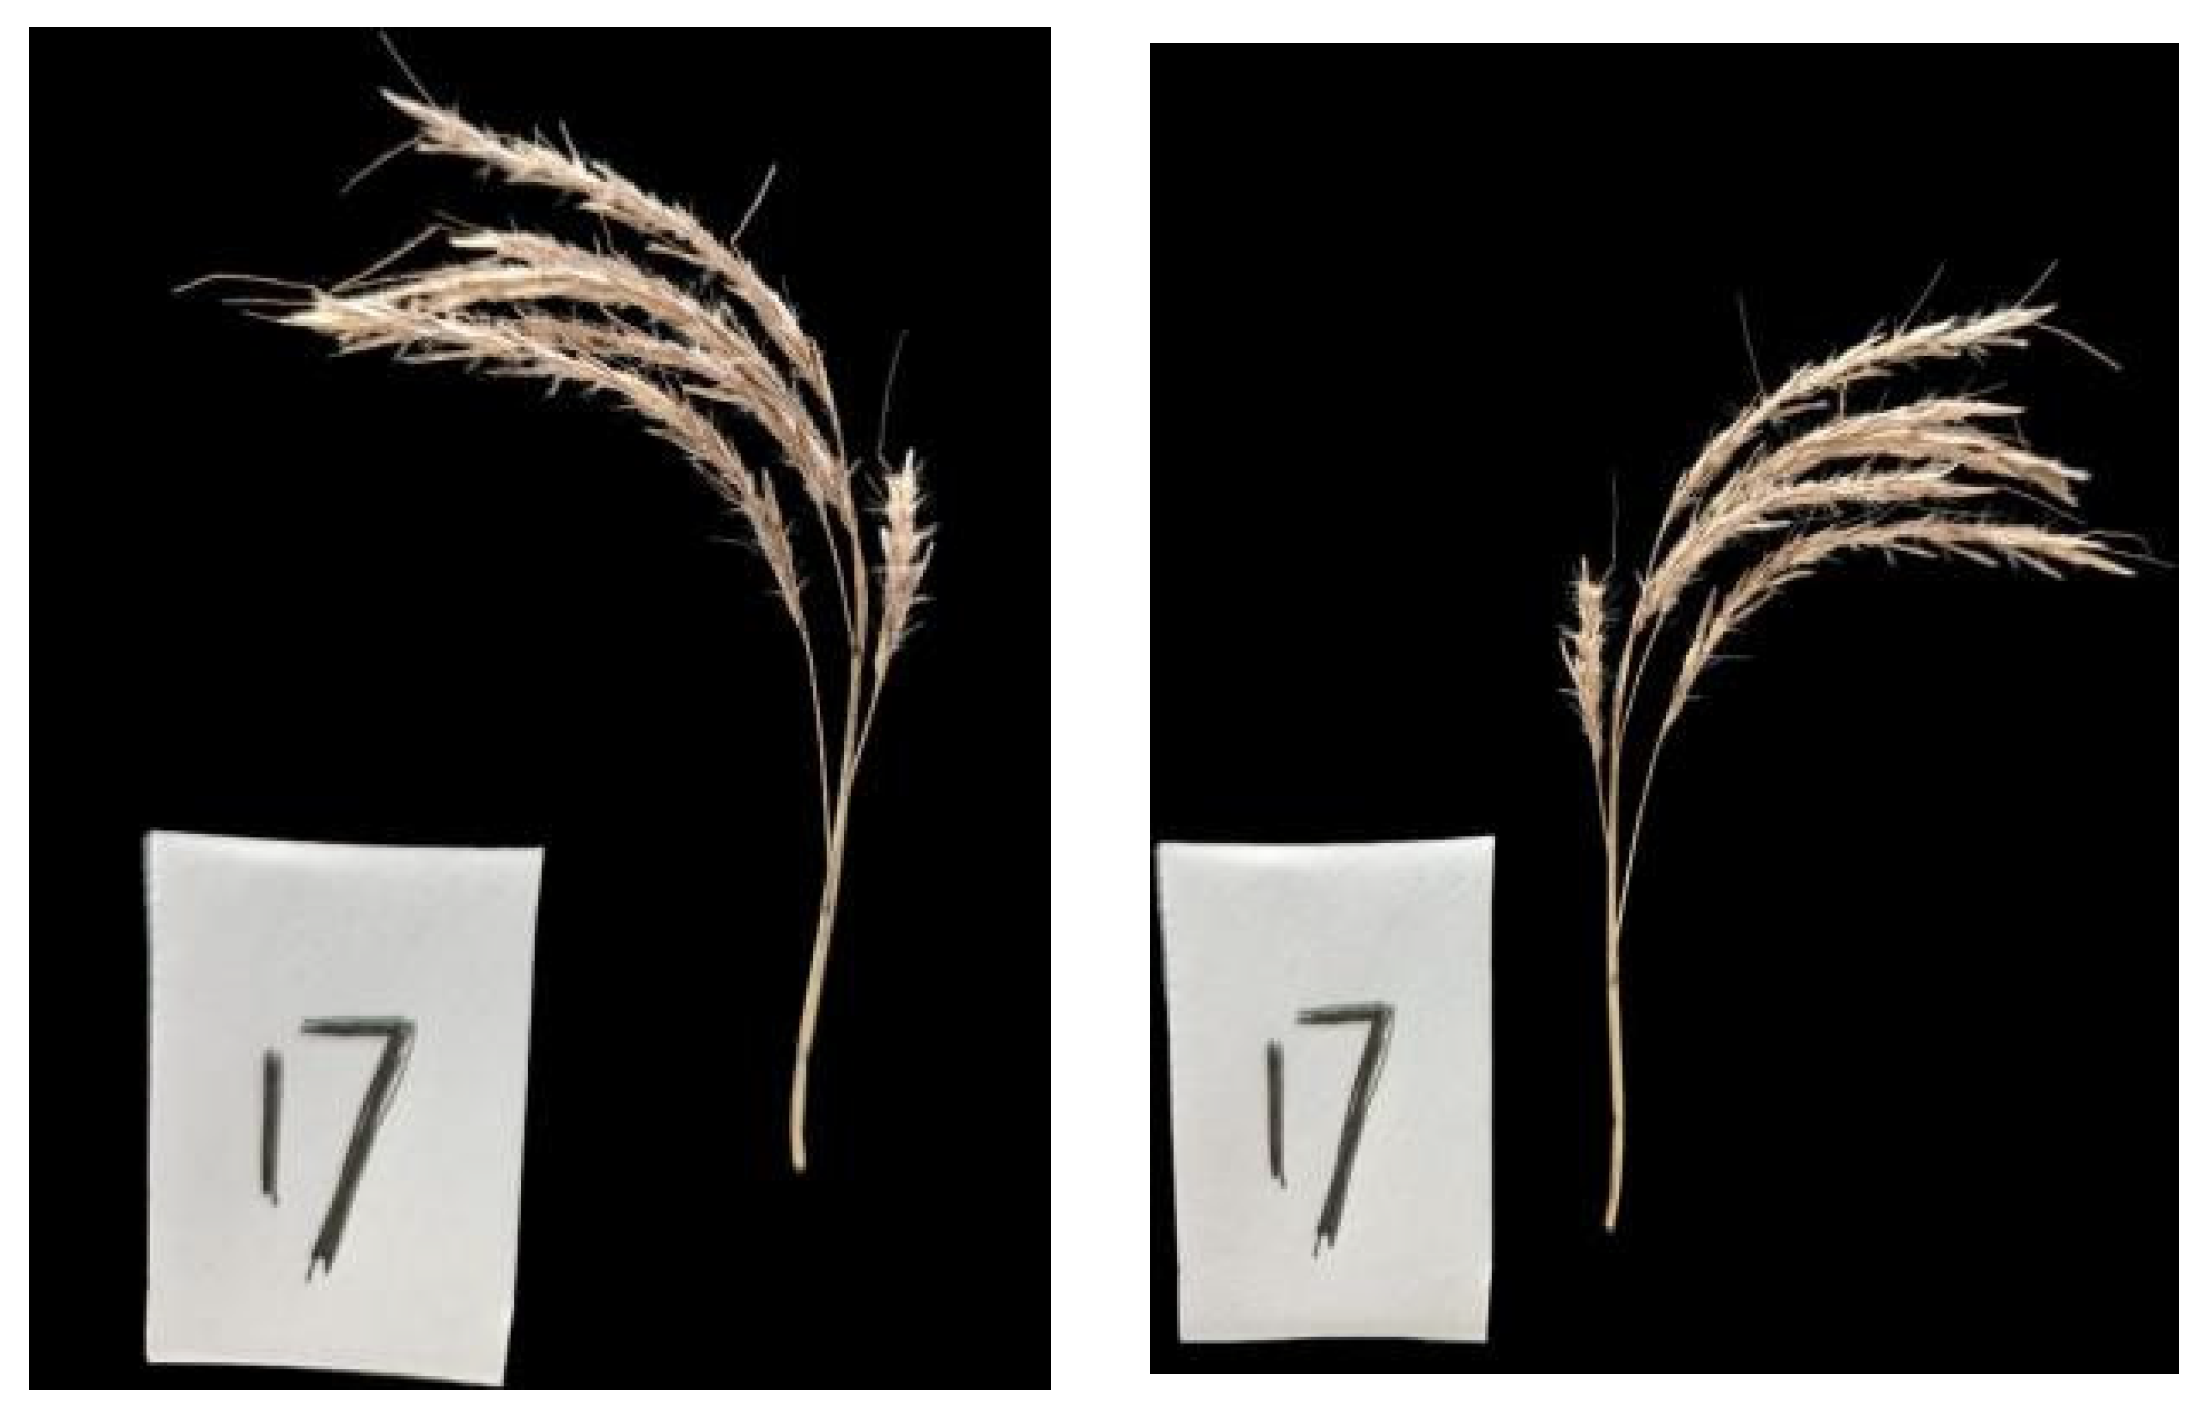
Figure 4, using a reflective box can eliminate shadows and evenly distribute light, while a tripod ensures that the equipment remains stationary during shooting. Additionally, a black plate helps highlight the outline of the inflorescences and reduces background interference. Each inflorescence was placed on a black background board labeled with a unique identifier, and images were captured using the automatic shooting mode of the iQOO Neo7 smartphone. To ensure consistency among samples, all photographs were taken in a compact shadowless photo studio. The distance between the smartphone and the inflorescence was maintained at 15 cm, and the image resolution was set to 3060 × 4080 pixels. No manual adjustment was applied to the inflorescences during image acquisition. The process included opening the plastic bag, removing the inflorescence, photographing it, returning it to the bag, and sealing it again. Because each image only captured one side of the inflorescence, occlusion might affect the accuracy of seed counting. To address this, images were taken from both sides of each inflorescence, resulting in two images per sample (
Figure 5). After removing blurred images, a total of 260 high-quality images were obtained, with approximately 4700 labeled boxes in total, which were used for the target detection and image classification datasets.
All deep learning experiments in this study were conducted on a Windows 11 operating system equipped with an i9-13900H CPU (Intel, Santa Clara, CA, USA), 16 GB of RAM (Samsung, Suwon, Republic of Korea), and an NVIDIA GeForce RTX 4070 GPU (NVIDIA, Santa Clara, CA, USA) with CUDA version 12.8. Model training, scatter plot visualization, regression analysis, and data augmentation were performed using PyCharm Community Edition 2024.3.1.1.
2.2. Performance Evaluation Metrics
The performance of the object detection models in this study was evaluated using precision (
P), recall (
R), and mAP@50. The corresponding calculation formulas are given in Equations (1)–(3):
Among them, by combining the true categories of samples with the predicted categories by the model, samples are classified into four categories: true positives (, positive samples predicted as positive), false negatives (, positive samples predicted as negative), false positives (, negative samples predicted as positive), and true negatives (, negative samples predicted as negative). Average precision (AP) is a metric for evaluating the accuracy of a single class, while mean average precision (mAP) is the mean of the average precisions across multiple classes. In Equation (3), k represents the number of label categories. In this study, k is 2 for the detection of Bothriochloa ischaemum spikes and 1 for the detection of Bothriochloa ischaemum seeds.
mAP50-95 is the definitive COCO-standardized metric for object detection and holds critical significance for small object detection. It averages mean Average Precision across ten Intersection over Union thresholds ranging from 0.50 to 0.95, rigorously evaluating both recall and localization precision. This multi-threshold design directly addresses core challenges in small object scenarios, such as ambiguous feature representation and precise alignment difficulties, while enabling objective quantification of model ability to capture sparse small objects and avoid false detections.
For seed count regression, predicted counts from the YOLOv12-EVC model were calibrated against manually obtained ground truth counts. Regression performance was evaluated using mean absolute error (MAE) and mean absolute percentage error (MAPE). MAE quantifies the average absolute deviation between predicted and true counts, treating all errors equally, while MAPE measures the average relative error as a percentage, providing an intuitive indication of prediction accuracy relative to true values.
2.3. YOLOv12-DAN Network Architecture
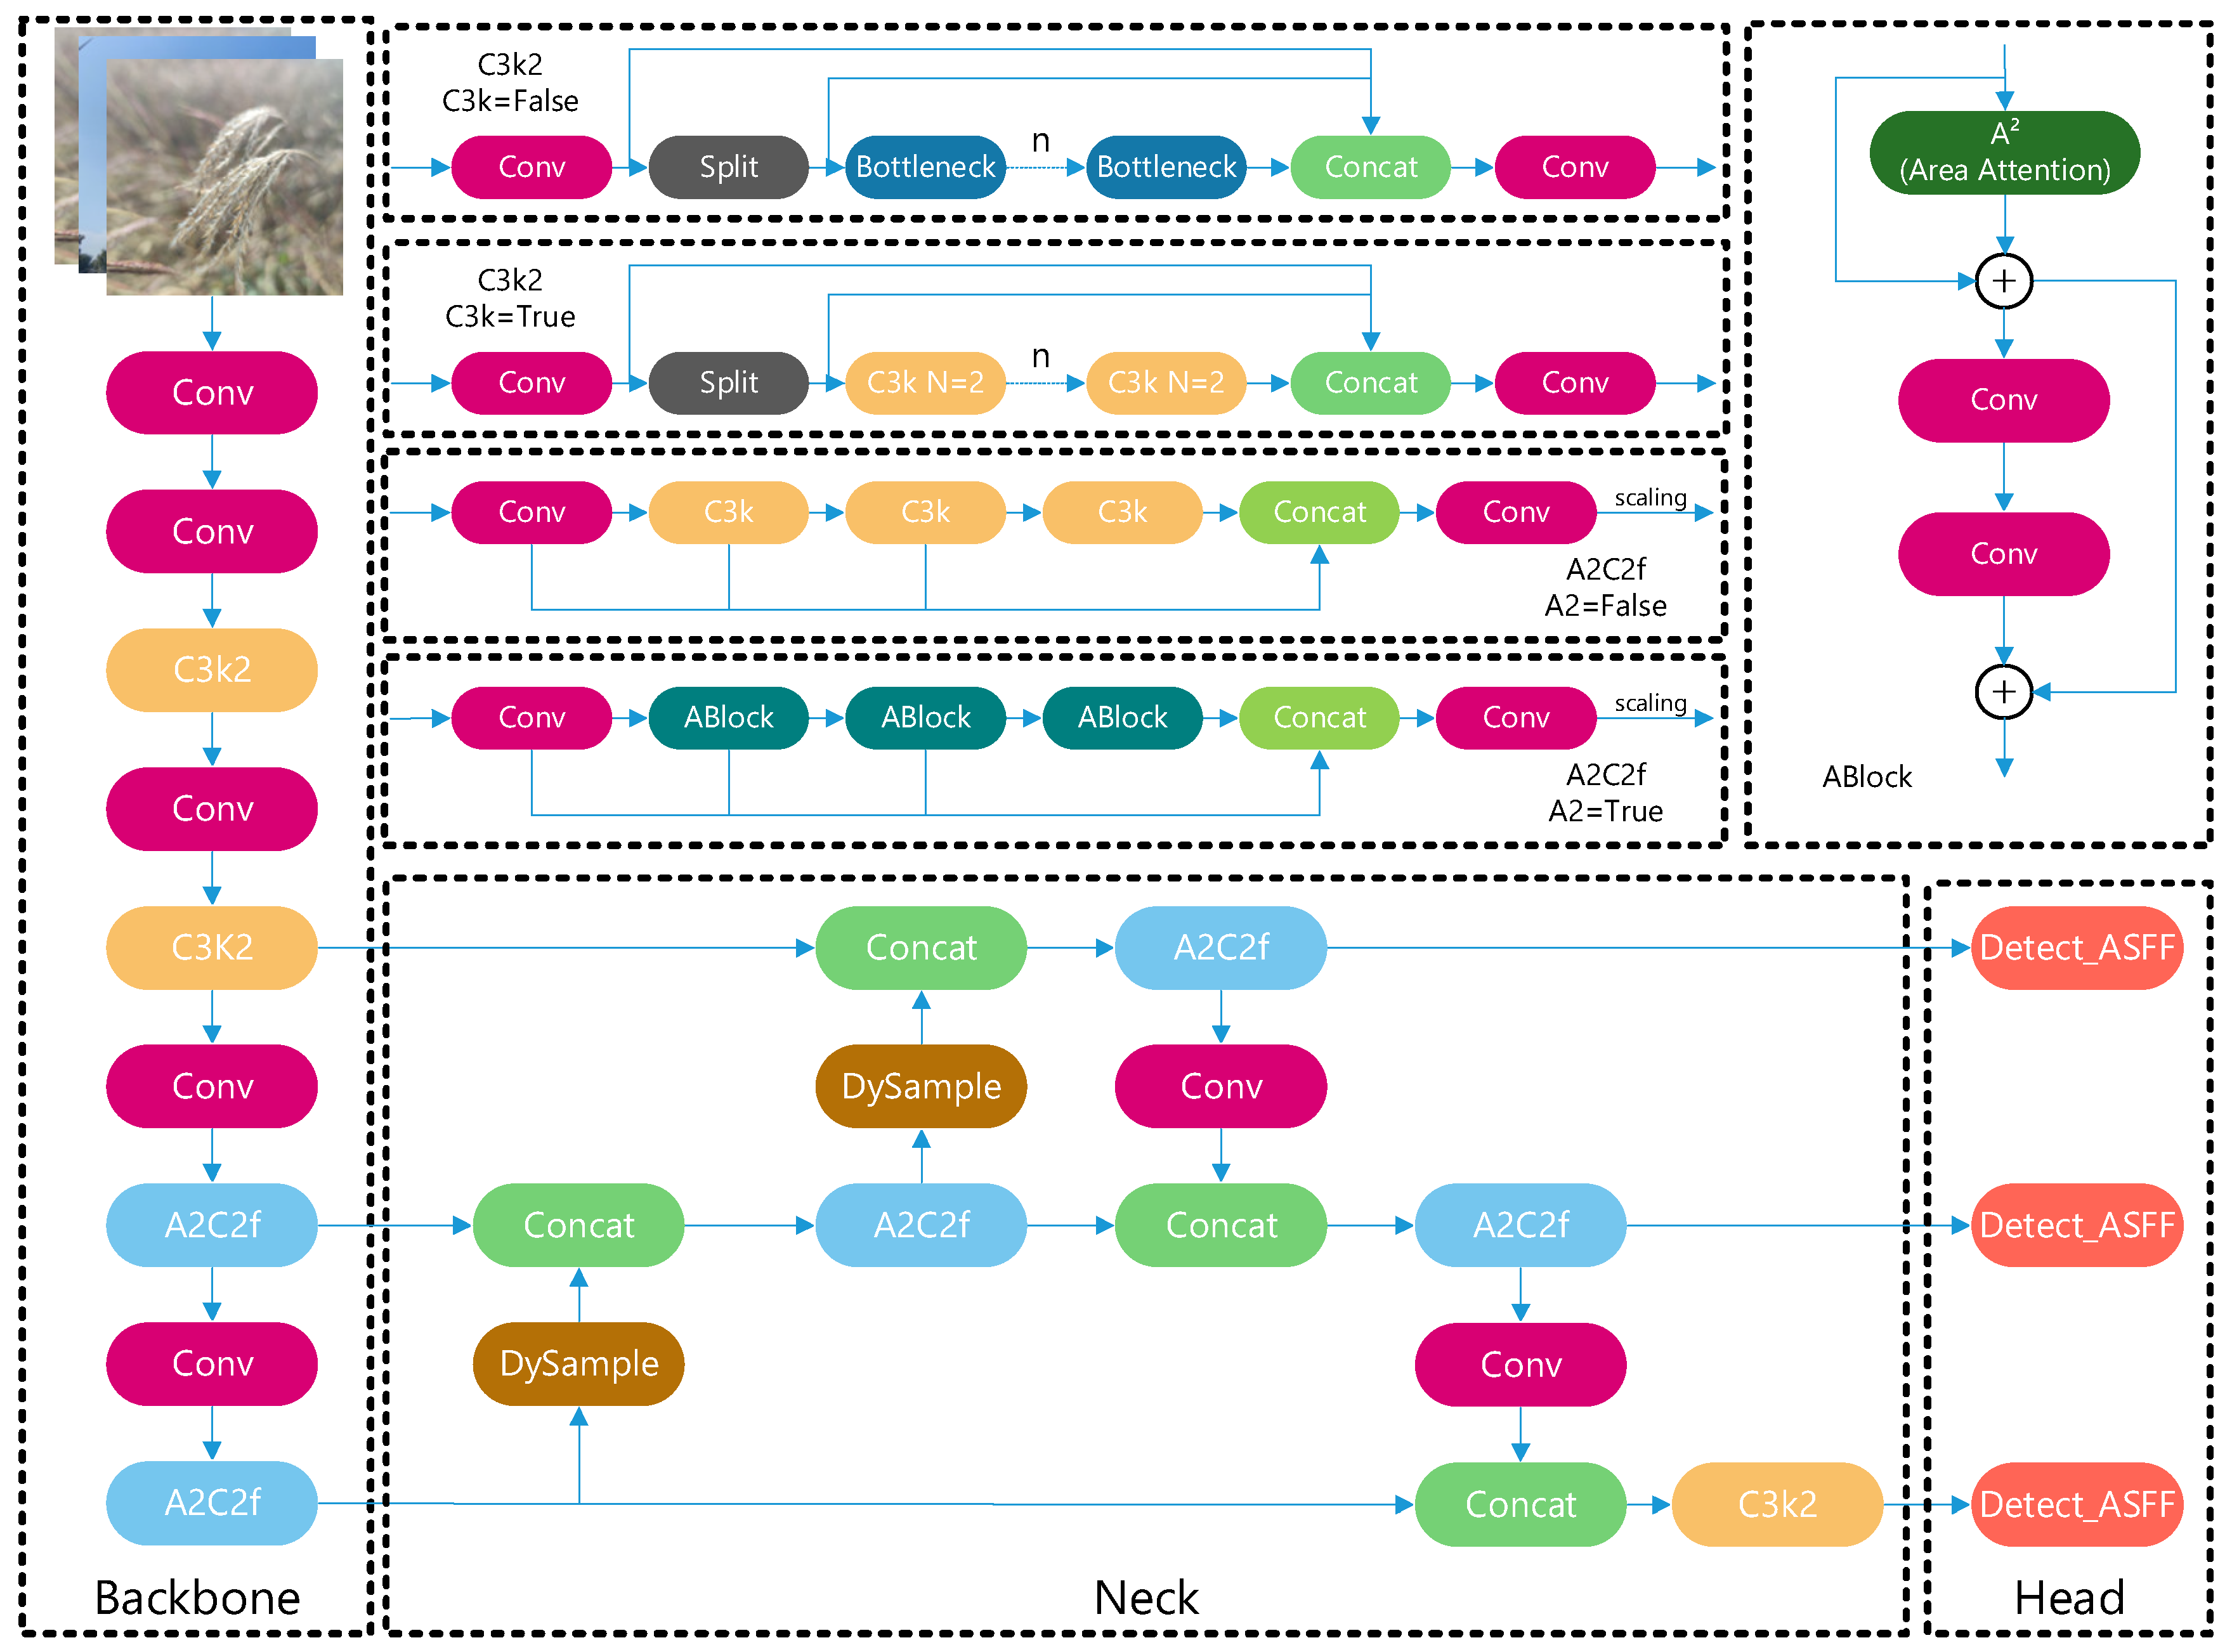
During the collection and annotation of Bothriochloa ischaemum spike images, several challenges were observed, including mutual occlusion, complex and dense backgrounds, and a high proportion of small targets. To address these issues, YOLOv12 was selected as the baseline model, and an improved model, YOLOv12-DAN, was developed with the following modifications:
- (1)
Dynamic upsampling (DySample): The standard upsampling was replaced with DySample to enhance detection accuracy for densely growing spikes.
- (2)
ASFF detection head: The detection head was modified to the Adaptive Spatial Feature Fusion (ASFF) structure to reduce missed detections caused by spike occlusion.
- (3)
NWD-based loss function: The loss function was changed to Normalized Wasserstein Distance (NWD) to improve small-target recognition within the spike dataset.
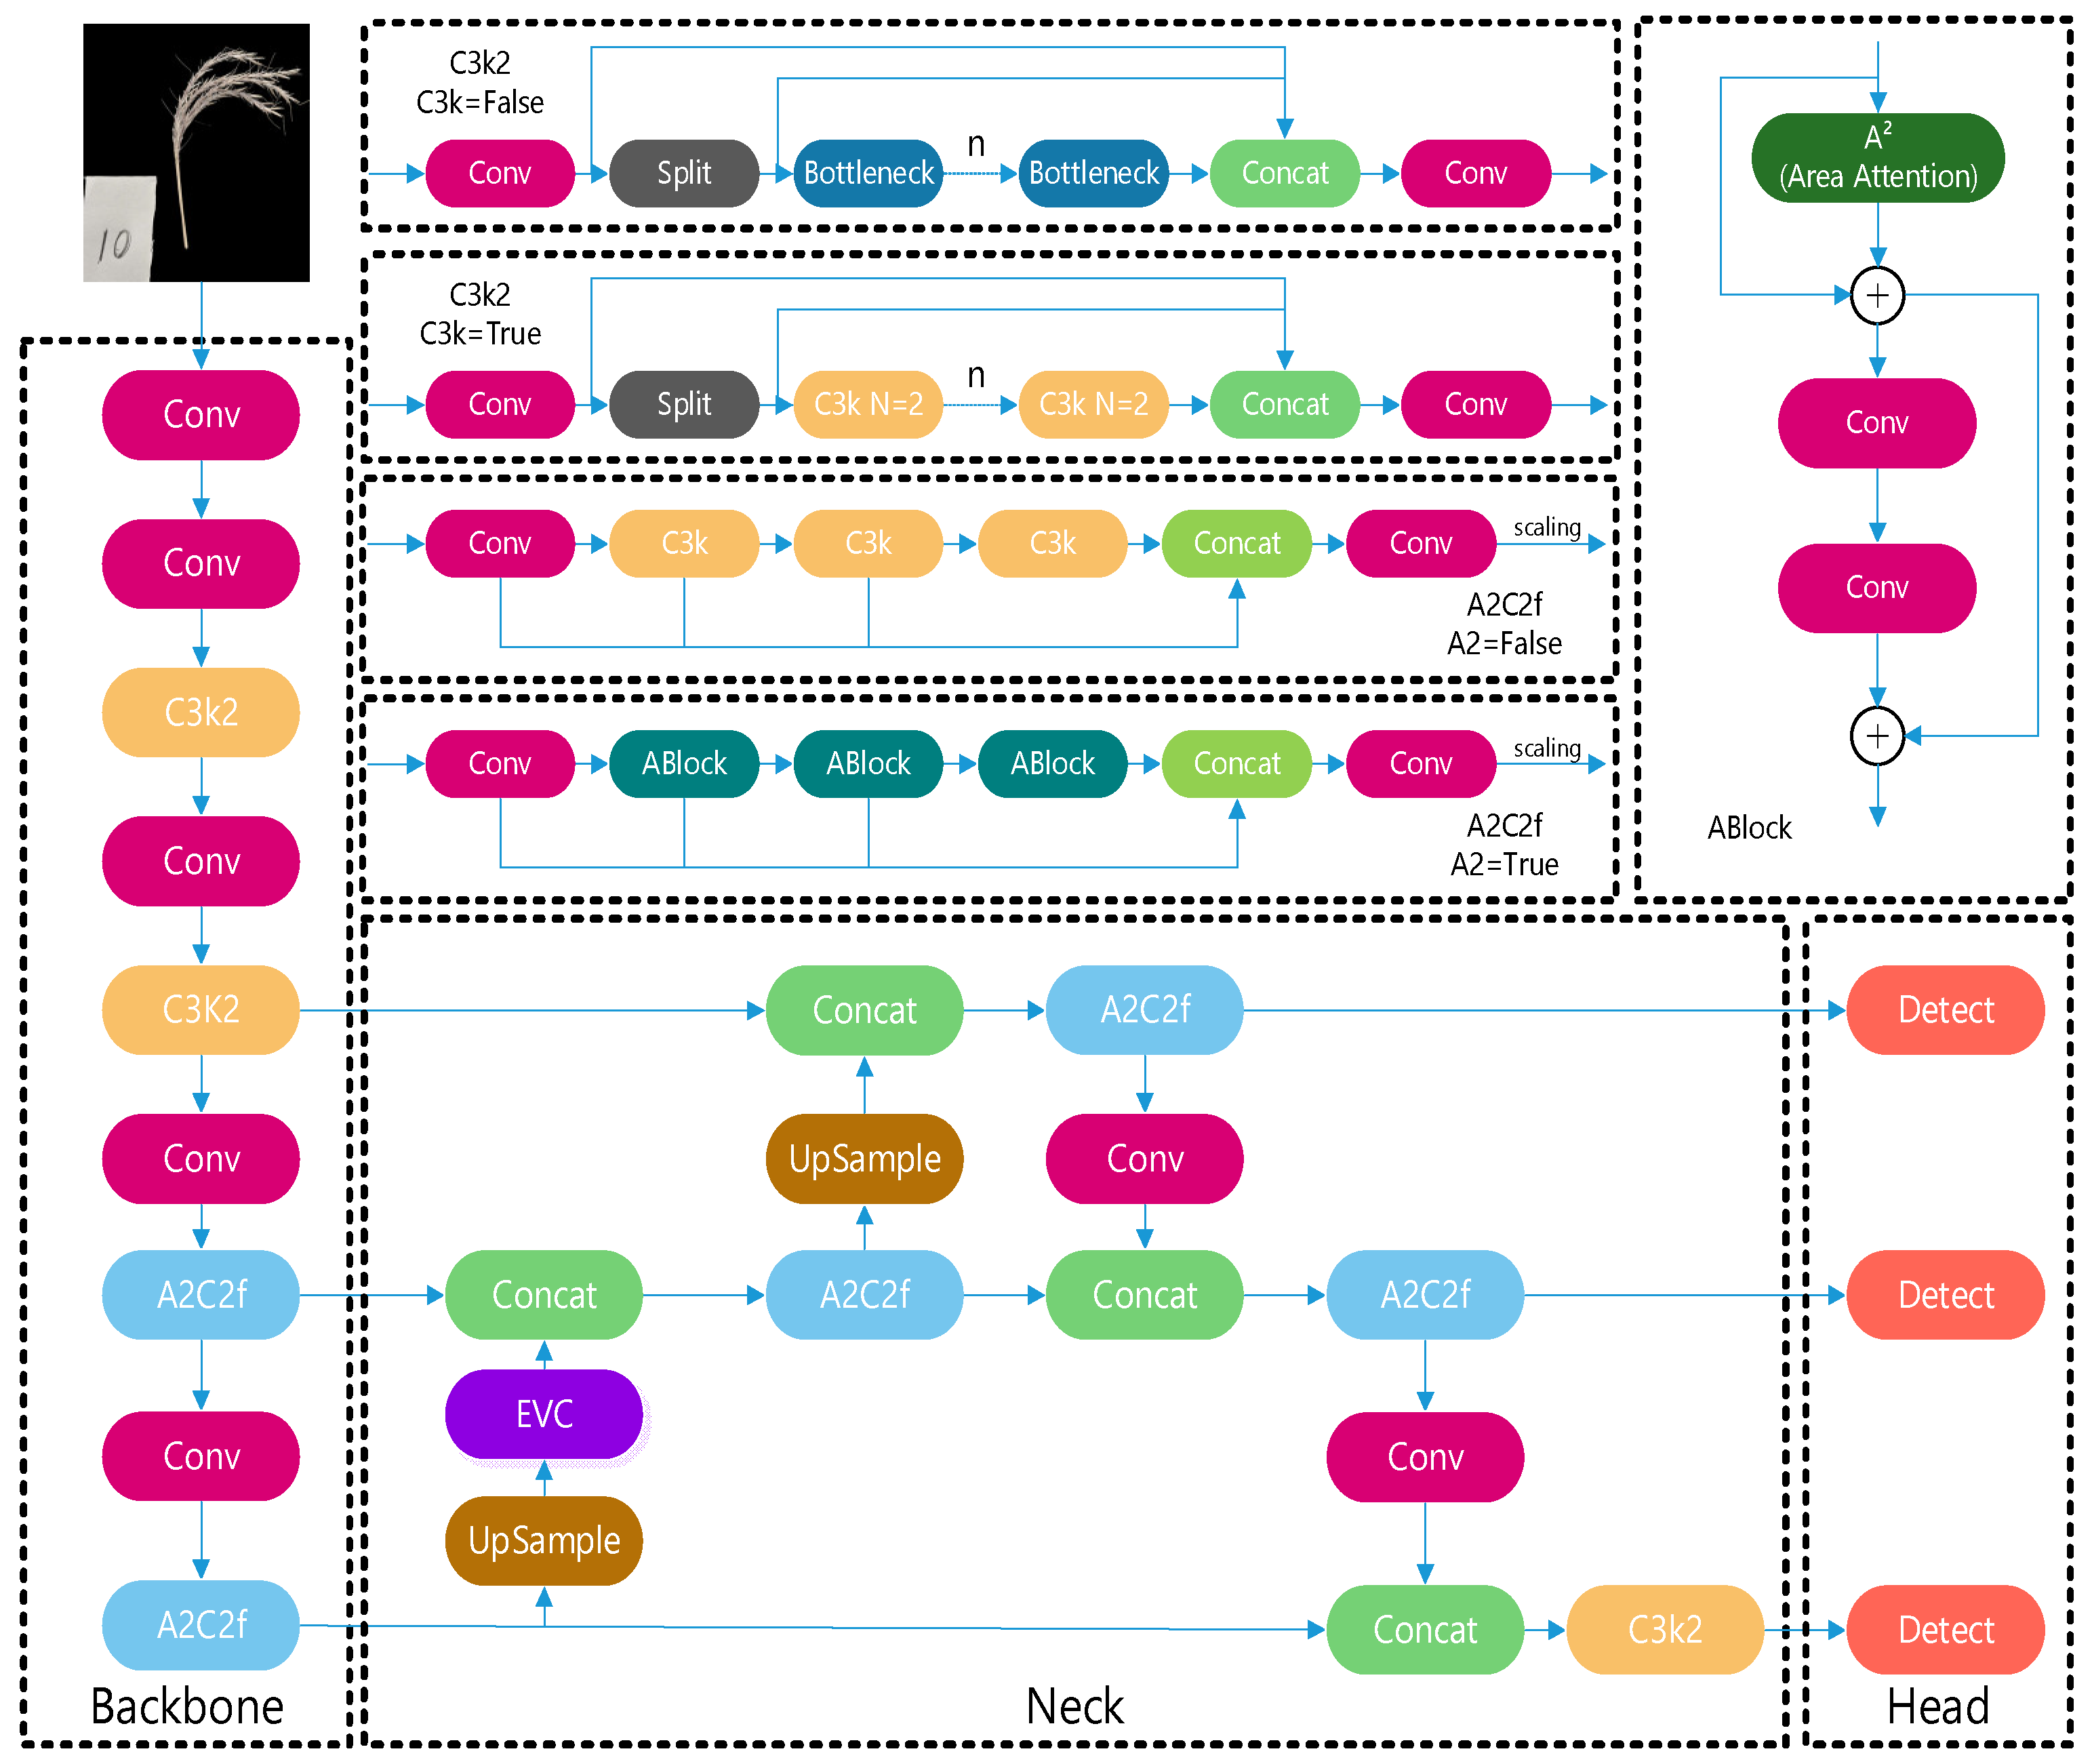
The network architecture of the improved YOLOv12-DAN model is illustrated in
Figure 6.
2.3.1. DySample Upsampling
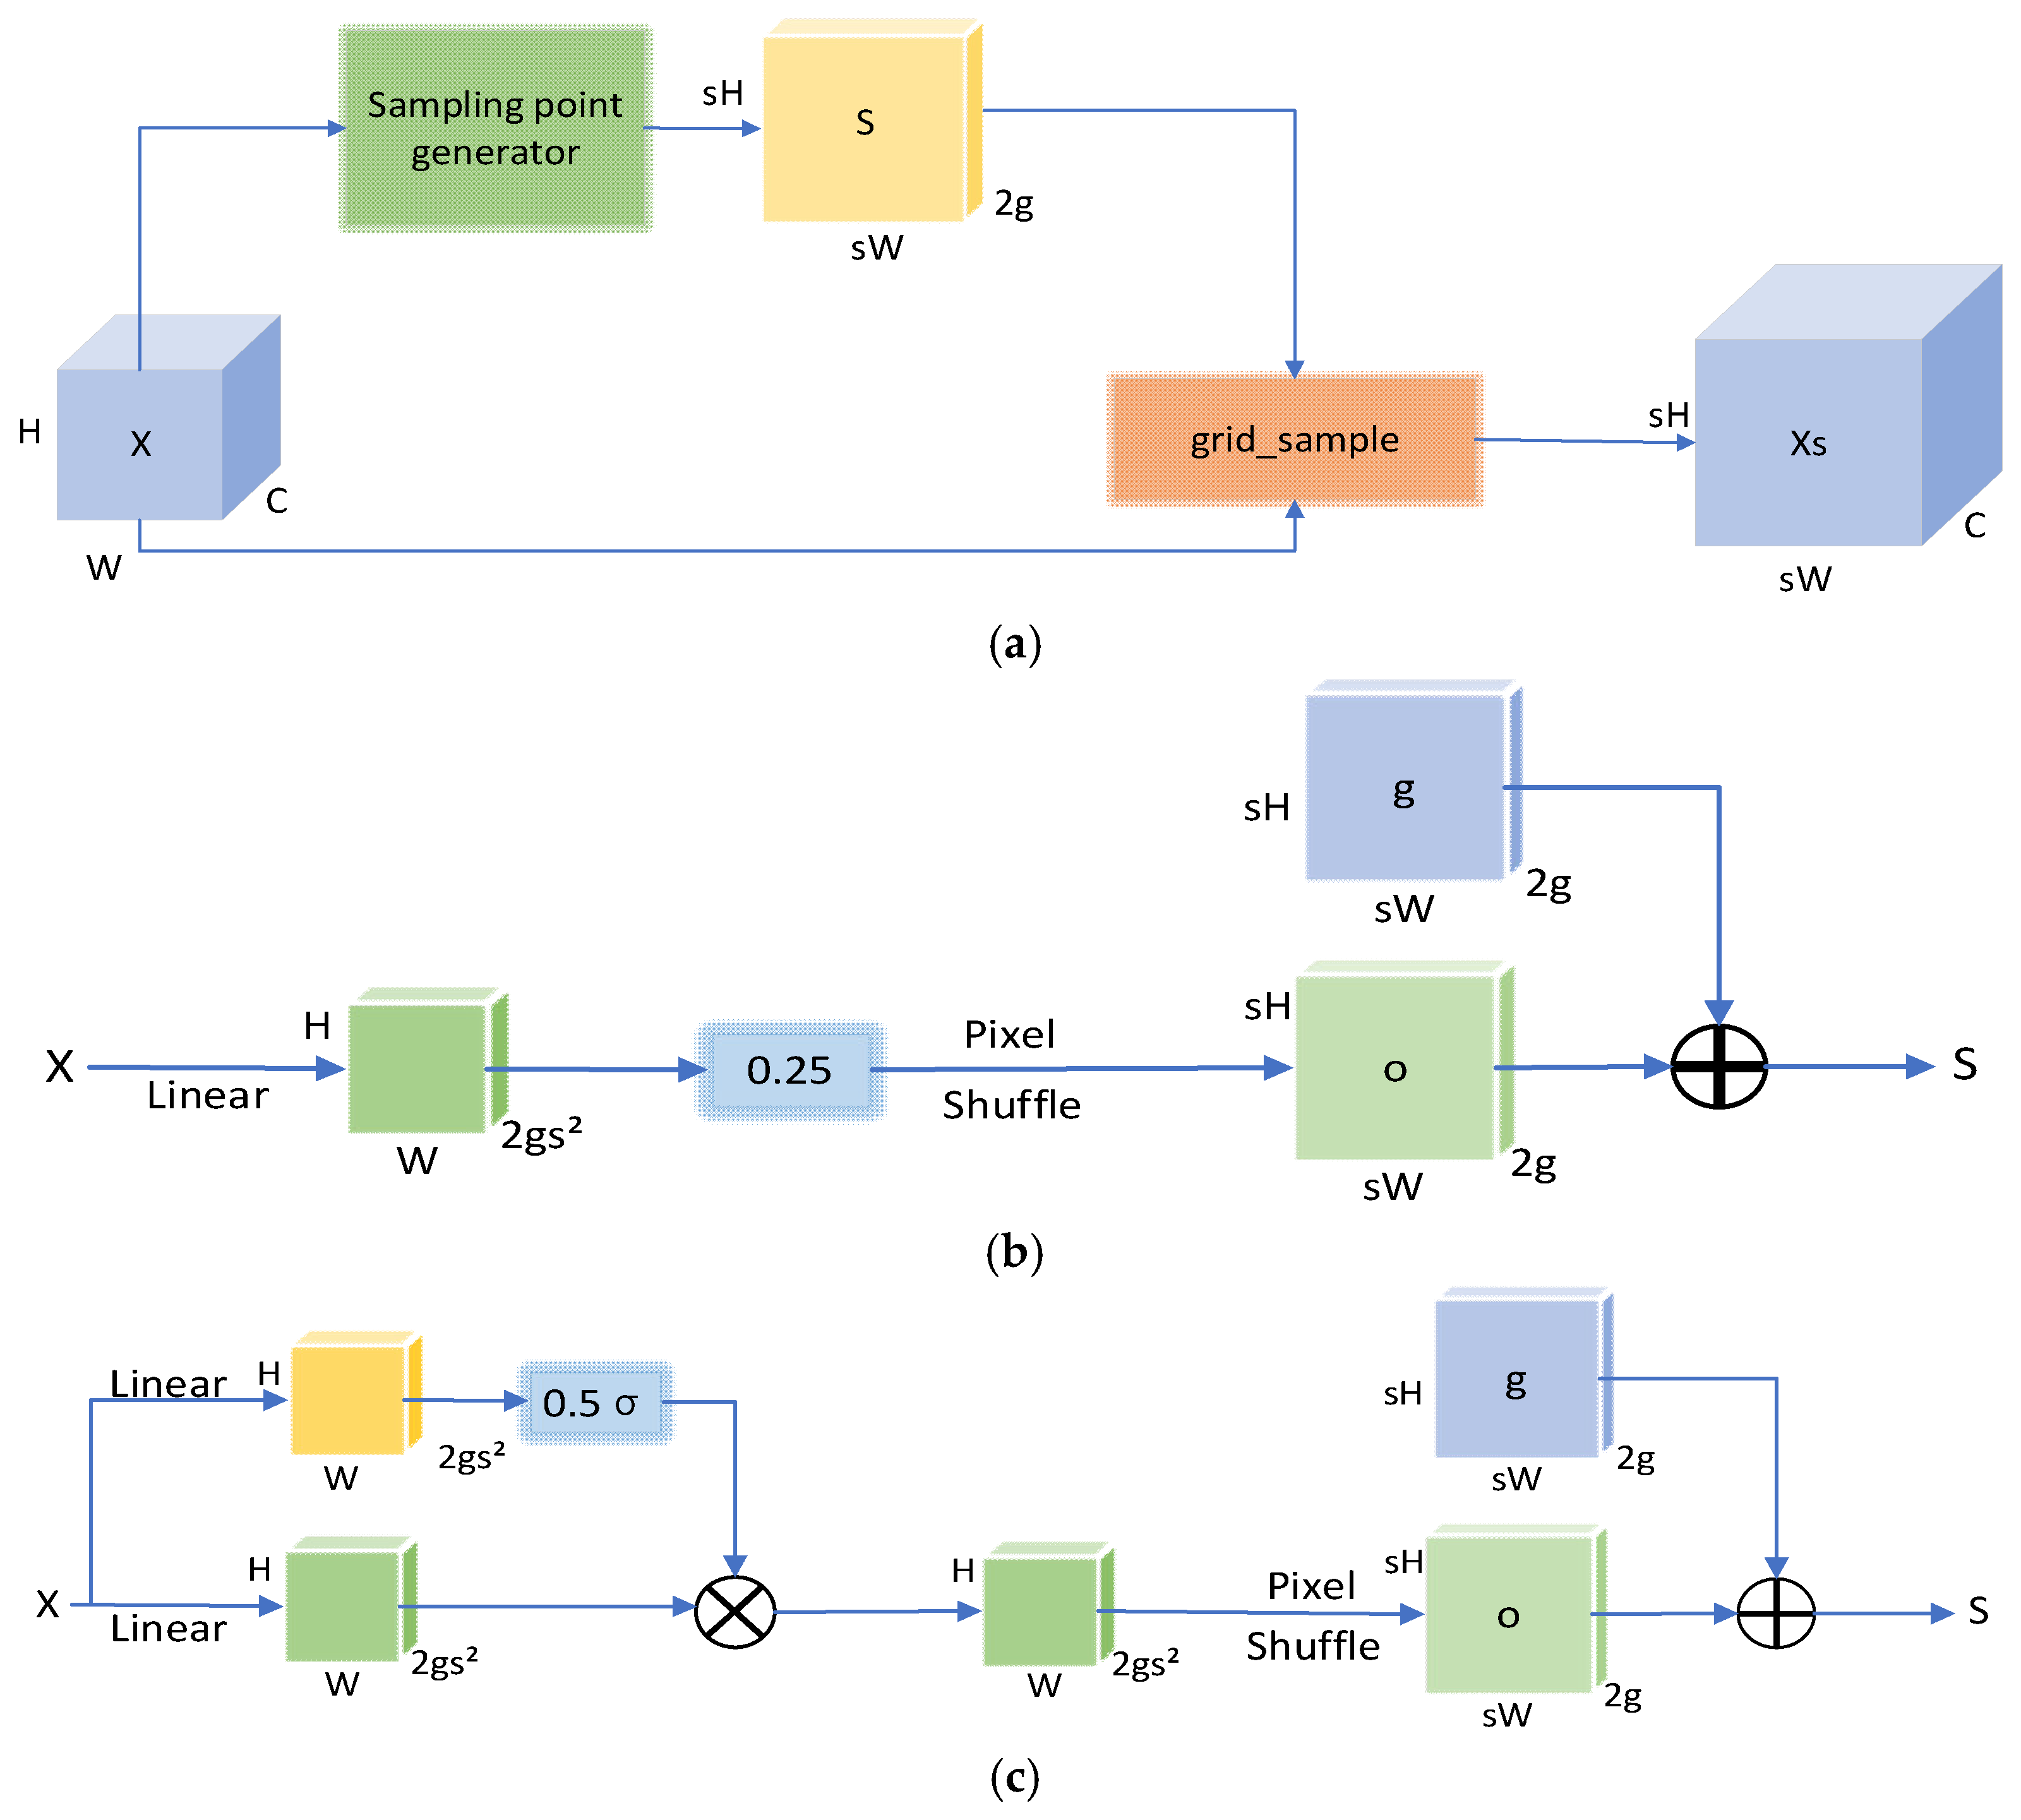
YOLOv12 employs the traditional nearest-neighbor interpolation method for upsampling, which has limited flexibility and cannot be optimized for specific feature content. This can adversely affect the performance of the model in dense prediction tasks. For Bothriochloa ischaemum spikes, which grow densely, DySample is introduced at the Neck stage to perform dynamic upsampling. This approach not only preserves detailed and semantic information in the features but also maintains good performance under limited computational resources. Progressive upsampling of features is a critical process for restoring feature resolution. DySample uses a point-based sampling strategy consisting of two components: sampling point generation and grid sampling. The SPG (Sampling Point Generator) produces a set of sampling points, and the grid_sample function is employed to learn the coordinates of these points. The input feature map is then resampled to generate a high-resolution feature map. This approach avoids the high computational cost associated with dynamic convolution while providing adaptive and dynamic sampling capability.
Due to the presence of normalization layers, the output feature values are typically within the range [−1, 1], which can cause local sampling positions to overlap. DySample introduces static and dynamic scope factors to adjust the offsets. In the Sampling Point Generator, the low-dimensional feature obtained by linearly transforming the feature map is multiplied by a static scope factor (e.g., 0.25) to obtain the offset, as defined in Equation (4):
This restricts the movement range of the sampling positions, making the upsampling process more stable and controllable. The dynamic scope factor introduces a dynamic range factor 0.5
within [0, 0.5], which is used to further adjust the offsets, as shown in Equation (5):
Overall, the sampling point set S is computed as the sum of the offset and the original sampling grid positions g, as expressed in Equation (6):
The DySample architecture and the structure of its Sampling Point Generator are illustrated in
Figure 7.
Here, represents the offset, denotes the linear layer, refers to the result obtained by applying a linear transformation to the input feature map , is the set of sampling points, grid_sample is the grid sampling function, denotes the original sampled network location, is the dynamic range factor, H is the height of the feature map, W is the width of the feature map, and C represents the number of channels in the feature map.
2.3.2. ASFF Module
Dense growth of
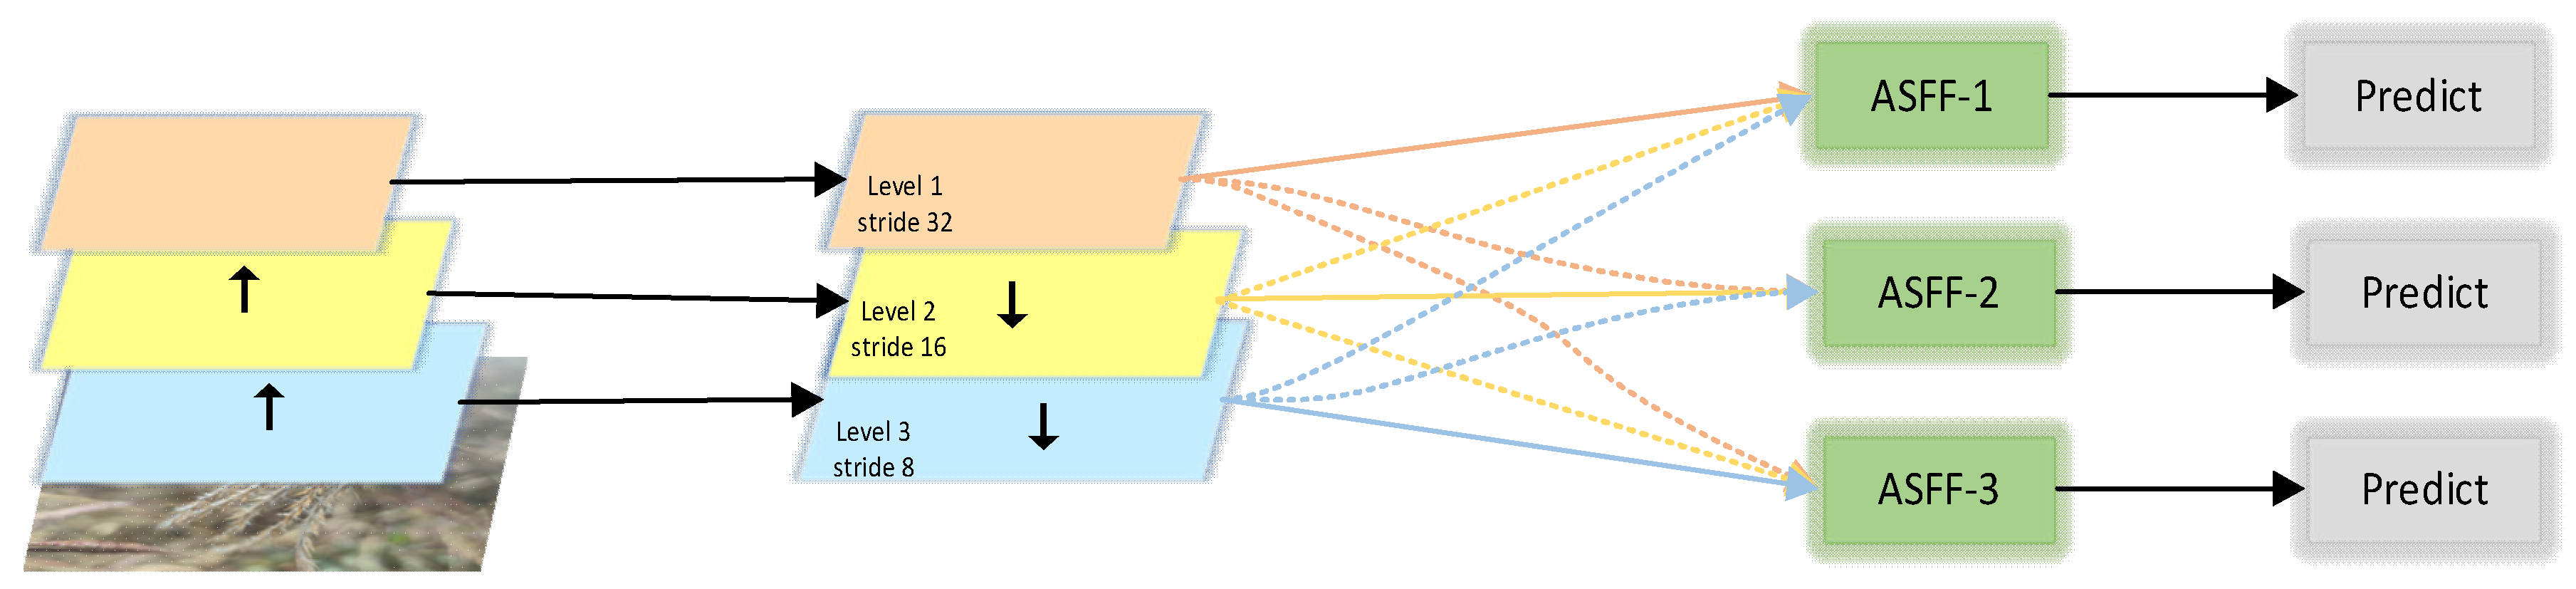
Bothriochloa ischaemum spikes often results in significant mutual occlusion between spikes. To address this issue, the detection head of the YOLOv12 baseline model was replaced with the ASFF (Adaptively Spatial Feature Fusion) module. ASFF adaptively fuses multi-level feature maps: low-level features capture fine details of small targets, while high-level features provide semantic information for larger targets. The fused feature map retains multi-scale information, enhances feature representation, and provides richer detail and semantic context, thereby improving the recognition and localization of occluded targets. This approach increases detection accuracy and robustness in complex scenes with objects of varying size and distance (
Figure 8). In ASFF, Level 1, Level 2, and Level 3 correspond to different layers of the feature pyramid with distinct spatial resolutions. ASFF-1, ASFF-2, and ASFF-3 denote feature fusion at these respective levels.
The module first performs feature alignment before adaptive fusion, addressing inconsistencies between features of different scales that can otherwise limit model performance. In the feature adjustment phase, for a given layer m, the features from other layers n () are reshaped to match the dimensions of , enabling seamless feature fusion. For upsampling, a 1 × 1 convolution is applied to reduce channel dimensions, followed by interpolation to increase feature resolution. For downsampling by a factor of 1/2, a 3 × 3 convolution with stride 2 is applied to adjust both resolution and channel dimensions. For downsampling by 1/4, a max-pooling layer with stride 2 is added before a 3 × 3 convolution with stride 2 to further reduce the resolution.
Let the aligned feature from layer
n mapped to layer
m at spatial position (
i,
j) be
. The fused feature
is computed as follows:
Here, represents the feature vector at position (i,j) from layer n mapped to layer m, and , , ∈ [0, 1] are adaptively learned spatial importance weights satisfying + + = 1. In YOLO, three feature layers with different resolutions and channel numbers are used. The scalar weight maps , , and are obtained through 1 × 1 convolutions applied to , , and , respectively.
2.3.3. Normalized Wasserstein Distance (NWD) Loss
Traditional object detection algorithms commonly employ Intersection over Union (IoU)-based loss functions to compute bounding box errors. However, these losses are often difficult to optimize, particularly for small objects: when the predicted and ground-truth boxes exhibit insufficient or no overlap, the localization and detection accuracy for small targets is significantly reduced. Although IoU variants such as DIoU and CIoU partially address these issues, they remain sensitive to minor positional deviations. In this study, the majority of
Bothriochloa ischaemum spikes are small targets (<32 pixels), necessitating a loss function capable of improving small-object detection. Accordingly, we adopt the NWD (Normalized Wasserstein Distance loss) [
32], which measures the similarity between bounding boxes modeled as probability distributions.
The procedure begins by modeling each bounding box as a two-dimensional Gaussian distribution. Within the bounding box, foreground and background pixels are concentrated at the center and along the boundaries, respectively. To better characterize the relative importance of pixels within the bounding box, the center pixels are assigned the highest weight, with importance decreasing gradually toward the edges. The 2D Gaussian model for a bounding box R = (C
x, C
y, w, h) is defined by its inscribed ellipse:
where (
μx,
μy) represents the ellipse center, and
σx and
σy denote the semi-axis lengths along the x and y directions, respectively. The corresponding probability density function of the Gaussian distribution is given by Equation (9):
where
x is the coordinate vector,
μ is the mean vector, and
Σ is the covariance matrix. Thus, the bounding box R = (C
x, C
y, w, h) can be represented as a Gaussian distribution
N(μ,Σ), where Equation (10):
The Wasserstein distance from Optimal Transport theory is then used to measure the similarity between two Gaussian-distributed bounding boxes. For two boxes,
and
, modeled as
Na and
Nb respectively, the squared 2nd-order Wasserstein distance is defined as Equation (11):
The W
22 (
Na,
Nb) represents a distance metric and therefore cannot be directly employed as a similarity measure. To address this, we normalize it using its exponential form and define a new metric termed the normalized Wasserstein distance, as expressed in Equation (12):
C is the average absolute scale of bounding boxes based on dataset statistics, and its calculation formula is shown in Equation (13):
NWD effectively measures the similarity between bounding boxes even in cases of little or no overlap, providing stable gradients and significantly improving the detection accuracy for small targets, which is particularly suitable for the dense and small Bothriochloa ischaemum spikes in this study.
2.4. YOLOv12-EVC Network Architecture
To enable precise detection of seeds on Bothriochloa ischaemum spikes, we propose the YOLOv12-EVC network, where “EVC” stands for Explicit Visual Center. Existing visual feature pyramid approaches in object detection tend to overemphasize inter-layer feature interactions while neglecting structured intra-layer feature representations. Some methods leverage attention mechanisms or visual transformers to learn compact intra-layer features; however, these approaches often overlook corner-region information, which is critical for dense prediction tasks.
To address these limitations, Quan, Zhang et al. proposed the CFP (Concentrated Feature Pyramid) that employs globally explicit feature aggregation for object detection, with EVC as its core component [
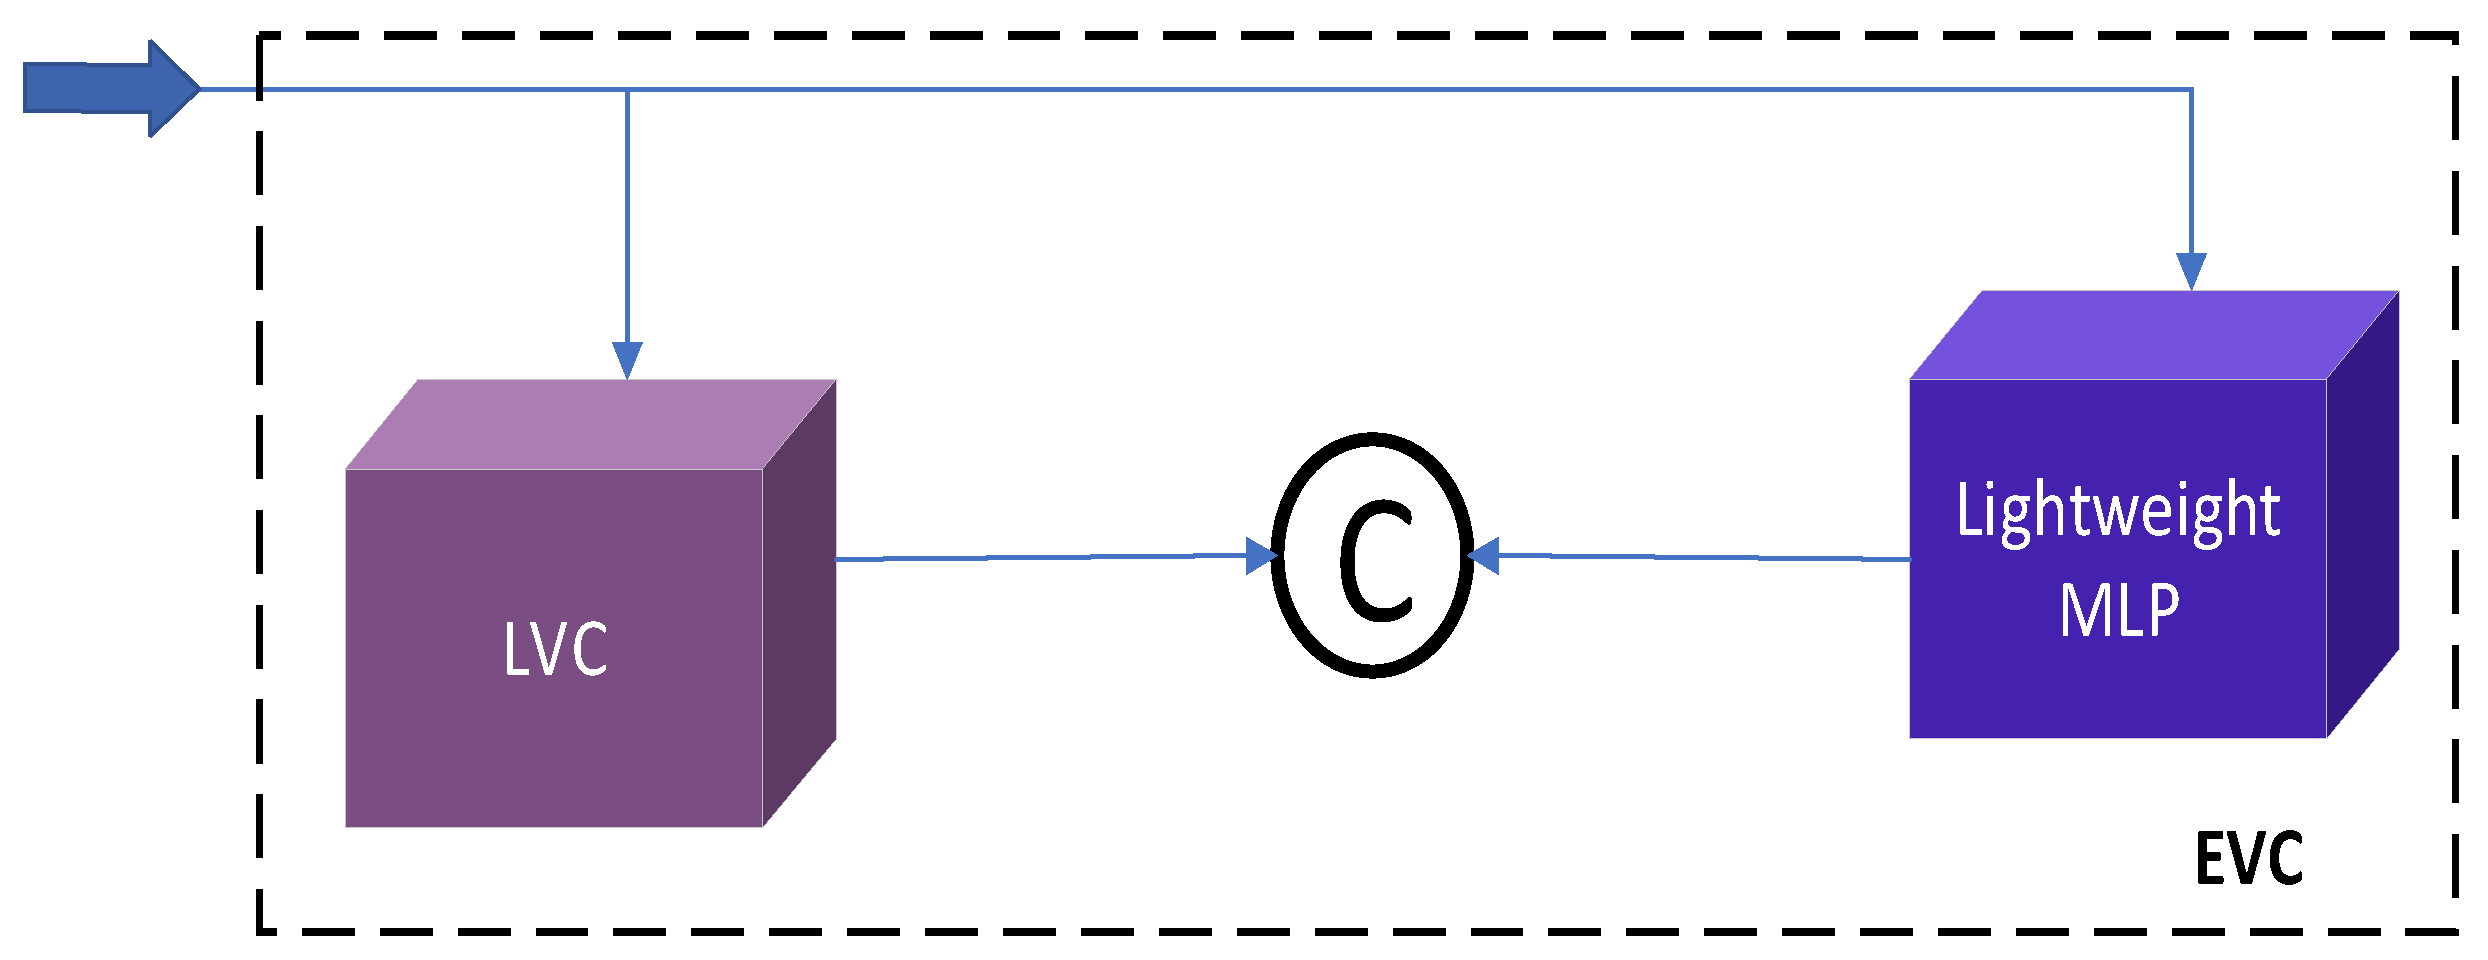
33]. The EVC module primarily consists of a lightweight multilayer perceptron (MLP) and a LVC mechanism (learnable visual center). Its design is simple and computationally efficient, while simultaneously capturing global long-range dependencies and preserving local corner-region information. This enables the model to extract more comprehensive image features, which is particularly important for dense prediction tasks. The proposed EVC module is therefore well-suited for the precise counting of seeds on naturally structured
Bothriochloa ischaemum spikes, as illustrated in
Figure 9.
In the original YOLOv12 model, the neck network fuses features from different levels through upsampling and concatenation (Concat). As shown in
Figure 10, in the improved YOLOv12-EVC model, an EVC module is inserted prior to feature fusion after upsampling to enhance the feature representation capability of the network.
3. Experiments and Results
This chapter first conducts ablation experiments to evaluate, one by one, the performance gains of dynamic upsampling (DySample), adaptive spatial feature fusion (ASFF), and the NWD loss function for dense ear detection, clarifying the contribution of each module to improving model accuracy, with an mAP increase of 2.2–3.8%. Next, a comparative study of mainstream YOLO network models is performed, horizontally testing the detection performance from YOLOv5 to YOLOv12-DAN on the same dataset, showing an mAP improvement of 10.2–35.7%, which confirms the superiority of the improved model in complex background and small-object scenarios. Subsequently, by comparing object detection results, the accuracy and robustness differences between YOLOv12-EVC and other mainstream detectors in seed-level recognition are analyzed, highlighting the advantage of the explicit visual center (EVC) module in extracting fine-grained seed features. Furthermore, seed counting regression analysis is implemented to construct a linear mapping model between predicted and actual seed counts, yielding R2 = 0.8083 to quantitatively evaluate the predictive reliability of the regression equation, with MAE = 6.3034 and MAPE = 9.3545%. Finally, based on mobile deployment experiments, the proposed model is verified for real-time detection capability on Android devices through a dynamic CPU-GPU resource scheduling mechanism, achieving rapid and non-destructive quantification of ear and seed numbers in field environments.
3.1. Experimental Results of Bothriochloa ischaemum Spike Detection Model
3.1.1. Ablation Study Results
The effectiveness of each proposed modification was evaluated by conducting ablation experiments, in which the improved modules were individually compared against the baseline YOLOv12n model. The results of these experiments are summarized in
Table 1. The hardware configuration of the training platform for this study consists of an AMD Ryzen 5 3600X 6-Core Processor 3.80 GHz (AMD, Santa Clara, CA, USA), and a graphics card NVIDIA GeForce RTX 3090 (NVIDIA, Santa Clara, CA, USA) with 24 GB of VRAM. The software environment is Windows 10, with a development environment of Python 3.9.7, deep learning framework Pytorch 1.9.0, and CUDA version 11.5. In the study of
Bothriochloa ischaemum, all models were run using the same dataset and parameters during training and testing, with a resolution of 640 × 640, 400 epochs, a batch size of 16, the optimizer using SGD with an initial learning rate of 0.0001, and the same set of data augmentation combinations (contrast adjustment and horizontal flipping).
In the ablation study, different variants of the YOLOv12n model were evaluated to assess the contribution of each proposed modification. Specifically, YOLOv12-N denotes the model with the loss function replaced by NWD; YOLOv12-D represents the model with DySample dynamic upsampling; YOLOv12-A incorporates the ASFF detection head; YOLOv12-DN combines DySample upsampling with NWD loss; YOLOv12-AD combines ASFF with DySample upsampling; YOLOv12-AN combines ASFF with NWD loss; and YOLOv12-DAN integrates all three improvements—ASFF detection head, DySample upsampling, and NWD loss—on the YOLOv12n baseline.
As summarized in
Table 1, all modified models demonstrated improvements in
P,
R, and (mAP) compared with the baseline YOLOv12n. Specifically, YOLOv12-N achieved increases of 0.9%, 1.2%, and 1.3% in
P,
R, and mAP, respectively, without increasing model size. The YOLOv12-DN and YOLOv12-AN models showed further improvements compared with YOLOv12-D and YOLOv12-A, respectively, with
P,
T, and mAP gains of 1.9%, 1.8%, 1.0% and 2.2%, 2.1%, 1.3%, demonstrating the effectiveness of the NWD loss function and its compatibility with other modules, particularly in enhancing small-object detection.
Although YOLOv12-D exhibited a slight decrease in precision and recall relative to YOLOv12n, its mAP increased by 0.6%. When combined with NWD (YOLOv12-DN) or ASFF (YOLOv12-AD), P, R, and mAP were further improved by 0.7%, 0.4%, 0.3% and 0.9%, 0.7%, 0.5%, respectively, confirming that DySample effectively addresses the challenges of dense spike growth and can be synergistically applied with other modules.
For YOLOv12-A, P, R, and mAP increased by 0.3%, 1.5%, and 1.0%, respectively, compared with YOLOv12n. The ASFF detection head introduces additional parameters due to convolutional operations and generates intermediate feature maps, increasing the model size by 3.4 MB. When combined with DySample (YOLOv12-AD) or NWD loss (YOLOv12-AN), P, R, and mAP increased by 1.5%, 0.7%, 0.5% and 1.6%, 1.4%, 1.0%, respectively, demonstrating the effectiveness of ASFF in addressing occlusion among spikes and its compatibility with other modules.
Table 2 presents the paired
t-test results of each improved module in the ablation experiments, as well as the overall comparison between the proposed YOLOv12-DAN model and the baseline YOLOv12n model. All tests were conducted on three core evaluation metrics for object detection, namely Precision, Recall, and mean Average Precision at an Intersection over Union (IoU) threshold of 50% (mAP50). A total of 10 independent repeated experiments were performed in this study, the degrees of freedom (df) were set to 9 for all tests, and the significance level was set to α = 0.05. In the single-module effectiveness validation, the separate introduction of the three modules, NWD, DySample, and ASFF, all brought extremely significant performance improvements in the three core metrics of the baseline model (
p < 0.001). Specifically, for the NWD module (YOLOv12n → YOLOv12-N), the t-value of mAP50 reached 10.26 with a
p-value less than 0.001; for the DySample module (YOLOv12n → YOLOv12-D), the t-value of mAP50 was 7.83 with a
p-value less than 0.001; for the ASFF module (YOLOv12n → YOLOv12-A), the t-value of mAP50 was 9.15 with a
p-value less than 0.001. These results demonstrate that the performance improvements brought by each individual module are statistically significant, rather than random fluctuations caused by repeated experiments. For the core validation of the redundancy of the DySample module (YOLOv12-AN → YOLOv12-DAN, with the DySample module as the only variable), the t-value of mAP50 was 2.37 and the
p-value was 0.042, indicating a statistically significant difference at the significance level of α = 0.05. This result fully proves that the introduction of the DySample module brings stable and significant performance improvement to the model, and the module is not a redundant design. In the other two sets of three-module combination validation, the three core metrics of YOLOv12-AD → YOLOv12-DAN (validating the NWD module) and YOLOv12-DN → YOLOv12-DAN (validating the ASFF module) both showed extremely significant performance improvements (
p < 0.001), further verifying the effectiveness of the multi-module combination strategy. In the overall comparison between YOLOv12-DAN and the baseline model YOLOv12n, the t-value of the Precision metric was 8.72 with a
p-value less than 0.001; the t-value of the Recall metric reached 9.35 with a
p-value also less than 0.001; the t-value of the mAP50 metric was 7.91 with a
p-value less than 0.001. All three core metrics showed extremely significant differences, which fully verified the effectiveness of the multi-module combined improvement strategy in this study.
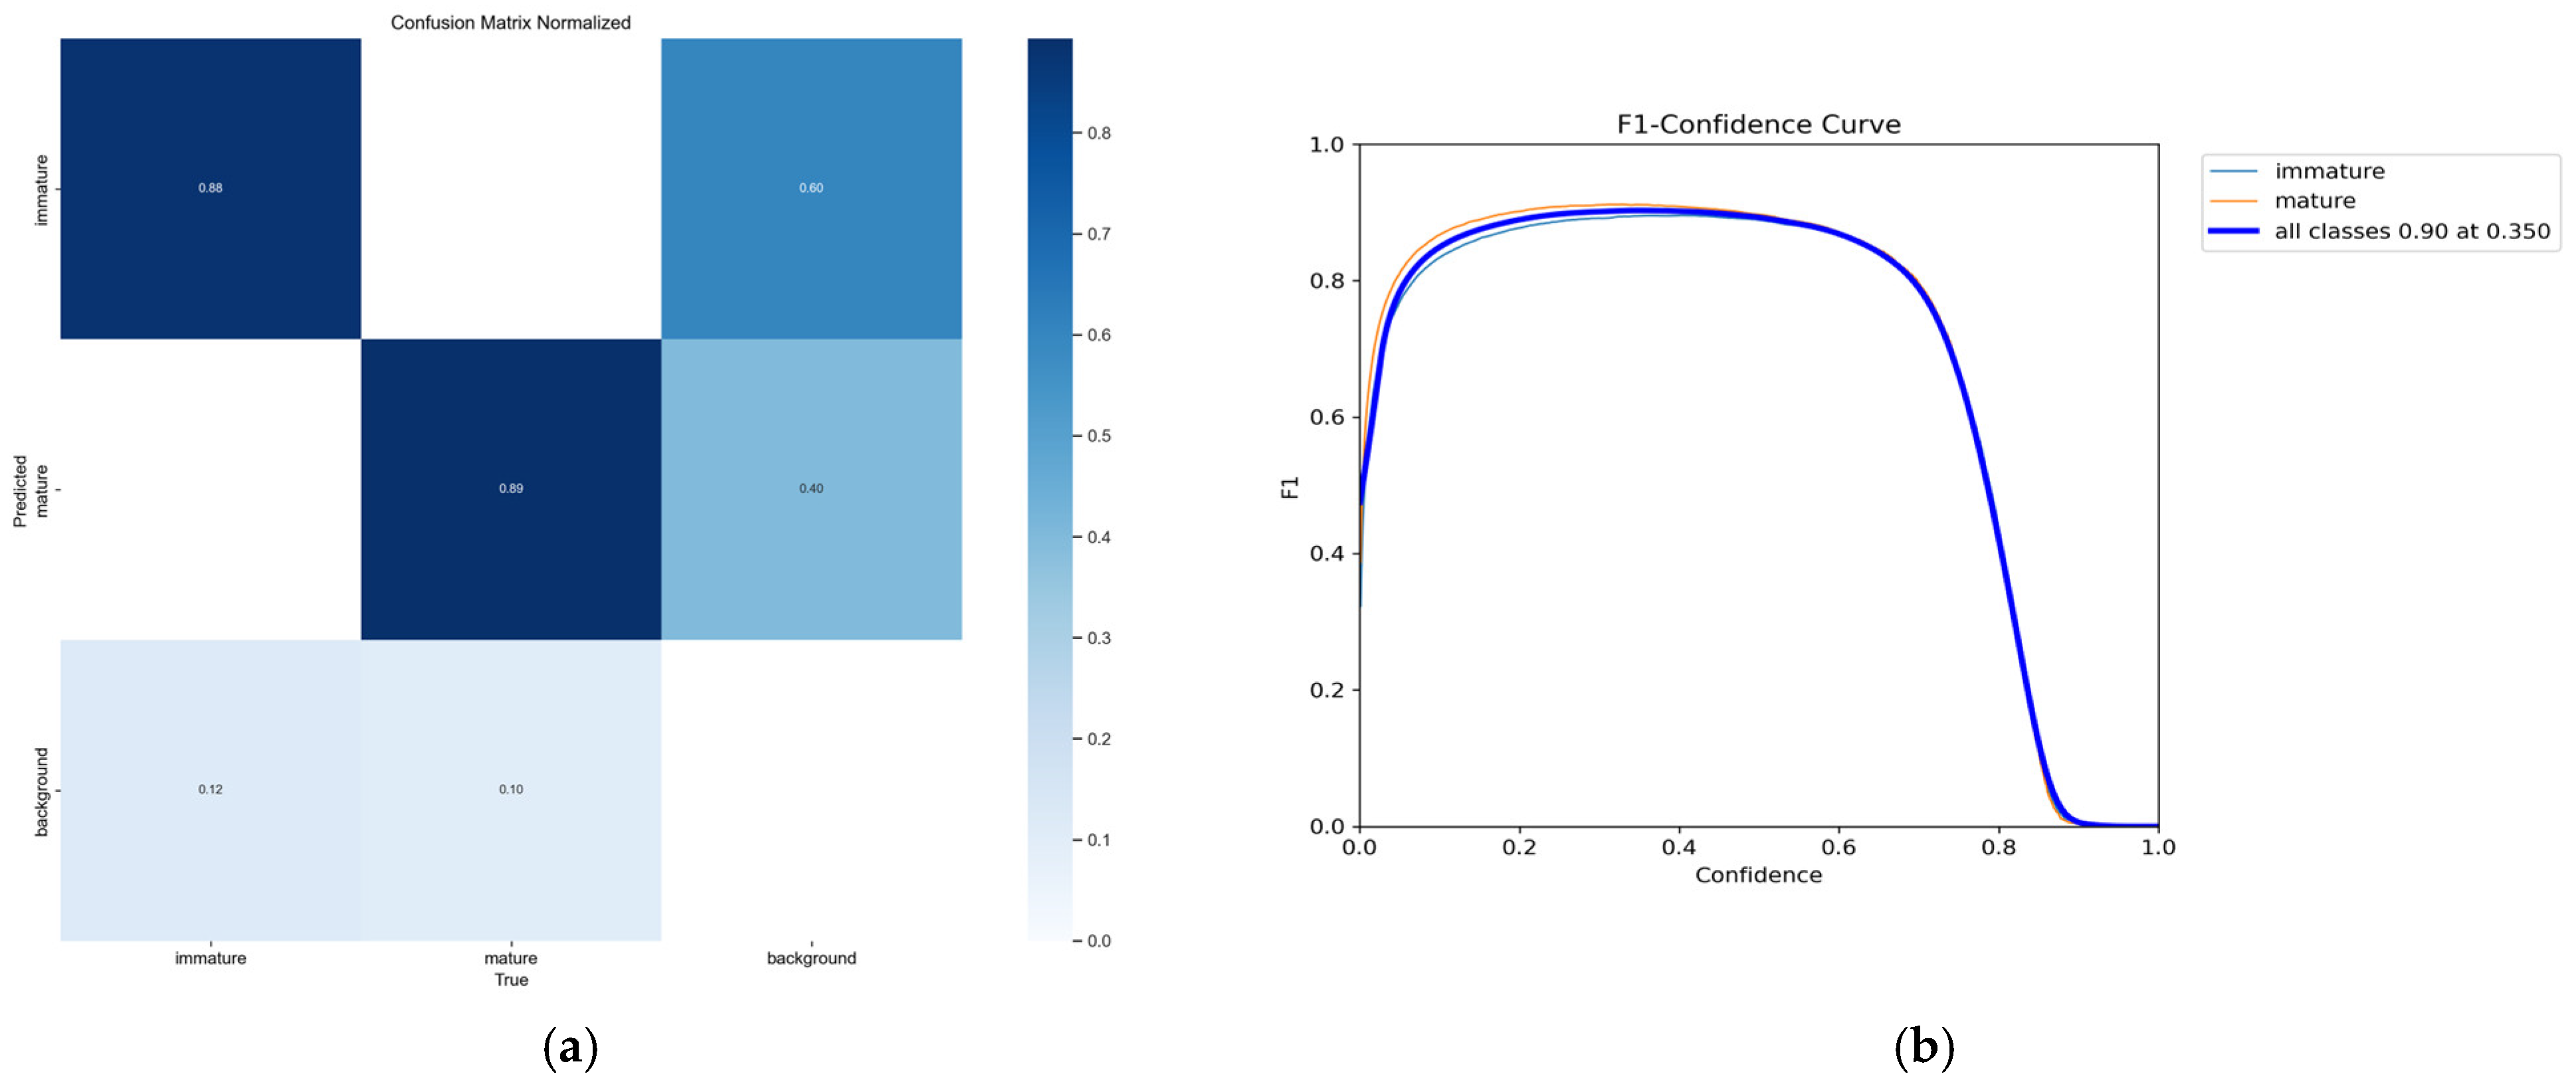
To further validate the model’s balance between precision and recall, in addition to the conventional Precision, Recall, and mAP metrics, this study also computed the F1 score based on confidence threshold scanning and the confusion matrix including the ‘background’ category. The results indicate that the F1–Confidence curve of YOLOv12-DAN peaks around a confidence threshold of approximately 0.35, where the F1 scores for each type of target are close to 0.90. Moreover, within the 0.25–0.50 range, the curve remains relatively flat, suggesting that the model can achieve high precision and recall across a wide range of thresholds, rather than relying on extreme threshold settings to optimize a single metric. The confusion matrix further shows that for the immature and mature fruit categories, about 88–89% of samples are correctly identified, with misclassification between these two categories below 1%. These results demonstrate that the proposed model achieves reasonably balanced detection performance between object categories and the background category. The normalized confusion matrix and F1-Confidence curve are shown in
Figure 11.
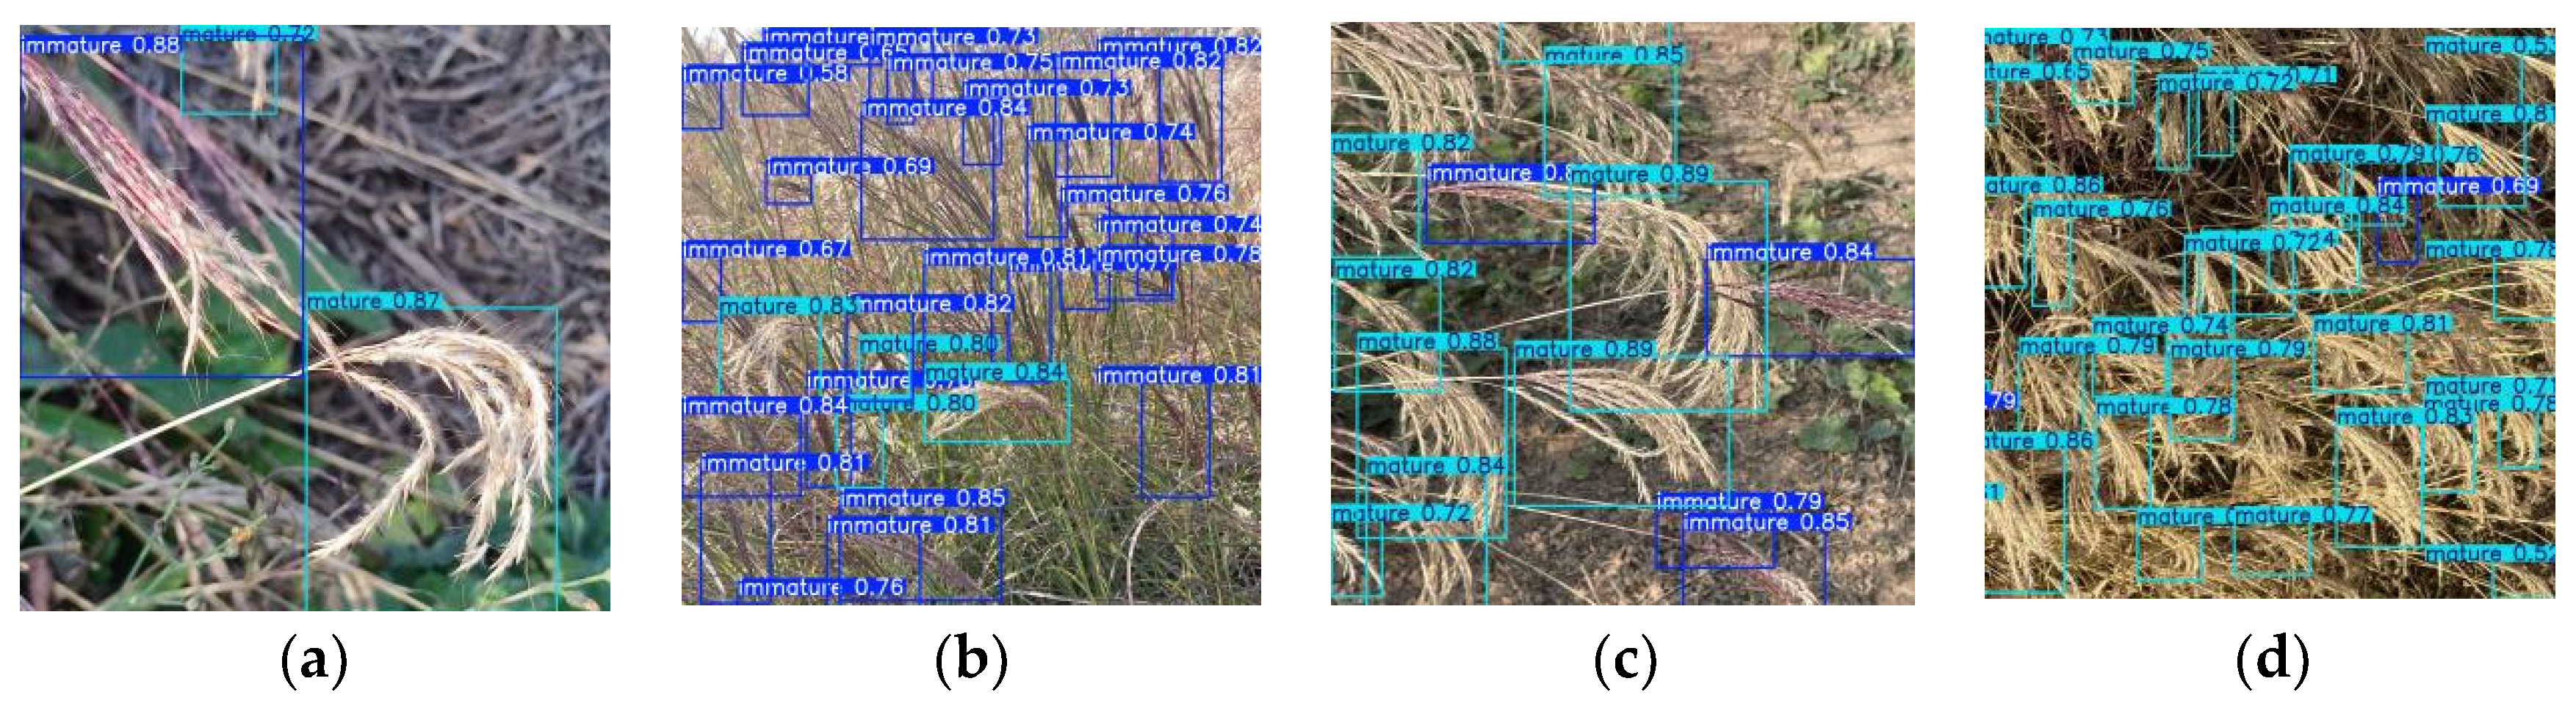
Overall, the YOLOv12-DAN model achieved an improvement of 2.8% in precision, 3.8% in recall, and 2.2% in mAP compared with the baseline YOLOv12n. Notably, the detection accuracy for mature spikes was consistently higher than for immature spikes. The ablation study confirms that the proposed YOLOv12-DAN model significantly enhances spike detection performance on the collected
Bothriochloa ischaemum dataset, validating the effectiveness of the combined improvements. Detection examples are illustrated in
Figure 12.
3.1.2. Comparative Evaluation of Mainstream YOLO Models
To further evaluate the detection performance of the improved YOLOv12-DAN, a comparative experiment was conducted with mainstream YOLO variants, including YOLOv5s, YOLOv7-tiny, YOLOv8n, YOLOv9n, YOLOv10n, YOLOv11n, and YOLOv12n, on the same
Bothriochloa ischaemum spike dataset. The results of this comparison are summarized in
Table 3.
As shown in
Table 3, the improved YOLOv12-DAN outperforms YOLOv5, YOLOv8, YOLOv9, YOLOv10, YOLOv11, and the original YOLOv12 in P by 11%, 16.9%, 35.3%, 22.6%, 23.9%, and 2.7%, respectively; in R by 11.4%, 13.7%, 32.4%, 19.7%, 19.5%, and 3.8%, respectively; and in mAP by 10.2%, 12.2%, 35.7%, 19.6%, 19.8%, and 2.2%, respectively. Although YOLOv7 exhibits slightly higher
P,
R, and mAP values compared to the improved YOLOv12-DAN, its larger model size renders it less suitable for deployment on harvesting robot platforms.
YOLOv12-DAN model, as an object detection model with potential advantages, was studied to explore the differences in its mean average precision at mAP50 under different conditions and to determine whether these differences are statistically significant. For this purpose, a univariate ANOVA and Tukey post hoc test were conducted, and the corresponding results are presented in
Table 4. This table presents key statistics including sources of variation, sum of squares, degrees of freedom, mean square, F value, and
p value. In terms of sources of variation, they are divided into Between Models, Within Models, and Total. Between-group variation reflects the differences in mAP50 among different model groups, with a sum of squares of 2876.32, degrees of freedom of 7, mean square of 410.90, an F value as high as 128.47, and a
p value less than 0.001. This indicates that there are extremely significant differences in mAP50 among different model groups. Within-group variation reflects the fluctuation of samples within the same model group in terms of mAP50, with a sum of squares of 252.18, degrees of freedom of 72, and mean square of 3.50. The total sum of squares is 3128.50 with 79 degrees of freedom. Through these statistics, the composition of mAP50 variation and the statistical significance of between-group differences for the YOLOv12-DAN model under different conditions are clearly demonstrated.
To accurately assess the practical performance of the newly proposed YOLOv12-DAN model and to clarify its advantages and disadvantages within the existing model framework, representative models, including YOLOv5s, YOLOv8n, YOLOv7-tiny, and YOLOv12n, were selected for comparison. Since one-way ANOVA can only determine whether there are significant differences among multiple population means but cannot specify which groups differ, the Tukey HSD post hoc test can further precisely explore the significance of pairwise differences among multiple groups based on one-way ANOVA. Therefore, we conducted comparative experiments based on the Tukey HSD post hoc test to determine whether the differences between YOLOv12-DAN and other models in the key metric of mean average precision (mAP50) are statistically significant, with the related results presented in
Table 5. From the perspective of average differences, when comparing YOLOv12-DAN with YOLOv5s, the average difference in mAP50 is 10.2 ± 0.91, indicating that YOLOv12-DAN is significantly higher than YOLOv5s in terms of mAP50. When comparing YOLOv12-DAN with YOLOv8n, the average difference is 12.2 ± 0.85, meaning that YOLOv12-DAN is clearly higher than YOLOv8n in mAP50. When comparing YOLOv12-DAN with YOLOv12n, the average difference is 2.2 ± 0.63, indicating that YOLOv12-DAN has a higher mAP50 than YOLOv12n. Whereas, when comparing YOLOv12-DAN with YOLOv7-tiny, the average difference is −2.1 ± 0.77, meaning that YOLOv12-DAN’s mAP50 is slightly lower than YOLOv7-tiny. In terms of
p-values and significance, the
p-values for YOLOv12-DAN compared with YOLOv5s and YOLOv8n are both less than 0.001, which, according to a significance level of α = 0.05, indicates extremely significant differences (* indicates
p < 0.001). The
p-value for YOLOv12-DAN compared with YOLOv12n is less than 0.01, showing a significant difference (
p < 0.01). Whereas the
p-value for YOLOv12-DAN compared with YOLOv7-tiny is 0.068, greater than 0.05, indicating no significant difference (ns indicates no significant difference). These results provide key statistical evidence for a comprehensive and in-depth evaluation of the YOLOv12-DAN model’s performance.
To verify the optimality of accuracy and model size when the improved modules (DySample, ASFF, NWD) proposed in this paper are integrated with the YOLOv12 model, we have integrated these modules into mainstream YOLO models and conducted comparative experiments. The results are presented in
Table 6 below. Although YOLOv12-DAN is slightly lower than YOLOv7-tiny-DAN in Precision (P), Recall (R), and mAP50 by 0.4%, 4.6%, and 2.4% respectively, its model size is 71 MB smaller, making it more suitable for deployment on mobile devices. Experimental results demonstrate that YOLOv12-DAN achieves superior overall performance.
3.2. Experimental Results of the Grain Counting Model on Bothriochloa ischaemum Spikes
The hardware configuration of the training platform used in this study includes an Intel Core i9-14900HX (24-core) processor and an NVIDIA GeForce RTX 4070 Laptop GPU with 28 GB of video memory. The software environment is Windows 11, with Python 3.11, PyTorch 2.5.1 as the deep learning framework, and CUDA 12.9. In the experiments on white hornwort spikes, all models were trained and tested with the same dataset and parameters: an image resolution of 512 × 512, and the SGD optimizer with an initial learning rate of 0.01. In this experiment, after screening and removing blurred images, 130 individual
Bothriochloa ischaemum spikes were selected to ensure the generality and accuracy of the model. Using LabelImg software v1.8.6, all seeds were annotated with rectangular bounding boxes, each covering the identifiable area of a single seed on one side. After annotation, the images were randomly divided into training and validation sets at a ratio of 8:2. Each dataset was then augmented using techniques such as rotation, random cropping, and mirroring to expand the dataset and improve model accuracy. The final augmented dataset contained a total of 780 images, including 624 images for training and 156 for validation. In this study, we evaluated Faster R-CNN, YOLOv8, YOLOv12, and the proposed YOLOv12-EVC models for seed detection and counting. The training parameters for each model are summarized in
Table 7. To effectively avoid the overfitting problem during model training and improve the generalization ability and practical application performance of the models, an early stopping regularization training strategy was introduced in the model training phase. Specifically, the training process would be automatically terminated when the performance metrics of the models on the validation set showed no significant improvement for 100 consecutive training epochs, so as to prevent the models from overfitting to the training set data due to excessive iterative training.
Table 8 presents the object detection results of different models. Observing the results, both YOLOv12 and YOLOv8 achieved relatively high precision, with mAP50 values of 0.943 and 0.865, respectively. The mAP50 metric is a comprehensive measure used to evaluate model performance in object detection. It first computes the precision at various recall levels for each class, then plots the precision–recall (P-R) curve, and calculates the area under this curve (AUC) as the average precision (AP) for that class. Finally, the mAP across all classes—typically representing all object categories in the dataset—is taken as mAP50. This metric simultaneously considers detection precision and recall across different categories, providing a holistic assessment of model performance. On this basis, YOLOv12-EVC performed particularly outstandingly, with its mAP50-95 metric reaching 73.9%, demonstrating significant advantages in small-object detection tasks. This advantage stems from the fact that mAP50-95 covers multiple Intersection over Union (IoU) thresholds ranging from 0.50 to 0.95, which more rigorously assesses the model’s ability to accurately localize small objects. YOLOv12-EVC can effectively address the core issues of weak feature expression and high difficulty in bounding box alignment for small objects such as white clover seeds. The high mAP50 values achieved by YOLOv12-EVC, YOLOv12, and YOLOv8 indicate strong detection performance for white clover seeds, while the high mAP50-95 value of YOLOv12-EVC highlights its remarkable superiority when dealing with small objects like white clover seeds. In contrast, Faster R-CNN achieved a relatively low mAP50 of 0.143, demonstrating insufficient accuracy for precise seed detection.
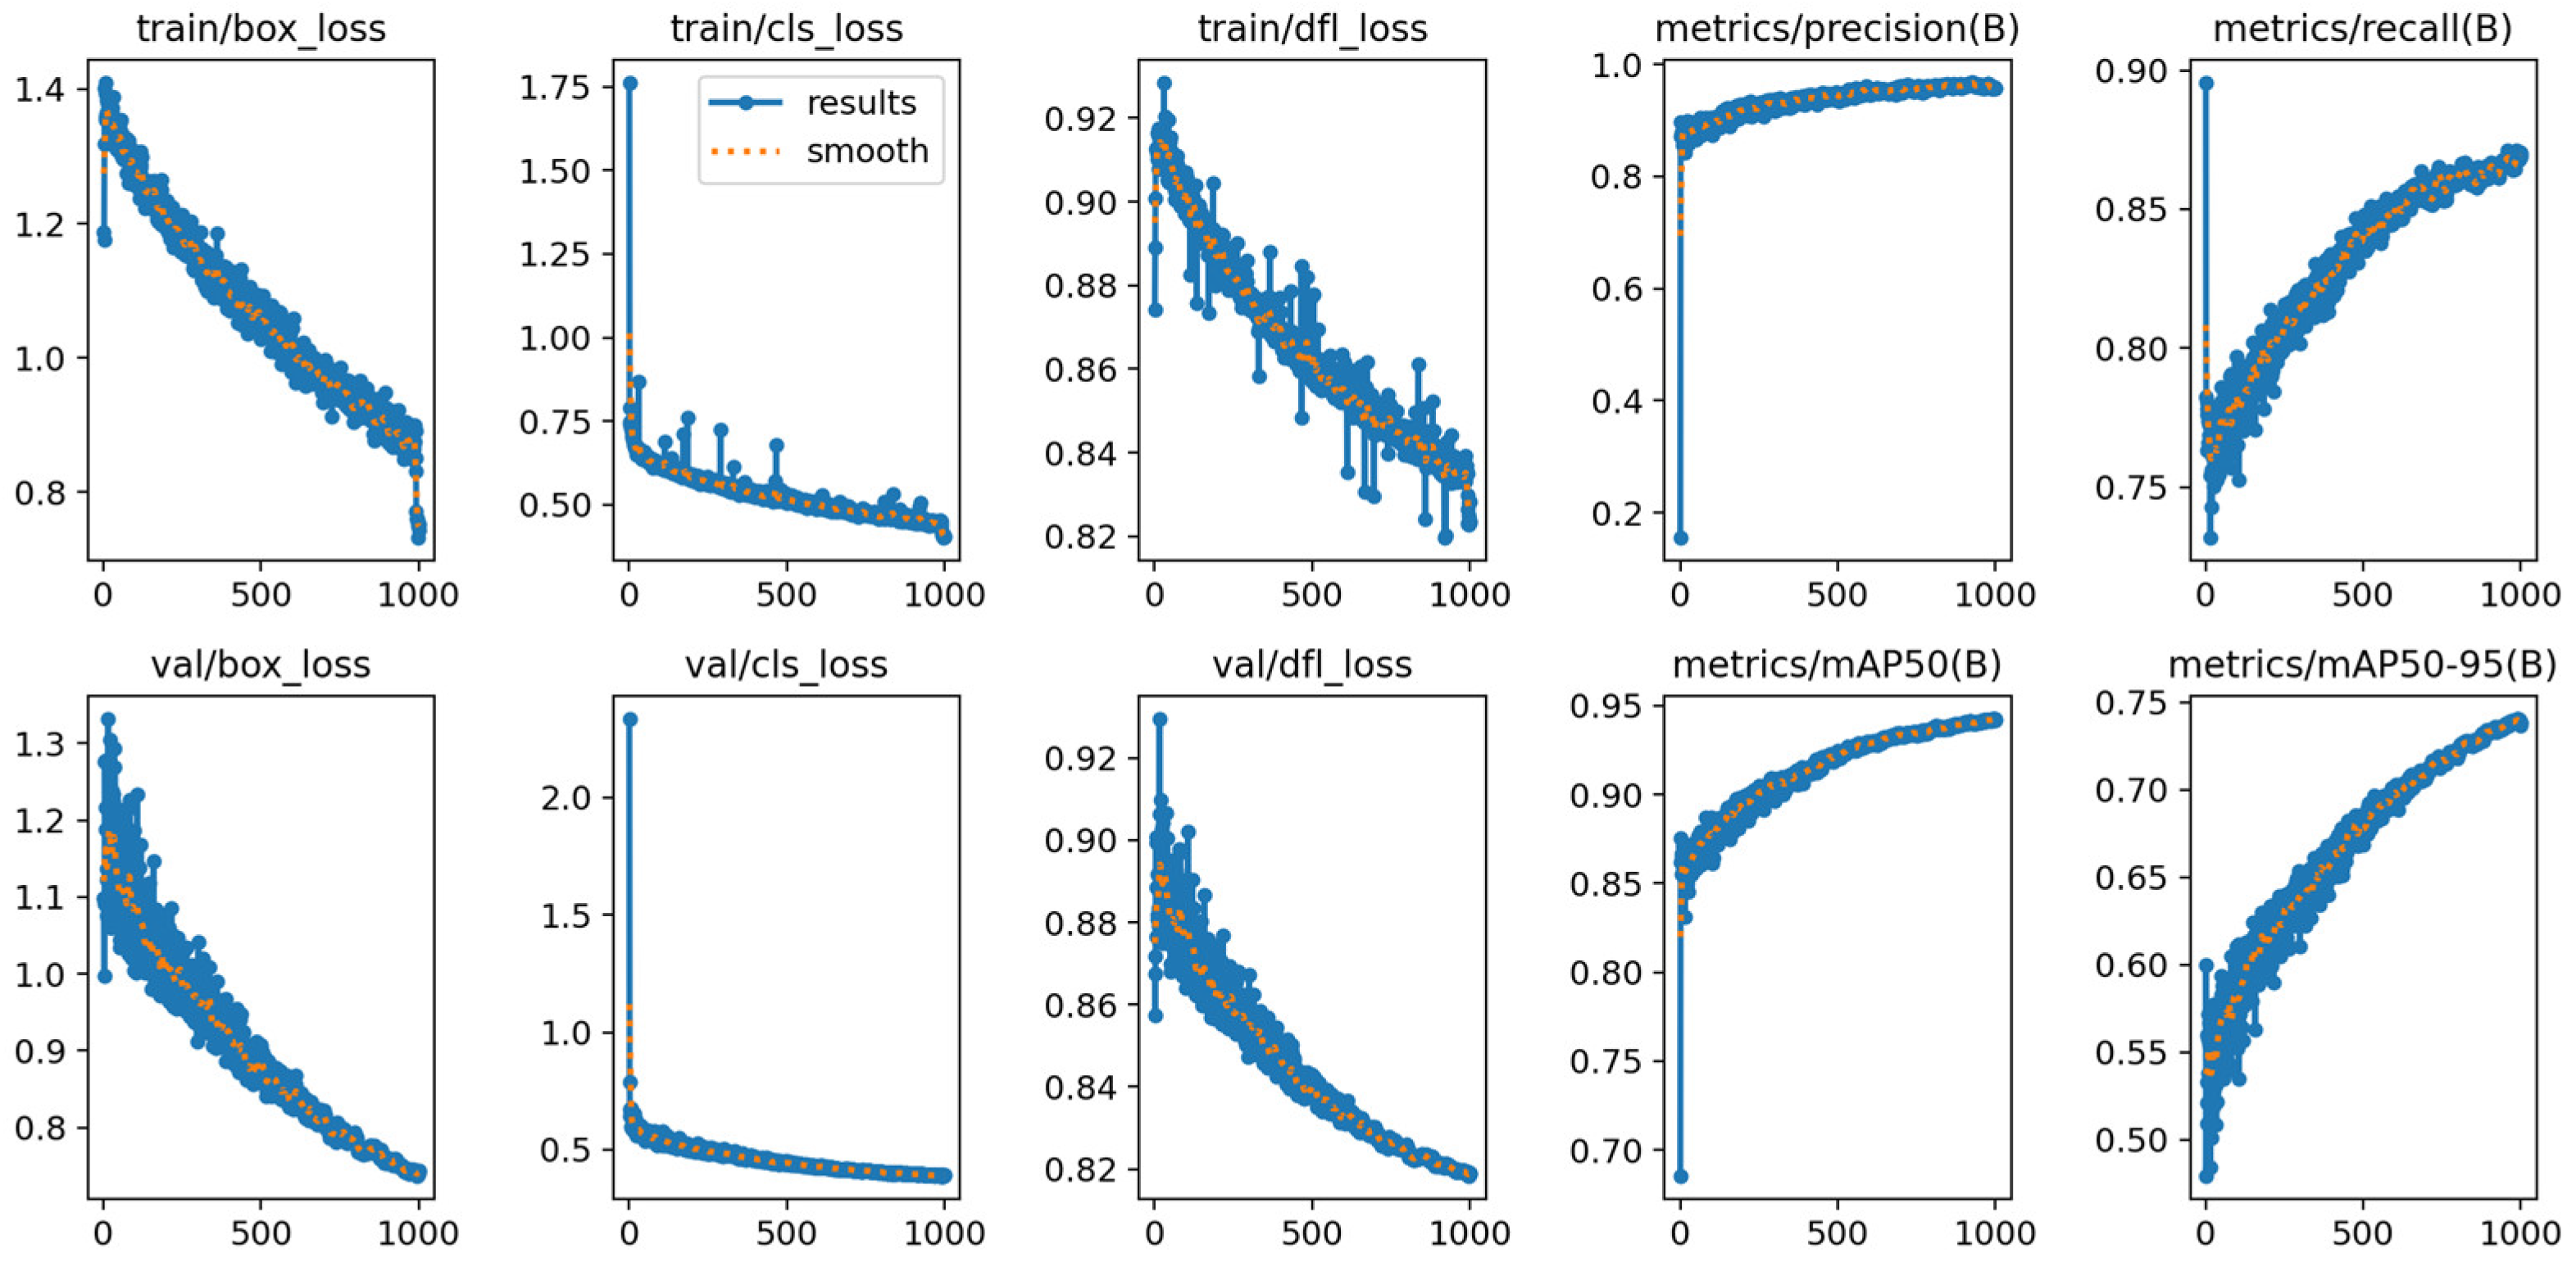
Figure 13 illustrates the loss variation and object detection performance metrics of the YOLOv12-EVC model during training for the
Bothriochloa ischaemum seed detection task. The bounding box loss (box_loss), classification loss (cls_loss), and distribution focal loss (dfl_loss) in both training and validation phases decrease continuously and converge gradually with training epochs, showing no obvious oscillation or overfitting. Meanwhile, detection metrics including Precision, Recall, mAP50, and mAP50-95 rise steadily and approach saturation, demonstrating that the model achieves favorable convergence and excellent generalization performance in the small object detection task of
Bothriochloa ischaemum seeds.
In order to gain a deeper understanding of the extent to which YOLOv12-EVC improves key object detection metrics compared to YOLOv12n, to determine whether its improvements are effective, and whether this enhancement is statistically significant, we conducted this experiment. The paired
t-test is a statistical test suitable for paired sample data, capable of determining whether there is a significant difference in the means of two paired datasets. Therefore, we used the paired
t-test to conduct a comparative analysis of YOLOv12-EVC and YOLOv12n on important metrics such as Precision, Recall, and mean Average Precision (mAP50-95), with the relevant results presented in
Table 9. From the t-values, the t-value for the precision metric is 4.28, for the recall metric it is 3.91, and for the mAP50-95 metric it is 5.17. The magnitude of the t-value reflects the extent of the difference between the means of the two paired data sets. The larger the t-value, the more significant the difference between the two means. In terms of
p-values and significance, the
p-values for both the precision and recall metrics are less than 0.01, showing significant differences according to the significance level α = 0.05 (indicating
p < 0.01). The
p-value for the mAP50-95 metric is less than 0.001, indicating an extremely significant difference (* indicates
p < 0.001). These results indicate that, compared with YOLOv12n, YOLOv12-EVC achieves higher precision and has a significant improvement in the mAP50-95 metric, demonstrating that the improvement methods adopted by YOLOv12-EVC have achieved excellent performance in object detection tasks, especially in the detection of dense small objects.
In summary, due to its outstanding detection efficiency and high mAP, YOLOv12-EVC is highly suitable for the grain counting task on
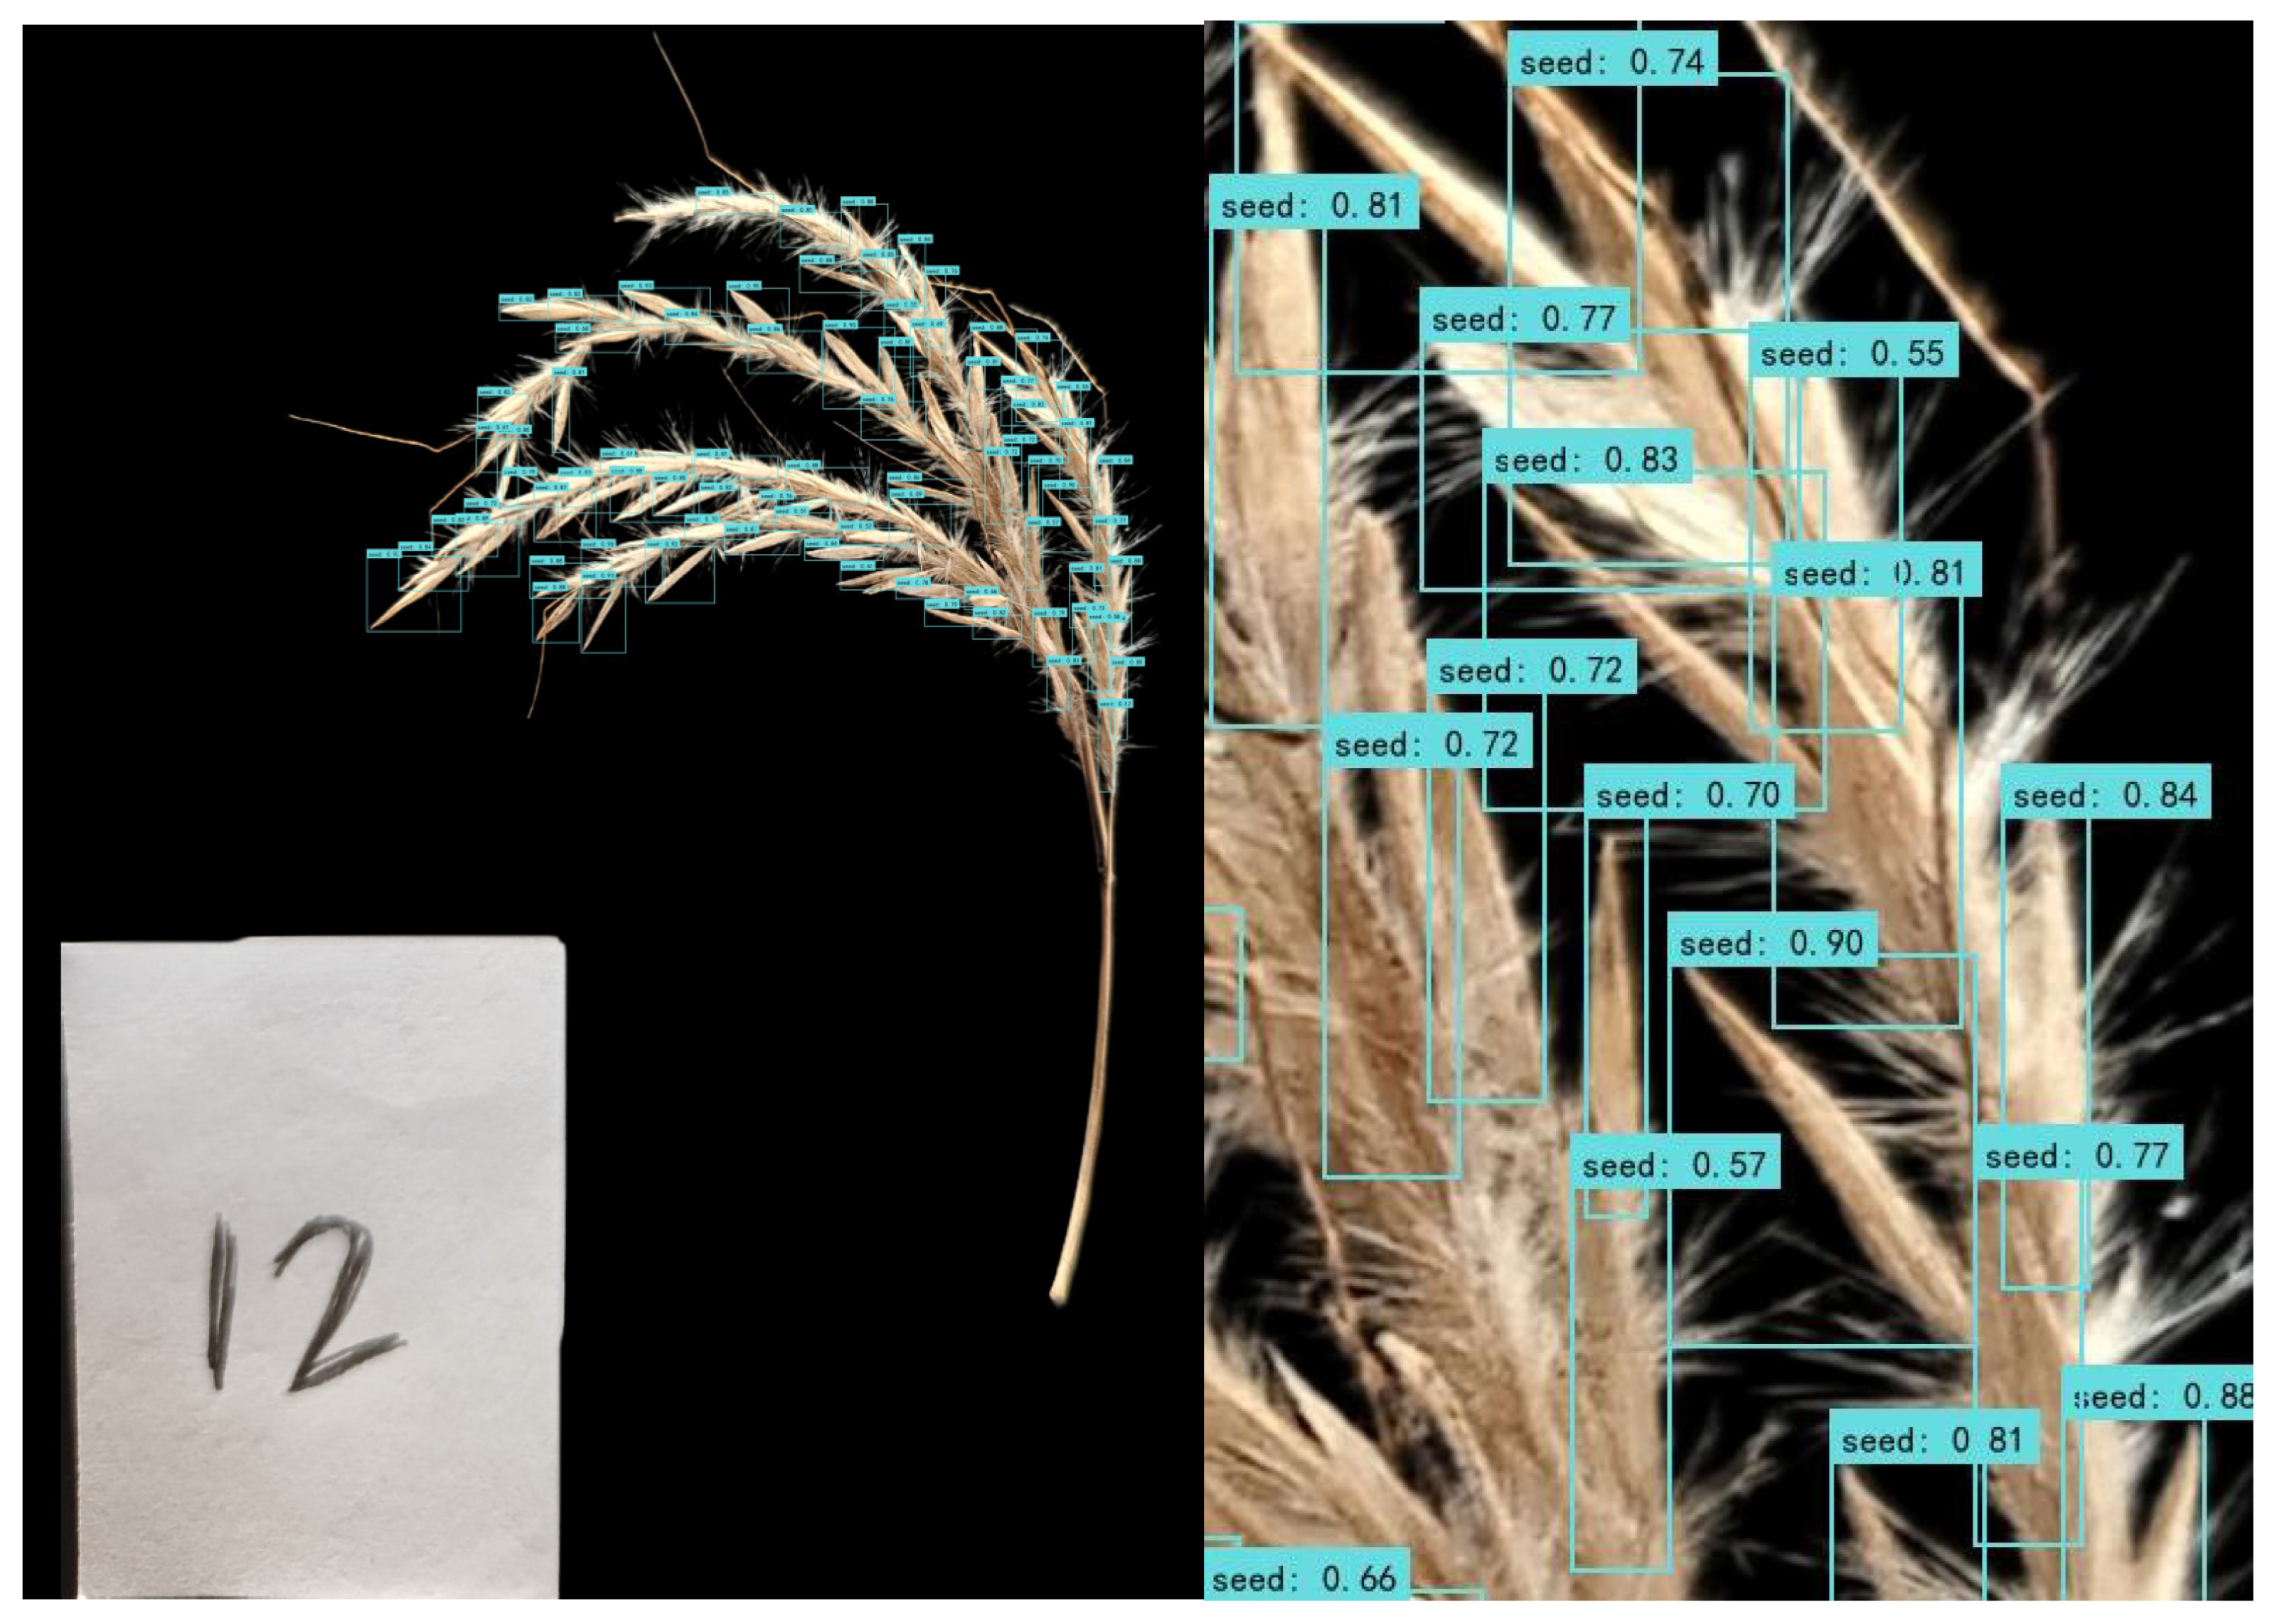
Bothriochloa ischaemum spikes. Therefore, YOLOv12-EVC was adopted as a core component of the proposed grain counting model in this study. As shown in
Figure 14, it is the model’s detection result.
Since the seeds of
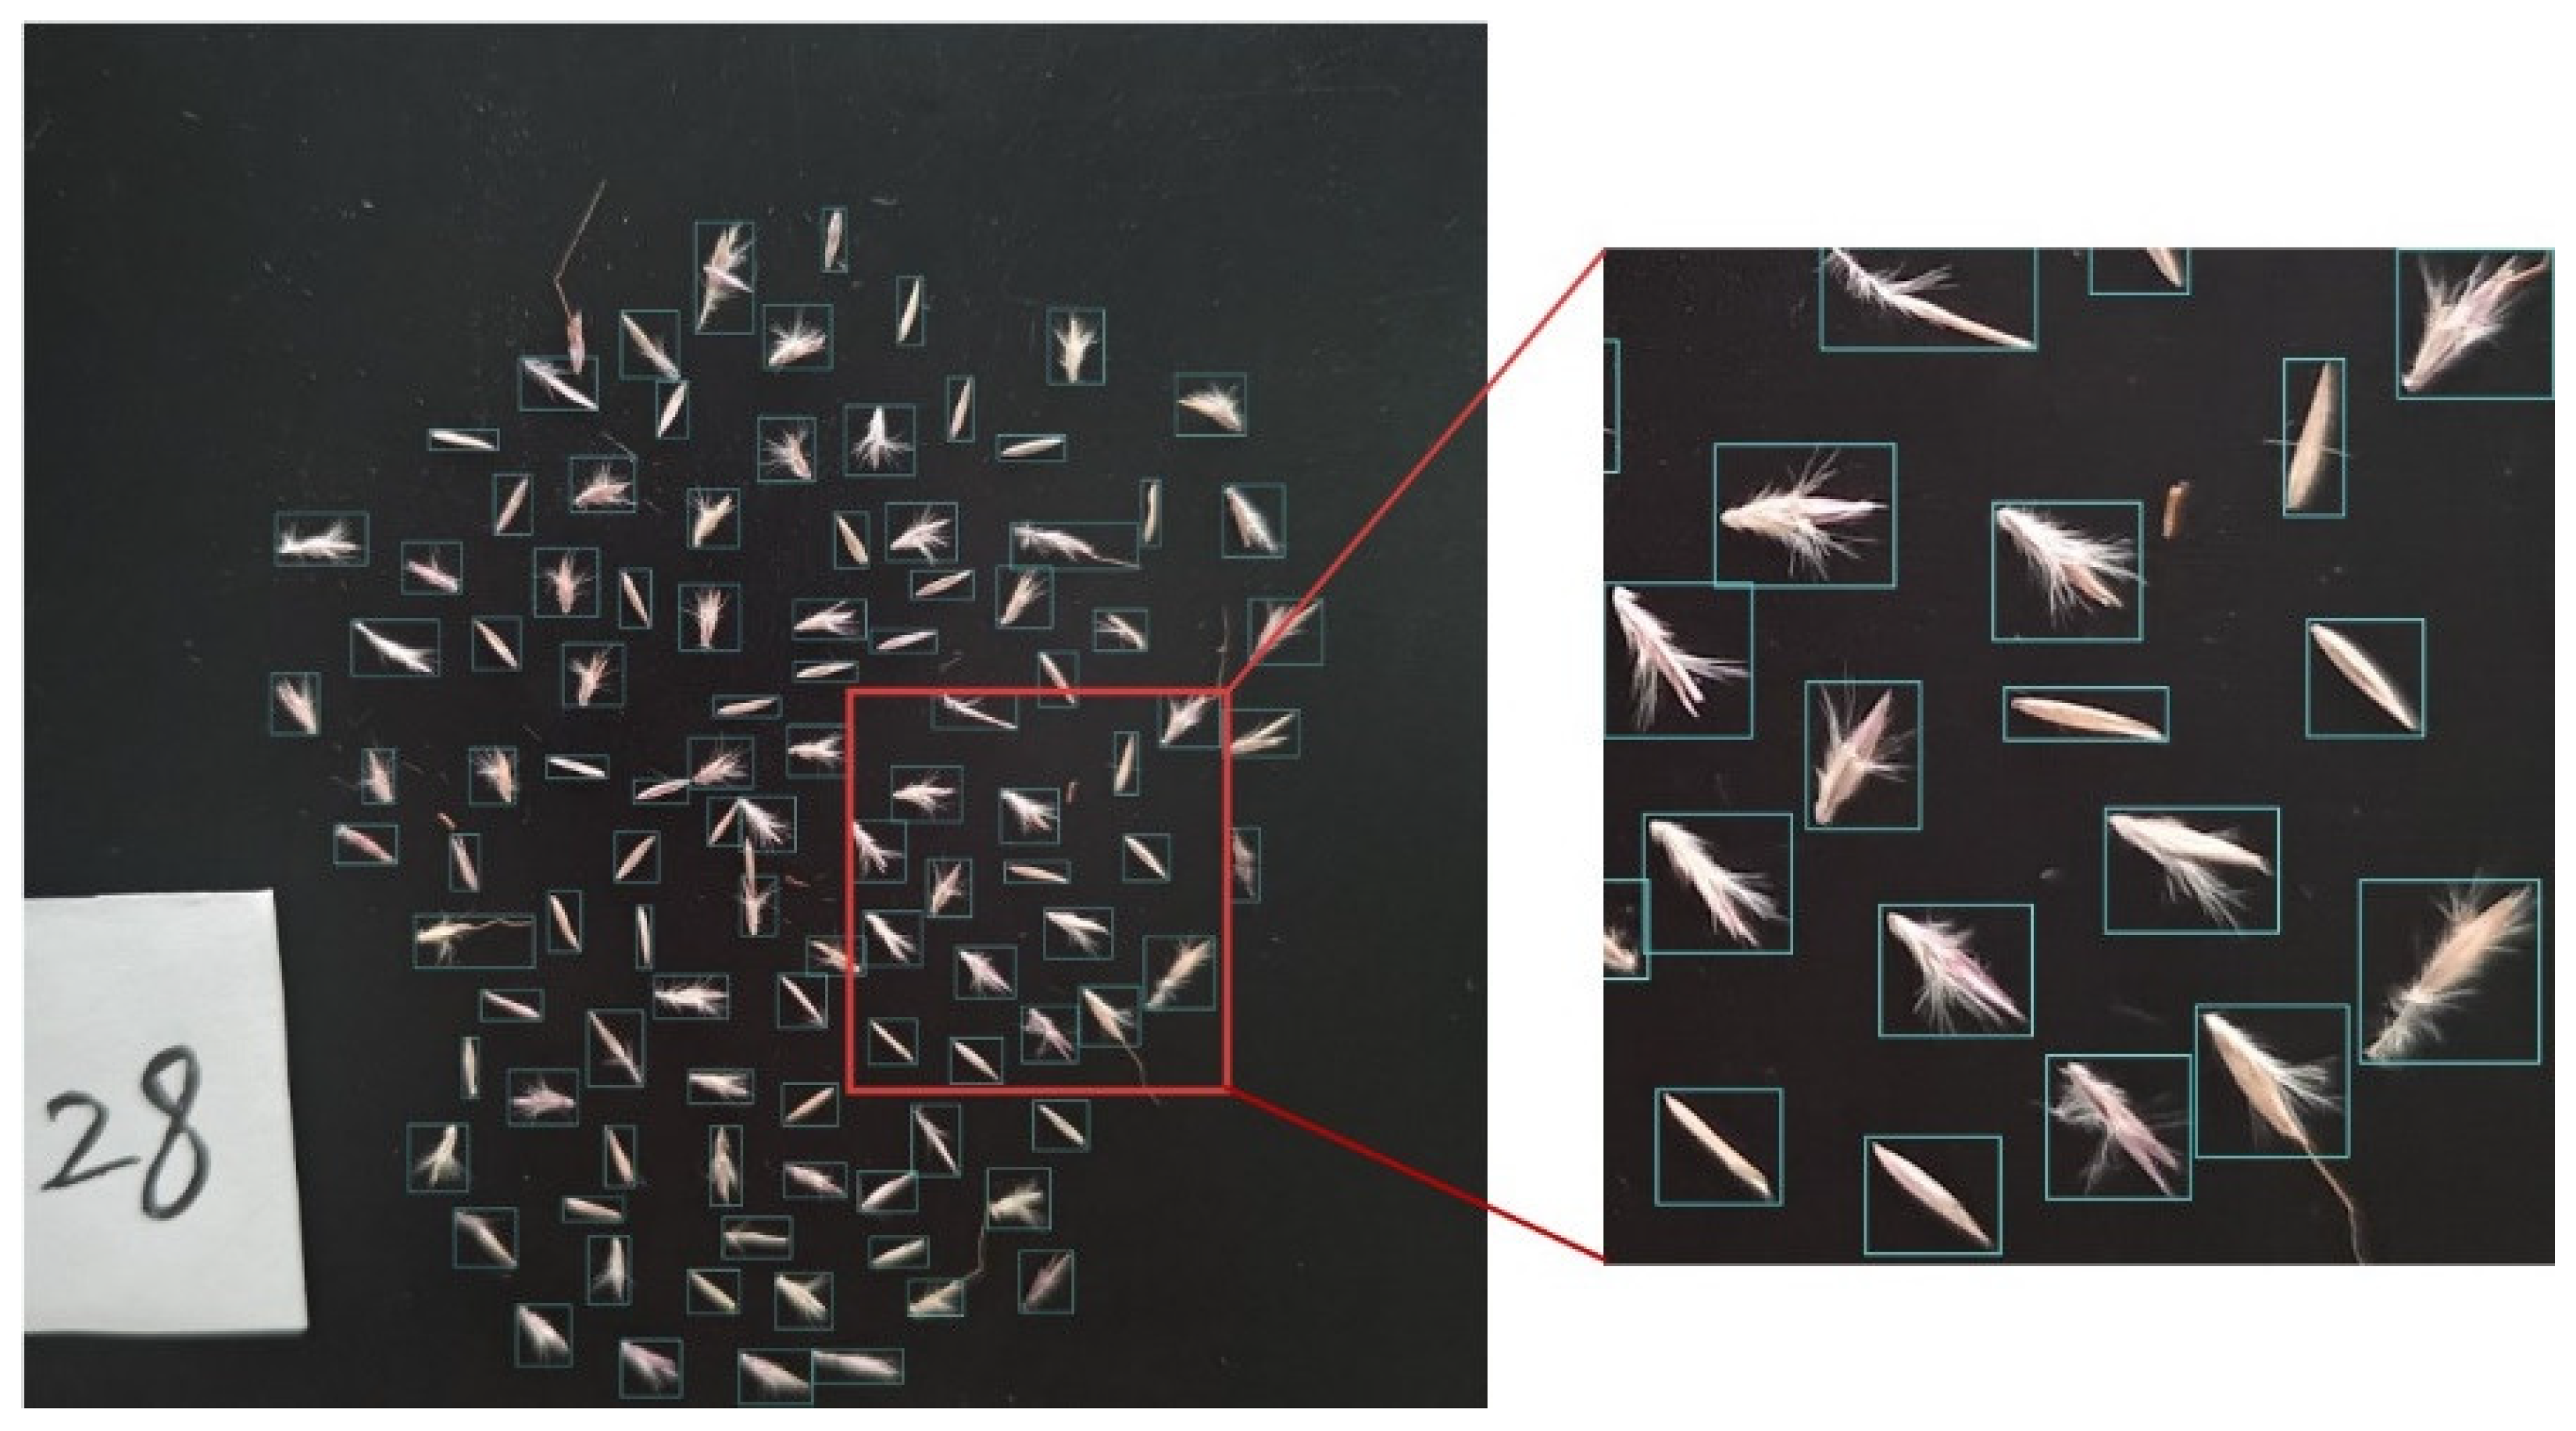
Bothriochloa ischaemum are small in size, the efficiency of manual counting is extremely low. Therefore, this study trained a dedicated detection model for ground-truth counting based on the YOLOv8 model, which achieves a mean average precision (mAP) of 96.1%. This model can directly identify the number of
Bothriochloa ischaemum seeds spread flat on black paper, which significantly improves the efficiency of seed counting, and the recognition results of the model are shown in
Figure 15 below. To ensure the accuracy of the detection model’s counting results, we randomly selected 50 images from the dataset for manual counting validation. Through verification and calculation, the model achieved an error rate of approximately 3.44%, which is relatively small, and its results can thus be regarded as the ground truth.
3.3. Seed Grain Counting Based on the Integration of Object Detection and Regression Equations
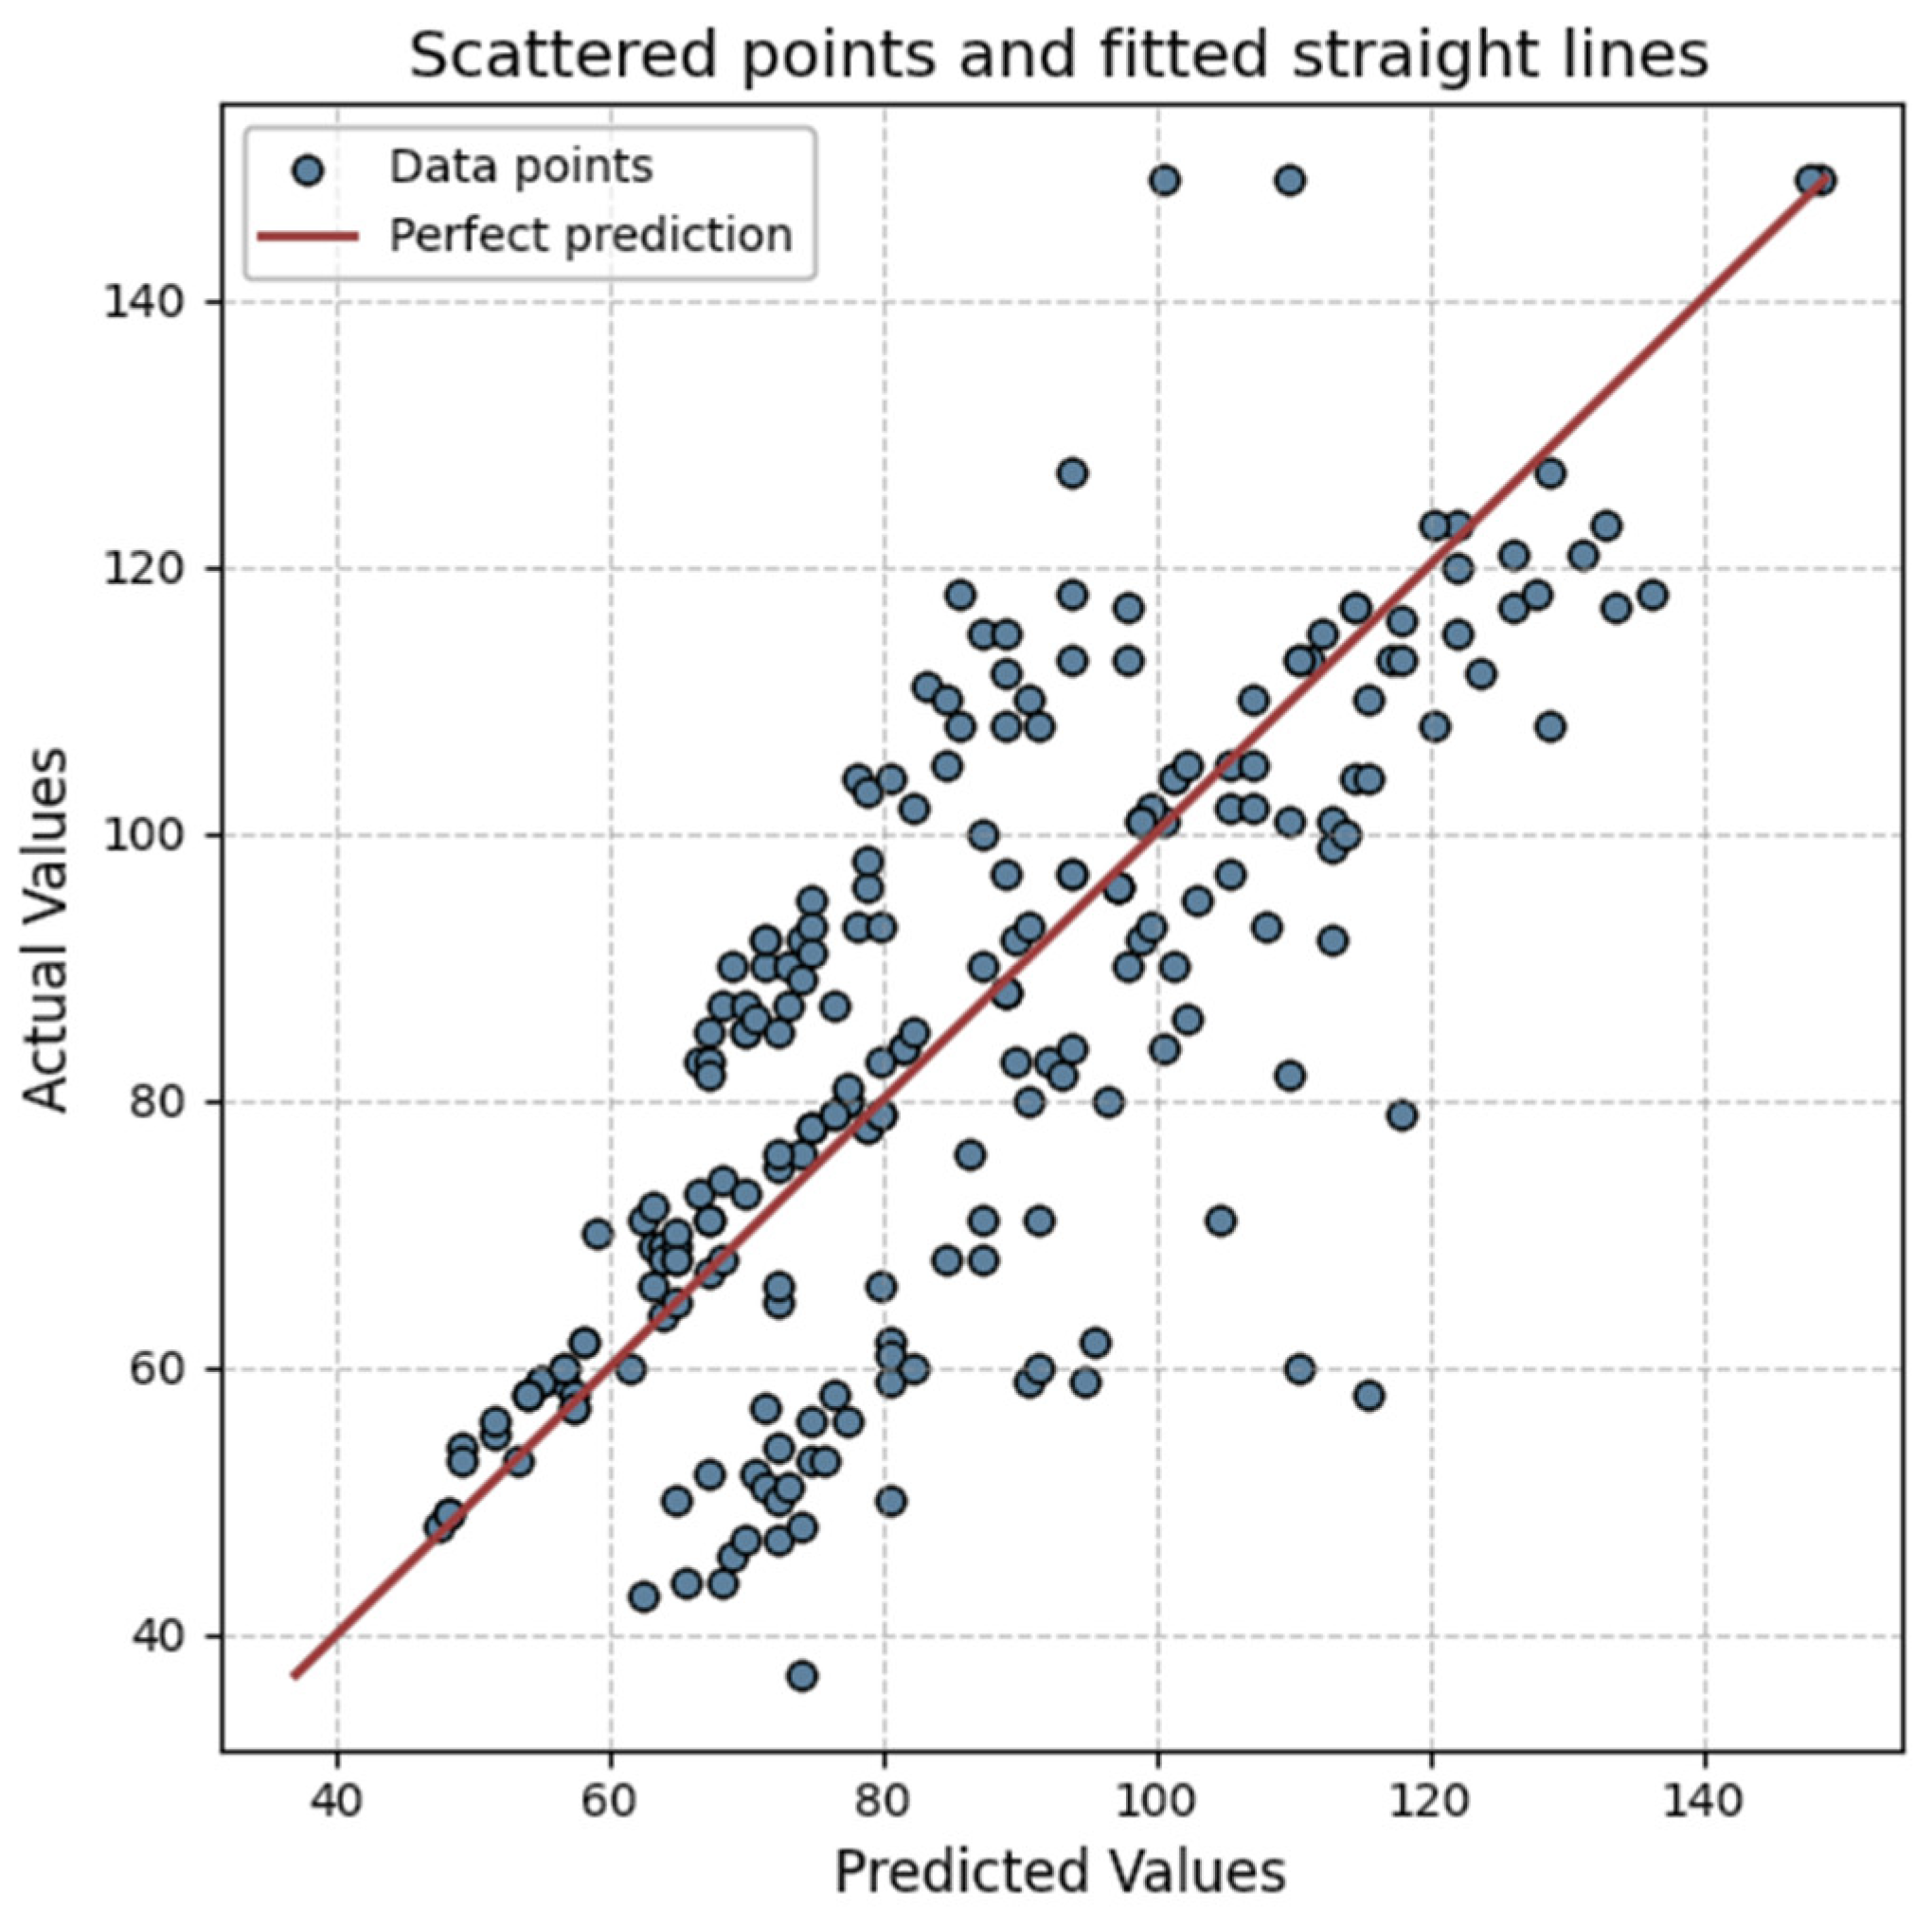
Regression analysis establishes a mathematical model to investigate the relationship between independent and dependent variables, providing an intuitive means to reveal how variables influence one another. By constructing such a model, the dependent variable can be predicted from known independent variables, and the degree of influence exerted by each independent variable can be quantitatively assessed. For Bothriochloa ischaemum seeds, however, the natural occlusion among grains prevents the direct use of model predictions as true seed counts. To address this, a scatter plot was generated using PyCharm 2024 to visualize the relationship between the model-predicted and ground-truth seed counts, confirming a strong correlation between them and thereby supporting the construction of a regression equation. In this study, the use of nonlinear models resulted in lower prediction accuracy and larger errors, with a fitting performance far inferior to that of the linear model. Taking into account both prediction accuracy and error control, the linear equation was ultimately selected as the optimal fitting model.
In this process, the predicted values were obtained using the trained YOLOv12-EVC model on seed images, while the ground-truth counts were derived from the trained YOLOv8 model. Finally, the scikit-learn library was employed to fit a linear regression line between the predicted and true counts, minimizing the sum of squared residuals—the vertical distances from each data point to the regression line. The resulting regression equation is expressed in Equation (14).
where Y represents the seed count estimated via the regression equation, and X represents the predicted seed count obtained directly from the object detection model.
The prediction process proceeds as follows: first, the trained YOLOv12-EVC model is applied to detect and predict the number of seeds on
Bothriochloa ischaemum spikes. The predicted values are then substituted into the regression equation to estimate the actual seed count. As shown in
Figure 16, the data points generally fluctuate around the regression line, clearly revealing a linear correlation between the predicted and actual values.
In regression analysis, MAE, MAPE, and R2 are commonly used evaluation metrics, each reflecting the model’s predictive performance from different perspectives. Based on these indicators, the regression equation in this study demonstrates high predictive accuracy.
The MAE was 6.3034, indicating that the average deviation between the predicted and actual values across all samples was 6.3034, suggesting a good overall fit of the equation. The MAPE was 9.3545%, which is below the commonly accepted 10% threshold, implying that the relative prediction error was small and the model achieved high fitting precision. The R2 value reached 0.8083, meaning that the equation could explain approximately 80% of the variance in the dependent variable. This indicates a strong explanatory power and reliable predictive performance, making the model suitable for seed count prediction and related analyses.
Taken together with the scatter plot and these error metrics, it is evident that the proposed regression equation successfully captures the underlying trend between predicted and actual values, demonstrating robust predictive capability and providing valuable insights into their quantitative relationship in this study.
3.4. Web Development and Deployment
To achieve rapid counting of spikes and spikelet grains of Bothriochloa ischaemum under field conditions, this study designed and implemented a lightweight end-to-end web application for inflorescence and seed recognition based on FastAPI. By deploying the improved YOLOv12-DAN and YOLOv12-EVC models on the web platform, rapid quantitative statistics of spikes and seeds of Bothriochloa ischaemum under natural conditions within specific field plots were realized. Specifically, YOLOv12-DAN was used for spike detection in the field, while YOLOv12-EVC was adopted to identify grains in their natural morphological state. The application adopts monolithic architecture with integrated front-end and back-end, eliminating the need for separate deployment of front-end projects. While focusing on the engineering implementation of object detection tasks, it features lightweight design, high performance, and mobile adaptability. The detailed design is described as follows:
(1) Overall Architecture Design
Python is adopted as the core development language of the application, which builds a full-stack service based on the FastAPI asynchronous web framework. The front-end interactive interface, back-end business logic, and YOLO model inference process are encapsulated in a single code file and launched via the Uvicorn server, enabling the lightweight deployment feature of one-click deployment with no additional dependencies. The core of the architecture consists of four decoupled modules that collaborate in a closed loop—initialization layer, core business layer, interface layer, and front-end interaction layer—covering the entire workflow from image upload, model detection, and result visualization to front-end rendering.
(2) Module Functions and Interactive Logic
The initialization layer completes the configuration of the FastAPI instance (with redundant automatic documentation interfaces disabled to simplify the service) and cross-origin middleware (allowing requests with all origins, methods, and headers to adapt to front-end asynchronous calls). It also loads the pre-trained YOLOv12 inflorescence detection model (byc_best.pt) and seed detection model (seed_best.pt), ensuring the stability of model loading through exception capture and log recording.
The core business layer encapsulates the detect_image function as the detection core, implementing a multi-step processing logic: first, it performs EXIF orientation correction on uploaded images to resolve the image rotation issue caused by mobile phone shooting; second, it calls the corresponding YOLO model for object detection (with a confidence threshold set to 0.3 to filter out low-precision results); third, it counts the detection results—inflorescences are classified into mature and immature categories, while the number of seeds is directly counted—and draws thick bounding boxes and category labels on the images; finally, it compresses the images for mobile adaptability and converts them to Base64 encoding to facilitate direct front-end rendering.
The interface layer is designed with two core HTTP interfaces: the GET/interface returns a front-end page embedded with native HTML/CSS/JavaScript, serving as the entry for user interaction; the POST/detect interface receives the image files and model type parameters uploaded from the front-end, calls the core business layer to complete detection, and returns the Base64-encoded images and statistical data in JSON format.
The embedded front-end interaction layer adopts a responsive layout for mobile adaptability, providing a drop-down box for model type selection, an image upload control, and a recognition trigger button. Native JavaScript is used to implement asynchronous request logic: after the button is clicked, it verifies the image selection status, constructs FormData to call the/detect interface, and displays the loading status and error prompts in real time. Upon receiving the returned results, it renders the detected images and displays the statistical data according to the selected model type.
(3) Overall Request Workflow
After users access the service address (192.168.31.23:8001), the back-end returns the front-end interactive page. Users then select the recognition model, upload images, and click the trigger button, prompting the front-end to asynchronously call the/detect interface via the Fetch API. After receiving the request, the back-end completes image detection and processing, and returns the Base64-encoded images and statistical data. Finally, the front-end renders the detection results, forming a closed-loop workflow of user interaction—back-end processing—result feedback.
This architecture abandons the complex deployment mode of traditional separate front-end and back-end, reducing engineering complexity through integrated design. Meanwhile, relying on the asynchronous characteristics of FastAPI and the high-efficiency inference capability of the YOLO model, it ensures the response speed and detection accuracy of mobile access, making it suitable for the demand of rapid identification of Bothriochloa ischaemum inflorescences and seeds under field scenarios.
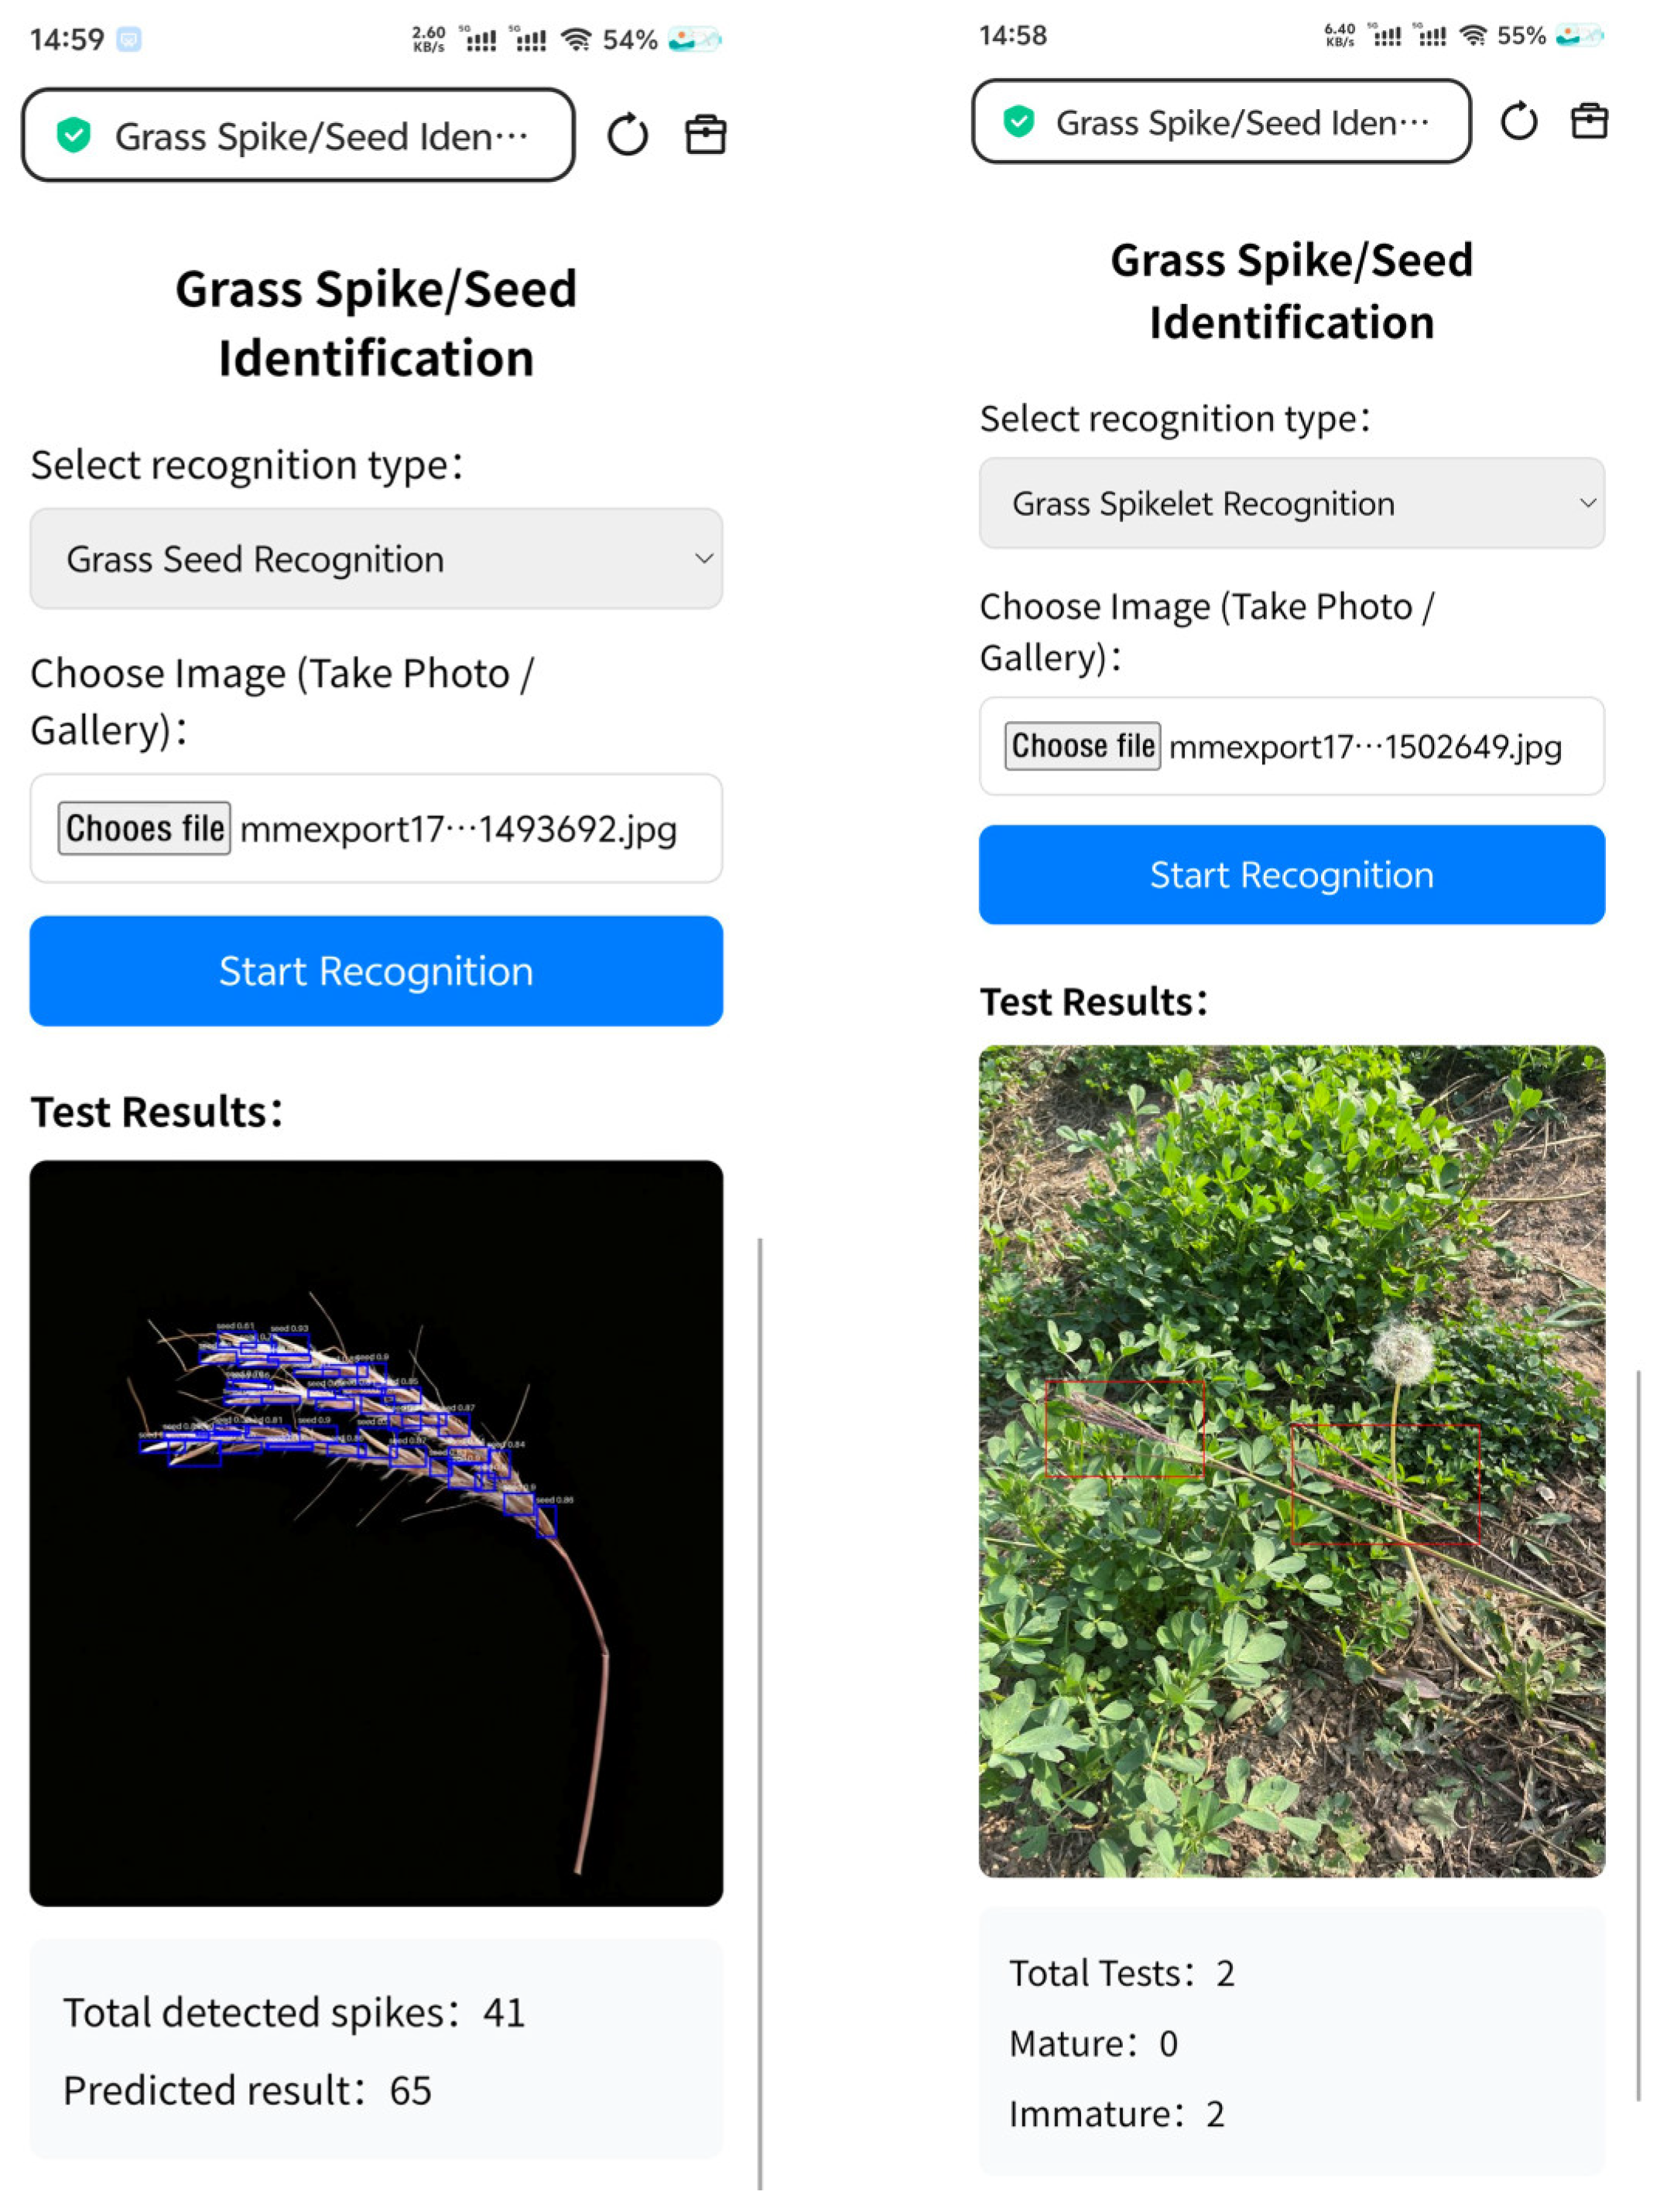
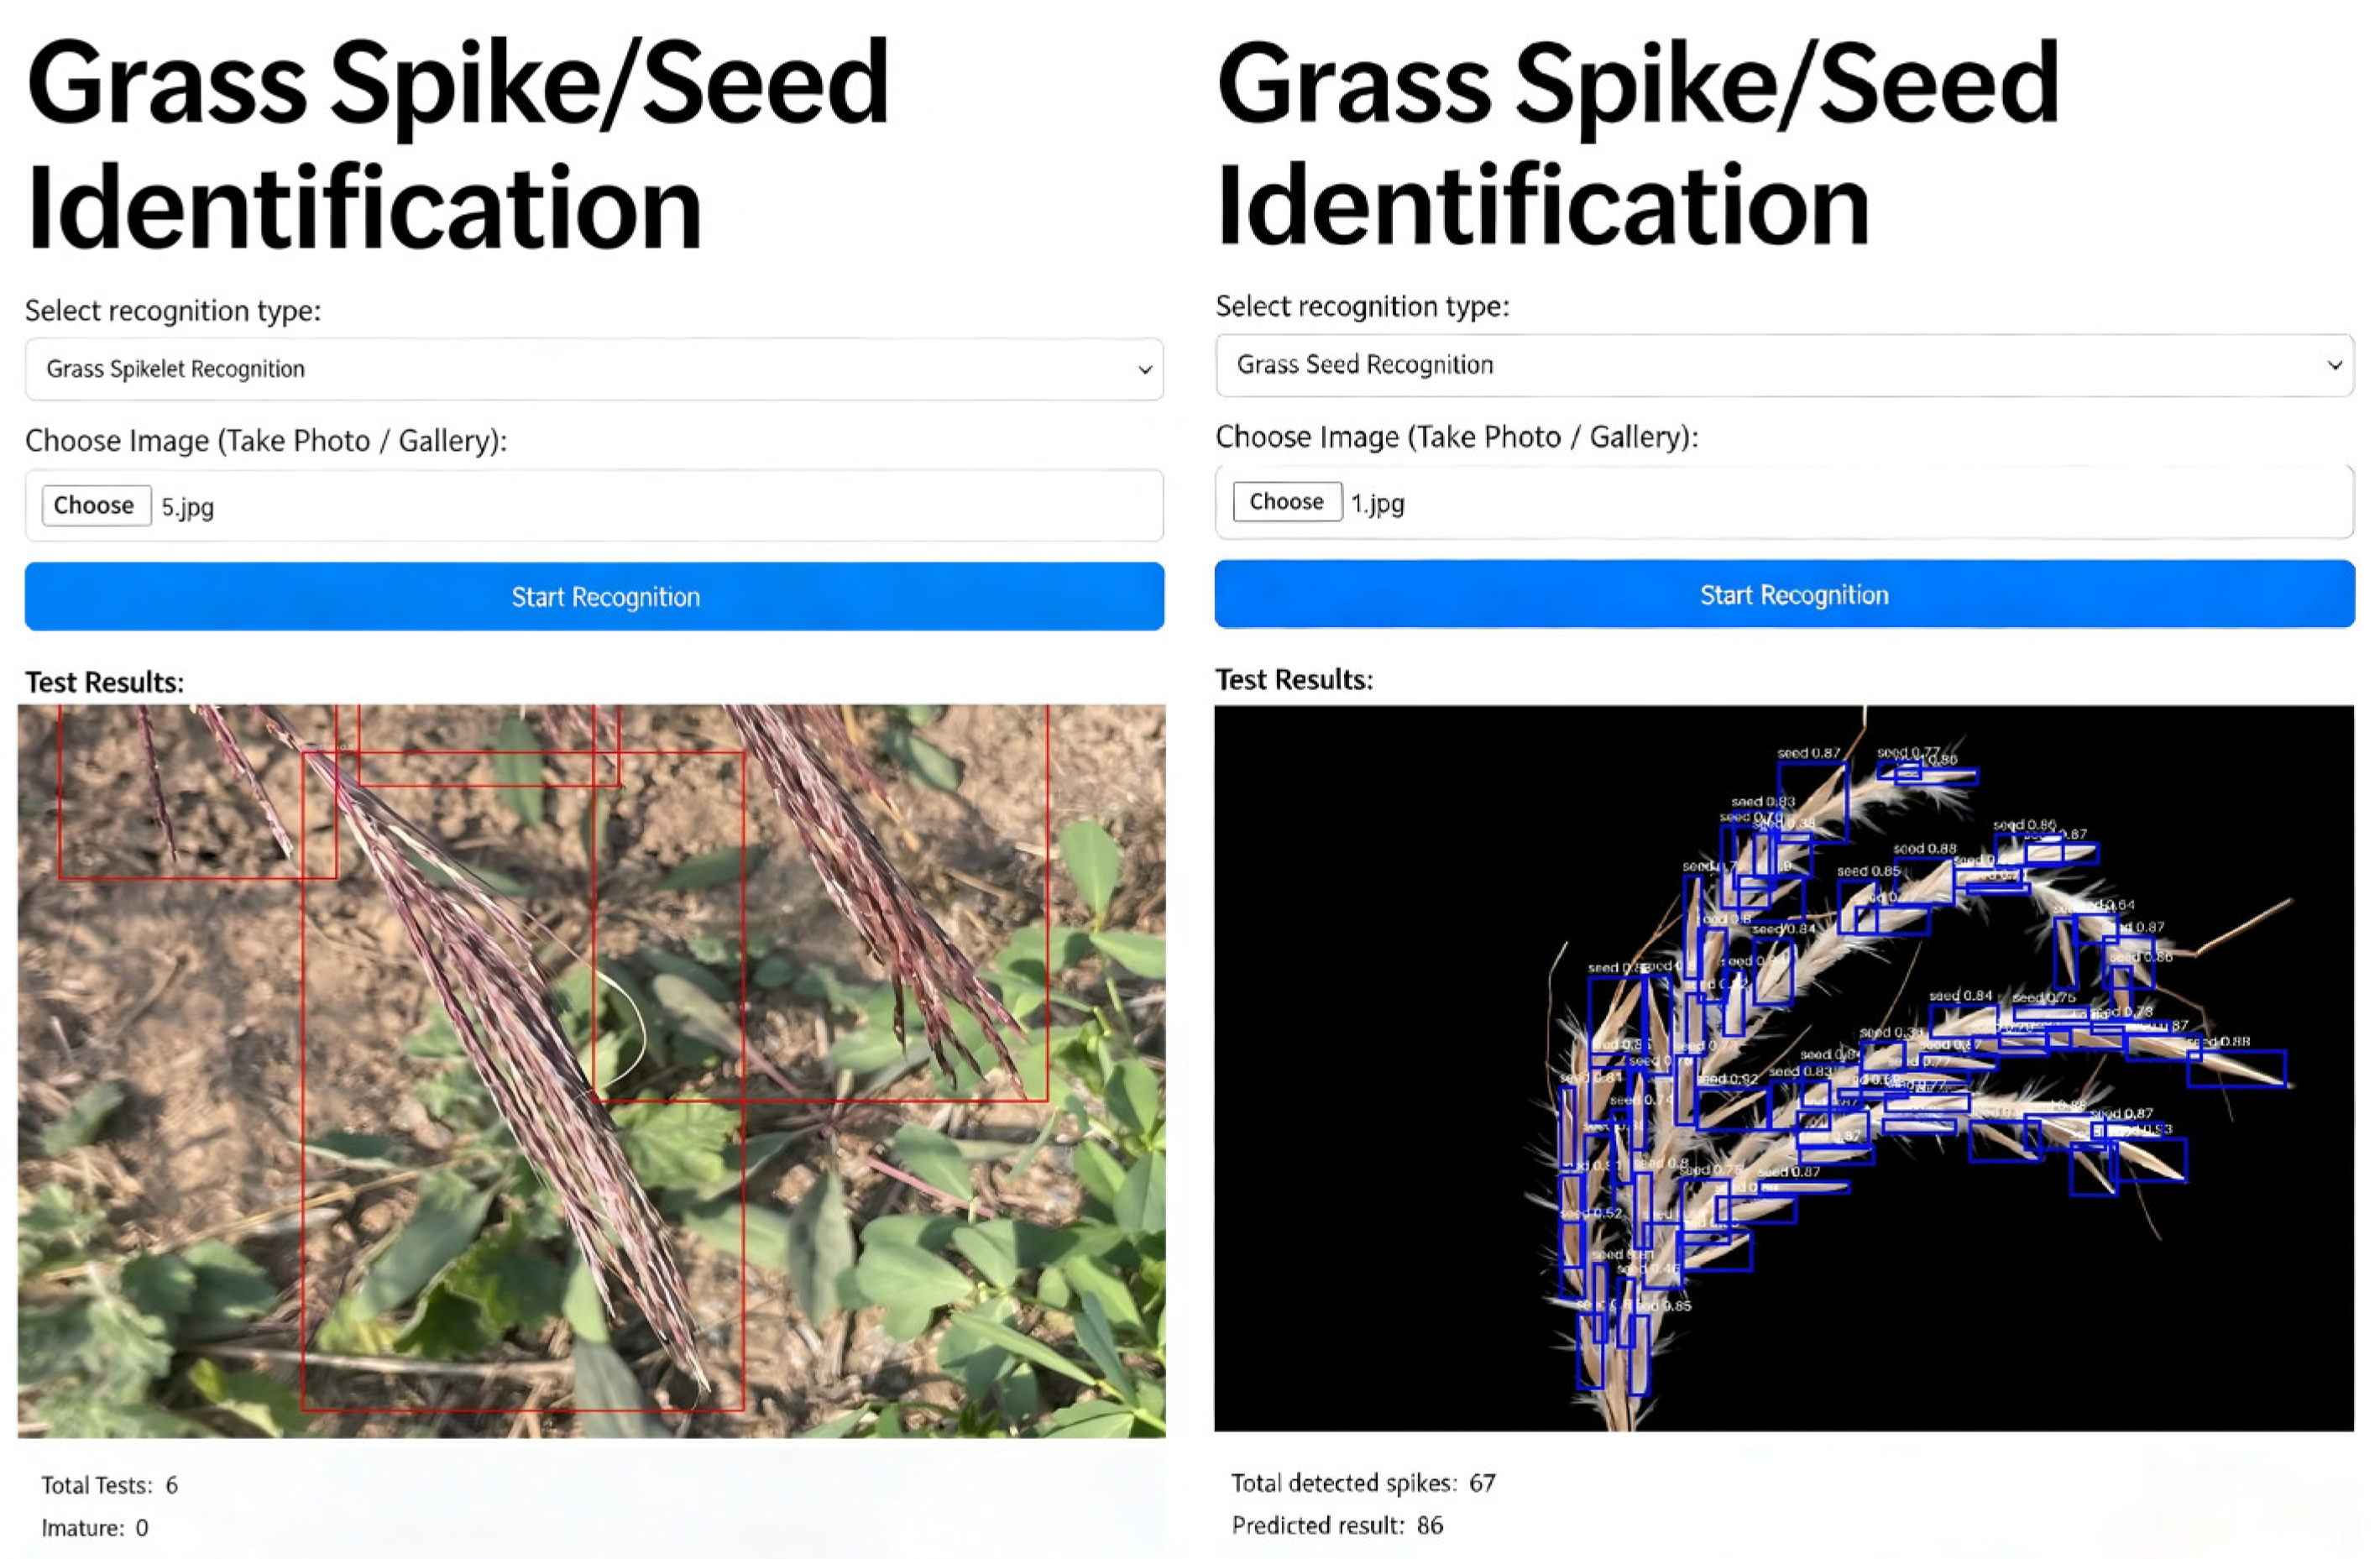
This implementation enables fast quantification of spikes and seeds within specific field plots, facilitating real-time yield estimation and decision-making during field experiments. As illustrated in
Figure 17 and
Figure 18, the web page is compatible with both computer and mobile terminals, and can flexibly switch the operation modes of the two models in accordance with actual operational requirements. When spike detection is needed, users can select the “spikelet” option to activate the spike recognition model, whereas selecting the “seed” option switches to the seed counting model. The Web supports image-based analysis using pre-stored photographs of
B. ischaemum spikes. This feature substantially accelerates processing speed, enabling efficient handling of large datasets and rapid completion of spike and seed counting tasks in outdoor environments. The application has completed multiple field tests in real agricultural environments, including indoor controlled scenarios and outdoor natural scenarios, and the experiments have verified that it possesses stable and good recognition performance.
This study completed the local deployment and functional verification of the inflorescence/seed recognition system based on the FastAPI and Uvicorn frameworks. During the deployment process, the Python runtime environment was first configured, and core dependent libraries including FastAPI, Uvicorn and Ultralytics were installed, followed by the loading of pre-trained YOLO model files (the inflorescence detection model and the seed detection model). Subsequently, the local web service was launched with the listening address configured as 0.0.0.0 and the port number set to 8001. In the testing phase, the front-end interface of the system was accessed via the local loopback address 192.168.31.23:8001, test images were uploaded and the recognition process was triggered. This verified the detection accuracy of the model for mature inflorescences, immature inflorescences and seeds, as well as the effectiveness of the system’s core functions including front-end and back-end data interaction, detection result visualization, and statistical data output. The full open-source project of this study is available in our public GitHub(v3.5.6)repository at:
https://github.com/DazaiYz/BDetectWeb/tree/main (accessed on 3 February 2026).
To verify the performance of the YOLO-based detection system in agricultural target detection tasks, this study carried out ear and seed detection tests separately: for ear detection, 60 planting scenario images with different density distributions were selected (25 dense, 15 medium-density and 20 sparse ones), with a total of 100 actual ears in the test set, and the system detected 90 valid ears, achieving an overall recall rate of 86.2% and a precision rate of 94.4%, while the mAP50 values for mature and immature ears reached 92.6% and 90.7% respectively, with the average mAP50 across all categories hitting 91.6%, indicating that the model can effectively address occlusion and overlap issues and exhibits excellent discriminative ability for ears at different maturity levels; for seed detection, 12 images containing 70–100 seeds each were selected, with the total number of seeds in the test set reaching 1000. The system successfully identified 900 seeds, yielding a recall rate of 86% and a precision rate of 96.5%, and the seed category achieved an mAP50 of 94.3% and an mAP50-95 of 73.9%, which demonstrates the model’s favorable generalization capability under different IoU thresholds. In conclusion, the system demonstrates high accuracy and robust performance in both automatic ear and seed detection tasks, and can meet the practical application requirements of agricultural production.
4. Discussion and Conclusions
This study proposes an approach that combines object detection and regression analysis to accurately quantify Bothriochloa ischaemum spikes and seeds in their natural form. For spike detection, an improved YOLOv12-DAN model was developed. DySample dynamic upsampling was employed to address recognition inaccuracies caused by the dense growth of Bothriochloa ischaemum spikes. The ASFF module was integrated as the detection head to mitigate missed detections resulting from spike occlusion. Additionally, the loss function was replaced with the Normalized Wasserstein Distance (NWD) to enhance the detection precision of small targets in the dataset. Compared with the baseline YOLOv12n model, the improved model achieved a 2.8% increase in precision (P), a 3.8% increase in recall (R), and a 2.2% improvement in mean average precision (mAP). Further comparative experiments across YOLO series models demonstrated that, on the same dataset, YOLOv12-DAN outperformed YOLOv5, YOLOv8, YOLOv9, YOLOv10, YOLOv11, and YOLOv12 with precision gains of 11%, 16.9%, 35.3%, 22.6%, 23.9%, and 2.7%, recall gains of 11.4%, 13.7%, 32.4%, 19.7%, 19.5%, and 3.8%, and mAP improvements of 10.2%, 12.2%, 35.7%, 19.6%, 19.8%, and 2.2%, confirming the superiority of the proposed model.
In the seed counting task, YOLOv12-EVC exhibited outstanding performance, achieving a bounding box precision of 96.5%, a recall of 86%, a mean average precision of 94.3%, and a mean average precision across IoU thresholds from 0.50 to 0.95 of 73.9%. The established regression equation effectively captured the relationship between predicted and actual seed counts, demonstrating small errors and substantial predictive capability. Therefore, the proposed approach holds promising applications in Bothriochloa ischaemum breeding and the automation of forage crop management.
To validate the significance of the proposed model improvements, we conducted paired
t-tests and one-way ANOVA with Tukey’s HSD post hoc tests based on 10 repeated experiments. For spike detection, YOLOv12-DAN showed extremely significant improvements over YOLOv12n in Precision (t = 8.72,
p < 0.001), Recall (t = 9.35,
p < 0.001), and mAP50 (t = 7.91,
p < 0.001;
Table 2). Multi-model comparisons confirmed that YOLOv12-DAN outperformed YOLOv5s, YOLOv8n, and other mainstream models with statistical significance (
p < 0.001), while its difference from YOLOv7-tiny was not significant (
p = 0.068)—a trade-off justified by YOLOv12-DAN’s 71 MB smaller model size (
Table 5). For seed counting, YOLOv12-EVC achieved significantly higher Precision (t = 4.28,
p < 0.01), Recall (t = 3.91,
p < 0.01), and mAP50-95 (t = 5.17,
p < 0.001) than YOLOv12 (
Table 9). These statistical results confirm that the proposed modifications (DySample, ASFF, NWD, EVC) are not accidental but contribute significantly to model performance, enhancing the reliability of our findings.




 ,
,