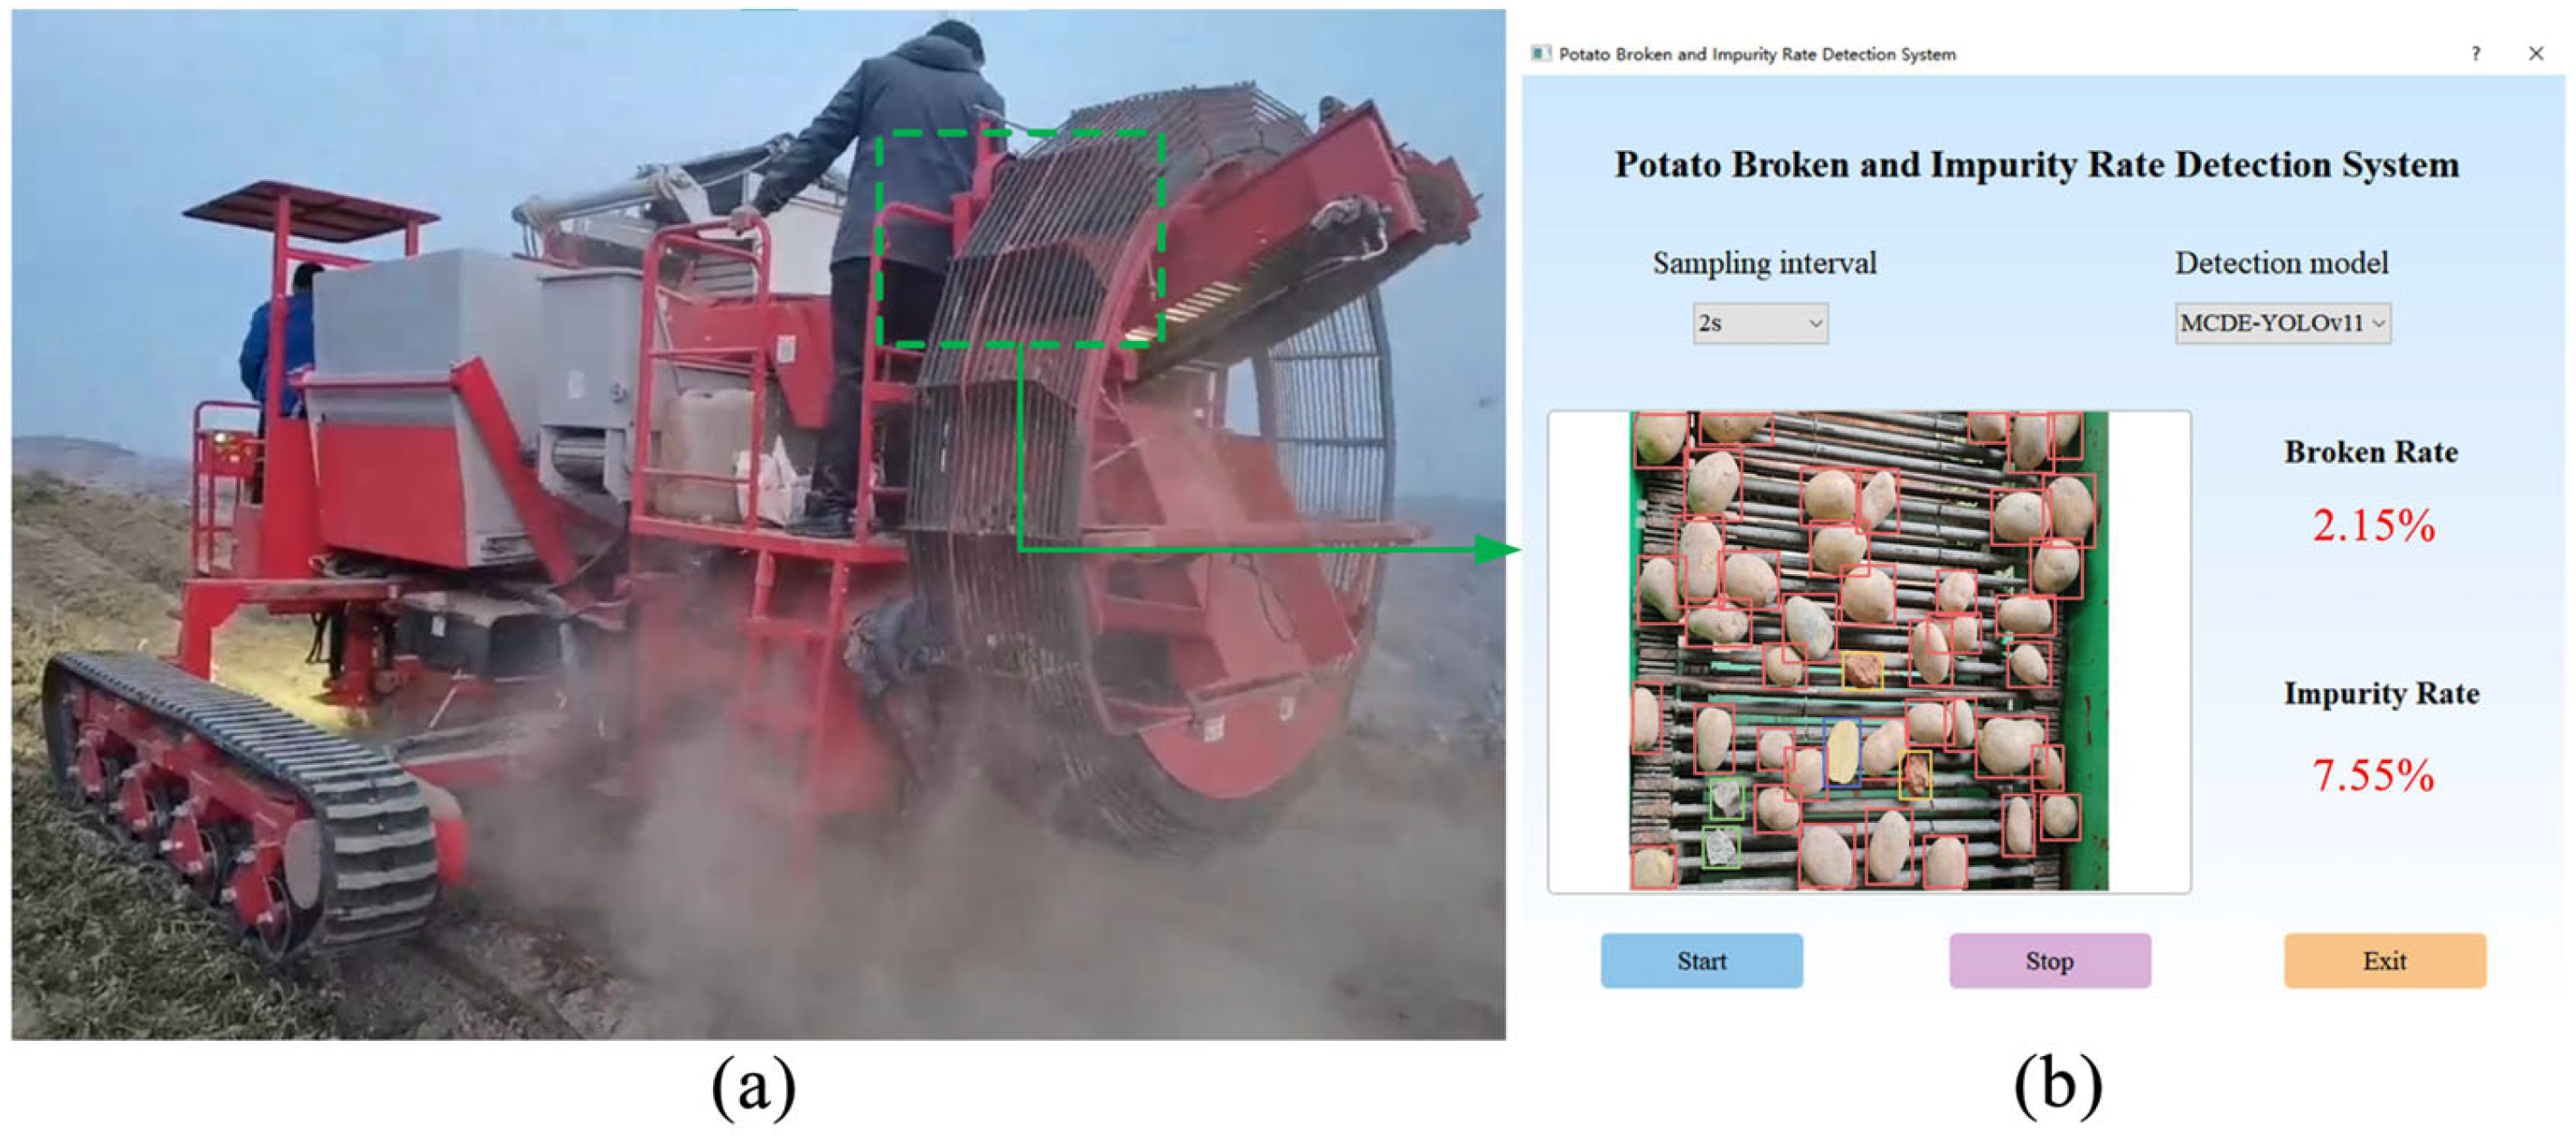
1. Introduction
Potato is an important food and economic crop that is widely cultivated worldwide, with diverse applications in fresh consumption, starch processing, food manufacturing, feed production, and industrial raw materials, highlighting its significance as both a staple food source and an industrial crop [
1]. Currently, potato harvesting methods mainly include segmented harvesting and combined harvesting [
2,
3]. Among them, potato combine harvesters are used in major potato-producing regions of China due to their high degree of operational integration, high working efficiency, and reduced labor costs [
4]. During combined harvesting, the broken and impurity rates of harvested materials are key indicators for evaluating harvesting quality, and their variations are closely related to critical operational parameters such as conveying, separation, and cleaning [
5,
6]. A high broken rate not only affects the commercial quality and storage performance of potatoes but also exacerbates the spread of diseases. A high impurity rate increases the burden on subsequent grading, storage, and processing stages, thereby reducing overall production efficiency.
Traditional methods for detecting broken and impurity rates usually require stopping the machine for sampling, followed by weighing the harvested materials and performing manual classification and statistical calculations [
7,
8]. This method is characterized by low detection efficiency and poor operational continuity, and it is also easily affected by human factors, making it difficult to meet the requirements for accuracy and real-time performance during practical harvesting operations [
9]. Therefore, real-time online monitoring of the broken and impurity rates during the harvesting process is important for timely adjustment of operational parameters, optimization of the harvesting process, and improvement in overall harvesting quality.
Computer vision and deep learning technologies are a solution for the evaluation of the broken and impurity rates during the harvesting process. These methods offer advantages such as non-contact detection, continuous online monitoring, and high-throughput processing [
10,
11,
12]. Geng et al. [
13] designed a grain detection device and proposed a two-stage deep learning model consisting of segmentation and classification to detect broken maize kernels. Using the SqueezeNet-dw2 network, Yao et al. [
14] realized broken maize kernel recognition with a validation accuracy of 93.98%. Ye et al. [
15] employed a convolutional neural network (CNN) to identify the broken rice rate (BR), and experimental results showed that the proposed method could achieve relatively accurate identification within approximately 2.5 s. However, most of the above studies were conducted under controlled indoor conditions, which differ significantly from the complex and variable operating conditions encountered during field operations of combine harvesters.
The online assessment of broken rate and impurity content during combine harvesting is receiving increasing attention in agricultural engineering applications. Current studies mainly focus on grain crops such as wheat, rice, maize, and soybean, and typically combine semantic segmentation or object detection algorithms with mathematical modeling methods to achieve online evaluation. By combining K-means clustering and the watershed algorithm, Chen et al. [
16] achieved particle image segmentation and implemented a backpropagation (BP) neural network for monitoring grain broken and impurity rates in combine harvester operations. Jin et al. [
17] proposed an online detection method for soybean broken rate and impurity content based on an improved U-Net, which was successfully deployed on a soybean combine harvester. Field test results showed good consistency between the proposed method and manual detection results. Wu et al. [
18] developed a lightweight detection system for broken and impurity rates based on Mask R-CNN. Their experimental results showed that during on-site operation of a grain harvester, the relative errors of impurity content and broken rate were 7.99% and 8.46%, respectively. Zhang et al. [
19] proposed the FSLYOLOv8n algorithm to detect kernel broken rate and impurity content during maize harvesting, achieving detection accuracies of 95.33% and 96.15%, respectively.
Compared with grain crops such as rice and wheat, the material flow rate during potato combine harvesting is relatively low; however, the individual volume of materials is larger, and phenomena such as block-like material overlap and similar color appearance frequently occur. These characteristics pose significant challenges for the accurate identification of potatoes, stones, and soil clods, thereby reducing the stability and accuracy of online detection. In addition, studies focusing on real-time detection of the broken and impurity rates during potato combine harvesting operations remain relatively limited, and mature and practical online monitoring solutions are still lacking.
To address the above issues, this study designed an online monitoring device for the broken and impurity rates in potato combine harvesting operations, and field experiments were conducted to verify the detection performance of the proposed method under different operating conditions. The main contributions of this paper are as follows:
- (1)
Considering the characteristics of large material volume, severe overlap, and similar color appearance during potato combine harvesting operations, an online monitoring device for broken and impurity rates was designed.
- (2)
A lightweight object detection model for potato combine harvesting operations was constructed. By introducing targeted improvements to the YOLOv11 network architecture, the recognition accuracy and robustness of the model under conditions of densely distributed multiple targets and similar appearances were enhanced.
- (3)
A field experimental platform was established to demonstrate the effectiveness and engineering applicability of the proposed method under varying operating speeds.
2. Materials and Methods
2.1. Composition and Installation Position of the Sampling Device
To achieve online monitoring of the broken and impurity rates during potato combine harvesting, a machine-vision-based sampling device was designed to enable real-time perception and analysis of material conditions on the chain conveyor. The device continuously acquires image information of materials during conveying and transmits the detection results to a control terminal for display, providing operators with intuitive feedback on operating status, thereby assisting in optimizing operating parameters and improving harvesting quality.
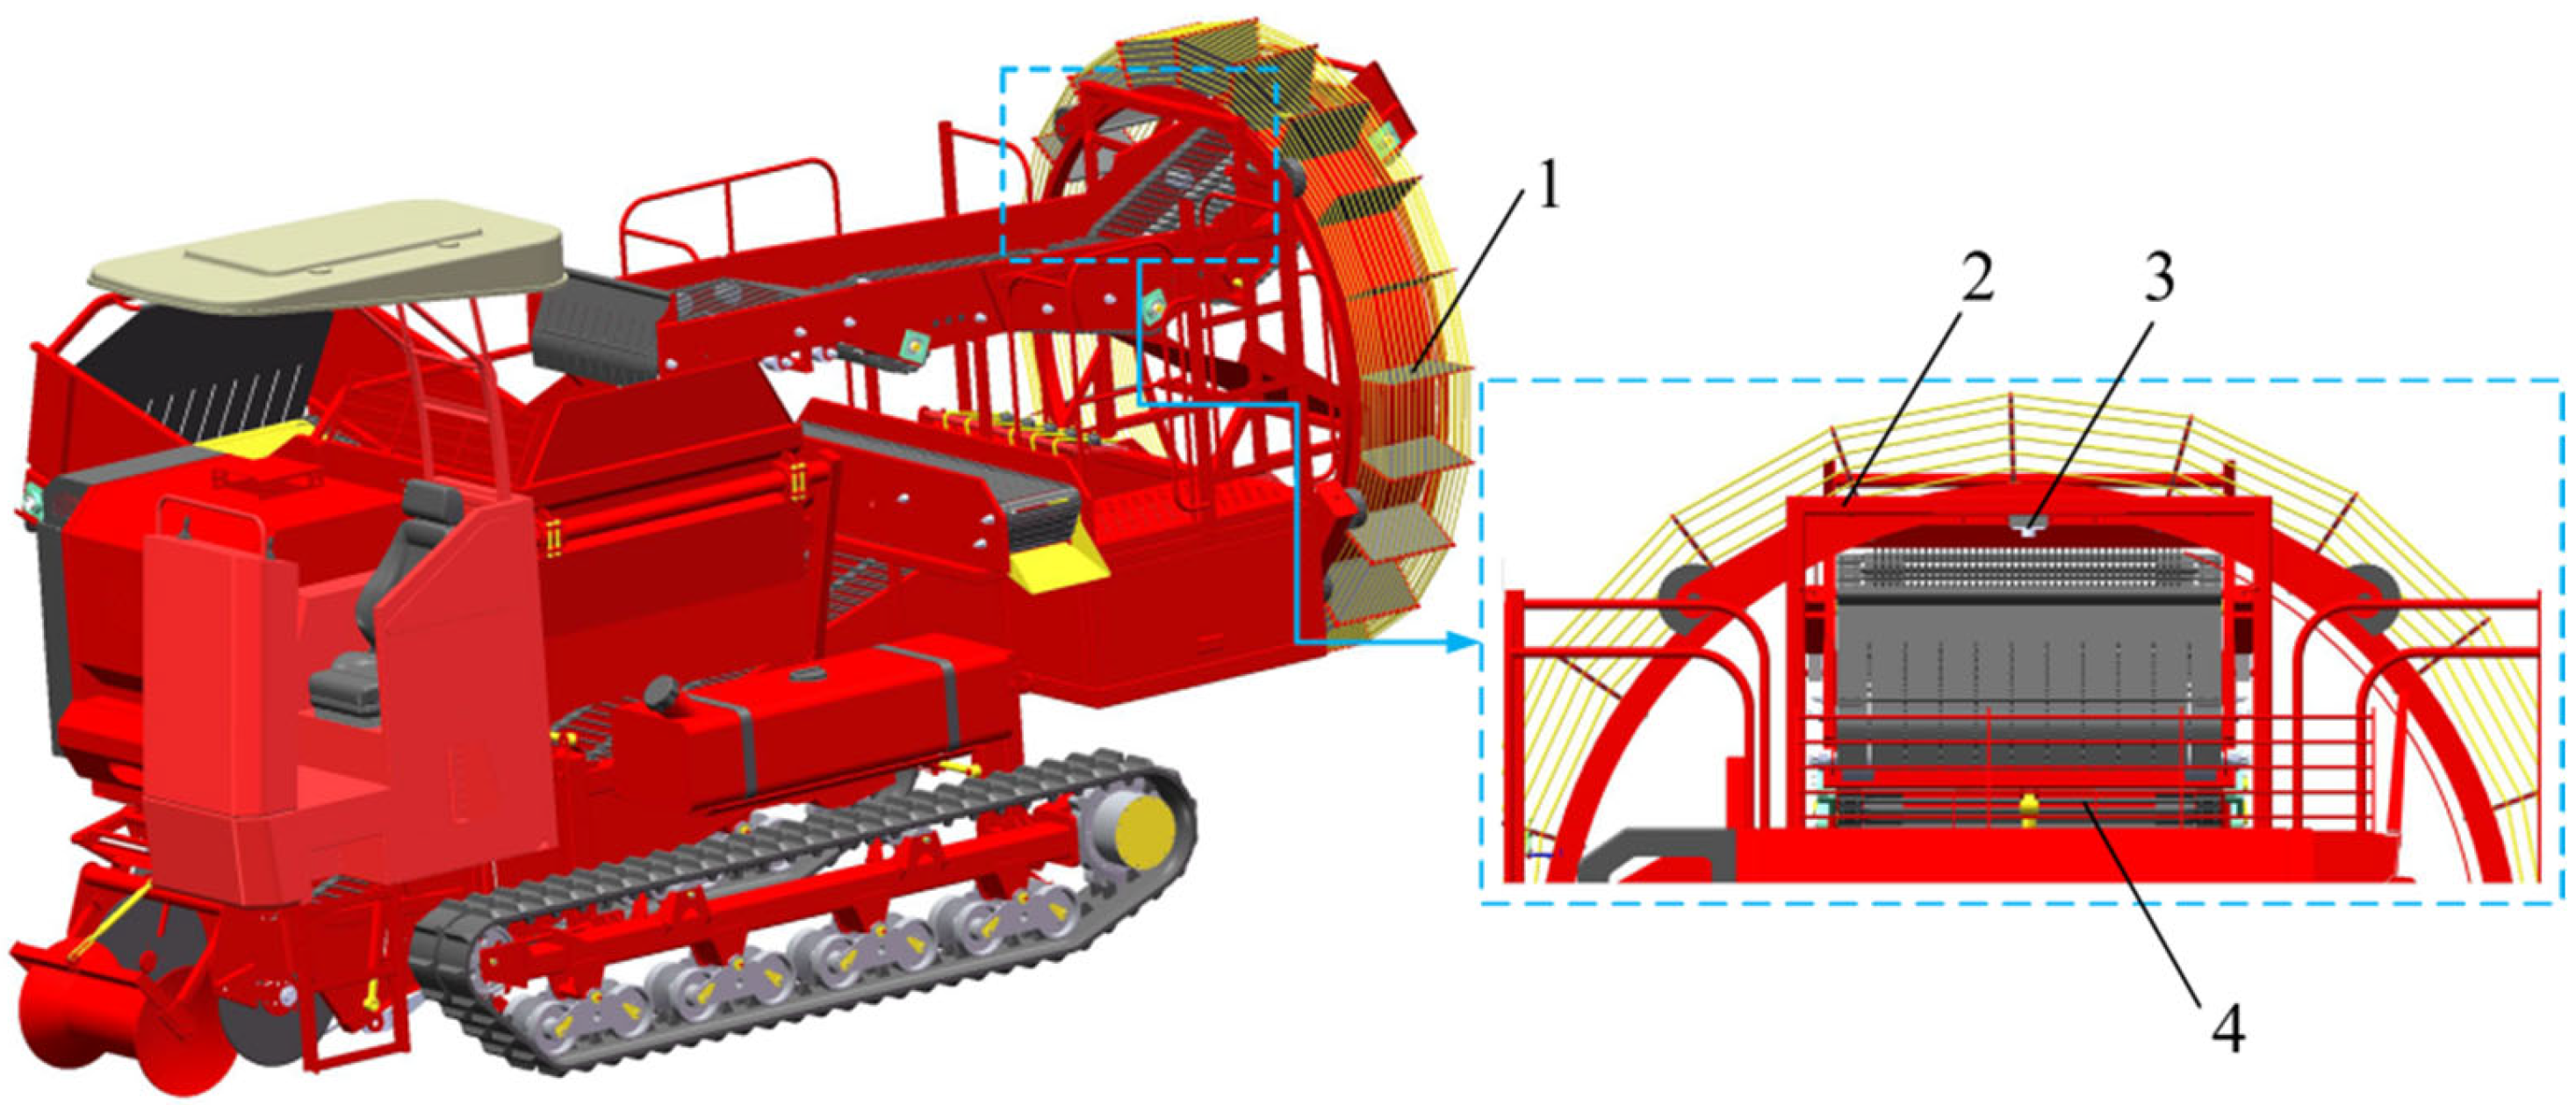
The overall structure of the potato combine harvester is shown in
Figure 1. The harvester used in this study was a 4U-1000 crawler self-propelled potato combine harvester developed by the Intelligent Agricultural Machinery Team of Hainan University and manufactured by Qingdao Hongzhu Agricultural Machinery Co., Ltd., Qingdao, China. The sampling device was installed at the inlet of the circular lifting device. An industrial camera was vertically mounted on the beam support structure above the chain conveyor, with the optical axis perpendicular to the material conveying plane. The installation distance between the camera and the conveyor chain was approximately 300 mm, balancing field-of-view coverage and imaging clarity to ensure stable acquisition of surface features of the conveyed materials. The camera was positioned at the tail end of the conveyor line, near the inlet of the circular lifting device, and its field of view covered the effective working width of the conveyor at this location, ensuring that all conveyed materials within the detection region were captured. Image samples are continuously acquired by the sampling device, while the broken and impurity rates are calculated and displayed in real time. During field operation, no additional lens cleaning was required, as the installation position effectively reduced soil splash and dust accumulation.
A Jetson was employed as the embedded computing platform, with built-in broken and impurity detection software. The industrial camera was connected to the computing platform via a USB interface to enable periodic dynamic sampling during image acquisition. In this study, an NVIDIA Jetson Orin Nano Super 4 GB (NVIDIA, Santa Clara, CA, USA) was used as the embedded control unit. The platform is based on the NVIDIA Ampere architecture and provides integrated CPU–GPU heterogeneous computing capability. It was equipped with 4 GB memory and 256 GB onboard storage, running Ubuntu 20.04 operating system for real-time field deployment.
2.2. Dataset Creation
Sample images were collected on 12 September 2025, in Dingxi City, Gansu Province, China. The data were collected under typical autumn harvesting conditions with stable natural illumination and dry soil surface conditions. The weather was clear, and no artificial lighting was used during image acquisition. The harvester operated continuously under normal field load, with a forward speed maintained at 3.5 km/h. A C100 industrial camera (WHEELTEC, Guangzhou, China) equipped with a 1/2.7-inch CMOS sensor (2 megapixels) was used for image acquisition, with a resolution of 1920 × 1080. Images were captured at an interval of 5 s to reduce redundancy between adjacent frames. The sampling device continuously imaged the materials on the chain conveyor under natural field illumination conditions. The camera operated with automatic exposure control during field acquisition, and key imaging parameters such as shutter speed and ISO were adaptively adjusted according to illumination changes.
The collected images included intact potatoes, damaged potatoes, soil clods, and stones. After acquisition, the original images were annotated and divided into datasets. All images were manually annotated using bounding boxes with LabelImg (Version 1.8.6, Tzutalin, Taipei, China). In cases of target overlap or partial occlusion, objects with more than 30% visible area were labeled. Damaged potatoes were defined as tubers showing clear surface breakage, cracks, or missing flesh caused by mechanical impact during harvesting.
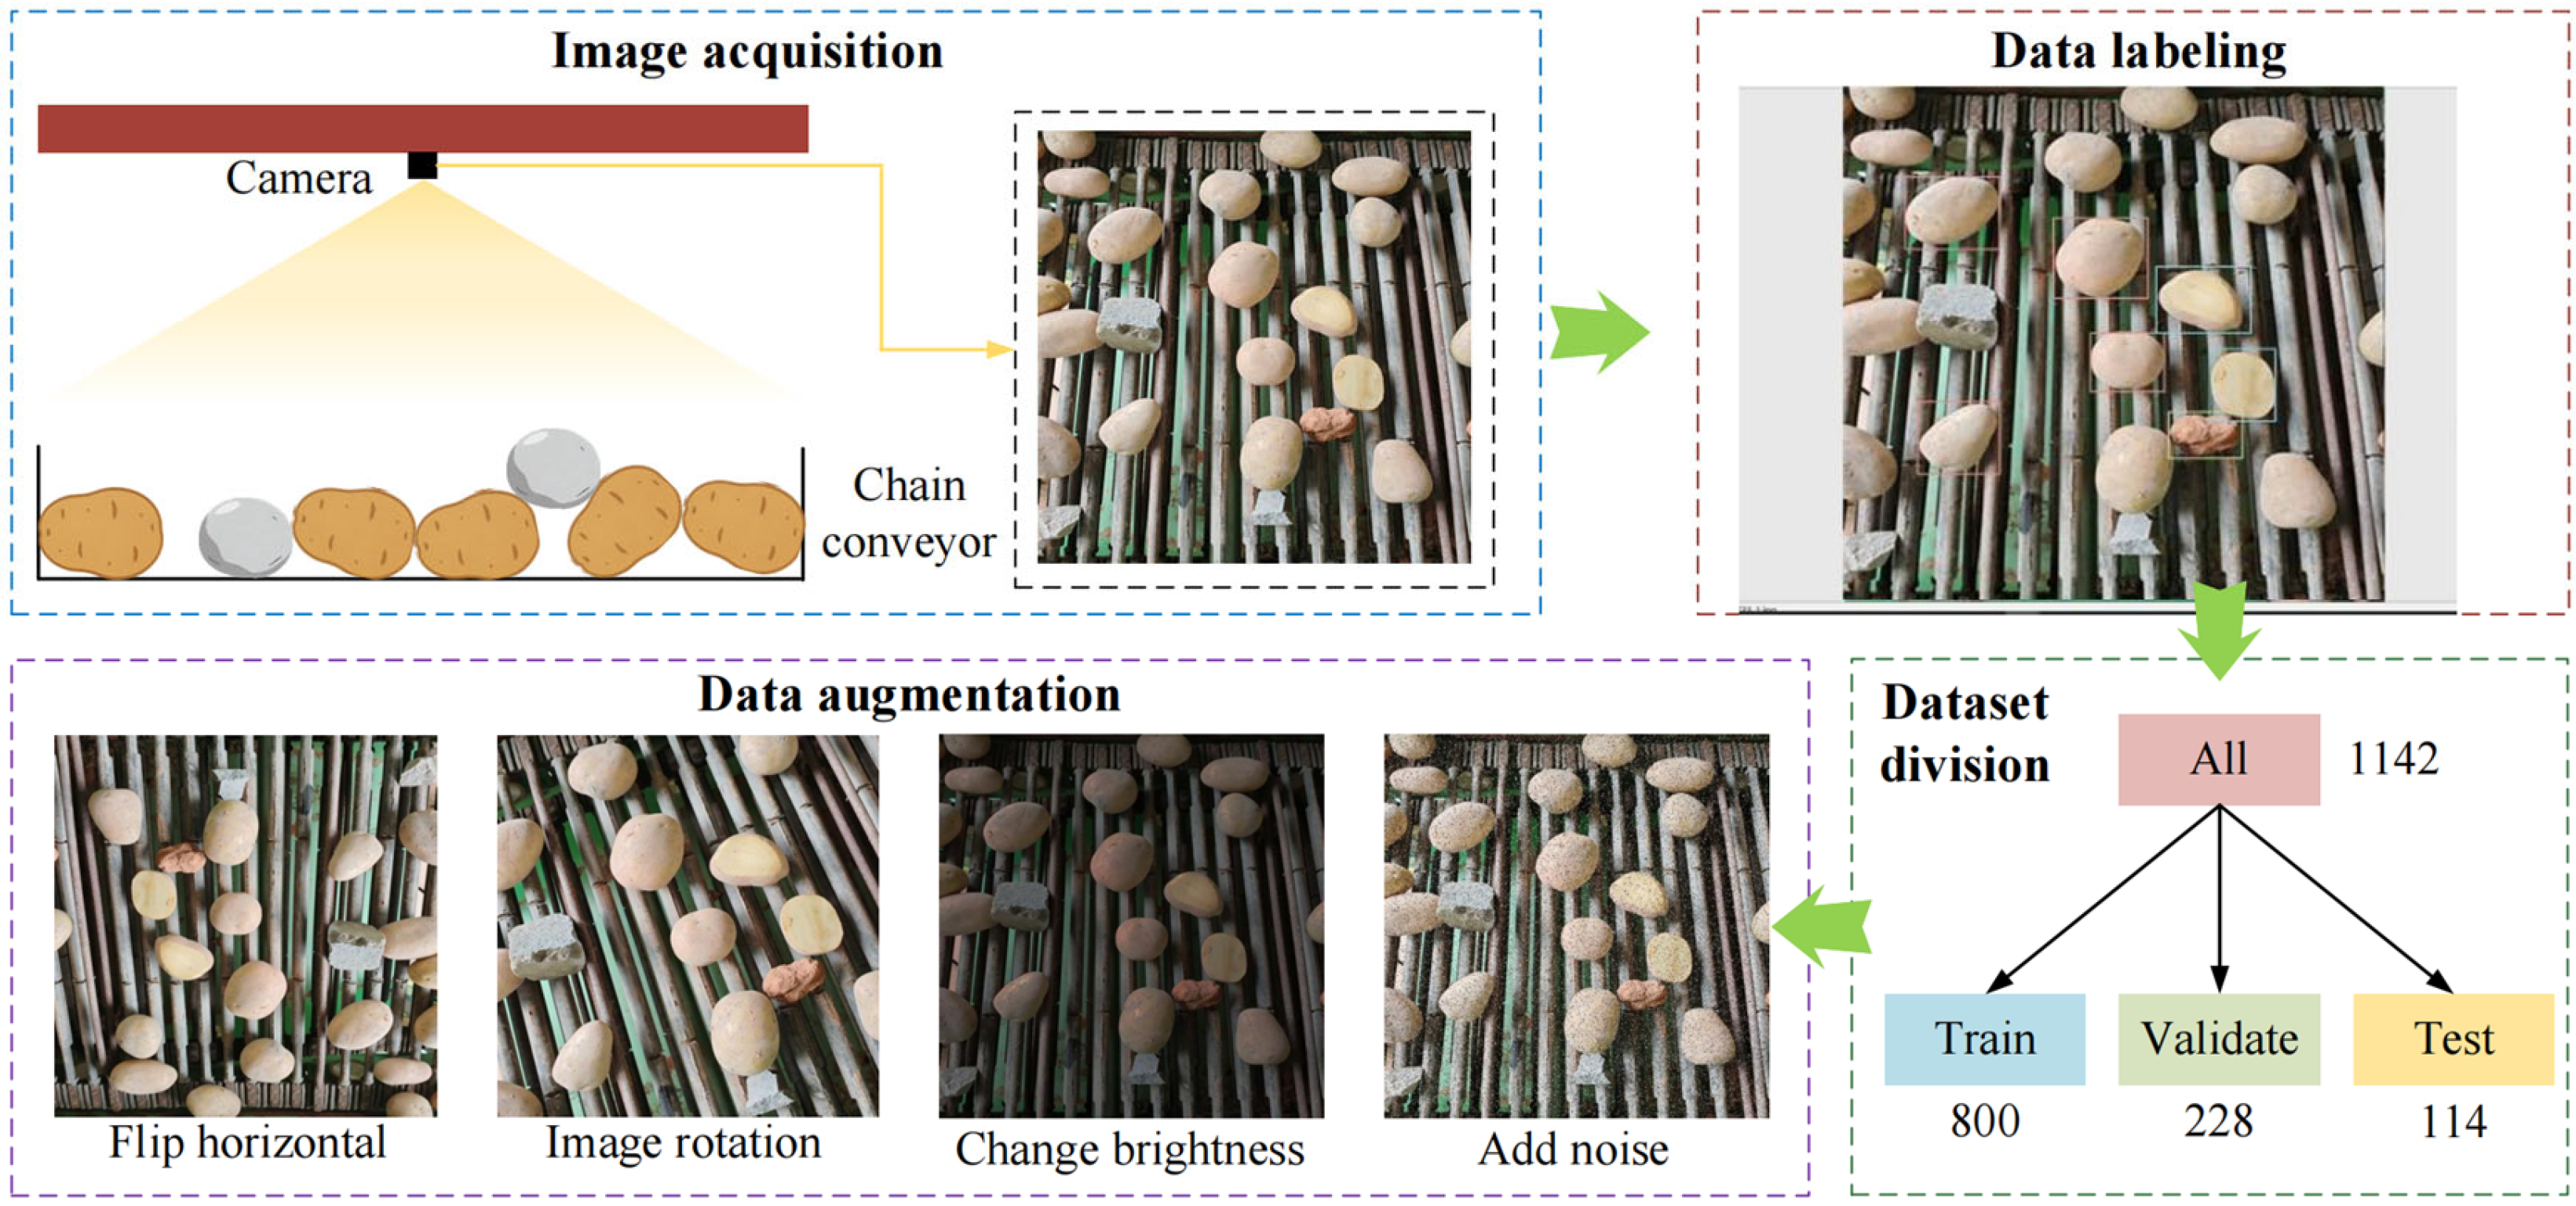
The diversity of the training dataset was increased by introducing data augmentation strategies, including brightness and contrast adjustment, image rotation, and noise addition, to improve performance in complex operating environments. All augmentation operations were implemented using Python (version 3.9.21)-based image processing scripts. A total of 1142 original images were captured before augmentation, and the final dataset size was expanded through these augmentation strategies. To avoid potential data leakage, the dataset was split based on different harvesting runs rather than random frame-level sampling, ensuring that adjacent frames from the same operation did not appear simultaneously in the training, validation, and test sets. Ultimately, a dataset consisting of 5710 images was constructed, including 4000 images for the training set, 1140 images for the validation set, and 570 images for the test set. The image acquisition and dataset construction process is shown in
Figure 2.
2.3. Calculation Model of Broken and Impurity Rates
In existing studies, the calculation of the broken and impurity rates is usually achieved by establishing a mapping relationship between the pixel area of detected targets and their actual mass, thereby estimating the mass of different types of materials and calculating their proportions. However, under the actual operating conditions of potato combine harvesters, materials often overlap and occlude each other during conveying. In such cases, relying on a linear relationship between pixel area and mass makes it difficult to accurately reflect the true mass distribution, thus affecting the reliability of the calculation results. Therefore, referring to the method proposed by Man et al. [
20], this study adopted a quantity–mass corresponding relationship for estimation. The numbers of different categories of materials were obtained based on object detection results, and the broken and impurity rates were calculated by combining these quantities with the average mass of individual materials. The broken rate
Mα and impurity rate
Mβ during potato combine harvesting can be calculated as follows:
where
m1,
m2,
m3, and
m4 represent the average mass of intact potatoes, damaged potatoes, soil clods, and stones, respectively.
n1,
n2,
n3,
n4 denote the corresponding numbers of detected targets for each category during the detection process. During the material collection stage, 100 groups of materials were randomly selected from the collected samples and weighed according to different categories. The obtained average masses were
m1 = 208 g,
m2 = 192 g,
m3 = 121 g, and
m4 = 244 g, respectively.
To address the potential variability in individual material mass, a sensitivity analysis was conducted to evaluate the robustness of the proposed quantity–mass estimation model. Although Equation (1) employs fixed average masses for each material category, in practical harvesting conditions, the mass of potatoes and impurities may vary due to differences in tuber size, damage degree, and impurity composition.
Therefore, the average mass parameters m1 − m4 were simultaneously perturbed within realistic fluctuation ranges of ±10% and ±20% relative to their baseline values, and the corresponding changes in the calculated Mα and Mβ were analyzed. The deviation was computed with respect to the original estimation results obtained using the unperturbed average masses. The results showed that when the mass values varied within ±10%, the relative deviation in the estimated rates remained below 3.5%, and even under ±20% variation, the deviation did not exceed 6.8%. These findings indicate that the proposed calculation model is not overly sensitive to moderate fluctuations in average mass parameters.
The robustness of the model can be attributed to the fact that the rate estimation relies primarily on the relative proportions of detected categories rather than absolute mass values. In addition, the average masses used in this study were obtained from 100 randomly sampled material groups. Statistical analysis showed that the mass distributions approximately follow a normal distribution, indicating that the samples are representative under typical harvesting conditions.
To evaluate the accuracy of the proposed calculation model, manual detection results were used as reference values, and the model outputs were quantitatively evaluated using relative error. The calculation formula is as follows:
where
η represents the relative error,
X denotes the broken rate or impurity rate obtained by manual detection, and
Y represents the corresponding indicators calculated by the detection system.
2.4. MCDE-YOLOv11
In the field of object detection, the YOLO series models are well known for their favorable detection speed and accuracy. However, issues such as computational redundancy and low parameter utilization still exist. As a key iterative version of the YOLO series, YOLOv11 maintains the technical advantages of the series in high-efficiency object detection through systematic architectural innovations [
21,
22,
23]. While preserving the core characteristics of real-time inference, the model embeds a redesigned C3K2 feature processing unit into the backbone, and integrates an enhanced C2PSA attention module into the feature fusion layer. Together, these components constitute the core innovative architecture of the model.
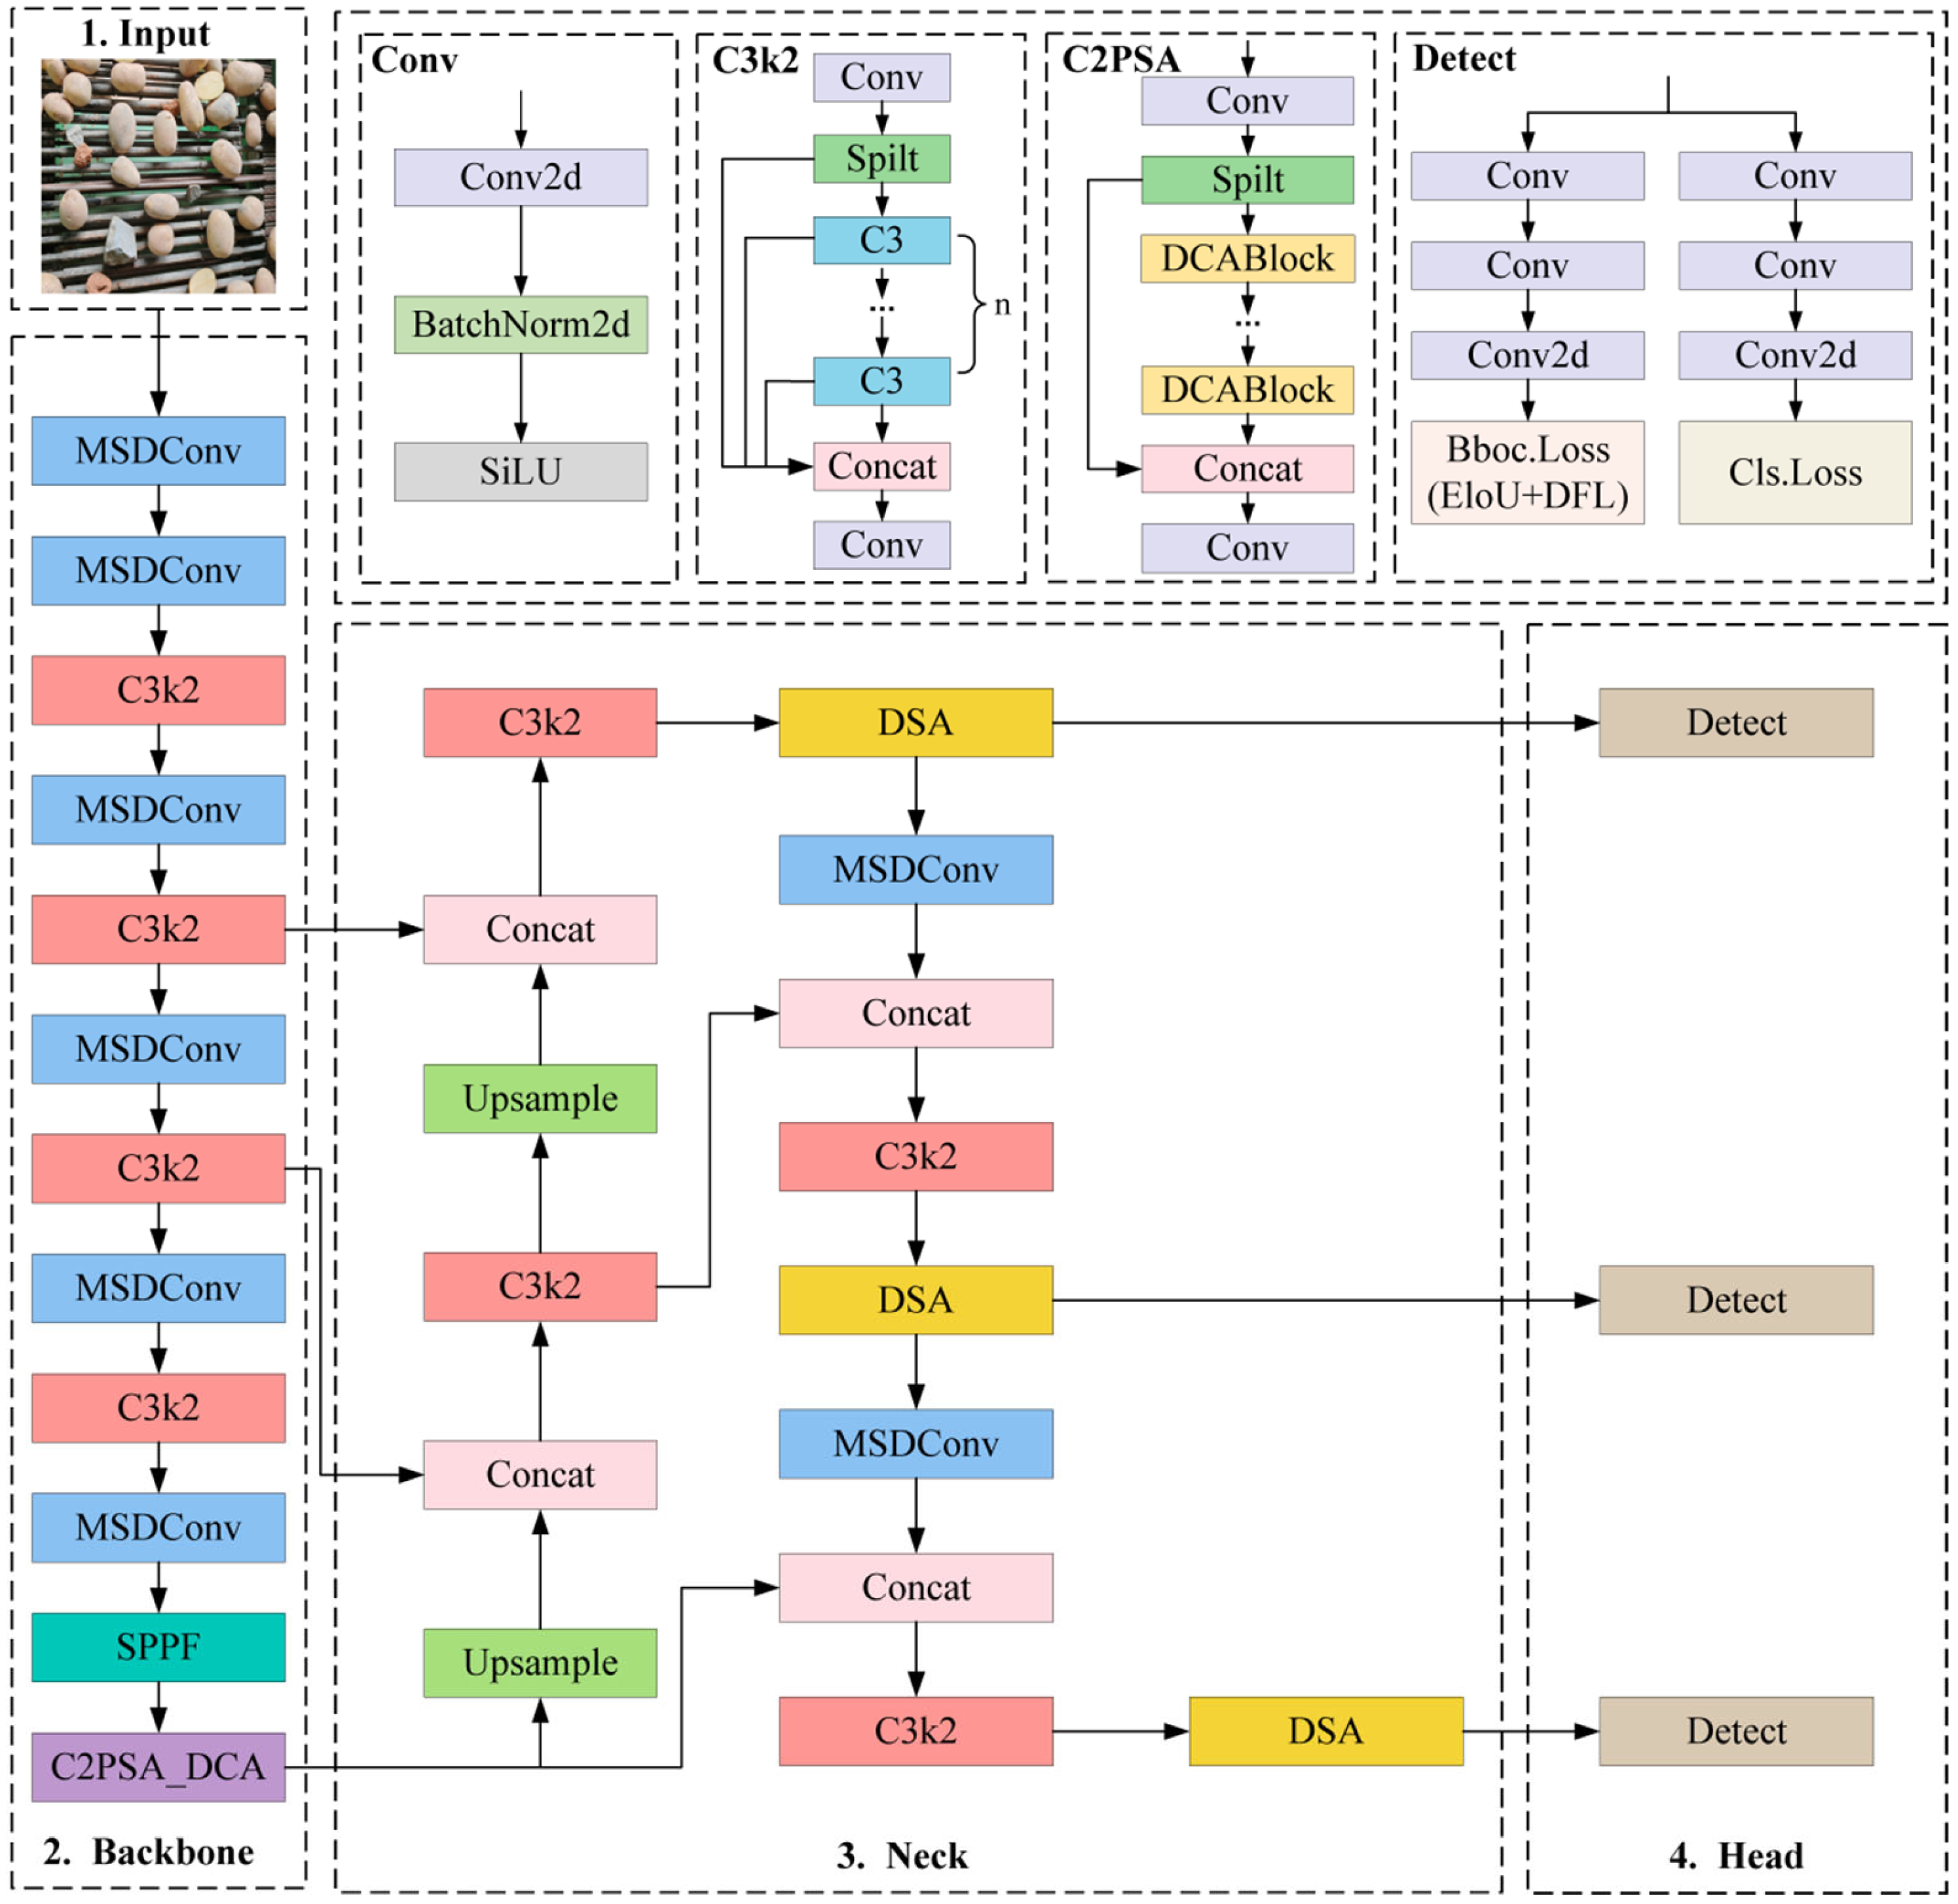
YOLOv11n was selected as the baseline model to meet the storage constraints of edge devices in potato object detection applications, with the aim of enhancing potato detection accuracy while maintaining a relatively small number of parameters. The improved YOLOv11 model mainly consists of backbone, neck, and head. The overall architecture of the model is illustrated in
Figure 3.
2.4.1. MSDConv
During potato harvester operation, potatoes are continuously conveyed along the chain conveyor and periodically captured for online detection, which may result in blurred target boundaries between adjacent materials. Meanwhile, foreign objects such as soil clods and stones are often conveyed together with potatoes, and some damaged potatoes exhibit incomplete surface structures. These factors lead to significant differences in scale, texture, and morphological features among targets. The original Conv module in YOLOv11 employs fixed single-scale convolution kernels for feature extraction, resulting in a limited receptive field and a primary focus on local spatial information modeling. In high-density chain conveyor scenarios, this module has difficulty simultaneously capturing fine-grained texture features of damaged potatoes and large-scale structural information in stacked and occluded regions. Consequently, small damaged areas are prone to missed detection, or foreign objects such as soil clods and stones may be misidentified as potatoes.
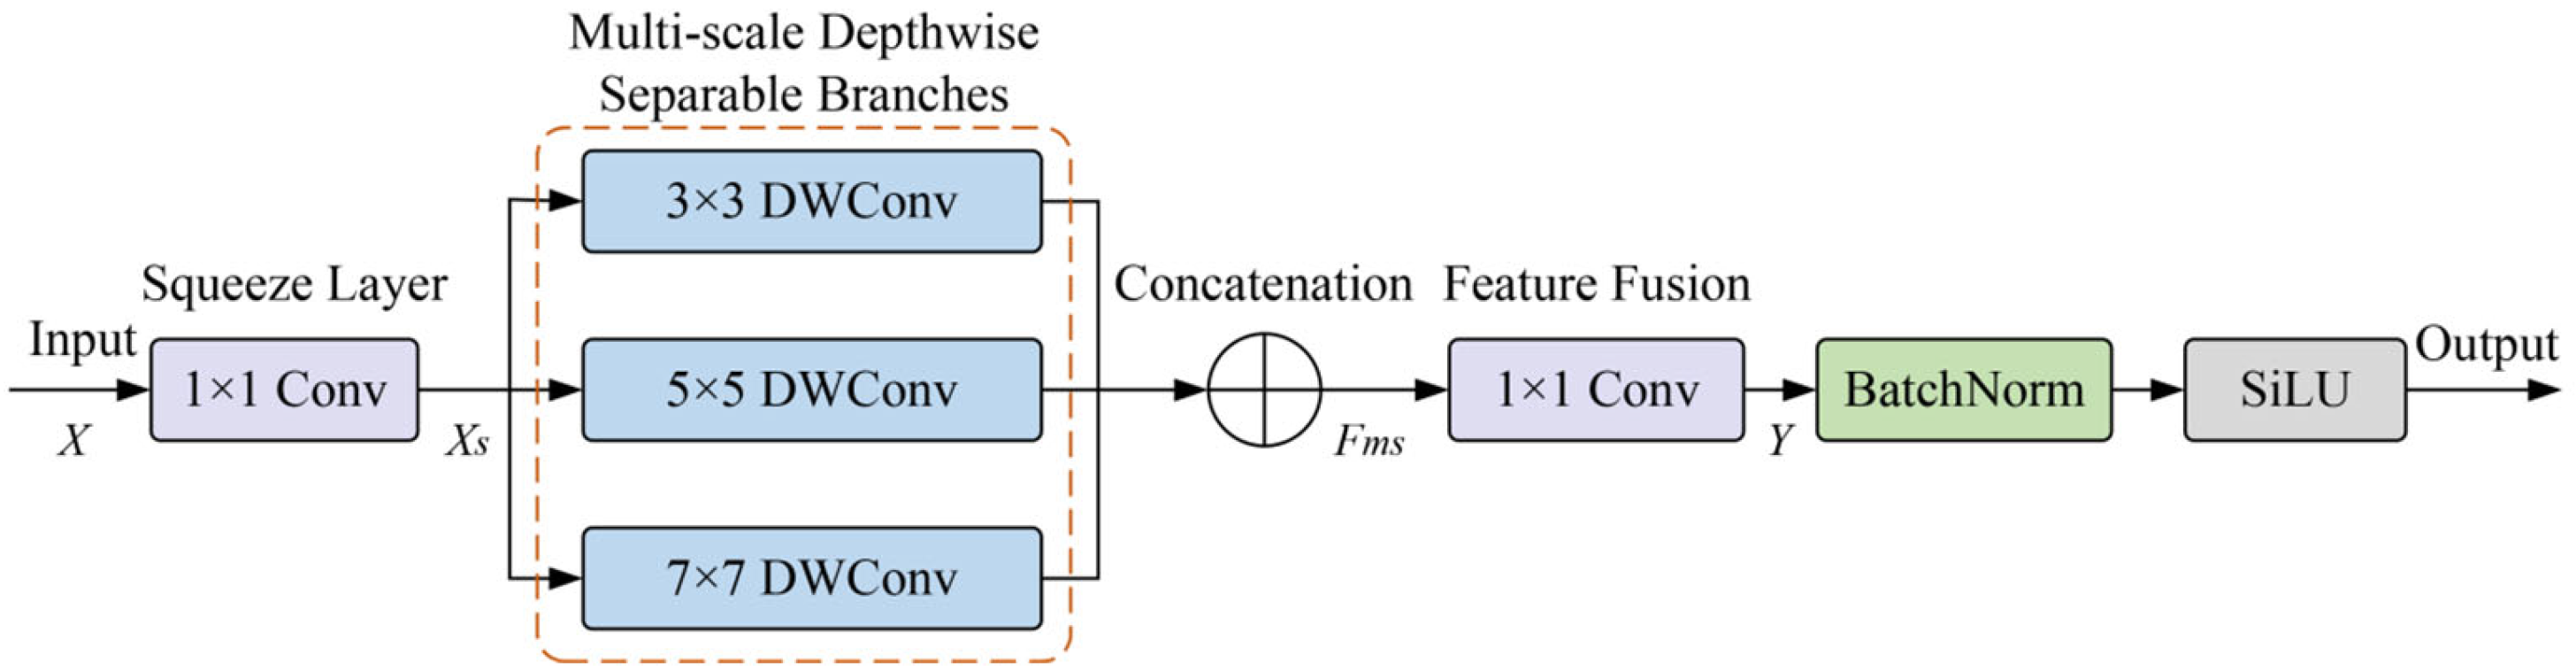
To address the above issues, a novel Multi-Scale Depthwise Convolution (MSDConv) module is proposed in this study. As shown in
Figure 4, the module is based on multi-scale depthwise separable convolution as its core, and jointly models texture and geometric features of potato surfaces at different spatial scales through a parallel-branch structure.
Specifically, given an input feature map
X∈R
Cin×H×W, where
Cin denotes the number of input channels and
H and
W represent the height and width of the feature map. Channel compression is first performed using a squeeze layer implemented by a 1 × 1 convolution to obtain the compressed feature
Xs. The number of compressed channels is controlled by the compression factor
r. Subsequently
Xs is fed into three parallel branches: a standard 3 × 3 depthwise separable convolution branch
f3×3(
Xs), a large-receptive-field 7 × 7 depthwise separable convolution branch
f7×7(
Xs), and a 5 × 5 dilated convolution branch with a dilation rate of 3, denoted as
f5×5,dilated(X
s). The output features of the three branches are fused through channel concatenation as follows:
where || denotes the channel concatenation operation.
Subsequently, a pointwise convolution
f1×1 is applied to map the fused multi-scale feature
Fms to the output space:
Finally, the output features are sequentially processed by batch normalization and a nonlinear activation function to obtain the final output of the MSDConv module.
Through the above design, the MSDConv module is expected to improve detection performance in potato harvester applications. The multi-scale parallel branches enable simultaneous capture of fine-grained surface features of damaged potatoes and global structural information in high-density stacked scenes, thereby effectively alleviating detection difficulties caused by occlusion and scale variation.
2.4.2. C2PSA_DCA
In the actual operating environment of the chain conveyor in potato harvesters, the detection process is often affected by factors such as uneven illumination, strong surface reflections, and random variations in material posture. Although the original C2PSA module in YOLOv11 introduces a position-sensitive attention mechanism that enhances local feature modeling to some extent, its attention modeling mainly focuses on spatial positional relationships. As a result, it lacks targeted characterization of feature differences along different geometric directions, making it difficult to fully exploit high-dimensional semantic information and directional structural features under complex operating conditions.
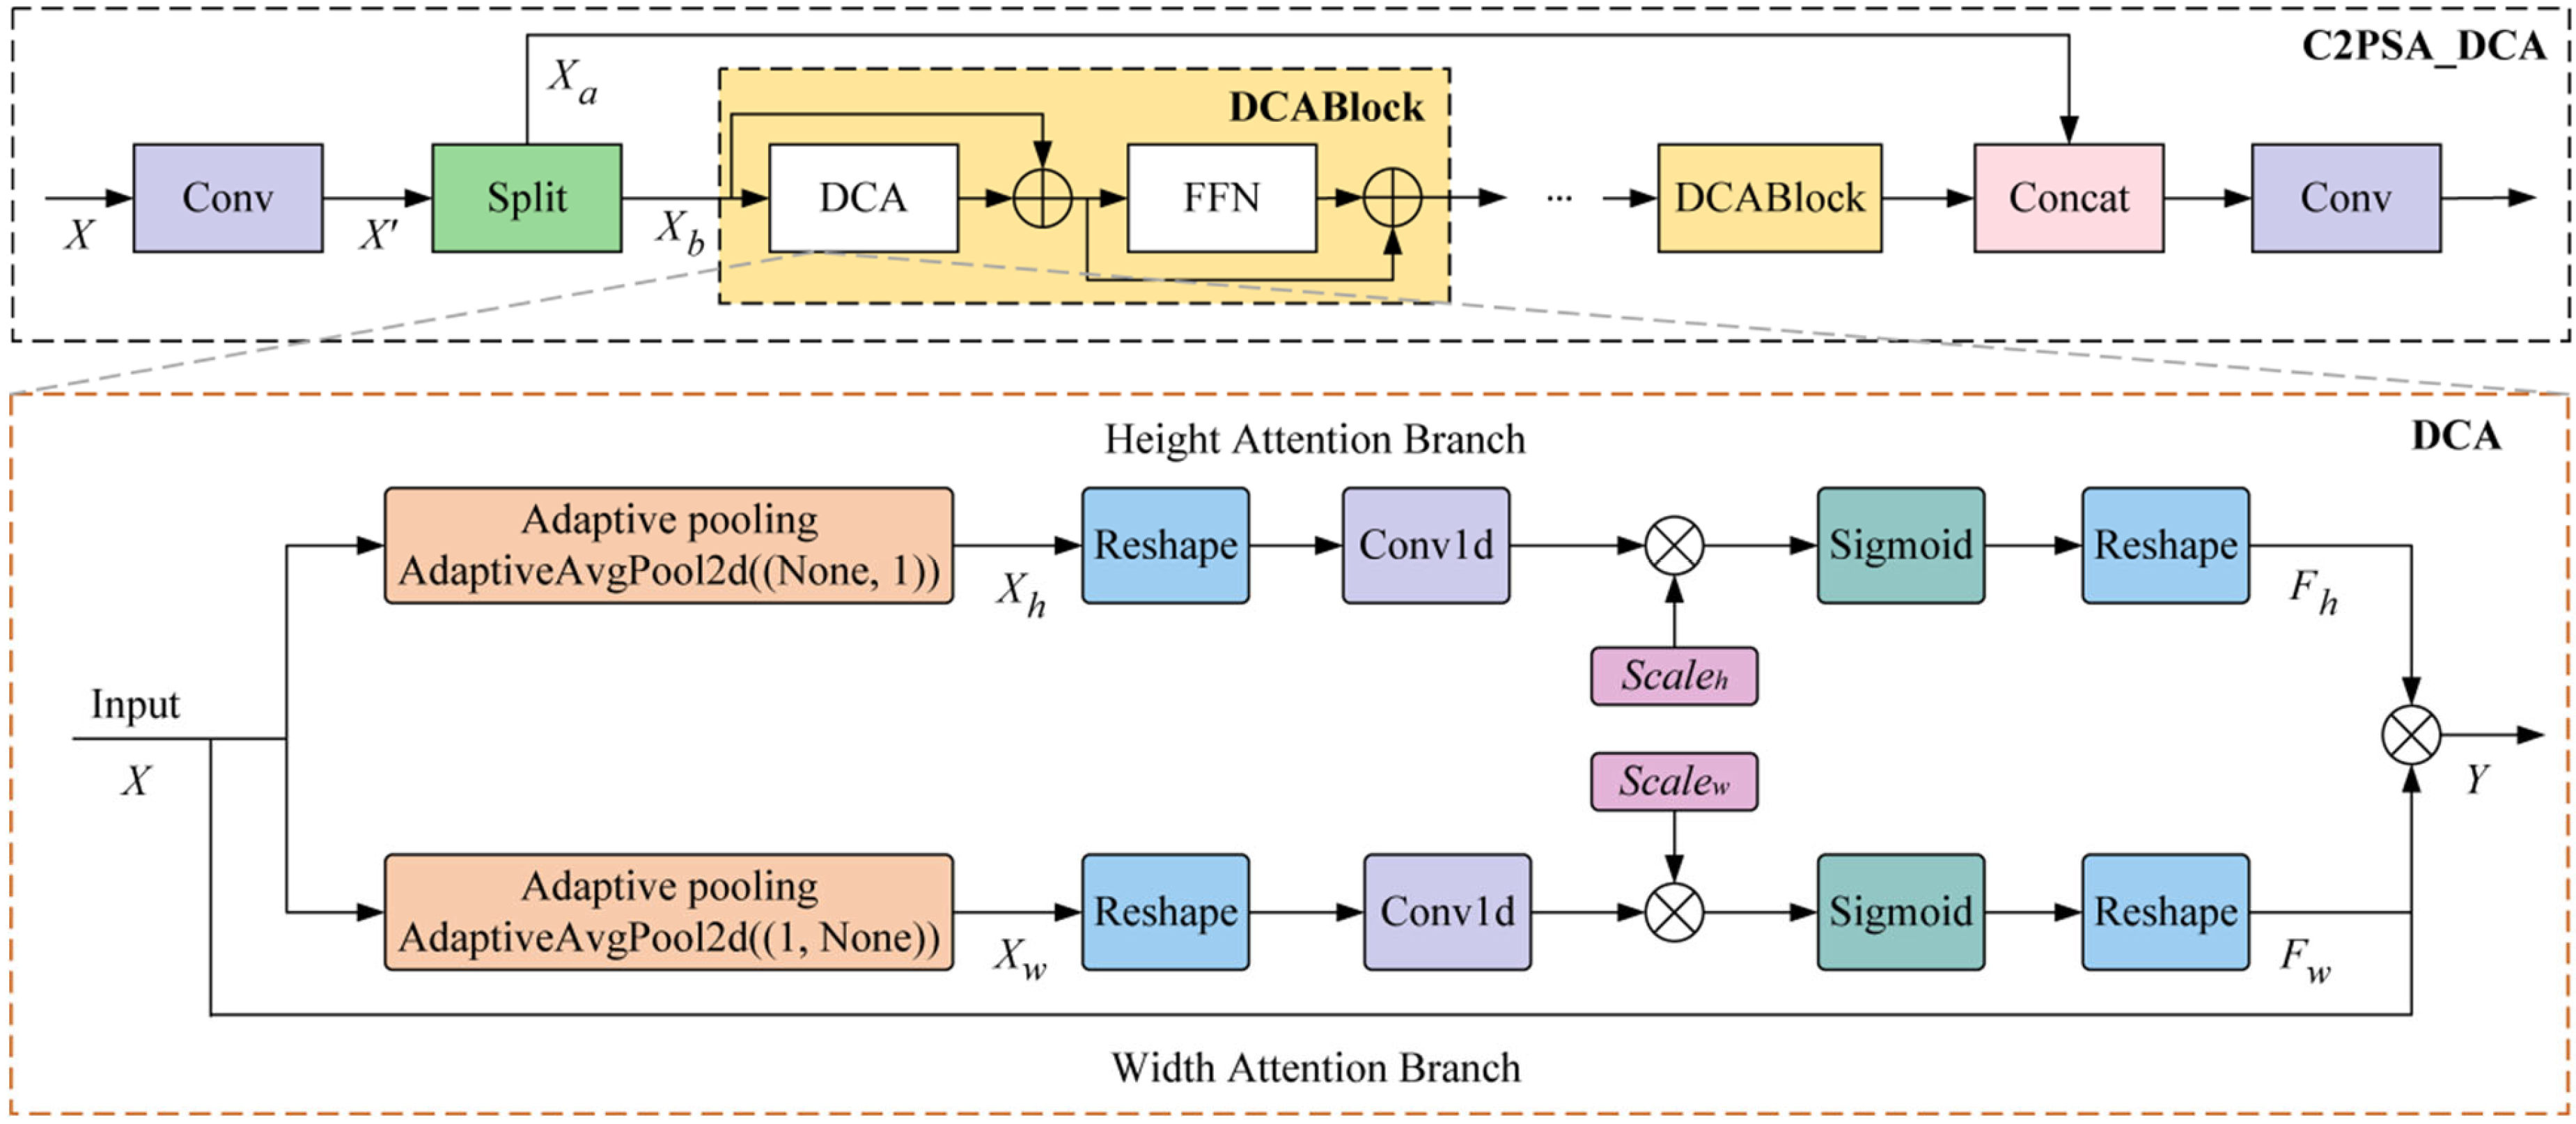
To address this limitation, a Directional Context Attention (DCA) mechanism is proposed in this study and embedded into the C2PSA module to construct an improved C2PSA_DCA module, as shown in
Figure 5. By explicitly modeling attention distributions along the height and width directions, the proposed module enhances the network’s perception of target geometric direction information and local defect features, thereby improving detection performance in complex conveyor chain environments.
The core idea of DCA is to independently model feature responses along the horizontal and vertical directions in the spatial domain to capture the saliency information of targets in different geometric orientations. Specifically, given an input feature map
X∈R
Cin×H×W, adaptive average pooling is first applied along the horizontal and vertical directions to obtain the following:
where
B denotes the batch size. Subsequently, the pooled features are flattened into one-dimensional signals and fed into a 1D convolution:
where
σ denotes the Sigmoid activation function;
αh and
αw are learnable scaling parameters. The resulting attention weights are then broadcast along the spatial dimensions and multiplied element-wise with the input features:
This operation enables adaptive weighting of feature responses along different directions, thereby better highlighting surface texture differences and defect regions of potatoes.
In terms of overall structure, C2PSA_DCA inherits the “branch-and-fusion” design philosophy of the original C2PSA, while incorporating DCA into the attention stage to achieve more targeted feature enhancement. First, for an input feature map
X∈R
Cin×H×W, a 1 × 1 convolution is applied to project the features into a low-dimensional space:
where
c denotes the number of compressed channels. The features are then divided into two branches, by equally splitting
X’ along the channel dimension into two feature maps with a 1:1 proportion:
where
Xa is retained directly as residual information, and
Xb is fed into a feature enhancement module composed of multiple stacked DCABlocks. Each DCABlock internally contains a DCA module and a feed-forward convolutional network, which are used to strengthen directional awareness and high-dimensional semantic representation capability. Finally, the enhanced features are concatenated with the residual features along the channel dimension and passed through a 1 × 1 convolution to restore the feature dimensionality:
By incorporating DCA, the C2PSA_DCA module enhances the modeling capability of geometric directional features of targets in conveyor-based scenarios, enabling the model to more effectively distinguish potatoes from background impurities such as soil clods and stones. Compared with the conventional C2PSA, C2PSA_DCA significantly improves feature representation and discriminative performance while keeping the overall model parameter size relatively controllable.
2.4.3. DSA
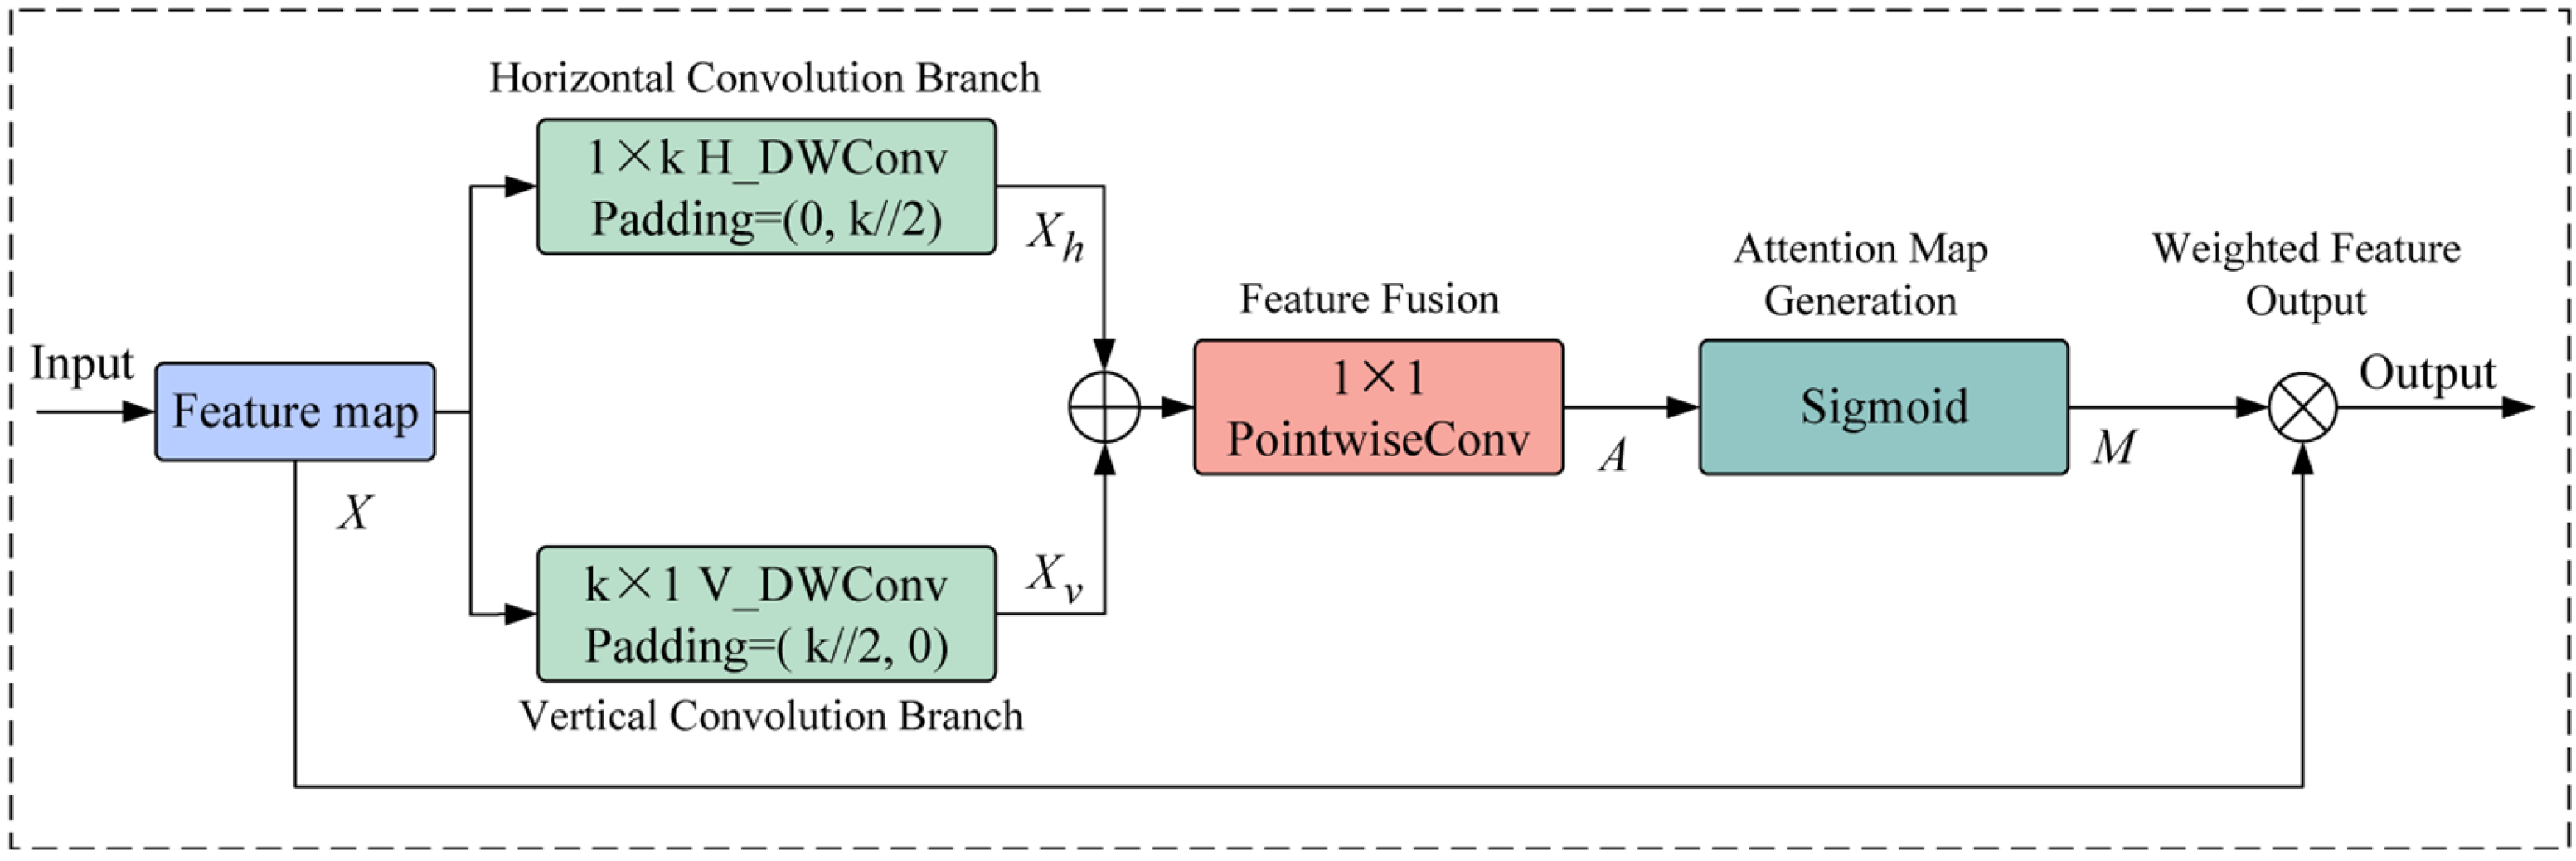
Under harvesting conditions, potatoes are usually densely distributed. During feature extraction, traditional convolutional neural networks tend to lose fine-grained spatial information, especially in the recognition of small-sized or visually similar targets. To address this issue, a novel Directional Selective Attention (DSA) module is designed in this study, as shown in
Figure 6. By introducing a direction-aware convolution modeling strategy, the proposed module selectively enhances surface damage features of potatoes as well as their differences from foreign objects such as soil clods and stones, thereby improving the discriminative power and robustness of feature representations. Unlike existing agricultural detection models that are mainly designed for relatively sparse field targets, the proposed method specifically addresses the dense material flow, severe occlusion, and high appearance similarity encountered in potato combine harvesting. In addition, the lightweight design ensures suitability for real-time embedded deployment, providing a practical advantage over heavier alternative frameworks.
The DSA module achieves direction-selective feature modeling through lightweight horizontal and vertical convolutions. Specifically, depthwise separable convolutions are applied to the input feature map
X∈R
C×H×W along the horizontal and vertical directions, respectively, yielding the following:
where
Conv1×k denotes a depthwise convolution operation with a kernel size of 1 ×
k, and
Convk×1 denotes a depthwise convolution operation with a kernel size of k × 1. Both operations adopt group convolution to ensure a computational complexity of
O(
C·
k·
H·
W), thereby achieving high efficiency in terms of parameters and computation.
Subsequently, directional information is fused through a pointwise convolution, resulting in the following:
To obtain the attention weight distribution, a Sigmoid activation function is applied to the fused feature
A:
Finally, the attention map M is multiplied element-wise with the input feature map to generate the refined output features.
Through the above operations, the DSA module is designed to alleviate mutual interference between high-density potatoes and foreign objects by means of direction-aware convolution. In particular, it is expected to enhance discriminative capability in detection tasks involving small targets and boundary regions.
2.4.4. EIoU
In field harvesting scenarios, numerous targets are present, with severe overlap and occlusion. Under such conditions, traditional bounding box regression loss functions often struggle to ensure detection stability. The original Complete Intersection over Union (CIoU) still exhibits limitations when dealing with high-density small-target scenarios, as its optimization objective focuses more on overall geometric constraints rather than improving convergence speed. As a result, the training process tends to converge slowly during the precise bounding box regression stage.
To address the above issues, EIoU is introduced to optimize the loss function. In EIoU loss, the optimization process explicitly incorporates spatial alignment, positional deviation, and scale consistency between the predicted bounding box and the corresponding ground truth. The calculation of the EIoU loss is expressed as follows:
In the formulation, LIoU, Ldis, and Lasp correspond to the IoU-based loss, center distance loss, and aspect ratio loss, respectively. The variables wc and hc indicate the width and height of the minimum enclosing rectangle that covers both the predicted and ground-truth bounding boxes. The symbols ha and hb refer to the heights of the predicted box and the ground-truth box, respectively. Moreover, ρ(a, b) measures the Euclidean distance between the centers of the two boxes, while ρ2(wa, wb) and ρ2(ha, hb) quantify the squared differences in width and height between them.
In practical high-density detection tasks during harvesting operations, the EIoU loss function better addresses the shortcomings of CIoU by directly constraining the positional relationship between the center points of the predicted and ground-truth boxes. This accelerates convergence during the early stages of model training, enabling predicted bounding boxes to approach the true targets more rapidly.
Based on the innovative designs of the various improved modules and their corresponding initial letters, the improved YOLOv11 model proposed in this study is named MCDE-YOLOv11.
2.5. Detection Model Training and Testing
All models in this study were trained using the Windows 11 operating system. The hardware configuration consisted of an Intel(R) i5-14600KF CPU, an NVIDIA GeForce RTX 4060 GPU with 8 GB of video memory, and 32 GB of system memory. The software environment included CUDA version 11.7, Python version 3.9.21, and the PyTorch deep learning framework (PyTorch version 2.0.1). The training parameter settings are listed in
Table 1.
To evaluate the target recognition performance of the model, multiple metrics were adopted for comprehensive assessment to fully reflect detection effectiveness. Precision (P) measures the proportion of correctly identified targets among all detected targets, reflecting detection accuracy. Recall (R) measures the proportion of actual targets that are correctly detected, indicating detection completeness. mAP50 (mean Average Precision at an IoU threshold of 0.5) comprehensively evaluates model performance across different categories, with particular emphasis on detection accuracy, where 0.5 represents the Intersection over Union (IoU) threshold. mAP50–95 calculates mAP values at ten IoU thresholds ranging from 0.5 to 0.95 with a step size of 0.05, and the final result is obtained by averaging these ten mAP values.
FLOPs (floating-point operations per second) are used to measure the computational complexity and representational capability of the model, while Params (number of parameters) reflect the model’s real-time detection capability and resource consumption.
where True Positive (TP) denotes the number of samples that are actually positive and correctly predicted as positive by the model. False Positive (FP) denotes the number of samples that are actually negative but incorrectly predicted as positive. False Negative (FN) denotes the number of samples that are actually positive but incorrectly predicted as negative. True Negative (TN) denotes the number of samples that are actually negative and correctly predicted as negative; and m represents the total number of categories.
3. Results
3.1. Attention Mechanism Comparison Experiments
To evaluate the comprehensive performance of the proposed DSA module in object detection tasks, comparative experiments were conducted under a unified experimental environment using YOLOv11 as the baseline detection framework. Several representative attention mechanisms, including CBAM [
24], LCA [
25], KSFA [
26], and HPA [
27], were introduced for comparison. The detection performance and computational complexity of different models are summarized in
Table 2. All models were trained and evaluated under identical training settings and dataset splits to ensure a fair comparison.
Models incorporating CBAM and LCA had slight improvements in R and mAP50 compared with the baseline model (
Table 2). However, the overall gains were limited, accompanied by an increase in Params. KSFA enhanced feature representation capability to some extent but introduces significantly higher computational overhead, with both FLOPs and model size noticeably exceeding those of other comparison methods.
Our YOLOv11 + DSA model increased performance on P and R by 0.3 and 2.7 over theYOLOV11 baseline (
Table 2). The mAP50 and mAP50–95 were improved to 95.6% and 81.9%, achieving the best performance among all compared methods. Meanwhile, the YOLOv11 + DSA model maintained relatively low computational complexity, with FLOPs of only 6.5 G and Params of 2.67 M, indicating that no significant computational or storage burden was introduced compared with higher-complexity attention mechanisms.
3.2. Function Comparison Experiments
We evaluated the impact of different bounding box regression loss functions on detection performance (
Table 3). YOLOv11 served as the baseline model and was compared with several commonly used loU-based loss functions, including SDloU [
28], SloU [
29], WloU [
30], and MPDloU [
31].
As indicated in
Table 3, different loss functions exhibit clear differences in detection accuracy and recall. Compared with the baseline model, SDIoU and SIoU slightly improve Precision. However, their Recall and mAP values do not show significant advantages. In particular, mAP50–95 decreases to varying degrees, indicating insufficient bounding box regression accuracy under higher IoU thresholds. WIoU and MPDIoU improve R to some extent, but the overall improvement in detection accuracy remains limited. Notably, although MPDIoU achieves a slightly higher R than the baseline model, its P decreases significantly, suggesting that this loss function may introduce more false detections in complex scenarios, which is unfavorable for accurate discrimination between damaged potatoes and impurities.
In contrast, the introduction of the EIoU loss function leads to more balanced and stable improvements across multiple evaluation metrics. YOLOv11 + EIoU achieves P, R, mAP50, and mAP50–95 values of 94.9%, 92.0%, 94.9%, and 80.9%, respectively. Comprehensive analysis demonstrates that by jointly constraining the center distance, width–height differences, and overlap area between predicted and ground-truth bounding boxes, the EIoU loss function more effectively enhances bounding box regression accuracy and detection stability in complex potato harvesting scenarios characterized by background clutter and large variations in target scale.
3.3. Ablation Experiments
To verify the actual contribution of each improved module to model performance, the original YOLOv11 was used as the baseline model. MSD-Conv, C2PSA_DCA, DSA, and EIoU were gradually introduced, and multiple ablation schemes were constructed through different module combinations. The experimental results are shown in
Table 4.
From the single-module ablation results, it can be observed that all proposed improvement strategies enhance detection performance to varying degrees. After introducing MSD-Conv, the mAP50–95 increases from 79.7% to 82.3%, while FLOPs are reduced from 6.3 G to 5.3 G, indicating that this module effectively enhances feature representation while reducing computational overhead. The incorporation of the C2PSA_DCA module improves both P and R, demonstrating its effectiveness in strengthening feature modeling of key regions. After introducing the DSA attention module, R increases to 92.6%, indicating a reduction in missed detections under complex scenarios. With the adoption of the EIoU loss function, both R and mAP50–95 show stable improvements, validating its effectiveness in optimizing bounding box regression accuracy.
In multi-module combination experiments, strong synergistic effects among different improvement strategies are observed. When both C2PSA_DCA and DSA are introduced, mAP50 increases to 96.6%, and detection accuracy in high-IoU ranges is further enhanced. When MSD-Conv, C2PSA_DCA, and DSA are jointly incorporated, significant improvements are achieved across Precision, Recall, and mAP metrics, with mAP50–95 reaching 85.6% while maintaining relatively low FLOPs.
With the full integration of MSD-Conv, C2PSA_DCA, DSA, and the EIoU loss function, the model achieves optimal overall performance. These results demonstrate that the proposed modules collaboratively enhance detection accuracy and robustness while preserving the lightweight nature of the model, providing effective support for online detection of broken potatoes and impurities in potato combine harvesters.
3.4. Comparative Analysis with Different Detection Algorithms
To comprehensively verify the performance advantages of the proposed algorithm in online detection of broken potatoes and impurities during potato combine harvesting, comparative experiments were conducted with multiple mainstream object detection models under the same testing environment and evaluation metrics. The results are presented in
Table 5.
As shown in
Table 5, significant differences exist among detection models in terms of detection accuracy and computational complexity. Lightweight CNN-based models such as YOLOv3-tiny and YOLOv5n exhibit certain advantages in inference efficiency. However, their performance on the mAP50–95 metric is relatively limited, making them insufficient for high-precision detection in complex field environments. With iterative network design, YOLOv8n to YOLOv12n show gradual performance improvements, but they remain constrained by the trade-off between feature representation capability and model size. In contrast, the Transformer-based RT-DETR improves global modeling ability to some extent, but its FLOPs and Params increase significantly, resulting in high deployment costs on edge devices. This makes it unsuitable for applications such as potato combine harvesters, which require real-time performance under limited computational resources.
The proposed method achieves a more favorable balance between detection accuracy and model complexity. These results demonstrate stronger recognition capability and robustness for broken potato and impurity targets. Meanwhile, the model maintains low computational and storage requirements, with FLOPs of only 5.5 G and Params of 2.15 M, highlighting its strong lightweight characteristics.
3.5. Visualization Analysis
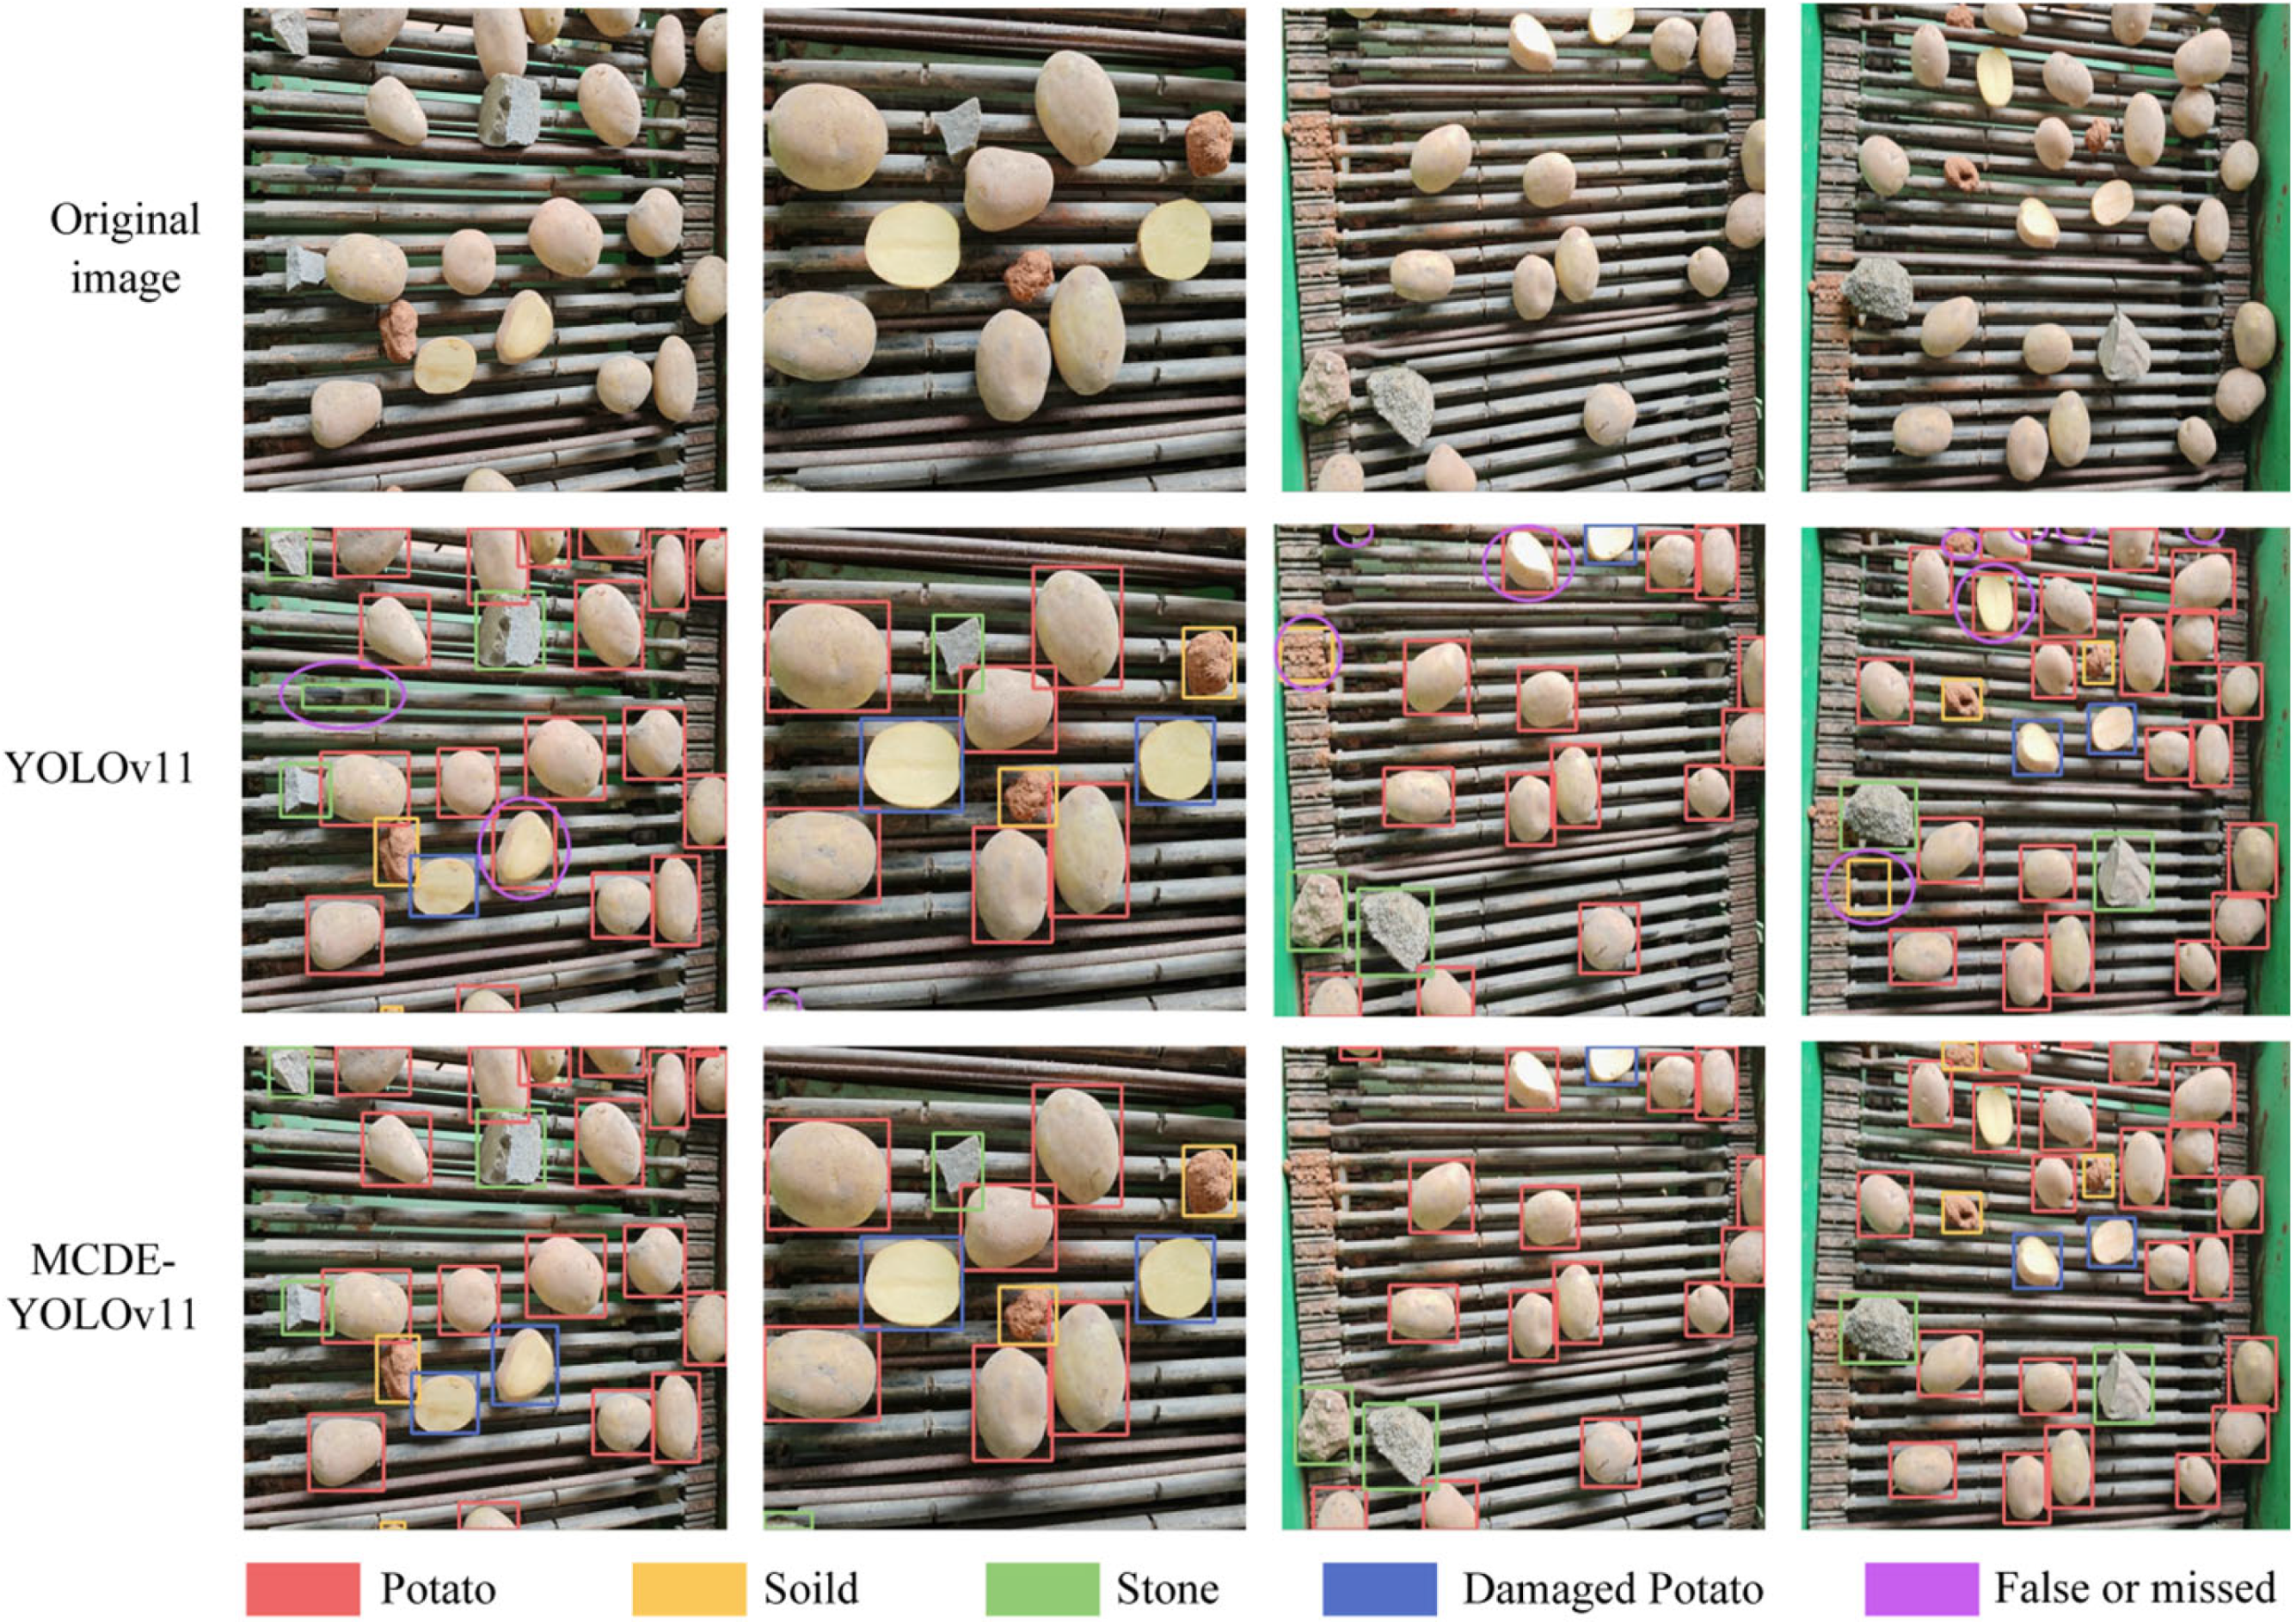
To intuitively evaluate the detection performance of the improved model under complex operating environments, multiple representative sample images containing different numbers of targets, scales, and spatial distributions were selected from the test set. Visual comparisons were conducted against the detection results of the YOLOv11n model, as shown in
Figure 7. The visualization results indicate that in scenes with a large number of targets and uneven distributions, YOLOv11n suffers from varying degrees of missed detections and false detections, whereas the improved model is able to more completely detect broken potatoes and impurity targets, with more stable bounding box localization. When target categories exhibit high similarity in color and texture, the improved model still accurately distinguishes different targets, effectively reducing the missed detection rate.
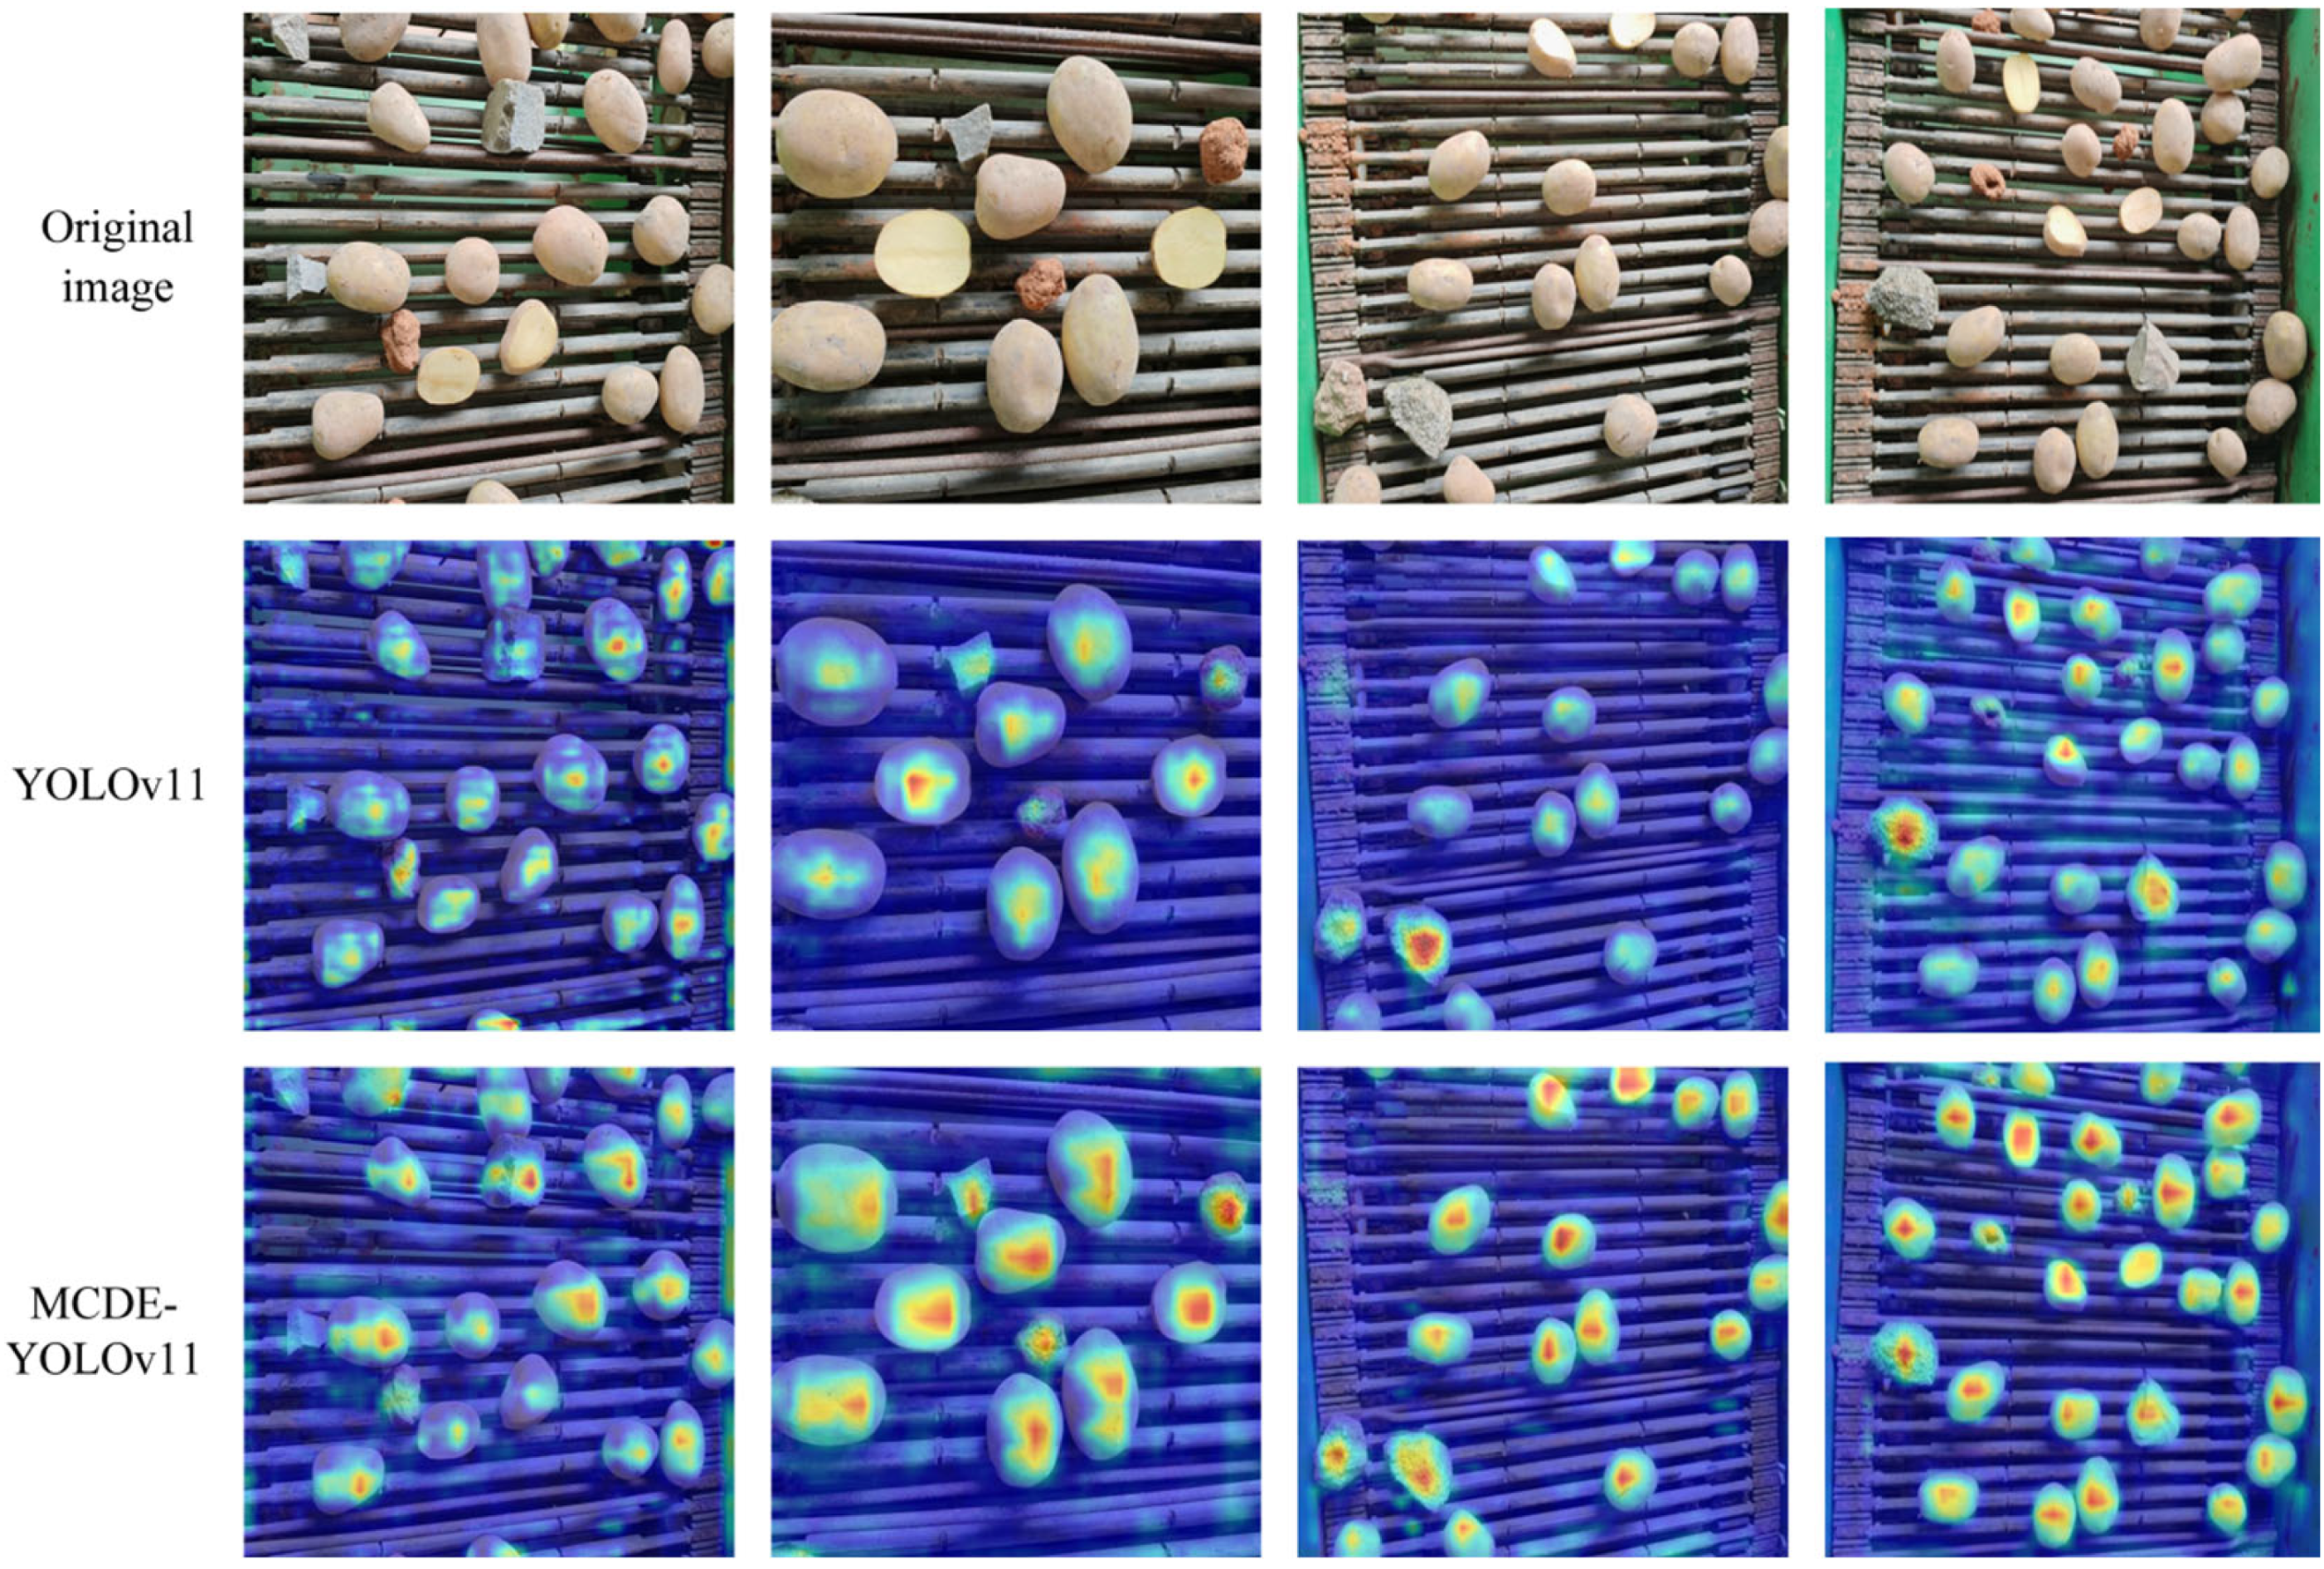
To further analyze the model’s attention regions and decision basis, the Grad-CAM method was introduced to provide interpretability analysis of the detection process. Heatmaps of several potato samples are shown in
Figure 8, where warm-colored regions indicate key feature areas that contribute more significantly to the detection results. As observed from the heatmaps, the improved model focuses more intensively on target regions and their boundary features, while exhibiting weaker responses to background areas. This indicates that irrelevant background interference is effectively suppressed during feature extraction, thereby enhancing detection accuracy and stability.
3.6. Field Experiments
To verify the applicability and stability of the proposed online monitoring system under actual operating conditions, field experiments were conducted in Dingxi City, Gansu Province, China. The potato variety used in the experiments was Holland No. 15. The experiments were performed under stable weather conditions with natural daylight and dry field surfaces. No precipitation occurred during the testing period, ensuring consistent operating and environmental conditions throughout the trials. At the inlet of the circular lifting device, lighting conditions were primarily influenced by natural daylight, with partial shading caused by the harvester structure. No additional artificial lighting was installed. During both dataset acquisition and field speed experiments, moderate dust was generated due to soil separation and material conveying; however, the camera installation position and vertical mounting configuration effectively reduced direct dust interference on the imaging area. The overall dust level did not cause significant visual obstruction or degradation of image quality.
The harvester used in this study was a 4U-1000 crawler self-propelled potato combine harvester developed by the Intelligent Agricultural Machinery Team of Hainan University. The machine is capable of harvesting one ridge with two rows in a single pass, integrating digging, conveying, separation, and collection functions.
Considering that the typical forward speed of potato combine harvesting operations ranges from 2.8 to 4 km/h, three operating speeds of 3 km/h, 3.5 km/h, and 4 km/h were selected to systematically evaluate the influence of different operating conditions on detection performance. For each operating speed, the experiment was repeated five times, and the average value was used for performance evaluation. The deployed system was implemented on an NVIDIA Jetson Orin Nano Super 4GB embedded platform. The input resolution was set to 640 × 640, and inference was performed using FP16 precision to improve computational efficiency. During field experiments, the average inference speed reached 76 fps, demonstrating real-time performance suitable for online monitoring applications.
During the experiments, the monitoring system performed online detection of the broken and impurity rates at intervals of 5 s, and the average value of the detection results was taken as the monitoring output under each operating condition. The combine harvester was operated continuously for 30 m, after which it was stopped and the harvested materials were removed from the collection box. Manual classification and weighing of the samples were performed to determine the ground-truth broken and impurity rates, which were used as reference values. Each operating speed condition was repeated five times. The field experiment process is shown in
Figure 9.
The summarized results of the field experiments are presented in
Table 6. Detailed data can be found in
Table A1 in
Appendix A. As the operating speed increases, the amount of material entering the detection area per unit time rises significantly, leading to intensified target overlap and occlusion, which in turn affects detection accuracy. At a forward speed of 3 km/h, the relative errors of the broken and impurity rates were 3.78% and 3.67%, respectively, indicating high consistency between the detection results and manual measurements. When the operating speed increased to 3.5 km/h, the relative errors of both indicators showed a slight increase but remained at a relatively low level.
Under high-load operating conditions with a forward speed of 4 km/h, the average relative errors of the broken and impurity rates increased to 8.30% and 8.72%, respectively. Although the detection errors increased under this condition, they remained within an acceptable range for engineering applications.
Overall, the proposed online monitoring system is capable of achieving stable online detection of the potato broken and impurity rates under different operating speeds, demonstrating good adaptability to field conditions and strong potential for engineering application. The system provides effective technical support for real-time evaluation of harvesting quality in potato combine harvesting operations.
4. Discussion
From the perspective of detection performance, the proposed method demonstrates strong recognition capability for broken potatoes and impurity targets under complex operating conditions. In particular, the improved model maintains high detection stability even when targets exhibit similar appearances or when local occlusion is severe. This phenomenon indicates that the constructed MCDE-YOLOv11 network plays a positive role in enhancing feature discriminability, enabling the model to focus more effectively on target regions rather than being influenced by background interference. Compared with conventional YOLO-based detection frameworks commonly applied in agricultural product inspection, the proposed improvement enhances multi-scale feature fusion and contextual representation, which is particularly beneficial in scenarios with dense object distribution and background complexity. This finding is consistent with previous studies reporting that feature enhancement modules can significantly improve detection robustness in agricultural vision tasks.
The influence of operating speed on detection performance also deserves attention. Detection errors for broken and impurity rates increase with the forward speed of the combine harvester under field operating conditions. This is mainly attributed to the increased material throughput, higher target overlap probability, and changes in the effective detection area. When material flow accelerates, target density and occlusion within a single frame become more pronounced, placing higher demands on the real-time perception capability of the model. This observation suggests that further improvements in detection stability under high-speed operating conditions could be achieved in future work by increasing the sampling frequency or integrating multi-frame information fusion strategies.
It should be noted that this study still has certain limitations. For example, the experimental data were mainly collected from a single operating area and involved a limited number of potato varieties. The generalizability of the model under different soil conditions, illumination environments, and varietal differences requires further validation. Due to the large size of the potato combine harvester and the associated transportation and field deployment constraints, data collection across multiple regions was limited in the current stage. Therefore, the conclusions of this study should be interpreted within the scope of the tested environmental conditions. In addition, the current system is primarily used for harvesting quality monitoring and has not yet formed a real-time feedback regulation mechanism integrated with the combine harvester control system. Future research may focus on multi-scenario data expansion and detection-result-driven adaptive parameter control to further enhance the intelligence level of the system.
5. Conclusions
Potato is one of the most important food and industrial crops worldwide, with diverse applications in fresh consumption, food processing, and starch-based industries. Based on the experimental results obtained in this study, the proposed MCDE-YOLOv11-based online detection method demonstrates reliable performance for identifying broken potatoes and impurity targets under typical field harvesting conditions. The integration of MSDConv, C2PSA_DCA, and DSA modules, together with the EIoU loss function, effectively improves feature discrimination in complex scenarios characterized by dense targets and occlusion while maintaining lightweight characteristics suitable for embedded deployment.
Field validation confirms that the system maintains stable detection accuracy across the commonly used harvesting speed range, with performance degradation at higher speeds remaining within an acceptable engineering range. The experimental results indicate that the proposed method achieves consistent agreement with manual measurements, supporting its feasibility for real-time online monitoring in practical harvesting operations.
This study provides a feasible technical solution for online evaluation of harvesting quality in potato combine harvesting operations and demonstrates certain engineering application value for improving the intelligence and refinement level of the harvesting process. The proposed method may also serve as a reference for quality monitoring during the harvesting of other tuber crops.



 ,
,