Article

Spatiotemporal Dynamics and Topographic Controls of Soil Moisture on Dune Slopes in a Semi-Arid Sandy Region


1
School of Hydraulic Engineering, Lanzhou Resources & Environment Voc-Tech University, Lanzhou 730030, China
2
Yellow River Basin Ecotope Integration of Industry and Education Research Institute, Lanzhou Resources & Environment Voc-Tech University, Lanzhou 730030, China
3
School of Water and Environment, Chang’an University, Xi’an 710054, China
4
Key Laboratory of Subsurface Hydrology and Ecological Effect in Arid Region of Ministry of Education, Chang’an University, Xi’an 710054, China
5
Key Laboratory of Eco-Hydrology and Water Security in Arid and Semi-Arid Regions of Ministry of Water Resources, Chang’an University, Xi’an 710054, China
6
Observation and Research Station of Mu Us Sandland Ecosystem in Yulin Shaanxi, National Forestry and Grassland Administration, Yulin 719000, China
*
Author to whom correspondence should be addressed.
Agronomy 2026, 16(7), 692; https://doi.org/10.3390/agronomy16070692
Submission received: 12 February 2026 / Revised: 20 March 2026 / Accepted: 24 March 2026 / Published: 25 March 2026

Abstract

In arid and semi-arid agroecosystems, soil water availability is a critical regulator of coupled carbon–water (C–W) cycling, vegetation dynamics, and ecosystem resilience under environmental change. This research investigated the temporal evolution and spatial patterns of soil moisture across sand dune slopes within the Mu Us Sandy Land. Data were collected via a combination of continuous high-frequency in situ monitoring spanning 20 months and manual sampling campaigns. We analyzed moisture levels at various depths and slope positions (windward vs. leeward) to understand their distribution and reaction to precipitation. Statistical analysis of all rainfall events that triggered measurable soil moisture responses showed that precipitation was the primary determinant of soil moisture fluctuations. Specifically, shallow soil (10 cm) reacts rapidly to rainfall events > 4.6 mm, whereas intermediate layers (20–50 cm) require > 8.6 mm. Conversely, deep soil moisture (>100 cm) remains stable, responding only to substantial storm events (>50 mm). Topography exerts a strong control over spatial variance; notably, slope toes consistently exhibit higher moisture than upper sections, particularly during wet seasons, indicating strong topographic control on moisture redistribution and possibly reflecting lateral subsurface transfer. Additionally, a nonlinear correlation was observed between mean moisture content and its variability, peaking under intermediate moisture conditions. The results provide a mechanistic basis for understanding agroecosystem responses to climate variability and offer valuable insights for adaptive land management, vegetation restoration, and hydrological modeling in water-limited regions.

1. Introduction

Soil moisture plays a fundamental role in regulating hydrological, ecological, and biogeochemical processes, linking water fluxes with ecosystem carbon cycling through its control on infiltration, runoff generation, hydrological connectivity, and plant–water interactions [1,2,3,4,5]. In addition, it is also the key medium of nutrient and carbon cycles [6,7]. In arid and semi-arid areas with fragile ecosystems, soil moisture mainly comes from precipitation. Under such environmental conditions, soil moisture is usually considered as the key factor limiting biological activities, ecosystem functions, ecosystem health, species richness, and biodiversity [8,9]. Therefore, it is very important to deepen the understanding of soil moisture dynamics for clarifying eco-hydrological processes and supporting ecological protection and sustainable development strategies.
On different spatial scales, the main controlling factors of spatial-temporal variability of soil moisture may be significantly different, indicating that it has obvious scale dependence [10]. On the hillside scale, the spatial variability of soil moisture is controlled by both local and non-local factors. Local factors mainly involve soil texture and vegetation, while non-local factors are mainly related to topography and rainfall variability. The relative contribution of these factors to soil water distribution varies with water conditions [11]. Generally speaking, the permeability of coarse soil is higher than that of fine soil, which is beneficial to the vertical and horizontal movement of water in the soil profile. In contrast, topography and vegetation have a significant impact on soil water redistribution, so they play a key role in shaping its temporal and spatial pattern [12]. Surface fluctuation can guide the lateral flow of groundwater, which leads to the accumulation of water in topographic depressions and then affects the water supply of vegetation. During the wet period, both surface water and groundwater tend to move laterally along the topographic slope, forming an organized wet area at the foot of the slope or in low-lying areas. In this case, topography becomes the main factor to control the spatial distribution of soil moisture. Famiglietti et al. [13] pointed out that the spatial change in soil moisture mainly reflects the difference in soil texture, especially the change in hydraulic conductivity and porosity. With the soil drying, the changes in saturated hydraulic conductivity, pressure conditions, and particle size distribution lead to the enhancement of soil moisture heterogeneity. On the contrary, in the drought period, the decrease in soil water content will weaken the lateral pore connectivity between soil particles [14]. Grayson, Western, Chiew and Blöschl [11] reported that under drought conditions, the lateral water movement was greatly inhibited and the lateral flow process became negligible. In this case, soil properties and vegetation characteristics dominate soil water dynamics, and vertical water flux becomes the main transport route. Kim et al. [15] showed that the distribution of surface soil moisture was mainly controlled by the vertical infiltration process, while the spatial variability of deep soil moisture was mainly driven by the horizontal redistribution process. Similarly, Ma et al. [16] pointed out that the lakes in the Badain Jaran Desert were maintained by the lateral water input of high-rise sand dunes during rainfall, which meant that there was substantial lateral groundwater recharge.
The difference in vertical and horizontal water flux enhances the spatial heterogeneity of soil water distribution, thus regulating the water availability of vegetation patches in arid areas [17,18]. In the relatively humid area, the soil reservoir formed by precipitation is much larger than that in the arid area, which reduces the influence of the horizontal movement of soil moisture on the spatial distribution of vegetation productivity and alleviates the plant water stress [19,20]. On the contrary, the influence of horizontal flow on the formation of vegetation patterns in arid and semi-arid areas is more significant than that in humid areas [21,22]. Therefore, it is very important to clarify how topography regulates the spatial distribution of soil water for evaluating the effectiveness of vegetation water in arid ecosystems and finally determining the effectiveness of ecosystem restoration.
In order to study the vertical and horizontal distribution pattern of soil moisture on the hillside and its relationship with the average soil moisture, we collected soil samples at several slopes on the sand dunes in Xiaojihan Town, Mu Us Sandy Land. Soil moisture content was determined by the gravimetric drying method. In addition, we set up an in situ monitoring station in Hongshixia Sandy Botanical Garden in Yulin City and carried out detailed monitoring for 20 months at different positions of representative windward slopes and leeward slopes. The purpose of this study is to (1) characterize the soil moisture characteristics of different slope positions along the topographic gradient; (2) quantify the temporal and spatial responses of soil moisture in different sand dune locations to rainfall events; and (3) evaluate the relationship between spatial variability of soil moisture and average soil moisture on a hillside scale.

2. Materials and Methods

2.1. Study Site

The fieldwork was carried out in Hongshixia Sandy Botanical Garden, Yulin City, Shaanxi, China (38°19′–38°22′ N, 109°37′–109°49′ E). This area is located in the ecotone between the Loess Plateau and the Ordos Plateau, with an annual average temperature of about 6.4 °C and extreme temperatures ranging from −31.4 °C to 36.4 °C. The average annual precipitation is 409 mm, of which more than 60% is concentrated from July to September [23,24], and the potential evaporation can reach 2343 mm. The annual cumulative sunshine time exceeds 2600 h, and the total radiation amount is 608.37 kJ/cm2 [25]. From late November to early March, the depth of soil freezing is 1–1.2 m [26]. Winter winds from the northwest shape the dunes, creating gentle windward slopes and steep leeward faces. The area retains the original geomorphic characteristics of dunes, such as a loose surface soil structure, poor water retention, and deficiency in soil fertility. The Hongshixia Sand Botanical Garden has been growing Pinus sylvestris var. mongolica Litv. plantations for the primary sand control since its inception in 1957. These plantations were cultivated in five stages, namely 1960, 1970, 1978, 1989, and 2004. The large-scale stabilization of vegetation in this area has made most sandy soils semi-fixed or fixed at present.

2.2. Experimental Design

A continuous hillside unit consisting of adjacent windward slopes, inter-dune lowlands, and leeward slopes was selected in Hongshixia Sandy Botanical Garden. According to the field topographic survey, the average slope of the windward slope is 10°, and the average slope of the leeward slope is 30°. The vegetation on the slope is mainly herbaceous plants, and shrubs are sparsely distributed. In order to monitor soil moisture dynamics, six automatic soil moisture monitoring stations were set up at the upper, middle, and toe of windward and leeward slopes, respectively. Six soil moisture probes (TDR315H, Acclima, Inc., Meridian, ID, USA) with depths of 10, 20, 50, 80, 100, and 150 cm are installed horizontally at each monitoring station to collect vertical soil moisture profile data (Figure 1a–c). Readings were logged at 10 min intervals and aggregated into hourly and daily averages using a CR300 datalogger (Campbell Scientific, Logan, UT, USA). In order to minimize the error caused by disturbance, after the sensor is installed, the original soil is carefully backfilled to restore the soil structure before disturbance as much as possible. In addition, field comparison was conducted to evaluate the performance of the probes. Under varying soil water conditions, gravimetric soil water content was determined using the oven-drying method and then converted to volumetric water content based on bulk density. These reference values were compared with the probe-measured volumetric water content for in situ calibration. The two methods showed good agreement, indicating that the probe measurements reliably reflected actual soil water content.
The geographic coordinates and elevations of each monitoring site were recorded using a handheld GPS (Garmin, Olathe, KS, USA) device. Undisturbed soil samples were collected at corresponding depths during probe installation using 100 cm3 cutting rings, with three replicates per location. Laboratory analyses included measurements of saturated hydraulic conductivity, soil water retention curves, and bulk density, conducted using the constant-head method and high-speed centrifugation. Disturbed soil samples were also collected at corresponding depths for particle size analysis. Soil texture was characterized using a laser diffraction particle size analyzer (Mastersizer 3000, Malvern Instruments Ltd., Malvern, UK) (Table 1). The study soil is dominated by coarse sand particles and has a relatively high drainage capacity. The measured saturated hydraulic conductivity was 1198 cm d−1, indicating rapid infiltration and percolation potential in the sandy profile. In addition, a meteorological monitoring station was set up in Hongshixia Sandy Botanical Garden to record the meteorological variables in the study area. The recorded parameters included atmospheric pressure, air temperature, precipitation, wind speed, relative humidity, and solar radiation.
Beyond the in situ monitoring station at the Hongshi Sand Botanical Garden, additional field sampling was carried out on fixed sand dunes distributed near Xiaojihan Town, approximately 16.6 km from the monitoring site. Soil samples were collected using a soil auger at the upper, middle, and foot of both windward and leeward slopes, as well as at the center of the interdune lowland. Two transects were established for sampling (Figure 1d), with 22 sampling sites on each transect, giving a total of 44 sampling sites. Field campaigns were conducted on 29 July 2021, and 11 May 2023. Samples were obtained at depths of 20, 40, 60, 80, 100, 120, and 150 cm, with three replicates per depth. It did not rain three days before sampling. All samples were transported to the laboratory, where soil moisture content was determined using the oven-drying method. Field observation shows that the groundwater level in the lowland between dunes in Xiaojihan Town is about 2 m, and the vegetation between dunes is obviously denser than the slope of dunes. The continuous in situ monitoring dataset was primarily used to analyze temporal dynamics and rainfall-response processes at representative slope positions, whereas the manually sampled profiles with field replicates were used to characterize hillslope-scale spatial variability in a complementary manner.

2.3. Data Preparation and Analytical Approach

2.3.1. Seasonal Soil Moisture Characteristics

In this study, the long-term dynamics of soil water content were analyzed based on the continuous in situ monitoring dataset collected over the 20-month (1 November 2021 to 31 August 2023) observation period, using classical statistical methods including the maximum, minimum, mean, standard deviation (SD), and coefficient of variation (CV). For the in situ monitoring dataset, each topographic position was represented by a single automatic monitoring station. Therefore, these continuous observations were used to characterize temporal dynamics and distributional differences among representative slope positions, rather than for inferential statistical comparison among positions. In this study, April to June is defined as the dry season, and July to October is defined as the wet season.

2.3.2. Rainfall Event Analysis

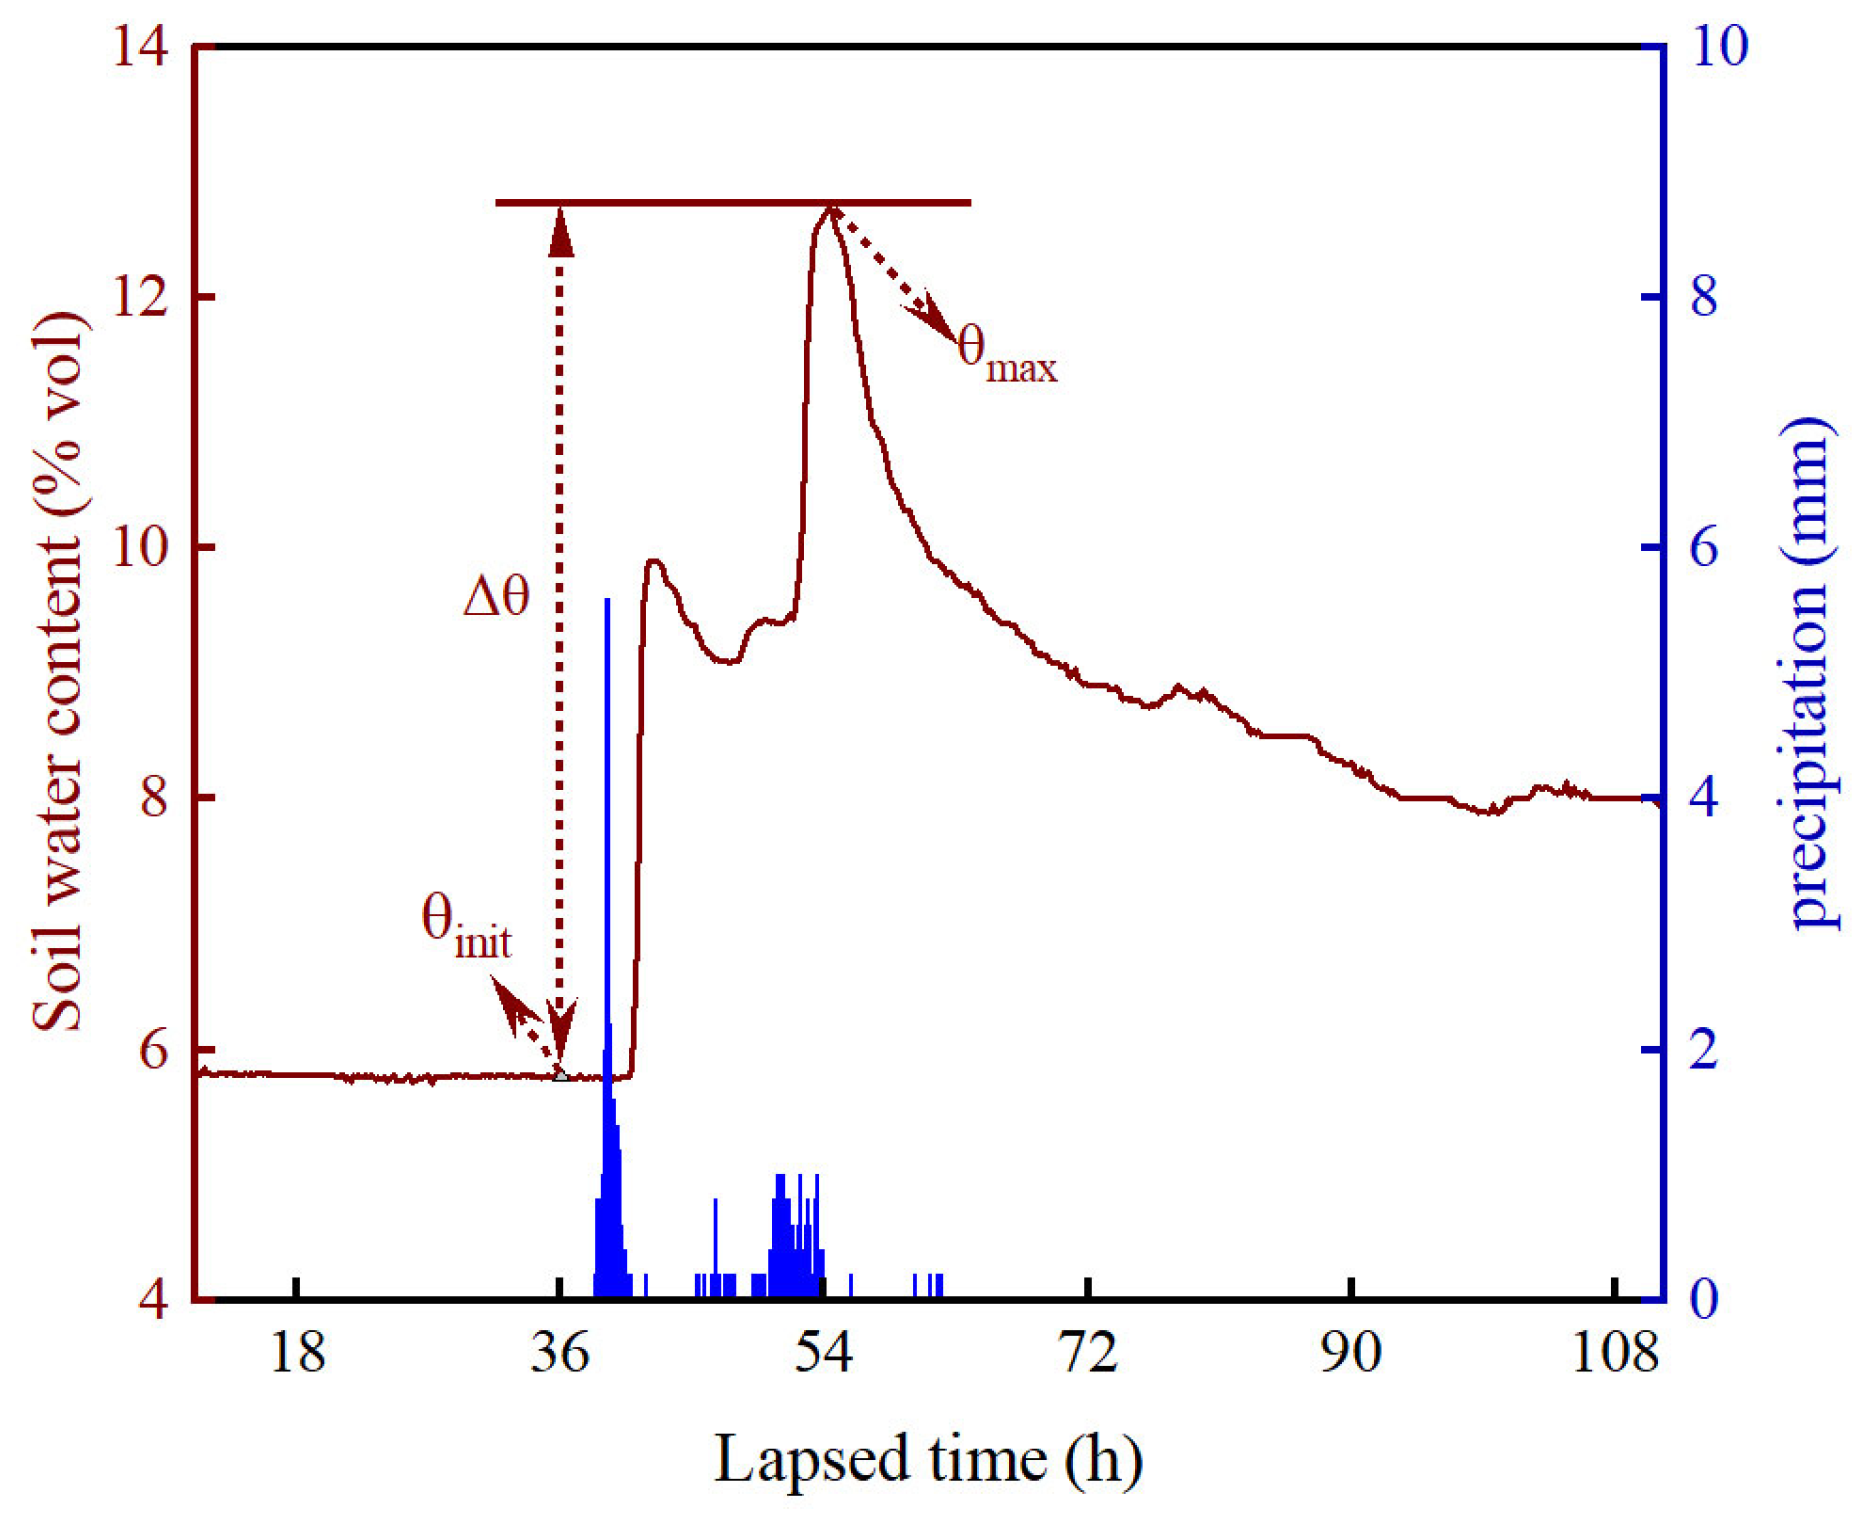
In this study, a rainfall event was defined as a precipitation episode with a total amount greater than 0.2 mm and an inter-event interval shorter than 8 h [27,28]. Soil moisture responses to rainfall inputs were characterized using multiple indicators (Figure 2), including initial soil water content (θinit), response lag time, event rainfall amount, maximum soil water content (θmax), and maximum soil water content increment (Δθ = θmaxθinit) [29]. Based on visual inspection of soil water content time series, the reference time was set to 1 h prior to rainfall onset, and the corresponding soil moisture content was taken as the initial soil water content. To quantify response timing, the response lag time was defined as the interval between rainfall onset and the first occurrence of a significant increase in soil moisture. A minimum soil moisture change threshold of 0.3% vol (0.003 cm3 cm−3) was adopted, and soil moisture response was considered to initiate when volumetric water content increased by at least this threshold relative to θinit. The peak lag time was further defined as the interval between the onset of soil moisture response and the attainment of θmax during a rainfall event. To characterize short-term soil water content dynamics, three representative rainfall events were selected from the continuous monitoring period and analyzed at a 10 min time step (Table 2). For each event, the temporal evolution of soil water content was examined across slope positions and soil depths, and response indices including response lag time, time to peak, maximum soil water content, and maximum soil water content increment were quantified. Analyses focused on the rising stage of the soil moisture curve, as the recession stage may be influenced by subsequent rainfall events. In addition to the three representative rainfall events selected for detailed illustration, all rainfall events that produced measurable soil moisture responses during the monitoring period were statistically analyzed to determine the minimum rainfall amount required to initiate soil moisture responses at different depths and the corresponding antecedent soil moisture conditions. Pearson correlation analysis was further used to evaluate the relationships between changes in soil water content and rainfall characteristics (e.g., rainfall amount and rainfall intensity).

2.3.3. Estimation of Profile-Scale Soil Water Storage

Soil water storage (SWS) for the 0–150 cm soil profile at a given time and slope position was estimated according to the equation below [30]:
S W S = i = 1 n θ i × D i
where SWS denotes profile-scale soil water storage at a given time (mm), θi represents the volumetric soil water content measured at depth i (cm3 cm−3), Dᵢ is the thickness of the corresponding soil layer (mm). Based on the midpoint-layer approach, the thicknesses assigned to the six sensors were 150, 200, 300, 250, 350, and 250 mm, respectively, where n is the number of soil layers.
The change in soil water storage over time was calculated using the following equation:
S W S = S W S k S W S j
where SWSk and SWSj represent the soil water storage (mm) at time k and j, respectively.

3. Results

3.1. Spatiotemporal Variations in Soil Moisture Along the Hillslope

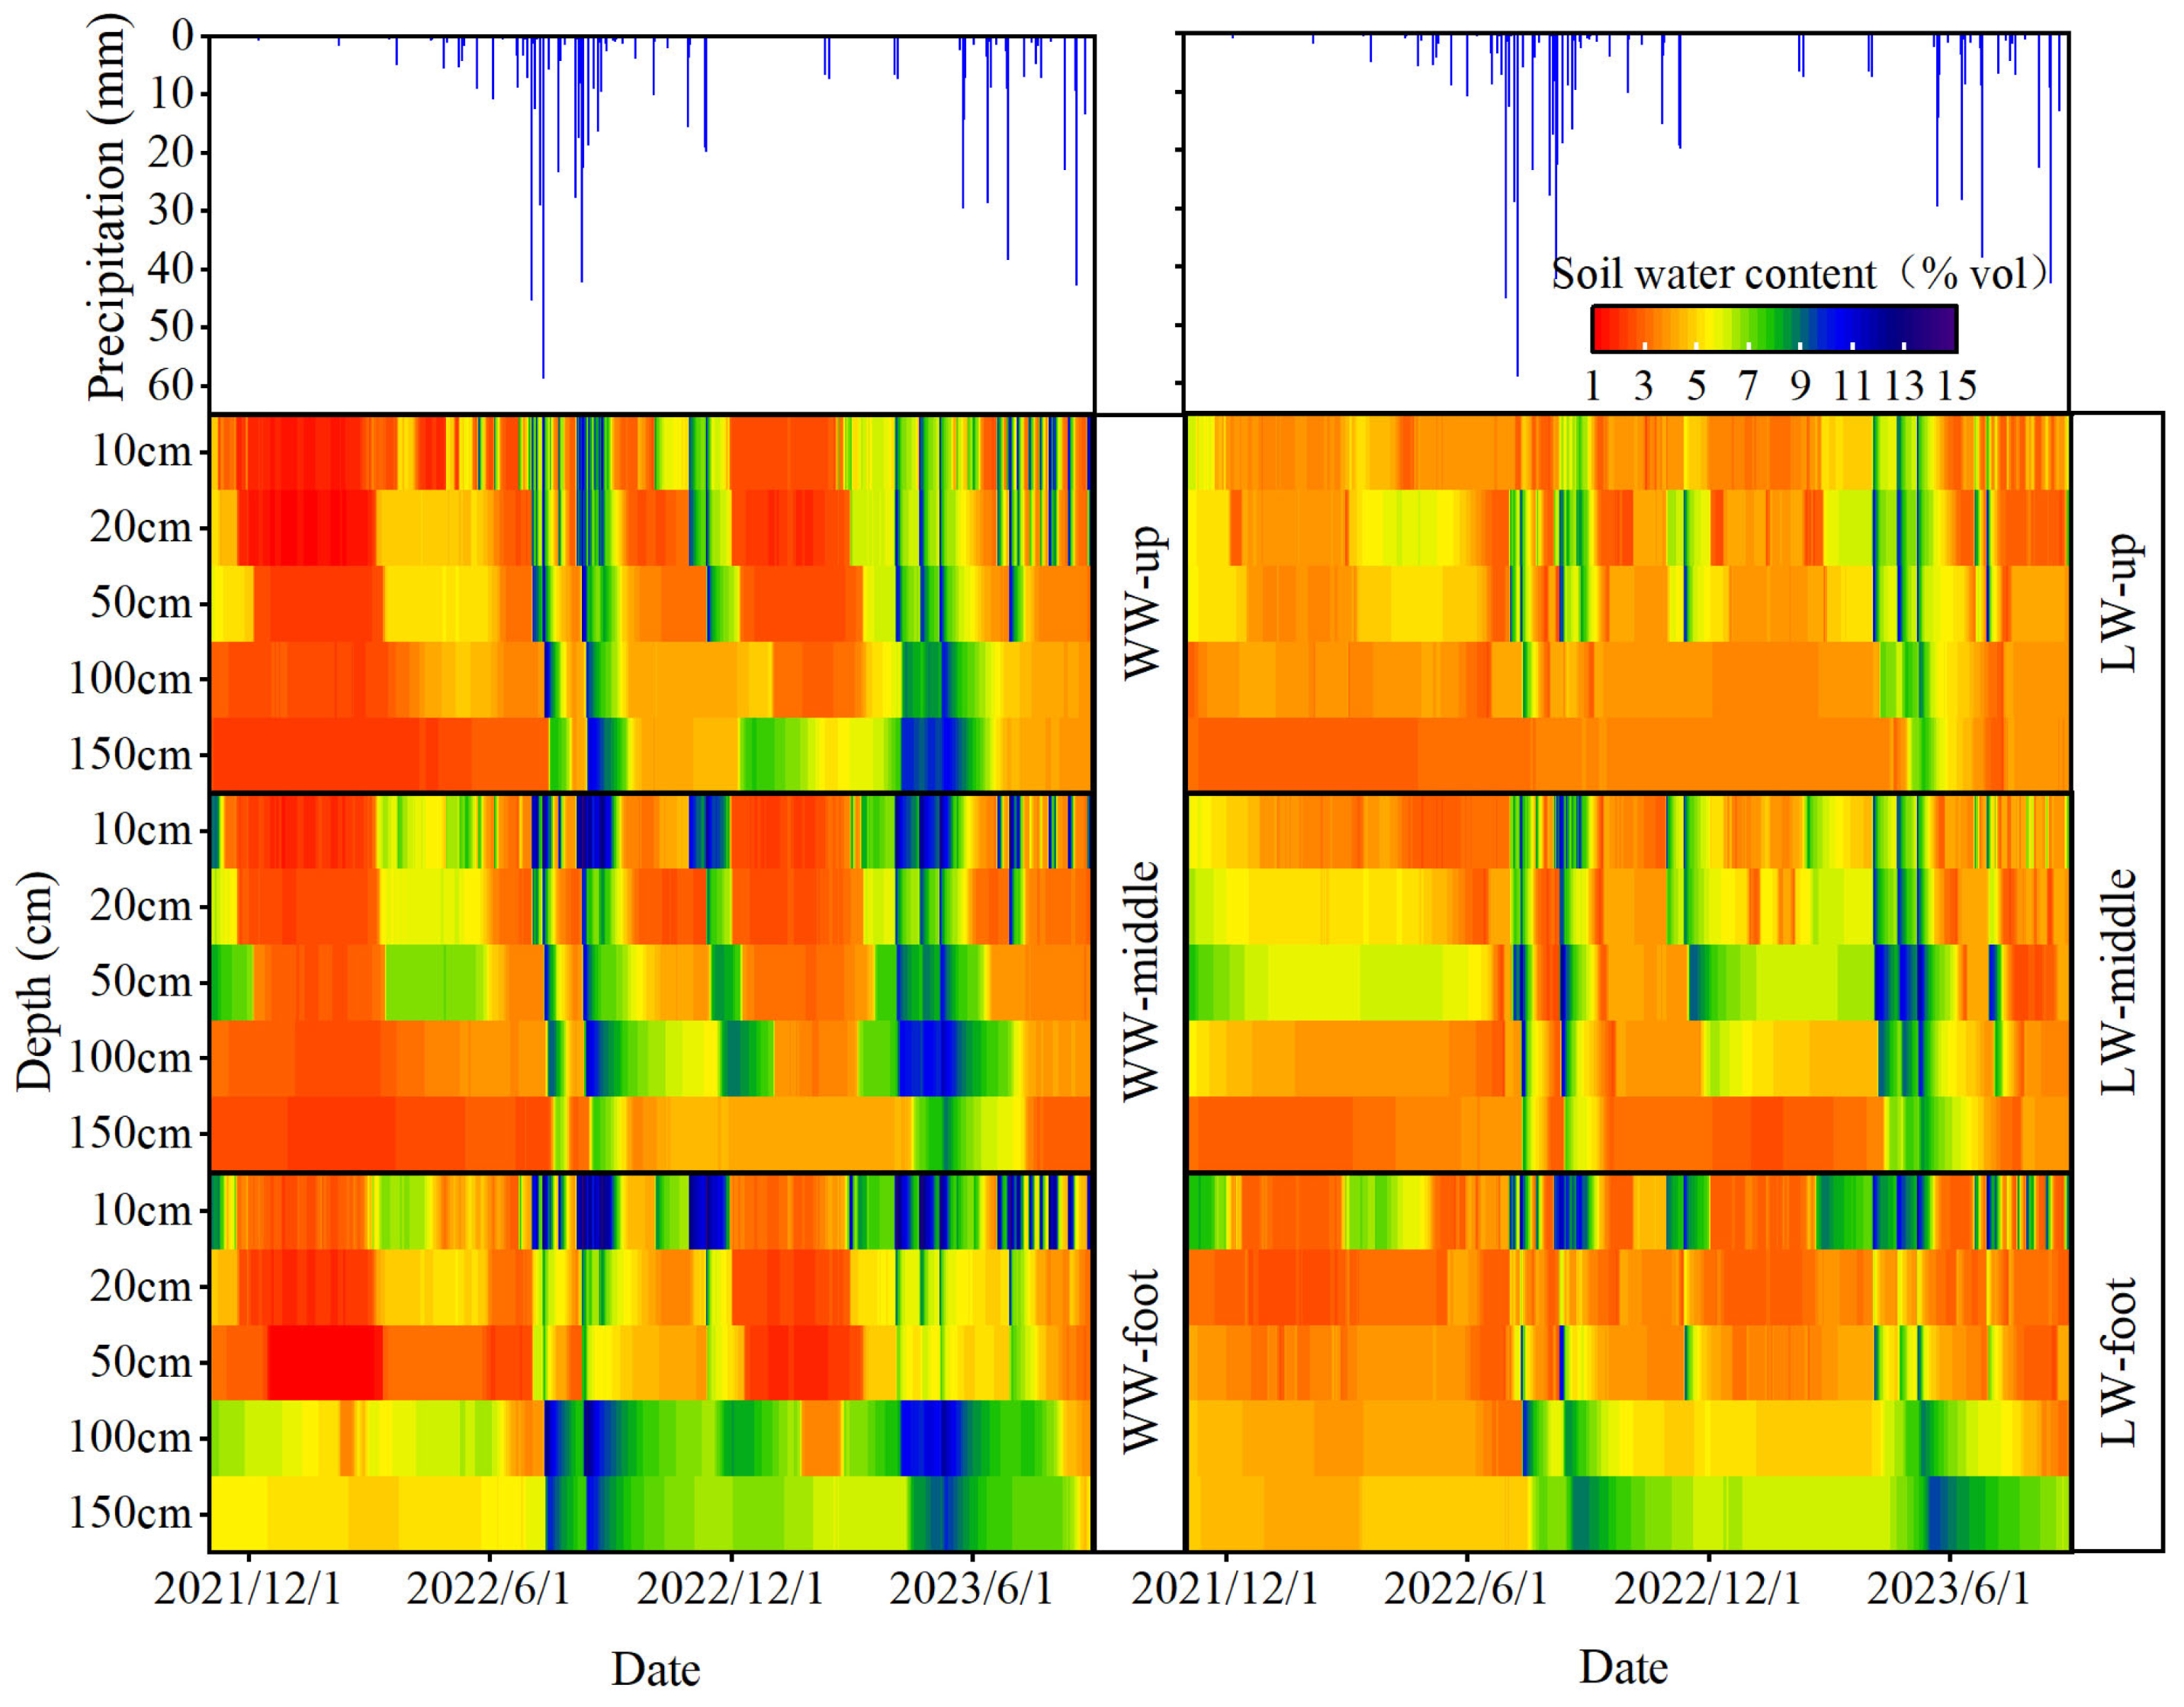
Figure 3 illustrates the daily dynamics of volumetric soil moisture content at different slope positions and soil depths on both the windward and leeward slopes of the in situ monitoring site. On a broader temporal scale, soil moisture dynamics were primarily regulated by seasonal rainfall patterns. Rainfall events typically replenished soil water in the upper 50 cm of the profile, while recharge of deeper soil layers occurred only under heavy or consecutive rainfall events. In this study, the comparable soil properties among the six monitoring locations, together with the relatively uniform spatial distribution of rainfall, resulted in limited spatial differences in soil moisture along the slope. By contrast, temporal fluctuations in soil moisture were pronounced and closely associated with seasonal variability in precipitation. For example, marked soil moisture oscillations were observed from July to September 2022, corresponding to frequent rainfall events (Figure 3). Overall, soil moisture dynamics reflected the combined effects of precipitation inputs and evapotranspiration losses. Shallow soil layers responded rapidly to rainfall and atmospheric demand, leading to frequent alternations between wet and dry conditions. In deeper soil layers, however, rainfall signals were attenuated, resulting in comparatively stable moisture regimes. Over the entire observation period, the mean coefficient of variation (CV) of soil moisture at 10 cm depth reached 44.58%, whereas the CV at 150 cm depth was 32.83%, representing a reduction of 26.36% relative to surface soil moisture (Table 3). Similar patterns have been reported by Zhou et al. [31] and Gao et al. [32], who also demonstrated greater temporal stability of deep soil moisture.
Substantial differences in mean soil moisture content and its variability were observed among the monitoring sites. The highest average soil moisture content was recorded at the foot of the windward slope (5.54% vol), followed by the mid-slope of the leeward slope (4.88% vol), mid-slope of the windward slope (4.87% vol), foot of the leeward slope (4.83% vol), top of the windward slope (4.52% vol), and top of the leeward slope (4.30% vol) (Table 3). These results indicate that soil moisture patterns varied with slope position and soil depth on both the windward and leeward slopes. In general, the footslope tended to show lower soil water content in the shallow layers but higher soil water content in the deeper layers, although not all differences among slope positions were statistically significant. The range of soil moisture variation also differed by location. On the windward slope, the soil moisture content ranged from 1.02% to 12.84% vol at the upslope, 2.25% to 14.64% vol at the midslope, and 1.04% to 14.39% vol at the foot. On the leeward slope, corresponding ranges were 2.61–11.00% vol (up), 2.60–12.32% vol (midslope), and 2.46–12.28% vol (foot). These differences may be attributed to variations in slope gradient and aspect, which influence hillslope hydrological processes and spatial heterogeneity of evapotranspiration between windward and leeward slopes.
At the toe positions of both the windward and leeward slopes, the soil moisture profile generally exhibited a pattern of an initial decline in the shallow layers followed by an increase in the deeper layers. For example, at the foot of the windward slope, the average soil water content decreased from 5.62% at 10 cm to 3.37% at 20 cm and then increased to 6.01% at 150 cm. As illustrated in Figure 3, the response of the soil moisture with deep soil layers (100 cm and 150 cm) to rainfall is more obvious than that of the shallow soil layers (20 cm and 50 cm), which is reflected in the clearer stripes in the color gradient.
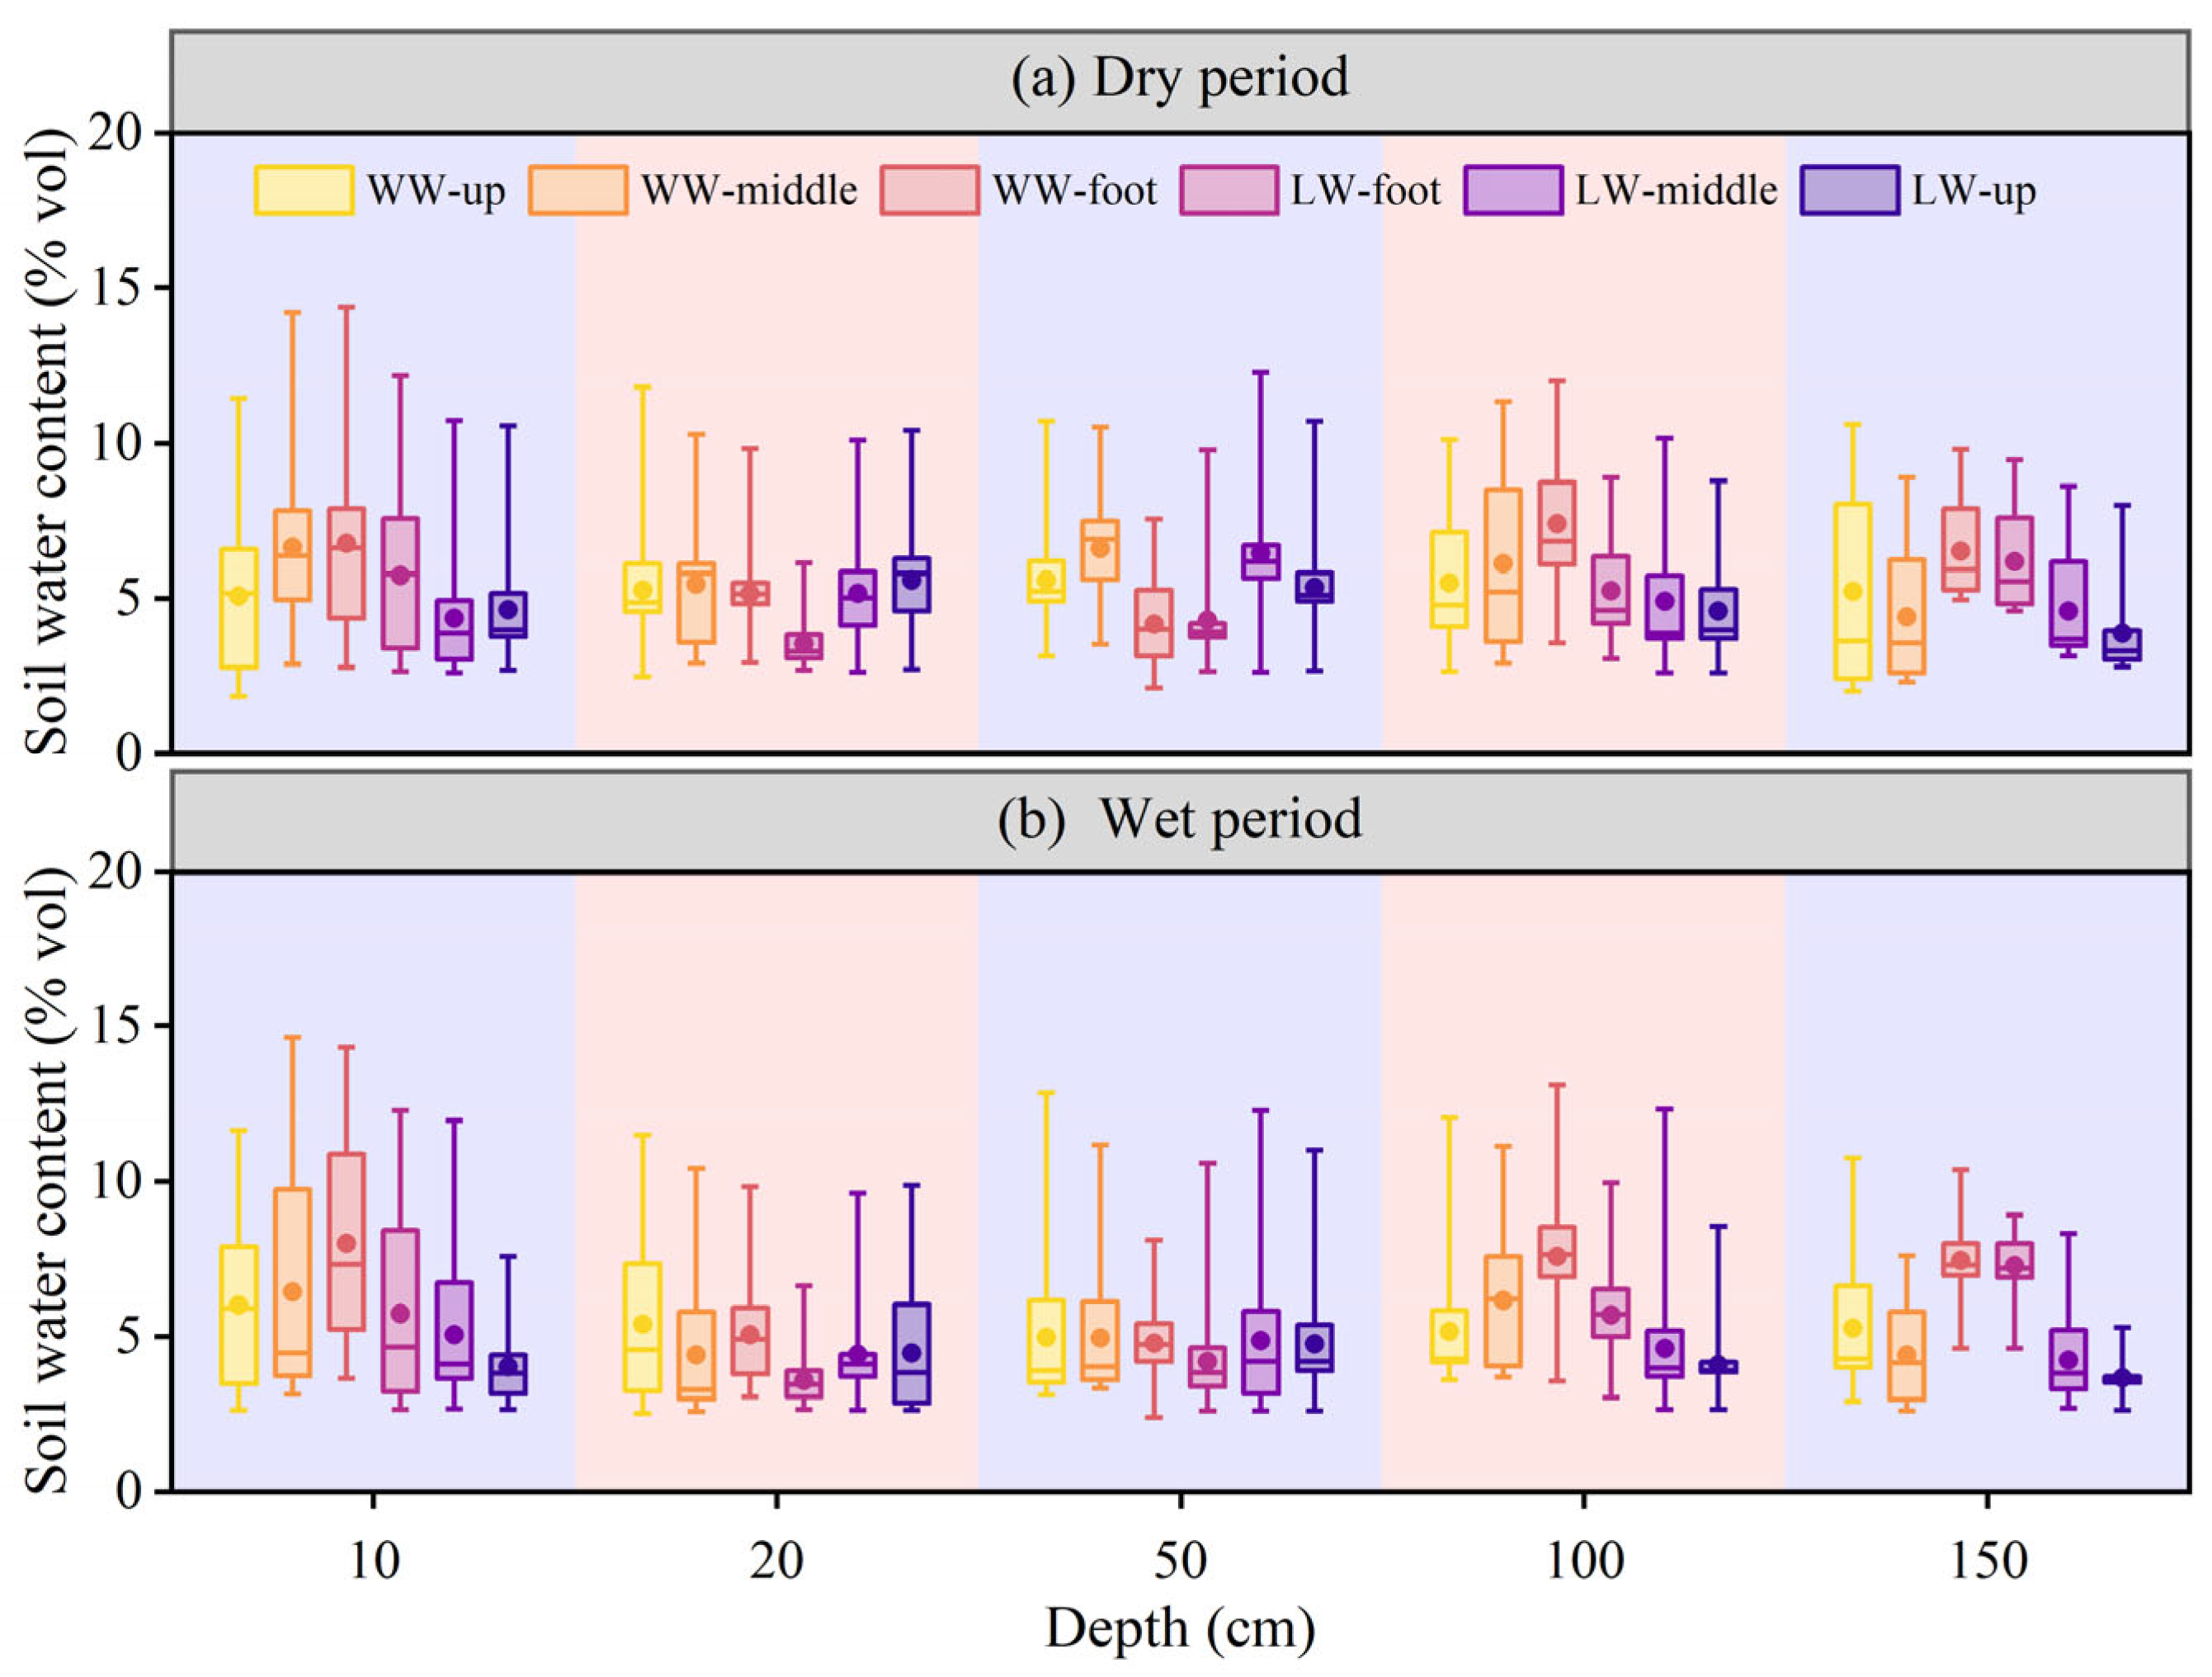
In order to minimize the influence of transient soil moisture conditions, the present study examines soil moisture variability across the dry and wet periods (Figure 4). Figure 4 clearly shows the distinct difference in soil moisture among different topographic positions. Across the dry and wet periods, soil moisture at the footslope is generally lower than that at middle and upper slope positions at depths of 20 and 50 cm. Conversely, at deeper layers (100 and 150 cm), the footslope exhibits higher soil moisture compared with the middle and upper slopes.
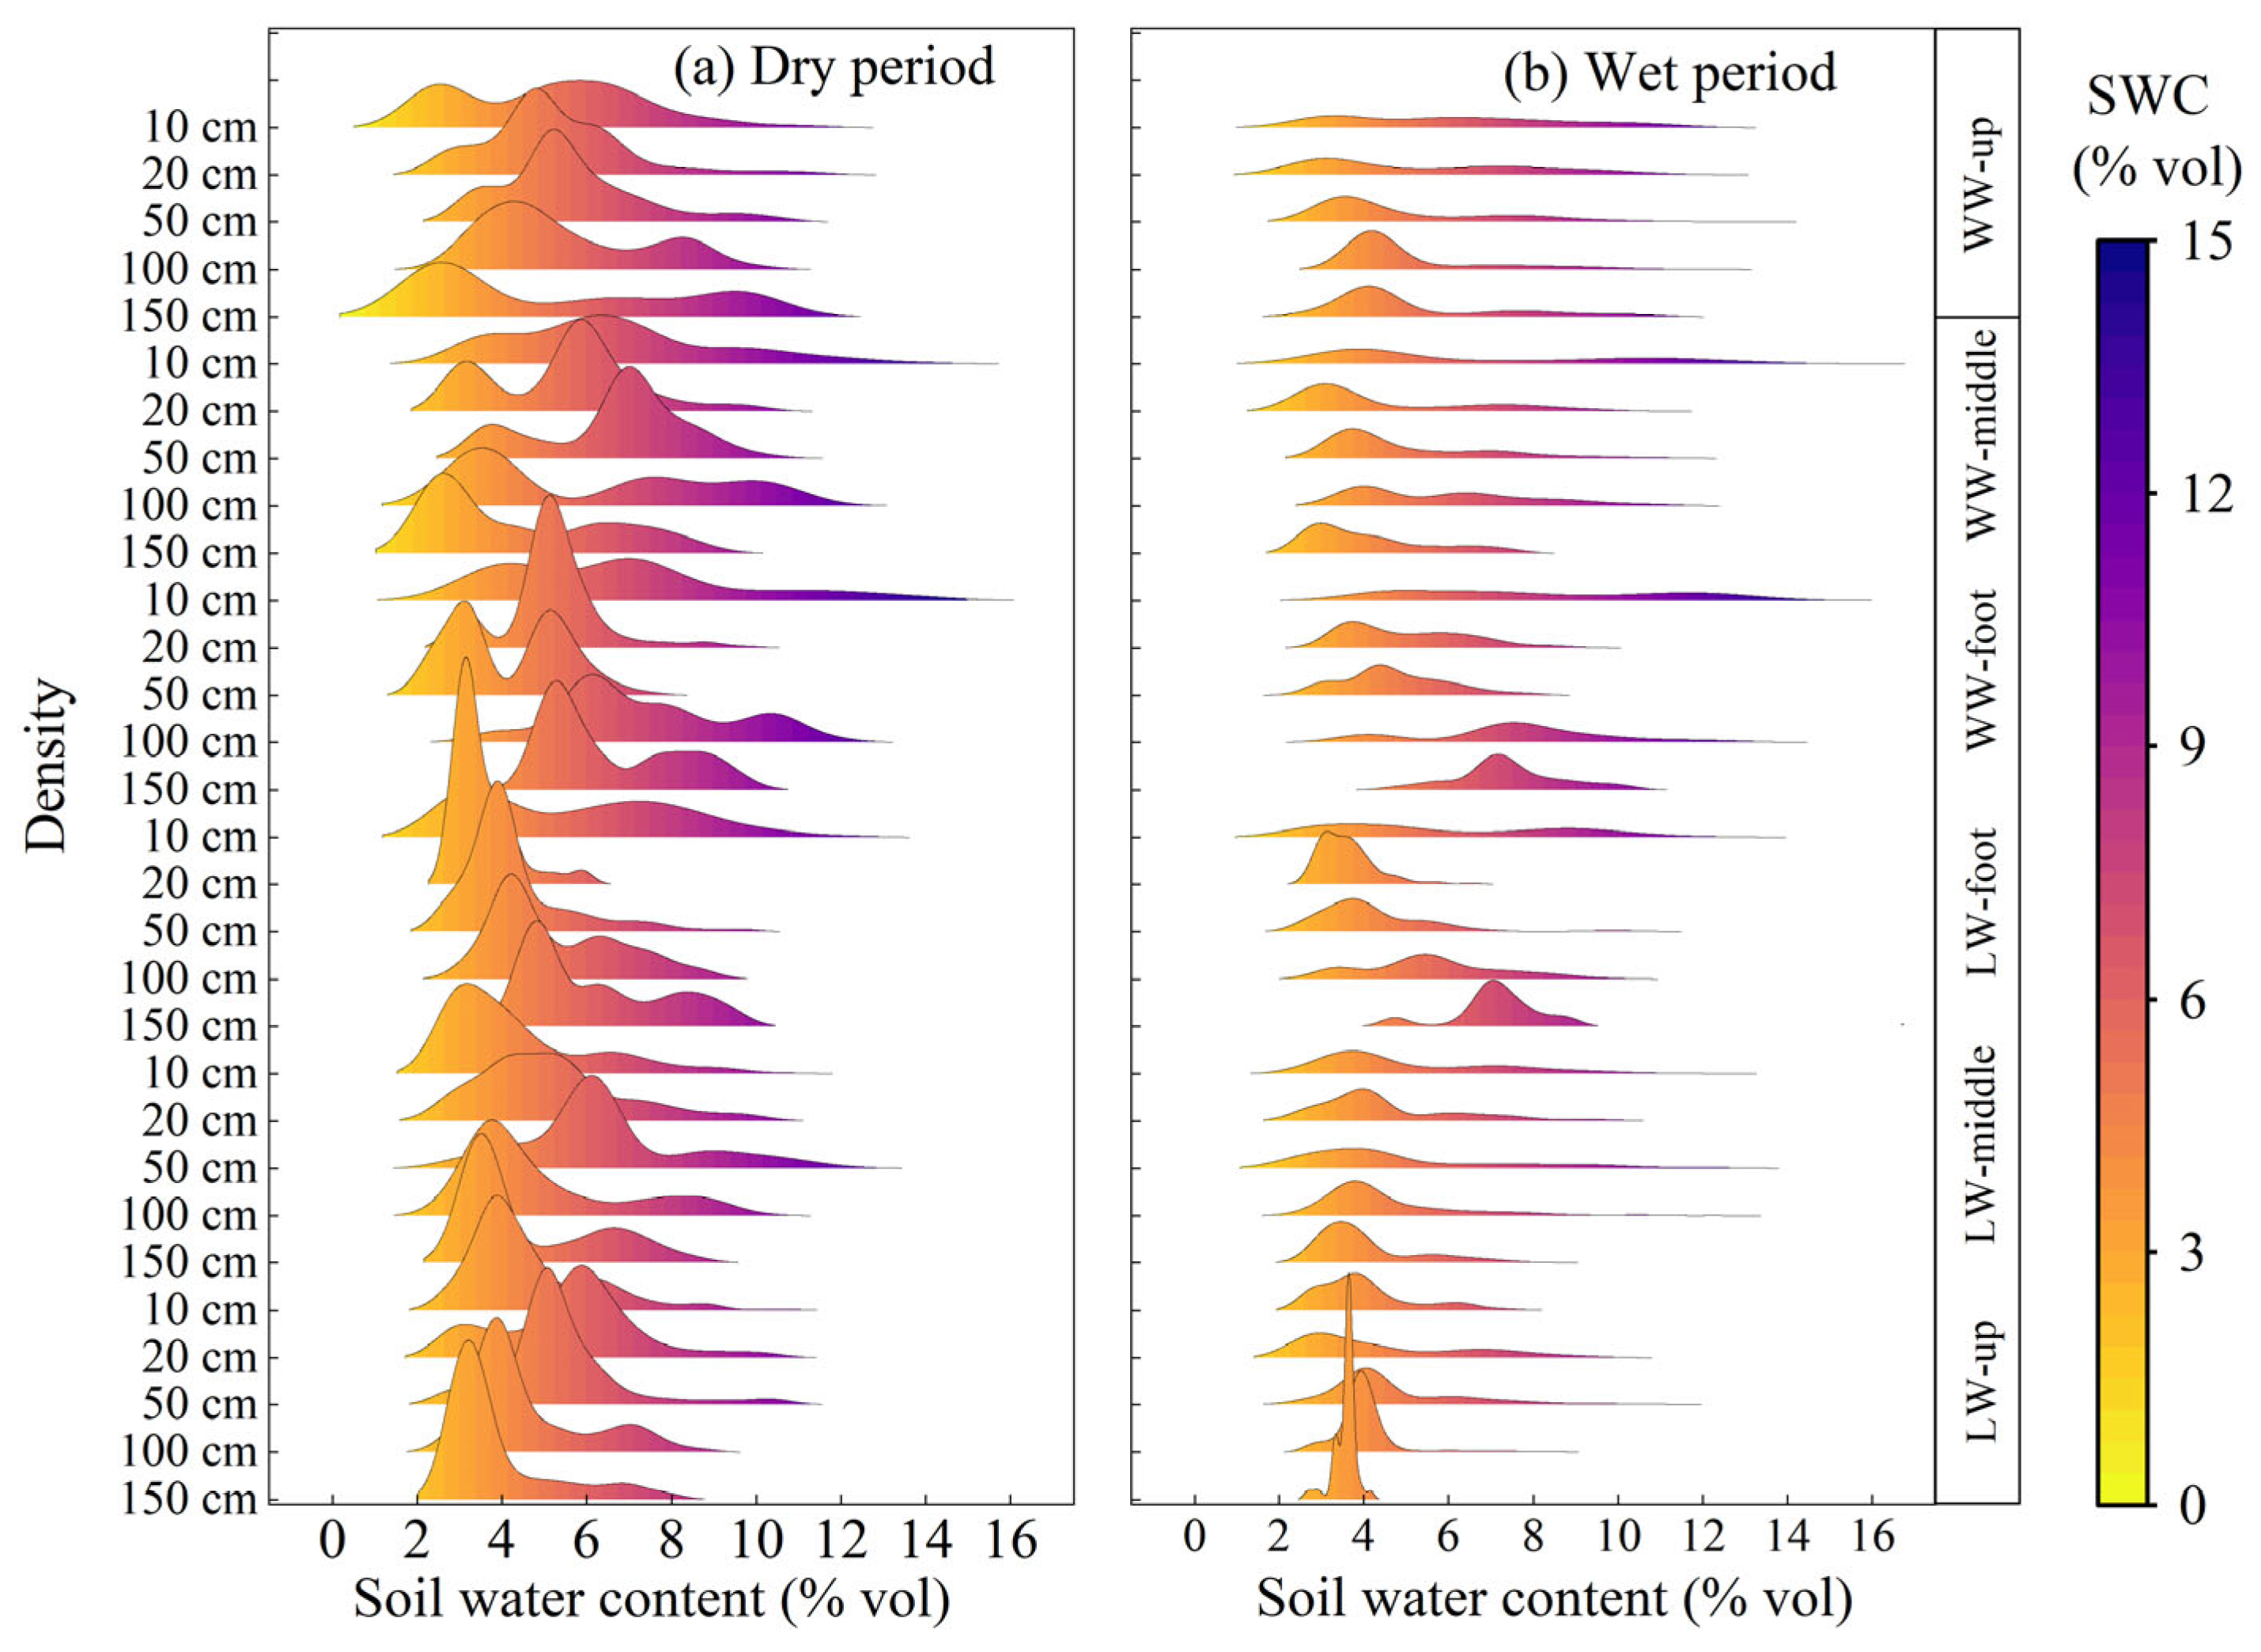
The ridge diagram clearly shows the complexity of soil moisture distribution under different slope positions and soil depths [33] (Figure 5). During the dry period, a remarkable change is that there is a higher peak value of soil moisture in deep soil, and the range of soil moisture changes is wider. In addition, the deep soil moisture distribution in different positions of the windward slope also tends to be bimodal. During the wet period, the overall range of soil water distribution increases, especially on the upper slope, where the peak value of water is low and usually presents a single peak distribution.

3.2. Hillslope-Scale Spatial Variability of Soil Moisture

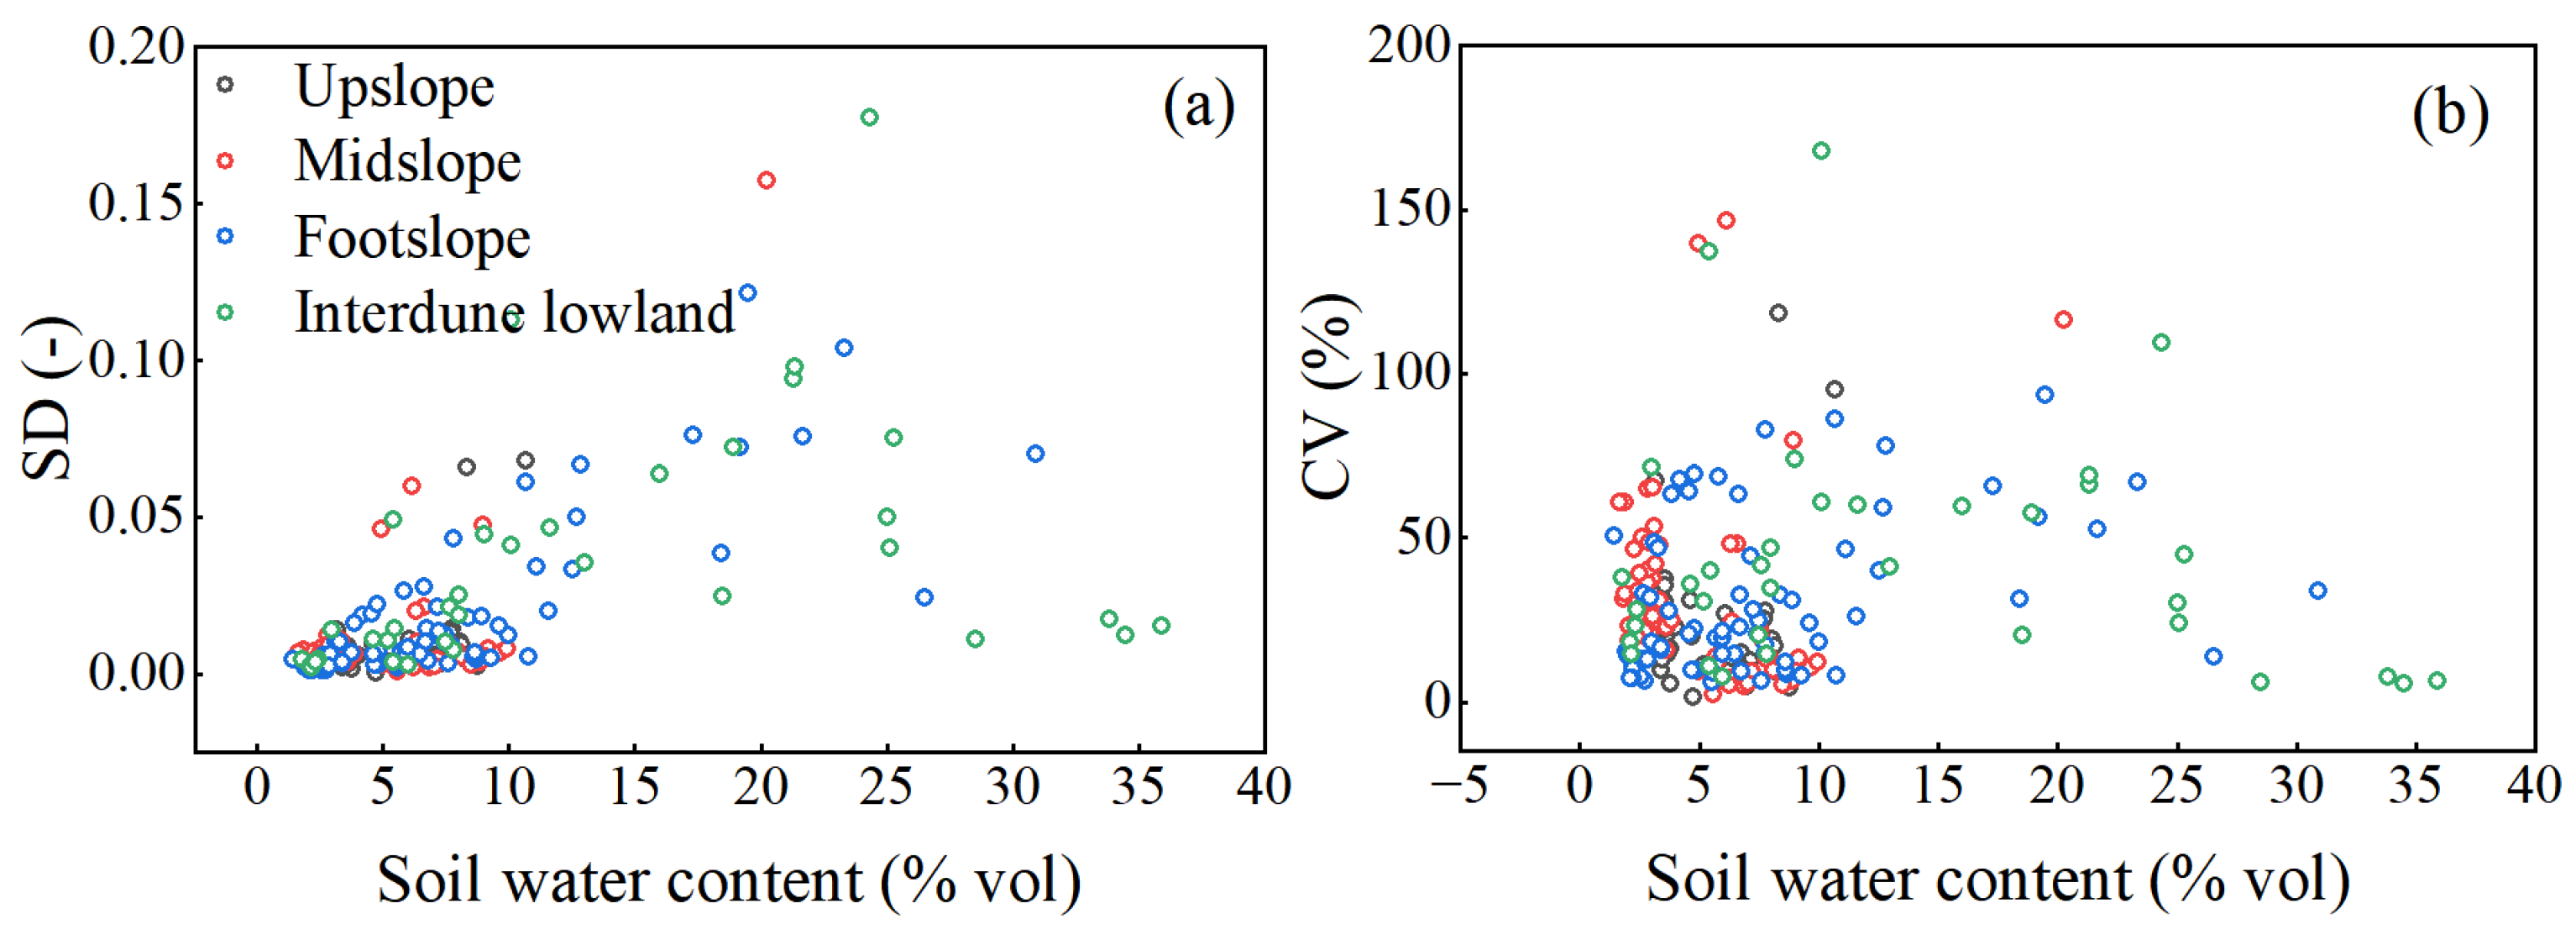
To characterize the spatial variability of soil moisture on dune slopes, the relationship between spatially averaged soil moisture and its variability was analyzed. Statistical analysis was conducted on soil moisture profiles collected manually from different slope positions in the fixed dunes of Xiaojihan Town. The relationships between mean volumetric soil water content, standard deviation, and coefficient of variation are shown in Figure 6. As illustrated in Figure 6, the standard deviation peaked when the mean soil water content was approximately 21% vol, indicating that the greatest variability occurred under intermediate soil moisture conditions. As the soil became either wetter or drier, the standard deviation gradually decreased. This finding is consistent with previous studies [34], which reported that soil moisture variability often peaks at intermediate water contents. A similar pattern was also observed between the average volume water content and the coefficient of variation, and the maximum coefficient of variation appeared when the average volume water content was about 10% vol.

3.3. Soil Moisture Response Characteristics Under Rainfall Events

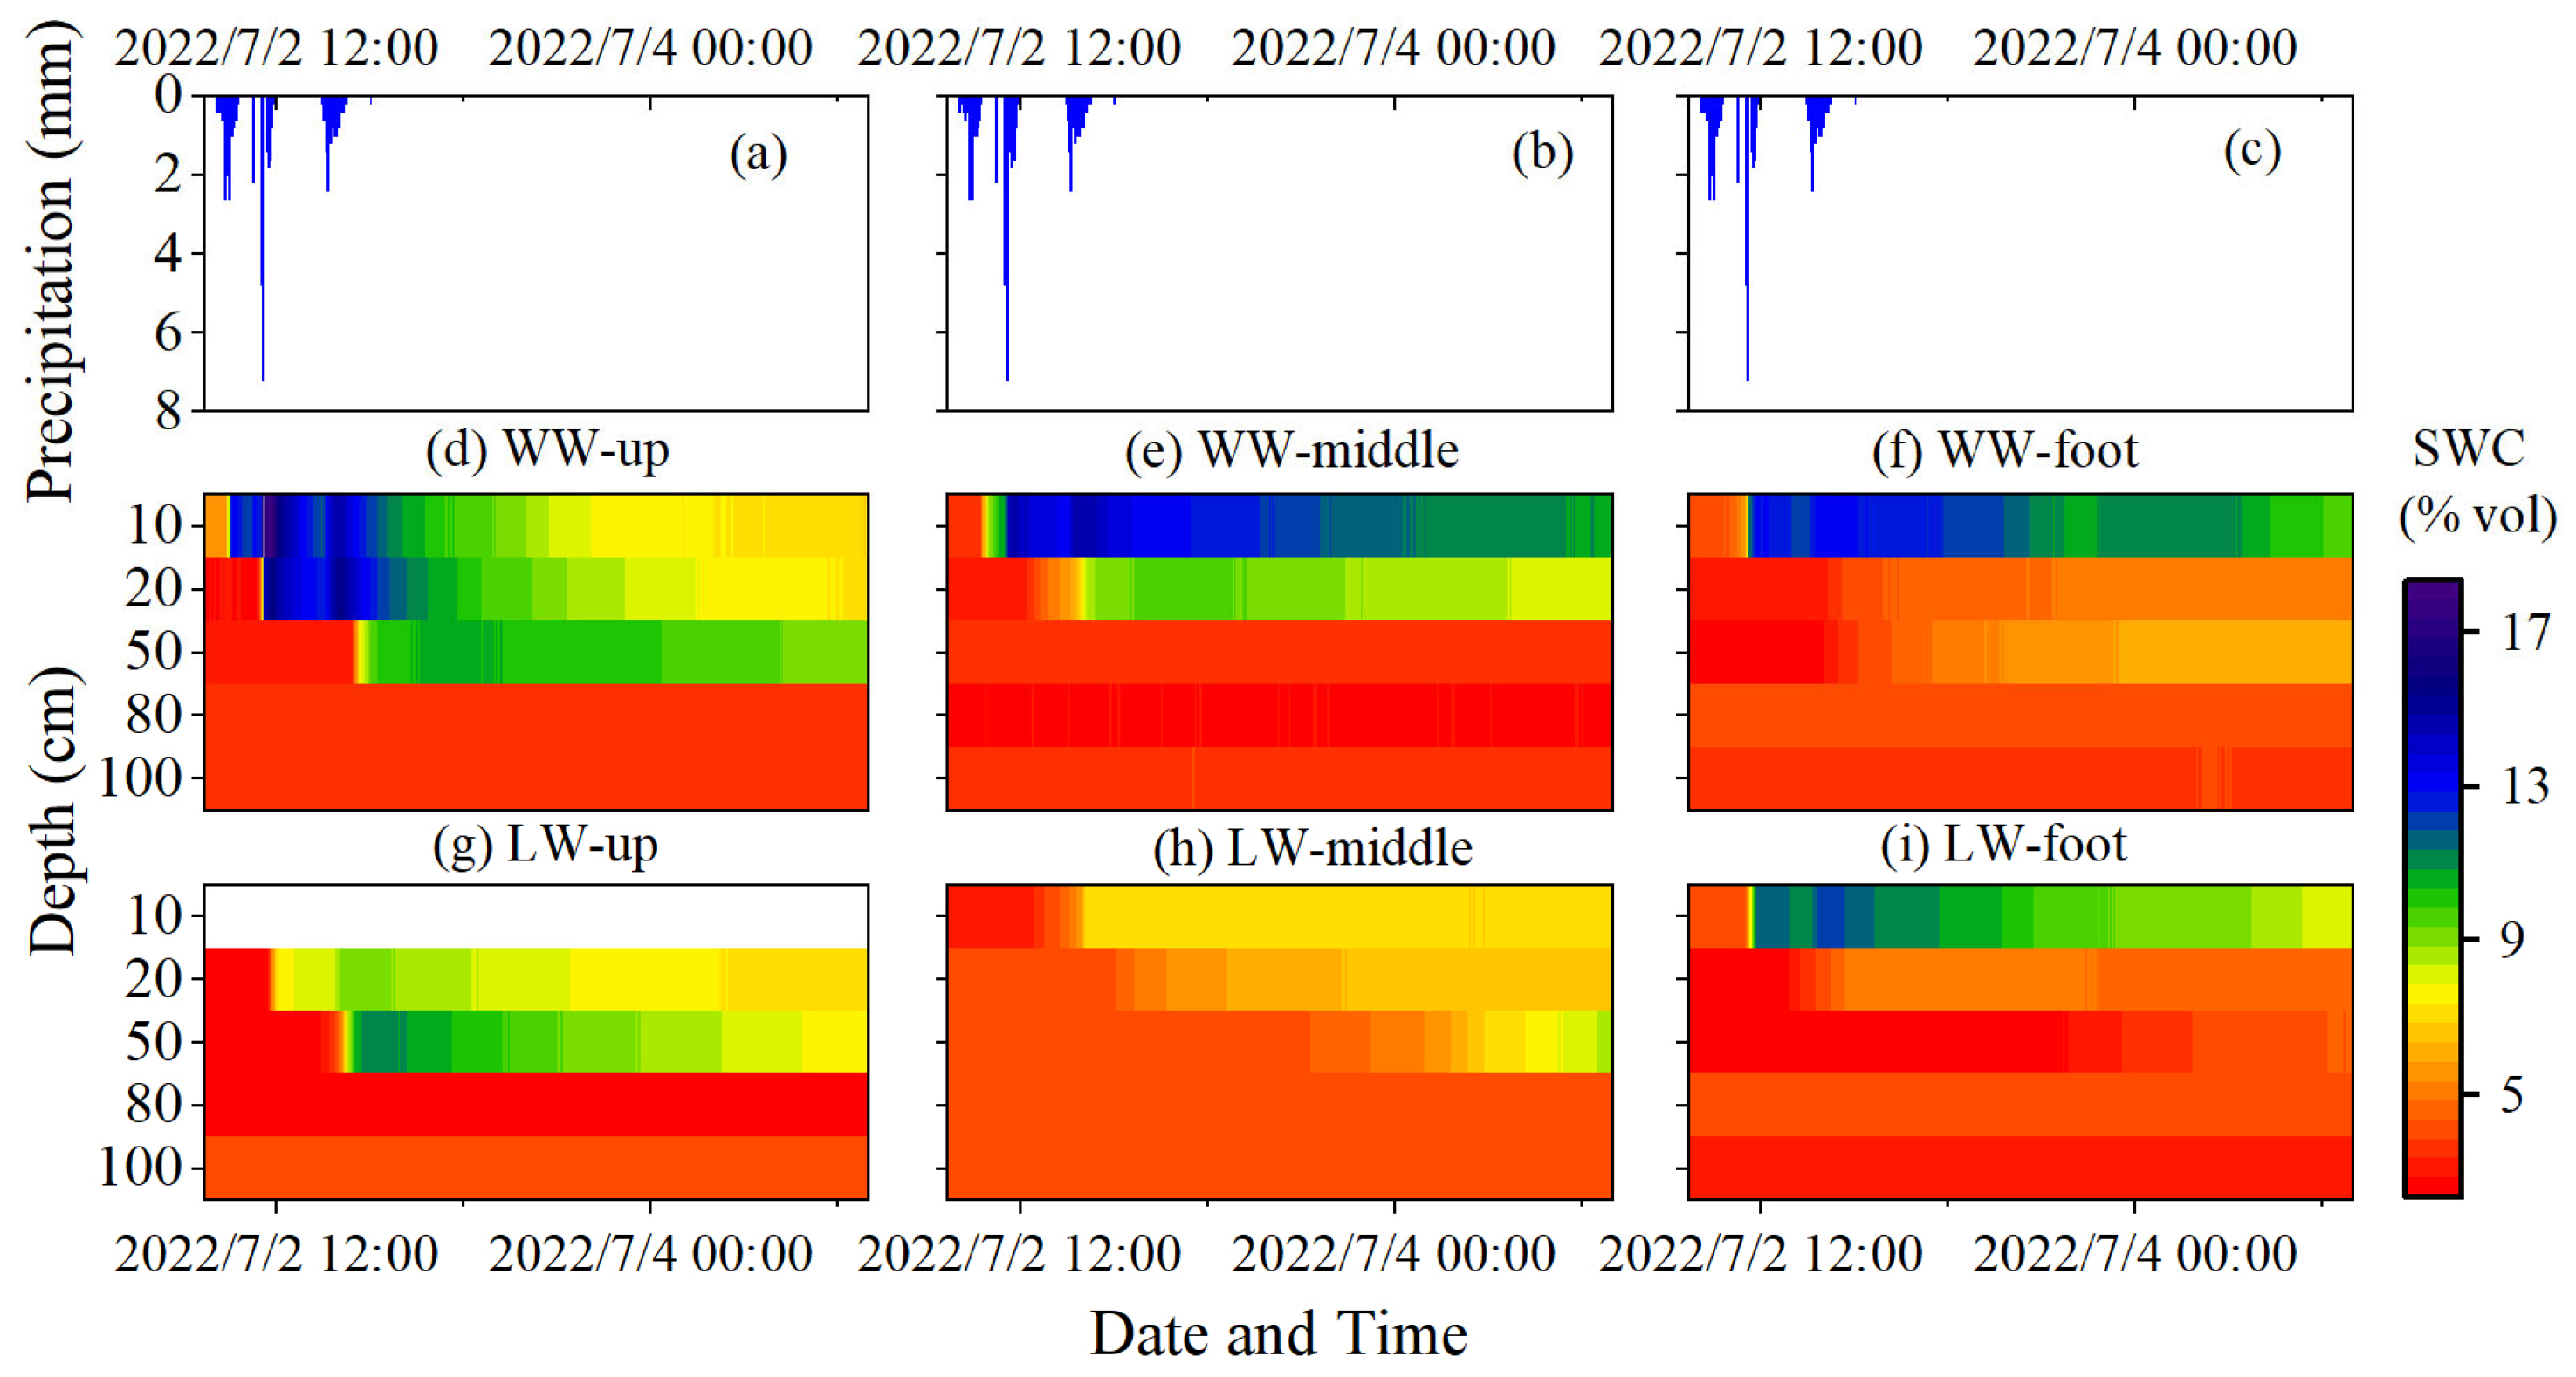
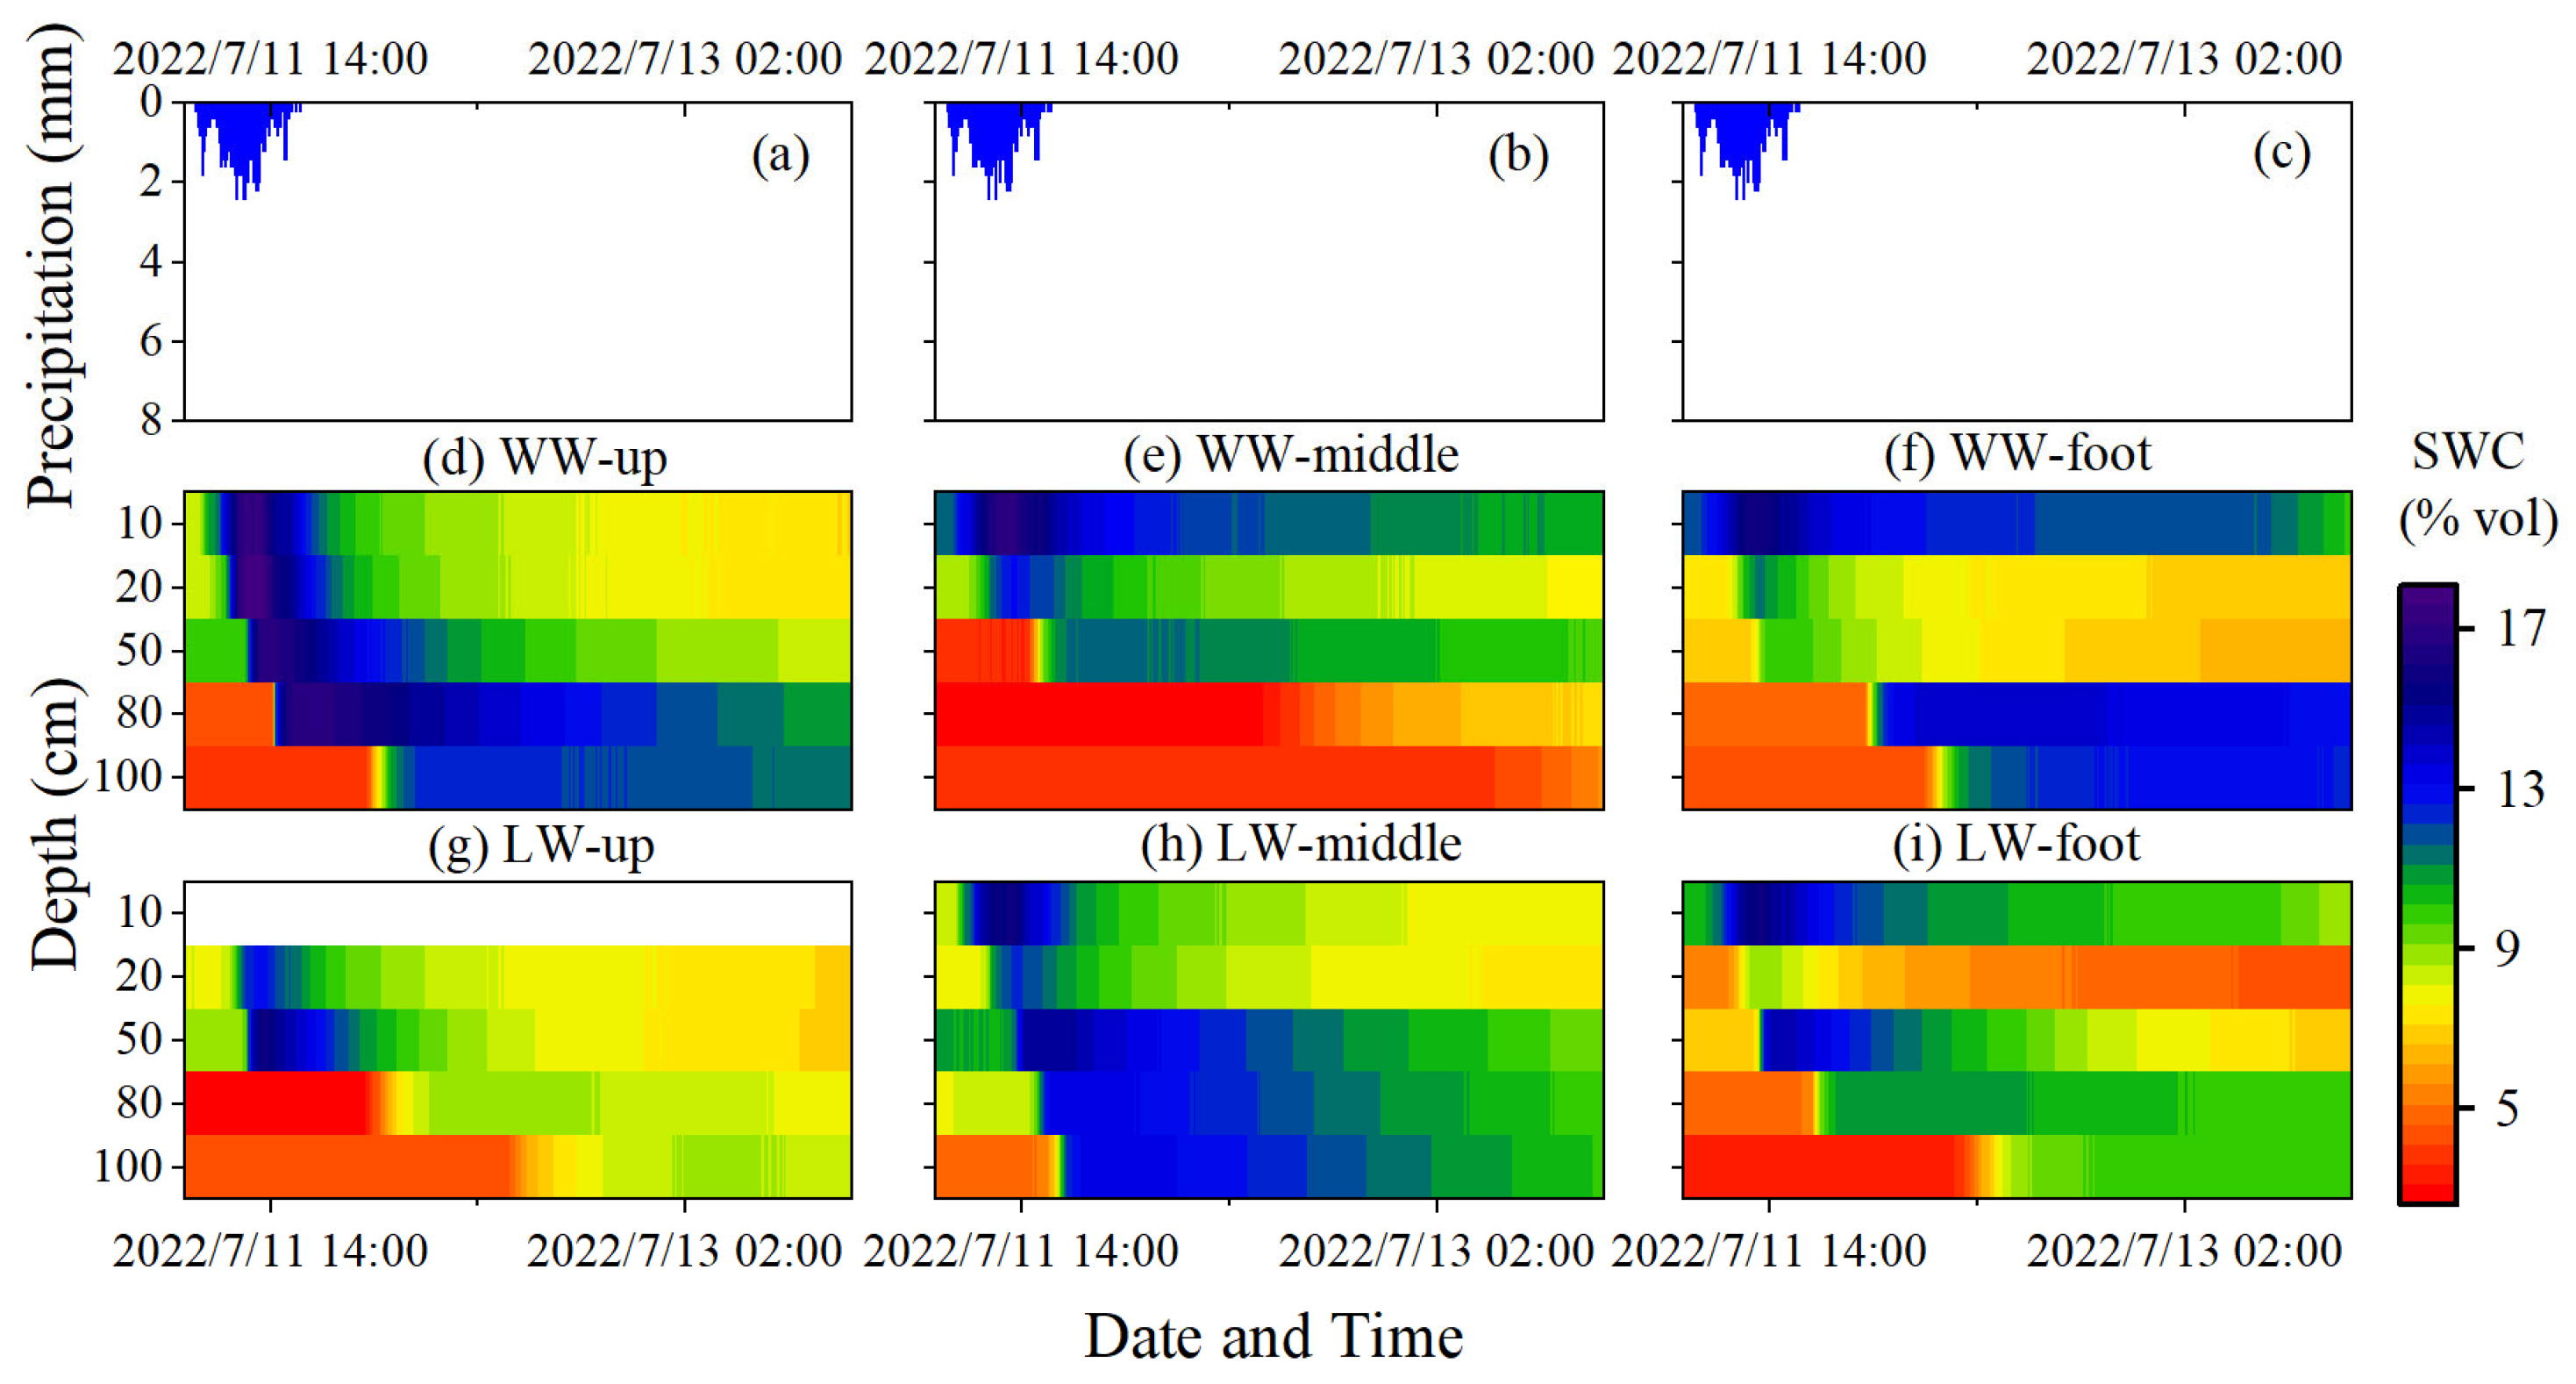
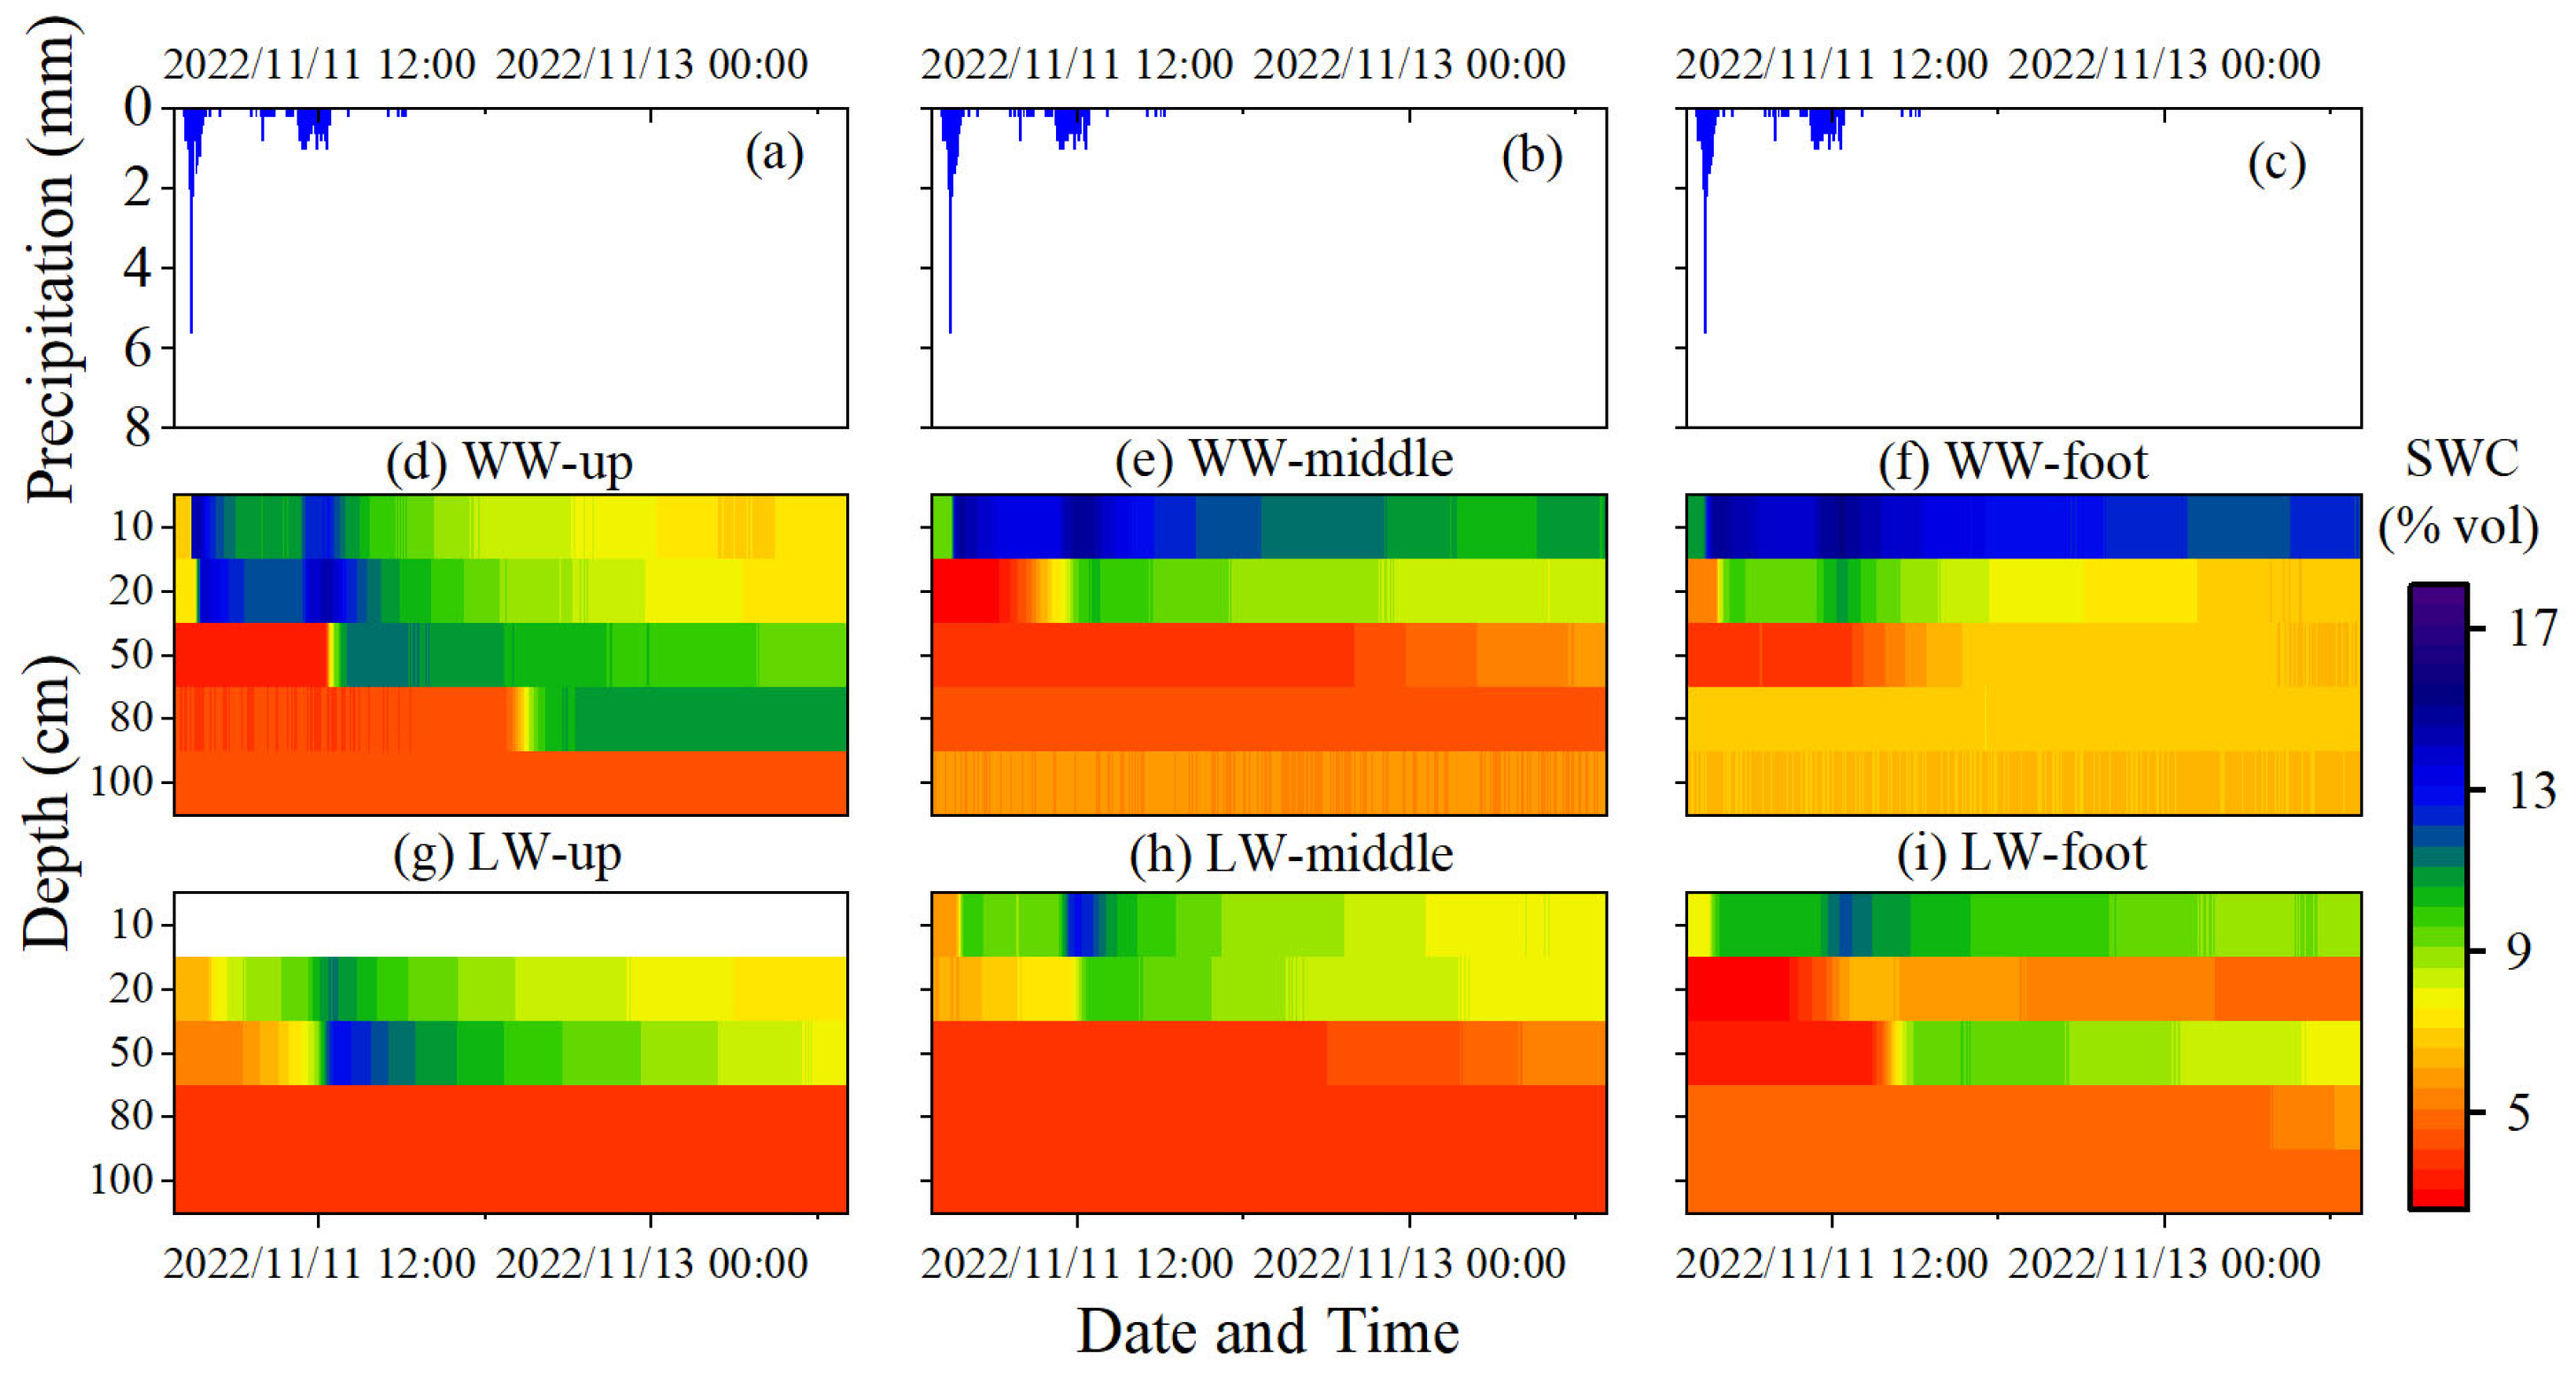
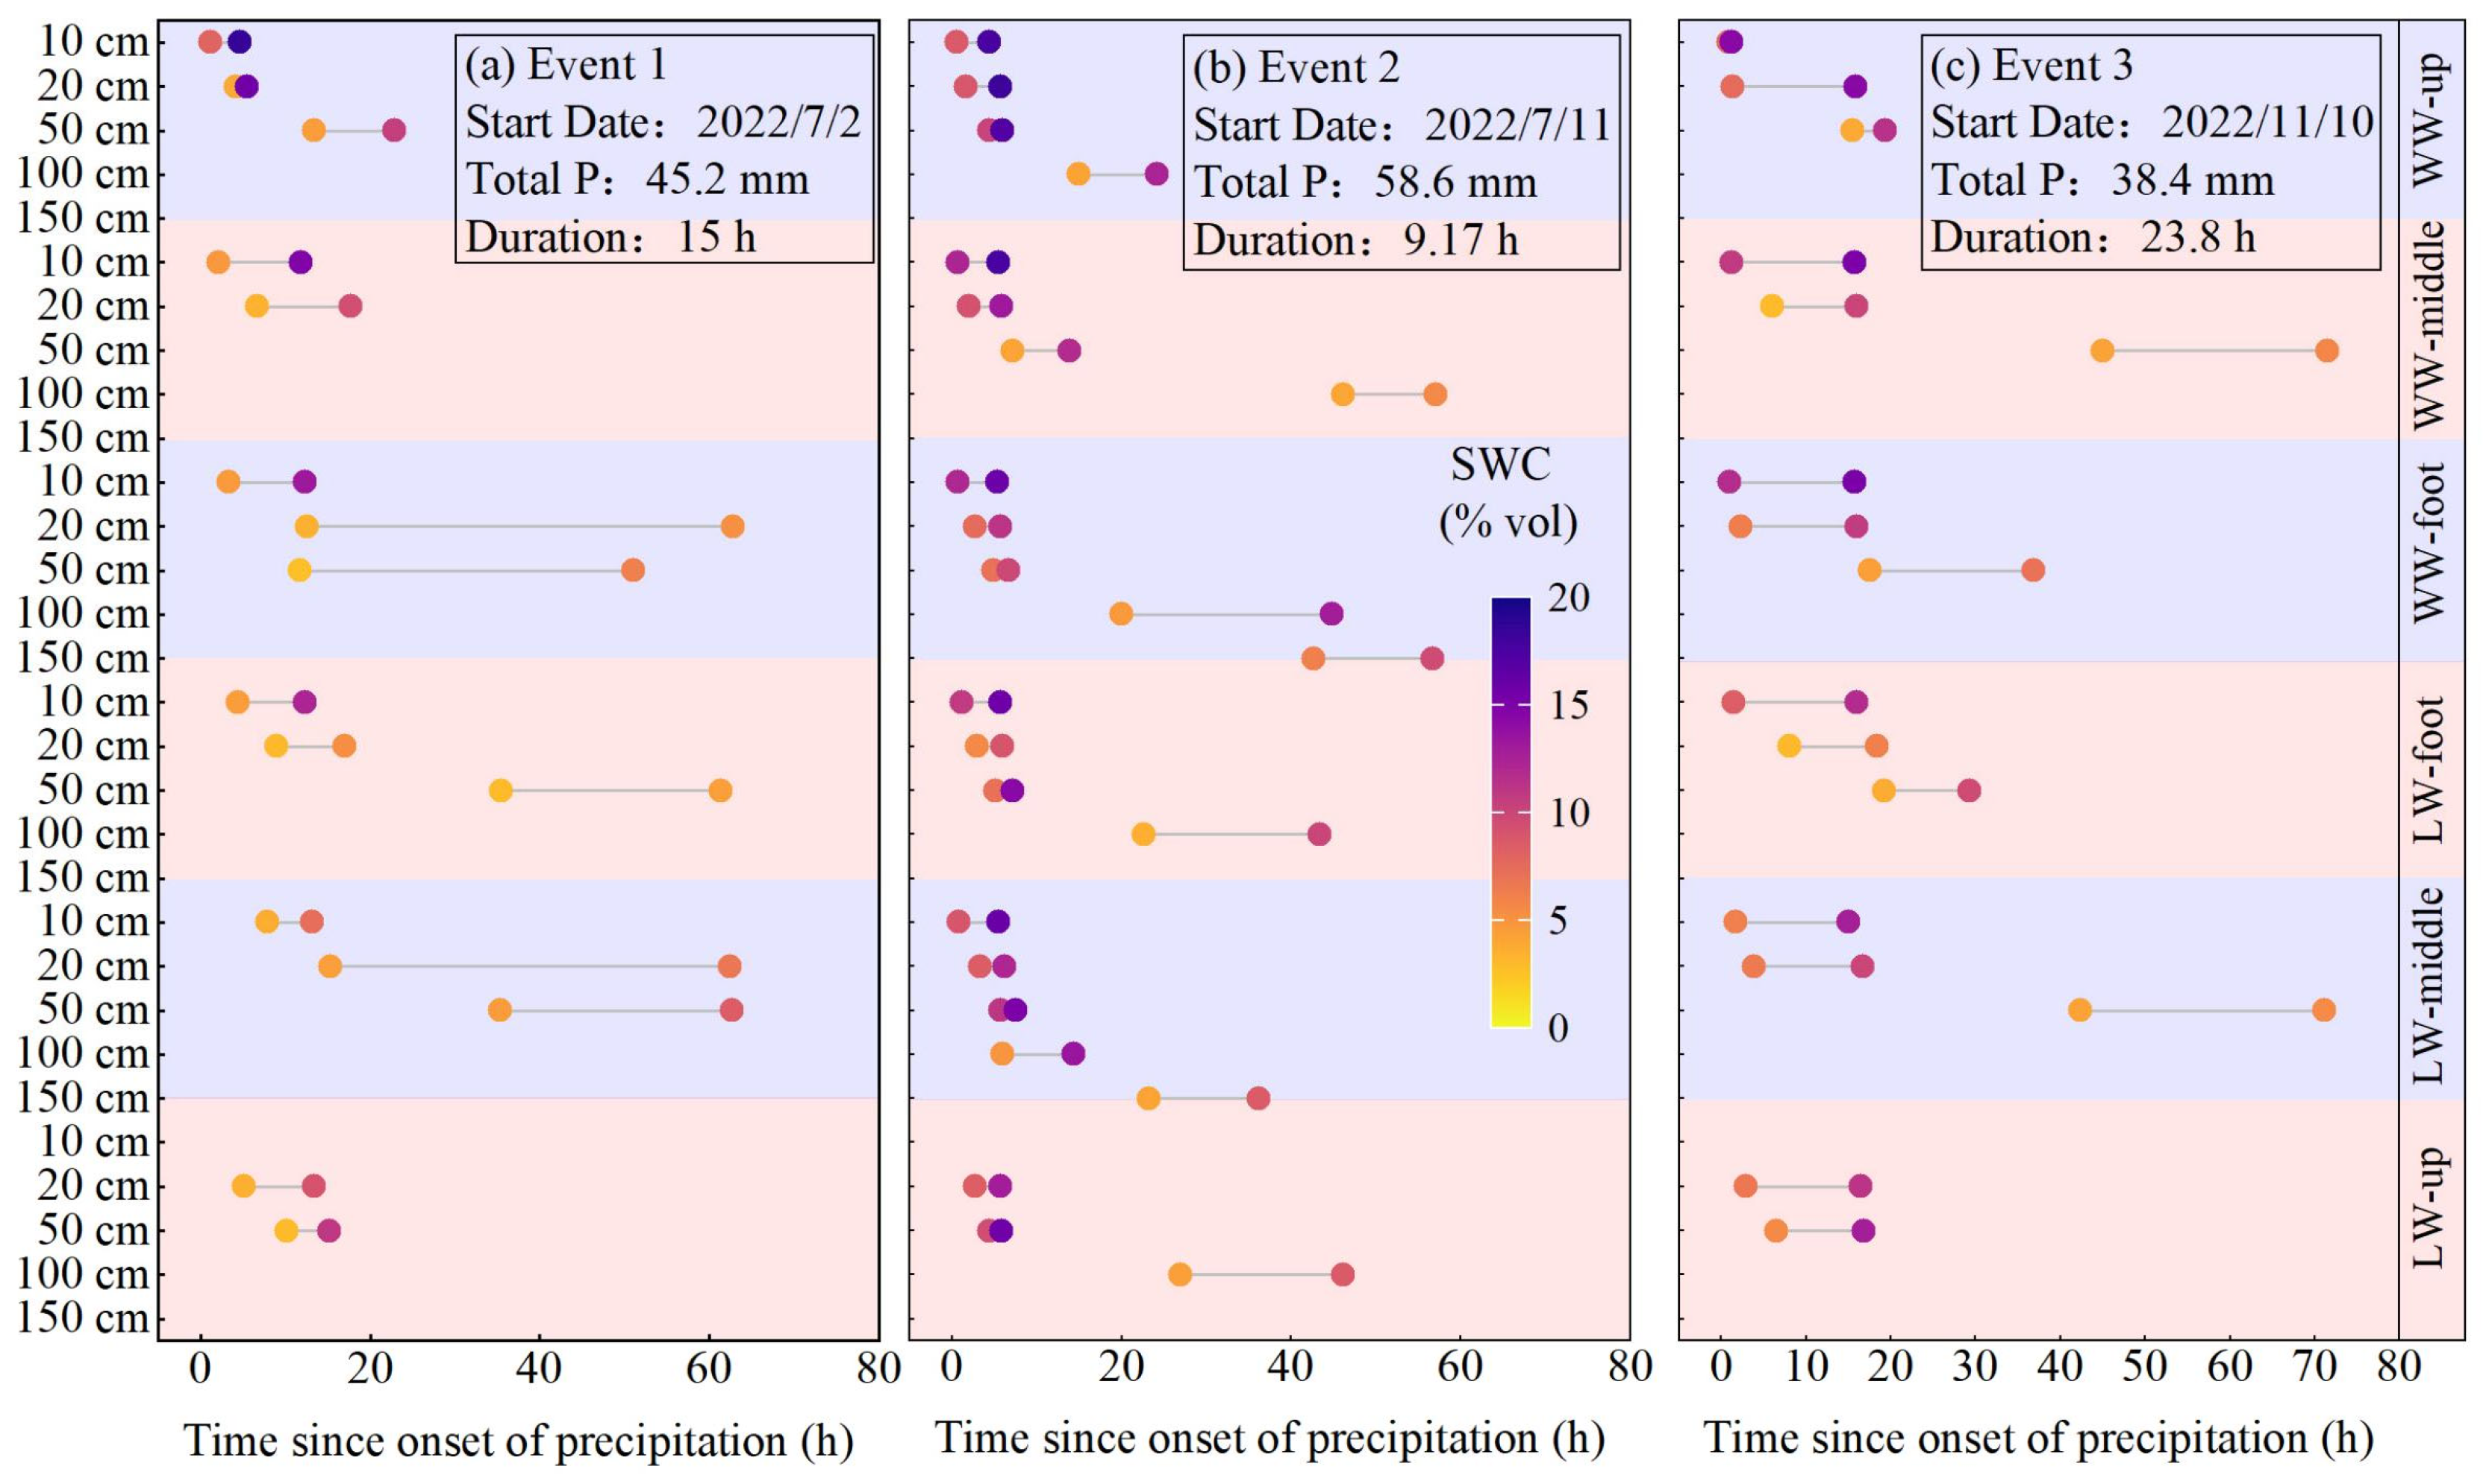
Soil moisture variations induced by rainfall were analyzed across different slope positions and soil layers for three typical precipitation events (Figure 7, Figure 8 and Figure 9). The results show that there are Distinct differences in soil moisture response characteristics of the three rainfall events. In event 1, the response lag time of 10 cm depth is 1.17 h, and the maximum infiltration depth is 50 cm. In event 2, the depth of 10 cm responded within 0.5 h, and the infiltration depth reached 100 cm. In Event 3, the response lag time of 10 cm depth was 0.83 h, and the infiltration depth reached 80 cm (Figure 10). These observations show that with the increase in rainfall, the response time of soil moisture to rainfall and the lag time of reaching peak soil moisture content are shortened. At all slope positions, Δθ (soil moisture increment) decreases continuously with the increase in depth, and the response of soil moisture to rainfall shows an increasing trend from the surface to the deep. This model strongly shows that the matrix flow is the main mechanism of soil moisture movement in the study area. Preferential flow is another way of soil moisture migration, which is usually related to the obvious heterogeneity of macropores, barrier layers, or soil structure. However, the soil heterogeneity in the study area is limited, which may limit the formation of preferential flow paths, thus further confirming that matrix flow is the main mechanism of water movement in this system.
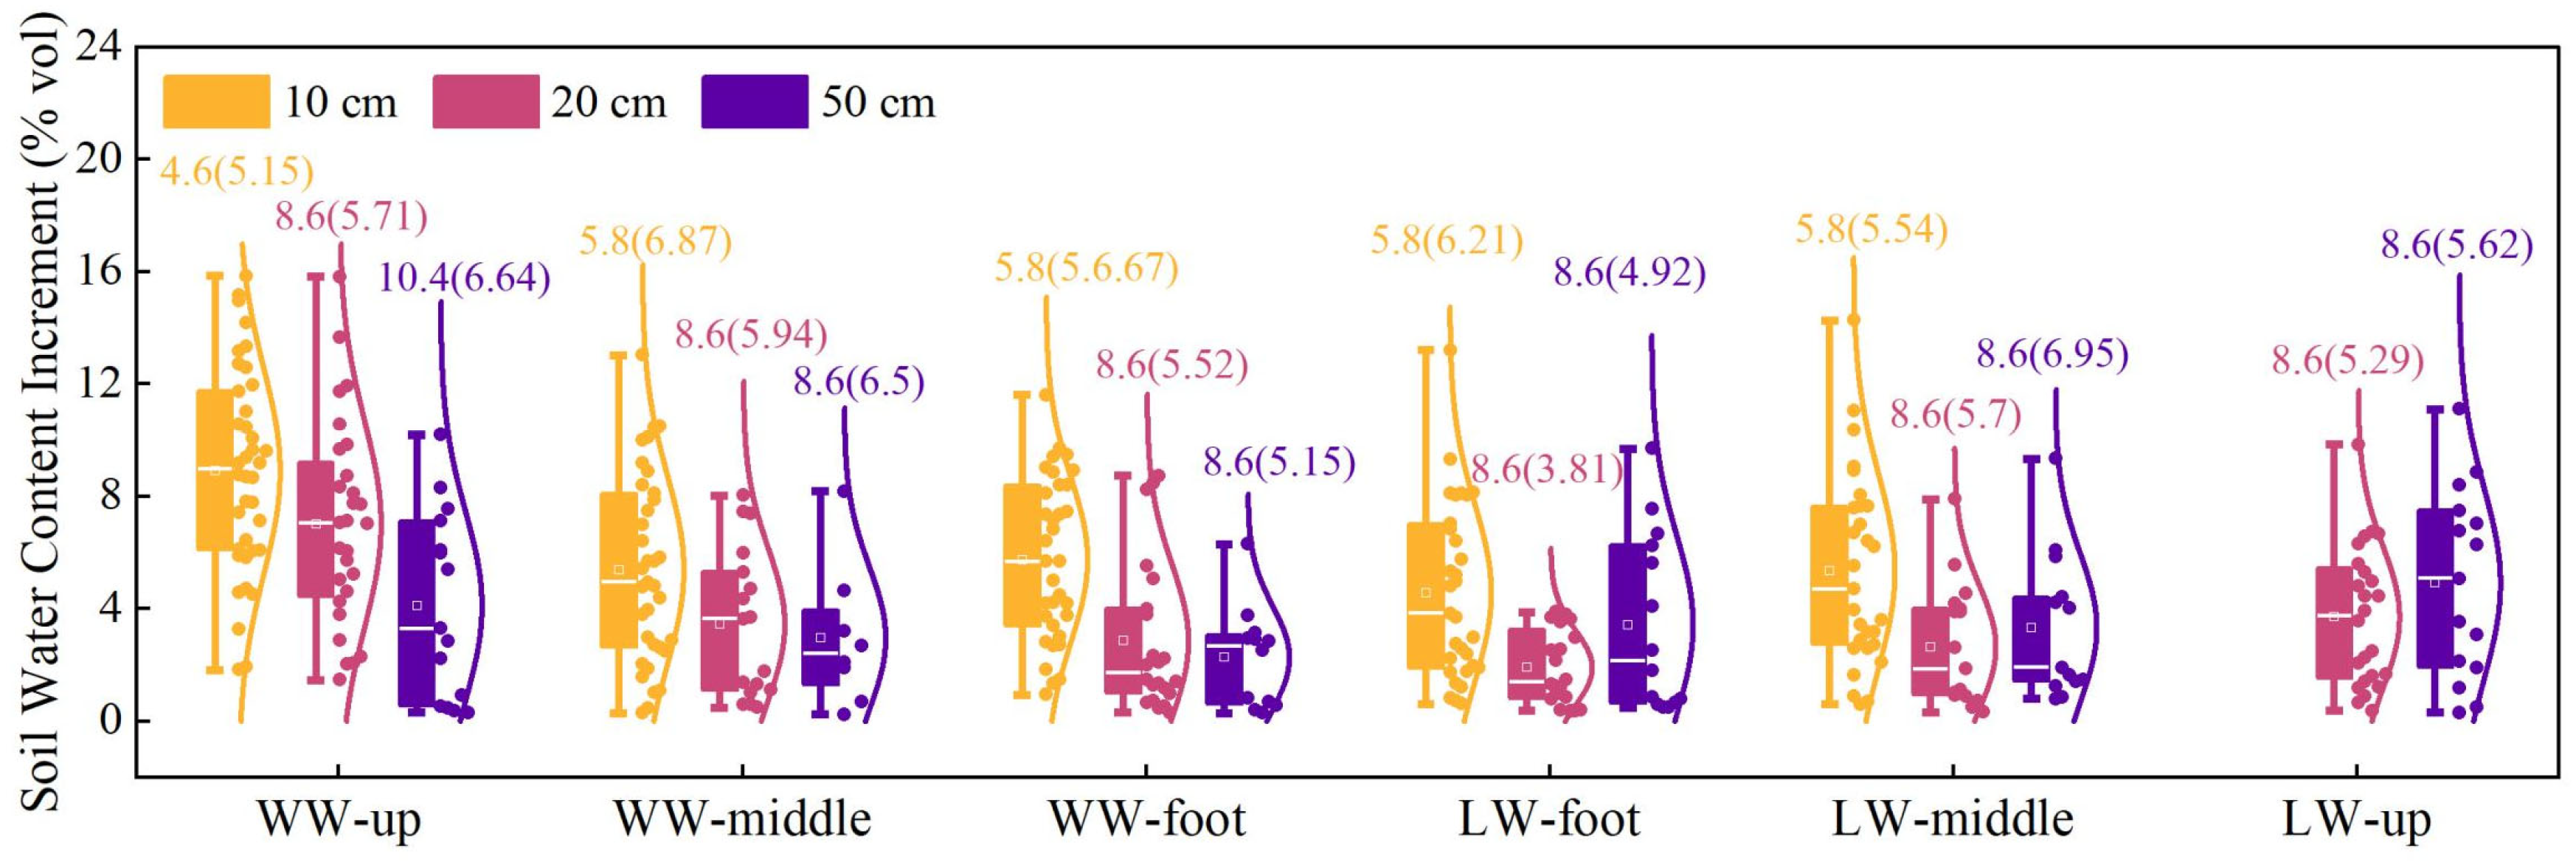
In order to further analyze soil moisture responses to rainfall, all rainfall events that triggered measurable soil moisture variations were subjected to statistical analysis over the observation period. Because only a few heavy rainfall events cause soil moisture changes below 50 cm, subsequent analyses focused on soil moisture dynamics at depths of 10, 20, and 50 cm, together with the associated rainfall conditions and initial soil moisture required to initiate responses at these depths (Figure 11). At different slope positions, the maximum increment in soil moisture (Δθ) generally occurred at 10 cm depth. On the windward slope, Δθ at all positions decreases with the increase in depth. In contrast, on the leeward slope, the maximum Δθ at 50 cm depth at the upper, middle, and footslope positions exceeded that observed at 20 cm depth. Along the downhill direction, the average maximum Δθ shows a downward trend. On the leeward slope, the maximum Δθ value at the foot of the slope is 14.43%, 48.0%, and 30.0% lower than that observed at the slope crest for the 10, 20, and 50 cm layers, respectively. On the windward slope, the corresponding decreases are 35.3%, 59.2%, and 44.7%, respectively. In addition, the surface soil moisture exhibited more sensitive to rainfall. At 10 cm depth, rainfall exceeding 4.6 mm can induce a soil moisture response, while at 20 cm and 50 cm, rainfall exceeding 8.6 mm is required. These findings are in agreement with those reported by Zhang et al. [35]. For deeper soil layers below 100 cm, a steady increase in soil moisture can only be observed when the rainfall exceeds 50 mm. In addition to rainfall, the initial soil moisture status also exerted a strong control on soil moisture responses. On average, the minimum initial volume water content required to trigger the response is 5.95% at 10 cm, 5.33% at 20 cm, and 5.96% at 50 cm. As far as a single rainfall event is concerned, drier prophase conditions often lead to a stronger soil moisture response [36]. Moreover, the initial drying conditions will form a larger soil moisture gradient, thus enhancing the cumulative infiltration of the whole soil profile [37].

3.4. Linkages Between Soil Moisture Response and Environmental Factors

Soil moisture responses to rainfall vary across slope positions and exhibit complex behavior governed by multiple factors, including rainfall amount, rainfall intensity, rainfall duration, and initial soil moisture conditions [38]. Table 4 summarizes correlations between the maximum soil moisture increment (Δθ) and rainfall characteristics (including total rainfall, maximum rainfall intensity (imax), average rainfall intensity (imean), and initial soil moisture content (θinit) in all rainfall events that produced measurable soil moisture response during the study period (1 November 2021 to 31 August 2023). The results indicate that the maximum soil moisture increment (Δθ) is positively associated with total rainfall across most soil depths and slope positions, with only a few depth-specific exceptions (p < 0.05), suggesting that rainfall amount represents the primary control on soil moisture response. In contrast, no consistent relationships were observed between Δθ and rainfall intensity parameters (including imax and imean) or initial soil moisture (θinit). Significant positive associations between Δθ and rainfall intensity were detected only at specific soil depths. In addition, Δθ exhibited a significant negative relationship with soil moisture at certain depths, implying that higher antecedent soil moisture may constrain the magnitude of soil moisture response by reducing infiltration capacity.

3.5. Relationships Between Precipitation and Profile-Scale Soil Water Storage Changes

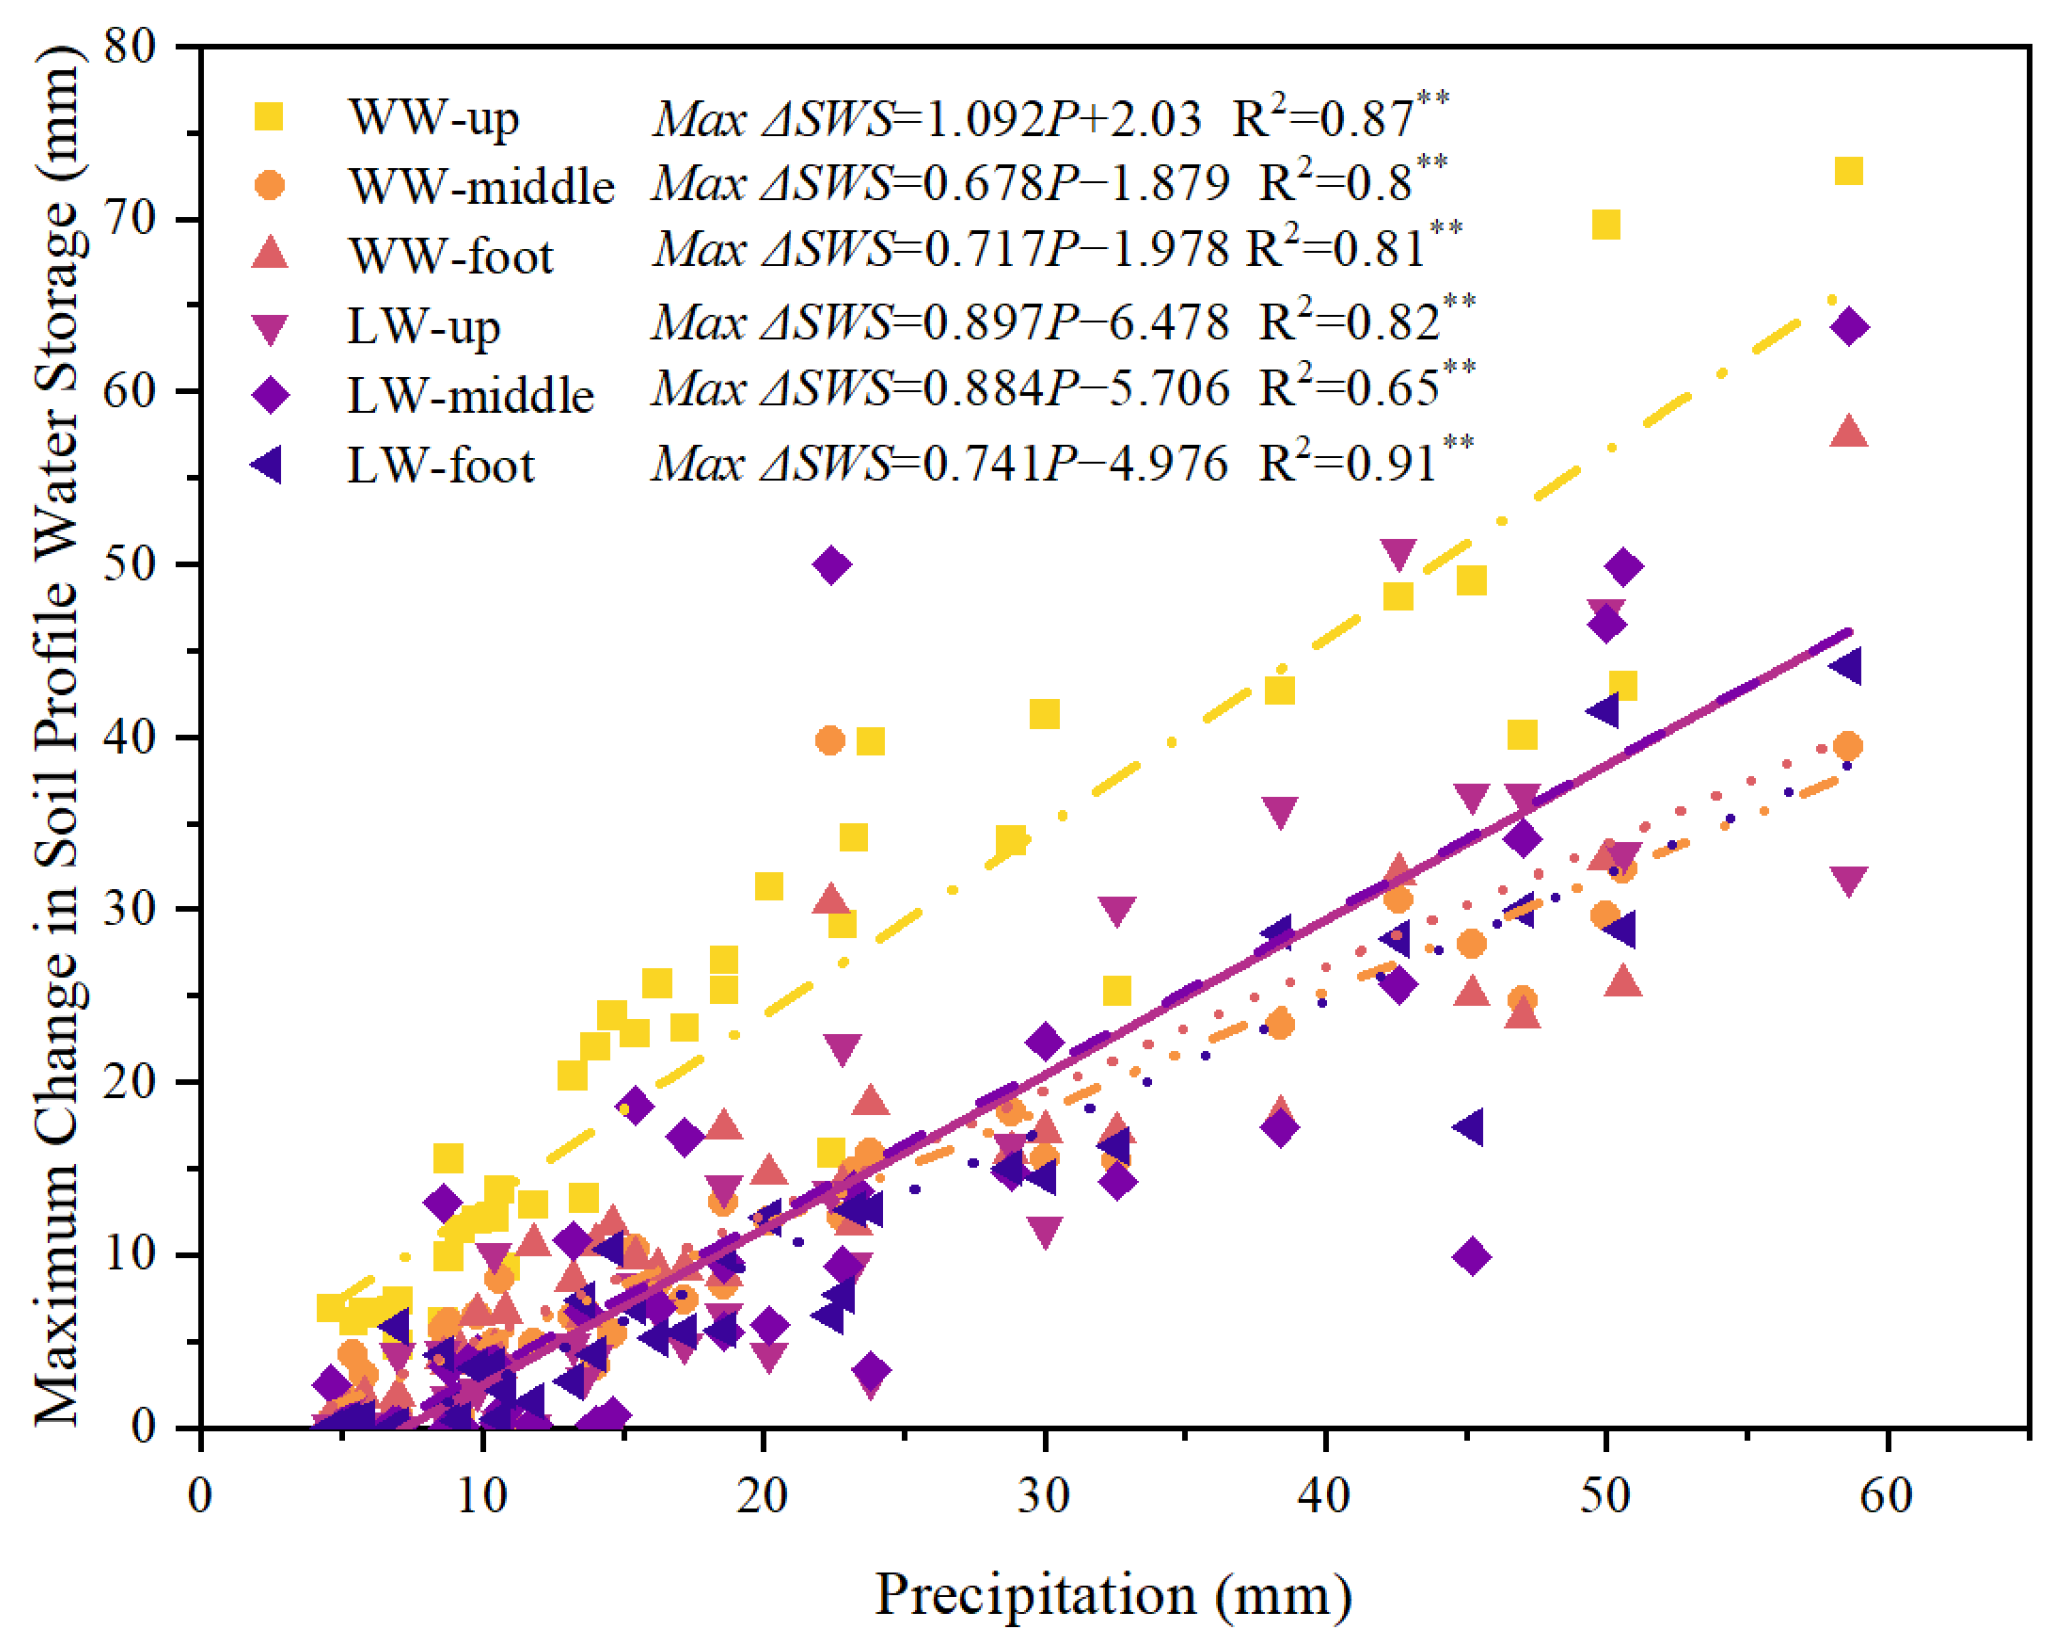
To further evaluate spatial differences in profile-scale water storage response to rainfall, the maximum increase in soil water storage was calculated for each slope position for all rainfall events that produced measurable soil moisture responses during the monitoring period. Figure 12 presents the relationship between precipitation and the maximum change in soil profile water storage. The results shows that total rainfall is positively associated with the maximum increase in soil water storage capacity across slope positions. Except for the leeward midslope, all slope positions exhibit significant linear relationships, with R2 values greater than 0.8, demonstrating strong model performance. This shows that the increase in soil water storage is usually positively correlated with the increase in rainfall. However, the magnitude of storage increase varied among slope positions during rainfall events. Based on the slopes of the fitted linear regressions, the upper position on the windward slope exhibited the greatest increase in storage, followed by the upper leeward slope, middle leeward slope, foot leeward slope, foot windward slope, and finally the middle windward slope. Notably, the slope of the regression line exceeded 1 only at the upper windward position, while it remained below 1 at all other locations.

4. Discussion

To explore the possible role of lateral soil moisture redistribution along the slope, this paper analyzed the relationship between rainfall and the maximum increase in soil water storage during rainfall events. Theoretically, in a single rainfall event, the foot of the slope should receive lateral moisture input from the upslope area, resulting in an increase in water storage greater than rainfall. However, as shown in Figure 12, this phenomenon has not been observed at the foot of the windward slope and leeward slope. On the contrary, it is observed that the soil water storage exceeds the rainfall at the top of the windward slope, indicating that clear footslope-focused lateral recharge was not directly captured during the analyzed events. According to the research of Zhu et al. [39], this lateral water flow usually occurs only when the initial soil water content exceeds 0.3 cm3/cm3 and the rainfall is greater than 50 mm. On the contrary, under dry antecedent conditions, even heavy rainfall may not lead to significant lateral recharge of deep soil layers. In Mu Us sandy land, sandy soil texture leads to low water retention capacity of soil. During the selected study period, the observed maximum soil water content was 24.56% (volume percentage, 0.2456 cm3/cm3), which was lower than the threshold of effective lateral flow. In addition, the rapid water loss caused by evapotranspiration and vertical water redistribution further reduces the possibility of downhill water movement. However, this does not necessarily mean that lateral flow did not occur during the rainfall. One possible explanation for not detecting obvious lateral recharge is the calculation method of soil water storage, which is based on the measurement data of six discrete depths (10, 20, 50, 80, 100, and 150 cm). Considering the significant vertical heterogeneity of soil moisture, the measured values of these points may not accurately reflect the overall water content of the soil profile, resulting in potential deviation between the calculated values and the actual water storage. In addition, according to the rainfall intensity and the measured saturated hydraulic conductivity, it can be inferred that there was no surface runoff during the study period, and the soil profile was basically unsaturated. Under such conditions, lateral soil water movement is typically slow, particularly in dry soils. At the temporal scale of the selected rainfall events, infiltrated water from upslope positions may not have reached the footslope within the same event, or the arrival of lateral flow may have occurred after the time when the maximum profile water storage was observed. As a result, the lateral redistribution process may not have been captured within the timescale of individual events. McCord et al. [40] and McCord and Stephens [41] demonstrated, using bromide tracers, that aeolian dune slopes exhibit significant lateral components of soil water movement. However, the downslope transport distance of the tracer was less than 1 m per day, indicating that lateral flow in sandy soils is limited and slow.
From an applied perspective, these findings have important implications for land management in semi-arid sandy regions. The identified rainfall thresholds indicate that small rainfall events can replenish only shallow soil layers, whereas deep soil recharge depends on relatively large storms. This means that plant species relying mainly on shallow soil water may respond rapidly to frequent small events, while deep-rooted vegetation establishment and long-term survival depend more strongly on the occurrence of larger rainfall events. In addition, the consistently higher soil moisture observed at footslope positions suggests that these locations may provide more favorable microsites for seedling establishment, dryland restoration, and the arrangement of shelterbelt vegetation. Therefore, topographic position should be explicitly considered when planning vegetation restoration and water-limited land management in sandy drylands.
A limitation of this study is that vegetation-related factors, such as root distribution, canopy interception, and transpiration, were not directly measured. Therefore, their contributions to the observed spatiotemporal soil moisture patterns could not be explicitly assessed in the present analysis. Future studies should combine soil moisture monitoring with vegetation measurements to better clarify the coupled effects of biotic and abiotic factors on slope-scale soil water dynamics.

5. Conclusions

In this study, hillslope soil moisture dynamics were characterized by integrating high-resolution in situ observations with manually collected soil moisture data. Soil moisture responses to rainfall events across different slope positions, together with variations in soil water storage along soil profiles, were further examined. The results indicate that rainfall exerts a dominant control on temporal soil moisture variability, as soil moisture time series at different slope positions closely follow rainfall fluctuations, revealing a strong temporal coupling between the two. In contrast, topographic controls primarily govern the spatial distribution of soil moisture along slopes. Soil water content at footslope positions on both windward and leeward slopes is consistently higher than that at middle and upper slope positions, particularly during wet periods. This spatial pattern indicates persistent moisture accumulation at the footslope. Lateral water redistribution may be one possible explanation, but this mechanism was not directly demonstrated by the event-scale analysis in the present study and may be influenced by threshold conditions, delayed subsurface transfer, vertical percolation, or limitations in profile water storage estimation. Moreover, soil moisture responses to rainfall were found to depend jointly on rainfall amount and antecedent soil moisture conditions. Specifically, surface soil moisture at 10 cm exhibited a detectable response once rainfall exceeded 4.6 mm, whereas responses at 20 and 50 cm occurred only when rainfall amounts were greater than 8.6 mm. In deeper soil layers (>100 cm), marked increases in soil moisture were observed exclusively during rainfall events exceeding 50 mm. Both the maximum soil moisture increment and the peak increase in profile-scale soil water storage increased with total rainfall amount; however, neither metric showed a significant relationship with rainfall intensity nor with antecedent soil water content. Overall, the present data support a persistent topographic pattern of greater footslope moisture, but they do not provide direct event-scale confirmation that lateral subsurface flow is the dominant mechanism. Instead, lateral redistribution should currently be regarded as a plausible but not conclusively verified process in this system.

Author Contributions

Conceptualization, W.G. and X.L.; methodology, W.G.; data curation, W.G. and X.Z.; writing—original draft preparation, W.G.; writing—review and editing, Z.J., X.L. and C.S.; supervision, Z.J., X.L. and C.S. All authors have read and agreed to the published version of the manuscript.

Funding

This work was supported by the Innovation Fund for Higher Education Teachers of Gansu Province [grant number, 2026B-301]; the Natural Science Basic Research Program of Shaanxi Province [grant number, 2025JC-YBQN-434].

Data Availability Statement

The data that support the findings of this study are available from the corresponding author upon reasonable request.

Acknowledgments

The authors are grateful to the editor and reviewers for their constructive comments and suggestions. During the preparation of this manuscript, ChatGPT-5 (Open AI, San Francisco, CA, USA) was used for language editing (e.g., grammar, spelling, punctuation, and readability) only. The tool was not used to generate scientific content, data, results, interpretations, or references.

Conflicts of Interest

The authors declare no conflicts of interest.

References

  1. Vereecken, H.; Amelung, W.; Bauke, S.L.; Bogena, H.; Brüggemann, N.; Montzka, C.; Vanderborght, J.; Bechtold, M.; Blöschl, G.; Carminati, A.; et al. Soil hydrology in the Earth system. Nat. Rev. Earth Environ. 2022, 3, 573–587. [Google Scholar] [CrossRef] [Scilit]
  2. Páez-Bimos, S.; Molina, A.; Calispa, M.; Delmelle, P.; Lahuatte, B.; Villacís, M.; Muñoz, T.; Vanacker, V. Soil–vegetation–water interactions controlling solute flow and chemical weathering in volcanic ash soils of the high Andes. Hydrol. Earth Syst. Sci. 2023, 27, 1507–1529. [Google Scholar] [CrossRef] [Scilit]
  3. Liu, J.; Engel, B.A.; Wang, Y.; Wu, Y.; Zhang, Z.; Zhang, M. Runoff Response to Soil Moisture and Micro-topographic Structure on the Plot Scale. Sci. Rep. 2019, 9, 2532. [Google Scholar] [CrossRef] [Scilit] [PubMed]
  4. Singh, N.K.; Emanuel, R.E.; McGlynn, B.L.; Miniat, C.F. Soil Moisture Responses to Rainfall: Implications for Runoff Generation. Water Resour. Res. 2021, 57, e2020WR028827. [Google Scholar] [CrossRef] [Scilit]
  5. Uber, M.; Vandervaere, J.P.; Zin, I.; Braud, I.; Heistermann, M.; Legoût, C.; Molinié, G.; Nord, G. How does initial soil moisture influence the hydrological response? A case study from southern France. Hydrol. Earth Syst. Sci. 2018, 22, 6127–6146. [Google Scholar] [CrossRef] [Scilit]
  6. Zhao, X.; Zhang, W.; Feng, Y.; Mo, Q.; Su, Y.; Njoroge, B.; Qu, C.; Gan, X.; Liu, X. Soil organic carbon primarily control the soil moisture characteristic during forest restoration in subtropical China. Front. Ecol. Evol. 2022, 10, 1003532. [Google Scholar] [CrossRef] [Scilit]
  7. Hao, Y.; Mao, J.; Bachmann, C.M.; Hoffman, F.M.; Koren, G.; Chen, H.; Tian, H.; Liu, J.; Tao, J.; Tang, J.; et al. Soil moisture controls over carbon sequestration and greenhouse gas emissions: A review. npj Clim. Atmos. Sci. 2025, 8, 16. [Google Scholar] [CrossRef] [Scilit]
  8. Zhang, J.; Feng, Y.; Maestre, F.T.; Berdugo, M.; Wang, J.; Coleine, C.; Sáez-Sandino, T.; García-Velázquez, L.; Singh, B.K.; Delgado-Baquerizo, M. Water availability creates global thresholds in multidimensional soil biodiversity and functions. Nat. Ecol. Evol. 2023, 7, 1002–1011. [Google Scholar] [CrossRef] [Scilit]
  9. O’Donnell, M.S.; Manier, D.J. Spatial Estimates of Soil Moisture for Understanding Ecological Potential and Risk: A Case Study for Arid and Semi-Arid Ecosystems. Land 2022, 11, 1856. [Google Scholar] [CrossRef] [Scilit]
  10. Vereecken, H.; Huisman, J.A.; Pachepsky, Y.; Montzka, C.; van der Kruk, J.; Bogena, H.; Weihermüller, L.; Herbst, M.; Martinez, G.; Vanderborght, J. On the spatio-temporal dynamics of soil moisture at the field scale. J. Hydrol. 2014, 516, 76–96. [Google Scholar] [CrossRef] [Scilit]
  11. Grayson, R.B.; Western, A.W.; Chiew, F.H.S.; Blöschl, G. Preferred states in spatial soil moisture patterns: Local and nonlocal controls. Water Resour. Res. 1997, 33, 2897–2908. [Google Scholar] [CrossRef] [Scilit]
  12. Luo, J.; Zheng, Z.; Li, T.; He, S. Spatial heterogeneity of microtopography and its influence on the flow convergence of slopes under different rainfall patterns. J. Hydrol. 2017, 545, 88–99. [Google Scholar] [CrossRef] [Scilit]
  13. Famiglietti, J.S.; Rudnicki, J.W.; Rodell, M. Variability in surface moisture content along a hillslope transect: Rattlesnake Hill, Texas. J. Hydrol. 1998, 210, 259–281. [Google Scholar] [CrossRef] [Scilit]
  14. Kaiser, K.E.; McGlynn, B.L. Nested Scales of Spatial and Temporal Variability of Soil Water Content Across a Semiarid Montane Catchment. Water Resour. Res. 2018, 54, 7960–7980. [Google Scholar] [CrossRef] [Scilit]
  15. Kim, S.; Sun, H.; Jung, S. Configuration of the relationship of soil moistures for vertical soil profiles on a steep hillslope using a vector time series model. J. Hydrol. 2011, 399, 353–363. [Google Scholar] [CrossRef] [Scilit]
  16. Ma, Y.; Wu, P.; Chen, Y.; Dong, Q.; Shao, T.; Zhao, G.; Liu, X.; Zhao, Z.; Guan, Z. Hydrological processes in the megadune slopes and their implications for the water source of lakes in the Badain Jaran Desert. J. Hydrol. 2024, 631, 130844. [Google Scholar] [CrossRef] [Scilit]
  17. Svoray, T.; Sela, S.; Chen, L.; Assouline, S. Lateral Flow and Contributing Area Control Vegetation Cover in a Semiarid Environment. Water Resour. Res. 2021, 57, e2021WR030998. [Google Scholar] [CrossRef] [Scilit]
  18. Canton, Y.; Rodríguez-Caballero, E.; Contreras, S.; Villagarcia, L.; Li, X.-Y.; Solé-Benet, A.; Domingo, F. Vertical and lateral soil moisture patterns on a Mediterranean karst hillslope. J. Hydrol. Hydromech. 2016, 64, 209–217. [Google Scholar] [CrossRef] [Scilit]
  19. Cao, R.; Jia, X.; Huang, L.; Zhu, Y.; Wu, L.; Shao, M. Deep soil water storage varies with vegetation type and rainfall amount in the Loess Plateau of China. Sci. Rep. 2018, 8, 12346. [Google Scholar] [CrossRef] [Scilit]
  20. Nousu, J.P.; Leppä, K.; Marttila, H.; Ala-aho, P.; Mazzotti, G.; Manninen, T.; Korkiakoski, M.; Aurela, M.; Lohila, A.; Launiainen, S. Multi-scale soil moisture data and process-based modeling reveal the importance of lateral groundwater flow in a subarctic catchment. Hydrol. Earth Syst. Sci. 2024, 28, 4643–4666. [Google Scholar] [CrossRef] [Scilit]
  21. Akhter, T.; Pokhrel, Y.; Felfelani, F.; Ducharne, A.; Lo, M.H.; Reinecke, R. Implications of Lateral Groundwater Flow Across Varying Spatial Resolutions in Global Land Surface Modeling. Water Resour. Res. 2025, 61, e2024WR038523. [Google Scholar] [CrossRef] [Scilit]
  22. Tenreiro, T.R.; Jeřábek, J.; Gómez, J.A.; Zumr, D.; Martínez, G.; García-Vila, M.; Fereres, E. Simulating water lateral inflow and its contribution to spatial variations of rainfed wheat yields. Eur. J. Agron. 2022, 137, 126515. [Google Scholar] [CrossRef] [Scilit]
  23. Nan, W.; Ta, F.; Meng, X.; Dong, Z.; Xiao, N. Effects of age and density of Pinus sylvestris var. mongolica on soil moisture in the semiarid Mu Us Dunefield, northern China. For. Ecol. Manag. 2020, 473, 118313. [Google Scholar] [CrossRef] [Scilit]
  24. Wang, L.; Ma, A.; Zhang, H.; Zhang, J.; Dong, Q.; Fu, G. Effects of Long-Term Vegetation Restoration on Distribution of Deep Soil Moisture in Semi-arid Northwest of China. J. Soil Sci. Plant Nutr. 2020, 20, 2123–2132. [Google Scholar] [CrossRef] [Scilit]
  25. Zheng, C.; Lu, Y.; Liu, X.; Šimůnek, J.; Zeng, Y.; Shi, C.; Li, H. In-Situ Monitoring and Characteristic Analysis of Freezing-Thawing Cycles in a Deep Vadose Zone. Water 2020, 12, 1261. [Google Scholar] [CrossRef] [Scilit]
  26. Zheng, C.; Šimůnek, J.; Zhao, Y.; Lu, Y.; Liu, X.; Shi, C.; Li, H.; Yu, L.; Zeng, Y.; Su, Z. Development of the Hydrus-1D freezing module and its application in simulating the coupled movement of water, vapor, and heat. J. Hydrol. 2021, 598, 126250. [Google Scholar] [CrossRef] [Scilit]
  27. Dunkerley, D. Intra-event intermittency of rainfall: An analysis of the metrics of rain and no-rain periods. Hydrol. Process. 2015, 29, 3294–3305. [Google Scholar] [CrossRef] [Scilit]
  28. Brasil, J.B.; Guerreiro, M.S.; Andrade, E.M.d.; de Queiroz Palácio, H.A.; Medeiros, P.H.A.; Ribeiro Filho, J.C. Minimum Rainfall Inter-Event Time to Separate Rainfall Events in a Low Latitude Semi-Arid Environment. Sustainability 2022, 14, 1721. [Google Scholar] [CrossRef] [Scilit]
  29. da Silva-Dias, R.; Raposo-Díaz, X.; García-Tomillo, A.; López-Vicente, M. Response time of soil moisture to rain in a vineyard with permanent cover. Geoderma 2024, 444, 116866. [Google Scholar] [CrossRef] [Scilit]
  30. Zhang, Q.; Fan, J.; Zhao, X. Effect of shrubland-to-grassland conversion on soil water storage and infiltration capacity in Loess Plateau region of China. Catena 2025, 249, 108720. [Google Scholar] [CrossRef] [Scilit]
  31. Zhou, J.; Fu, B.; Gao, G.; Lü, N.; Lü, Y.; Wang, S. Temporal stability of surface soil moisture of different vegetation types in the Loess Plateau of China. Catena 2015, 128, 1–15. [Google Scholar] [CrossRef] [Scilit]
  32. Gao, L.; Peng, X.; Biswas, A. Temporal instability of soil moisture at a hillslope scale under subtropical hydroclimatic conditions. Catena 2020, 187, 104362. [Google Scholar] [CrossRef] [Scilit]
  33. Dymond, S.F.; Wagenbrenner, J.W.; Keppeler, E.T.; Bladon, K.D. Dynamic Hillslope Soil Moisture in a Mediterranean Montane Watershed. Water Resour. Res. 2021, 57, e2020WR029170. [Google Scholar] [CrossRef] [Scilit]
  34. Vereecken, H.; Kamai, T.; Harter, T.; Kasteel, R.; Hopmans, J.; Vanderborght, J. Explaining soil moisture variability as a function of mean soil moisture: A stochastic unsaturated flow perspective. Geophys. Res. Lett. 2007, 34, L22402. [Google Scholar] [CrossRef] [Scilit]
  35. Zhang, J.; Duan, L.; Liu, T.; Chen, Z.; Wang, Y.; Li, M.; Zhou, Y. Experimental analysis of soil moisture response to rainfall in a typical grassland hillslope under different vegetation treatments. Environ. Res. 2022, 213, 113608. [Google Scholar] [CrossRef] [Scilit]
  36. Yang, M.Y.; Zhang, Y.Y.; Pan, X.Y. Improving the Horton infiltration equation by considering soil moisture variation. J. Hydrol. 2020, 586, 124864. [Google Scholar] [CrossRef] [Scilit]
  37. Liu, H.; Lei, T.W.; Zhao, J.; Yuan, C.P.; Fan, Y.T.; Qu, L.Q. Effects of rainfall intensity and antecedent soil water content on soil infiltrability under rainfall conditions using the run off-on-out method. J. Hydrol. 2011, 396, 24–32. [Google Scholar] [CrossRef] [Scilit]
  38. He, Z.; Zhao, W.; Liu, H.; Chang, X. The response of soil moisture to rainfall event size in subalpine grassland and meadows in a semi-arid mountain range: A case study in northwestern China’s Qilian Mountains. J. Hydrol. 2012, 420–421, 183–190. [Google Scholar] [CrossRef] [Scilit]
  39. Zhu, Q.; Nie, X.; Zhou, X.; Liao, K.; Li, H. Soil moisture response to rainfall at different topographic positions along a mixed land-use hillslope. Catena 2014, 119, 61–70. [Google Scholar] [CrossRef] [Scilit]
  40. McCord, J.T.; Stephens, D.B.; Wilson, J.L. Hysteresis and state-dependent anisotropy in modeling unsaturated hillslope hydrologic processes. Water Resour. Res. 1991, 27, 1501–1518. [Google Scholar] [CrossRef] [Scilit]
  41. McCord, J.T.; Stephens, D.B. Lateral moisture flow beneath a sandy hillslope without an apparent impeding layer. Hydrol. Process. 1987, 1, 225–238. [Google Scholar] [CrossRef] [Scilit]
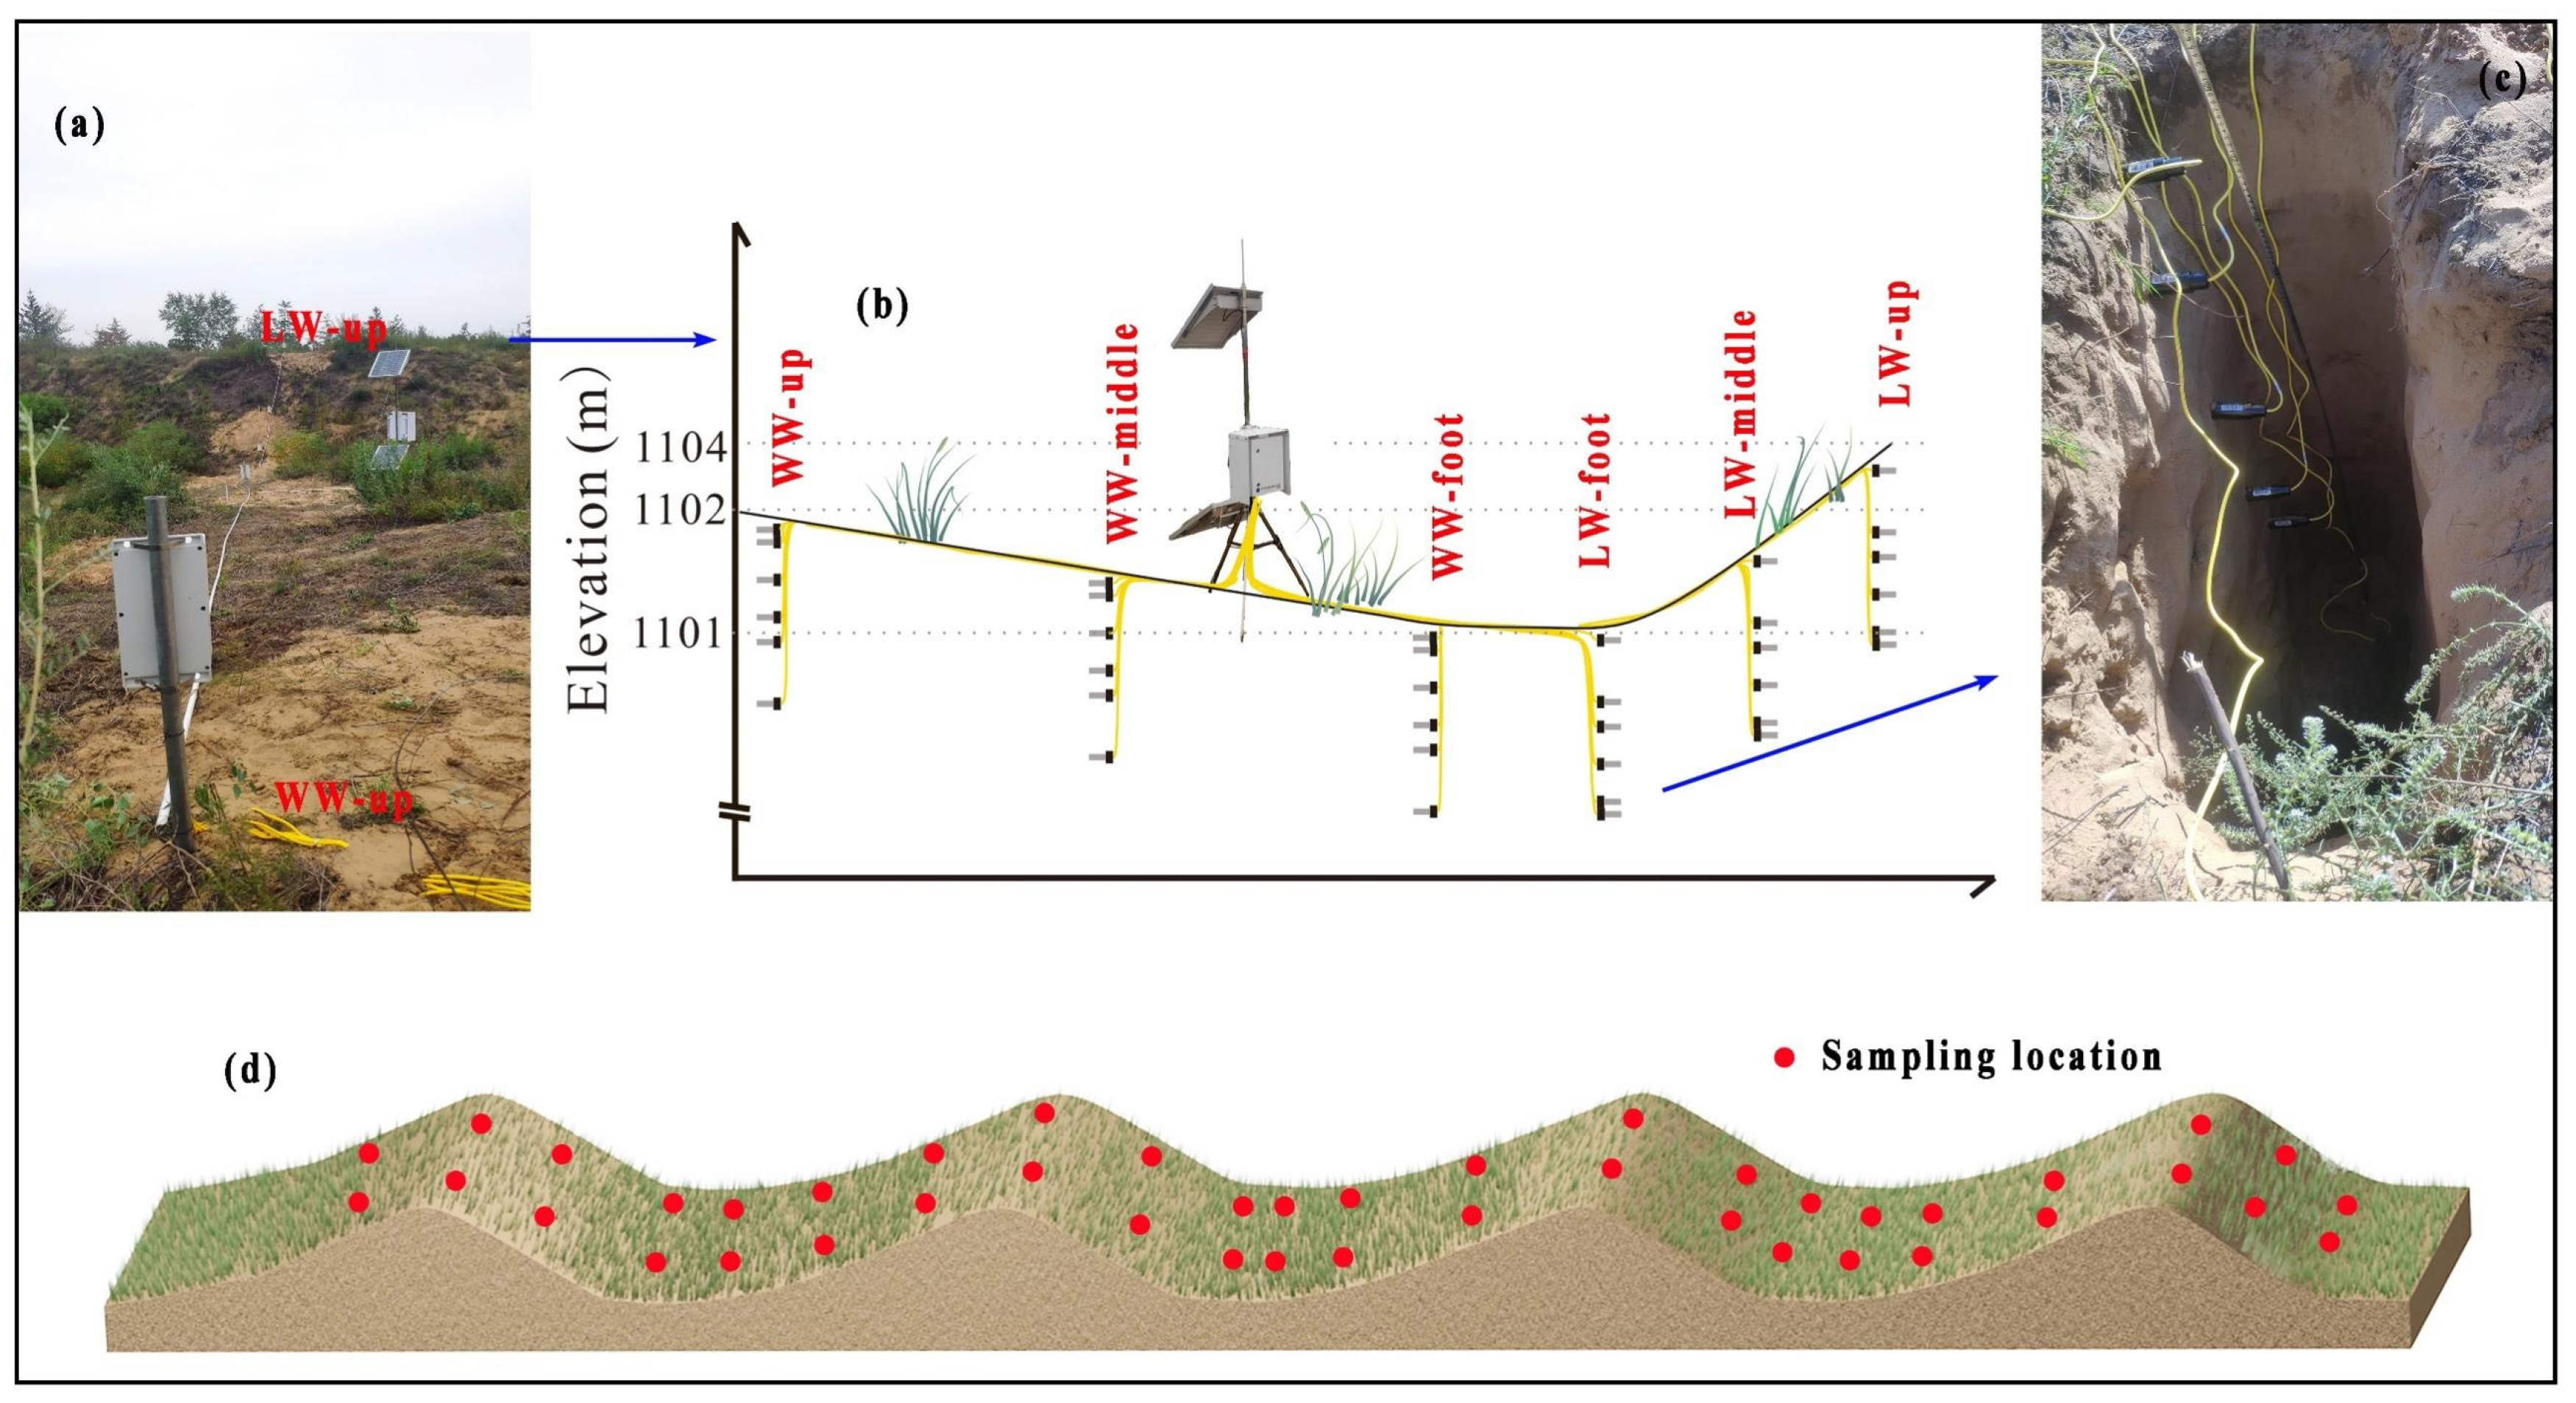
Figure 1. Overview of the soil moisture monitoring design. (ac) illustrate the in situ automatic monitoring stations installed across windward and leeward slopes in the Hongshixia Sand Botanical Garden. (d) shows the layout of manual sampling transects established in fixed dunes near Xiaojihan Town. WW-up, windward upslope; WW-middle, windward midslope; WW-foot, windward footslope; LW-up, leeward upslope; LW-middle, leeward midslope; and LW-foot, leeward footslope. These abbreviations are used consistently in all subsequent figures and tables.
Agronomy 16 00692 g001
Figure 2. Schematic representation of rainfall-induced soil moisture responses, illustrating initial moisture content (θinit), maximum moisture content (θmax), soil moisture increase (Δθ).
Agronomy 16 00692 g002
Figure 3. Daily precipitation together with corresponding daily volumetric soil water content (% vol) on the windward and leeward slopes.
Agronomy 16 00692 g003
Figure 4. Changes in soil moisture at different positions and depths of windward and leeward slopes during dry period and wet period: (a) Dry period; (b) Wet period.
Agronomy 16 00692 g004
Figure 5. Ridgeline plots of soil water content at different slope positions and depths on the windward and leeward slopes during the dry and wet periods: (a) Dry period; (b) Wet period. SWC, soil water content.
Agronomy 16 00692 g005
Figure 6. Relationships between average soil water content and variability indices across fixed sand dunes in the Xiaojihan sand dune landscape: (a) relationship between average soil water content and standard deviation (SD); (b) relationship between average soil water content and coefficient of variation (CV).
Agronomy 16 00692 g006
Figure 7. Response of soil water content at different slope positions to rainfall event 1: (ac) precipitation during the event; (d) WW-up; (e) WW-middle; (f) WW-foot; (g) LW-up; (h) LW-middle; and (i) LW-foot. SWC, soil water content.
Agronomy 16 00692 g007
Figure 8. Response of soil water content at different slope positions to rainfall event 2: (ac) precipitation during the event; (d) WW-up; (e) WW-middle; (f) WW-foot; (g) LW-up; (h) LW-middle; and (i) LW-foot. SWC, soil water content.
Agronomy 16 00692 g008
Figure 9. Response of soil water content at different slope positions to rainfall event 3: (ac) precipitation during the event; (d) WW-up; (e) WW-middle; (f) WW-foot; (g) LW-up; (h) LW-middle; and (i) LW-foot. SWC, soil water content.
Agronomy 16 00692 g009
Figure 10. Response indexes of soil moisture to specific rainfall events under different slope positions and soil depths: (a) Event 1; (b) Event 2; and (c) Event 3. In each panel, the first point indicates the lag time of the initial response of soil moisture after the start of rainfall, and the second point indicates the time when soil moisture reaches the peak value. The line connecting these two points indicates the lag time to reach the peak moisture. The colors of the dots represent the initial soil moisture content and the peak soil moisture content, respectively.
Agronomy 16 00692 g010
Figure 11. Vertical patterns of soil moisture increment in all rainfall events. The value above the box chart indicates the minimum rainfall amount necessary to initiate soil moisture responses at each depth, and values in brackets indicates the mean antecedent soil water content.
Agronomy 16 00692 g011
Figure 12. The relationship between precipitation and maximum change in soil profile water storage. Colored symbols represent observations from different slope positions, and the fitted lines in matching colors indicate the corresponding linear relationships. ** indicates significance at p < 0.01.
Agronomy 16 00692 g012
Table 1. Soil’s physical properties.
PositionParticle Size Distribution (%)Bulk Density
(g/cm3)
<0.002 mm0.002~0.02 mm>0.02 mm
WW-up00.1699.841.56
WW-middle00.3599.651.54
WW-foot00.1799.831.55
LW-up00.0399.971.58
LW-middle00.3199.691.58
LW-foot00.0599.951.6
Table 2. Characteristics of representative rainfall events.
Rainfall EventDateAmount (mm)Duration (min)10 min Intensity (mm)
MaxMinAverage
Event 12 July 202245.29007.20.20.5
Event 211 July 202258.65502.40.21.07
Event 310 November 202238.414305.60.20.027
Table 3. Descriptive statistics of volumetric soil moisture at different depths for six monitoring sites on windward and leeward slopes.
Depth (cm)Min (% vol)Max (% vol)Average (% vol)SDCV (%)Min (% vol)Max (% vol)Average (% vol)SDCV (%)
WW-upLW-up
101.4511.644.632.4252.382.6510.564.351.2528.61
201.0212.054.482.3652.632.6110.424.791.6133.66
502.0512.844.572.0745.382.6111.004.851.3327.47
1002.3112.054.351.8241.762.618.784.050.9623.66
1501.6910.754.572.4754.022.627.993.470.8123.20
WW-middleLW-middle
101.6314.645.713.2456.782.6111.954.761.7236.1
202.2610.414.47244.82.6210.095.211.4627.94
502.611.175.232.1541.112.612.286.041.9432.16
1002.4611.355.172.4447.182.6112.324.671.4430.92
1502.258.893.81.5841.552.68.623.721.2934.64
WW-footLW-foot
102.2814.396.523.1848.792.6412.285.622.5244.8
201.889.834.311.6137.392.466.623.370.6820.09
501.048.13.61.6144.752.610.594.111.1728.5
1003.3713.16.841.927.843.029.955.031.2524.85
1504.6110.376.441.320.154.199.476.011.4123.39
Table 4. Relationships between maximum soil moisture increase (Δθ) and total rainfall (P), maximum rainfall intensity (imax), mean rainfall intensity (imean), and initial soil moisture content (θinit) across different slope positions and soil depths.
LocationDepth (cm)nPimaximeanθinit
WW-up10450.576 **0.460 **0.099−0.127
20450.808 **0.380 *0.373−0.302
50450.870 **0.0950.204−0.403
WW-middle10450.704 **0.424 *0.394 *−0.277
20450.8490.3450.12−0.515
50450.757 *0.5330.907 **−0.665
WW-foot10450.577 **0.471 **0.138−0.568 **
20450.755 **−0.1280.2840.131
50450.7780.0240.282−0.708
LW-up10450.556 **−0.1630.180.122
20450.742 **0.160.307−0.249
50450.871 **0.3070.292−0.555 *
LW-middle10450.546 **0.1810.571 **−0.079
20450.711 **−0.398−0.115−0.237
50450.743 **−0.1090.403−0.444
LW-foot10450.660 **0.622 **0.377 *−0.475 **
20450.933 **0.0650.204−0.185
50450.833−0.2070.042−0.311
Notes: n is the number of rainfall events included in the Pearson correlation analysis. A total of 45 rainfall events that produced measurable soil moisture responses were analyzed. * and ** indicate significance at p < 0.05 and p < 0.01, respectively.
Disclaimer/Publisher’s Note: The statements, opinions and data contained in all publications are solely those of the individual author(s) and contributor(s) and not of MDPI and/or the editor(s). MDPI and/or the editor(s) disclaim responsibility for any injury to people or property resulting from any ideas, methods, instructions or products referred to in the content.