Article

Development of High-Yield Forage Agrocenoses for Sustainable Livestock Production in Northern Kazakhstan

1
Agrotechnological Faculty, M. Kozybayev North Kazakhstan University, Petropavl 150000, Kazakhstan
2
Institute of Agrotechnology, Zhangir Khan West Kazakhstan Agrarian-Technical University, Uralsk 090000, Kazakhstan
3
Faculty of Engineering, Urgench State University Named After Abu Rayhon Beruni Kharezm, Urgench 220100, Uzbekistan
*
Author to whom correspondence should be addressed.
Agronomy 2026, 16(6), 620; https://doi.org/10.3390/agronomy16060620
Submission received: 29 January 2026 / Revised: 19 February 2026 / Accepted: 10 March 2026 / Published: 14 March 2026
(This article belongs to the Section Grassland and Pasture Science)

Abstract

Low forage productivity of natural grasslands remains a major limitation for sustainable livestock production in the forest–steppe zone of Northern Kazakhstan, highlighting the need for high-yield, locally adapted forage systems. This study evaluated nine forage agrophytocenoses, including perennial grasses and legume–grass mixtures, established in 2024 and assessed over two growing seasons on leached chernozem soils. Plant height, stand density, and biomass yields were quantified at optimal harvest stages, with statistical differences tested using one-way ANOVA and Tukey’s HSD (p < 0.05). Legume-containing agrophytocenoses consistently outperformed natural grass cover and grass monocultures in canopy development and biomass accumulation. The highest productivity was achieved in Lolium multiflorum + Medicago sativa (I+A), Medicago sativa + Festuca arundinacea (A+TF), and Onobrychis viciifolia + Festulolium + Phleum pratense (S+F+T), reaching up to ~19.66 t ha−1 green biomass and ~5.24 t ha−1 dry matter. In contrast, Agropyron cristatum monoculture yielded minimally during establishment, while ryegrass mixtures with annuals declined in the second year. Optimized legume–grass agrophytocenoses represent the most productive and agronomically reliable strategy to enhance forage supply and improve environmental resilience in Northern Kazakhstan.

1. Introduction

Ensuring a stable supply of high-quality forage is fundamental for sustainable livestock production, yet this remains a persistent challenge across many regions of the world, including Kazakhstan. Globally, livestock systems face increasing pressure from land degradation, climatic variability, and rising feed demand, which together threaten food security and rural livelihoods [1,2,3]. These challenges are particularly acute in arid and semi-arid environments, where rising temperatures and irregular precipitation patterns contribute to reduced pasture productivity, accelerated soil erosion, and declining rangeland resilience.
Northern Kazakhstan’s forest-steppe zone plays a pivotal role in the nation’s agriculture, where livestock farming contributes significantly to food security and economic stability. With vast pastures spanning millions of hectares, the region supports a growing herd, but faces constraints from limited crop diversity and environmental pressures. Kazakhstan has a long tradition of pastoral livestock farming, but economically efficient livestock production is impossible without the use of high-quality forage crops that provide balanced nutrition and ensure rational use of land resources [4,5,6]. One of the main challenges in modern animal husbandry in Northern Kazakhstan is therefore ensuring an uninterrupted and sustainable supply of sufficient forage [7]. This issue is especially acute in the forest–steppe zone of Northern Kazakhstan, where natural pastures have very low productivity, often yielding as little as 0.1–0.2 tons of dry biomass per hectare [8,9]. Over decades, these native grasslands have suffered serious degradation due to overgrazing, disruption of pasture rotations, and unregulated grazing during critical regrowth periods, leading to a sharp decline in their carrying capacity [7,10,11,12,13]. In addition, the limited availability of high-yielding, locally adapted forage cultivars and the poor resilience of many traditional forage species to drought and other stresses further constrain the improvement of the feed base in this region. Developing a more productive and sustainable forage base has thus become an urgent priority for supporting Northern Kazakhstan’s growing livestock sector [14,15].
One promising solution is the creation of forage agrocenoses, or artificially constructed plant communities, that combine perennial and annual forage species with high productivity and complementary ecological functions [16]. Mixed cropping systems involving legumes and grasses are known to improve both herbage yield and nutritional value by enhancing nitrogen cycling and resource use efficiency [17,18,19]. Legume components such as alfalfa (Medicago sativa) and sainfoin (Onobrychis viciifolia) contribute to biological nitrogen fixation, enriching soil fertility and reducing dependence on mineral fertilizers, while grasses such as ryegrass (Lolium spp.), brome (Bromus inermis), and Sudan grass (Sorghum sudanense) provide high biomass and structural carbohydrates. Together, such combinations form more stable and productive communities that are better adapted to environmental fluctuations than monocultures [20,21]. Numerous studies worldwide have confirmed the potential of these mixed agrocenoses to increase forage output while improving soil structure, biodiversity, and carbon sequestration [22,23,24,25].
This study postulates that the development of agrophytocenoses comprising highly productive perennial and annual forage species represents a robust and sustainable strategy for enhancing the livestock forage base in Northern Kazakhstan. Building upon our prior research on optimizing crop productivity within ‘green conveyor’ systems under regional climatic instability [7], the present work advances a conceptual framework for the year-round provision of succulent and bulky fodder. The synergistic integration of two distinct technologies aims to mitigate production risks: while the green conveyor ensures a continuous supply of fresh biomass during the vegetative period (early May to late October), the establishment of perennial agrophytocenoses facilitates the accumulation of high-quality winter stores (utilizable from November through April). Furthermore, agrophytocenoses structured around the interspecific complementarity of grasses and legumes—leveraging diverse growth habits, phenological stages, and nutritional profiles—offer a resilient model for forage production [26,27]. These self-regulating communities are capable of maintaining high biomass yields and ecological persistence without the need for intensive, calendar-based management [28,29,30]. Consequently, the evaluation of these multi-component systems serves as a logical progression toward achieving temporal continuity in regional forage security.
This study is novel in that it integrates multiple perennial and annual forage species into a unified agrophytocenosis specifically tailored to the soil–climatic conditions of Northern Kazakhstan’s forest–steppe zone. The scientific novelty lies in the introduction and assessment of previously untested or underutilized forage crop combinations, providing new insights into the productivity, nutritive value, and interspecific interactions within mixed-species forage systems. The findings have substantial practical value, offering evidence-based recommendations for creating high-yield forage stands that can reduce dependence on external feed inputs and improve the self-sufficiency of livestock enterprises. Equally important, the approach prioritizes ecological sustainability: by incorporating nitrogen-fixing legumes such as Medicago sativa L. and Onobrychis viciifolia Scop. with perennial grasses, it naturally enhances soil fertility, improves ground cover, and alleviates grazing pressure on natural pastures. Thus, the development of these diverse, high-performing forage agrophytocenoses contributes simultaneously to improved livestock productivity and long-term environmental resilience in the forest–steppe ecosystem of Northern Kazakhstan.

2. Materials and Methods

2.1. Field Site and Experimental Design

The field experiment was established and conducted in 2024–2025 at the research plots of “Service-Zhars” LLP, located within the forest–steppe zone of Northern Kazakhstan. The study site represents a typical agricultural landscape situated 37 km south of Petropavl (geographical coordinates: 54°41′36″ N, 69°14′05″ E) (Figure 1). The region is characterized by a moderately continental climate with pronounced interannual variability in moisture availability and is considered representative of the environmental conditions under which forage crops are cultivated in Northern Kazakhstan. The soils at the site are classified as leached chernozems with medium levels of nutrient supply (key agrochemical properties are presented below).
The experimental layout included nine types of forage agrocenoses comprising perennial grasses and their mixed cropping combinations, established on a total area of 825 m2 (0.0825 ha). The field is bordered by natural birch groves, which create localized microclimatic effects influencing soil moisture distribution and wind regimes. Each plot measured 3 m in width and 30 m in length.
To ensure reproducibility and statistical robustness, all treatments were arranged in three replications. Standardized field-experiment procedures were followed, including uniform seeding rates, consistent agronomic management, and identical technological operations across treatments. The collected data were used to evaluate the productivity of individual species and forage mixtures, as well as their adaptability to local soil and climatic conditions.

2.2. Studied Crops

The selection of forage crop species and mixtures was based on the long-term agronomic research experience in the region and on the adaptive potential of these species under local edaphoclimatic conditions. The experiment included the most promising and ecologically plastic perennial and annual forage species capable of producing high biomass yields in the forest–steppe zone of Northern Kazakhstan. All sowing treatments were established in spring 2024 and evaluated both in the year of establishment and during the second year of stand development. The list of studied agrocenoses, along with sowing and harvesting dates, is presented in Table 1.
The species were chosen for their high productivity, tolerance to drought and cold, and capacity to form persistent and balanced swards. The inclusion of legume components was specifically intended to enhance soil nitrogen through biological fixation, thereby promoting stand nutrition and long-term sustainability. This selection enabled an evaluation of the most promising and environmentally resilient forage options for the region.

2.3. Agronomic Practices and Sowing Procedure

The establishment of the field experiment aimed at forming hay and pasture agrocenoses from pure and mixed stands of annual and perennial forage crops was carried out in strict accordance with the methodological guidelines developed for the forest–steppe zone of Northern Kazakhstan. The overall objective of the agronomic operations was to create an optimal agrophysical soil environment and a uniform seedbed that would ensure synchronized germination, vigorous initial growth, and the long-term persistence of perennial forage species.
The experimental design and management practices followed the recommendations of the Methodology for Conducting Experiments on Hayfields and Pastures [31], the Methodology of Field Experiments [32], and Methods for the Evaluation of Forage Legumes, Grasses and Fodder Trees for Use as Livestock Feed [33]. Adherence to these standardized protocols ensured methodological consistency, reproducibility, and comparability with previous agronomic studies conducted in similar environments.
Sowing of perennial forage crops was conducted in spring 2024 on arable soils. Sudan grass cultivated for hay served as the preceding crop across all treatments. After its removal, primary tillage was performed using a PLN-3-35 (Krasnyi Aksai, Rostov-on-Don, Russia) moldboard plow aggregated with an MTZ-82-1 (Minsk Tractor Works, Minsk, Belarus) tractor to a depth of 23–25 cm. Deep plowing effectively eliminated compacted layers, incorporated crop residues, improved aeration, and facilitated moisture accumulation within the soil profile.
In the sowing year, early season operations included moisture retention using a heavy tooth harrow (BZTS-1, Krasnyi Aksai, Rostov-on-Don, Russia) in two passes: the first in late April and the second in early May. This practice helped break the post-thaw soil crust, suppress filament-stage weeds, and improve surface leveling after primary tillage.
Pre-sowing cultivation was carried out with a 1-GKN (Krasny Oktyabr Machine-Building Plant, Kirov, Russia) rotary tiller to a depth of 10–12 cm, resulting in a homogeneous and well-prepared seedbed. Rotary tillage enhanced soil friability, ensured proper seed–soil contact, and provided additional mechanical weed control.
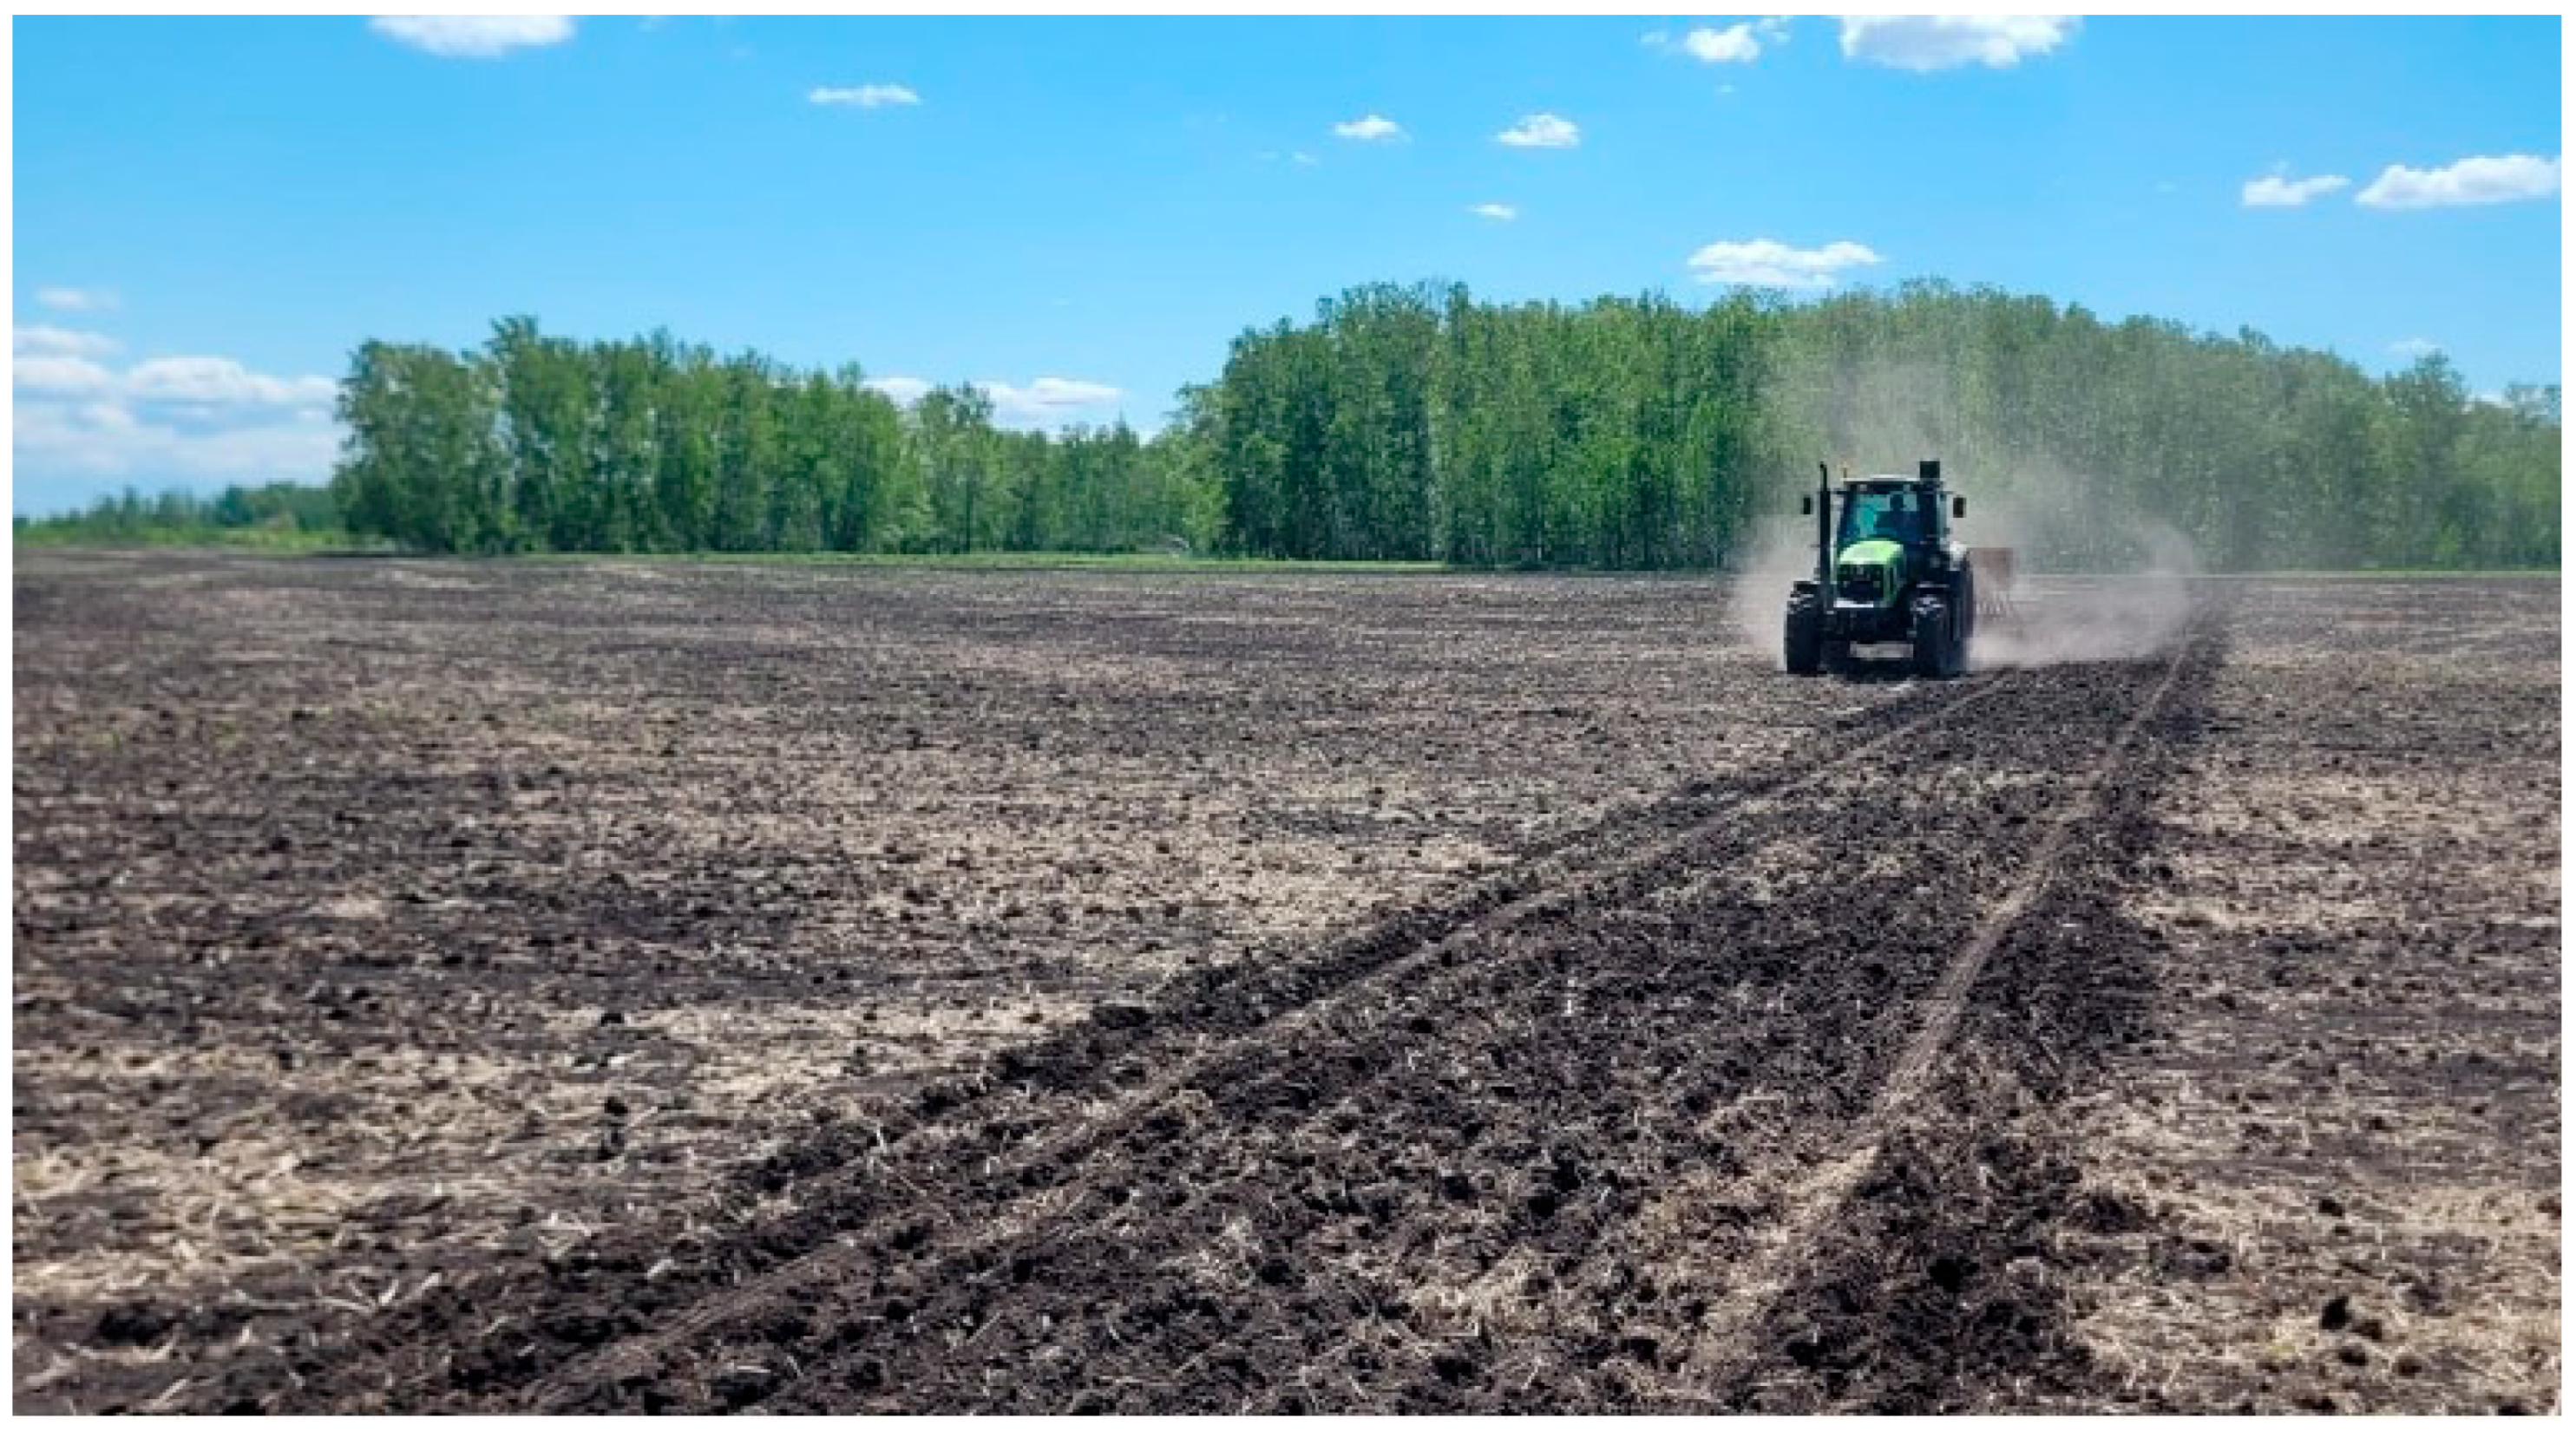
Sowing was conducted on 21 May using a disk seeder (Haybaster 107C, DuraTech Industries, Jamestown, ND, USA) equipped with a partially implemented seed miss-prevention system [34]. The seeding depth for all forage species was maintained at 2–3 cm, except for sainfoin, which was sown deeper (4–5 cm) to ensure adequate moisture contact. Seeding rates for monocultures were 20 kg ha−1 for Bromus inermis and 12 kg ha−1 for Agropyron cristatum L. For mixed stands, seeding rates were optimized to provide balanced interspecific competition and favorable growth for all components, and were as follows: (Onobrychis viciifolia Scop.) + (Agropyron cristatum L.) (50 + 10 kg ha−1), (Lolium multiflorum Lam.) + (Medicago sativa L.) (12 + 12 kg ha−1), (Lolium multiflorum Lam.) + (Lolium annuum Lam.) (12 + 28 kg ha−1), Medicago sativa L.+ Festuca arundinacea Schreb. (12 + 18 kg ha−1), Onobrychis viciifolia Scop + (×Festulolium (Festuca × Lolium)) + Phleum pratense L. (58 + 6 + 2 kg ha−1), and (Lolium perenne L.) + Festuca arundinacea Schreb. + Dactylis glomerata L. (12 + 18 + 10 kg ha−1). Figure 2 shows the sowing of experimental variants.

2.4. Meteorological Observations

Meteorological conditions during the experimental period were characterized using data from the nearest certified meteorological station of Kazhydromet, located within 10 km of the study site. Weather parameters included monthly mean air temperature and precipitation totals. Aggregated data by month and decade are provided in Supplementary Table S1.

2.5. Soil Chemical and Analytical Assessments

Soil sampling was carried out using an adaptive GPS–guided grid to ensure even spatial coverage across the entire experimental field. Samples were collected from the plough layer (0–30 cm), which represents the standard diagnostic depth for assessing the agrochemical status of soils in field experiments. A total of five composite samples were prepared, each consisting of several individual cores (Supplementary Figure S1), providing representative coverage of the study area.
The laboratory analyses were conducted at the accredited laboratory Agro Test using standard and widely recognized procedures commonly applied in agronomic and soil science research. Nitrate nitrogen (NO3–N) was quantified photometrically following extraction with 1 M potassium chloride (KCl) [35].
Plant-available phosphorus and potassium were extracted using a modified Machigin method, followed by photometric determination for phosphorus and flame photometric detection for potassium [36]. Available sulfur was determined turbidimetrically after KCl extraction and precipitation of sulfate ions as barium sulfate [37,38]. Soil organic matter content was assessed through oxidation with a bichromate–sulfuric acid mixture followed by photometric detection, corresponding to the classical Tyurin and Walkley–Black approaches [39,40].
Soil pH, electrical conductivity (EC), and total dissolved solids (TDS) were measured in a soil–water suspension prepared at a ratio of 1:5, enabling assessment of salinity levels and overall solution mineralization [41].
To ensure the reliability and reproducibility of analytical results, internal quality control procedures were implemented. These included the use of control standards and repeated measurements of selected parameters within each analytical batch. This approach minimized methodological uncertainty and ensured a high degree of confidence in the accuracy and consistency of the obtained data.

2.6. Morphological Measurements and Yield Assessment

Biometric observations were conducted at key phenological stages to assess plant growth, stand structure, and biomass productivity. Plant height was measured immediately prior to cutting using a 1 m graduated ruler. Measurements were taken at 10 randomly selected points per plot, with three replications, and mean values were subsequently calculated. Stand density (tiller or stem density) was determined by counting all shoots within several fixed 0.25 m2 quadrats placed in each plot and converting the counts to plants per square meter. From these fixed quadrats within the agrophytocenoses, all plants were cut at ground level; the harvested biomass was tied into bundles and transported to the laboratory, where a manual species-level count of the grass mixture components was conducted. These measurements provided a quantitative estimate of plant density and offered insight into stand development and competitive interactions within mixed agrocenoses.
Green biomass yield was assessed using the direct-cut method on three sampling areas of 1 m2 each, systematically distributed within every plot. Harvesting was performed at the onset of heading in grasses and at the budding stage in legumes—the developmental phases corresponding to the optimal timing for forage harvesting—when plant height typically ranged between 50 and 70 cm depending on the treatment. Cutting was performed at a stubble height of 5–7 cm above the soil surface. Immediately after harvesting, all aboveground biomass from each sampling area was weighed to determine green (fresh) mass yield.
To determine dry matter content, a subsample of the combined green biomass was dried to constant weight at 65 °C in a forced-air drying oven (Shanghai Bluepard Instruments Co., Ltd., Shanghai, China), a temperature that prevents the loss of volatile nutrient compounds. Dry matter yield was calculated based on the difference between fresh and oven-dry weights. Final yield values were expressed in t ha−1 after converting data from the 1 m2 sampling area.
After the first cut in 2024, perennial stands were retained on the field to regrow naturally, and yields during the second year (2025) were recorded for a single cut taken in early summer. All biometric data collected throughout the study provided a comprehensive evaluation of the productivity, structural development, and adaptive performance of each forage agrocenosis.

2.7. Statistical Analysis

Descriptive statistics were calculated for all agronomic traits (plant density, plant height, green mass yield, and dry matter yield). The data are presented as the mean ± standard error (SE) when comparing differences between treatments to illustrate the precision of the mean, or as the mean ± standard deviation (SD) when characterizing the variability of the samples, as specified in the figure captions.
To evaluate differences among the nine agrophytocenosis variants within each year, a one-way analysis of variance (ANOVA) was conducted. Multiple comparisons of means were performed using Tukey’s Honest Significant Difference (HSD) test. Different letters in the figures indicate statistically significant differences between treatments at p < 0.05.
To analyze the effect of the cultivation year (2024 vs. 2025) on the performance of each specific agrophytocenosis, independent two-sample t-tests were applied. Significance levels are denoted as follows: p > 0.05 (ns, not significant), * p < 0.05, ** p < 0.01, and *** p < 0.001.
Statistical processing of the experimental data and visualization were performed using Python programming language (v3.13) with Pandas (v2.2.3), NumPy (v2.2), SciPy (v1.13), Statsmodels (v0.14), Matplotlib (v3.10), and Seaborn (v0.13.2) libraries.

3. Results and Discussion

3.1. Soil Physical and Chemical Properties

The soil of the experimental site is represented by leached chernozem formed under mixed forb–meadow vegetation. Soil chemical properties were determined in 2025 by the accredited laboratory Agro Test. Soil samples were collected from five points within the experimental field at a depth of 0–30 cm. A comparative characterization of the soil chemical composition is presented in Table 2.
The content of available forms of the main nutrients in the plough layer of the experimental field was characterized by the following mean values: available nitrogen—15.18 mg kg−1, available phosphorus—11.14 mg kg−1, available potassium—477 mg kg−1, and sulfur content—2.1 mg kg−1. The soil reaction ranged from pH 8.07 to 8.80, indicating moderately to strongly alkaline conditions. The average humus content was 7.44%.
An assessment of nutrient availability indicates that nitrogen is present at a low to medium level, which is typical for soils of the North Kazakhstan region. Such levels suggest a potential nitrogen deficit relative to the requirements for maximum crop productivity, particularly for cereals and perennial grasses. Phosphorus availability is also low, which is characteristic of chernozem and dark chestnut soils in the region, where a substantial portion of phosphorus is fixed in poorly soluble forms. In contrast, potassium is present at a high level, potentially contributing to enhanced plant tolerance to drought and low temperatures; this is a typical feature of loess-derived and clayey soils of North Kazakhstan. Sulfur content is deficient (2.1 mg kg−1), which could potentially influence nitrogen use efficiency and the dynamics of protein synthesis in plants.
The soil reaction is neutral to slightly alkaline, which is generally favorable for most agricultural crops. However, at pH values above 7.5, a decrease in the availability of phosphorus and certain micronutrients, such as zinc and manganese, may occur [42,43].

3.2. Weather Conditions

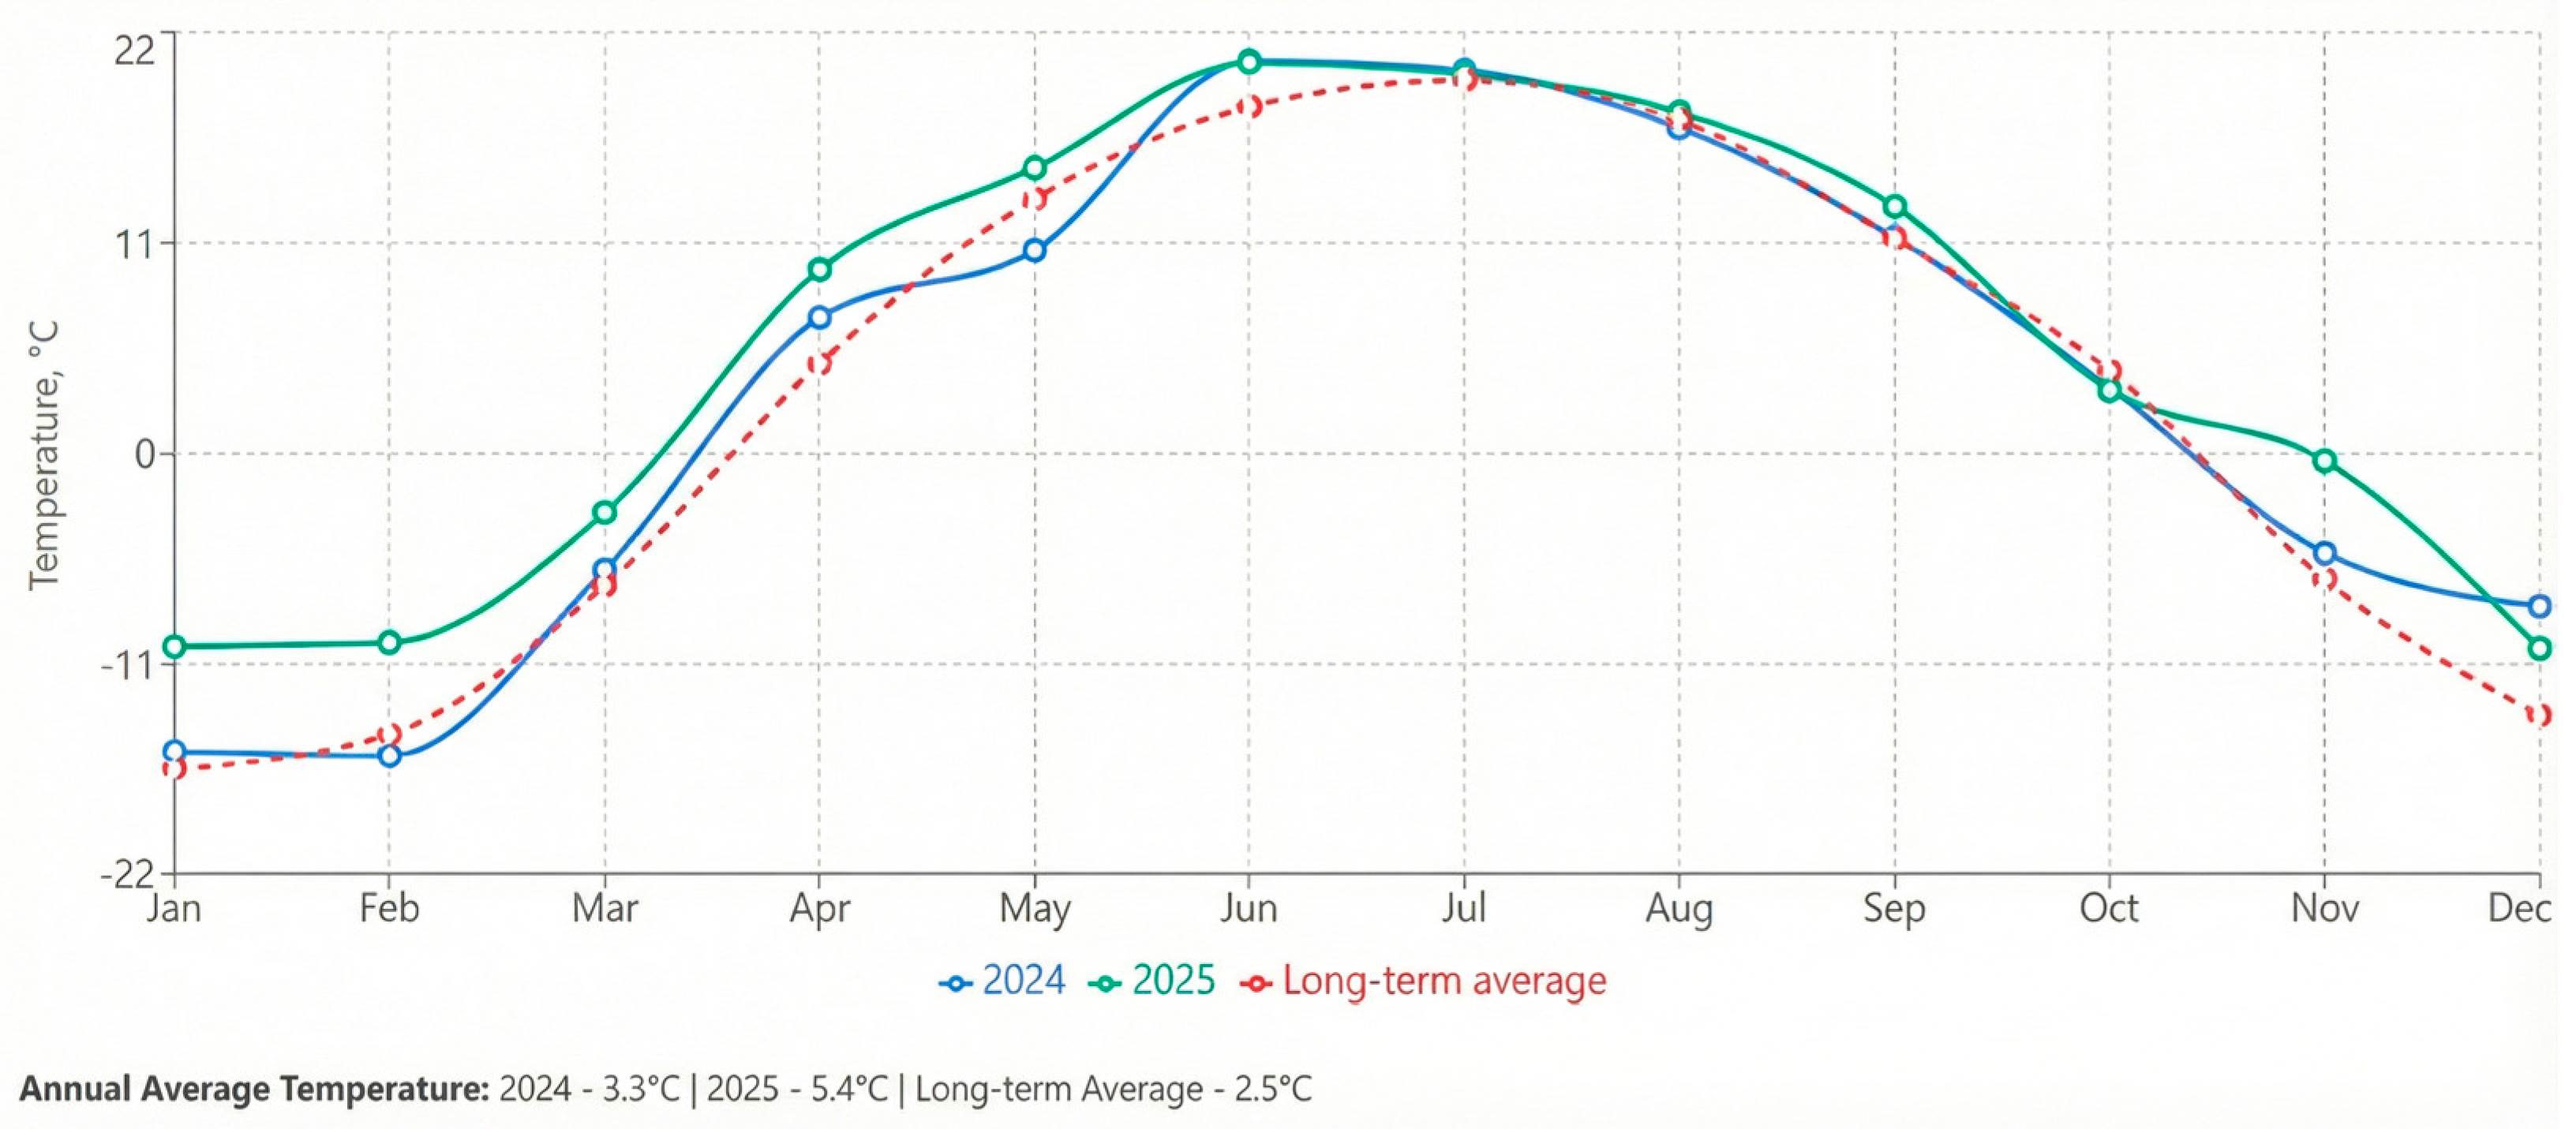
Air temperature was continuously monitored throughout the study period. The temperature data are presented in Supplementary Table S1 and illustrated in Figure 3.
During the winter period (January–February), temperatures in 2024 were close to the long-term climatic average, whereas 2025 was characterized by a noticeably warmer winter with temperatures exceeding the climatic norm. The most pronounced deviations were observed in January and February 2025, when mean monthly temperatures were consistently higher than the long-term average.
In spring (March–May), a gradual increase in air temperature was observed in both years. However, spring warming in 2025 occurred earlier and was more intensive, with temperatures in April and May exceeding both the values recorded in 2024 and the long-term average. In contrast, spring 2024 was characterized by a more moderate and delayed temperature increase.
The summer period (June–August) generally corresponded to long-term climatic conditions. In June 2024, the highest mean monthly temperatures were recorded, slightly exceeding the long-term average. July temperatures in both 2024 and 2025 were similar and close to the climatic norm, while in August 2025 a slight positive deviation from the long-term average was observed.
During the autumn period (September–November), 2025 exhibited a warmer temperature regime compared with 2024 and the long-term average, particularly in September. In October, temperatures in both years were close to the climatic norm. November 2024 was marked by a more pronounced temperature decline, whereas November 2025 remained relatively mild. In December, mean monthly temperatures in both years exceeded the long-term average.
Meteorological data indicate a generally warmer temperature regime in 2025 during the winter–spring and autumn periods, compared to the more contrasting annual temperature pattern of 2024. These differences may have influenced vegetation conditions and crop development in the region.
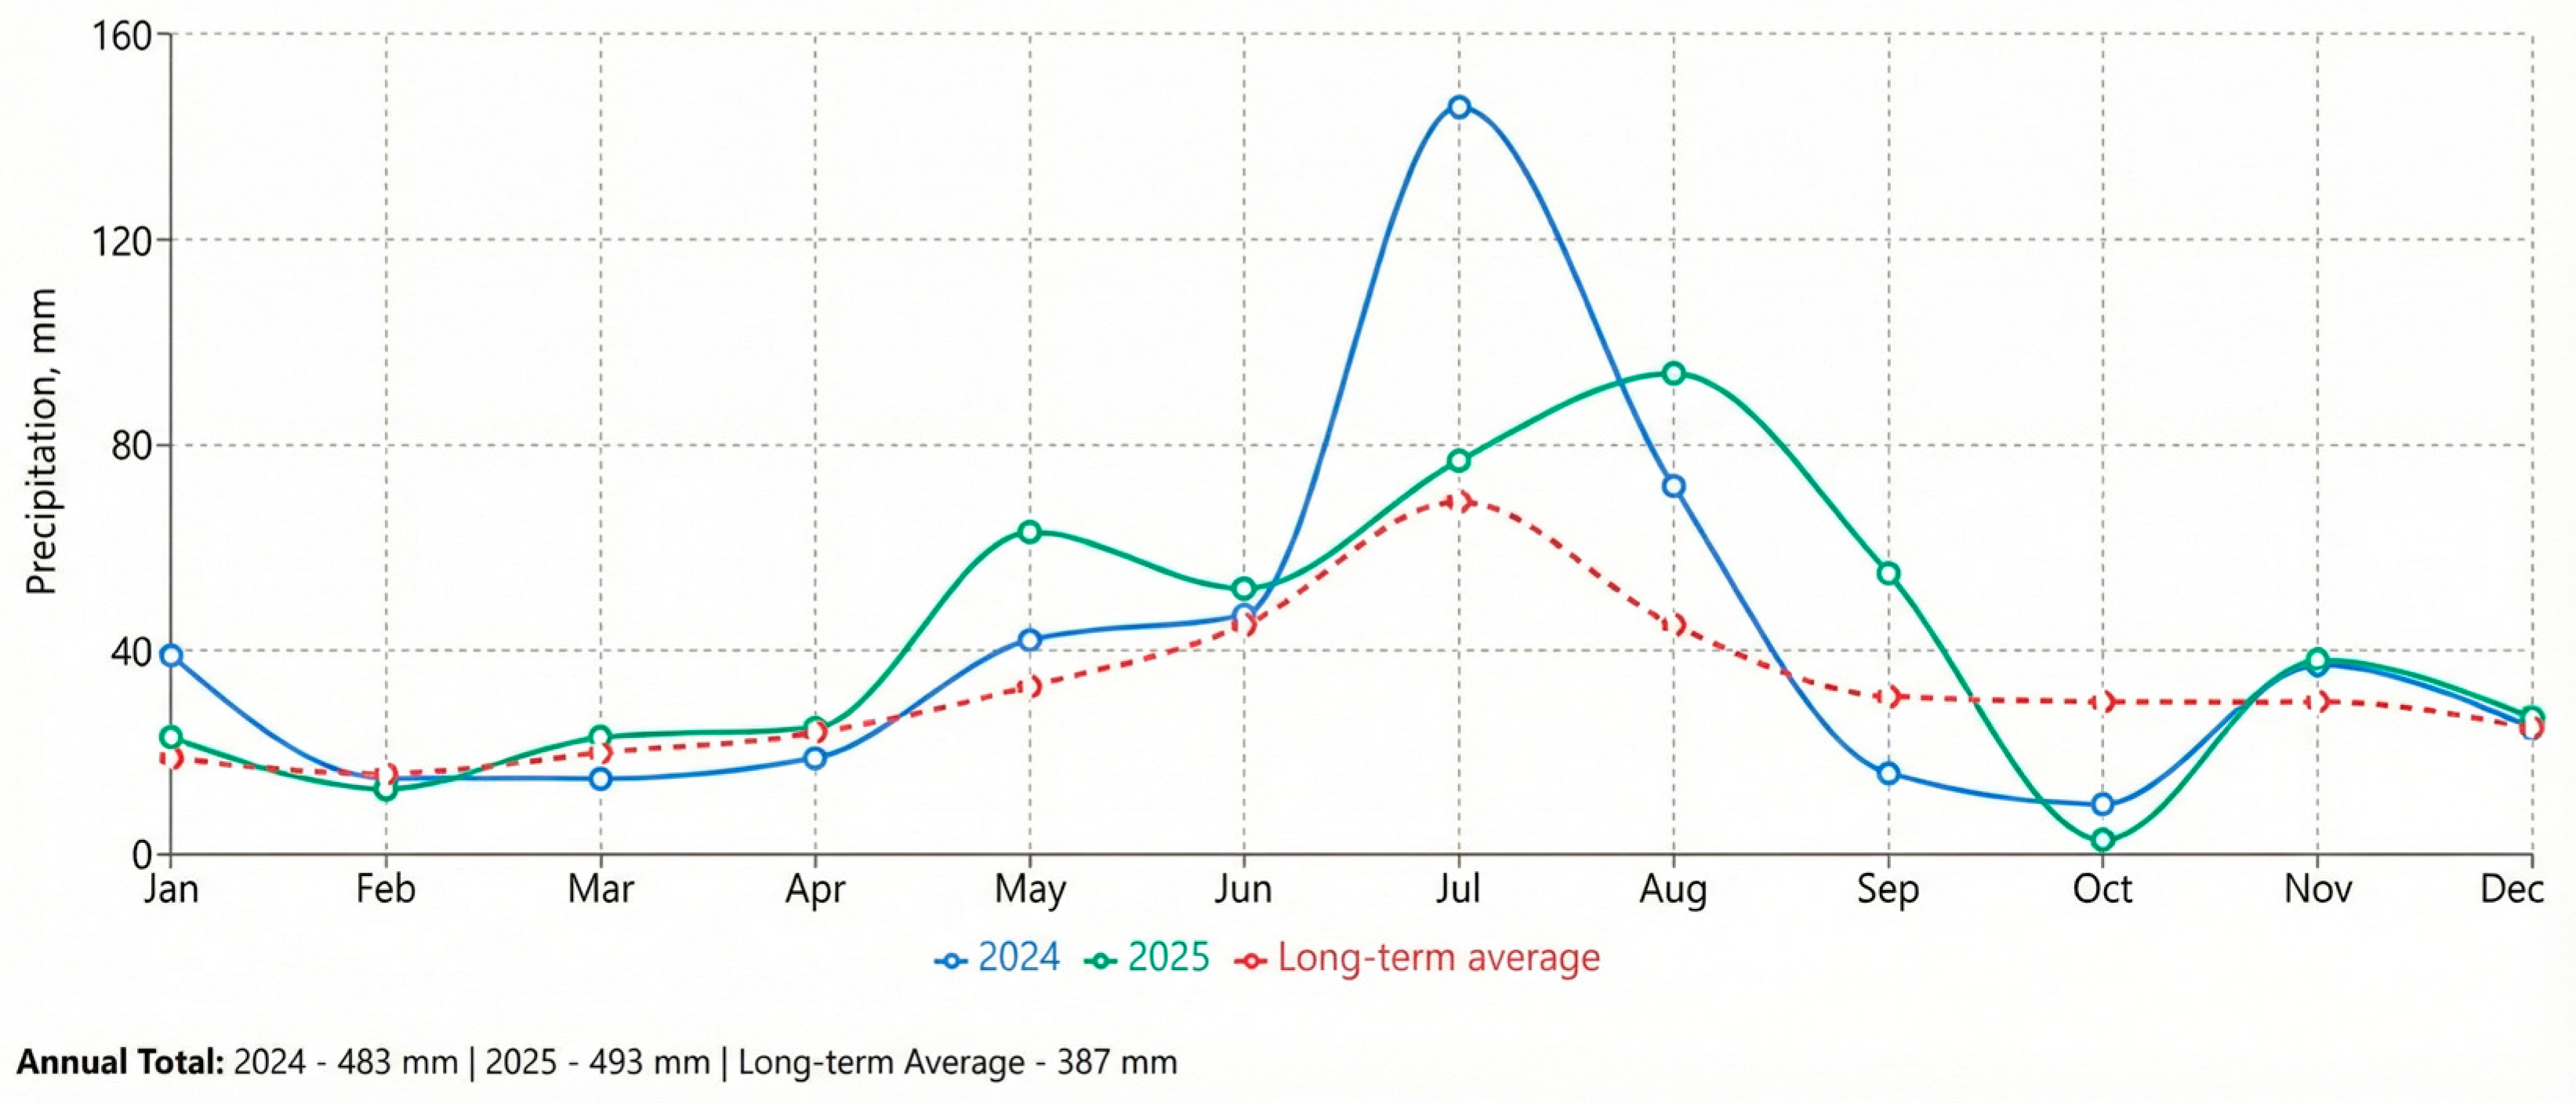
Precipitation was systematically recorded throughout the study period. The precipitation data are presented in Supplementary Table S1 and shown in Figure 4.
During the winter period (January–February) of 2024, precipitation amounts generally exceeded long-term averages, particularly in January, when 39 mm of precipitation was recorded compared with the climatic norm of 19 mm. In February 2024, precipitation was close to the long-term average. In contrast, winter 2025 was characterized by lower precipitation levels compared with 2024, with January and February values at or slightly below the climatic norm.
In spring (March–May) 2024, precipitation amounts were generally close to long-term averages, although slight deficits were observed in March and April. In May 2024, precipitation reached 42 mm, exceeding the long-term mean. Spring 2025 was notably wetter: precipitation in March and April exceeded long-term averages, and May showed a substantial surplus (63 mm compared with a long-term average of 33 mm), indicating favorable moisture conditions during the early stages of vegetation.
The summer period (June–August) in both years was characterized by increased moisture availability. In 2024, July was particularly notable, with 146 mm of precipitation—more than twice the long-term average—while August also exceeded average values. In 2025, summer precipitation was likewise elevated but more evenly distributed: June and July were close to or slightly above the climatic norm, whereas August showed a pronounced positive deviation.
During autumn (September–October), 2024 experienced a marked precipitation deficit, especially in September and October, when precipitation was significantly below long-term averages. In contrast, autumn 2025 was characterized by increased moisture availability, particularly in September (55 mm compared with a long-term average of 31 mm), although October 2025 showed a sharp precipitation deficit.
In 2024, precipitation was unevenly distributed with a pronounced summer maximum, whereas 2025 exhibited more uniform moisture conditions and frequent exceedance of long-term averages during the growing season. Total annual precipitation amounted to 483 mm in 2024 and 493 mm in 2025, compared with a long-term average of 387 mm, which may have had a substantial impact on crop growth and development.
Overall, the observed deviations in temperature and precipitation regimes between the two study years likely influenced crop growth dynamics and yield formation. The warmer winter–spring conditions and earlier thermal accumulation observed in 2025, together with more evenly distributed precipitation during the early and mid-vegetation periods, coincided with more favorable conditions for crop establishment and vegetative development. In contrast, the more contrasting temperature pattern and uneven precipitation distribution recorded in 2024, including periods of excessive summer rainfall and moisture deficits toward the end of the growing season, may have created less stable moisture and thermal conditions during key phenological stages.

3.3. Morphological Measurements

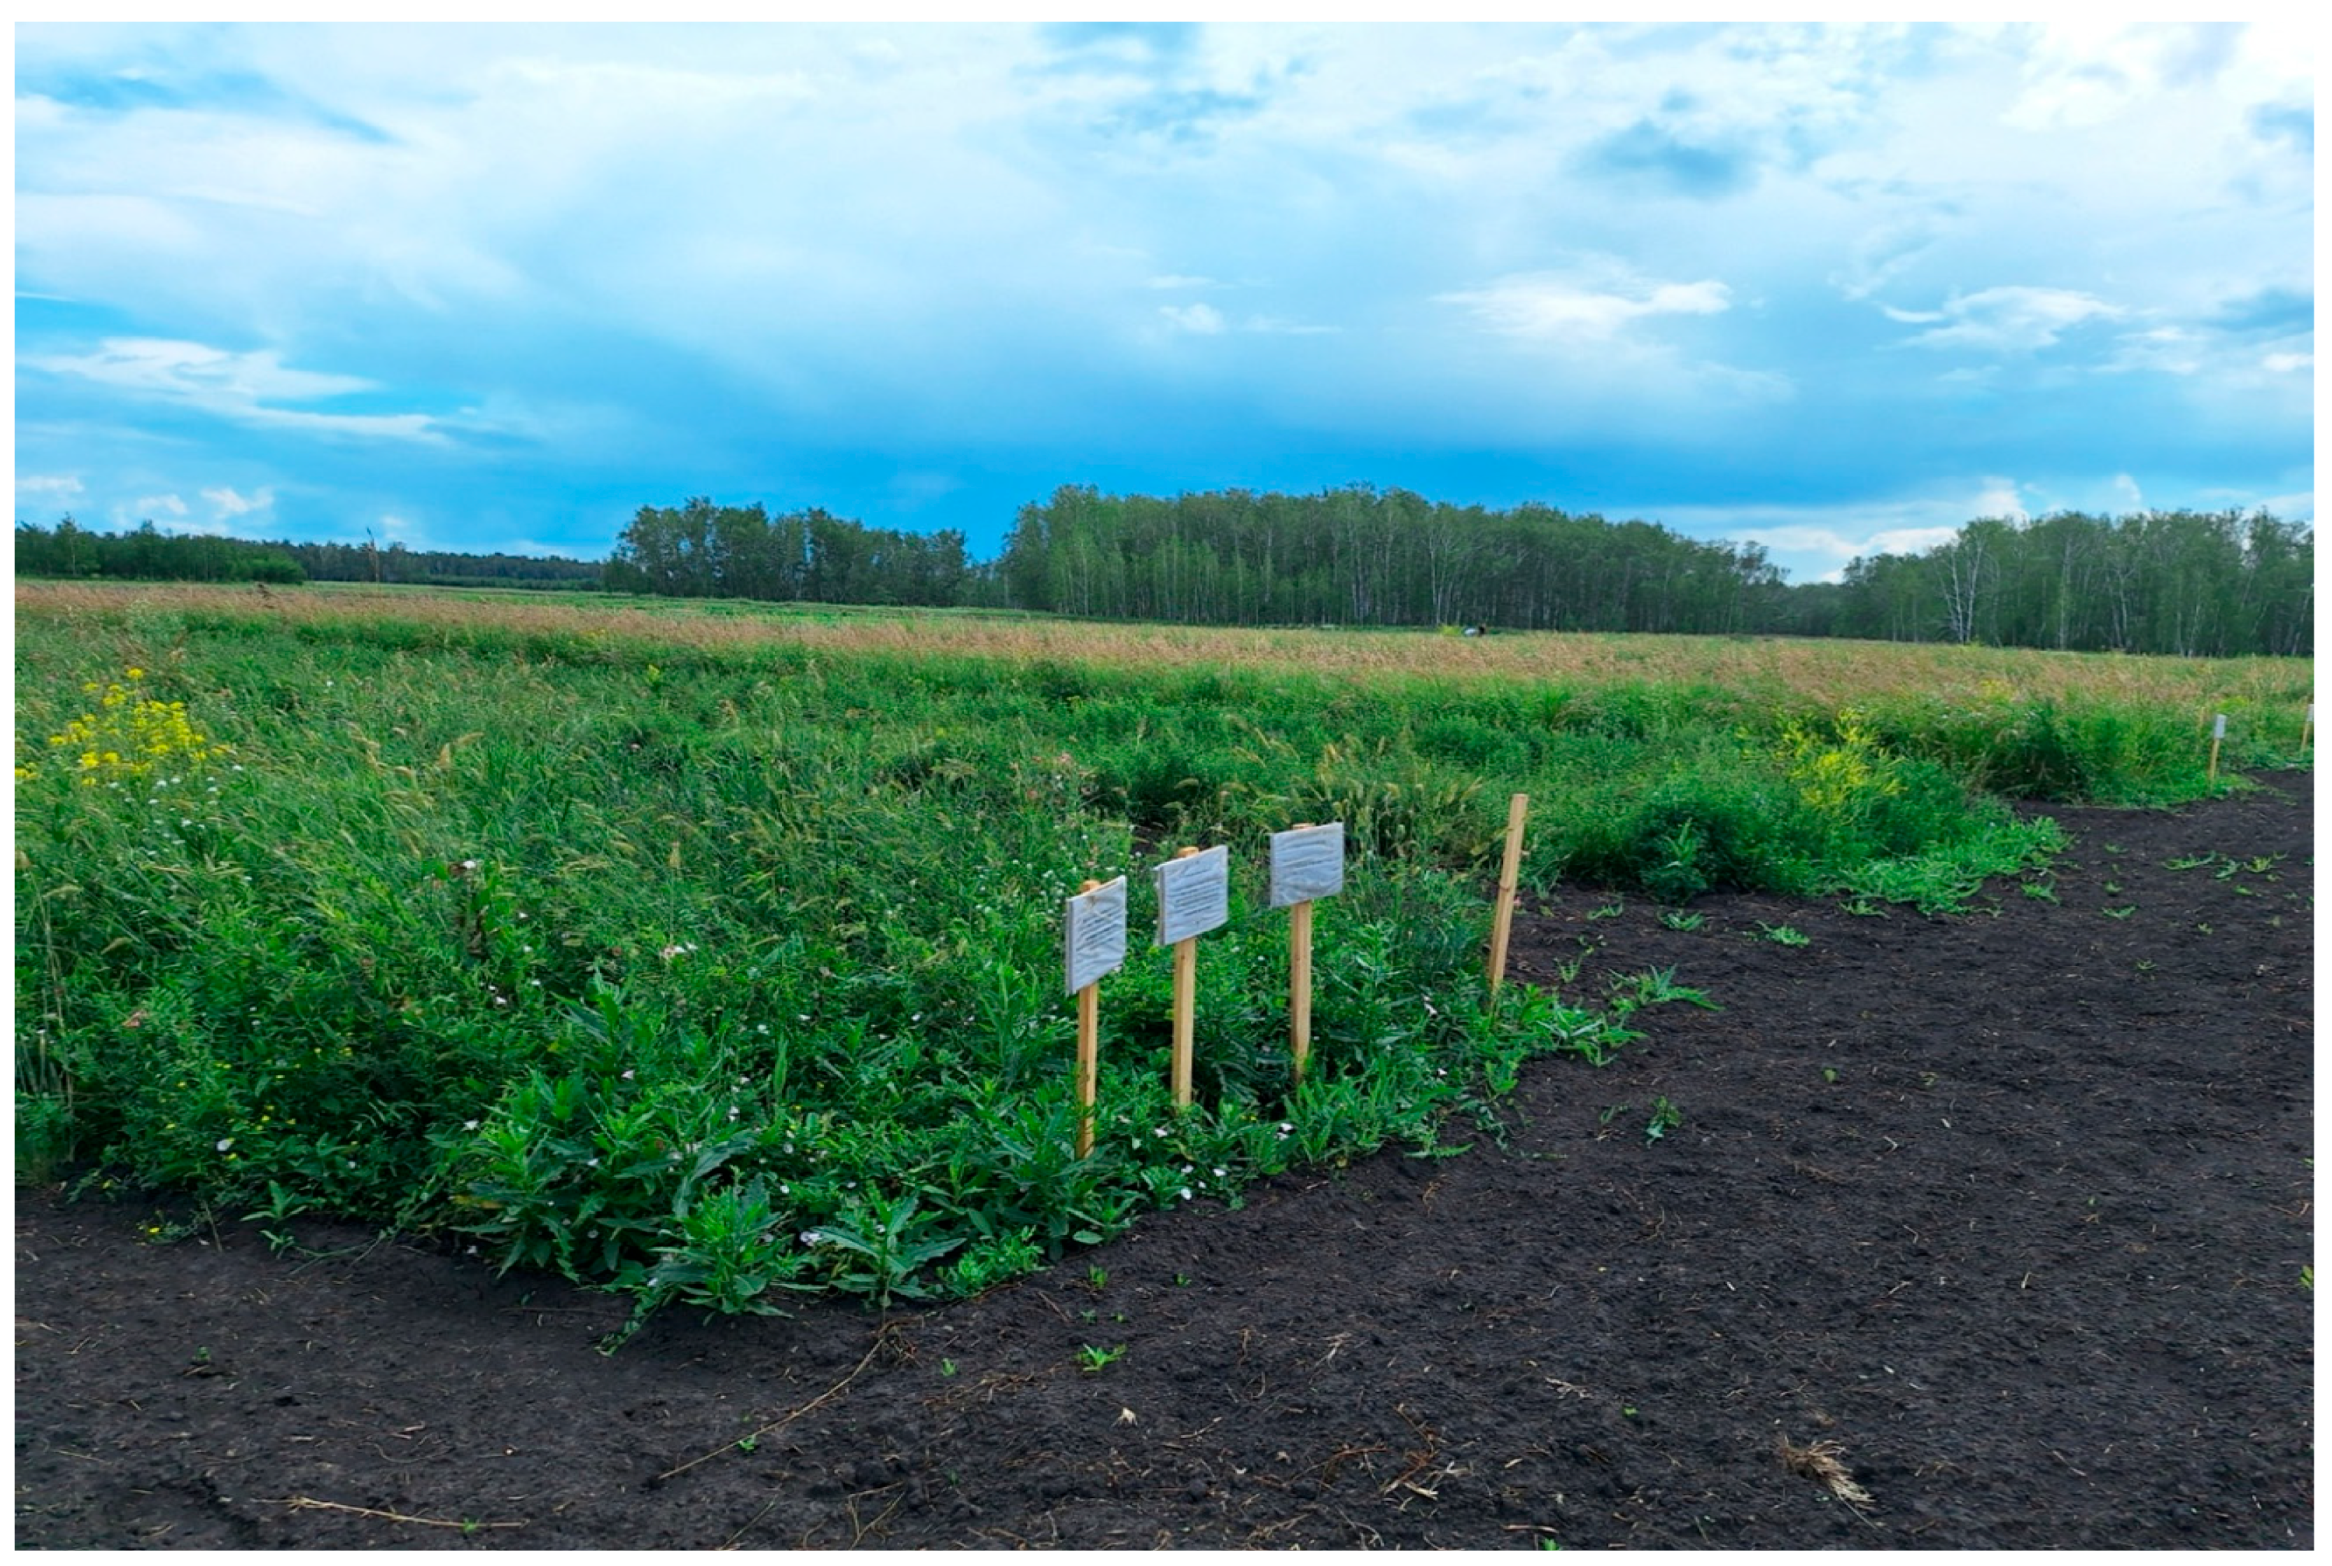
In the northern regions of Kazakhstan, the maintenance and enhancement of hayfield and pasture productivity play a critical role in establishing a stable forage base for livestock production. The grass stands evaluated in this study were established in 2024; details of soil preparation and sowing technology are provided in the Section 2. Biometric data were collected over two consecutive years. A general view of the grass stand in its second year of development is shown in Figure 5. The present analysis focuses on plant height and stand density, as well as green and dry biomass yield, with the corresponding data summarized in Supplementary Table S2.
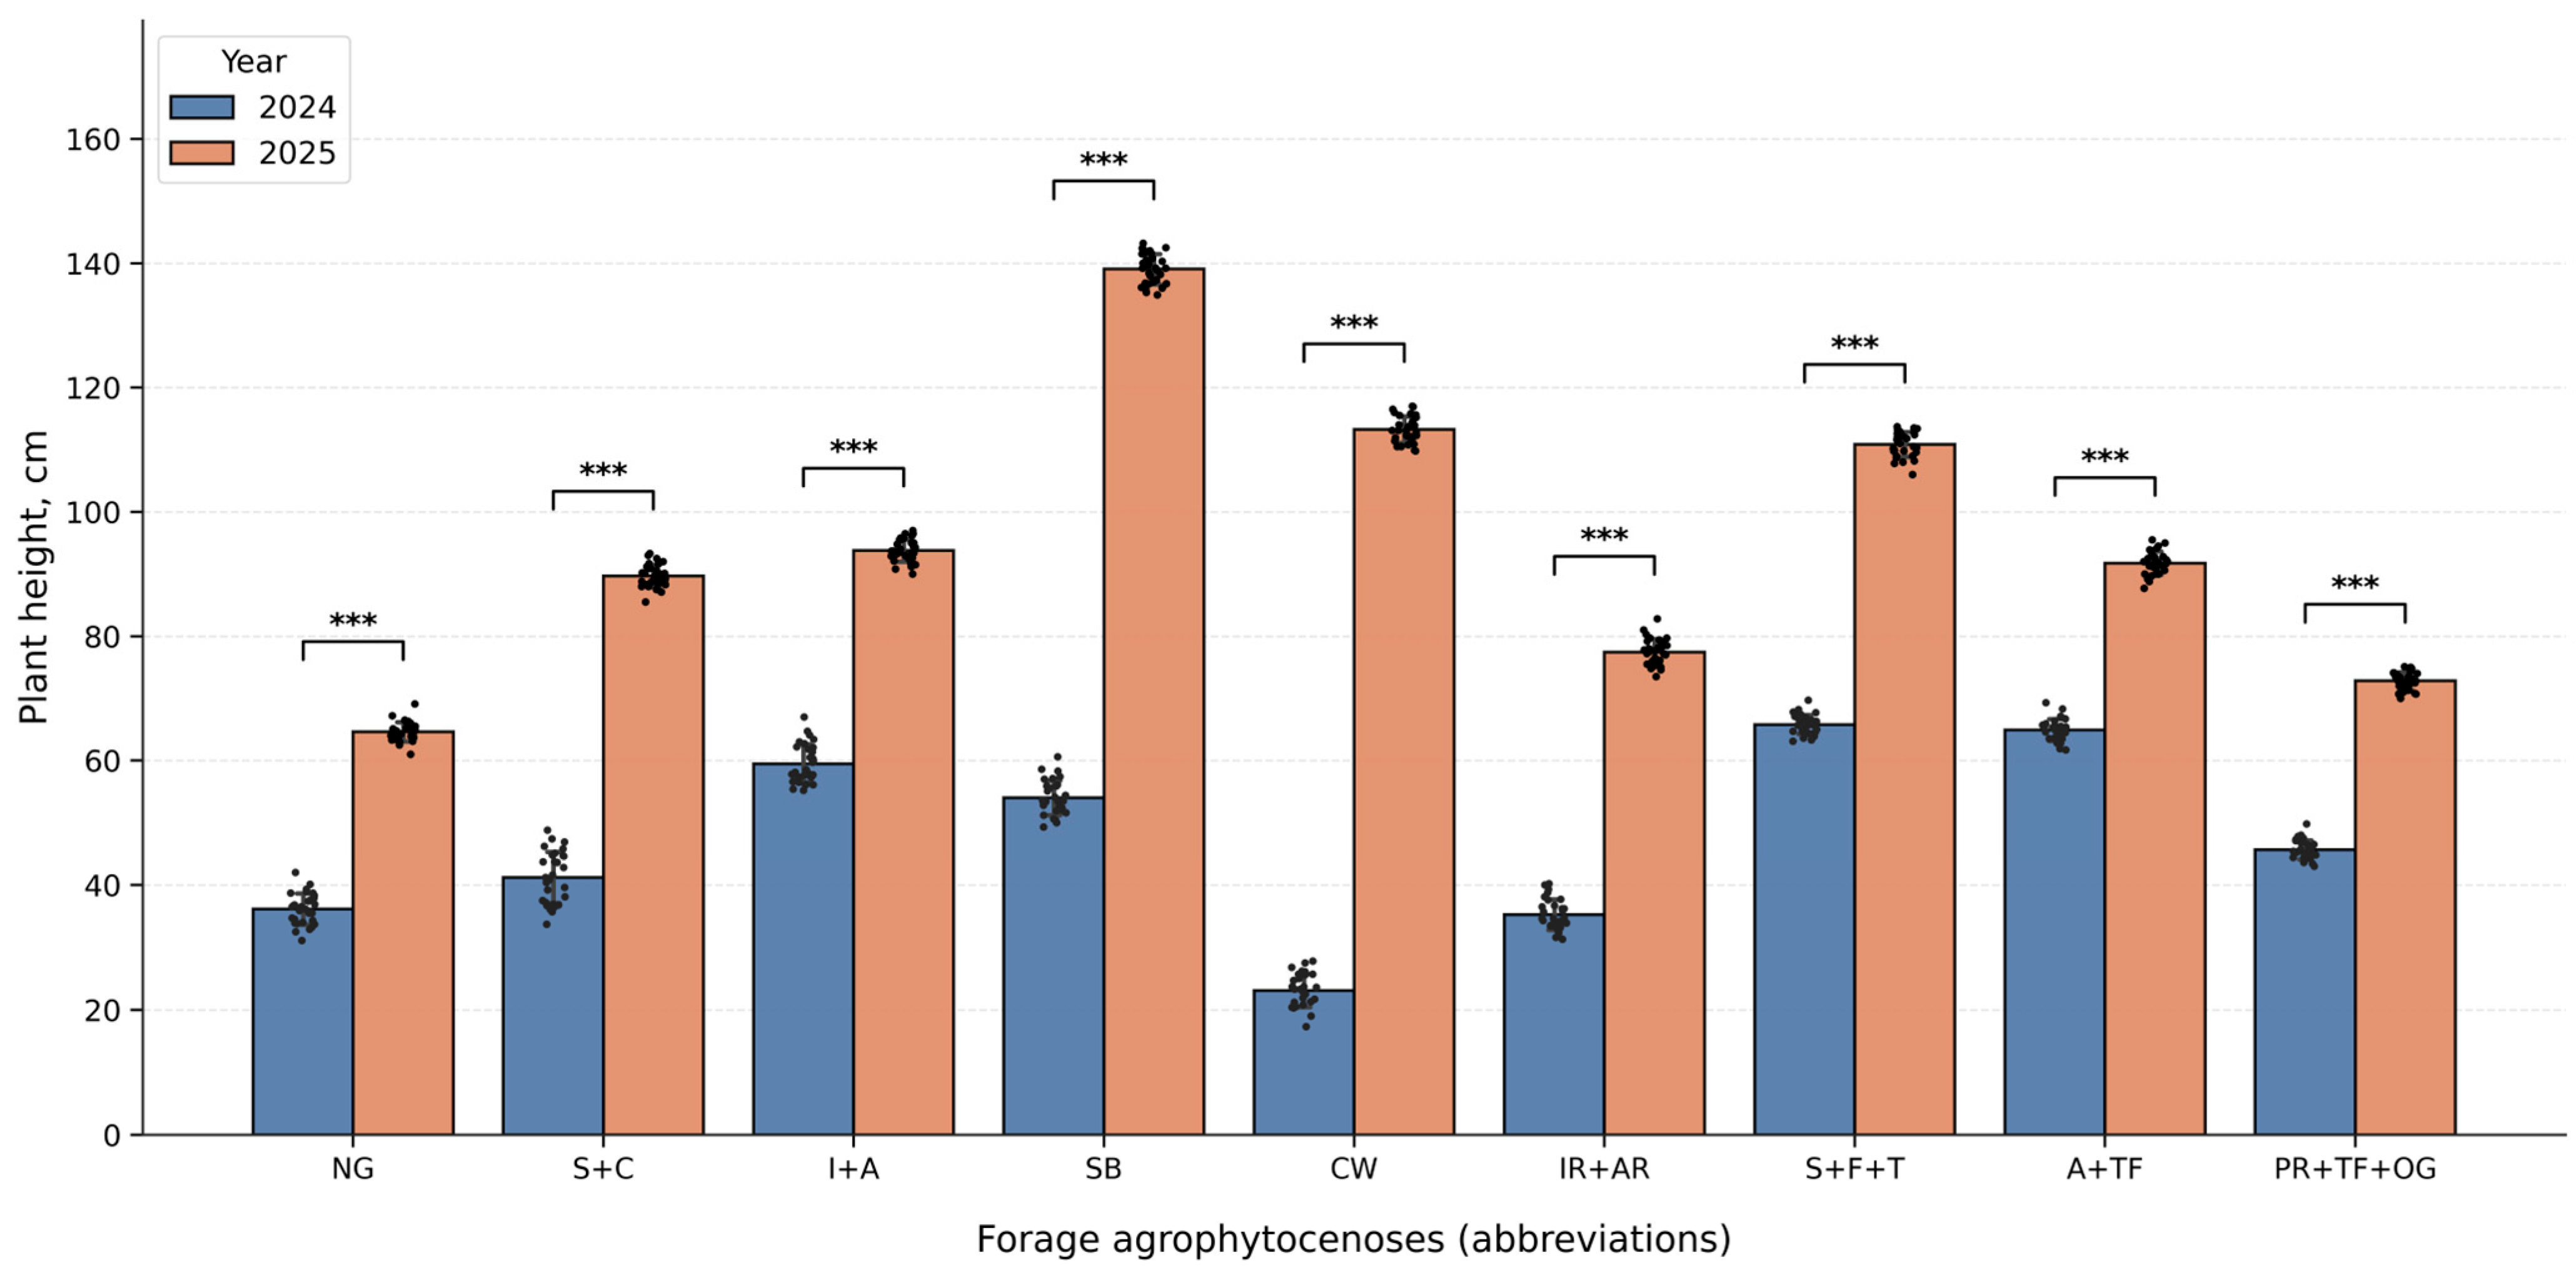
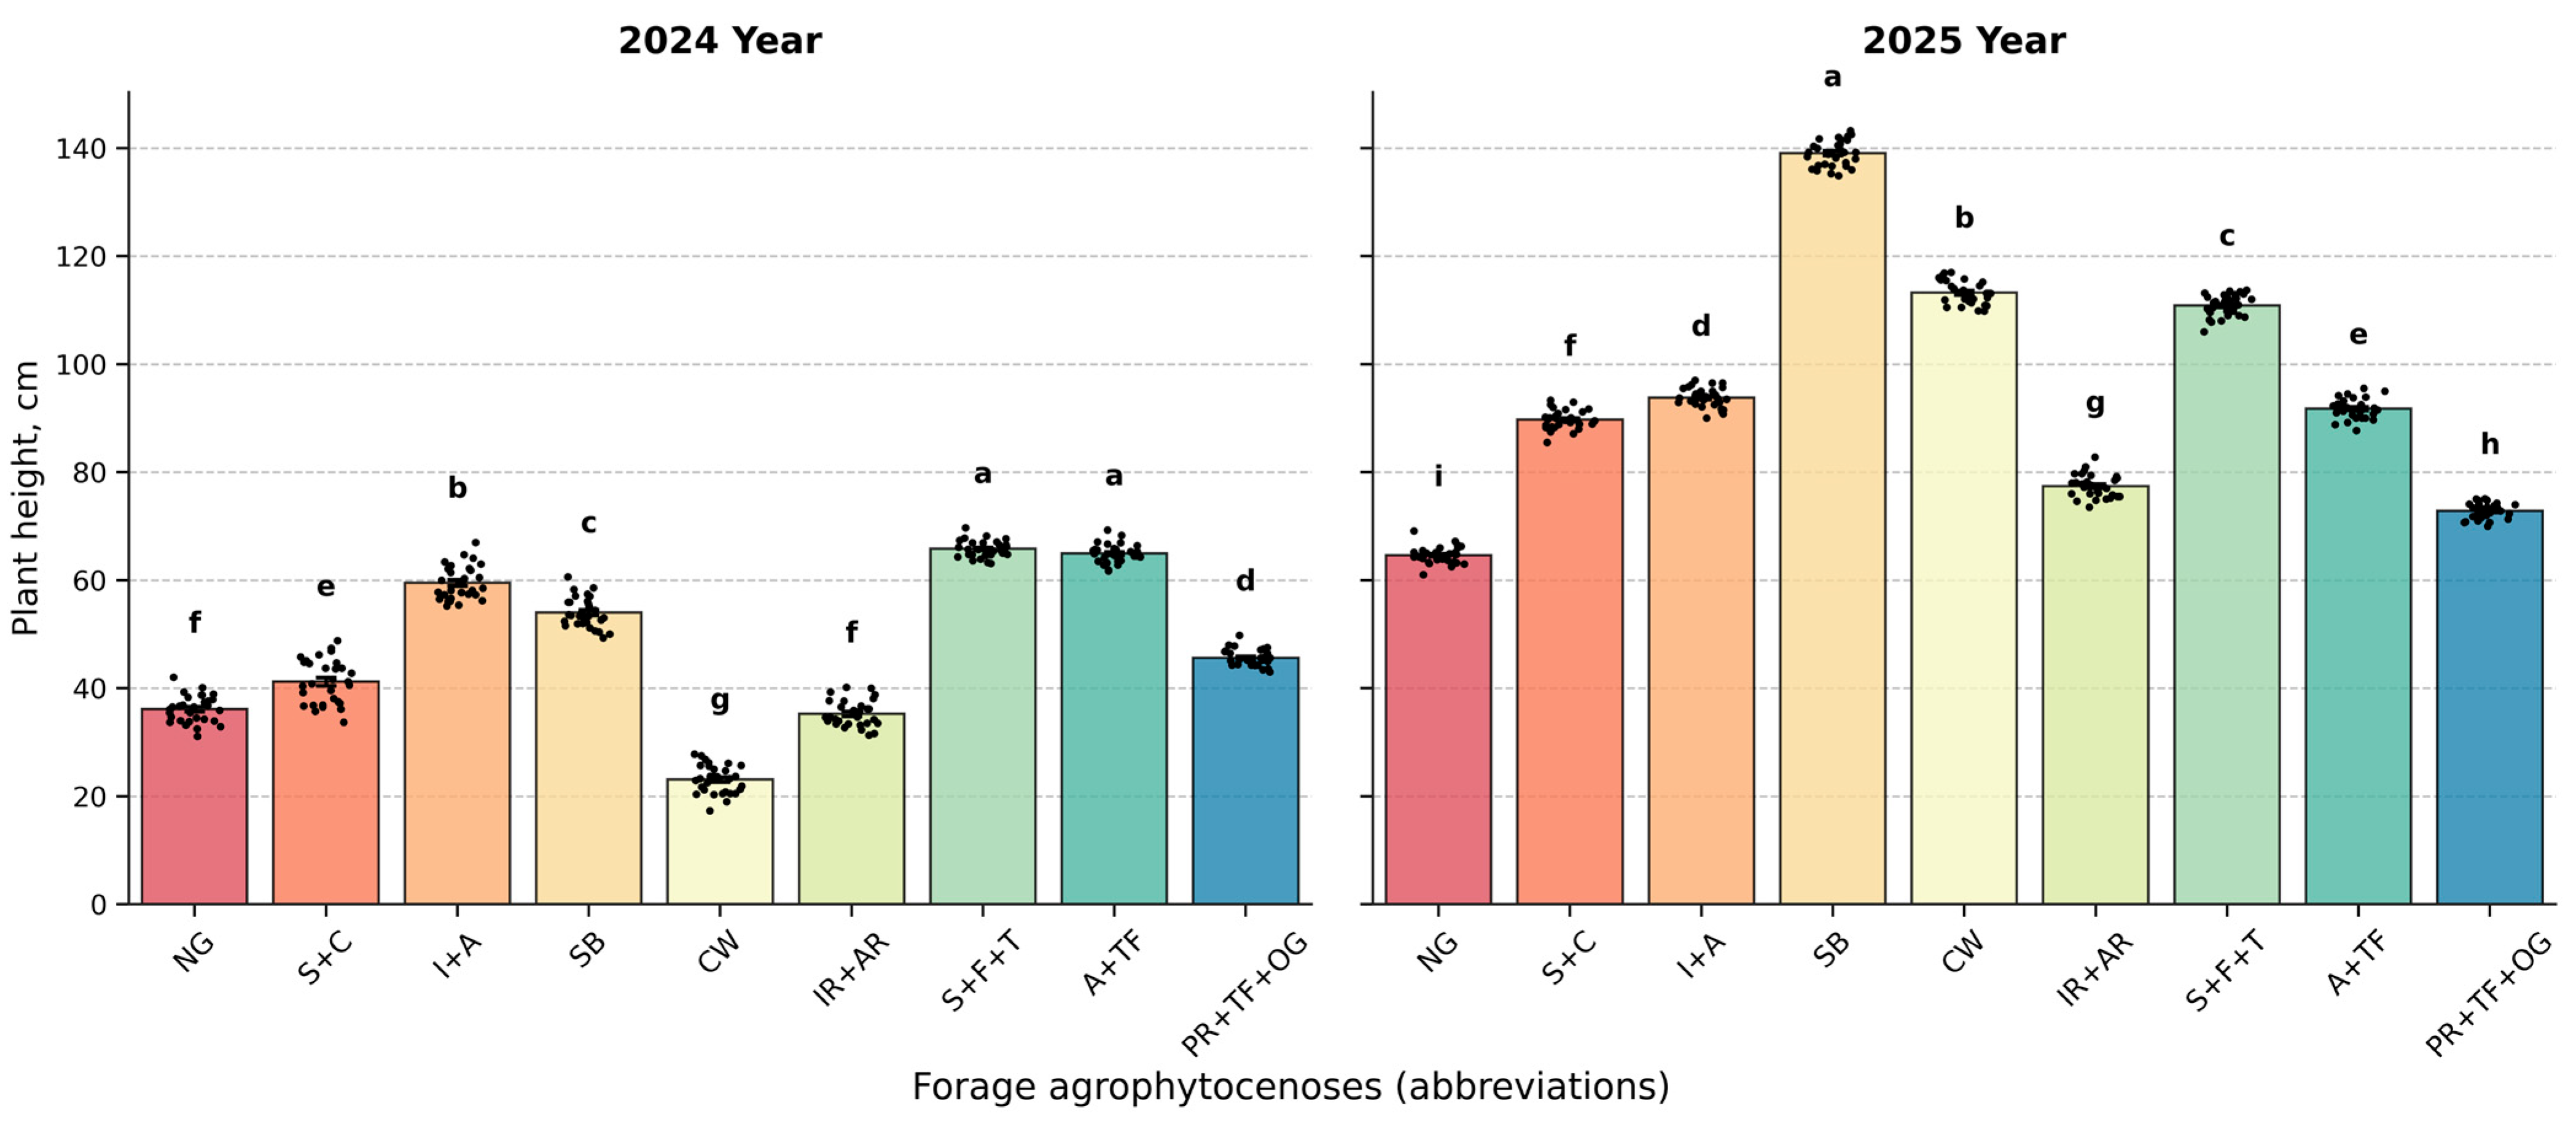
Assessment of the structural state of hayfield–pasture vegetation prior to mowing or grazing is a key component of forage production systems. Plant height and stand density are primary indicators determining green and dry matter yield. Results show distinct differences in the growth performance of perennial forage species and mixtures. Figure 6 and Figure 7 illustrate the plant height dynamics.

3.3.1. Plant Height in 2024

In 2024, the natural grass stand used as the control treatment reached a height of 36.1 cm and was represented by a feather grass–grass community. The greatest plant heights were recorded in the mixtures Onobrychis viciifolia + Festulolium + Phleum pratense (S+F+T) (65.8 cm), Medicago sativa + Festuca arundinacea (A+TF) 64.9 cm, and Lolium multiflorum + Medicago sativa (I+A) 59.5 cm (Figure 6).
The greater plant height observed in the mixed stands is primarily attributed to the presence of leguminous components (Medicago sativa, Onobrychis viciifolia) and highly productive grass species, which promote interspecific complementarity and facilitation within these cropping systems. In the Lolium multiflorum + Medicago sativa (I+A) mixture, plant height development was driven by the synergistic growth dynamics of the legume component [44]. Within such agrophytocenoses, niche differentiation and resource sharing exert positive effects on plant morphology. Specifically, the optimized vertical arrangement of the canopy improves light interception, which stimulates vertical growth and leads to increased plant height [45,46]. According to S. Schwinning, plants in these structured communities may strategically allocate a greater proportion of biomass to aboveground shoots to maximize photosynthetic activity, thereby enhancing stem elongation while maintaining the overall productivity of the stand [47].
Moderate plant height was observed in the mixtures Onobrychis viciifolia + Agropyron cristatum (S+C) 40.2 cm and Lolium perenne + Festuca arundinacea + Dactylis glomerata (PR+TF+OG) 45.7 cm. The relatively lower height in these mixtures is explained by the predominance of grass species that exhibit limited aboveground growth during the establishment year [48].
The grass mixture Lolium multiflorum + Lolium annuum (IR+AR) exhibited the lowest height, 35.3 cm, among mixtures, which can be explained by the absence of legumes, the inherently low growth habit of both species, and strong interspecific competition due to similar root zone occupation.
In monoculture, Bromus inermis reached a height of 54.0 cm, which is considered optimal for the first year of development, as this species primarily allocates resources to root system formation during establishment and reaches maximum productivity in the third to fourth year. The lowest plant height in 2024 was recorded for Agropyron cristatum, 23.1 cm, which was 13 cm lower than the control. This species is characterized by slow early development and achieves peak productivity in the third to fourth year while maintaining long-term persistence [49].

3.3.2. Plant Height in 2025

The 2025 growing season was characterized by favorable thermal and moisture conditions for perennial forage development. Spring onset was early, with regrowth beginning around 10 April, which was 8–10 days earlier than the long-term average.
The height of the natural grass stand increased to 64.5 cm, exceeding the 2024 value by 28.4 cm. Among the experimental treatments, the highest plant height was observed in Bromus inermis monoculture, 139.2 cm, exceeding the control by 74.7 cm and the 2024 value by 85.2 cm. High plant heights were also recorded for Agropyron cristatum, 110.8 cm; Onobrychis viciifolia + Festulolium + Phleum pratense (S+F+T), 110.8 cm; Lolium multiflorum + Medicago sativa (I+A), 93.7 cm; Medicago sativa + Festuca arundinacea (A+TF), 91.8 cm; and Onobrychis viciifolia + Agropyron cristatum (S+C), 89.8 cm.
Relatively lower plant heights were observed in the mixtures Lolium perenne + Festuca arundinacea + Dactylis glomerata (PR+TF+OG), 72.8 cm, and Lolium multiflorum + Lolium annuum (IR+AR), 77.4 cm (Figure 7). The substantial increase in plant height across nearly all treatments compared with 2024 reflects both the biological characteristics of perennial forage species—where aboveground biomass accumulation intensifies in the second year—and the more favorable weather conditions in 2025 [50].

3.4. Plant Density

Plant density of perennial forage species is a key indicator determining the productivity, stability, and persistence of agrophytocenoses. The number of plants per unit area directly affects canopy closure, competitive interactions within the stand, and the efficiency of water, nutrient, and light utilization. Therefore, the assessment of plant density prior to mowing or grazing serves as an important diagnostic criterion for evaluating stand condition and for predicting forage productivity in subsequent years.

3.4.1. Plant Density in 2024

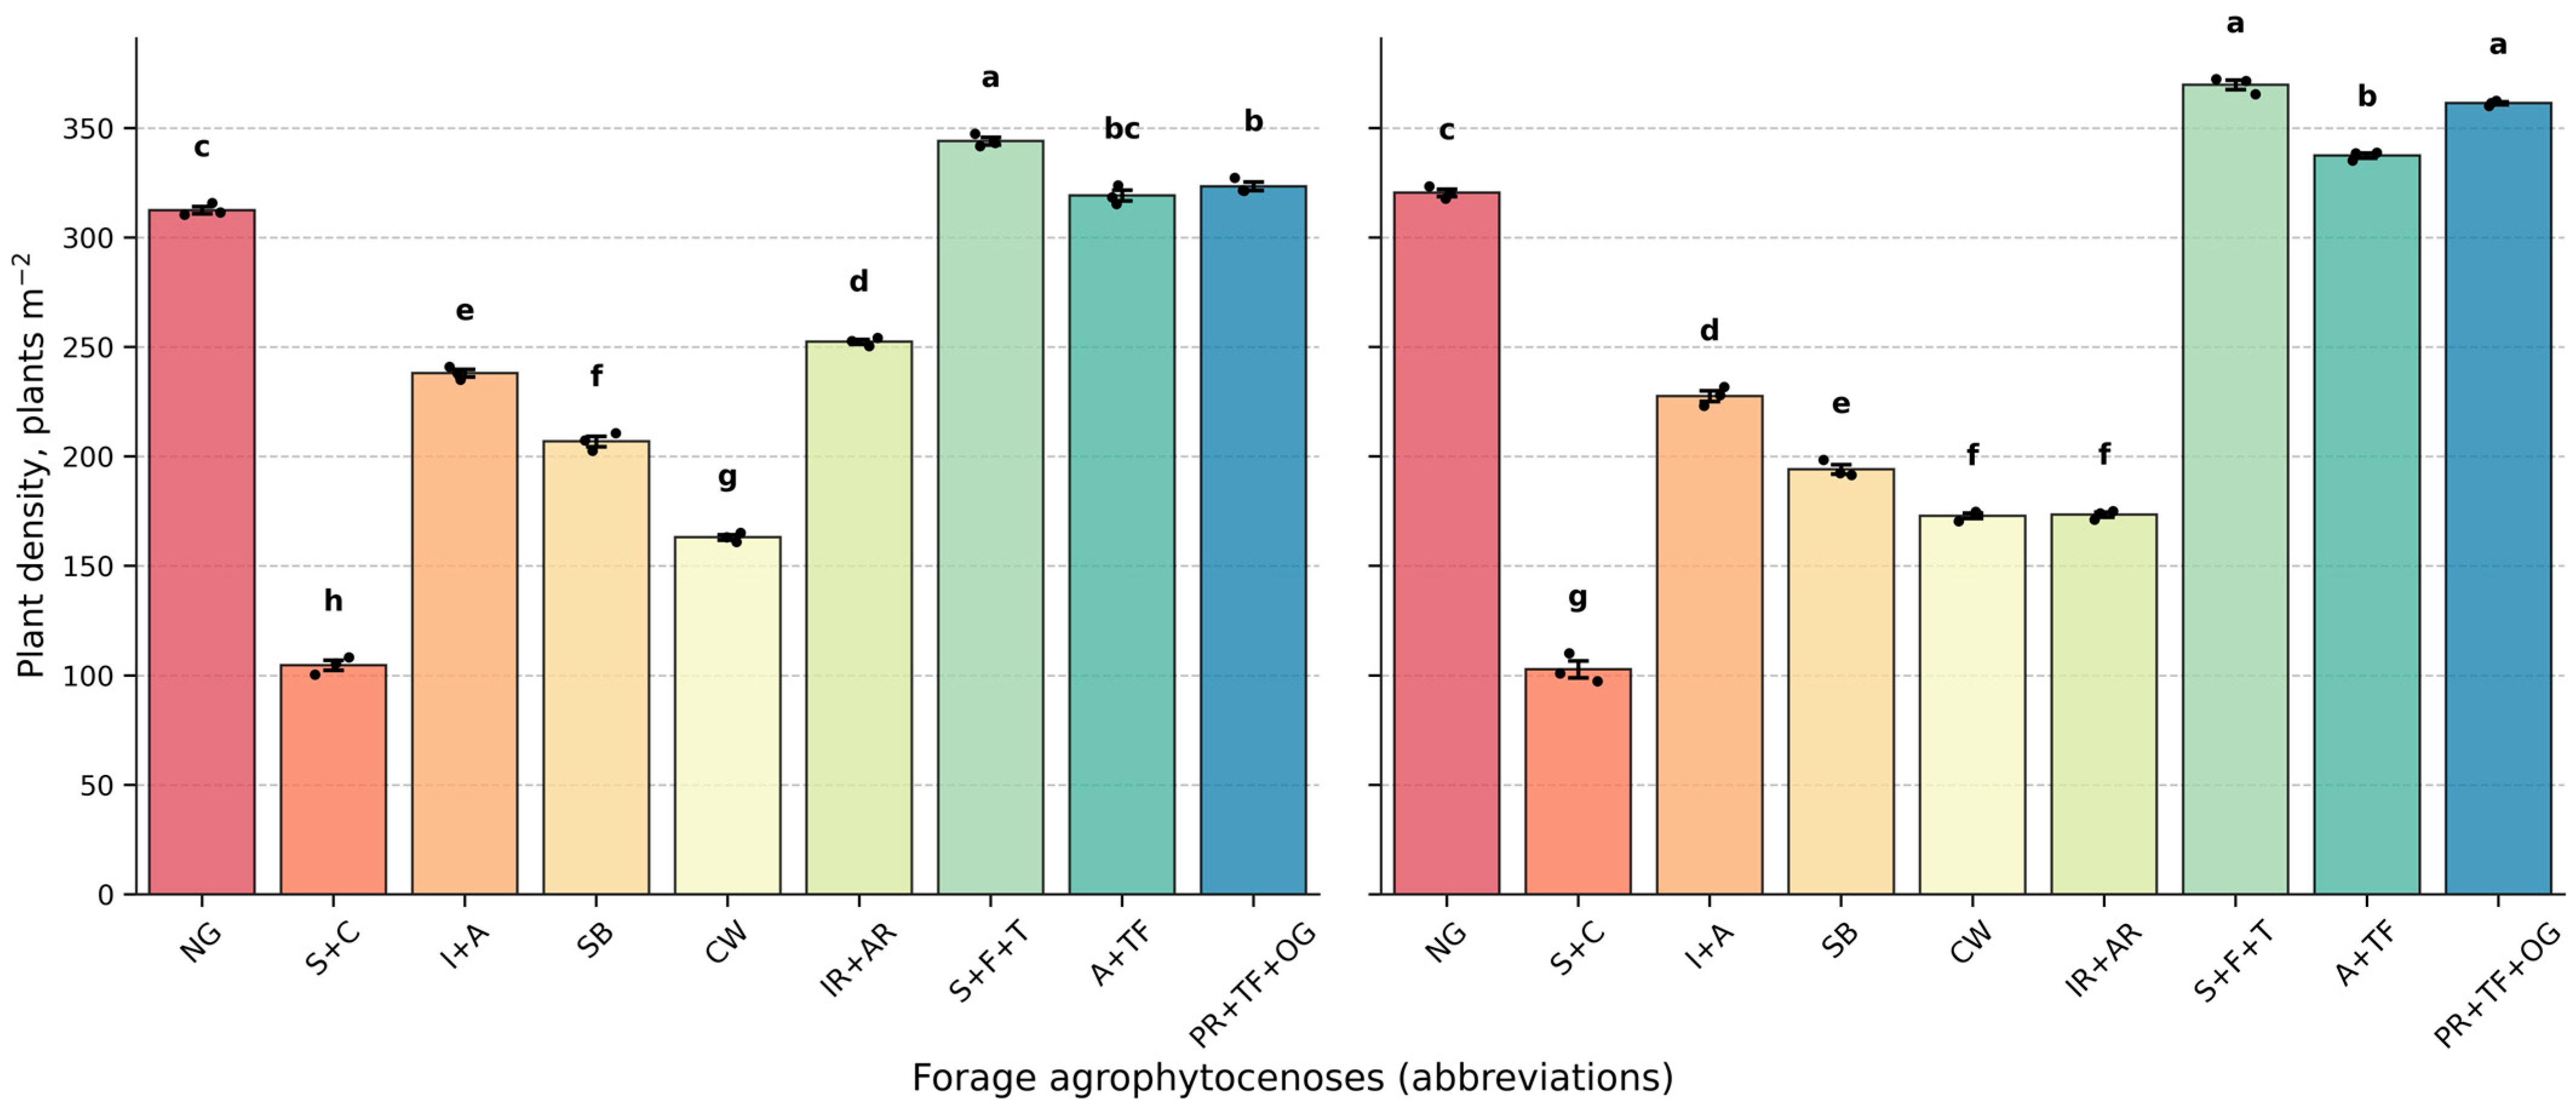
In 2024, the highest plant density was recorded in multi-component legume–grass mixtures. The maximum value was observed in the mixture Onobrychis viciifolia + Festulolium + Phleum pratense (S+F+T), 344.1 plants m−2, followed by the mixtures Lolium perenne + Festuca arundinacea + Dactylis glomerata (PR+TF+OG), 323.4 plants m−2, and Medicago sativa + Festuca arundinacea (A+TF), 319.2 plants m−2. The high density of these mixtures can be attributed to complementary interactions among species, where interspecific competition for moisture, nutrients, and light stimulates tillering and accelerates stand establishment.
The natural grass stand (control) formed a density of 312.5 plants m−2. Monoculture stands of Bromus inermis and Agropyron cristatum exhibited moderate densities of 206.9 and 163.1 plants m−2, respectively. For perennial grasses in the establishment year, such density levels can be considered optimal, as these species primarily allocate resources to root system development during the first year.
The lowest plant density was observed in the mixture Onobrychis viciifolia + Agropyron cristatum (S+C) 104.7 plants m−2, which is most likely associated with the slow early development of Agropyron cristatum during the first year of growth. Plant density for 2024–2025 is shown in Figure 8.

3.4.2. Plant Density in 2025

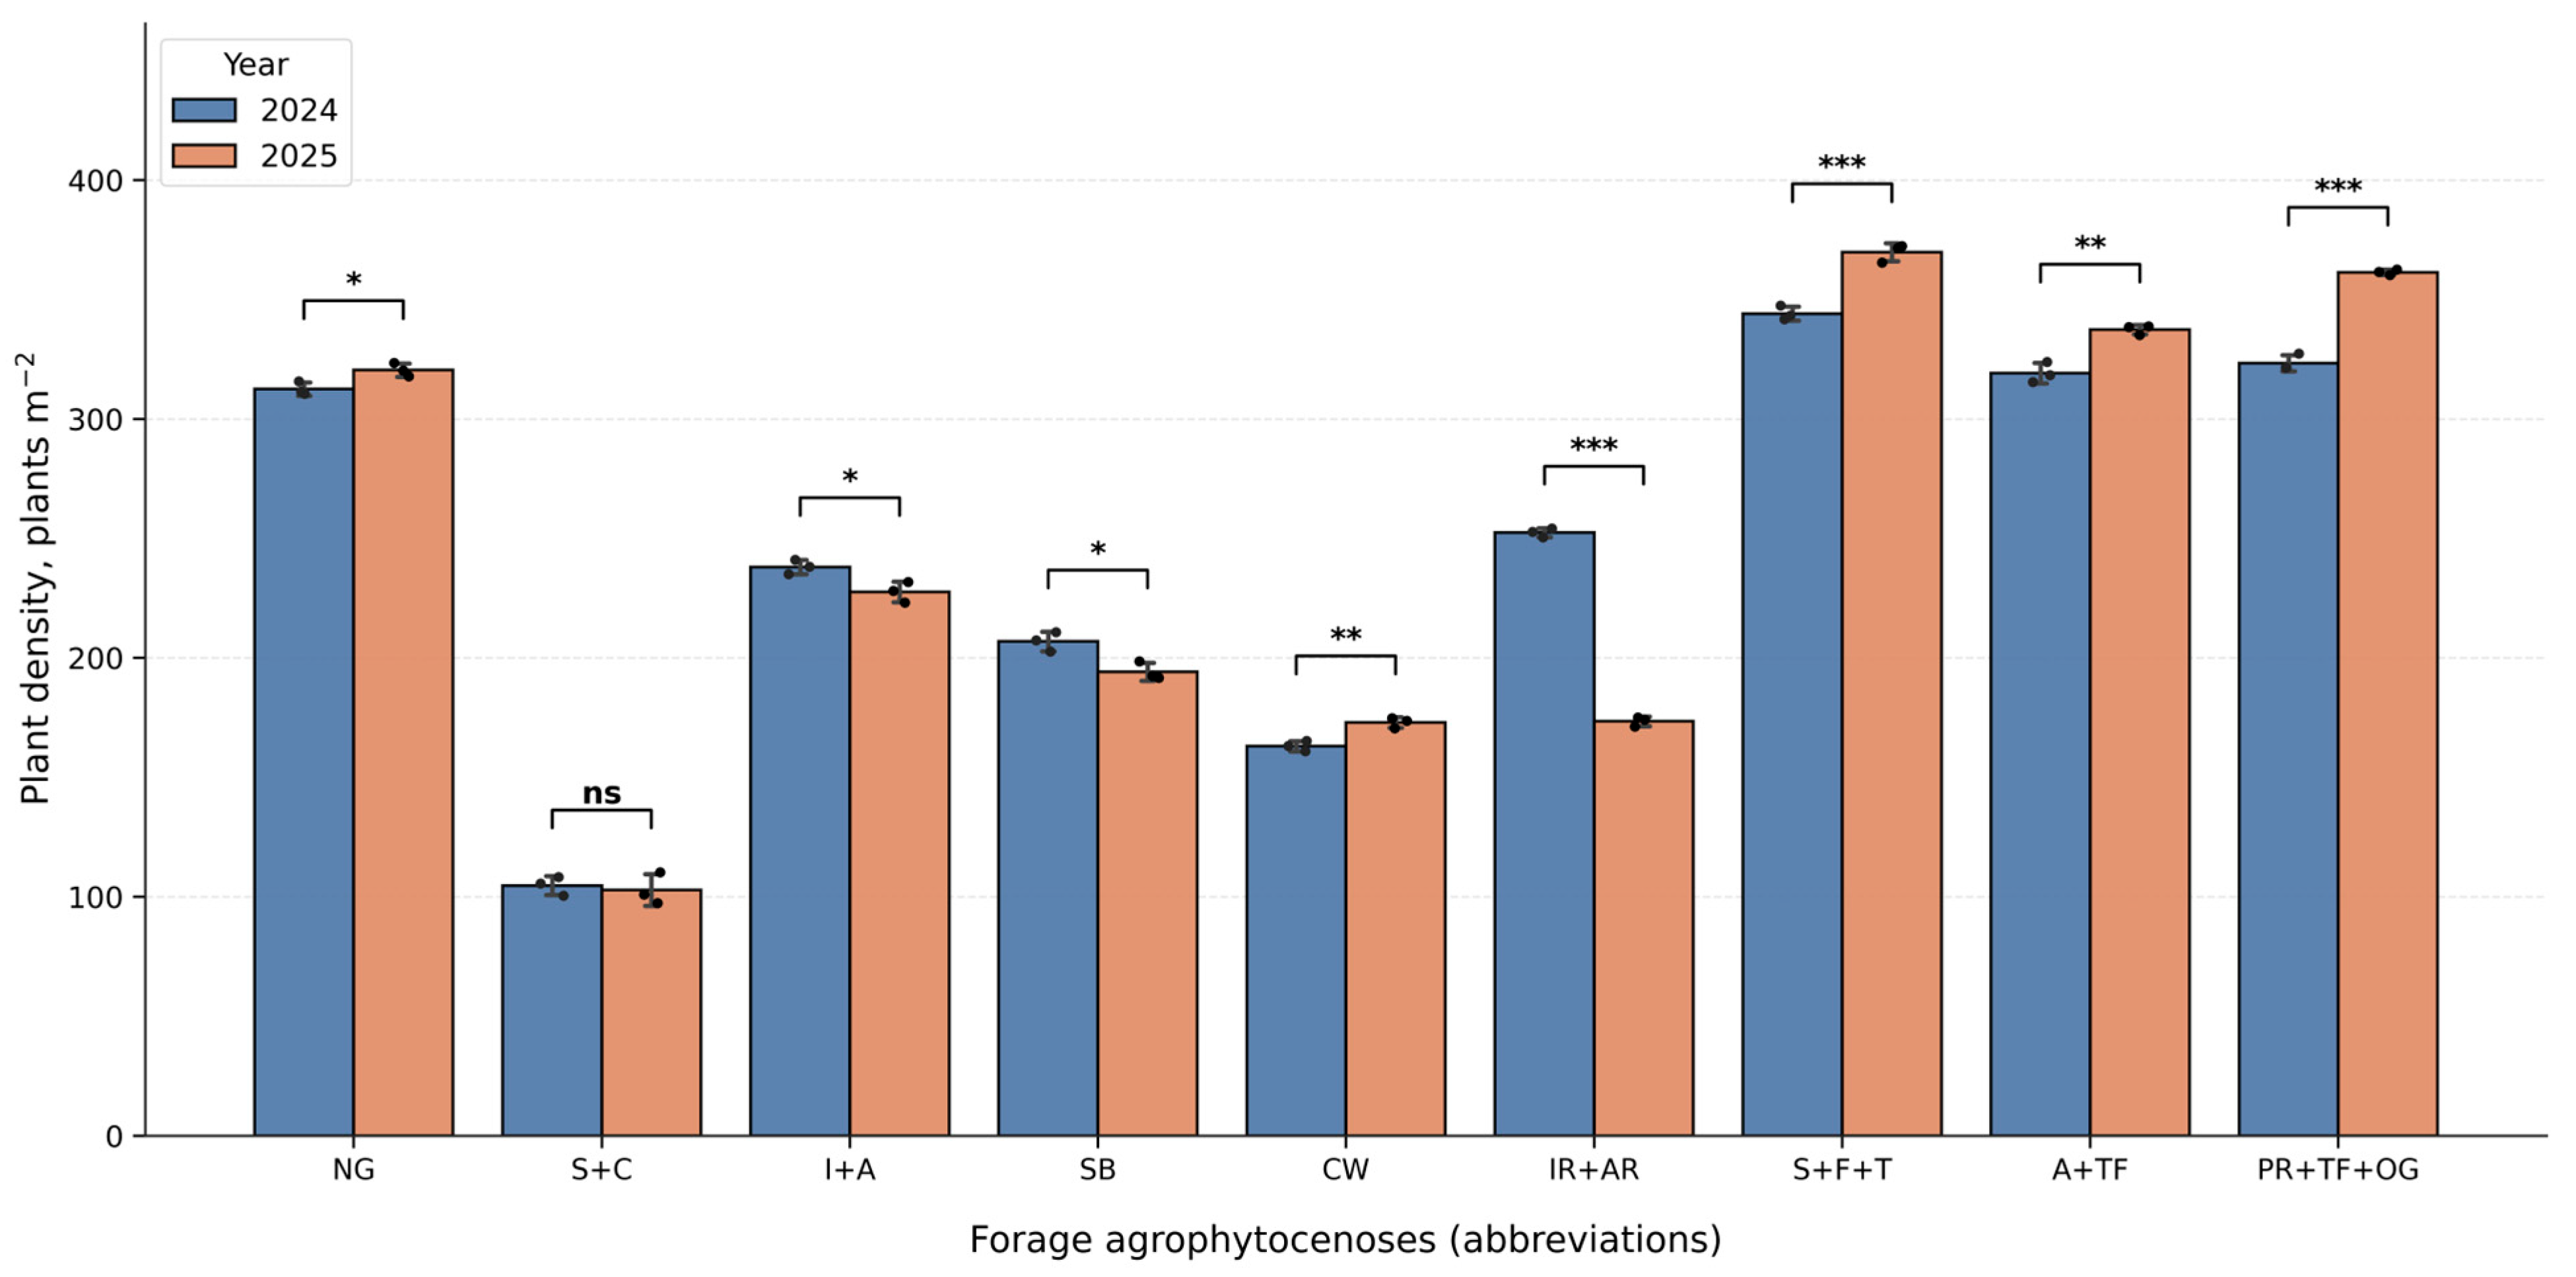
In 2025, most agrophytocenoses maintained or increased plant density compared with the previous year. The highest density was again recorded in the mixture Onobrychis viciifolia + Festulolium + Phleum pratense (S+F+T), 369.7 plants m−2. The mixtures Medicago sativa + Festuca arundinacea (A+TF) and Lolium perenne + Festuca arundinacea + Dactylis glomerata (PR+TF+OG) also showed increased densities, reaching 337.4 and 361.4 plants m−2, respectively.
The natural grass stand maintained a stable density of 320.5 plants m−2, indicating high adaptive capacity under the prevailing environmental conditions. In monoculture, Agropyron cristatum increased plant density to 172.9 plants m−2, reflecting enhanced tillering during the second year of development.
A slight decrease in plant density was observed in the treatments Lolium multiflorum + Medicago sativa (I+A) and Bromus inermis. This reduction may be partially attributed to overwintering conditions, as Lolium multiflorum and Medicago sativa are known to be less tolerant of low winter temperatures compared with other species included in the experiment [51].
The most pronounced thinning was recorded in the mixture Lolium multiflorum + Lolium annuum (IR+AR) 173.4 plants m−2. This effect is primarily associated with the loss of the annual component (Lolium annuum) after the first growing season, resulting in a substantial reduction in total stand density. Density interannual comparisons between 2024 and 2025 are shown in Figure 9.

3.5. Biomass Yield

The assessment of green and dry biomass yield in perennial grasses is a fundamental component in evaluating the efficacy of established agrophytocenoses. Yield metrics directly reflect the stand’s capacity to accumulate productive biomass, ensuring high forage quality and the rational utilization of edaphoclimatic resources. Furthermore, quantifying these indicators allows for the differentiation of productivity levels among various species and mixtures, thereby elucidating the impact of botanical composition and interspecific interactions on the final output. Consequently, yield data serve as a fundamental indicator for the agrotechnological evaluation of forage lands, making this parameter a critical criterion for selecting the most promising agrophytocenoses.
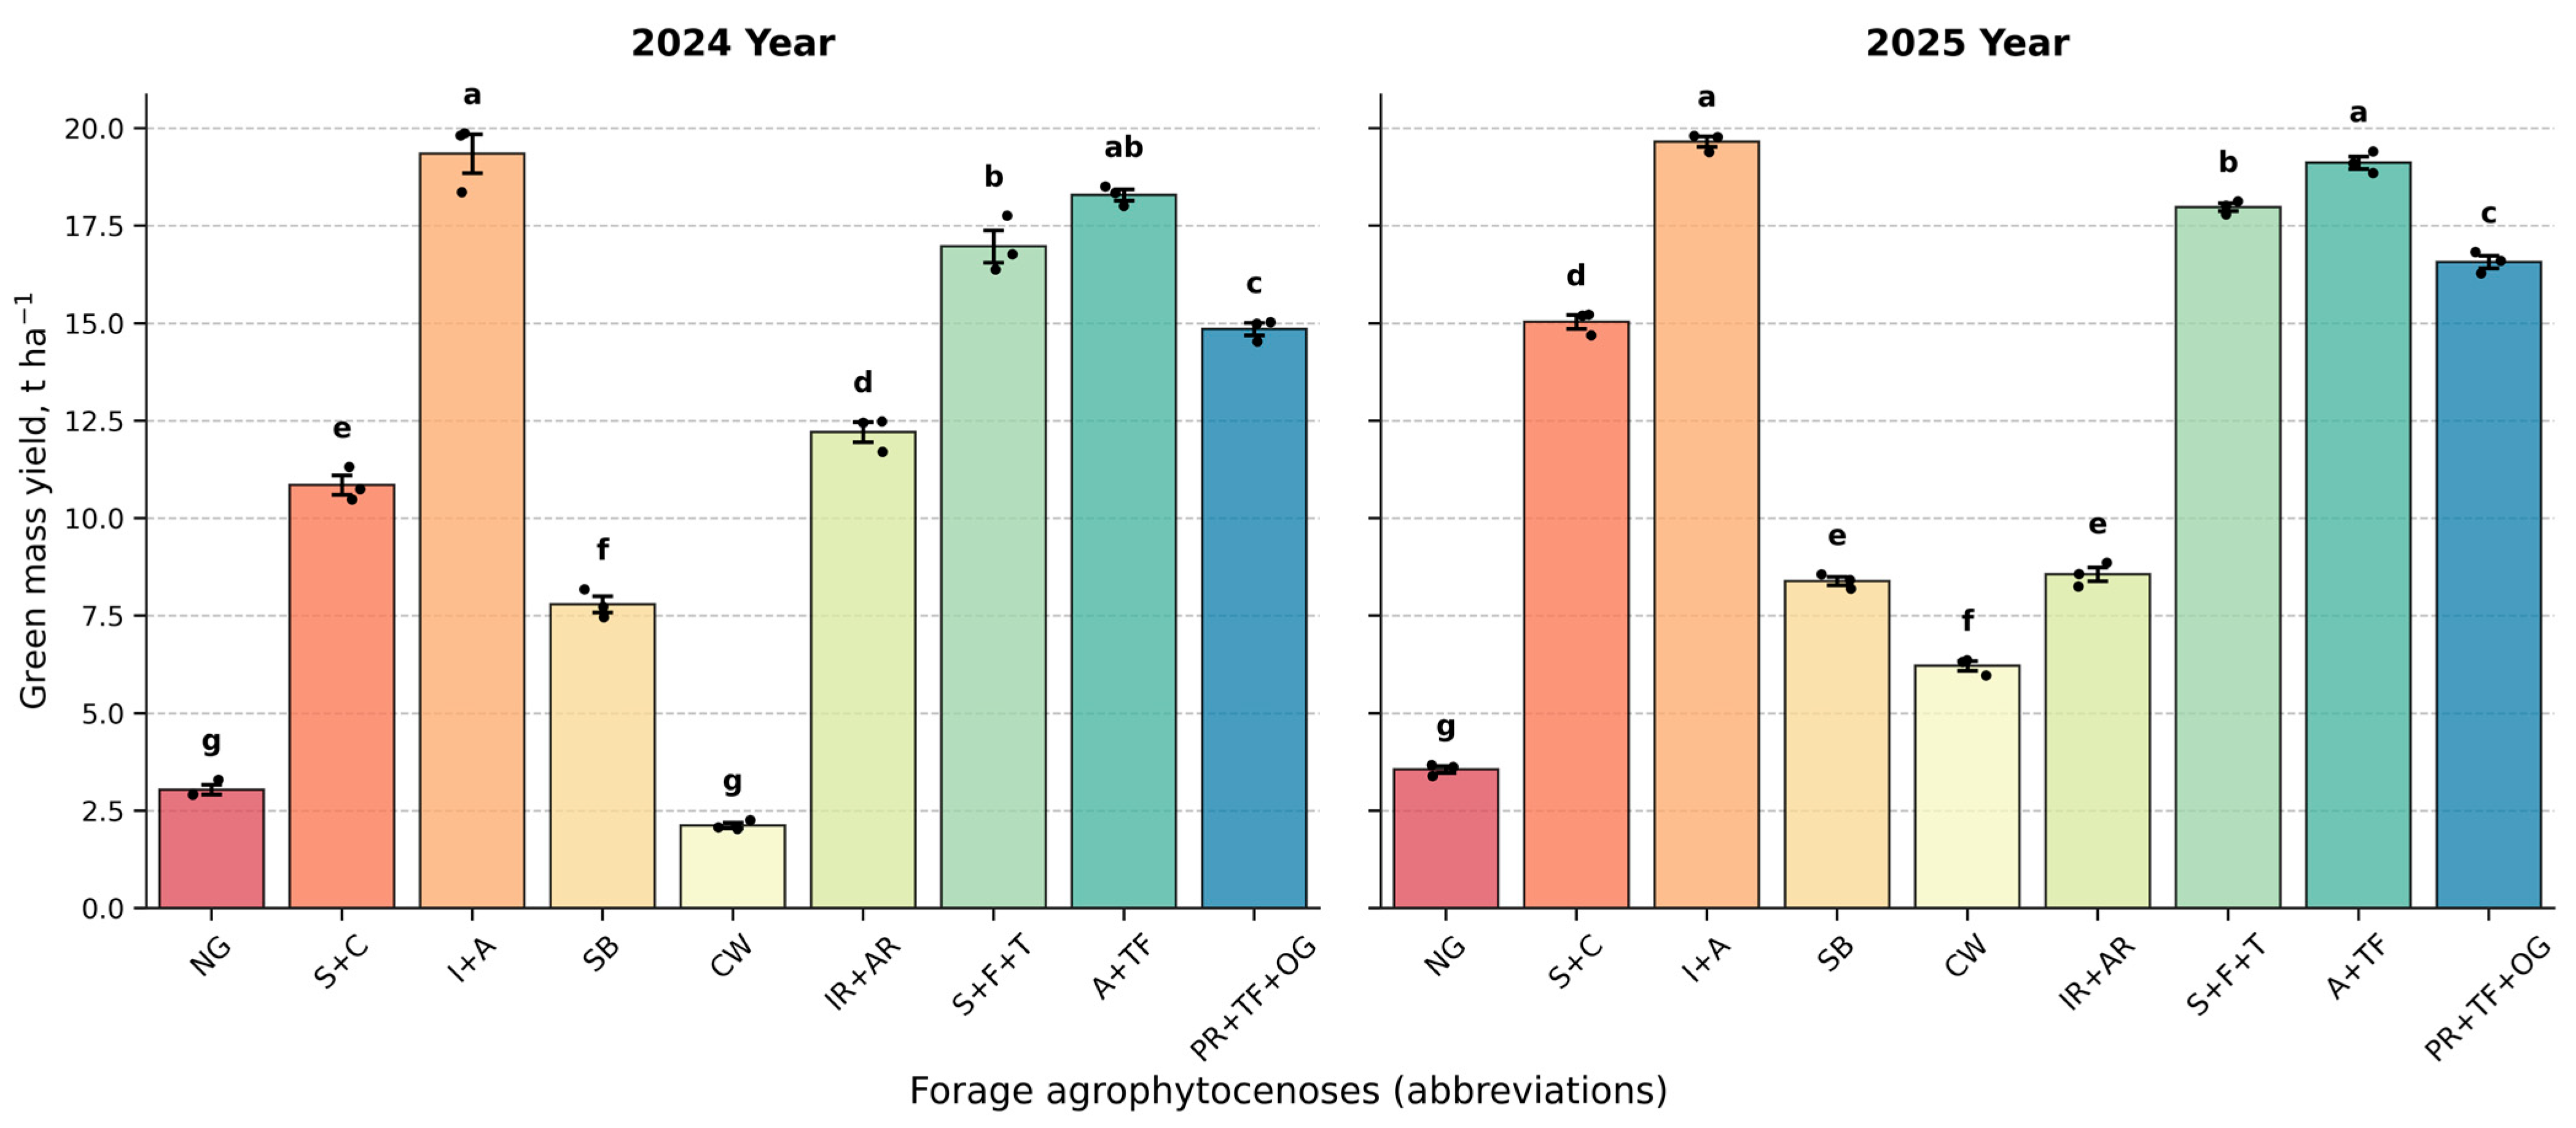
The productivity of the natural grass stand (control) reached 3.04 t ha−1 of green biomass and 1.68 t ha−1 of dry matter. In 2024, pronounced differences in green biomass yield were observed among the experimental treatments. The highest yields were recorded in legume–grass agrophytocenoses (Figure 10).
Specifically, the highest yields were recorded in legume–grass agrophytocenoses. Maximum productivity was achieved in the mixtures Lolium multiflorum + Medicago sativa (I+A) (19.35 t ha−1 green biomass and 5.12 t ha−1 dry matter), Medicago sativa + Festuca arundinacea (A+TF) (18.29 and 4.68 t ha−1, respectively), and Onobrychis viciifolia + Festulolium + Phleum pratense (S+F+T) (16.97 and 4.48 t ha−1). The high productivity of these mixtures might be associated with rapid vegetative growth, the potential for biological nitrogen fixation by the legume component, and complementary use of environmental resources [52]. In such mixed stands, nitrogen-fixing bacteria are known to facilitate the conversion of atmospheric nitrogen into bioavailable forms, potentially providing a supplementary nitrogen source for the associated grasses [53]. It is likely that nitrogen fixed by legumes is translocated to non-fixing grass species through established source–sink dynamics, which may serve as a vital pathway for alleviating nitrogen stress in the grass component [54].
Moderate yield levels were observed in grass-dominated treatments, including Lolium multiflorum + Lolium annuum (IR+AR), 12.21 and 3.14 t ha−1; Onobrychis viciifolia + Agropyron cristatum (S+C), 10.85 and 2.82 t ha−1; and monoculture Bromus inermis (7.79 and 2.05 t ha−1). The lowest productivity during the establishment year was recorded in monoculture Agropyron cristatum (2.12 and 0.54 t ha−1). Reduced yield in grass-dominated treatments compared with legume-containing mixtures is associated with the absence of nitrogen fixation and with the slower formation of aboveground biomass typical of perennial grasses in the first year of growth. In the mixture Onobrychis viciifolia + Agropyron cristatum (S+C), yield formation was primarily driven by the legume component.
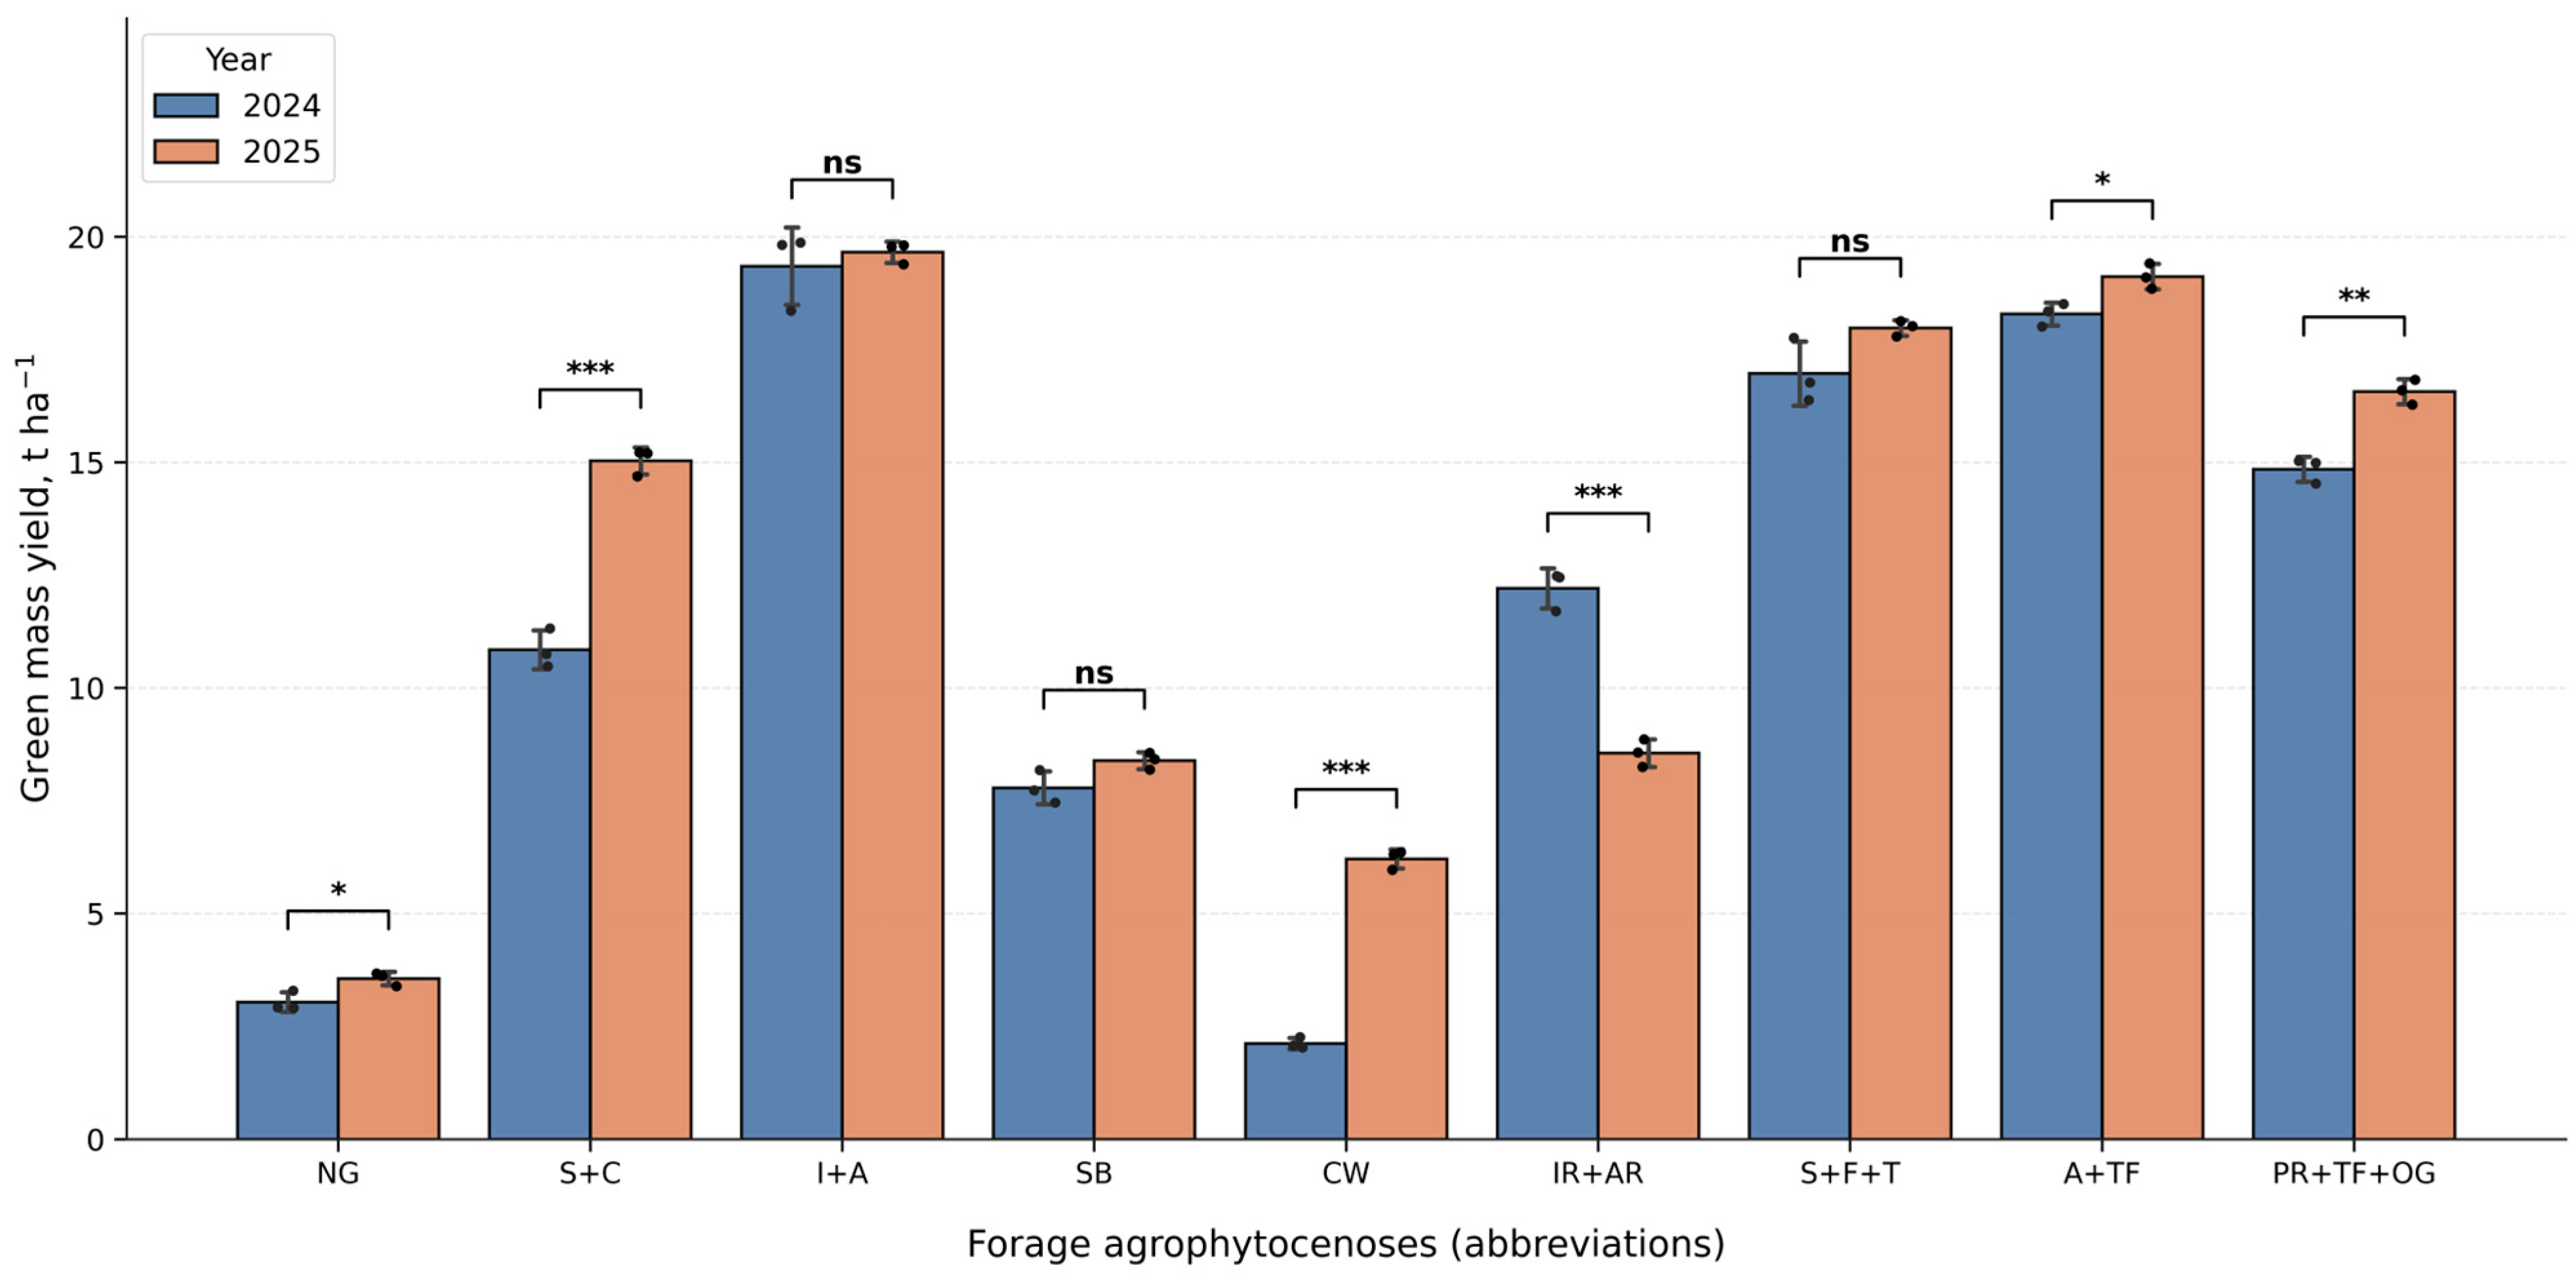
A detailed comparison of green mass yield dynamics between the two years is presented in Figure 11.
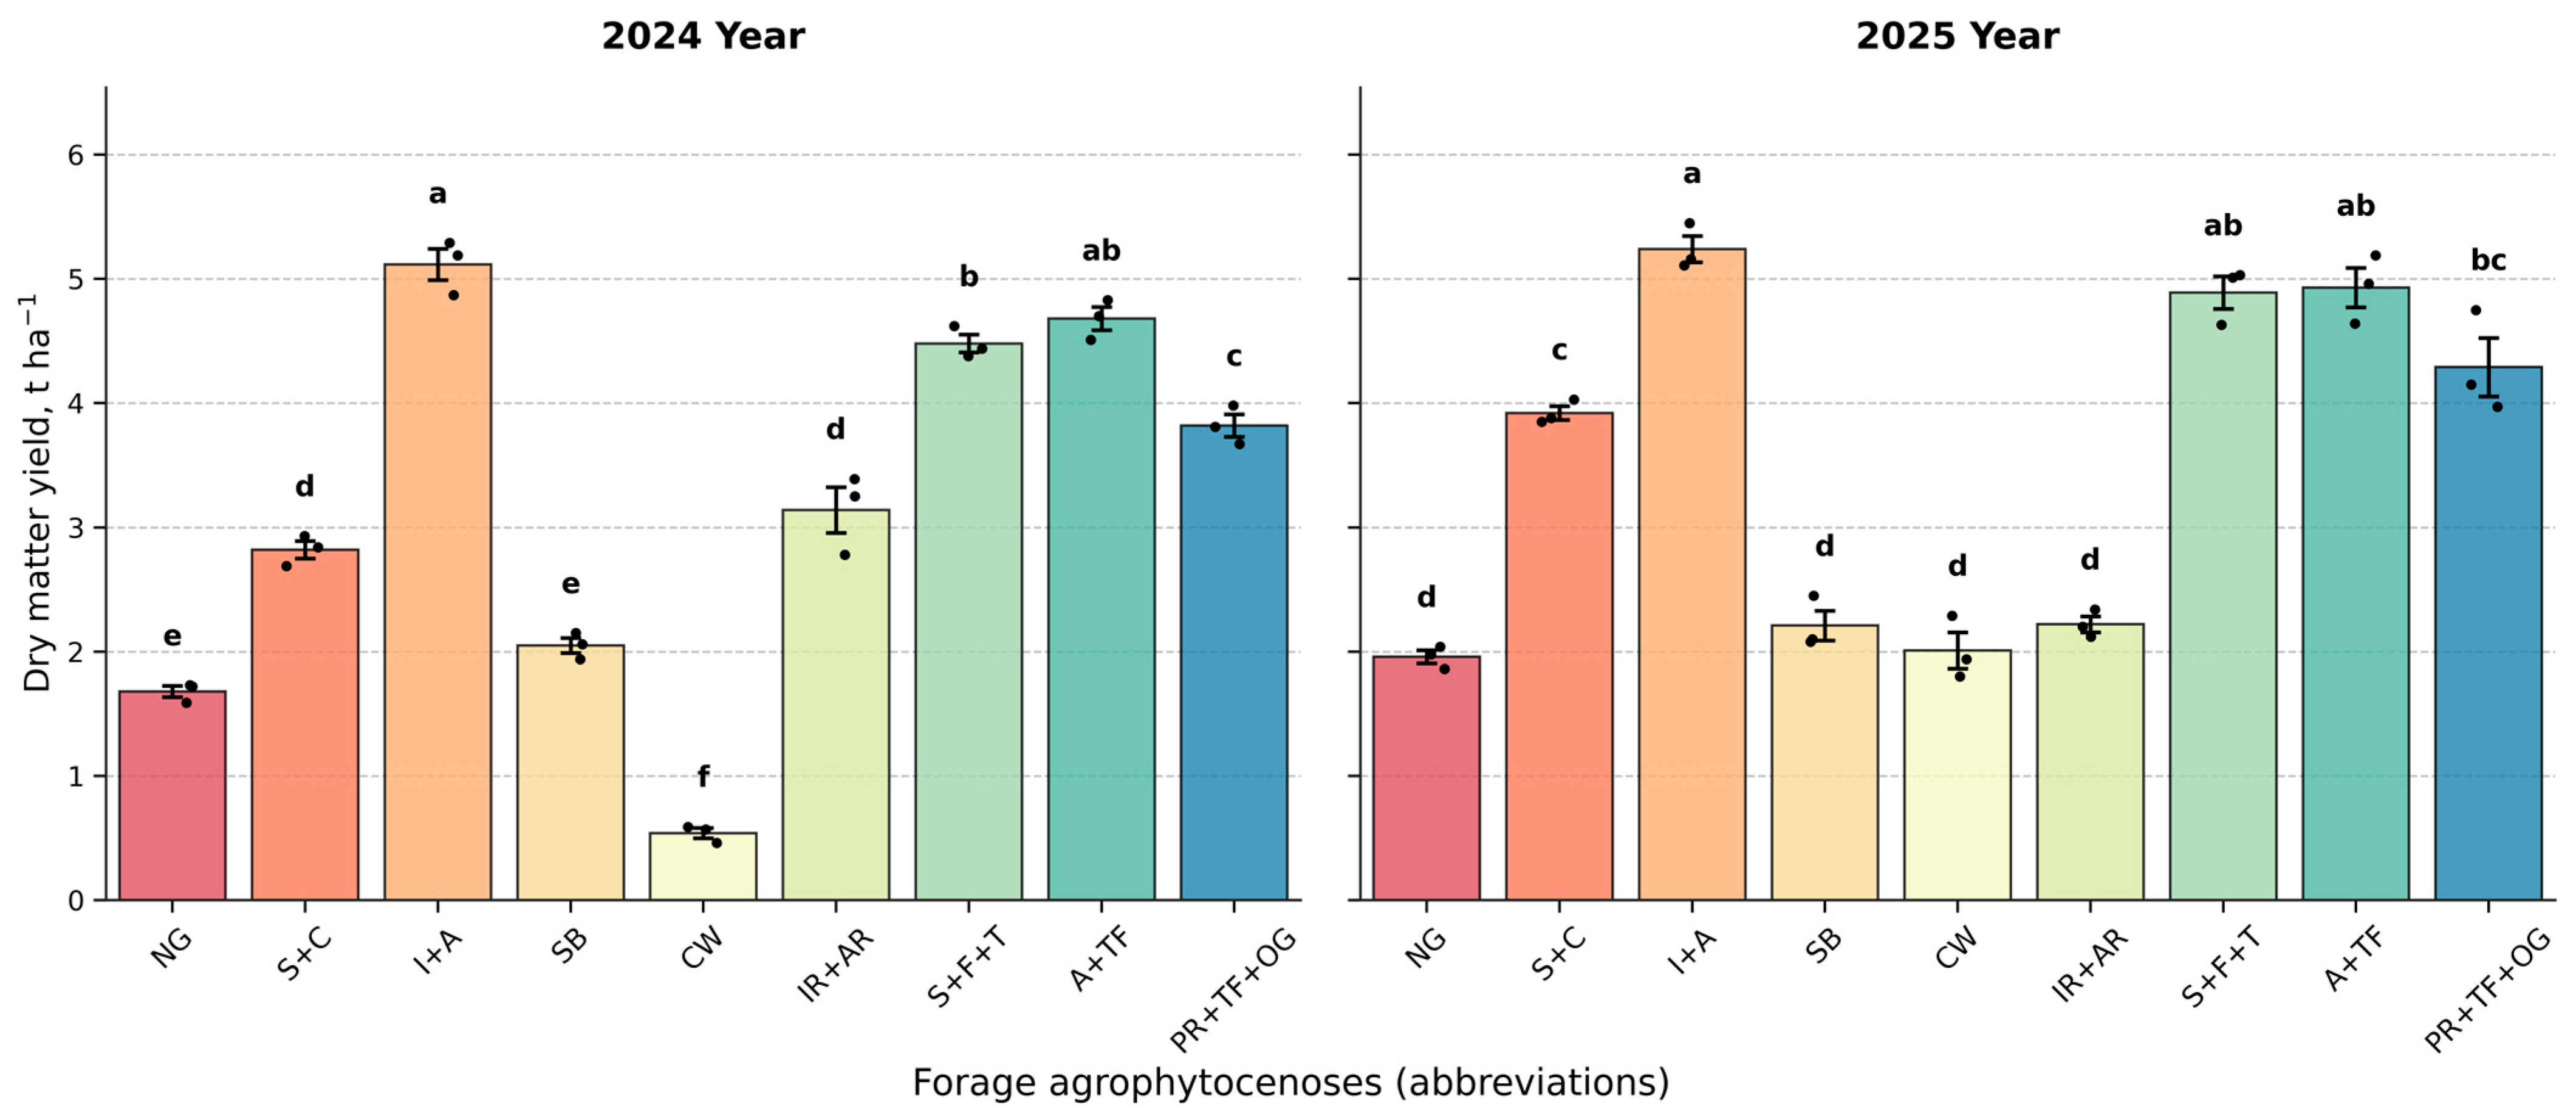
In the second year of vegetation (2025), the majority of agrophytocenoses exhibited an upward trend in yield, signaling the transition of perennial grasses to a phase of maximum vegetative development and intensified tillering. As shown in the dry matter analysis (Figure 12), legume–grass mixtures maintained their dominance.
The mixture Lolium multiflorum + Medicago sativa (I+A) produced 19.66 t ha−1 of green biomass and 5.24 t ha−1 of dry matter, while Medicago sativa + Festuca arundinacea (A+TF) yielded 19.12 and 4.93 t ha−1, respectively. High yield levels were also observed in Onobrychis viciifolia + Festulolium + Phleum pratense (S+F+T) (17.98 and 4.89 t ha−1) and Lolium perenne + Festuca arundinacea + Dactylis glomerata (PR+TF+OG) (16.57 and 4.29 t ha−1).
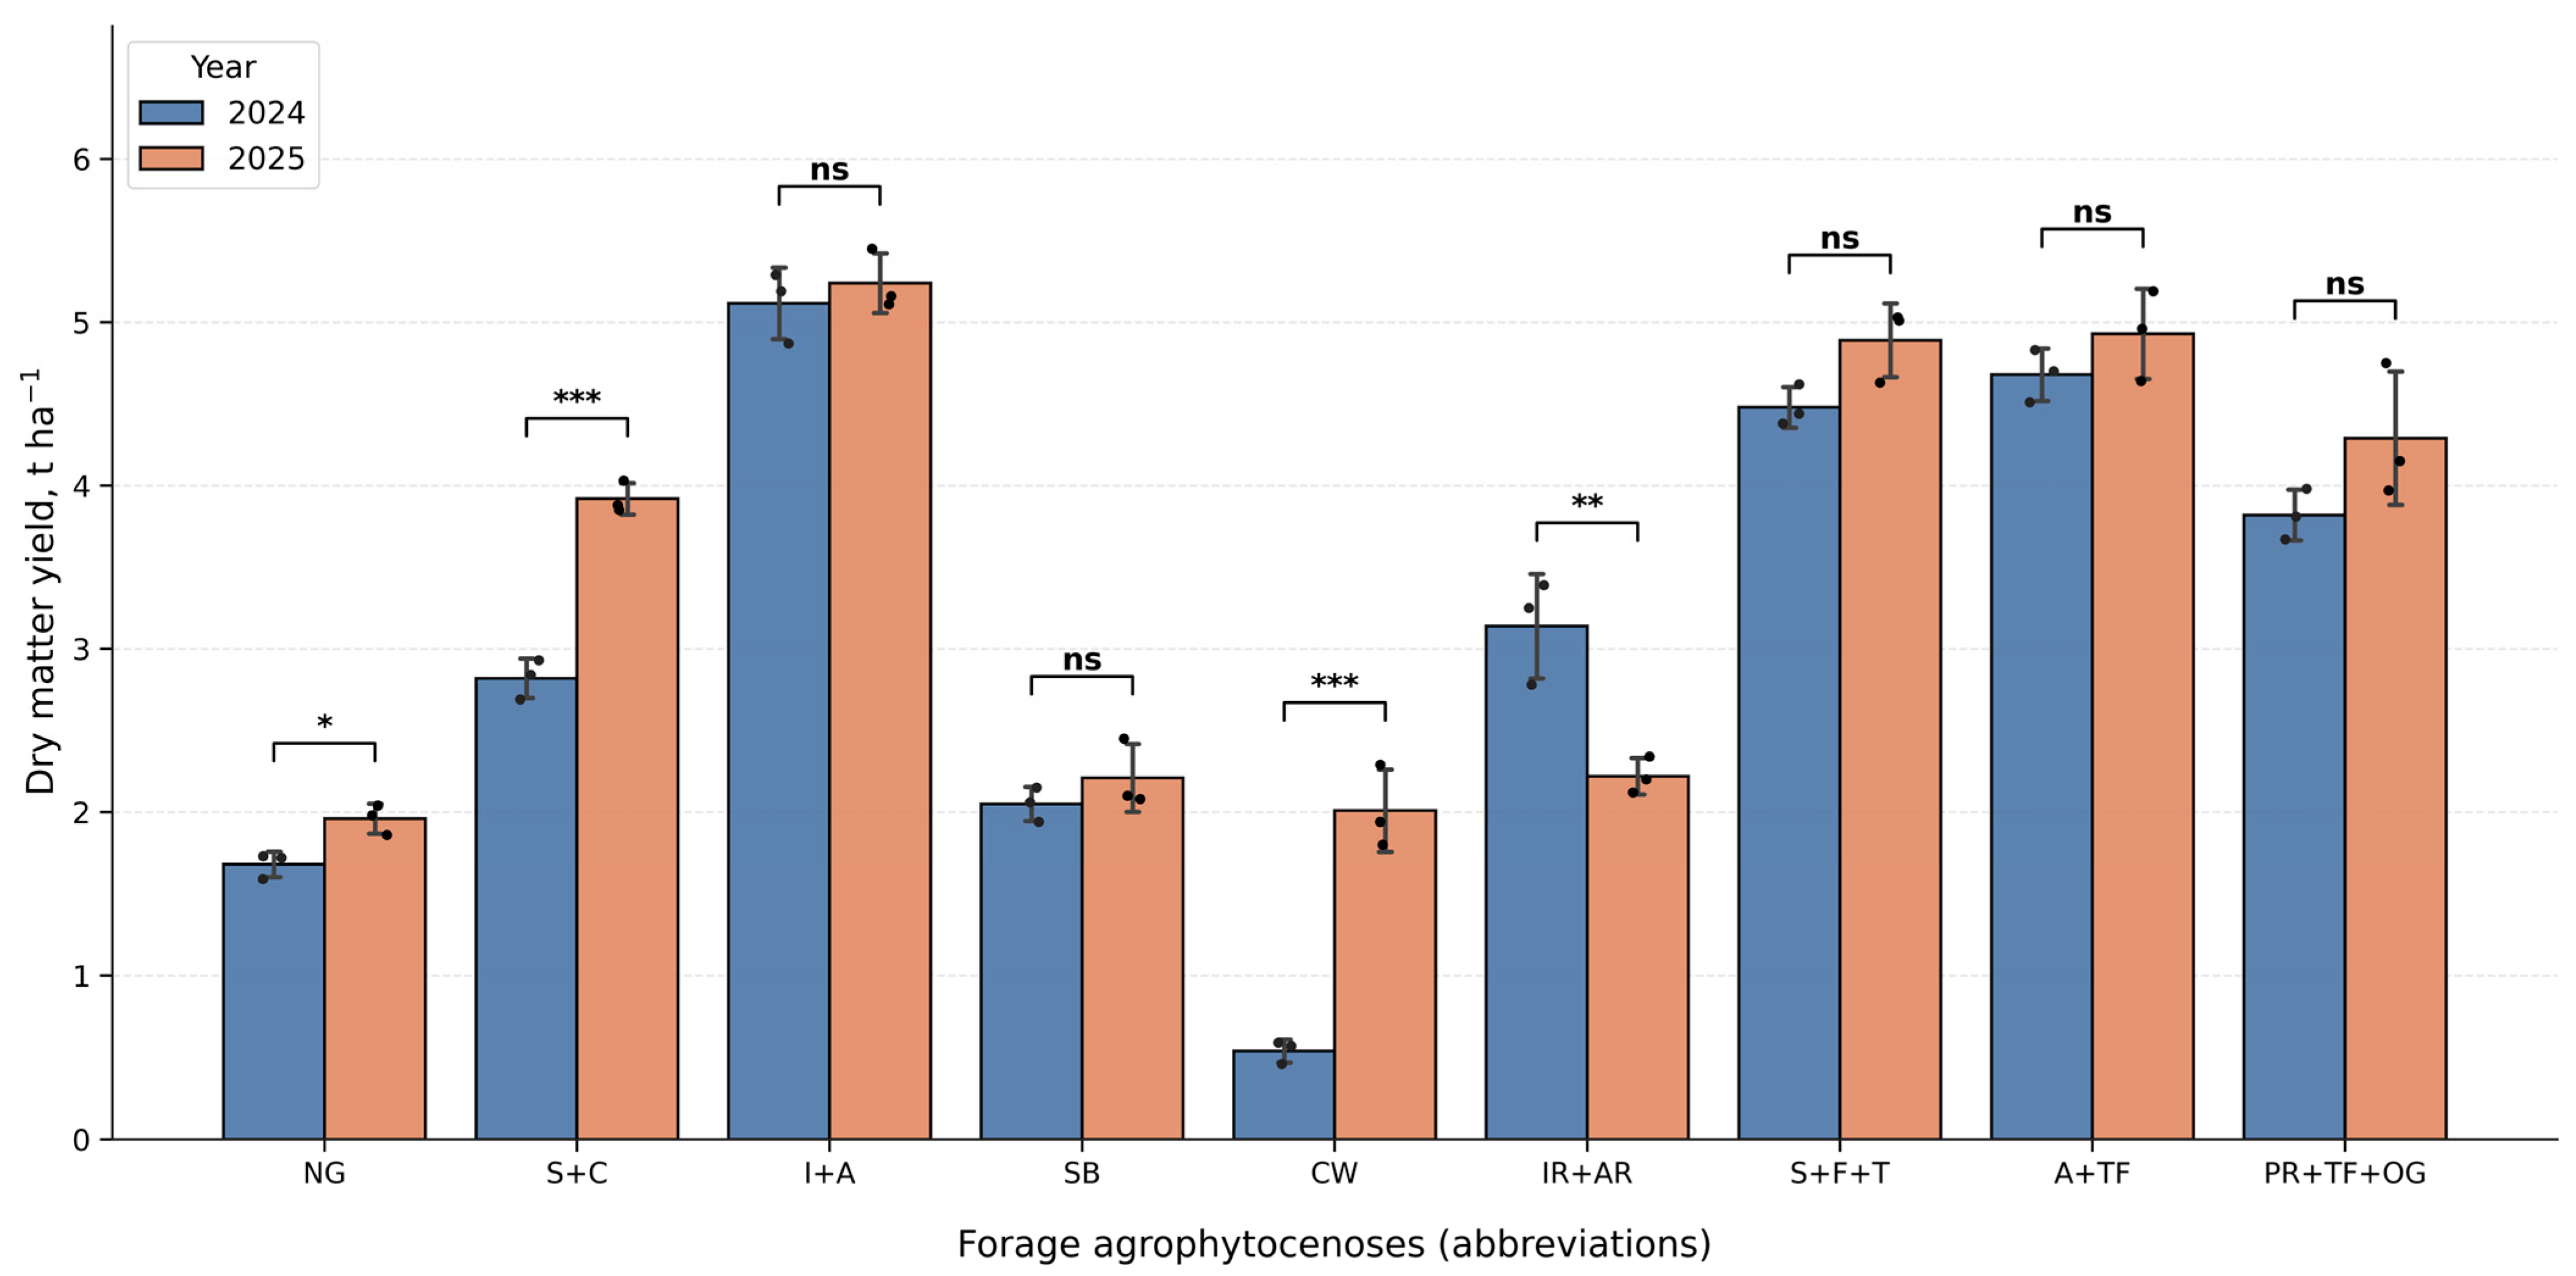
A substantial increase in productivity was observed in the mixture Onobrychis viciifolia + Agropyron cristatum (S+C), 14.97 t ha−1 green biomass and 2.01 t ha−1 dry matter, indicating improved development of both components in the second year of vegetation. Monocultures of Bromus inermis and Agropyron cristatum maintained stable but moderate productivity, yielding 8.37 and 6.28 t ha−1 of green biomass and 2.21 and 2.01 t ha−1 of dry matter, respectively. Notably, Agropyron cristatum demonstrated the most pronounced relative increase compared with the first year, which is consistent with its biological growth characteristics [55]. The overall dynamics of dry matter accumulation are summarized in Figure 13.
A decrease in yield was observed in the mixture Lolium multiflorum + Lolium annuum (IR+AR), 8.56 t ha−1 green biomass and 2.22 t ha−1 dry matter. This reduction is primarily associated with the loss of the annual component (Lolium annuum) after the first growing season and with competitive interactions during the establishment year that limited the yield potential of the perennial component.
Comparison of yield data between 2024 and 2025 indicates that most perennial species and mixtures exhibited higher productivity in the second year of growth, confirming general patterns of productivity formation in perennial agrophytocenoses. The most pronounced yield increases were observed in treatments containing Agropyron cristatum, particularly in the mixture Onobrychis viciifolia + Agropyron cristatum (S+C) and in monoculture Agropyron cristatum.

4. Conclusions

This study demonstrated that diversified forage agrophytocenoses can substantially improve forage production in the forest–steppe zone of Northern Kazakhstan. Across 2024–2025, the tested variants differed significantly in stand structure (height and density) and biomass productivity, confirming the clear advantage of mixed-species stands over natural grass cover and most grass monocultures.
The most productive agrophytocenoses in both years were the legume–grass mixtures Lolium multiflorum Lam. + Medicago sativa L. (I+A), Medicago sativa L. + Festuca arundinacea Schreb. (A+TF), and the multi-component stand Onobrychis viciifolia Scop. + Festulolium (Festuca × Lolium) + Phleum pratense L (S+F+T). Their yield superiority is primarily explained by complementary interspecific interactions, dense canopy formation, and the contribution of legumes through biological nitrogen fixation, which supports rapid vegetative growth and efficient resource use.
Grass-based stands generally produced lower yields during the establishment year, reflecting the typical developmental pattern of perennial grasses. However, in 2025 several perennial grass treatments demonstrated strong improvements. Bromus inermis Leyss. (SB) expressed particularly high regrowth potential, while Agropyron cristatum (L.) Gaertn. (CW) showed marked second-year development, consistent with its slower establishment but strong long-term persistence. These species may therefore be valuable for durable hay and pasture systems, although their limited first-year productivity should be considered in management decisions.
The weakest performance was recorded in stands lacking legumes or showing reduced persistence. In particular, Agropyron cristatum (L.) Gaertn. (CW) monoculture produced the lowest yields in 2024 due to slow early development. In addition, the mixture Lolium multiflorum Lam. + Lolium annuum Lam. (IR+AR) declined in the second year, likely because of the disappearance of the annual component and subsequent reduction in stand density. This emphasizes that forage mixtures must be designed not only for high initial biomass but also for stability across years.
From a practical perspective, forage producers in Northern Kazakhstan should prioritize legume–grass mixtures (especially I+A, A+TF, and S+F+T) to achieve high and stable yields and improve the protein content of the forage base. Perennial grasses such as SB and CW can serve as long-term foundation species, particularly in persistent grasslands, but are most effective when integrated into systems that compensate for their slower first-year productivity.

5. Patents

As an outcome of this research, a utility model patent has been granted in the Republic of Kazakhstan: Shayakhmetova, A.S.; Savenkova, I.V.; Temirbulatova, A.K.; Akhmetov, M.B.; Useinov, A.A.; Nasiyev, B.N. Method of foraging. Utility Model Patent No. 10556, granted on 16 May 2025.

Supplementary Materials

The following supporting information can be downloaded at https://www.mdpi.com/article/10.3390/agronomy16060620/s1, Supplementary Table S1. Monthly and decadal dynamics of meteorological parameters at the experimental site during the 2024–2025 growing seasons. Supplementary Table S2. Raw experimental data on plant density, height, and biomass yield for the nine forage agrophytocenoses (2024–2025). Supplementary Figure S1. Soil sampling map.

Author Contributions

Conceptualization, A.B. and A.S.; methodology, A.B. and A.S.; software, A.B.; validation, A.S., I.S. and B.N.; formal analysis, A.B.; investigation, A.B., A.S., I.S., M.A., A.U., A.T., Y.I., F.M., M.K. and G.B.; resources, B.N., B.K. and A.S.; data curation, A.B., A.S. and I.S.; writing—original draft preparation, A.B.; writing—review and editing, A.S., I.S., B.N., B.K. and M.A.; visualization, A.B.; supervision, A.S. and B.N.; project administration, A.B. and A.S.; funding acquisition, A.S. and B.N. All authors have read and agreed to the published version of the manuscript.

Funding

This research was funded by the Ministry of Agriculture of the Republic of Kazakhstan, grant number BR22883585 “Development of effective technologies to increase productive potential and rational use of pastures.”

Institutional Review Board Statement

Not applicable.

Informed Consent Statement

Not applicable.

Data Availability Statement

The original contributions presented in the study are included in the article/Supplementary Materials, and further inquiries can be directed to the corresponding author.

Conflicts of Interest

The authors declare no conflicts of interest.

Abbreviations

The following abbreviations are used in this manuscript:
NGNatural grass cover (control)
S+CSainfoin (Onobrychis viciifolia Scop.) + crested wheatgrass (Agropyron cristatum (L.) Gaertn.)
I+AItalian ryegrass (Lolium multiflorum Lam.) + alfalfa (Medicago sativa L.)
SBSmooth brome (Bromus inermis Leyss.)
CWCrested wheatgrass (Agropyron cristatum (L.) Gaertn.)
IR+ARItalian ryegrass (Lolium multiflorum Lam.) + annual ryegrass (Lolium annuum Lam.)
S+F+TSainfoin (Onobrychis viciifolia Scop.) + Festulolium (×Festulolium (Festuca × Lolium)) + Timothy grass (Phleum pratense L)
A+TFGreen Line Alpha Protein Grass Mix: alfalfa 75% (Medicago sativa L.) + tall fescue 25% (Festuca arundinacea Schreb.)
PR+TF+OGGreen Line Grass Seed Mixture Base: perennial ryegrass 30% (Lolium perenne L.) + tall fescue 50% (Festuca arundinacea Schreb.) + orchard grass 20% (Dactylis glomerata L.)

References

  1. Cherlet, M.; Hutchinson, C.; Reynolds, J.; Hill, J.; Sommer, S.; Von, M.G. World Atlas of Desertification; Publications Office of the European Union: Luxembourg, 2018. [Google Scholar]
  2. Zucca, C.; Middleton, N.; Kang, U.; Liniger, H. Shrinking Water Bodies as Hotspots of Sand and Dust Storms: The Role of Land Degradation and Sustainable Soil and Water Management. Catena 2021, 207, 105669. [Google Scholar] [CrossRef]
  3. Kikstra, J.S.; Nicholls, Z.R.J.; Smith, C.J.; Lewis, J.; Lamboll, R.D.; Byers, E.; Sandstad, M.; Meinshausen, M.; Gidden, M.J.; Rogelj, J.; et al. The IPCC Sixth Assessment Report WGIII Climate Assessment of Mitigation Pathways: From Emissions to Global Temperatures. Geosci. Model Dev. 2022, 15, 9075–9109. [Google Scholar] [CrossRef]
  4. Nokusheva, Z.A.; Kantarbayeva, Z.A.; Zhaksalykov, R.A.; Zhantleuov, D.A.; Isaeva, Z.B. Productivity of American Alfalfa Varieties under the Conditions of Northern Kazakhstan. Sci. Pract. J. Zhangir Khan West Kazakhstan Agrar.-Tech. Univ. 2025, 3, 230–240. [Google Scholar] [CrossRef]
  5. Fuglie, K.; Peters, M.; Burkart, S. The Extent and Economic Significance of Cultivated Forage Crops in Developing Countries. Front. Sustain. Food Syst. 2021, 5, 712136. [Google Scholar] [CrossRef]
  6. Stybayev, G.; Zargar, M.; Nasiyev, B.; Batielenova, A.; Nogayev, A. Rotational Pasture Management for Ameliorating Productivity and Feed Value of Vegetation, Soil Quality, and Sustainability in Dry Steppe Zone. Online J. Biol. Sci. 2025, 25, 209–218. [Google Scholar] [CrossRef]
  7. Shayakhmetova, A.; Bakirov, A.; Savenkova, I.; Nasiyev, B.; Akhmetov, M.; Useinov, A.; Temirbulatova, A.; Zhanatalapov, N.; Bekkaliyev, A.; Mukanova, F.; et al. Optimization of Productivity of Fodder Crops with Green Conveyor System in the Context of Climate Instability in the North Kazakhstan Region. Sustainability 2024, 16, 9024. [Google Scholar] [CrossRef]
  8. Stybayev, G.; Serekpayev, N.; Yancheva, H.; Baitelenova, A.; Nogayev, A.; Khurmetbek, O.; Mukhanov, N. Succession Dynamics, Quality, and Production in Improved and Natural Pastures in Northern Kazakhstan. Bulg. J. Agric. Sci. 2021, 27, 95–102. Available online: https://www.agrojournal.org/27/01s-12.pdf (accessed on 7 March 2026).
  9. Issanova, G.; Saduakhas, A.; Abuduwaili, J.; Tynybayeva, K.; Tanirbergenov, S. Desertification and Land Degradation in Kazakhstan. Sci. J. Pedagog. Econ. 2020, 5, 95–102. Available online: https://journals.nauka-nanrk.kz/bulletin-science/article/view/829 (accessed on 9 March 2026). [CrossRef]
  10. Bi, X.; Li, B.; Zhang, L.; Nan, B.; Zhang, X.; Yang, Z. Response of Grassland Productivity to Climate Change and Anthropogenic Activities in Arid Regions of Central Asia. PeerJ 2020, 8, e9797. [Google Scholar] [CrossRef]
  11. Chen, T.; Bao, A.; Jiapaer, G.; Guo, H.; Zheng, G.; Jiang, L.; Chang, C.; Tuerhanjiang, L. Disentangling the Relative Impacts of Climate Change and Human Activities on Arid and Semiarid Grasslands in Central Asia during 1982–2015. Sci. Total Environ. 2019, 653, 1311–1325. [Google Scholar] [CrossRef]
  12. Yang, Y.; Xu, M.; Sun, J.; Qiu, J.; Pei, W.; Zhang, K.; Xu, X.; Liu, D. Dynamic of Grassland Degradation and Its Driving Forces from Climate Variation and Human Activities in Central Asia. Agronomy 2023, 13, 2763. [Google Scholar] [CrossRef]
  13. Godde, C.M.; Boone, R.B.; Ash, A.J.; Waha, K.; Sloat, L.L.; Thornton, P.K.; Herrero, M. Global Rangeland Production Systems and Livelihoods at Threat under Climate Change and Variability. Environ. Res. Lett. 2020, 15, 044021. [Google Scholar] [CrossRef]
  14. Konopianov, K.; Anikina, I.; Omarova, K.; Arystangulov, S.; Omarov, M.; Tuganova, B.; Kabykenov, T. Enhancing the Effectiveness of Feed Production in Arid Areas, Northern Kazakhstan, Considering the Utilization of Soil Moisture Resources. Online J. Biol. Sci. 2024, 24, 515–523. [Google Scholar] [CrossRef]
  15. Akhylbekova, B.; Serekpayev, N.; Nogayev, A.; Zhumabek, B. Pasture Productivity Depending on the Method of Pasture Use in the Steppe Zone of Northern Kazakhstan. Online J. Biol. Sci. 2022, 22, 476–483. [Google Scholar] [CrossRef]
  16. Jaramillo, D.M.; Sheridan, H.; Soder, K.; Dubeux, J.C.B., Jr. Enhancing the Sustainability of Temperate Pasture Systems through More Diverse Swards. Agronomy 2021, 11, 1912. [Google Scholar] [CrossRef]
  17. Ashilenje, D.S.; Amombo, E.; Hirich, A.; Kouisni, L.; Devkota, K.P.; El Mouttaqi, A.; Nilahyane, A. Crop Species Mechanisms and Ecosystem Services for Sustainable Forage Cropping Systems in Salt-Affected Arid Regions. Front. Plant Sci. 2022, 13, 899926. [Google Scholar] [CrossRef] [PubMed]
  18. Capstaff, N.M.; Miller, A.J. Improving the Yield and Nutritional Quality of Forage Crops. Front. Plant Sci. 2018, 9, 535. [Google Scholar] [CrossRef]
  19. Gulwa, U.; Mgujulwa, N.; Beyene, S.T. Benefits of Grass-Legume Inter-Cropping in Livestock Systems. Afr. J. Agric. Res. 2018, 13, 1311–1319. [Google Scholar] [CrossRef]
  20. Helgadóttir, Á.; Suter, M.; Gylfadóttir, T.Ó.; Kristjánsdóttir, T.A.; Lüscher, A. Grass–Legume Mixtures Sustain Strong Yield Advantage over Monocultures under Cool Maritime Growing Conditions over a Period of 5 Years. Ann. Bot. 2018, 122, 337–348. [Google Scholar] [CrossRef]
  21. Wang, T.; Wang, B.; Xiao, A.; Lan, J. Optimizing Seeding Ratio for Legume Forage to Maximize System Productivity and Resource Use Efficiency in Mixed Cropping Systems. Agriculture 2024, 14, 1249. [Google Scholar] [CrossRef]
  22. Nugmanov, A.B.; Mamikhin, S.V.; Valiev, K.K.; Bugubaeva, A.U.; Tokusheva, A.S.; Tulkubaeva, S.A.; Bulaev, A.G. Poly-Species Phytocenoses for Ecosystem Restoration of Degraded Soil Covers. Online J. Biol. Sci. 2022, 22, 268–278. [Google Scholar] [CrossRef]
  23. Yan, Y.; Connolly, J.; Liang, M.; Jiang, L.; Wang, S. Mechanistic Links between Biodiversity Effects on Ecosystem Functioning and Stability in a Multi-site Grassland Experiment. J. Ecol. 2021, 109, 3370–3378. [Google Scholar] [CrossRef]
  24. Wang, Y.; Cadotte, M.W.; Chen, Y.; Fraser, L.H.; Zhang, Y.; Huang, F.; Luo, S.; Shi, N.; Loreau, M. Global Evidence of Positive Biodiversity Effects on Spatial Ecosystem Stability in Natural Grasslands. Nat. Commun. 2019, 10, 3207. [Google Scholar] [CrossRef] [PubMed]
  25. Jensen, J.L.; Eriksen, J. Soil Carbon Sequestration Potential of Grass-Clover Leys: Effect of Grassland Proportion and Organic Fertilizer. Geoderma 2022, 424, 116022. [Google Scholar] [CrossRef]
  26. Luo, C.L.; Duan, H.X.; Wang, Y.L.; Liu, H.J.; Xu, S.X. Complementarity and Competitive Trade-Offs Enhance Forage Productivity, Nutritive Balance, Land and Water Use, and Economics in Legume-Grass Intercropping. Field Crops Res. 2024, 319, 109642. [Google Scholar] [CrossRef]
  27. Elgersma, A.; Søegaard, K. Changes in Nutritive Value and Herbage Yield during Extended Growth Intervals in Grass–Legume Mixtures: Effects of Species, Maturity at Harvest, and Relationships between Productivity and Components of Feed Quality. Grass Forage Sci. 2018, 73, 78–93. [Google Scholar] [CrossRef]
  28. Eriksen, J.; Askegaard, M.; Søegaard, K. Complementary Effects of Red Clover Inclusion in Ryegrass–White Clover Swards for Grazing and Cutting. Grass Forage Sci. 2014, 69, 241–250. [Google Scholar] [CrossRef]
  29. Tahir, M.; Li, C.; Zeng, T.; Xin, Y.; Chen, C.; Javed, H.H.; Yang, W.; Yan, Y. Mixture Composition Influenced the Biomass Yield and Nutritional Quality of Legume–Grass Pastures. Agronomy 2022, 12, 1449. [Google Scholar] [CrossRef]
  30. Yan, H.; Gu, S.; Li, S.; Shen, W.; Zhou, X.; Yu, H.; Ma, K.; Zhao, Y.; Wang, Y.; Zheng, H. Grass-Legume Mixtures Enhance Forage Production via the Bacterial Community. Agric. Ecosyst. Environ. 2022, 338, 108087. [Google Scholar] [CrossRef]
  31. Iglovikov, V.T.; Konyushkov, N.S.; Melnichuk, V.P. Methodology of the Experiments on Hay Fields and Pastures; All-Russian Research Institute of Phytopathology (VNIIF): Moscow, Russia, 1971; Volume 1, 174p.
  32. Dospekhov, B.A. Field Experiment Methodology: (With the Basics of Statistical Processing of Research Results); Al’yans: Moscow, Russia, 2011. [Google Scholar]
  33. Tarawali, S.A. Methods for the Evaluation of Forage Legumes, Grasses and Fodder Trees for Use as Livestock Feed; ILRI (aka ILCA and ILRAD): Nairobi, Kenya, 1995; Volume 1. [Google Scholar]
  34. Bakirov, A.; Kostyuchenkov, N.; Kostyuchenkova, O.; Grishin, A.; Omarbekova, A.; Zagainov, N. Application of Seed Miss Prevention System for a Spoon-Wheel Type Precision Seed Metering Device: Effectiveness and Limitations. Agriculture 2025, 15, 1363. [Google Scholar] [CrossRef]
  35. Keeney, D.R.; Nelson, D.W. Nitrogen—Inorganic Forms. In Methods Soil Analysis. Part 2: Chemical Microbiological Properties; Page, A.L., Miller, R.H., Keeney, D.R., Eds.; American Society of Agronomy: Madison, WI, USA, 1982; pp. 643–698. [Google Scholar]
  36. State Standard No 26205-91; Soils. Determination of Mobile Phosphorus and Potassium Compounds Using the Machigin Method. Standards Publishing: Moscow, Russia, 1991. Available online: https://allgosts.ru/13/080/gost_26205-91 (accessed on 12 May 2024).
  37. Massoumi, A.; Cornfield, A.H. A Rapid Method for Determining Sulphate in Water Extracts of Soils. Analyst 1963, 88, 321–322. [Google Scholar] [CrossRef]
  38. Chaudhary, I.A.; Cornfield, A.H. The Determination of Total Sulphur in Soil and Plant Material. Analyst 1966, 91, 528–530. [Google Scholar] [CrossRef]
  39. Walkley, A. A Critical Examination of a Rapid Method for Determining Organic Carbon in Soils—Effect of Variations in Digestion Conditions and of Inorganic Soil Constituents. Soil Sci. 1947, 63, 251–264. [Google Scholar] [CrossRef]
  40. Walkley, A.; Black, I.A. An Examination of the Degtjareff Method for Determining Soil Organic Matter, and a Proposed Modification of the Chromic Acid Titration Method. Soil Sci. 1934, 37, 29–38. [Google Scholar] [CrossRef]
  41. State Standard No 26423-85; Soils. Methods for Determining Specific Electrical Conductivity, PH, and Solid Residue of Water Extract. Standards Publishing: Moscow, Russia, 1986. Available online: https://allgosts.ru/13/080/gost_26423-85 (accessed on 12 May 2024).
  42. Scattolin, M.; Peuble, S.; Pereira, F.; Paran, F.; Moutte, J.; Menad, N.; Faure, O. Aided-Phytostabilization of Steel Slag Dumps: The Key-Role of PH Adjustment in Decreasing Chromium Toxicity and Improving Manganese, Phosphorus and Zinc Phytoavailability. J. Hazard. Mater. 2021, 405, 124225. [Google Scholar] [CrossRef]
  43. Barrow, N.J.; Hartemink, A.E. The Effects of PH on Nutrient Availability Depend on Both Soils and Plants. Plant Soil 2023, 487, 21–37. [Google Scholar] [CrossRef]
  44. Olszewska, M. Micronutrient Content of Aboveground Biomass as Influenced by Different Proportions of Medicago Media Pers. In Two-Component Alfalfa–Grass Mixtures. Agriculture 2024, 14, 2205. [Google Scholar] [CrossRef]
  45. Poorter, H.; Niklas, K.J.; Reich, P.B.; Oleksyn, J.; Poot, P.; Mommer, L. Biomass Allocation to Leaves, Stems and Roots: Meta-analyses of Interspecific Variation and Environmental Control. New Phytol. 2012, 193, 30–50. [Google Scholar] [CrossRef] [PubMed]
  46. Walker, M.J.; Spigler, R.B. Experimental Evidence of Inbreeding Depression for Competitive Ability and Its Population-Level Consequences in a Mixed-Mating Plant. Front. Plant Sci. 2024, 15, 1398060. [Google Scholar] [CrossRef]
  47. Schwinning, S.; Weiner, J. Mechanisms Determining the Degree of Size Asymmetry in Competition among Plants. Oecologia 1998, 113, 447–455. [Google Scholar] [CrossRef] [PubMed]
  48. Shamanin, A.A.; Ivanov, S.V.; Petrov, D.N.; Kuznetsova, E.V. Features of Establishment of Grass–Legume Mixed Swards in the First Year of Growth. J. Forage Sci. Grassl. Manag. 2021, 5, 45–54. [Google Scholar] [CrossRef]
  49. Smoliak, S.; Johnston, A.; Lutwick, L.E. Productivity and Durability of Crested Wheatgrass in Southeastern Alberta. Can. J. Plant Sci. 1967, 47, 539–548. [Google Scholar] [CrossRef]
  50. Faji, M.; Kebede, G.; Feyissa, F.; Mohammed, K.; Minta, M.; Mengistu, S.; Tsegahun, A. Evaluation of Ten Perennial Forage Grasses for Biomass and Nutritional Quality. Trop. Grassl.-Forrajes Trop. 2021, 9, 292–299. [Google Scholar] [CrossRef]
  51. Hulke, B.S.; Watkins, E.; Wyse, D.L.; Ehlke, N.J. Freezing Tolerance of Selected Perennial Ryegrass (Lolium perenne L.) Accessions and Its Association with Field Winterhardiness and Turf Traits. Euphytica 2008, 163, 131–141. [Google Scholar] [CrossRef]
  52. Luo, F.; Mi, W.; Liu, W. Legume–Grass Mixtures Improve Biological Nitrogen Fixation and Nitrogen Transfer by Promoting Nodulation and Altering Root Conformation in Different Ecological Regions of the Qinghai–Tibet Plateau. Front. Plant Sci. 2024, 15, 1375166. [Google Scholar] [CrossRef]
  53. Fitter, A.H. Allocation as Components of the Plastic Response of Root Systems to Soil Heterogeneity. In Exploitation of Environmental Heterogeneity by Plants: Ecophysiological Processes Above-and Belowground; Academic Press: San Diego, CA, USA, 1994; pp. 305–323. [Google Scholar]
  54. Jensen, E.S. Grain Yield, Symbiotic N2 Fixation and Interspecific Competition for Inorganic N in Pea-Barley Intercrops. Plant Soil 1996, 182, 25–38. [Google Scholar] [CrossRef]
  55. Poudel, K.; Sheaffer, C.; Jungers, J.M.; Weihs, B.J.; Lamb, J.F.S.; Bauder, S.; Picasso, V.; Heuschele, J.; Xu, Z. Quantifying Winter Survival of Alfalfa [Medicago sativa (L.)]. Agron. J. 2024, 116, 170–179. [Google Scholar] [CrossRef]
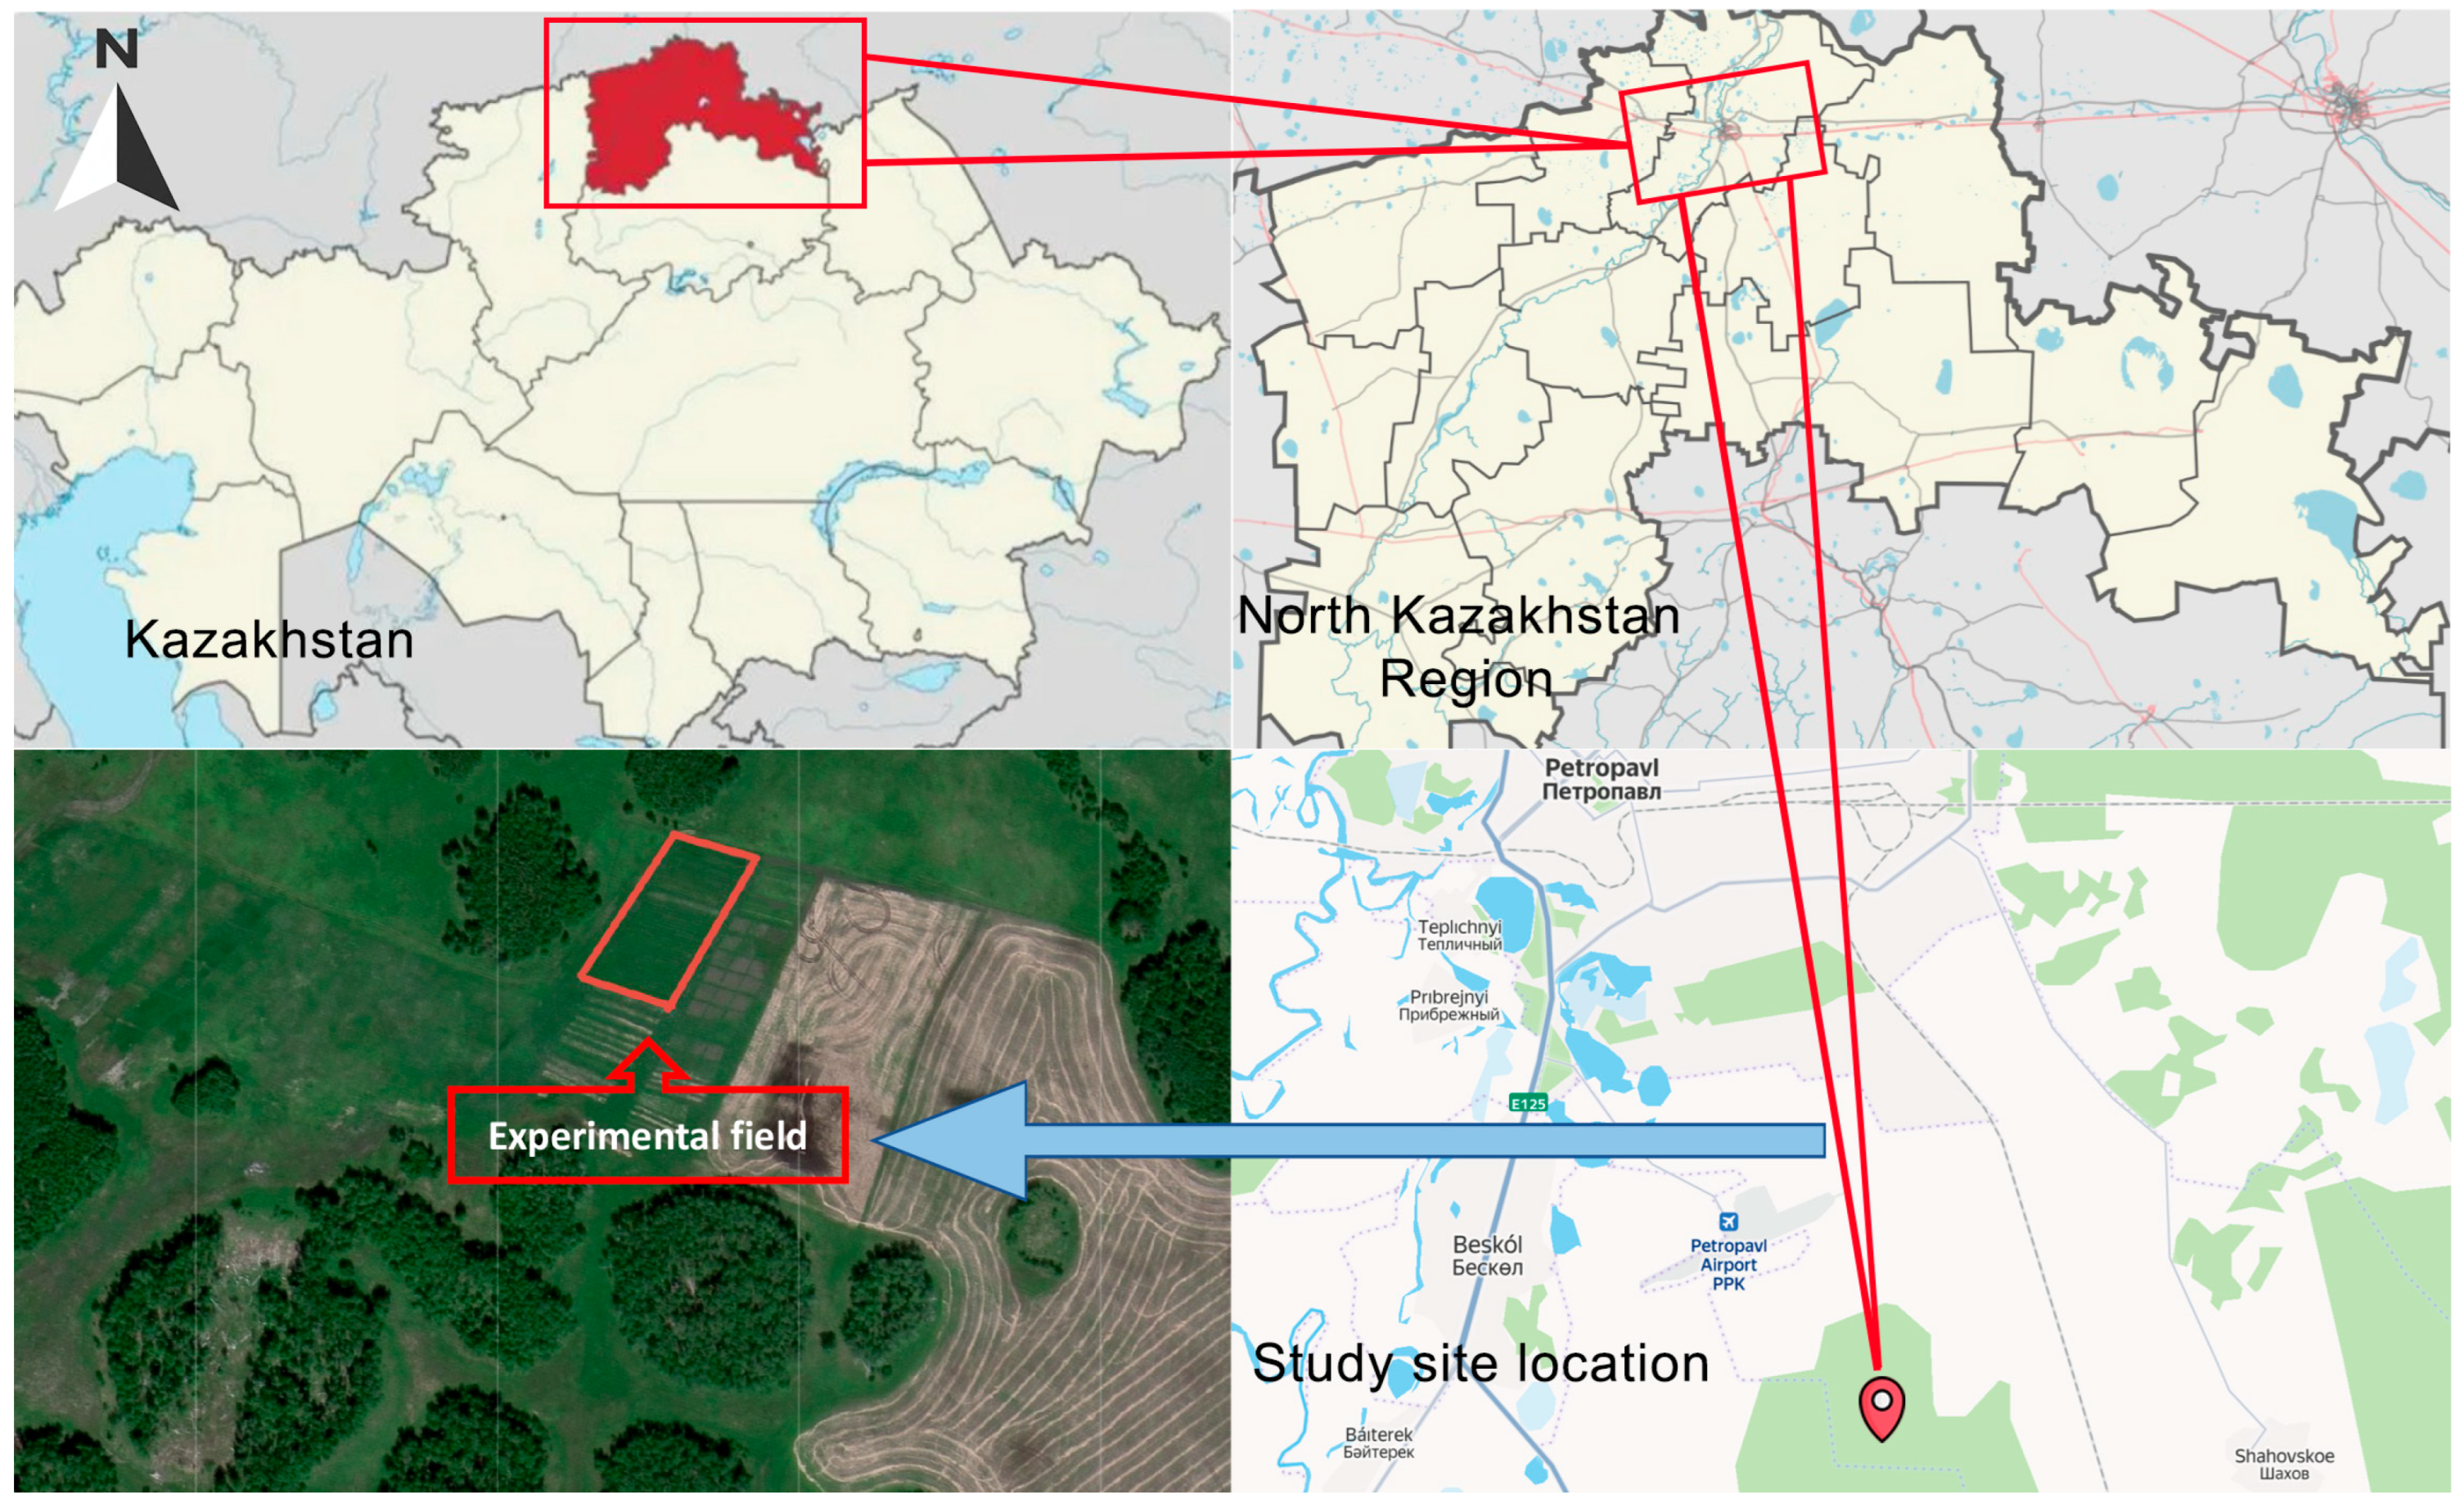
Figure 1. Location of the experimental field in the North Kazakhstan Region, Kazakhstan.
Agronomy 16 00620 g001
Figure 2. Field layout marking and sowing operations.
Agronomy 16 00620 g002
Figure 3. Monthly air temperature during 2024 and 2025 compared to the long-term average.
Agronomy 16 00620 g003
Figure 4. Monthly precipitation during 2024 and 2025 compared to the long-term average.
Agronomy 16 00620 g004
Figure 5. General view of the experimental plots in the second year after sowing (2025 year).
Agronomy 16 00620 g005
Figure 6. Plant height of different agrophytocenoses in the 2024 and 2025 growing seasons. Data are presented as mean ± standard error (SE). Black dots represent individual observations. Different lowercase letters above the bars indicate statistically significant differences between treatments within the same year (one-way ANOVA followed by Tukey’s HSD test, p < 0.05). Abbreviations of agrophytocenosis names correspond to those listed in Table 1.
Agronomy 16 00620 g006
Figure 7. Comparative analysis of plant height for nine agrophytocenoses between the 2024 and 2025 vegetation periods. Data are expressed as mean ± standard deviation (SD). Black dots represent individual observations. Asterisks indicate significant differences between years for each treatment as determined by an independent two-sample t-test: *** p < 0.001. Abbreviations of agrophytocenosis names correspond to those listed in Table 1.
Agronomy 16 00620 g007
Figure 8. Plant density of different agrophytocenoses in the 2024 and 2025 growing seasons. Data are presented as mean ± standard error (SE). Black dots represent individual observations. Different lowercase letters above the bars indicate statistically significant differences between treatments within the same year (one-way ANOVA followed by Tukey’s HSD test, p < 0.05). Abbreviations of agrophytocenosis names correspond to those listed in Table 1.
Agronomy 16 00620 g008
Figure 9. Comparative analysis of plant density for nine agrophytocenoses between the 2024 and 2025 vegetation periods. Data are presented as mean ± standard deviation (SD). Black dots represent individual observations. Asterisks indicate significant differences between years for each treatment (independent two-sample t-test): * p < 0.05, ** p < 0.01, *** p < 0.001; ns, not significant. Abbreviations of agrophytocenosis names correspond to those listed in Table 1.
Agronomy 16 00620 g009
Figure 10. Green mass yield of different agrophytocenoses in the 2024 and 2025 growing seasons. Data are presented as mean ± standard error (SE). Black dots represent individual observations. Different lowercase letters above the bars indicate statistically significant differences between treatments within the same year (one-way ANOVA followed by Tukey’s HSD test, p < 0.05). Abbreviations of agrophytocenosis names correspond to those listed in Table 1.
Agronomy 16 00620 g010
Figure 11. Comparative analysis of green mass yield for nine agrophytocenoses between the 2024 and 2025 vegetation periods. Data are expressed as mean ± standard deviation (SD). Black dots represent individual observations. Asterisks indicate significant differences between years for each treatment as determined by an independent two-sample t-test: * p < 0.05, ** p < 0.01, and *** p < 0.001; ns, not significant. Abbreviations of agrophytocenosis names correspond to those listed in Table 1.
Agronomy 16 00620 g011
Figure 12. Dry mass yield of different agrophytocenoses in the 2024 and 2025 growing seasons. Data are presented as mean ± standard error (SE). Black dots represent individual observations. Different lowercase letters above the bars indicate statistically significant differences between treatments within the same year (one-way ANOVA followed by Tukey’s HSD test, p < 0.05). Abbreviations of agrophytocenosis names correspond to those listed in Table 1.
Agronomy 16 00620 g012
Figure 13. Comparative analysis of dry mass yield for nine agrophytocenoses between the 2024 and 2025 vegetation periods. Data are expressed as mean ± standard deviation (SD). Black dots represent individual observations. Asterisks indicate significant differences between years for each treatment as determined by an independent two-sample t-test: * p < 0.05, ** p < 0.01, and *** p < 0.001; ns, not significant. Abbreviations of agrophytocenosis names correspond to those listed in Table 1.
Agronomy 16 00620 g013
Table 1. Composition and management schedule of the forage agrocenoses established in the forest–steppe zone of Northern Kazakhstan.
NoNames of Agrophytocenoses of Forage CropsAbbreviationSowing DateHarvest Date 2024 YearHarvest Date 2025 Year
1Natural grass cover (control)NG-23.06.202420.06.2025
2Sainfoin 60% (Onobrychis viciifolia Scop.) + crested wheatgrass 40% (Agropyron cristatum (L.) Gaertn.)S+C21.05.202415.08.202424.06.2025
3Italian ryegrass 40% (Lolium multiflorum Lam.) + alfalfa 60% (Medicago sativa L.)I+A21.05.202415.08.202424.06.2025
4Smooth brome (Bromus inermis Leyss.)SB21.05.202415.08.202424.06.2025
5Crested wheatgrass (Agropyron cristatum (L.) Gaertn.)CW21.05.202415.08.202424.06.2025
6Italian ryegrass 50% (Lolium multiflorum Lam.) + annual ryegrass 50% (Lolium annuum Lam.)IR+AR21.05.202415.08.202424.06.2025
7Sainfoin 70% (Onobrychis viciifolia Scop.) + Festulolium 15% (×Festulolium (Festuca × Lolium)) + Timothy grass 15% (Phleum pratense L.)S+F+T21.05.202415.08.202424.06.2025
8Green Line Alpha Protein Grass Mix: alfalfa 75% (Medicago sativa L.) + tall fescue 25% (Festuca arundinacea Schreb.)A+TF21.05.202415.08.202424.06.2025
9Green Line Grass Seed Mixture Base: perennial ryegrass 30% (Lolium perenne L.) + tall fescue 50% (Festuca arundinacea Schreb.) + orchard grass 20% (Dactylis glomerata L.)PR+TF+OG21.05.202415.08.202424.06.2025
Abbreviations: NG—natural grass cover (control); S+C—sainfoin + crested wheatgrass; I+A —Italian ryegrass + alfalfa; SB—smooth brome; CW—crested wheatgrass; IR+AR—Italian ryegrass + annual ryegrass; S+F+T—sainfoin + festulolium + timothy grass; A+TF—alfalfa + tall fescue; PR+TF+OG—perennial ryegrass + tall fescue + orchard grass. Percentages indicate the proportion of species in the seed mixture by weight.
Table 2. Chemical properties of soil samples from the experimental area.
NoHumus, %pH (H2O)S (Sulfur), mg kg−1Available Nutrients, mg kg−1
N-NO3P2O5K2O
17.88.362.76.716.6289
27.18.763.513.09.3453
38.18.81.822.011.8525
46.88.651.823.111.2686
57.48.070.711.16.8432
Disclaimer/Publisher’s Note: The statements, opinions and data contained in all publications are solely those of the individual author(s) and contributor(s) and not of MDPI and/or the editor(s). MDPI and/or the editor(s) disclaim responsibility for any injury to people or property resulting from any ideas, methods, instructions or products referred to in the content.