Article

Spatial Distribution Characteristics of Phaeozems in Jilin Province and Their Relationship with Environmental Factors Based on the Integrated Quality Index

1
Faculty of Agronomy, Jilin Agricultural University, Changchun 130118, China
2
Jilin Provincial Soil and Fertilizer General Station, Changchun 130033, China
*
Authors to whom correspondence should be addressed.
Agronomy 2026, 16(6), 597; https://doi.org/10.3390/agronomy16060597
Submission received: 26 January 2026 / Revised: 27 February 2026 / Accepted: 7 March 2026 / Published: 10 March 2026
(This article belongs to the Section Agroecology Innovation: Achieving System Resilience)

Abstract

Soil quality assessment is crucial for understanding soil heterogeneity and guiding appropriate agricultural practices. This study selected optimal soil indicators and MDS in the black soil area of Jilin Province, comparing different scoring methods, indicators and datasets to clarify soil quality spatial distribution characteristics and their relationship with environmental factors. Firstly, the IDS of soil indicators was screened via the correlation between yield and soil indexes. Then, PCA was used to select the MDS of the IQI derived from the LS method as the optimal evaluation model for assessing soil quality in the study area. The MDS included BD, SOM, AN and AK. The results showed that soil quality was mainly moderate (Grades II, III, IV), accounting for 70.28% and 78.38% of IDS and MDS, respectively, with IQI gradually increasing from northwest to southeast. Finally, environmental factors were integrated to analyze key drivers of regional soil quality differences: in the EHM region, the main influencing factors (in descending order) were Pre, TWI, Temp, Slope and PM; in the CEH region, they were Pre, Slope, PM, TWI and Temp; in the WSP region, they were Temp, TWI, PM, Pre and Slope.

1. Introduction

Soil quality integrates inherent and dynamic soil characteristics, influenced and interacted with by land use, management practices, and the soil system itself. Reliable and accurate soil quality assessment enhances understanding of soil quality and serves as a decision-making tool for quantitatively analyzing soil quality by effectively integrating diverse soil information [1].
Soil quality assessment has evolved from visual approaches to analytical methods, including the Comprehensive Index Method [2], Nemero’s Index Method [3], the Grey Relational Method [4], the Neural Network Model Method [5], the Matter-Element Model Method [6], and the T-Value Classification Method [7], with the development of various conceptual frameworks. The SQI, a quantitative indicator reflecting overall soil performance, has become the most widely used soil quality assessment method due to its simplicity in calculation and flexibility in quantification [8]. SQI calculation typically involves three steps [9]: (1) selecting appropriate indicators, (2) scoring indicators, and (3) integrating indicator scores into a single index. Indicator scoring requires data normalization: the LS method establishes a linear relationship between quality scores and measured data based on indicator sensitivity to soil quality changes [10], while the NLS method was developed for cases where no linear relationship exists between quality scores and indicator values [11,12]. Unlike the LS method, which relies on indicator measured values, the NLS method requires a deeper understanding of the study area’s soil and crop systems. Both LS and NLS methods can accurately quantify the contribution of different indicators to soil quality, effectively avoiding the disconnection between indicator scores and actual ecological functions in traditional non-dimensionalized processes [9,13], thereby enhancing SQI quantification and objectivity. However, the SQI method faces challenges from indicator redundancy during calculation. The MDS, constructed based on dimension reduction theory and fuzzy mathematics, provides a critical indicator basis for SQI by selecting fewer soil indicators to simplify calculations [3]. Common SQI calculation methods (addition [12], multiplication [14], and averaging) fail to clearly define the importance of each MDS indicator [15], whereas the IQI method considers indicator importance by assigning weights during scoring [11,16], with weights determined by expert opinion or statistical analysis [10,17].
Previous studies have shown that the spatial distribution of the comprehensive soil quality index is influenced by both internal soil properties and external environmental factors, including climate, topography, and PM [18]. For instance, Li [19] used an MDS model combined with the NLS method to evaluate black soil farmland quality in Northeast China, finding that soil quality was moderate and mainly affected by mean annual Temp and soil PM. Additionally, ref. [20] identified SSC, TC, Mg, NO3-N, and TS as the MDS, revealing that the SQI in the Yellow River Delta coastal wetlands ranged from 0.18 to 0.66; the summer SQI (0.50 a ± 0.13) was significantly higher than that in spring (0.37 b ± 0.13) and autumn (0.36 b ± 0.11) [20,21], with Temp remaining a key limiting factor for soil quality. However, significant spatial heterogeneity in farmland soil characteristics and environmental composition in the black soil region of Jilin Province introduces widespread uncertainty in the influence patterns and relative importance of environmental factors on farmland soil across different regions and scales [19]. Quantifying the relationship between environmental factors and soil properties and clarifying the spatial distribution characteristics of soil quality—an integrated analysis approach—can provide a more comprehensive soil quality assessment compared to evaluations considering only intrinsic soil physical and chemical properties [19]. This approach not only effectively overcomes the limitations of traditional assessment methods in addressing soil spatial heterogeneity but also provides a theoretical basis and practical guidance for the precise management and sustainable improvement of regional farmland soil quality.
As one of China’s important commodity grain production bases, Jilin Province has 981,101,000 ha of black soil cultivated land, accounting for 87% of the province’s total cultivated land and contributing approximately 80% of its total grain output, serving as a cornerstone for ensuring national food security [10,22]. Current research on soil quality in Jilin Province has mainly focused on soil fertility improvement technologies (e.g., full straw deep incorporation [23,24], fertile topsoil construction via organic fertilizer combined application [25,26,27]) and soil quality assessment based on the MDS [19]. However, most of these studies have focused on local-scale technical model validation; systematic evaluation of topsoil quality in black soil rain-fed farmland at the provincial scale remains insufficient, and research on the influence of environmental factors (e.g., climate, topography) on the spatial distribution of soil quality is not thorough. Based on this, this study systematically compared the applicability of different scoring methods, evaluation index systems, and data sources to screen a precise soil quality evaluation method suitable for Jilin Province’s regional characteristics. It clarified the spatial differentiation law and distribution pattern of soil quality at the provincial scale, revealed the key environmental limiting factors affecting regional soil quality, and ultimately provided a solid scientific theoretical basis and feasible technical support for the accurate formulation of black soil protection and directional fertilization strategies, soil fertility improvement, and food sustainable production capacity guarantee in Jilin Province.

2. Materials and Methods

2.1. Overview of the Study Area

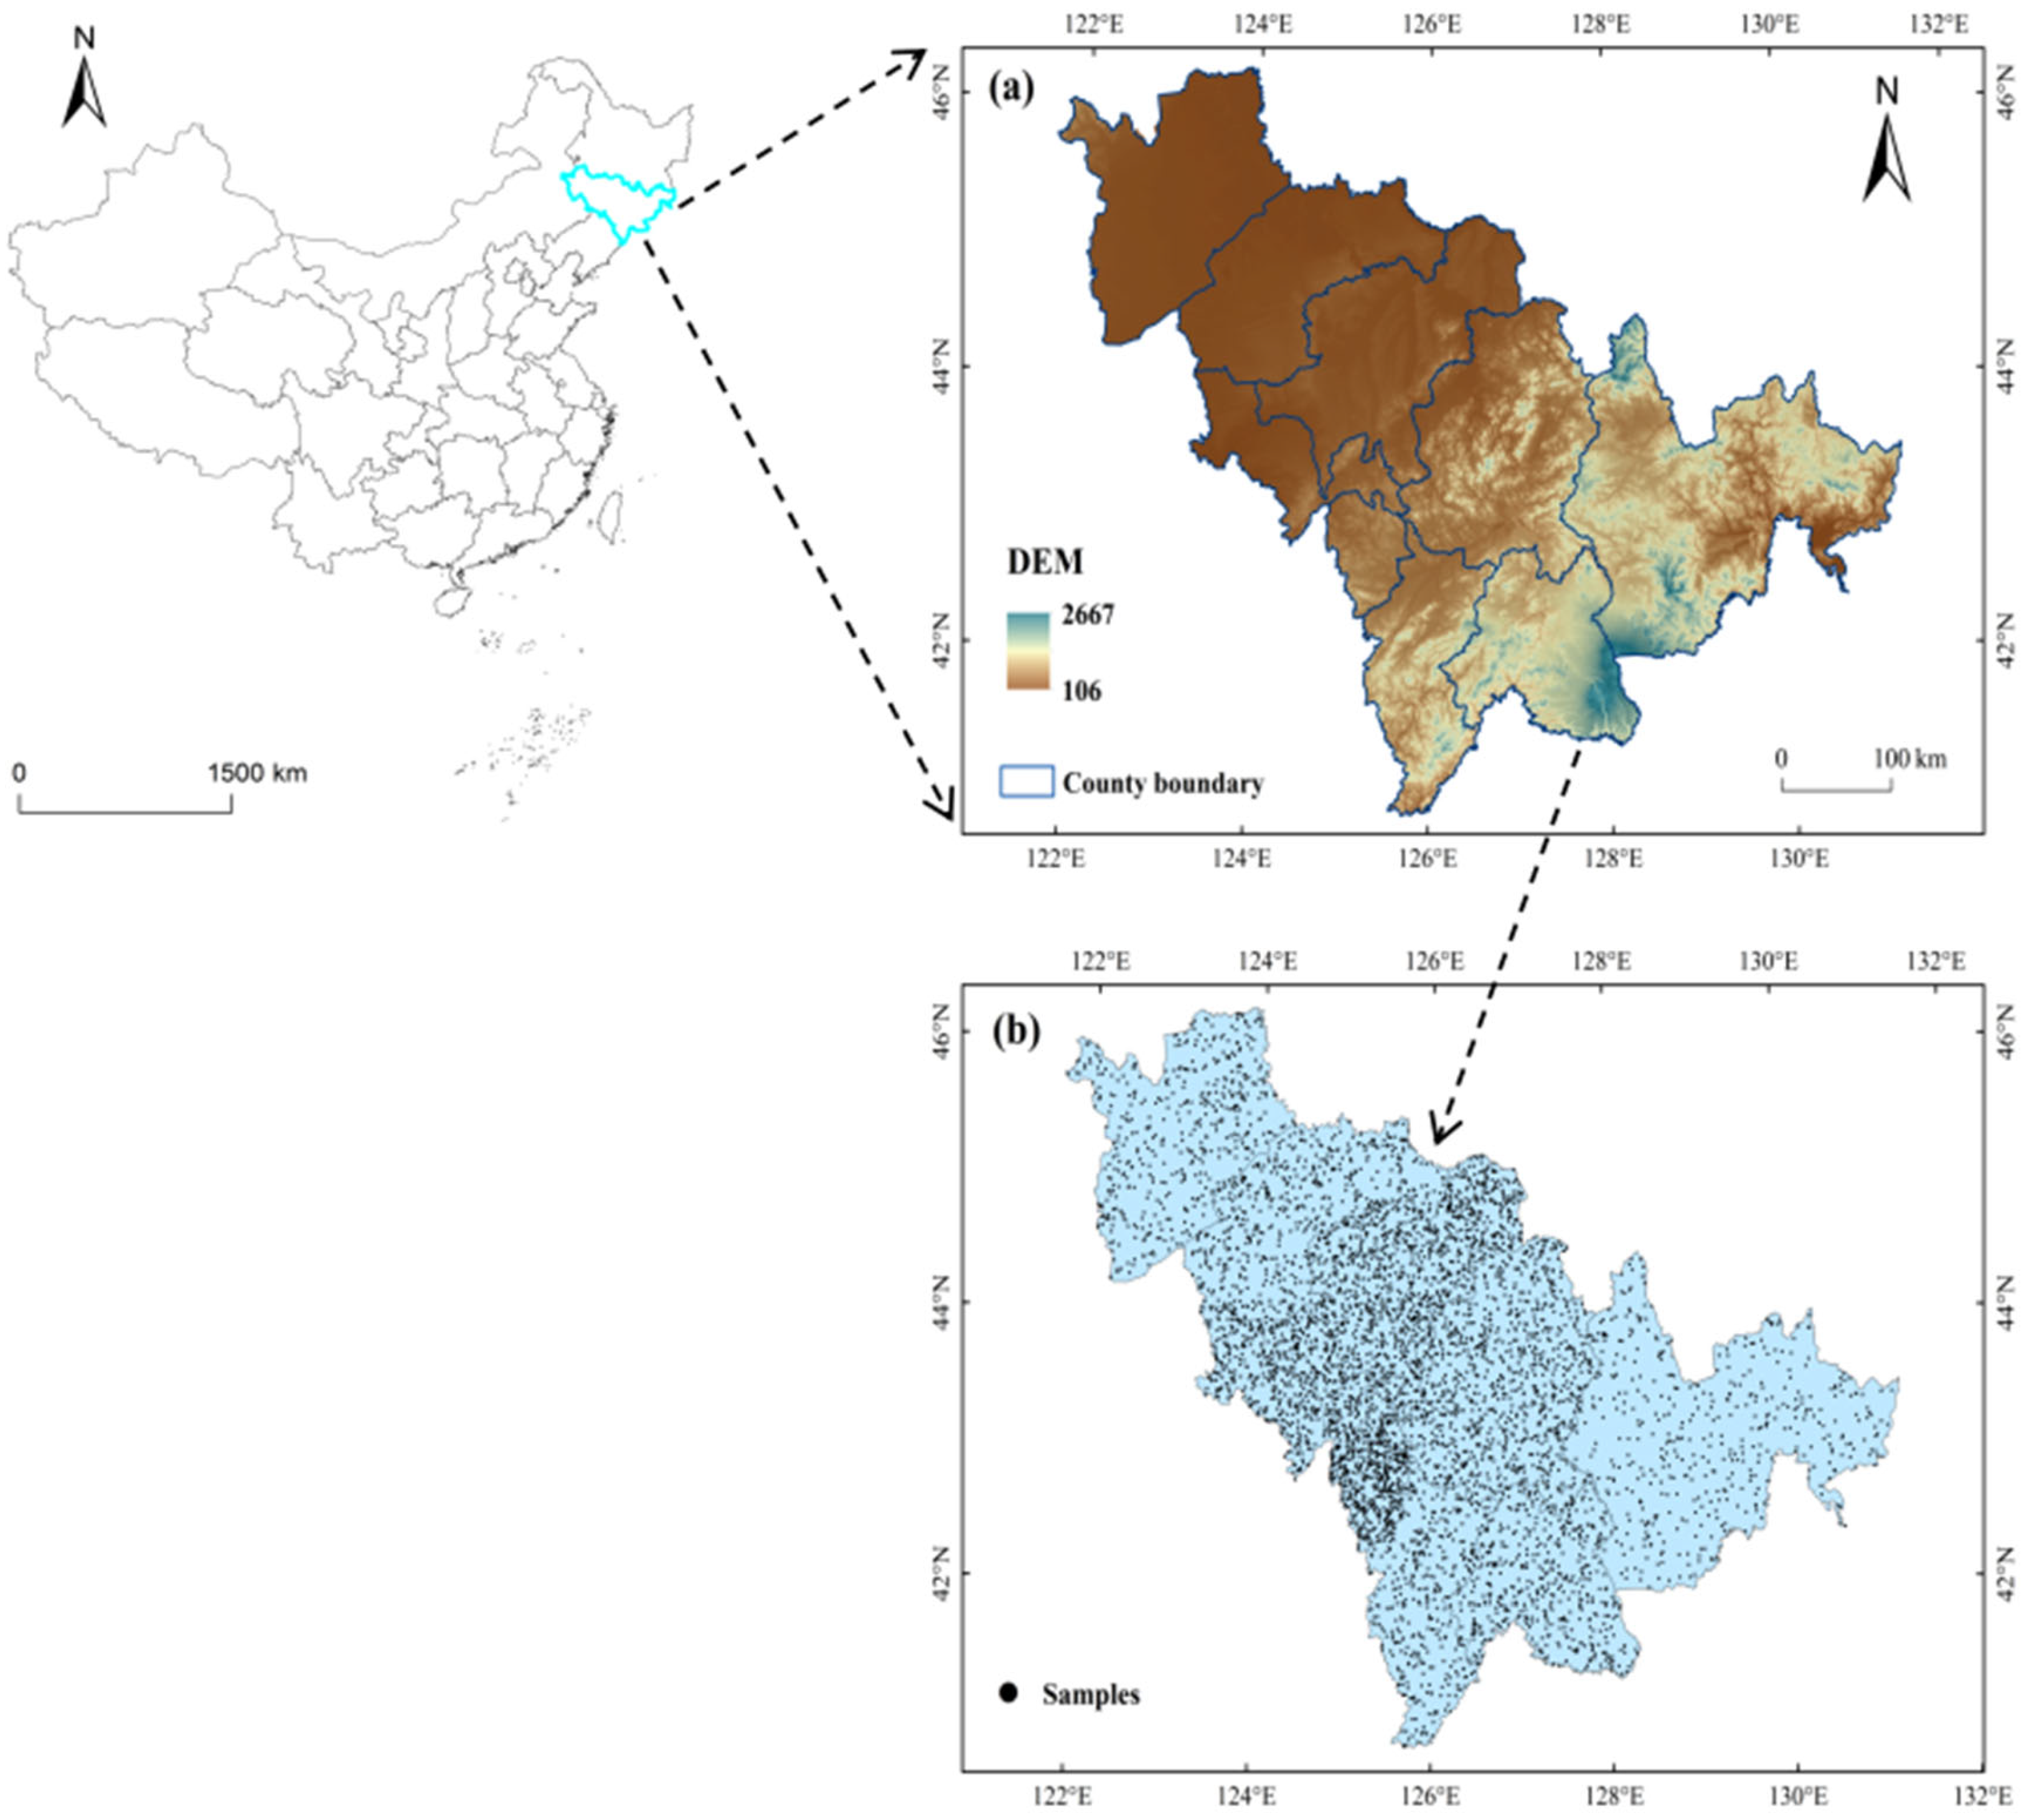
The study area is located in Jilin Province, central Northeast China (121°38′–131°19′ E, 40°52′–46°18′ N), part of one of the world’s three major black soil zones (Figure 1). It has a temperate continental monsoon climate with distinct seasons and synchronized rain and heat, a mean annual Temp of 2–6 °C, and mean annual Pre of 400–900 mm. Covering approximately 180,000 km2, the study area includes nine cities (Tonghua, Baishan, Yanbian, Changchun, Liaoyuan, Jilin, Songyuan, Siping, Baicheng) and is divided into three ecological zones (EHM, CEH, WSP) based on climate, topography, and soil properties [28].

2.2. Data Sources and Measurement

2.2.1. Sample Collection

Following the 2023 autumn harvest, a total of 4131 soil samples were collected from the 0–20 cm layer using the five-point sampling method in 30 m × 30 plots. These samples were obtained from black soil cropland monitoring sites established by the Jilin Provincial Soil and Fertilizer General Station and covered all prefecture-level cities in the province (Figure 1b).

2.2.2. Laboratory Analysis

Eight soil physical and chemical properties were determined. THK was measured using a steel tape, and Y was estimated by multi-point sampling and adjusted to a standard grain moisture content of 14%. Analytical methods for the other indicators are listed in Table 1.

2.3. Acquisition of Environmental Variables

2.3.1. Topographical Parameters

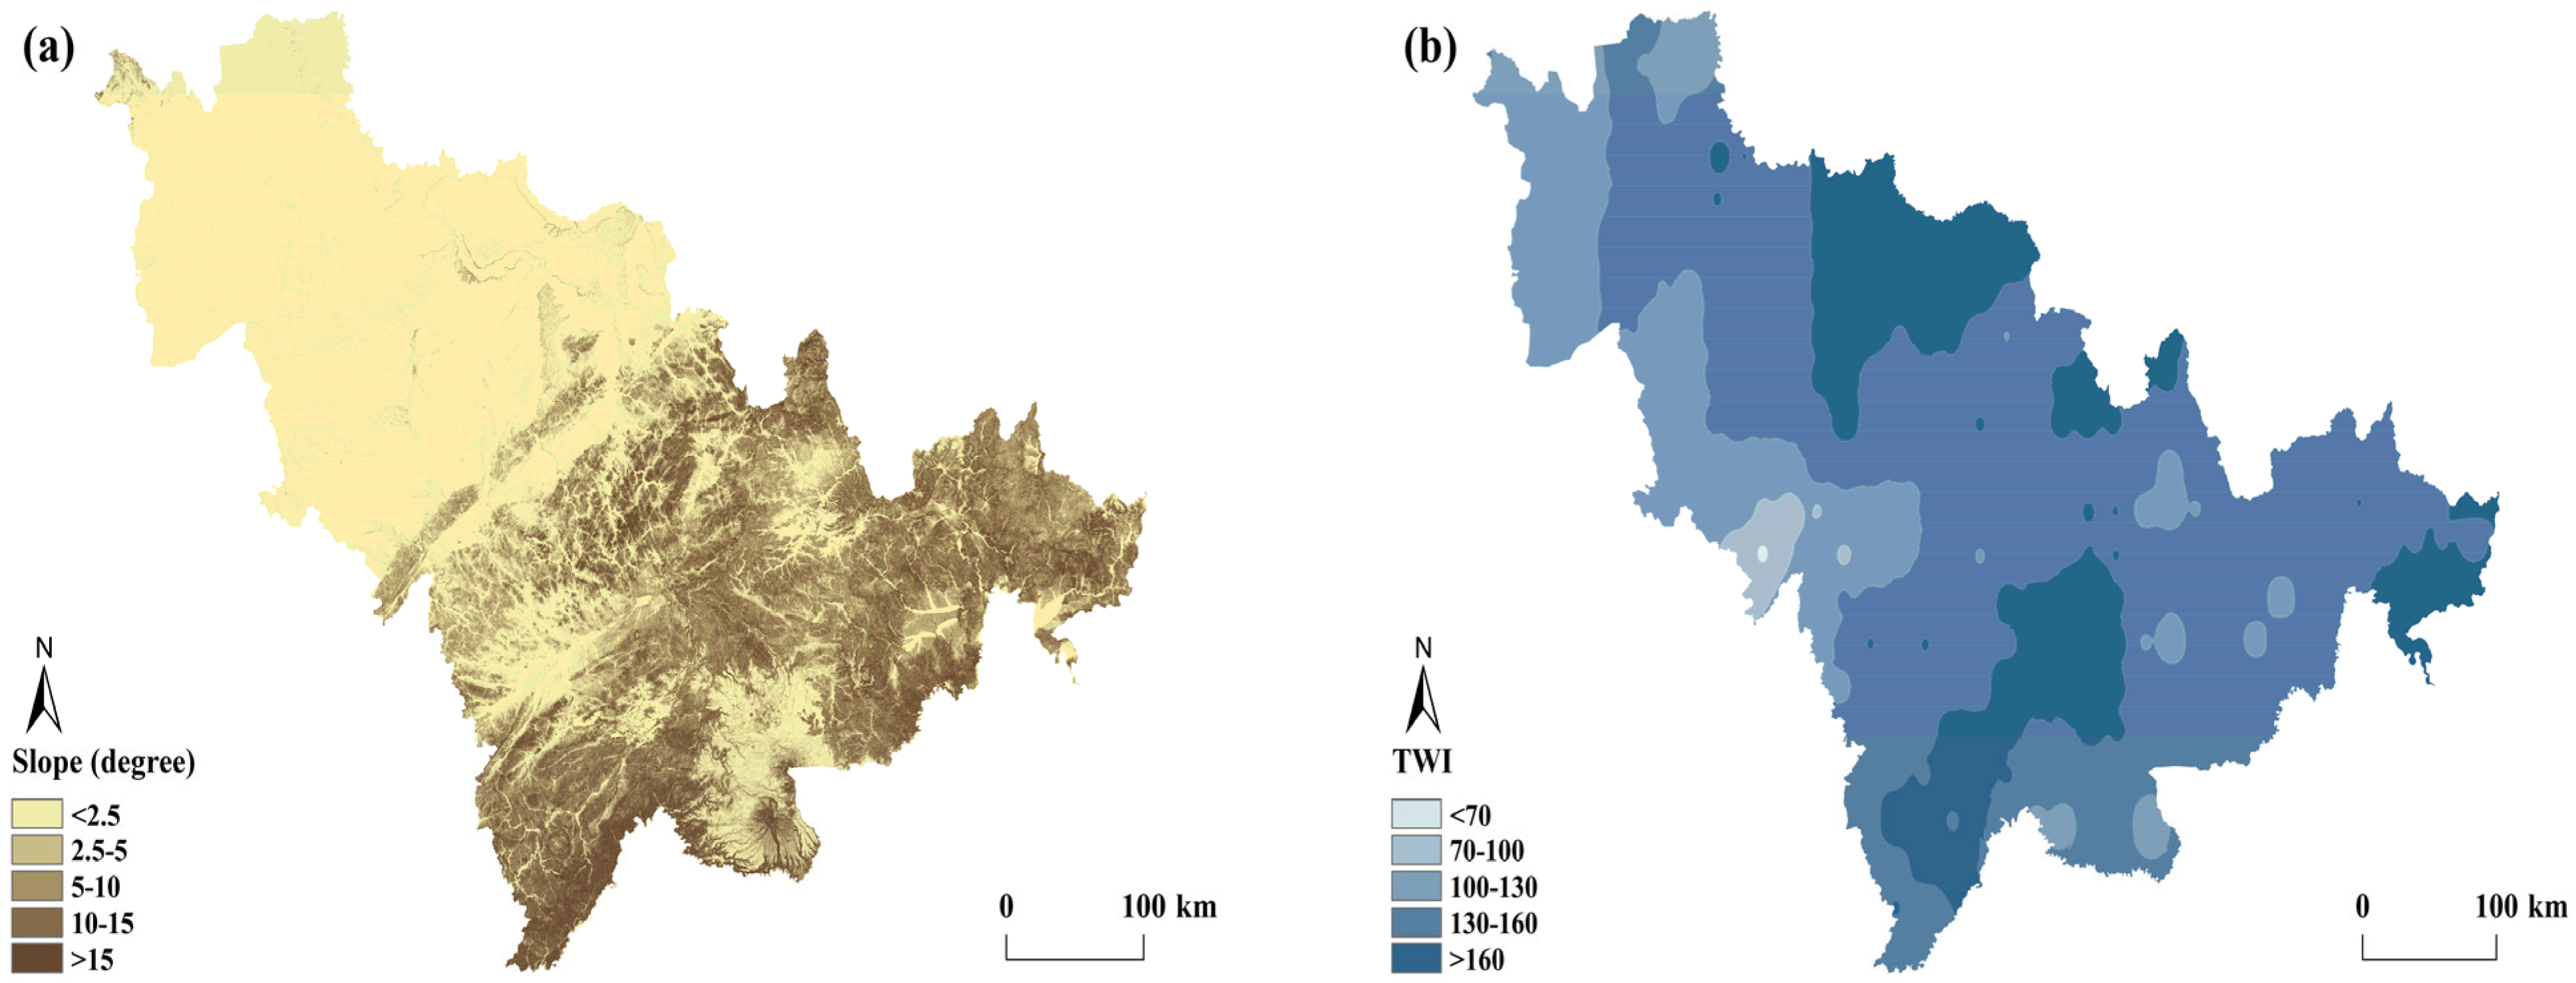
In this study, three topographic variables—slope (Figure 2a), DEM (Figure 1a), and TWI (Figure 2b)—were extracted from a 30 m resolution DEM obtained from CAS NIGA (Beijing, China). Slope and DEM were derived using the Surface Analysis tools in ArcMap 10.8.2 (Esri, Redlands, CA, USA), while TWI was calculated with the Raster Calculator in the same software.

2.3.2. Geologic Map

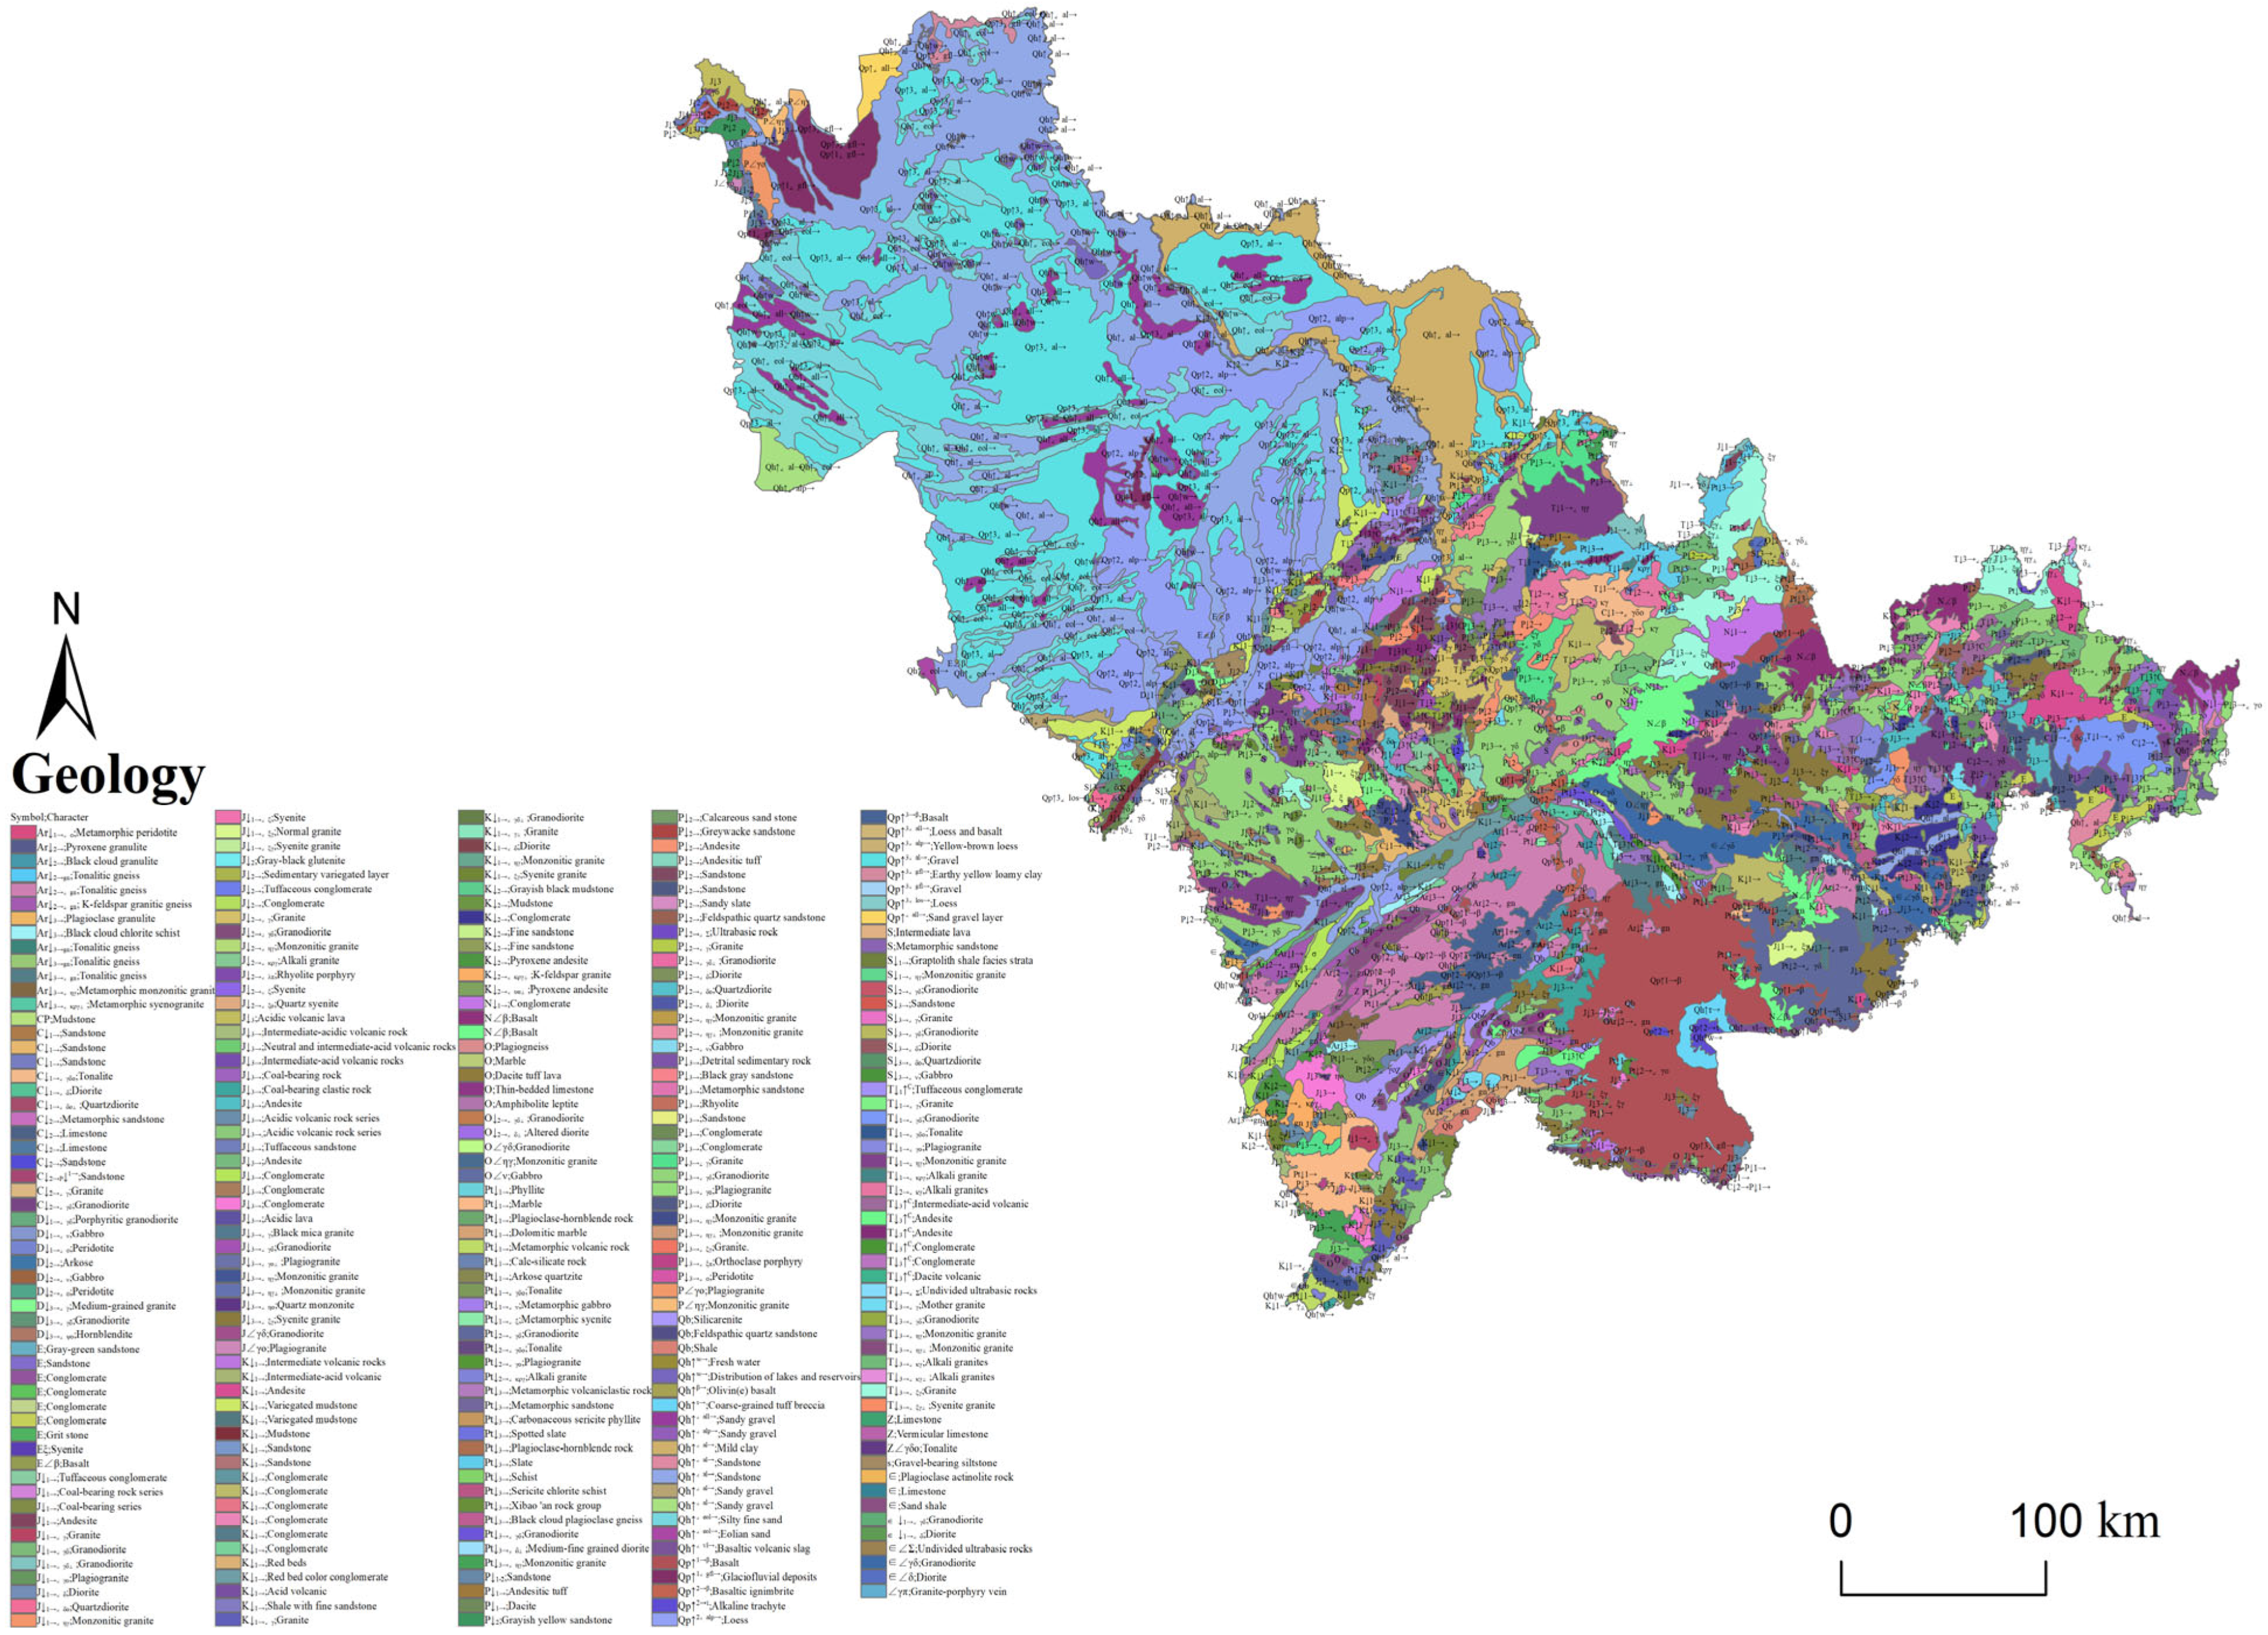
The 1:250,000-scale geological map of Northeast China was acquired from the National Geological Data Information Center (http://ngac.org.cn/) (Figure 3). The PM types of sampling points were identified by combining field survey data with the aforementioned geological information.

2.3.3. Climatic Data

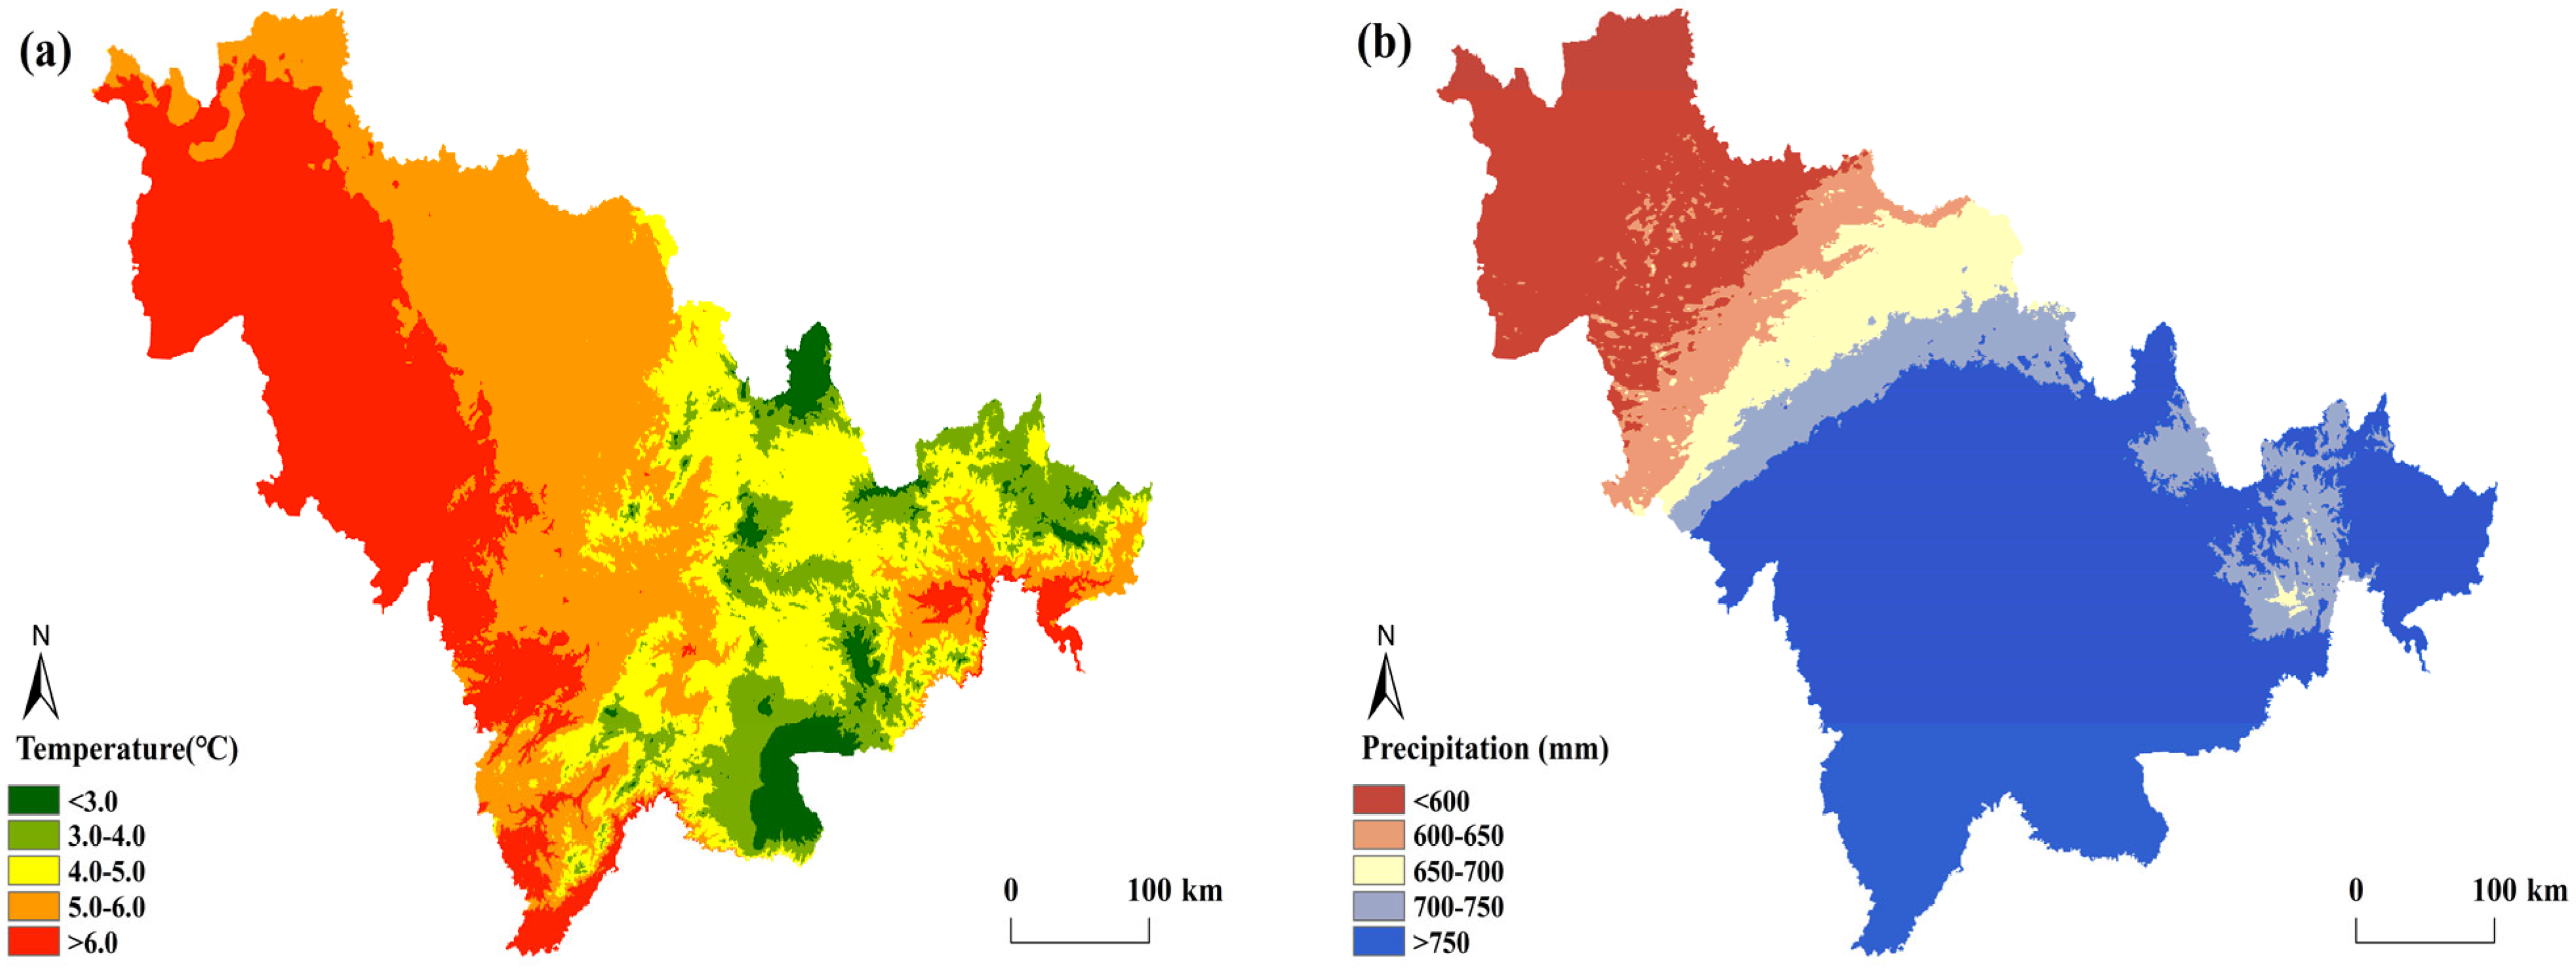
2023 climatic data (monthly precipitation, daily temperature) were downloaded from the China Meteorological Data Network (http://data.cma.cn). Before spatial interpolation via the OK in ArcMap 10.8.2 (Figure 4a,b), map verification was conducted on the spatial statistical results of Temp and Pre in Jilin Province. This verification included coupling the statistical characteristics of the two variables with the natural geographic base map of the study area (DEM and geographical location) and a geospatial rationality assessment from three aspects: extreme value differentiation, agglomeration pattern and distribution pattern. The results showed that the spatial distribution of the statistical extreme values of Temp and Pre was highly consistent with the study area’s east-high west-low topographic pattern, with Temp having an average standard error of 0.515 (RMSSE ≈ 0.164) and Pre having one of 13.961 (RMSSE ≈ 0.378).

2.4. Soil Quality Evaluation Method

2.4.1. Indicator Selection

In this study, eight soil properties influencing soil nutrient cycling and structural stability were selected to construct the TDS: BD, pH, SOM, TN, AN, AP, AK, and THK. To improve evaluation efficiency, the MDS was established using PCA with varimax rotation to maximize correlations between PCs and measured variables. Following previous studies, only PCs with eigenvalues > 1 were retained to represent soil system characteristics [35]. For each PC, indicators with high factor loadings (within 10% of the maximum absolute loading) were kept as key variables. Variables with strong correlation (r > 0.6) were regarded as redundant, and only one representative variable from each redundant group was included in the MDS.

2.4.2. Indicator Scoring

In this study, all indicators were transformed into standardized scores (0–1) using the LS and NLS methods. For the LS method, indicators were divided into two categories [35]: (1) positive indicators (e.g., SOM, TN) evaluated by a “more is better” function (U); (2) BD and pH, assessed using an “optimal range” function (R). Scores were calculated based on whether indicator values fell above or below the corresponding thresholds. The equations and parameters for these functions are listed in Table 2.
For NLS, the following equation was used [35]:
F ( x ) = x max 1 + ( xi / x ¯ i ) b
where F ( x ) is the soil indicator score, x m a x is the maximum value equal to 1, x i is the value of the soil indicator i , x ¯ i is the mean value of the soil indicator, and b is the slope of the equation, which is set to −2.5 for the “more is better” curve and 2.5 for the “less is better” curve.

2.4.3. Index Calculation

To calculate the IQI, weights were assigned to the soil quality indicators. In this study, indicator weights for both IDS and MDS were determined via PCA based on the common factor variance of each indicator [22].
The calculation formula of IQI is as follows [35]:
I Q I = i n W i N i
where IQI is the Integrated Quality Index, W i is the weight of the indicator, and N i is the normalized score of the indicator.
Four soil quality indices were constructed by combining two scoring methods (LS and NLS) with two datasets (IDS and MDS): IQIIDS-LS, IQIMDS-LS, IQIIDS-NLS, and IQIMDS-NLS.

2.4.4. Comparison of IQI and Soil Quality Classification Standard

Linear correlation analysis was first used to select the MDS with the highest consistency with the IDS. The accuracy of different methods was then evaluated by comparing soil quality grade distributions and performing correlation analysis.
According to the Regulation for Classification of Cultivated Land Type Regions and Fertility Grades in China (NY/T 309-1996) [36], combined with the local environment and soil fertility characteristics of the study area, soil quality was divided into five grades. Grade I represents the highest quality and is most suitable for crop growth, while Grade V has the lowest IQI values and the most restrictive conditions.

2.5. Soil Quality and Environmental Factors

The restrictive effect of environmental factors on soil quality was analyzed using the OLS method [37]. In ArcMap software, OLS regression was performed with IQI as the dependent variable and IQI-controlling factors as independent variables.
The basic OLS model is as follows:
Y i = β 0 + β 1 x i + β 2 x i + + β i x i + ε i
where Y i   represents the response variable,   β 0 is the intercept of the linear model, β i represents the coefficient associated with the independent variable, x i is the observed value of the independent variable i, and ε i is the identically and normally distributed error for the independent variable i.

2.6. Statistical Analysis

Microsoft Excel 2019 (Microsoft Corp., Redmond, WA, USA) was used for preliminary sorting of original data [38]; PCA and correlation analysis were conducted using IBM SPSS Statistics 27 (IBM Corp., Armonk, NY, USA) [39]; charts were plotted with Origin Pro 2025 (OriginLab Corporation, Northampton, MA, USA) [40]; the Ordinary Kriging (OK) method was applied to spatialize soil indices and IQI; and ArcMap 10.8.2 (Esri, Redlands, CA, USA) was used to map their spatial distribution [41].

3. Results

3.1. Distribution Characteristics of Soil Properties in the Study Area

3.1.1. Characteristics of Soil Index

The basic physical and chemical properties of farmland soil in the black soil region of Jilin Province are shown in Table 3. AP showed significant variability with a large difference between maximum and minimum values, while other indicators varied moderately. The low BD value indicates good overall soil structure. According to the classification standards of the Second National Soil Census of China (Table 4), soil AN and AP were at Level II (abundant), SOM and AK at Level III (suitable), and the pH value (6.59) indicated neutral soil. In general, the soil nutrient content in the study area was at a high level.
However, obvious differences in soil nutrient content were observed among different regions. The EHM region showed higher SOM, AN, TN and AP contents (Table 5); the CEH region had a higher AK content, with a mean value of 154.49 mg·kg−1 (Table 6). In contrast, the WSP region exhibited lower soil nutrient levels, and its pH value (5.10–9.85) varied widely from acidic to alkaline (Table 7).

3.1.2. Spatial Distribution of Soil Indicators

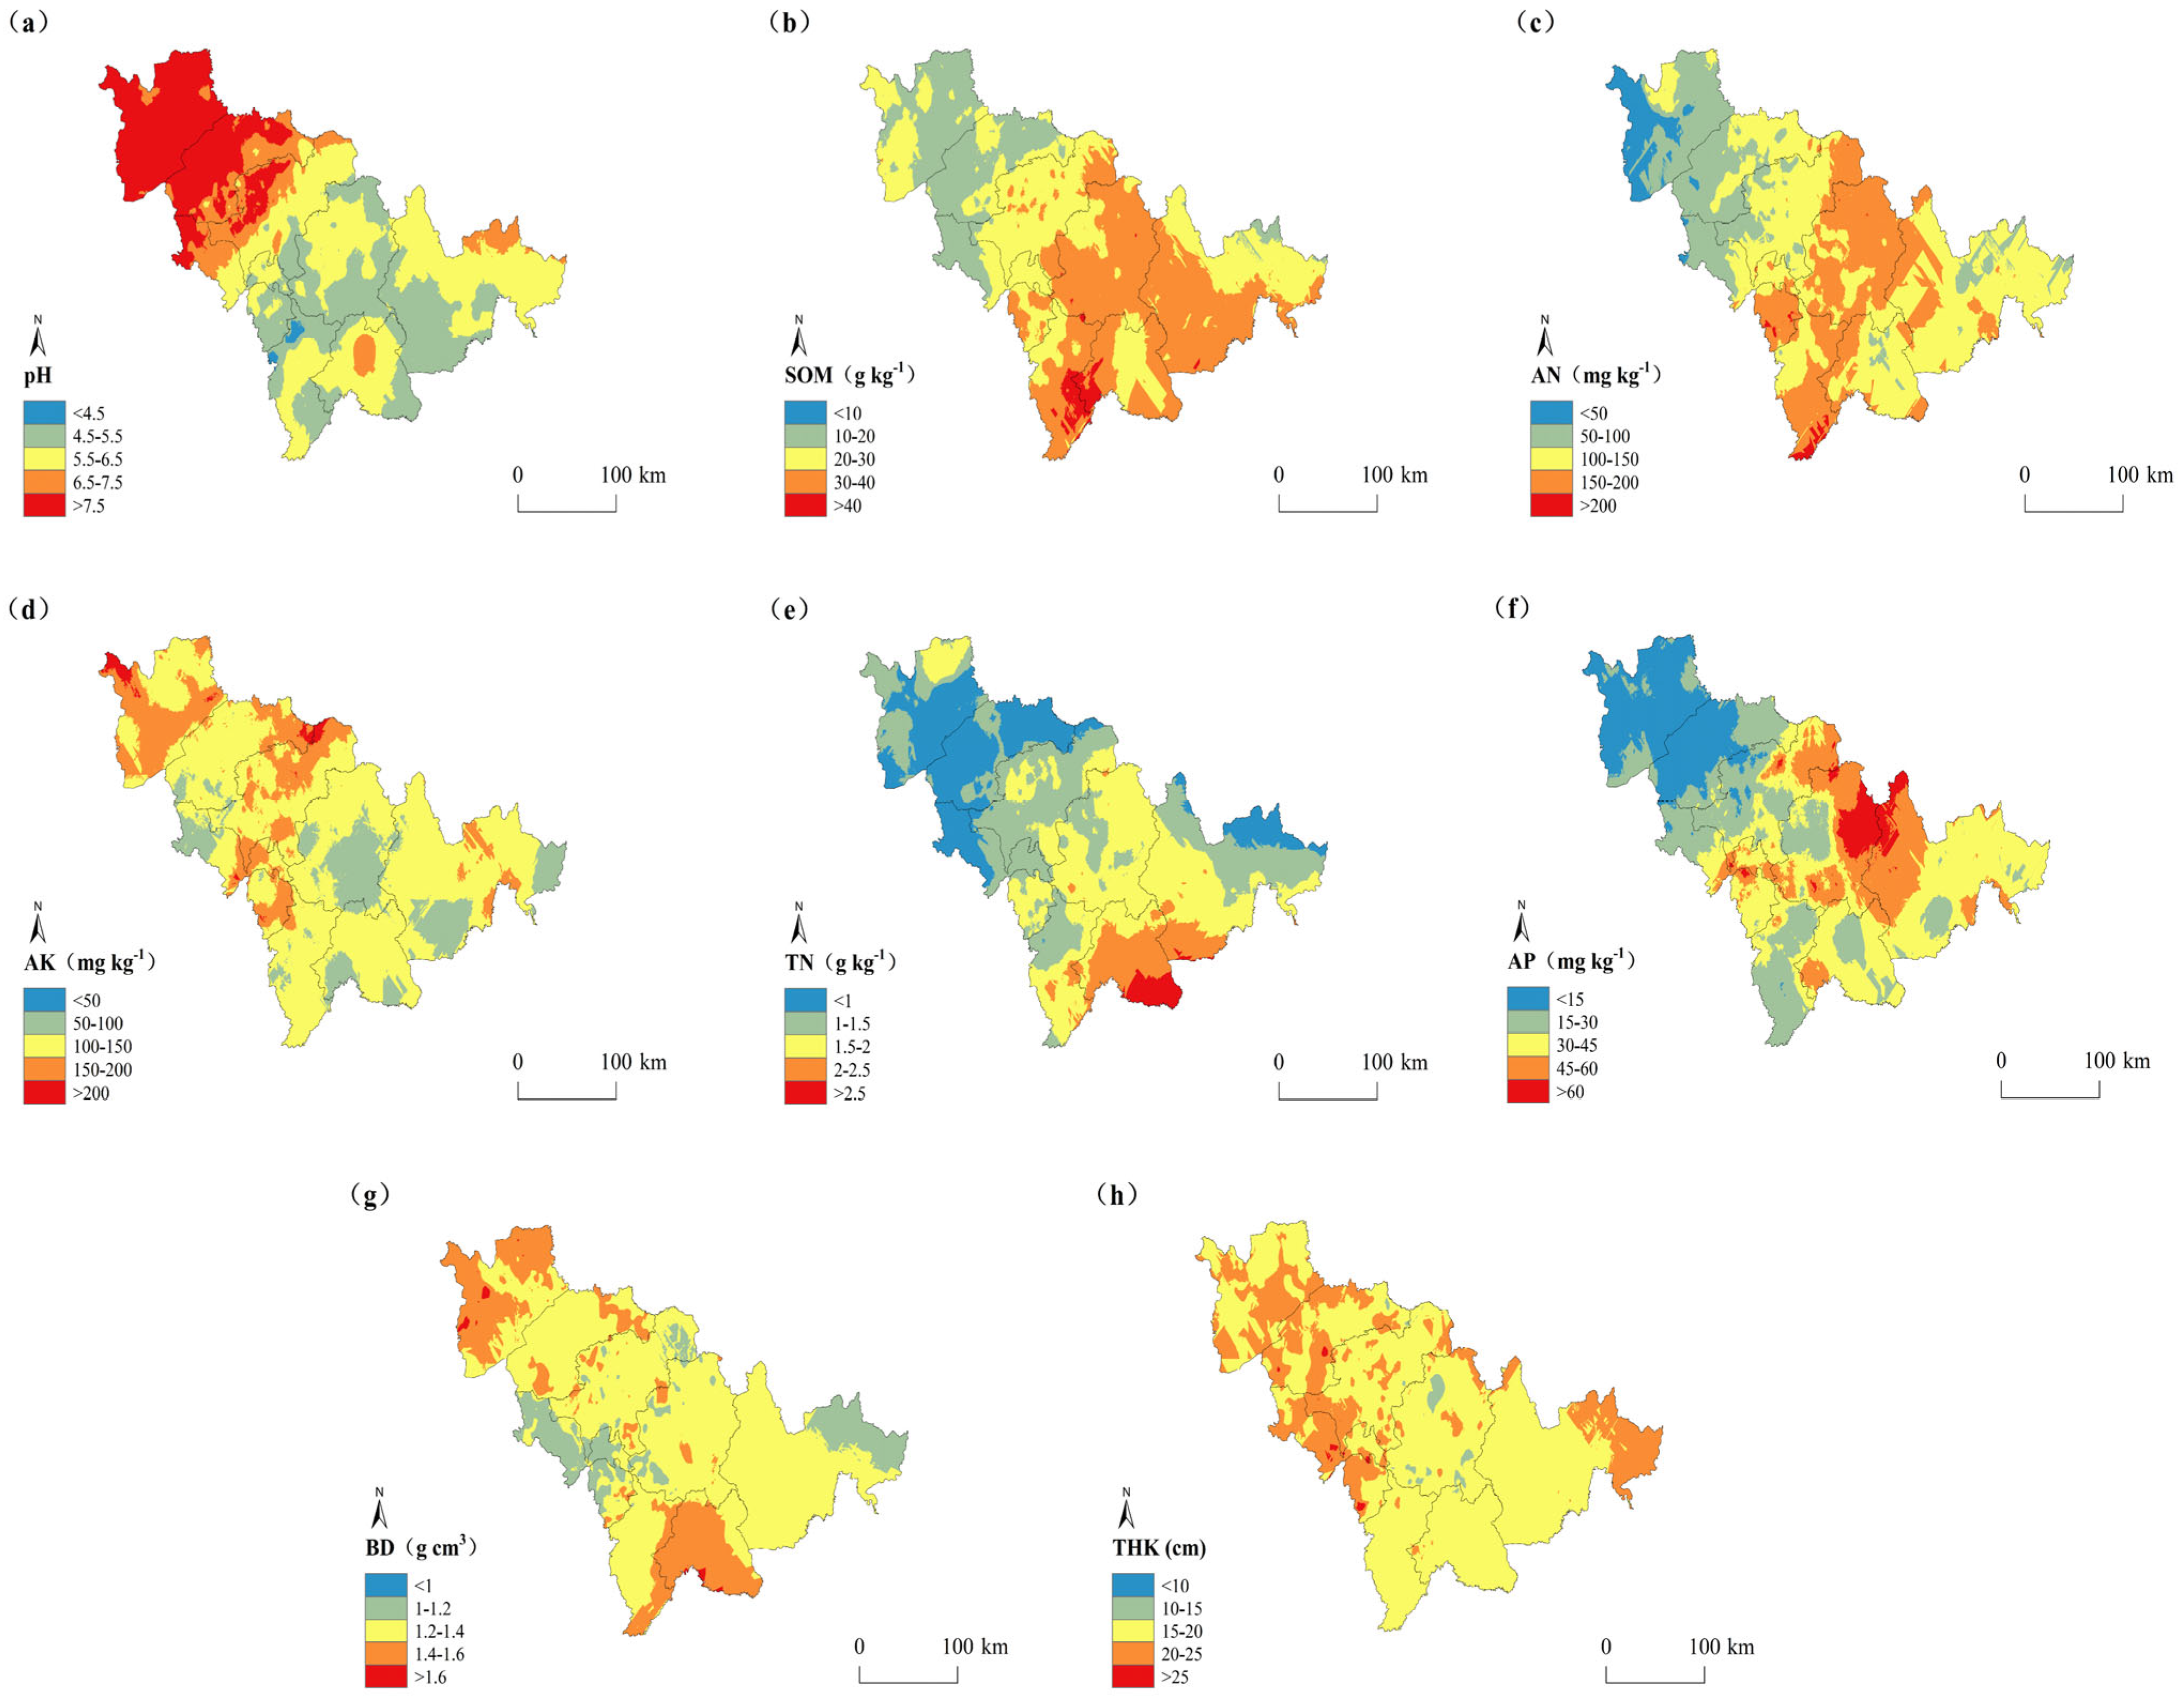
As shown in Figure 5, the soil nutrient content and physical properties in the study area showed obvious spatial distribution differences. The pH value showed a trend of being higher in the WSP and lower in the EHM (Figure 5a), with weakly alkaline soil (pH > 7.5) in the WSP region. SOM was mainly in the range of 30–40 g·kg−1 and concentrated in the CEH and EHM regions (Figure 5b). Figure 5c,d showed that AN and AK had obvious regional differences: the low-value areas for AN (<50 mg·kg−1and 50–100 mg·kg−1) were concentrated in the WSP region, whereas the low-value areas for AK (50–100 mg·kg−1) showed an opposite trend to AN and were distributed in a patchy pattern in the CEH and EHM regions. The spatial distributions of TN and AP were similar (Figure 5e,f), both showing a gradual increasing trend from west to east; however, the locations of their high-value areas differed: the high-value areas for TN (>2.5 g·kg−1 and 2–2.5 g·kg−1) were distributed in the EHM region, while the high-value areas for AP (>60 mg·kg−1 and 45–60 mg·kg−1) were mainly located in the CEH region. As shown in Figure 5g and Figure 5h, BD was primarily in the range of 1.2–1.4 g·cm−3, indicating that the overall soil structure was good; THK was predominantly in the 15–20 cm range across the province, and the state of the plough layer was more reasonable.

3.2. Comparison of IQI Calculation Methods

3.2.1. IDS Index Selection

Pearson correlation analysis was performed between the eight indices in TDS and Y (Table 8). The results showed that BD, pH, SOM, TN, AP, AK, and AN were extremely significantly correlated with Y. Specifically, pH exhibited a strong negative correlation with Y, with a correlation coefficient of −0.350, while SOM showed a high positive correlation with Y, with a correlation coefficient of 0.274. No significant correlation was observed between THK and Y, indicating that THK should not be included in IDS.
Establishment of MDS
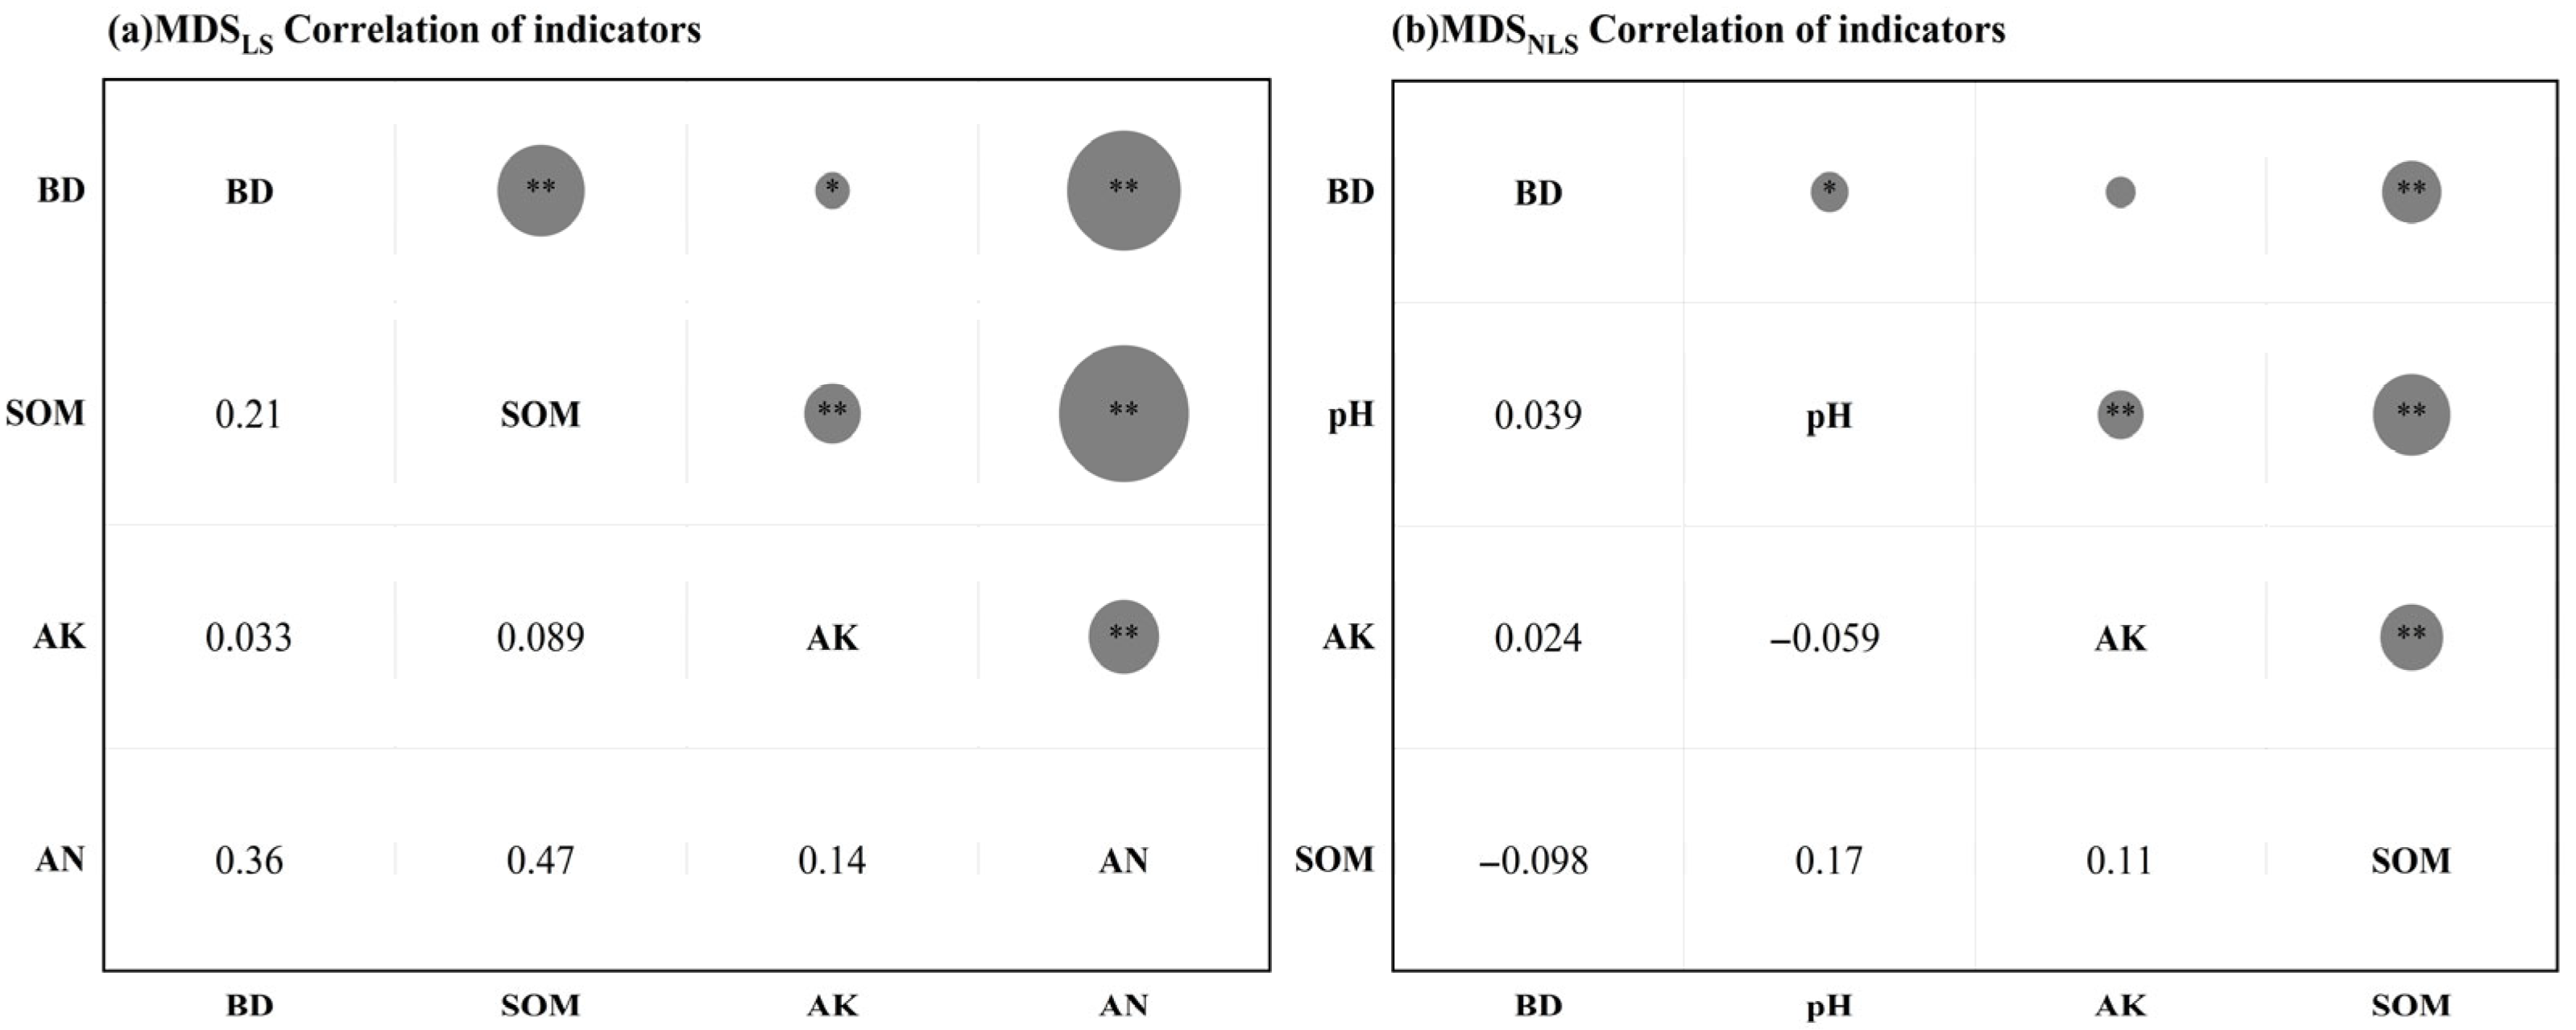
Table 9 shows that three PCs with eigenvalues greater than 1 were extracted by both the LS and NLS methods, with cumulative contribution rates of 70.95% and 67.27%, respectively. Based on the principle of selecting high-loading indicators, the correlation coefficients among the indicators included in the MDS for both methods were all below 0.6, so no indicators needed to be excluded (Figure 6). Ultimately, the MDS determined by the LS method comprised BD, SOM, AN, and AK, whereas that determined by the NLS method consisted of BD, SOM, AK, and pH. In addition, AK in the MDS under different bisection methods was assigned a lower weight (Table 10).
Construct the Optimal Model of Soil Quality Evaluation
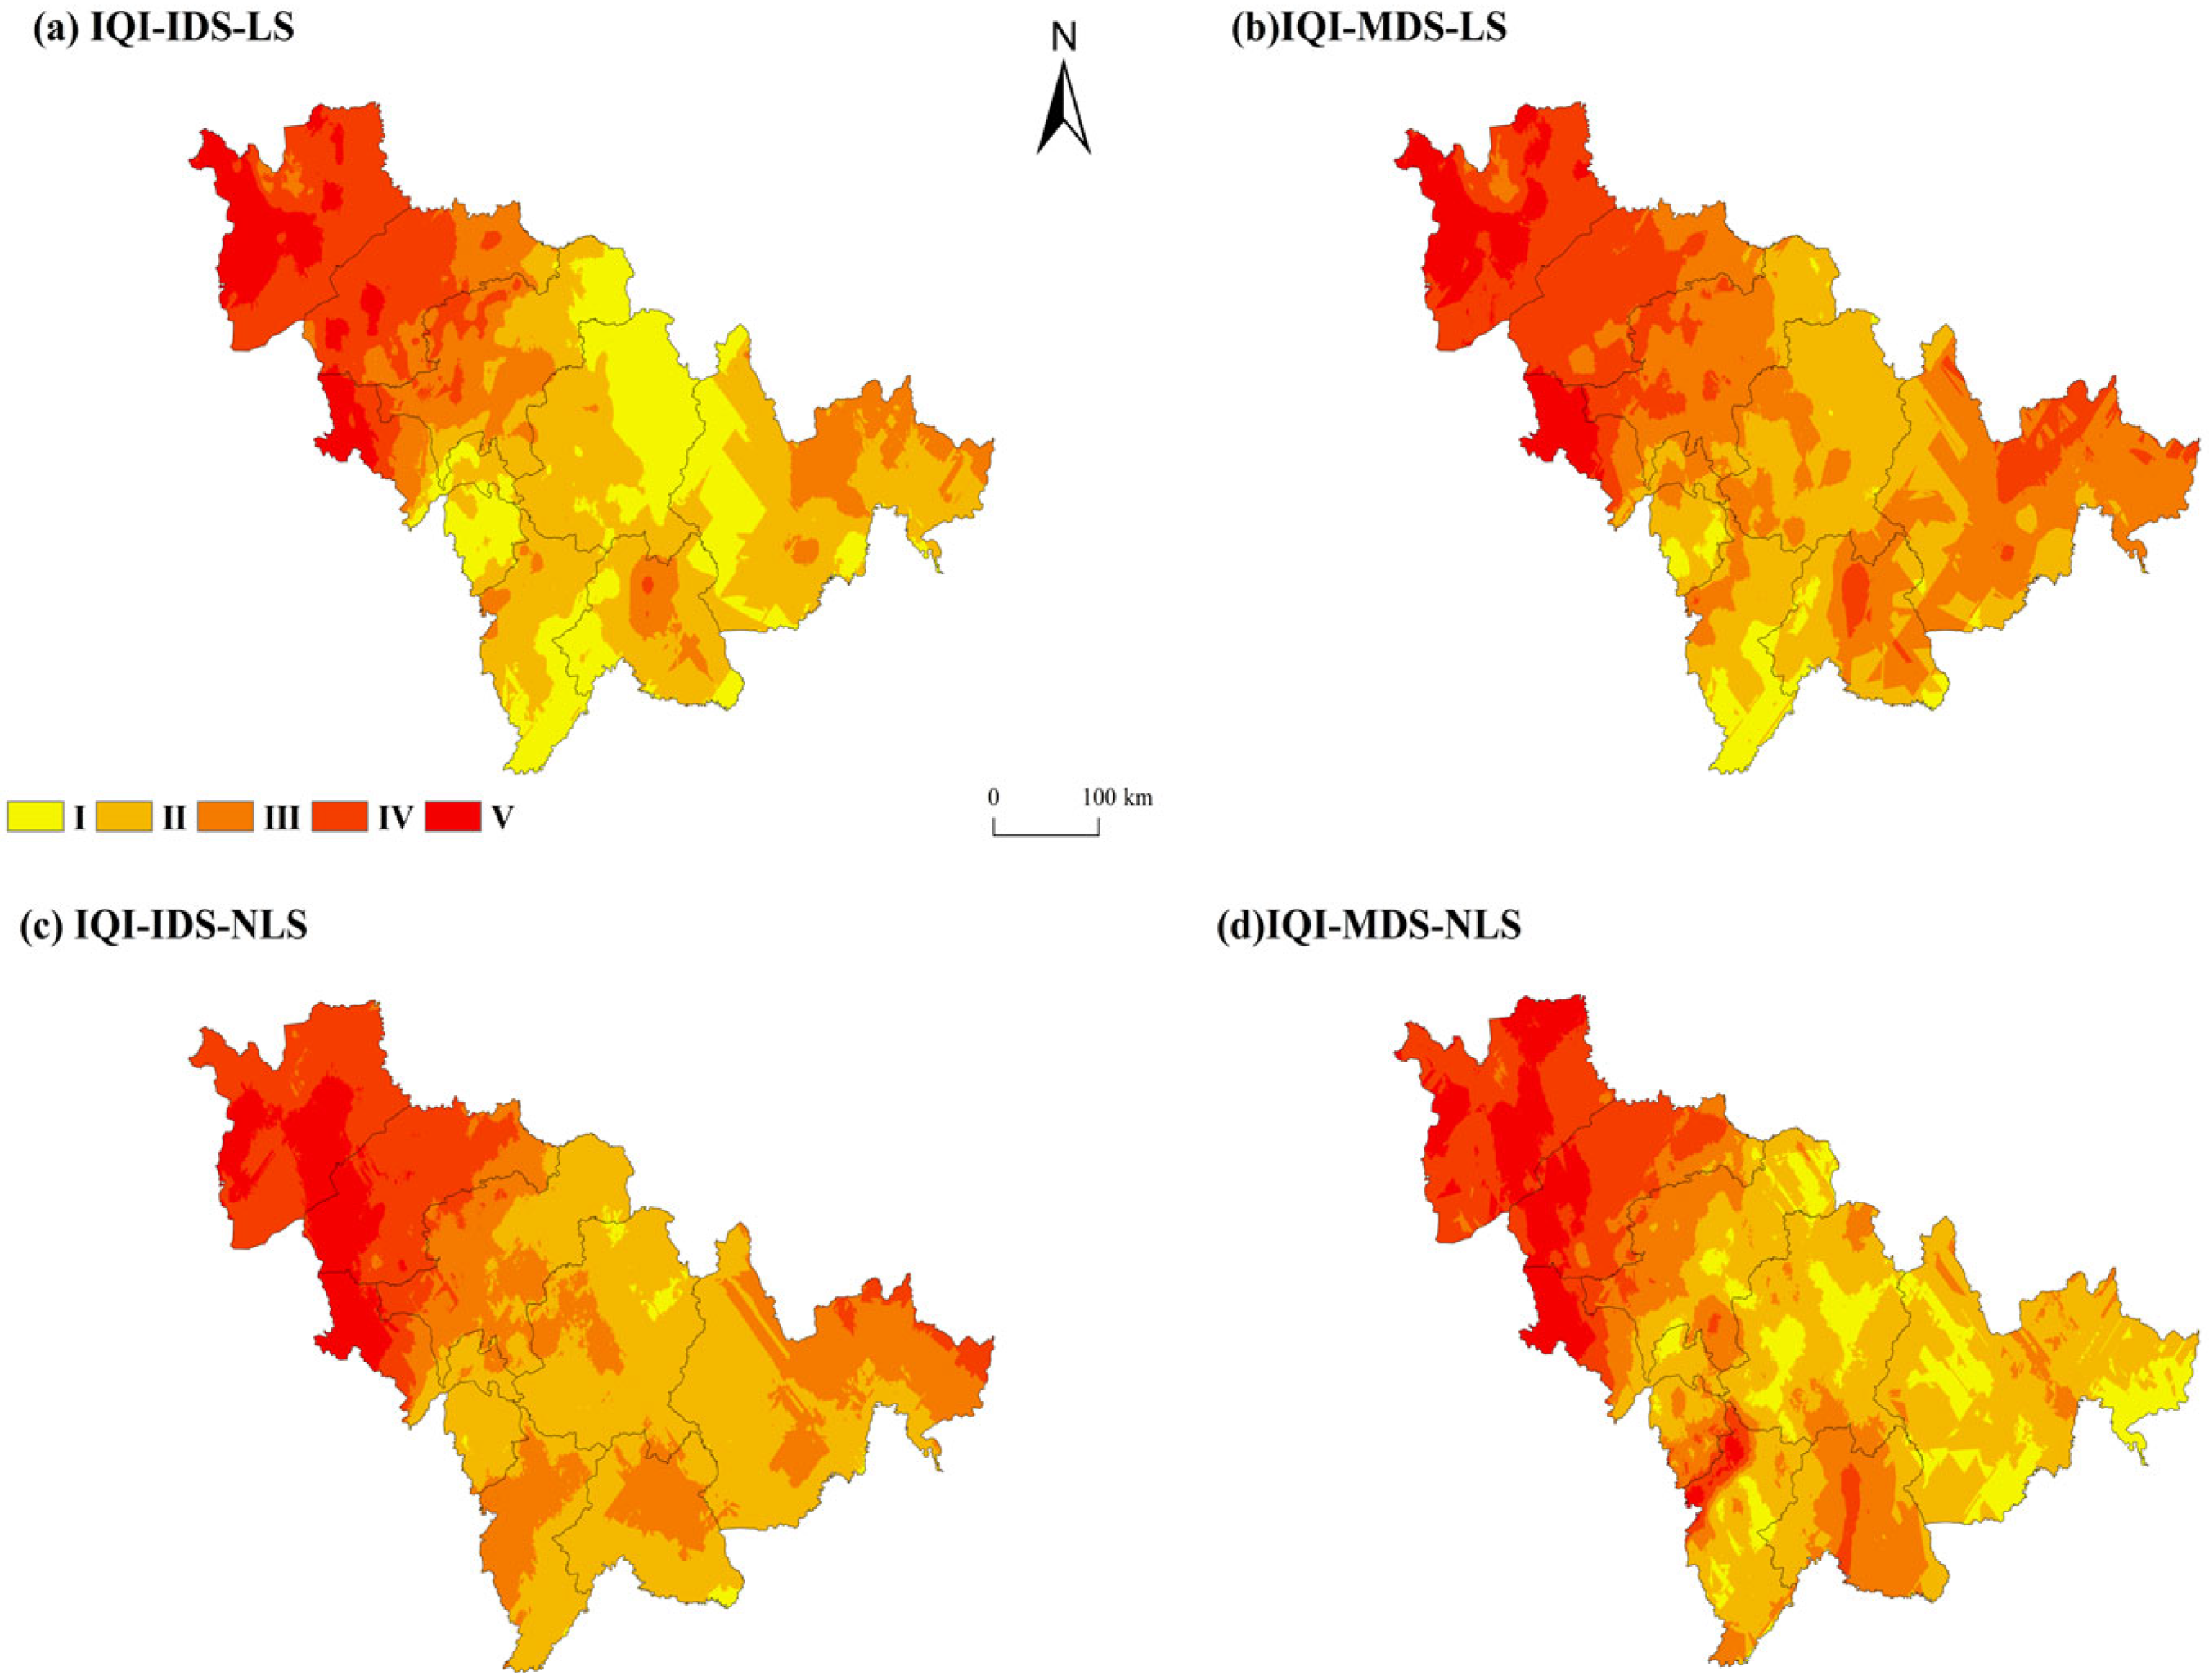
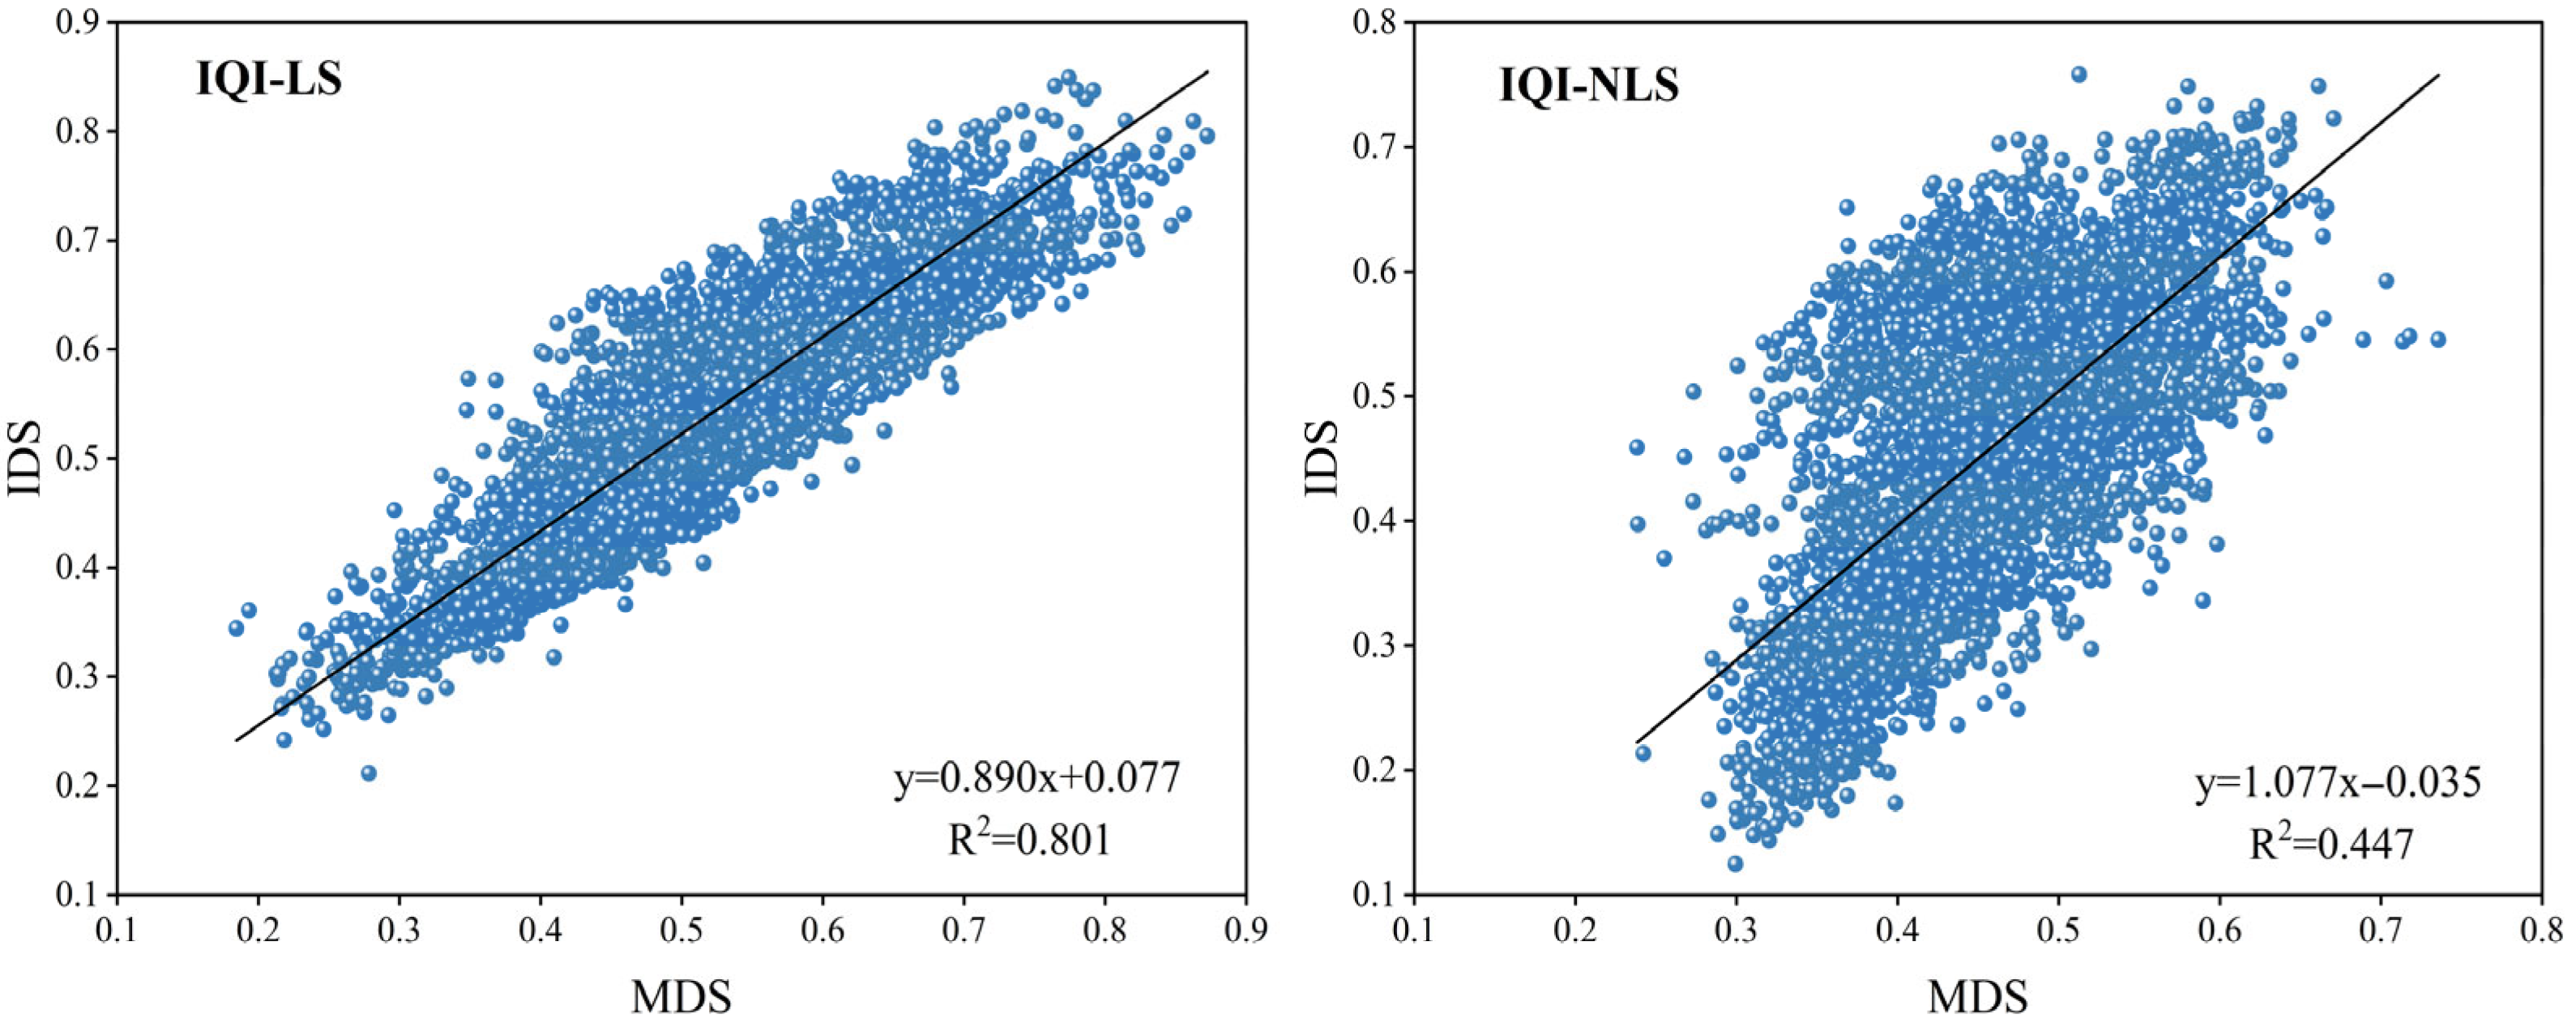
Linear relationships between different indicator-based methods (Figure 7) showed that MDS and IDS had a better fit under the LS method, with IQI-LS (R2 = 0.801) > IQI-NLS (R2 = 0.447). Although the spatial distribution trends of soil quality calculated by different methods were similar (Figure 8), significant local differences existed in the evaluation results: the IQI-NLS method significantly underestimated the soil quality of the study area, as larger areas of both IDS and MDS were classified into the lowest grade (Grade V) under this method (Table 10), accounting for 14.25% and 15.01% of the total area, respectively. Thus, IQI-MDS-LS was selected as the optimal model for soil quality assessment in Jilin Province.
Evaluation of Soil Quality Index
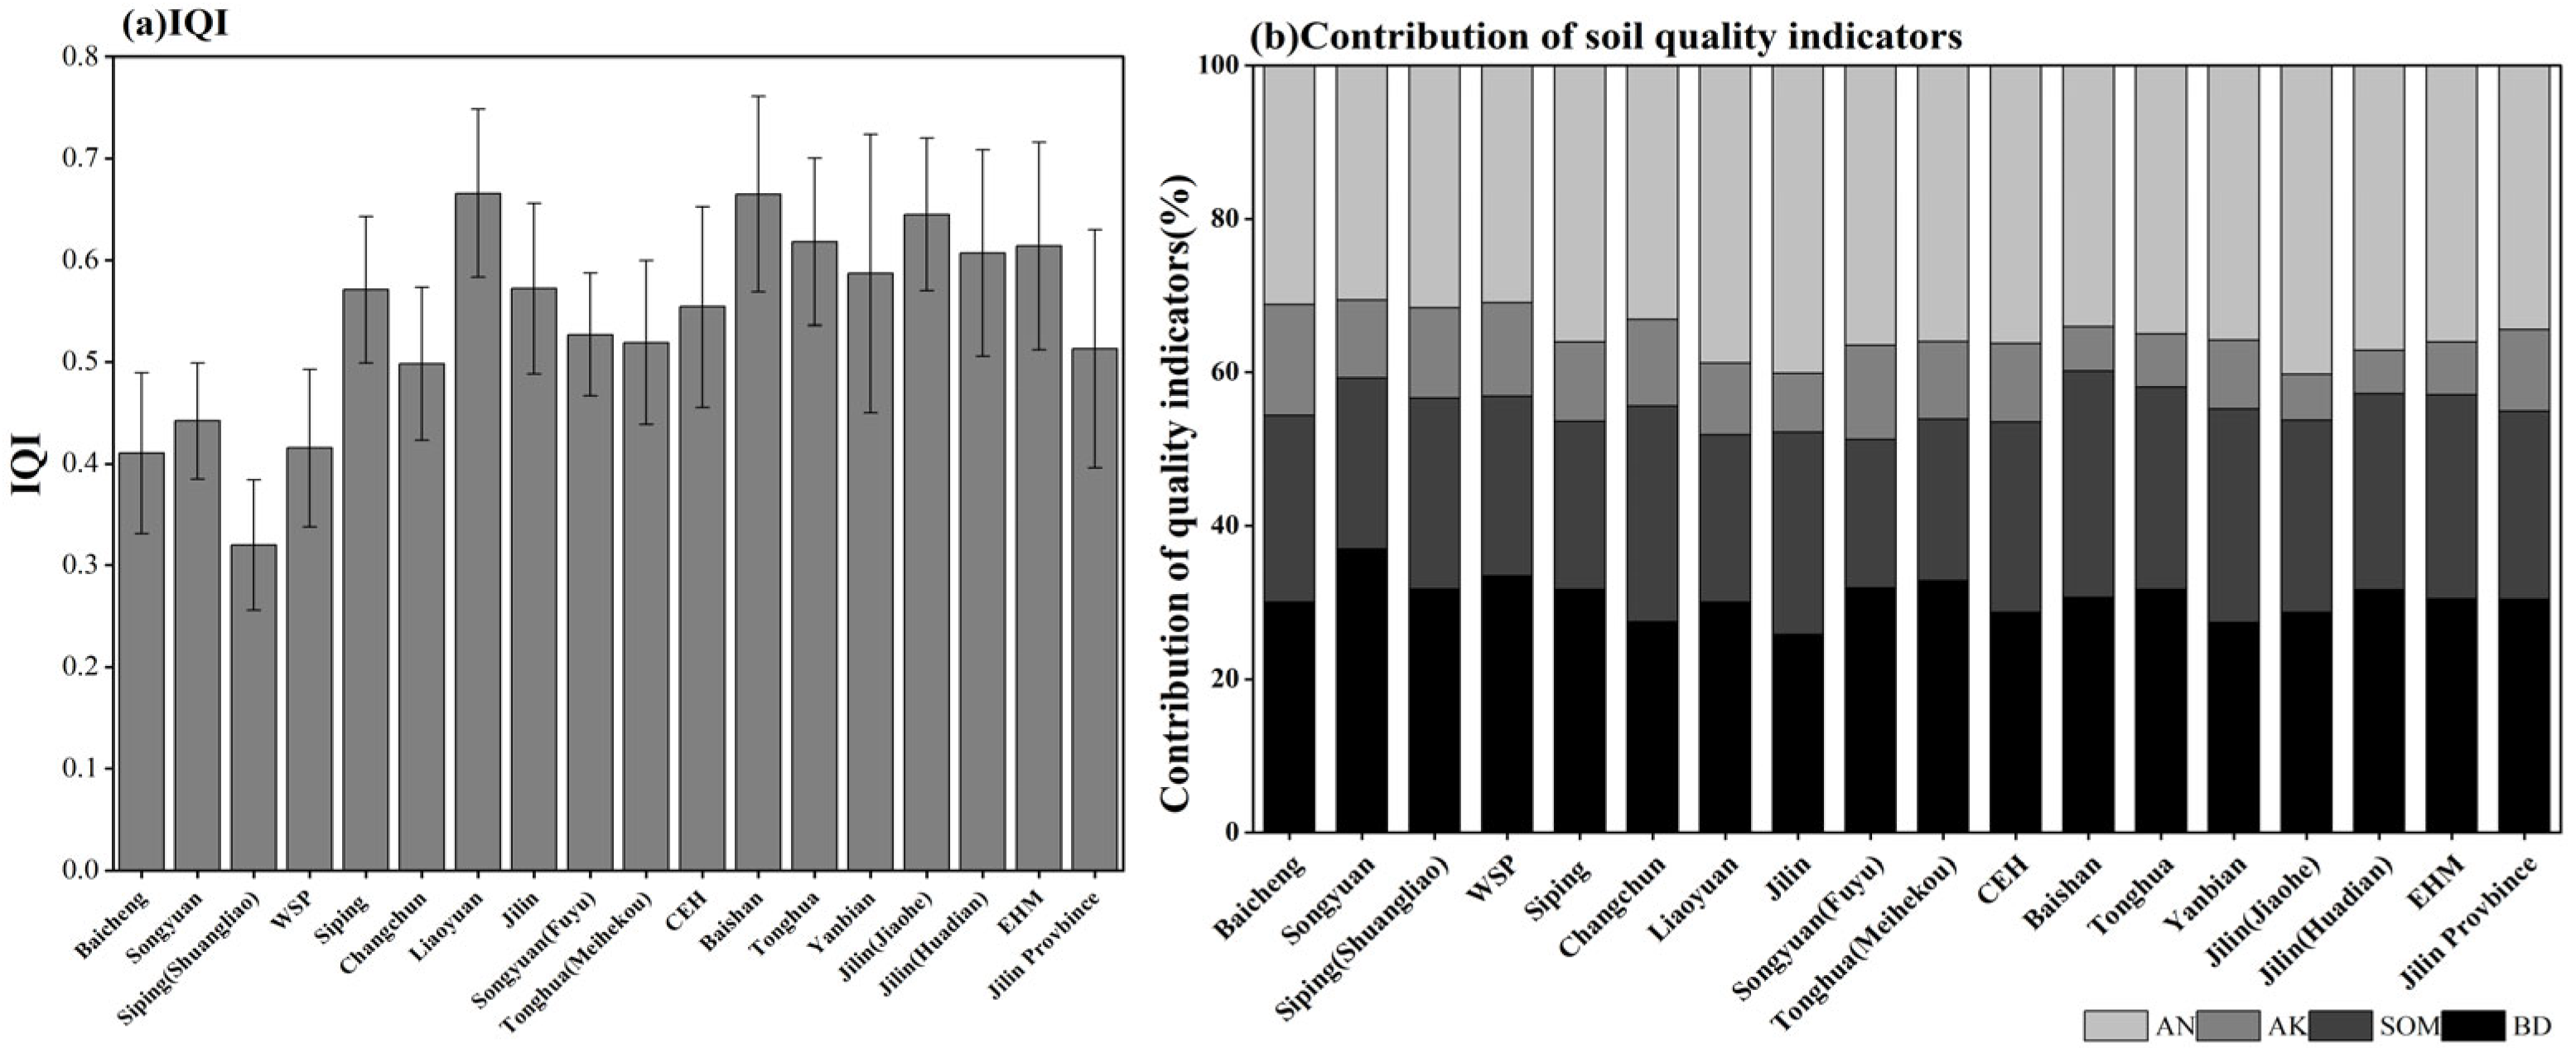
Although the IDS and MDS under the LS method showed high consistency, the MDS evaluation results were more representative of the study area’s actual soil quality, further confirming that IQIMDS-LS was suitable for soil quality assessment. As shown in Figure 8b, the study area’s soil quality was predominantly of medium grades (II, III, IV), accounting for 18.37%, 32.37%, and 27.64% of the total area, respectively (Table 11), while Grade I and Grade V soils accounted for only 9.30% and 12.32%. Figure 9a shows that the IQI ranged from 0.185 to 0.872 (mean = 0.513), with IQI increasing from northwest to southeast. Nevertheless, municipal-scale IQI exhibited distinct regional characteristics: the EHM region had a higher soil quality index (0.614) than the CEH (0.554) and WSP regions (0.415).
According to the contribution rates of soil indicators to IQI (Figure 9b), AN, AK, BD, and SOM contributed 34.46%, 10.59%, 30.41%, and 24.53%, respectively, indicating that AN is a critical factor affecting soil quality. This finding is also supported by the common factor variance analysis of indicator weights in MDS (Table 10), where AN had the highest weight (0.335) and AK the lowest (0.110).

3.3. Impact of Environmental Factors on Soil Quality

In this study, the potential environmental factors influencing soil quality included Temp, Pre, Slope, TWI and PM, and their degrees of influence on soil quality were analyzed. Table 12 shows a significant correlation between environmental factors and IQIMDS-LS, with the specific analysis as follows:
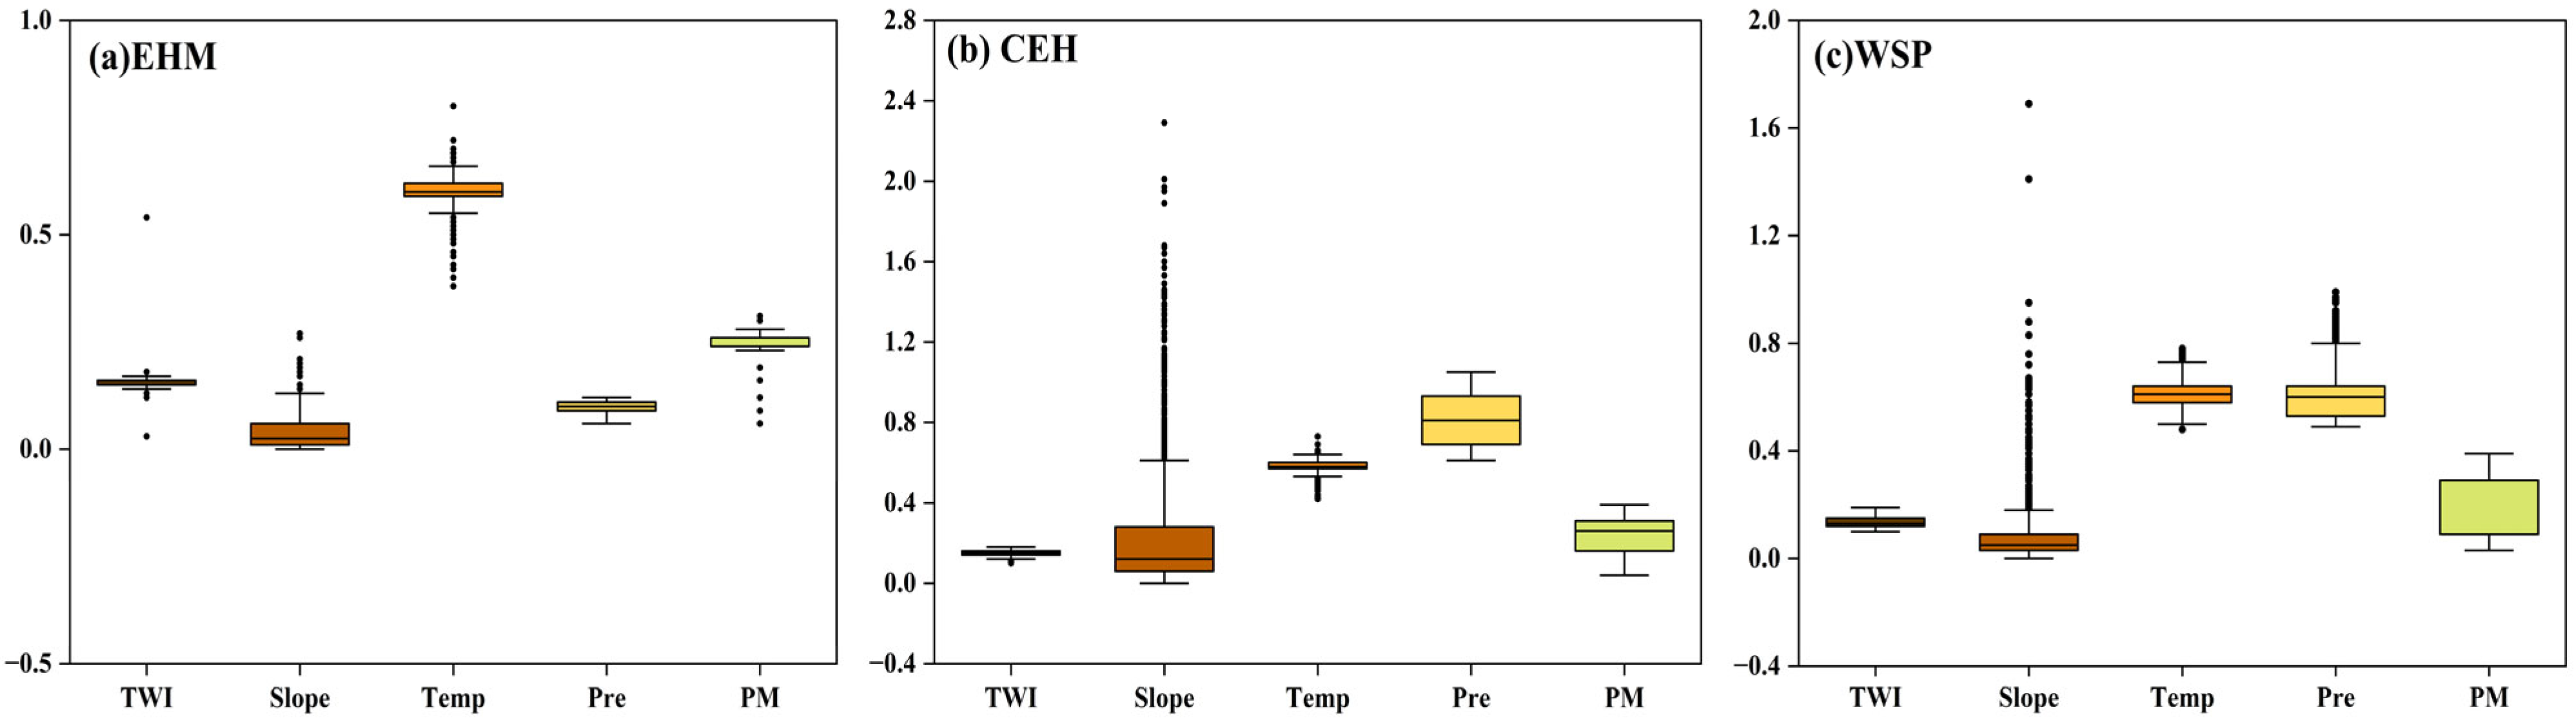
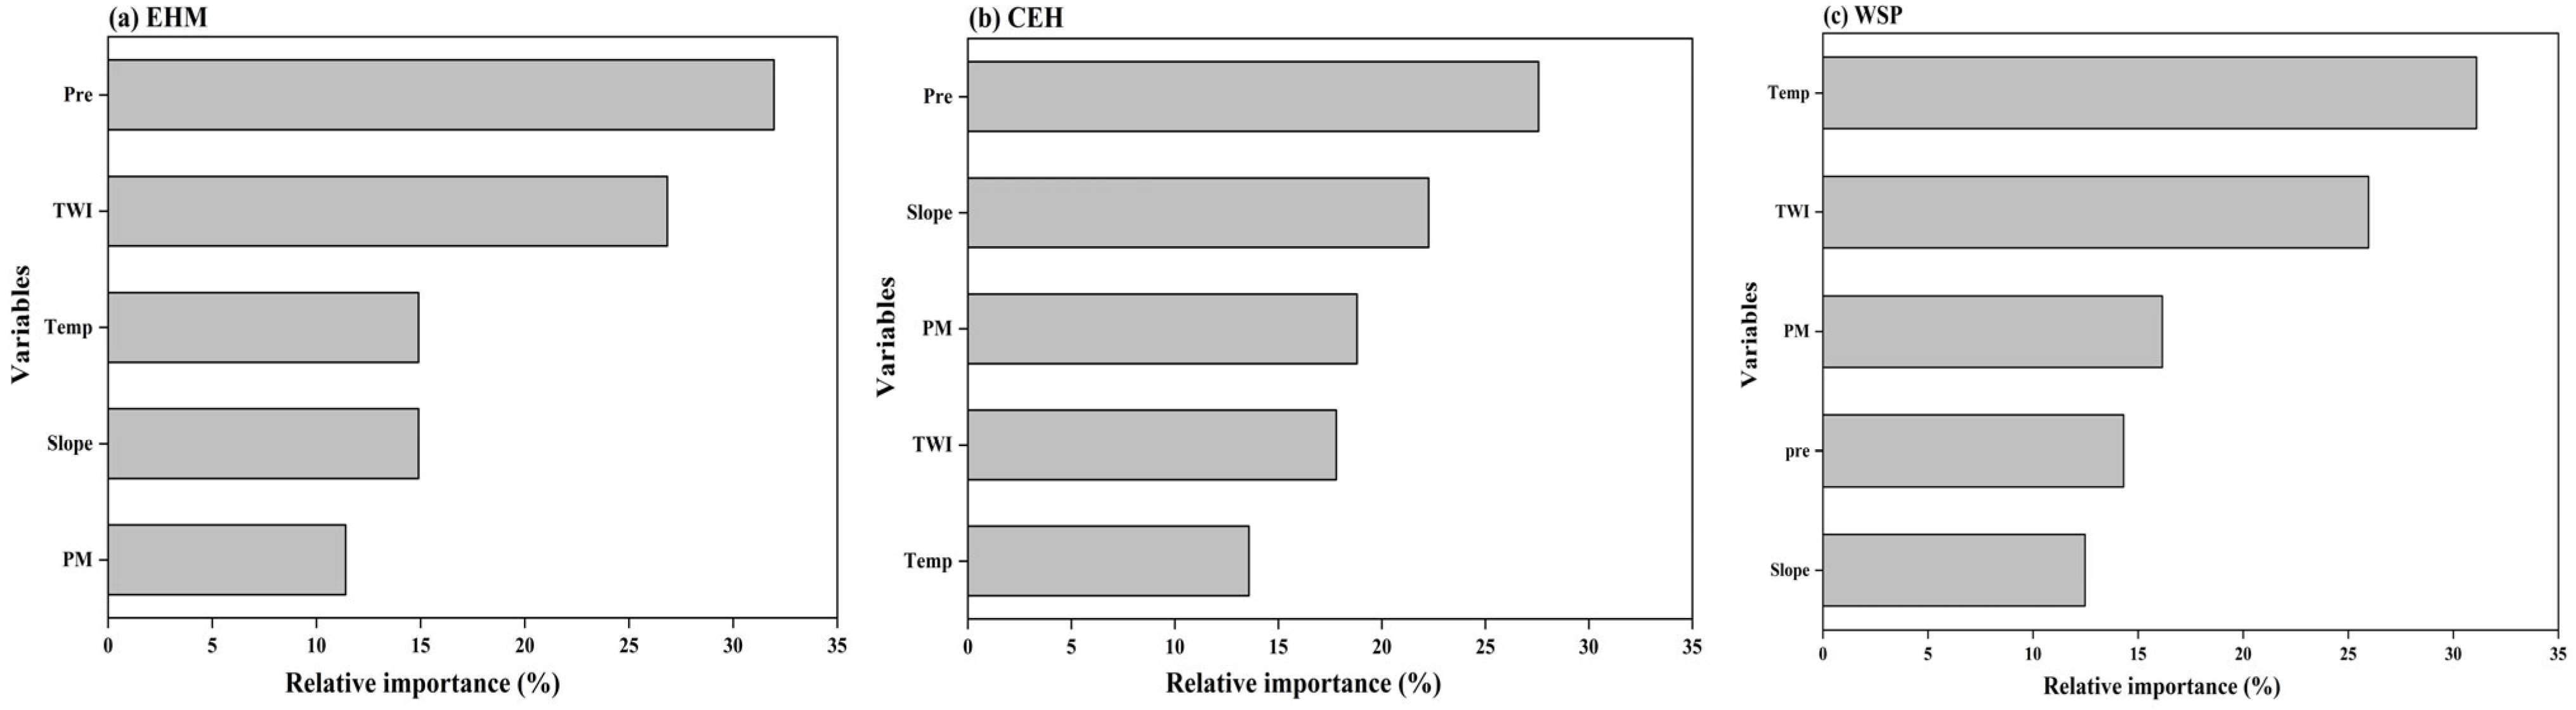
The EHM, with 358 samples, has high soil quality, an IQI of 0.614, and a standard deviation of 0.102 (Table 13). In this region, TWI and Pre were relatively high and concentrated, with minor regional variations (Figure 10a). OLS regression analysis (Figure 11a) indicated that Pre had a significant impact on soil quality, with a cumulative contribution rate of 31.96%, while other environmental factors had less restrictive effects, suggesting that soil quality in this region is primarily regulated by precipitation.
The CEH had the largest number of samples (2382), with a mean IQI of 0.554 and a standard deviation of 0.099 (Table 13). In contrast to the EHM region, the CEH region had higher Pre and lower Temp (Figure 10b). OLS regression analysis (Figure 11b) revealed that environmental factors had an important impact on soil quality in this area, with Pre and Slope as the key influencing factors, contributing 27.57% and 22.26%, respectively.
The WSP comprised 1391 samples and was characterized by lower soil quality, with a mean IQI of 0.415 and a small standard deviation of 0.077 (Table 13). There was no obvious change in the distribution of Temp and Pre in this region (Figure 10c). OLS analysis (Figure 11c) indicated that soil quality was less controlled by precipitation and slope, and was primarily regulated by Temp, TWI and PM, with contribution rates of 31.10%, 25.96% and 16.15%, respectively.
Through OLS regression analysis, the relationship between the IQI and its controlling factors was determined. The regression equations are as follows:
E H M : I Q I = 0.647 0.027 X T W I 0.157 X T e m p + 0.015 X P r e 0.012 X S l o p e 0.024 X P M ( n = 358 ,   r = 0.018 ,   p < 0.01 )
C E H : I Q I = 0.254 + 0.008 X T W I + 0.972 X T e m p 0.041 X P r e 0.111 X S l o p e 0.028 X P M ( n = 2382 ,   r = 0.143 ,   p < 0.01 )
W S P : I Q I = 0.543 + 0.081 X T W I 0.036 X T e m p 0.009 X P r e 0.101 X S l o p e 0.072 X P M ( n = 1391 ,   r = 0.163 ,   p < 0.01 )

4. Discussion

4.1. Soil Quality in the Study Area

Soil quality in the study area was predominantly medium-grade, with Grade I and Grade V soils distributed locally, which was consistent with previous findings [42,43]. Grade I soils were mainly distributed in Liaoyuan and Tonghua, characterized by high contents of SOM, AN, and AK as well as weakly acidic pH (Figure 4). In contrast, Grade V soils were concentrated in Baicong and Shuangliao, where inappropriate land use accelerated soil degradation and thus lowered soil quality [43], exhibiting low SOM and available nutrient contents, high pH and bulk density, and weak to strong alkalinity. As a critical indicator of soil quality and crop productivity, soil pH generally ranges from 6 to 7 for optimal plant growth [44]. In this study, the average soil pH in Jilin Province was 6.59, falling within the suitable range and indicating a generally favorable acid–base environment. Nevertheless, pH exhibited substantial spatial heterogeneity, with higher values in the WSP region than in the CEH and EHM regions, which could be attributed to multiple natural and anthropogenic factors. Anthropogenic disturbances, particularly long-term improper fertilization, may accelerate soil acidification or alkalization, alter nutrient availability, and degrade soil structure, while environmental factors, especially water balance, also exert profound influences on pH dynamics. A global trend of soil pH shifting from alkaline to acidic has been documented, with precipitation regulating soil sensitivity to management practices [45]. Therefore, systematic evaluation of soil acidification and salinization in representative regions, identification of their driving mechanisms, and implementation of targeted management strategies are essential for alleviating soil degradation and ensuring sustainable soil utilization.

4.2. Comparison of Soil Quality Evaluation Methods

All indicators used in this study were selected based on previous research to ensure comparability [19,46]. To enhance the practical guiding significance of the evaluation results for agricultural production, yield was included as a key criterion for screening the IDS. Correlation analysis results showed that all seven soil indicators except THK had a very significant correlation with yield (Table 1). Unlike previous studies that directly screened MDS from TDS [23,24], this study added the step of screening IDS using yield indicators, which distinguishes it from other related studies and makes the evaluation results more suitable for actual agricultural production practices. Using PCA, the number of IDS-related indicators was reduced from seven to four in the MDS for both the LS and NLS methods (Table 10). For the MDS derived from the LS method, AN and SOM had higher common factor variances and weights; in contrast, BD and pH were assigned higher weights in the MDS from the NLS method. However, AK had the lowest weight in both methods due to its lower coefficient of variation.
The applicability of an MDS is typically evaluated by the consistency of evaluation results between two datasets. Even with a high observed correlation, the MDS should be applied with caution. As shown in Figure 7, the overall spatial distribution patterns of evaluation results from the MDS under the two scoring methods were similar; however, the proportion of Grade V soil in IQI-NLS-MDS was the highest among the four datasets, while the proportion of medium-grade soils was lower than that in IQI-NLS-IDS (Table 11), clearly underestimating the study area’s soil quality. Both IQI-LS and IQI-NLS methods showed high correlations between IDS and MDS (p < 0.01) (Figure 6), with the correlation (R2 = 0.801) in the IQI-LS evaluation for Jilin Province being higher than that in the NLS method (R2 = 0.447). Furthermore, ref. [47] reported that LS method results were superior to NLS, with a high correlation (r > 0.60) in SQIs between the two methods. Although both index calculation methods are based on mathematical analysis and are easy to use, MDS-based IQI-LS performed better, possibly because NLS requires a deeper understanding of the study area’s soil and crop systems than LS. In most cases, parameters in the NLS equation (e.g., thresholds and baseline values) are empirical values from previous studies, which are often specific to certain soil types or regions [17,35]. Thus, these parameters may not be suitable for the black soils in this study, and modifying them could improve the NLS method’s accuracy.

4.3. Factors Influencing Soil Quality Control

The spatial heterogeneity of soil quality is the combined result of multiple factors; the significant regional differences in environmental factors can lead to distinct soil quality outcomes [19]. Therefore, quantifying the relationship between environmental factors and soil quality via OLS regression enables the analysis of soil quality’s regional differentiation patterns and the identification of key drivers within complex natural systems. Through regional comparative analysis, this study revealed the relationship between soil quality and environmental driving factors, indicating that the mechanisms shaping soil quality exhibit strong regional dependence, which arises from the differentiated combinations and dominant roles of factors such as climate, topography, and PM. Modifying these parameters could improve the NLS method’s accuracy.
This study found that the EHM region had overall higher soil quality with lower variability, where Pre was the key controlling factor, and the influence of other environmental factors was relatively limited (Figure 10a). This indicates that, under the background of relatively uniform Slope and PM, moisture conditions are the primary natural driving force regulating soil fertility and ecological functions in this region; precipitation can directly regulate soil quality by affecting processes such as leaching, SOM accumulation, and microbial activity [48]. In contrast, soil quality in the CEH region was affected by multiple environmental factors, with precipitation and Slope contributing the most prominently (Figure 10b); PM, TWI, and Temp also exerted significant impacts. This pattern of multi-factor synergistic control suggests that the region is a transitional zone for climate and topography, and its soil quality is the combined result of hydrothermal conditions, topographic relief, and parent material characteristics. Due to the relatively low Temp in the CEH region, Temp is a limiting factor for agricultural activities there [49]. Previous studies have shown that increased Temp can significantly enhance soil organic carbon and soil enzyme activity, thereby improving soil quality [49,50]. For the WSP region with lower soil quality, it was primarily controlled by temperature and TWI (Figure 10c), while Pre and PM also had a certain impact. Although slope is an important factor affecting soil quality by influencing soil erosion in many studies [51], and previous research has indicated that the slope has a great influence on soil quality [22,51], slope showed no significant relationship with soil quality in the EHM and WSP regions at a large scale in this study. This is because most farmland in these regions is distributed in flat valleys, making slope a non-primary factor affecting soil quality.
PM plays a crucial role in determining the composition of soils formed in a specific area [18]. However, soil properties can be altered by agricultural activities, and even long-term stable clay minerals can undergo spontaneous modification and transformation during sedimentation and burial processes [52]. Thus, the contribution of PM to soil quality varies across regions. In the central region, PM exerts a significant impact on soil quality; the soil is mainly derived from loessial sediments, with strong humus accumulation dominating the soil-forming process. In contrast, the initially formed soil physical and chemical properties from parent material differ considerably in the EHM region, where soils are mostly developed from rock weathering products and volcanic materials, containing relatively abundant minerals and thus exhibiting relatively good fertility. Although human activities can improve certain soil properties, fundamental changes are difficult to achieve in a short period, indicating that PM plays an important role in the spatial differentiation of soil quality.
Given its ability to quantitatively simulate soil hydrological conditions, TWI has been identified as a factor influencing soil properties in many studies [47,53,54]. However, TWI showed no significant correlation with IQI in the eastern region in this study, which may be associated with the TWI calculation method. Li [19] found that in areas with gentle topography, TWI values are high in narrow streamlines but generally low elsewhere, meaning that TWI measured by this method cannot accurately reflect soil moisture and humidity in gentle terrains.

5. Conclusions

Taking dry farmland in Jilin’s black soil area as the research object, this study established the optimal soil quality evaluation model by comparing different scoring methods and datasets. While IQI values from different methods exhibited similar spatial trends, detailed regional differences were observed. The MDS for soil quality evaluation was identified as SOM, AN, AK, and BD, reducing the TDS from eight to four indexes. Given MDS’s advantages in cost reduction and efficiency improvement, MDSIQI-LS is recommended for large-scale applications when it is highly consistent with IDS. The evaluation results indicated that soil quality in the study area was mainly moderate (Grades II, III, and IV), accounting for 78.38% of the total area, with IQI values gradually increasing from northwest to southeast.
Considering the complexity of environmental factors, sub-regional analysis was conducted to explore their relative importance. The results showed that: in the EHM region, the importance of environmental factors in descending order was Pre, TWI, Temp, Slope, PM, with Pre being the key factor controlling soil quality; in the CEH region, which is characterized by lower temperatures and relatively flat terrain, the main influencing factors were Pre, Slope, PM, TWI, and Temp in order of importance; in the WSP region, where soil quality is relatively low, Temp and TWI were the primary controlling factors, and the contribution of environmental factors to IQI followed the order: Temp > TWI > PM > Pre > Slope.
Based on the aforementioned results and regional climatic and soil characteristics, targeted technical strategies are proposed. The EHM region should adopt straw crushing and incorporation to consolidate soil, preserve fertility, elevate temperature and regulate moisture; the CEH region is suggested to implement straw mulching and no-tillage to improve soil quality and fertility; the WSP region should prioritize deep plowing with straw incorporation coupled with integrated water and fertilization to enhance fertility, conserve water and maintain soil moisture.

Author Contributions

Conceptualization, X.M. and N.M.; methodology, X.M., N.M. and Y.G.; software, Y.T., M.L., D.L. and R.L.; investigation, X.M., M.L. and D.L.; resources, N.M. and Y.G.; data curation, X.M. and F.L.; writing—original draft preparation, X.M., Y.T., F.L. and R.L.; writing—review and editing, X.M. and N.M.; supervision, N.M. and Y.G.; project administration, N.M.; funding acquisition, N.M. All authors have read and agreed to the published version of the manuscript.

Funding

This research was funded by the National Key Research and Development Program of China (2024YFD1500300), the Science and Technology Development Project Foundation of Jilin Province, China (20220203011SF), The 5th Batch of Young Sci-Tech Talents Nurturing Project of Jilin Province, China (QT202128) and the Innovation Training Program for College Students in China (202410193035).

Data Availability Statement

The data presented in this study are available on request from the corresponding author.

Acknowledgments

We wish to express our sincere gratitude to the Jilin Academy of Agricultural Sciences (Northeast Agricultural Research Center of China) and Jilin Provincial Soil and Fertilizer General Station (Jilin Cultivated Land Quality Monitoring Network) for their support and help in soil sampling, indicator measurement and establishment of the evaluation model.

Conflicts of Interest

The authors declare no conflicts of interest.

Abbreviations

AKavailable potassium
ANalkaline hydrolysis nitrogen
APavailable phosphorus
BDbulk density
CEHcentral tableland semi-humid zone
DEMdigital elevation model
EHMeastern hilly and mountainous humid zone
IDSimportant dataset
IQIintegrated quality index
LSlinear scoring method
MDSminimum dataset
Mgmagnesium
NO3-Nnitrate nitrogen
OKordinary kriging
OLSordinary least squares
PCAprincipal component analysis
PCsprincipal components
PMparent material
Preprecipitation
SQIsoil quality index
SSCsoil salt concentration
SOMsoil organic matter
TCtotal carbon
Temptemperature
TDStotal dataset
THKtopsoil thickness
TNtotal nitrogen
TStotal sulfur
TWItopographic wetness index
WSPwestern plain semi-arid zone
Ycrop yield

References

  1. Liu, L.; Qin, F.; Sheng, Y.; Li, L.; Dong, X.; Zhang, S.; Shen, C. Soil quality evaluation and limiting factor analysis in different microtopographies of hilly and gully region based on minimum data set. Catena 2025, 254, 108973. [Google Scholar] [CrossRef]
  2. Vasu, D.; Tiwary, P.; Chandran, P. A novel and comprehensive soil quality index integrating soil morphological, physical, chemical, and biological properties. Soil Tillage Res. 2024, 244, 106246. [Google Scholar] [CrossRef]
  3. Rahmanipour, F.; Marzaioli, R.; Bahrami, H.A.; Fereidouni, Z.; Bandarabadi, S.R. Assessment of soil quality indices in agricultural lands of Qazvin Province, Iran. Ecol. Indic. 2014, 40, 19–26. [Google Scholar] [CrossRef]
  4. Wang, P.; Fu, Z.; Yang, S. Resources Integration Theory and Gray Correlation Analysis: A Study for Evaluating China’s Agri-food Systems Supply Capacity. Res. World Agric. Econ. 2023, 4, 79–91. [Google Scholar] [CrossRef]
  5. Pacci, S.; Dengiz, O.; Alaboz, P.; Saygin, F. Artificial neural networks in soil quality prediction: Significance for sustainable tea cultivation. Sci. Total Environ. 2024, 947, 174447. [Google Scholar] [CrossRef] [PubMed]
  6. Gong, J.; Liu, Y.; Chen, W. Land suitability evaluation for development using a matter-element model: A case study in Zengcheng, Guangzhou, China. Land Use Policy 2012, 29, 464–472. [Google Scholar] [CrossRef]
  7. Mandal, D.; Sharda, V.N. Appraisal of soil erosion risk in the Eastern Himalayan region of India for soil conservation planning. Land Degrad. Dev. 2013, 24, 430–437. [Google Scholar] [CrossRef]
  8. Qi, Y.; Darilek, J.L.; Huang, B.; Zhao, Y.; Sun, W.; Gu, Z. Evaluating soil quality indices in an agricultural regionof Jiangsu Province, China. Geoderma 2009, 149, 325–334. [Google Scholar] [CrossRef]
  9. Andrews, S.S.; Karlen, D.L.; Mitchell, J.P. A comparison of soil quality indexing methods for vegetable productionsystems in Northern California. Agric. Ecosyst. Environ. 2002, 90, 25–45. [Google Scholar] [CrossRef]
  10. Liu, Z.; Zhou, W.; Shen, J.; Li, S.; He, P.; Liang, G. Soil quality assessment of Albic soils with different productivities for eastern China. Soil Tillage Res. 2014, 140, 74–81. [Google Scholar] [CrossRef]
  11. Bi, C.; Chen, Z.; Wang, J.; Zhou, D. Quantitative assessment of soil health under different planting patterns and soil types. Pedosphere 2013, 23, 194–204. [Google Scholar] [CrossRef]
  12. Cambardella, C.A.; Moorman, T.B.; Andrews, S.S.; Karlen, D.L. Watershed-scale assessment of soil quality in the loess hills of southwest Iowa. Soil Tillage Res. 2004, 78, 237–247. [Google Scholar] [CrossRef]
  13. Raiesi, F. A minimum data set and soil quality index to quantify the effect of land use conversion on soil quality and degradation in native rangelands of upland arid and semiarid regions. Ecol. Indic. 2017, 75, 307–320. [Google Scholar] [CrossRef]
  14. Amirinejad, A.A.; Kamble, K.; Aggarwal, P.; Chakraborty, D.; Pradhan, S.; Mittal, R.B. Assessment and mapping of spatial variation of soil physical health in a farm. Geoderma 2011, 160, 292–303. [Google Scholar] [CrossRef]
  15. Svoray, T.; Hassid, I.; Atkinson, P.M.; Moebius-Clune, B.N.; van Es, H.M. Mapping soil health over large agriculturally important areas. Soil Sci. Soc. Am. J. 2015, 79, 1420–1434. [Google Scholar] [CrossRef]
  16. Congreves, K.A.; Hayes, A.; Verhallen, E.A.; Van Eerd, L.L. Long-term impact of tillage and crop rotation on soilhealth at four temperate agroecosystems. Soil Tillage Res. 2015, 152, 17–28. [Google Scholar] [CrossRef]
  17. Glover, J.D.; Reganold, J.P.; Andrews, P.K. Systematic method for rating soil quality of conventional, organic, andintegrated apple orchards in Washington State. Agric. Ecosyst. Environ. 2000, 80, 29–45. [Google Scholar] [CrossRef]
  18. Alfaro, F.D.; Manzano, M.; Marquet, P.A.; Gaxiola, A. Microbial communities in soil chronosequences with distinct parent material: The effect of soil pH and litter quality. J. Ecol. 2017, 105, 1709–1722. [Google Scholar] [CrossRef]
  19. Li, X.; Wang, D.; Ren, Y.; Wang, Z.; Zhou, Y. Soil quality assessment of croplands in the black soil zone of JilinProvince, China: Establishing a minimum data set model. Ecol. Indic. 2019, 107, 105251. [Google Scholar] [CrossRef]
  20. Zhang, G.; Bai, J.; Xi, M.; Zhao, Q.; Lu, Q.; Jia, J. Soil quality assessment of coastal wetlands in the Yellow RiverDelta of China based on the minimum data set. Ecol. Indic. 2016, 66, 458–466. [Google Scholar] [CrossRef]
  21. Omer, M.; Idowu, O.J.; Ulery, A.L.; Leeuwen, D.V.; Guldan, S.J. Seasonal changes of soil quality indicators in selected arid cropping systems. Agriculture 2018, 8, 124. [Google Scholar] [CrossRef]
  22. Yu, P.; Liu, S.; Zhang, L.; Li, Q.; Zhou, D. Selecting the minimum data set and quantitative soil quality indexingof alkaline soils under different land uses in northeastern China. Sci. Total Environ. 2018, 616, 564–571. [Google Scholar] [CrossRef]
  23. Li, Y.; Sun, Y.; Kuramae, E.E.; Zhang, S.; Wang, E.; Yao, Z.; Nasir, F.; Tian, L.; Gao, Q.; Tian, C. Positive effect of carbohydrate-metabolizing bacteria determines increasing soil organic carbon during long-term fertilization and straw returning in the black soil region of China. Pedosphere 2024, 34, 853–864. [Google Scholar] [CrossRef]
  24. Chen, S.; Fan, W.; Wu, H.; Cheng, S.; Liu, J.; Fan, Z.; Liang, Y.; Cai, H. Deep tillage with straw retention increased organic carbon sequestration and enhanced homogenization of microbial communities and functions across soildepths. Agric. Ecosyst. Environ. 2026, 395, 109949. [Google Scholar] [CrossRef]
  25. Hou, S.; Ren, H.; Fan, F.; Zhao, M.; Zhou, W.; Zhou, B.; Li, C. The effects of plant density and nitrogen fertilization on maize yield and soil microbial communities in the black soil region of Northeast China. Geoderma 2023, 430, 116325. [Google Scholar] [CrossRef]
  26. Zhang, L.; Baoyin, B.; Cui, J.; Ma, J.; Zhao, Z.; Wang, H.; Duan, R.; Li, Q. Crop rotation improves soil biological properties and spring maize yield in Northeast China. J. Agric. Food Res. 2025, 24, 102439. [Google Scholar] [CrossRef]
  27. Bohoussou, N.D.Y.; Zheng, G.; Zhang, S.; Wu, W.; Ju, F.; Ayenikafo, O.M.; Boboua, S.Y.B.; Dang, Y.P. Influence of fertilization, tillage, and residue management on soil organic carbon, total nitrogen, and soil pH in black soils of Northeast China. Eur. J. Agron. 2026, 173, 127911. [Google Scholar] [CrossRef]
  28. Xu, Z.; Zhang, T.; Wang, S.; Wang, Z. Soil pH and C/N ratio determines spatial variations in soil microbial communities and enzymatic activities of the agricultural ecosystems in Northeast China: Jilin Province case. Appl. Soil Ecol. 2020, 155, 103629. [Google Scholar] [CrossRef]
  29. Blake, G.R.; Hartge, K.H. Bulk Density, 2nd ed.; Klute, A., Ed.; American Society of Agronomy and Soil Science Society of America: Madison, WI, USA, 1986; Volume 5, pp. 363–375. [Google Scholar]
  30. Nelson, D.W.; Sommers, L.E. Total Carbon, Organic Carbon, and Organic Matter, 2nd ed.; Page, A.L., Miller, R.H., Keeney, D.R., Eds.; American Society of Agronomy and Soil Science Society of America: Madison, WI, USA, 1982; Volume 9, pp. 539–579. [Google Scholar]
  31. Soil and Plant Analysis Council, Inc. Handbook on Reference Methods for Soil Analysis, 2nd ed.; Dellavalle, N.B., Ed.; Council on Soil Testing & Plannt Analysis: Athens, GA, USA, 1992; pp. 44–50. [Google Scholar]
  32. Bremner, J.M.; Mulvaney, C.S. Nitrogen—Total, 2nd ed.; Page, A.L., Miller, R.H., Keeney, D.R., Eds.; American Society of Agronomy and Soil Science Society of America: Madison, WI, USA, 1982; Volume 9, pp. 595–624. [Google Scholar]
  33. Olsen, S.R.; Sommers, L.E. Phosphorus Soluble in Sodium Bicarbonate, 2nd ed.; Page, A.L., Miller, R.H., Eds.; American Society of Agronomy and Soil Science Society of America: Madison, WI, USA, 1982; Volume 9, pp. 403–430. [Google Scholar]
  34. Lu, R. Soil Analytical Methods of Agronomic Chemical, 2nd ed.; China Agricultural Science and Technology Press: Beijing, China, 2000. (In Chinese) [Google Scholar]
  35. Guo, L.; Sun, Z.; Ouyang, Z.; Han, D.; Li, F. A comparison of soil quality evaluation methods for Fluvisol along the lower Yellow River. Catena 2017, 152, 135–143. [Google Scholar] [CrossRef]
  36. NY/T 309-1996; National Division of Arable Land Types and Grading of Arable Land Quality. China Standards Press: Beijing, China, 1997.
  37. Kumar, S.; Lal, R.; Liu, D. A geographically weighted regression kriging approach for mapping soil organic carbon stock. Geoderma 2012, 189, 627–634. [Google Scholar] [CrossRef]
  38. Microsoft Corporation. Microsoft Excel 2019 [Computer Software]; Microsoft Corporation: Redmond, WA, USA, 2019. [Google Scholar]
  39. IBM Corp. IBM SPSS Statistics 27 [Computer Software]; IBM Corporation: Armonk, NY, USA, 2021. [Google Scholar]
  40. OriginLab Corporation. OriginPro 2025 [Computer Software]; OriginLab Corporation: Northampton, MA, USA, 2024. [Google Scholar]
  41. Esri. ArcMap 10.8.2 [Computer Software]; Environmental Systems Research Institute: Redlands, CA, USA, 2020. [Google Scholar]
  42. Liu, X.; Zhang, X.; Wang, Y.; Sui, Y.; Zhang, S.; Herbert, S.J.; Ding, G. Soil degradation: A problem threatening the sustainable development of agriculture in Northeast China. Plant Soil Environ. 2010, 56, 87–97. [Google Scholar] [CrossRef]
  43. Obade, V.D.P.; Lal, R. A standardized soil quality index for diverse field conditions. Sci. Total Environ. 2016, 541, 424–434. [Google Scholar] [CrossRef] [PubMed]
  44. Rezaei, S.A.; Gilkes, R.J.; Andrews, S.S. A minimum data set for assessing soil quality in rangelands. Geoderma 2006, 136, 229–234. [Google Scholar] [CrossRef]
  45. Zhang, S.; Jiang, L.; Liu, X.; Zhang, X.; Fu, S.; Dai, L. Soil nutrient variance by slope position in a Mollisol farmland area of Northeast China. Chin. Geogr. Sci. 2016, 26, 508–517. [Google Scholar] [CrossRef]
  46. Conrad, O.; Bechtel, B.; Bock, M.; Dietrich, H.; Fischer, E.; Gerlitz, L.; Wehberg, J.; Wichmann, V.; Bohner, J. System for automated geoscientific analyses (SAGA) v. 2.1.4. Geosci. Model Dev. 2015, 8, 1991–2007. [Google Scholar] [CrossRef]
  47. Slessarev, E.W.; Lin, Y.; Bingham, N.L.; Johnson, J.E.; Dai, Y.; Schimel, J.P.; Chadwick, O.A. Water balance createsa threshold in soil pH at the global scale. Nature 2016, 540, 567–569. [Google Scholar] [CrossRef]
  48. Dong, M.; Xia, W.; Li, L.; Zhou, H. Spatiotemporal Variation in Soil Health in Slope Farmlands in Hunan Province: Taking Fenghuang County as an Example. J. Irrig. Drain. 2022, 41, 2022230. [Google Scholar] [CrossRef]
  49. Padarian, J.; Minasny, B.; McBratney, A.B. Using deep learning to predict soil properties from regional spectral data. Geoderma 2019, 16, e00198. [Google Scholar] [CrossRef]
  50. Liu, Y.; Wang, L.; Liu, B.; Mark, H. Observed changes in shallow soil temperatures in Northeast China, 1960–2007. Clim. Res. 2016, 67, 31–42. [Google Scholar] [CrossRef]
  51. Song, C.; Zhang, J. Effects of soil moisture, temperature, and nitrogen fertilization on soil respiration and nitrous oxide emission during maize growth period in northeast China. Acta Agric. Scand. Sect. B–Soil Plant Sci. 2009, 59, 97–106. [Google Scholar] [CrossRef]
  52. Wang, Z.; Zhang, B.; Song, K.; Liu, D.; Li, F.; Guo, Z.; Zhang, S. Soil organic carbon under different landscape attributes in croplands of Northeast China. Plant Soil Env. 2008, 54, 420–427. [Google Scholar] [CrossRef]
  53. Liu, Y.; Yao, S.; Han, X.; Zhang, B.; Banwart, S.A. Soil mineralogy changes with different agricultural practices during 8-year soil development from the parent material of a Mollisol. Adv. Agron. 2017, 142, 143–179. [Google Scholar] [CrossRef]
  54. Meng, D.; Bao, N.; Tayier, K.; Li, Q.; Yang, T. A remote sensing based index for assessing long-term ecological impact in arid mined land. Environ. Sustain. Indic. 2024, 22, 100364. [Google Scholar] [CrossRef]
Figure 1. Overview of the study area and soil sampling points: (a) Digital DEM Model of Jilin’s black soil area (for extracting topographic parameters including Slope and TWI); (b) distribution of 4131 soil samples (0–20 cm layer) covering all prefecture-level cities in Jilin Province. Note: The study area is the black soil region of Jilin Province. A total of 4131 topsoil samples (0–20 cm) were collected across the entire region for soil property analysis.
Agronomy 16 00597 g001
Figure 2. Maps of slope (a) and TWI (b) in the study area.
Agronomy 16 00597 g002
Figure 3. Geological map of the study area.
Agronomy 16 00597 g003
Figure 4. Maps of Temp (a) and Pre (b) in the study area.
Agronomy 16 00597 g004
Figure 5. Spatial distribution of soil nutrients and physical properties in Jilin Province. (a) pH; (b) SOM; (c) AN; (d) AK; (e) TN; (f) AP; (g) BD; (h) THK.
Agronomy 16 00597 g005
Figure 6. Correlation between LS and NLS indicators. Note: * indicates a significant correlation (p < 0.05); ** indicates a highly significant correlation (p < 0.01).
Agronomy 16 00597 g006
Figure 7. Linear relationship between IDS and MDS indicators across different models.
Agronomy 16 00597 g007
Figure 8. Distribution of soil quality grades evaluated by different methods in the study area.
Agronomy 16 00597 g008
Figure 9. Soil quality IQI and contribution rate of soil quality indicators in Jilin Province.
Agronomy 16 00597 g009
Figure 10. The distribution of environmental variables in the EHM, CEH and WSP regions of Jilin Province.
Agronomy 16 00597 g010
Figure 11. The contribution of environmental control factors to the total variance of IQI in the EHM, CEH and WSP parts of Jilin Province.
Agronomy 16 00597 g011
Table 1. Laboratory analysis method of selected indicators.
IndicatorAnalytical MethodReferences
BDCutting ring method[29]
SOMPotassium dichelate method with external heating[30]
pHElectrode method with a soil-to-water ratio of 1:1[31]
TNSemi-micro Kjeldahl’s method[32]
APOlsen method[33]
AK Flame   luminosity   method   with   1   m o l · L 1 N H 4 A c extraction[34]
ANAlkaline hydrolysis diffusion method[34]
Note: The analytical methods and corresponding references for soil physical and chemical properties determined in this study are listed in this table, ensuring the reliability and reproducibility of the measurement data.
Table 2. Linear membership function table.
IndexType x 1 x 2 b 1 b 2 Membership Function
SOM (g·kg−1)U ( x ) 3.4067.30 U ( x ) { 0.1                                                       x     x 1 0.9 × x x 1 x 2 x 1 + 0.1 1.0                                                     x     x 2 x 1 < x < x 2
R ( x ) { 0.1 x < x 1 0.9 × x x 1 b 1 x 1 + 0.1 x 1 < x < b 1   1.0 b 1 x b 2 1 0.9 × x b 2 x 2 b 2 b 2 < x < x 2 0.1 x > x 2
TN (g·kg−1)U ( x ) 0.104.08
AP (mg kg−1)U ( x ) 3.0099.90
AK (mg kg−1)U ( x ) 32.58298.80
AN (mg kg−1)U ( x ) 10.00239.20
BD (g·cm−3) R ( x ) 1.001.761.271.39
pHR ( x ) 3.279.855.186.27
Note: In the equations, x is the measured value of the indicator; U(x) and R(x) are the “more is better” and “optimal range” scoring functions, respectively, with values ranging from 0.1 to 1; X1 and X2 are the maximum and minimum values of the indicator, respectively; and b1 and b2 are the lower and upper limits of the optimal range, respectively.
Table 3. Descriptive statistics of soil indicators in Jilin Province.
IndexRangeMeanCV
BD (g·cm−3)1.00–1.761.330.11
THK (cm)10.00–30.0019.550.17
pH3.27–9.856.590.20
SOM (g· kg−1)3.40–67.3025.850.35
TN (g kg−1)0.10–4.081.320.50
AP (mg kg−1)3.00–99.9030.740.73
AN (mg kg−1)10.00–239.20121.490.41
AK (mg·kg−1)32.58–298.80145.000.37
Note: Cv denotes the coefficient of variation.
Table 4. Classification standards for soil pH and nutrient content.
IndexSufficiencyOptimumDeficiency
Grade1Grade2Grade3Grade4Grade5Grade6
pH6.5~7.55.5~6.54.5~5.57.5~8.5<4.5>8.5
SOM>4030~4020~3010~206~10<6
AN>150120~15090~12060~9030~60<30
AP>4020~4010~205~103~5<3
AK>200150~200100~15050~10030~50<30
TN>2.01.5~2.01.0~1.50.75~1.00.5~0.75<0.5
Note: pH value: strong alkaline > 9.0; alkaline 8.5~9.0; weak alkaline 7.5~8.5; neutral 6.5~7.5; weak acidic 5.5~6.5; acidic 4.5~5.5; strong acid < 4.5; > and < do not include this value.
Table 5. Descriptive statistics of soil indicators in the EHM of Jilin Province.
IndexRangeMeanCV
BD (g·cm−3)1.00–1.671.230.10
THK (cm)10.00–30.0018.620.20
pH3.15–7.425.550.11
SOM (g·kg−1)9.74–66.5535.030.29
TN (g kg−1)0.46–4.081.650.33
AP (mg kg−1)3.30–99.8044.260.63
AN (mg kg−1)25.18–238.00154.250.28
AK (mg·kg−1)35.00–282.33115.150.43
Table 6. Descriptive statistics of soil indicators in the CEH of Jilin Province.
IndexRangeMeanCV
BD (g·cm−3)1.00–1.771.320.11
THK (cm)10.00–30.0019.850.18
pH3.27–9.406.070.20
SOM (g·kg−1)7.50–67.3028.450.28
TN (g·kg−1)0.10–3.491.440.33
AP (mg·kg−1)3.20–43.7036.340.59
AN (mg·kg−1)20.70–239.20138.710.32
AK (mg·kg−1)32.58–298.80154.490.35
Table 7. Descriptive statistics of soil indicators in the WSP of Jilin Province.
IndexRangeMeanCV
BD (g·cm−3)1.04–1.751.380.10
THK (cm)12.00–30.0019.280.14
pH5.10–9.857.750.10
SOM (g·kg−1)3.40–43.7019.060.29
TN (g·kg−1)0.12–2.921.040.40
AP (mg·kg−1)3.00–98.7017.670.88
AN (mg·kg−1)10.00–238.0083.590.42
AK (mg·kg−1)35.00–294.15136.450.37
Table 8. Correlation analysis between soil indicators and Y.
IndexBDTHKpHOMTNAPAKANY
BD1
THK−0.0131
pH0.373 **0.042 **1
OM−0.211 **−0.101 **−0.457 **1
TN−0.087 **−0.161 **−0.369 **0.795 **1
AP−0.209 **−0.089 **−0.541 **0.327 **0.265 **1
AK−0.033 *0.143 **−0.0260.089 **0.089 **0.071 **1
AN−0.358 **0.014−0.589 **0.467 **0.405 **0.366 **0.138 **1
Y−0.220 **0.005−0.350 **0.274 **0.236 **0.254 **0.041 **0.243 **1
Note: * indicates a significant correlation (p < 0.05); ** indicates a highly significant correlation (p < 0.01).
Table 9. PCA results for soil quality indicators.
LS NLS
PC1PC2PC3PC1PC2PC3
SOM0.82−0.40−0.180.87−0.18−0.04
TN0.73−0.56−0.210.81−0.34−0.05
AP0.630.300.030.640.28−0.01
AK0.15−0.350.890.21−0.140.82
AN0.760.140.160.730.220.12
BD0.440.520.29−0.130.650.47
PH0.670.39−0.150.310.65−0.36
Eigenvalue2.841.121.012.521.141.05
Variance (%)40.5616.0214.3736.0516.2614.95
Cumulative variance (%)40.5656.5870.9536.0552.3167.27
Table 10. Commonality and weight values of all indicators in IDS and MDS methods based on LS and NLS functions.
IndexIDS-LS
COM Weight
MDS-LS
COM Weight
IndexIDS-NLS
COM Weight
MDS-NLS
COM Weight
SOM0.8600.0980.5580.300SOM0.7920.1500.7000.246
TN0.8880.054 TN0.7770.115
AP0.4840.177 AP0.4880.171
AK0.9410.0980.0760.110AK0.7380.1320.8740.012
AN0.6210.2000.6980.335AN0.6010.199
BD0.5440.1980.4030.255BD0.6600.1260.9090.281
pH0.6270.176 pH0.6530.1070.7830.462
Note: COM indicates the commonality value.
Table 11. Area percentage of soil quality grades in Jilin Province.
MethodsArea (%)
IDSIQI-LS15.8323.9223.0223.3413.89
IQI-NLS9.8325.9326.8523.1414.25
MDSIQI-LS9.3018.3732.3727.6412.32
IQI-NLS12.1025.5123.4123.9715.01
Table 12. Correlation coefficients between IQIMDS-LS and environmental variables in the EHM, CEH, and WSP regions.
EHMIQIMDS-LSTWITempPreSlopePM
IQIMDS-LS1.000.060.040.11 *−0.04−0.01
TWI0.061.000.050.52 **0.13 *0.04
Temp0.040.051.000.21 **−0.22 **−0.10
Pre0.11 *0.52 **0.21 **1.000.070.10
Slope−0.040.13 *−0.22 **0.071.000.08
PM−0.010.04−0.100.100.081.00
CEHIQIMDS-LSTWITempPreSlopePM
IQIMDS-LS1.000.12 **0.08 **−0.30 **−0.16 **−0.13 **
TWI0.12 **1.00−0.52 **−0.58 **−0.31 **−0.19 **
Temp0.08 **−0.52 **1.000.39 **−0.06 **0.06 **
Pre−0.30 **−0.58 **0.39 **1.000.39 **0.25 **
Slope−0.16 **−0.31 **−0.06 **0.39 **1.000.11 **
PM−0.13 **−0.19 **0.06 **0.25 **0.11 **1.00
WSPIQIMDS-LSTWITempPreSlopePM
IQIMDS-LS1.000.25 **−0.35 **0.02−0.01−0.09 **
TWI0.25 **1.00−0.51 **0.26 **0.19 **0.02
Temp−0.35 **−0.51 **1.000.26 **−0.04−0.09 **
Pre0.020.26 **0.26 **1.000.35 **−0.16 **
Slope−0.010.19 **−0.040.35 **1.00−0.03
PM−0.09 **0.02−0.09 **−0.16 **−0.031.00
Note: * indicates a significant correlation (p < 0.05); ** indicates a highly significant correlation (p < 0.01).
Table 13. Statistical data of IQI in the EHM, CEH, and WSP parts of Jilin Province.
CountMinMaxMeanStandard Deviation
EHM3580.2550.842 0.6140.102
CEH23820.2630.872 0.5540.099
WSP13910.1850.6570.4150.077
Disclaimer/Publisher’s Note: The statements, opinions and data contained in all publications are solely those of the individual author(s) and contributor(s) and not of MDPI and/or the editor(s). MDPI and/or the editor(s) disclaim responsibility for any injury to people or property resulting from any ideas, methods, instructions or products referred to in the content.