Article

Impacts of Extreme Climate Events on Subtropical Upland Crops: A 20-Year Case Study in the Hilly Area of Southwest China


1
Institute of Mountain Hazards and Environment, Chinese Academy of Sciences, Chengdu 610299, China
2
University of Chinese Academy of Sciences, Beijing 100049, China
3
Department of Soil Sciences, University of Zanjan, Zanjan 45371, Iran
*
Authors to whom correspondence should be addressed.
Agronomy 2026, 16(5), 572; https://doi.org/10.3390/agronomy16050572
Submission received: 8 February 2026 / Revised: 2 March 2026 / Accepted: 3 March 2026 / Published: 5 March 2026

Abstract

Understanding how climate extremes affect crop growth in humid–subtropical hilly regions is essential for climate-smart agriculture, yet phenology-resolved evidence remains limited. We combined 20 ETCCDI extreme climate indices (1960–2024) with field records of wheat and maize production (2005–2024) from the hilly area of southwest China, and quantified climate–crop linkages using Mantel tests and generalized additive models; persistence and prospective tendencies were evaluated using Hurst (H) and Mann–Kendall statistics. Warming extremes intensified, with significant increases in TXx (0.22 °C decade−1), SU25 (2.48 days decade−1), and DTR (0.47 °C decade−1), while TNx and TNn declined and frost days increased; most precipitation intensity indices showed no significant trends except CDD, which increased by 1.73 days decade−1. Seasonally, warm extremes and CDD strengthened during the maize season, whereas climatic conditions during the wheat season were comparatively more favorable. Climate impacts on crop growth were stage-dependent, typically lagging by 1–2 months: wheat biomass was positively associated with TXx/TNx (strongest near heading), whereas maize production was more sensitive to temperature extremes (negative) and precipitation frequency indices; CDD significantly affected both crops. These findings suggest that compound heat–drought risks for maize could increase under the persistence and trend signals observed in the historical record, while modest warming may benefit wheat but cold extremes could remain a constraint for management.

1. Introduction

Under the context of anthropogenic warming, extreme weather events (such as droughts, heatwaves, and floods) have become more frequent and intense [1,2]. Although low-probability occurrences, extreme climates cause more potential damage and result in complex impacts on natural ecosystems and socioeconomic systems, because of unpredictability and high destructiveness [3,4]. Particularly under the threat of water resource sustainability, extreme weather events exacerbate the pressure on agricultural ecosystems, leading to sharp declines in crop yields [5,6]. Furthermore, the instability of monsoons has made agriculture in China highly vulnerable to extreme weather events [7,8]. For instance, the Yangtze River basin experienced the most severe drought during the 2022 rainy season since comprehensive meteorological records began in 1961 [9]. The prolonged high temperatures and droughts caused significant crop yield reductions and even total crop failure in some areas of southwestern China [10]. Currently, the assessment of extreme weather events is primarily conducted using extreme climate indices, among which the 27 indices proposed by the Expert Team on Climate Change Detection and Indices (ETCCDI) are widely applied in related studies [11,12,13]. According to the existing studies, extreme temperature events exhibit a global warming trend, while extreme precipitation events demonstrate significant regional variability and fluctuations, both of which influence regional vegetation growth [14,15,16].
Crop traits are strongly regulated by temperature and moisture conditions during the corresponding stages [17]. In rainfed systems, maize (C4) and wheat (C3) may exhibit different sensitivities to extreme climates due to distinct physiological thresholds and seasonal exposure [18,19,20,21]. However, current research primarily focuses on the impacts of average climate change or specific meteorological factors on crop growth and yields [21,22,23], while the effects of extreme weather events on crop growth remain insufficiently understood, particularly when considering crop phenology and potential lagged responses. Therefore, a clear analysis of the characteristics of extreme climate change and its specific impacts on crop growth is crucial to better understand crop vulnerability under increasing climate variability.
Evidence from mountainous regions indicates that the impacts of extreme climate indices on vegetation can be highly heterogeneous. For example, there were positive correlations between the NDVI and extreme warm temperature indices but negative correlations with extreme cold temperature indices in southwest China, with the frequency of extreme temperature indices being the dominant factor affecting the growth of vegetation [24]. On the contrary, compared with extreme temperatures, the interannual variation in extreme precipitation has a greater impact on vegetation growth in arid and semiarid mountainous areas because moisture is the main climatic factor that limits vegetation growth in this region [25]. In addition, results from typical mountainous areas showed spatial heterogeneity: the NDVI green trend was more obvious in the Yunnan–Guizhou Plateau than in the Hengduan Mountain and Sichuan basin, and was more sensitive to extreme climate change, especially extreme temperature [26]. Overall, these findings suggest that crop and vegetation responses to extremes can vary across regions, and region-specific evidence is required for agricultural risk assessment.
The hilly area in the Sichuan basin is located in Southwest China, covering an area of 160,000 km2. As the typical lithomorphic immature soil, shallow purple soils (mostly Entisols) sustain food production in this populous area, and maize (Zea mays) and wheat (Triticum aestivum) are the main crops [19,27]. Typically, the subtropical humid monsoon climate in this region results in uneven distribution of precipitation, causing not only severe soil erosion during the rainy season, but also the seasonal drought [28]. As a consequence of severe soil erosion, 73% of upland cropland in this region has shallow solum with thickness ranging from 20 to 60 cm, which might greatly inhibit moisture retention and limit the availability of plant-available water [27,29]. Additionally, the underlying bedrock restricts plant root growth and water infiltration, thereby limiting the ability of crops to exploit deeper-layer soil moisture. These properties imply limited “soil water storage” for crops, which can amplify sensitivity to short-term heat and drought stress [27,30]. Meanwhile, during intense rainfall events, rapid runoff and reduced effective infiltration into the root zone may weaken the buffering capacity of precipitation against water deficits. As different vegetation types respond differently to extreme climate events, there is still a lack of analysis of specific crop responses to extreme climate events in the hilly area of southwest China, which hampers a comprehensive understanding of extreme climate characteristics and their impacts on regional agriculture.
Above all, research on extreme climate events has mainly focused on arid and semi-arid areas [25,31], while the characteristics of extreme climate events and their impacts on crop production have rarely been documented in the hilly area of southwest China. This study was conducted at a long-term experimental station in the Sichuan basin (a typical northern subtropical monsoon zone), along with 20 years of measured plant traits (maize and wheat) data (2005–2024) and long-term meteorological data (1960–2024). We hypothesize that extreme indices have shifted over time, with contrasting magnitude and direction between the maize and wheat growing seasons, that maize and wheat show contrasting trait sensitivities to extremes, and crop traits exhibit lagged responses consistent with limited buffering in shallow purple soils. The main objectives were to (1) characterize long-term changes and seasonal patterns of climate extremes using multiple indices; and (2) examine how climate extremes relate to maize and wheat traits (especially yield) and determine the key controlling extreme factors. The findings aim to develop possible regulatory measures and water management strategies to mitigate production risks under future climate variability and contribute to climate-resilient agricultural development and policymaking for upland crops in similar areas.

2. Materials and Methods

2.1. Research Sites and Datasets

The research site in this study is located at the Yanting Agro-Ecological Station of Purple Soil, Chinese Academy of Sciences (YTA station), which is in the north–central Sichuan basin in southwest of China, at an altitude of 400–600 m above sea level (105°27′ E, 31°16′ N). The region belongs to a moderate subtropical monsoon climate and the average temperature is 17.3 °C. The annual precipitation is 800–1200 mm and the distribution of rainfall is very uneven: approximately 70% of the annual precipitation occurs in summer and autumn. Seasonal drought is frequent, mainly in spring and early summer. The soil is calcareous purple soil (Entisols; clay loam) with a shallow profile (40–60 cm), resulting in low water holding capacity and strong dependence of rainfed crops on precipitation inputs [19,30]. Detailed geological and soil profile descriptions are provided in Text S1.
Daily weather data for this study from 1960 to 2024 were obtained from the China Meteorological Data Sharing Service System (http://data.cma.cn//) (accessed on 25 March 2025) and Scientific data platform of Sichuan Yanting Farmland Ecosystem National Field Scientific observation and Research Station (http://yga.cern.ac.cn) (accessed on 25 March 2025), including maximum temperatures, minimum temperatures and precipitation. Maize and wheat field experiment data from 2005 to 2024 were collected from the 3 long-term fixed observation fields at the Yanting Agro-Ecological Station of Purple Soil, Chinese Academy of Sciences. The same fertilization management in accordance with local standards was applied, and the same seeding and plowing were also carried out. A regular cropping system of wheat (Triticumaestivum L.) and maize (Zea mays L.) rotation on sloping croplands has lasted for more than 50 years. The investigated plant trait variables included aboveground biomass, height during the growing periods, grain yield, and hundred-kernel weight and thousand-kernel weight of the maize and wheat after harvesting. All the plant trait variables were measured by the standard methods of the Chinese Ecosystem Research Network (CERN), which is governed by the Chinese Academy of Sciences.

2.2. Methods

2.2.1. Selection and Treatment of Extreme Climate Indices

Among the extreme climate indices (http://etccdi.pacificclimate.org/list_27_indices.shtml) (accessed on 10 May 2025) recommended by the Expert Team on Climate Change Detection and Indices (ETCCDI), we selected 20 ETCCDI indices to capture the major dimensions of climate extremes relevant to rainfed crop production (warm/cold temperature extremes and precipitation extremes). Indices with highly overlapping definitions, or those not representative under the local temperature regime, were not included to reduce redundancy and improve interpretability. The indices include 9 extreme temperature indices and 11 extreme precipitation indices (Table 1). These indices were divided into four categories: extreme temperature warm indices, extreme temperature cold indices, extreme precipitation frequency indices and extreme precipitation intensity indices. Extreme climate indices were calculated at three temporal scales, interannual, growing season (the growing season of maize extends from June to September, while that of wheat spans from November to the following April), and monthly, to analyze the correlation with crop growth.
RClimDex v1.1 (available on the ETCCDI website, https://etccdi.pacificclimate.org/software.shtml, accessed on 26 March 2025) was used for data quality control and extreme climate indices calculation on annual and monthly scales in this study, while indices for different growing seasons were calculated using MATLAB (R2024a).

2.2.2. Linear Trend Analysis

To investigate the trends of extreme climate events in the hilly area of central Sichuan, trend analysis (with time as an independent variable) was used to show the interannual variation rates of the extreme climate indices.
S L O P E = n × i = 1 n ( i × T i ) i = 1 n i i 1 n T i n i = 1 n i 2 ( i = 1 n i ) 2
where Slope is the slope of the linear regression equation; n represents the number of years of cumulative monitoring; i represents the i th year (1 ≤ i ≤ n); and Ti represents the variable T in the i th year.

2.2.3. Pearson Correlation and Lag Analysis

Pearson correlation analysis was used to investigate the linear association between crop traits (aboveground biomass and plant height) and extreme climate indices for each growth stage.
Crop growth and trait formation may respond to changes in thermal and moisture conditions with a time lag, and the short-term irregularity of extreme weather events can obscure relationships when only contemporaneous conditions are considered. Therefore, examining lagged correlations within the growing months can better capture sensitivity windows to climate extremes. Following previous studies that assessed vegetation responses using contemporaneous and preceding three-month extreme climate information during the growing season [32], we predefined a 1–3-month lag window to represent short-term antecedent effects that are agronomically plausible and consistent with the limited buffering capacity in rainfed systems with shallow soil. Moreover, this choice is consistent with crop growth cycles and physiological characteristics, whereby key trait formation is sensitive to short-term antecedent hydrothermal conditions during specific phenological stages [25,27].
For each growth stage, lagged correlations were calculated by correlating the current-month aboveground biomass and plant height with extreme indices at lag 0–3 months (lag 0 = concurrent month; lag 1–3 = 1–3 months prior). The lag length for a given trait–index pair was defined as the lag within the predefined 1–3-month window that yielded the maximum absolute correlation coefficient (|r|).
To assess whether the observed lag effects were consistent across years rather than driven by a few extreme seasons, we conducted a leave-one-year-out (LOYO) sensitivity analysis by repeating the lag selection after excluding one year at a time and summarizing the stability of the selected lag (Table S1). In addition, the uncertainty of selected lag correlations was quantified using bootstrap resampling to obtain 95% confidence intervals (Table S1).

2.2.4. Mantel Test

The Mantel test is a widely used method in ecology for testing the linear correlation between two matrices. In this study, we applied the Mantel test as an exploratory multivariate complement to Pearson correlation to summarize the overall linkage between crop traits (grain yield, aboveground biomass, height, and hundred-kernel weight and thousand-kernel weight of maize and wheat) and sets of extreme climate indices under a multi-trait and multi-index setting. We applied it because this study involves multiple crop traits and multiple extreme indices that can be inter-correlated, for which numerous separate regressions may yield fragmented inference under multicollinearity.
For each crop, we constructed (i) a crop–trait matrix (years × traits; grain yield, aboveground biomass, plant height, and hundred-kernel weight and thousand-kernel weight) and (ii) an extreme index matrix (years × indices) for the corresponding crop growing season. To remove scale effects, all variables were standardized (z-scores) prior to distance calculation. Euclidean distance matrices were then computed for traits and indices, and Mantel correlation (Mantel r) between the two distance matrices was tested using 9999 permutations. All Mantel analyses were conducted in “R 4.2.3” using the mantel function in the vegan package, and correlation plots were produced using the “ggcor” package.

2.2.5. Generalized Additive Model Analysis

To evaluate the relative importance of extreme climate indices on crop production, a generalized additive model (GAM) was further applied. The GAM allows for flexible nonlinear relationships while incorporating penalization to constrain model complexity. Smooth terms were estimated using penalized regression splines, with smoothing parameters selected automatically during model fitting. To reduce overfitting given the relatively short (20-year) record, we constrained model flexibility by limiting the basis dimension (k) for each smooth term (e.g., k = 3–4) and using penalized smoothing in the GAM framework. Candidate models were compared using AIC-based multi-model inference, which favors parsimonious formulations and discourages unnecessary complexity. Model diagnostics were performed in R using “gam.check” and “concurvity” (Table S2). Across the top-performing candidate models, the deviance explained ranged from 19.2% to 58.9% (Table S2), indicating moderate explanatory power without overly flexible fits. “Concurvity” was assessed where applicable; when the selected best model retained a single smooth term, “concurvity” was not applicable. The relative importance of each extreme climate index was assessed using the sum of Akaike weights across candidate models, providing a relative measure of variable importance [33]. All analyses were performed in R software, version 4.2.3.

2.2.6. Hurst Exponent

The Hurst exponent (H) was used to assess the persistence of climate indices over long periods [34,35]. It can be calculated by least squares, taking the logarithm of both sides of the equation, and converting H into a coefficient in linear regression [36]. When H = 0.5, the sequence is considered to have no autocorrelation; when H > 0.5, the sequence has a strong positive correlation and high persistence; and when H < 0.5, the sequence has a strong negative correlation and low persistence. The exponent was calculated using MATLAB (R2024a). We noted that H > 0.5 indicates persistence under the statistical properties of the observed record, but it does not imply deterministic continuation of trends under changing boundary conditions.

2.2.7. Interaction Analysis

To explicitly test whether the combined impacts of heat extremes and moisture conditions on maize are non-additive, we conducted a simple interaction analysis using linear models (ANCOVA framework). This analysis complements the correlation results by evaluating whether the effect of a temperature extreme index depends on concurrent moisture conditions, which is a key feature of compound heat–drought hazards. Specifically, for each maize trait (yield, aboveground biomass, hundred-kernel weight and plant height), we fitted models of the following form:
Trait = β0 + βT·T + βP·P + βT × P·(T × P) + ε,
where Trait is the response variable; β0 is the intercept; βT and βP are the main-effect coefficients for the extreme temperature indices (T) and precipitation indices (P), respectively; βT × P quantifies the interaction effect; and ε is the random error term. We selected TXx and TNx as representative heat extreme indicators and used CDD and PRCPTOT to represent dry-spell severity and overall precipitation availability during the maize growing season. Predictors were standardized (z-scores) prior to fitting to improve comparability and numerical stability. Statistical significance of coefficients, including the interaction term βT × P, was assessed using HC3 robust standard errors, and model performance was summarized using adjusted R2.

3. Results

3.1. Temporal Variations in Extreme Climate Indices

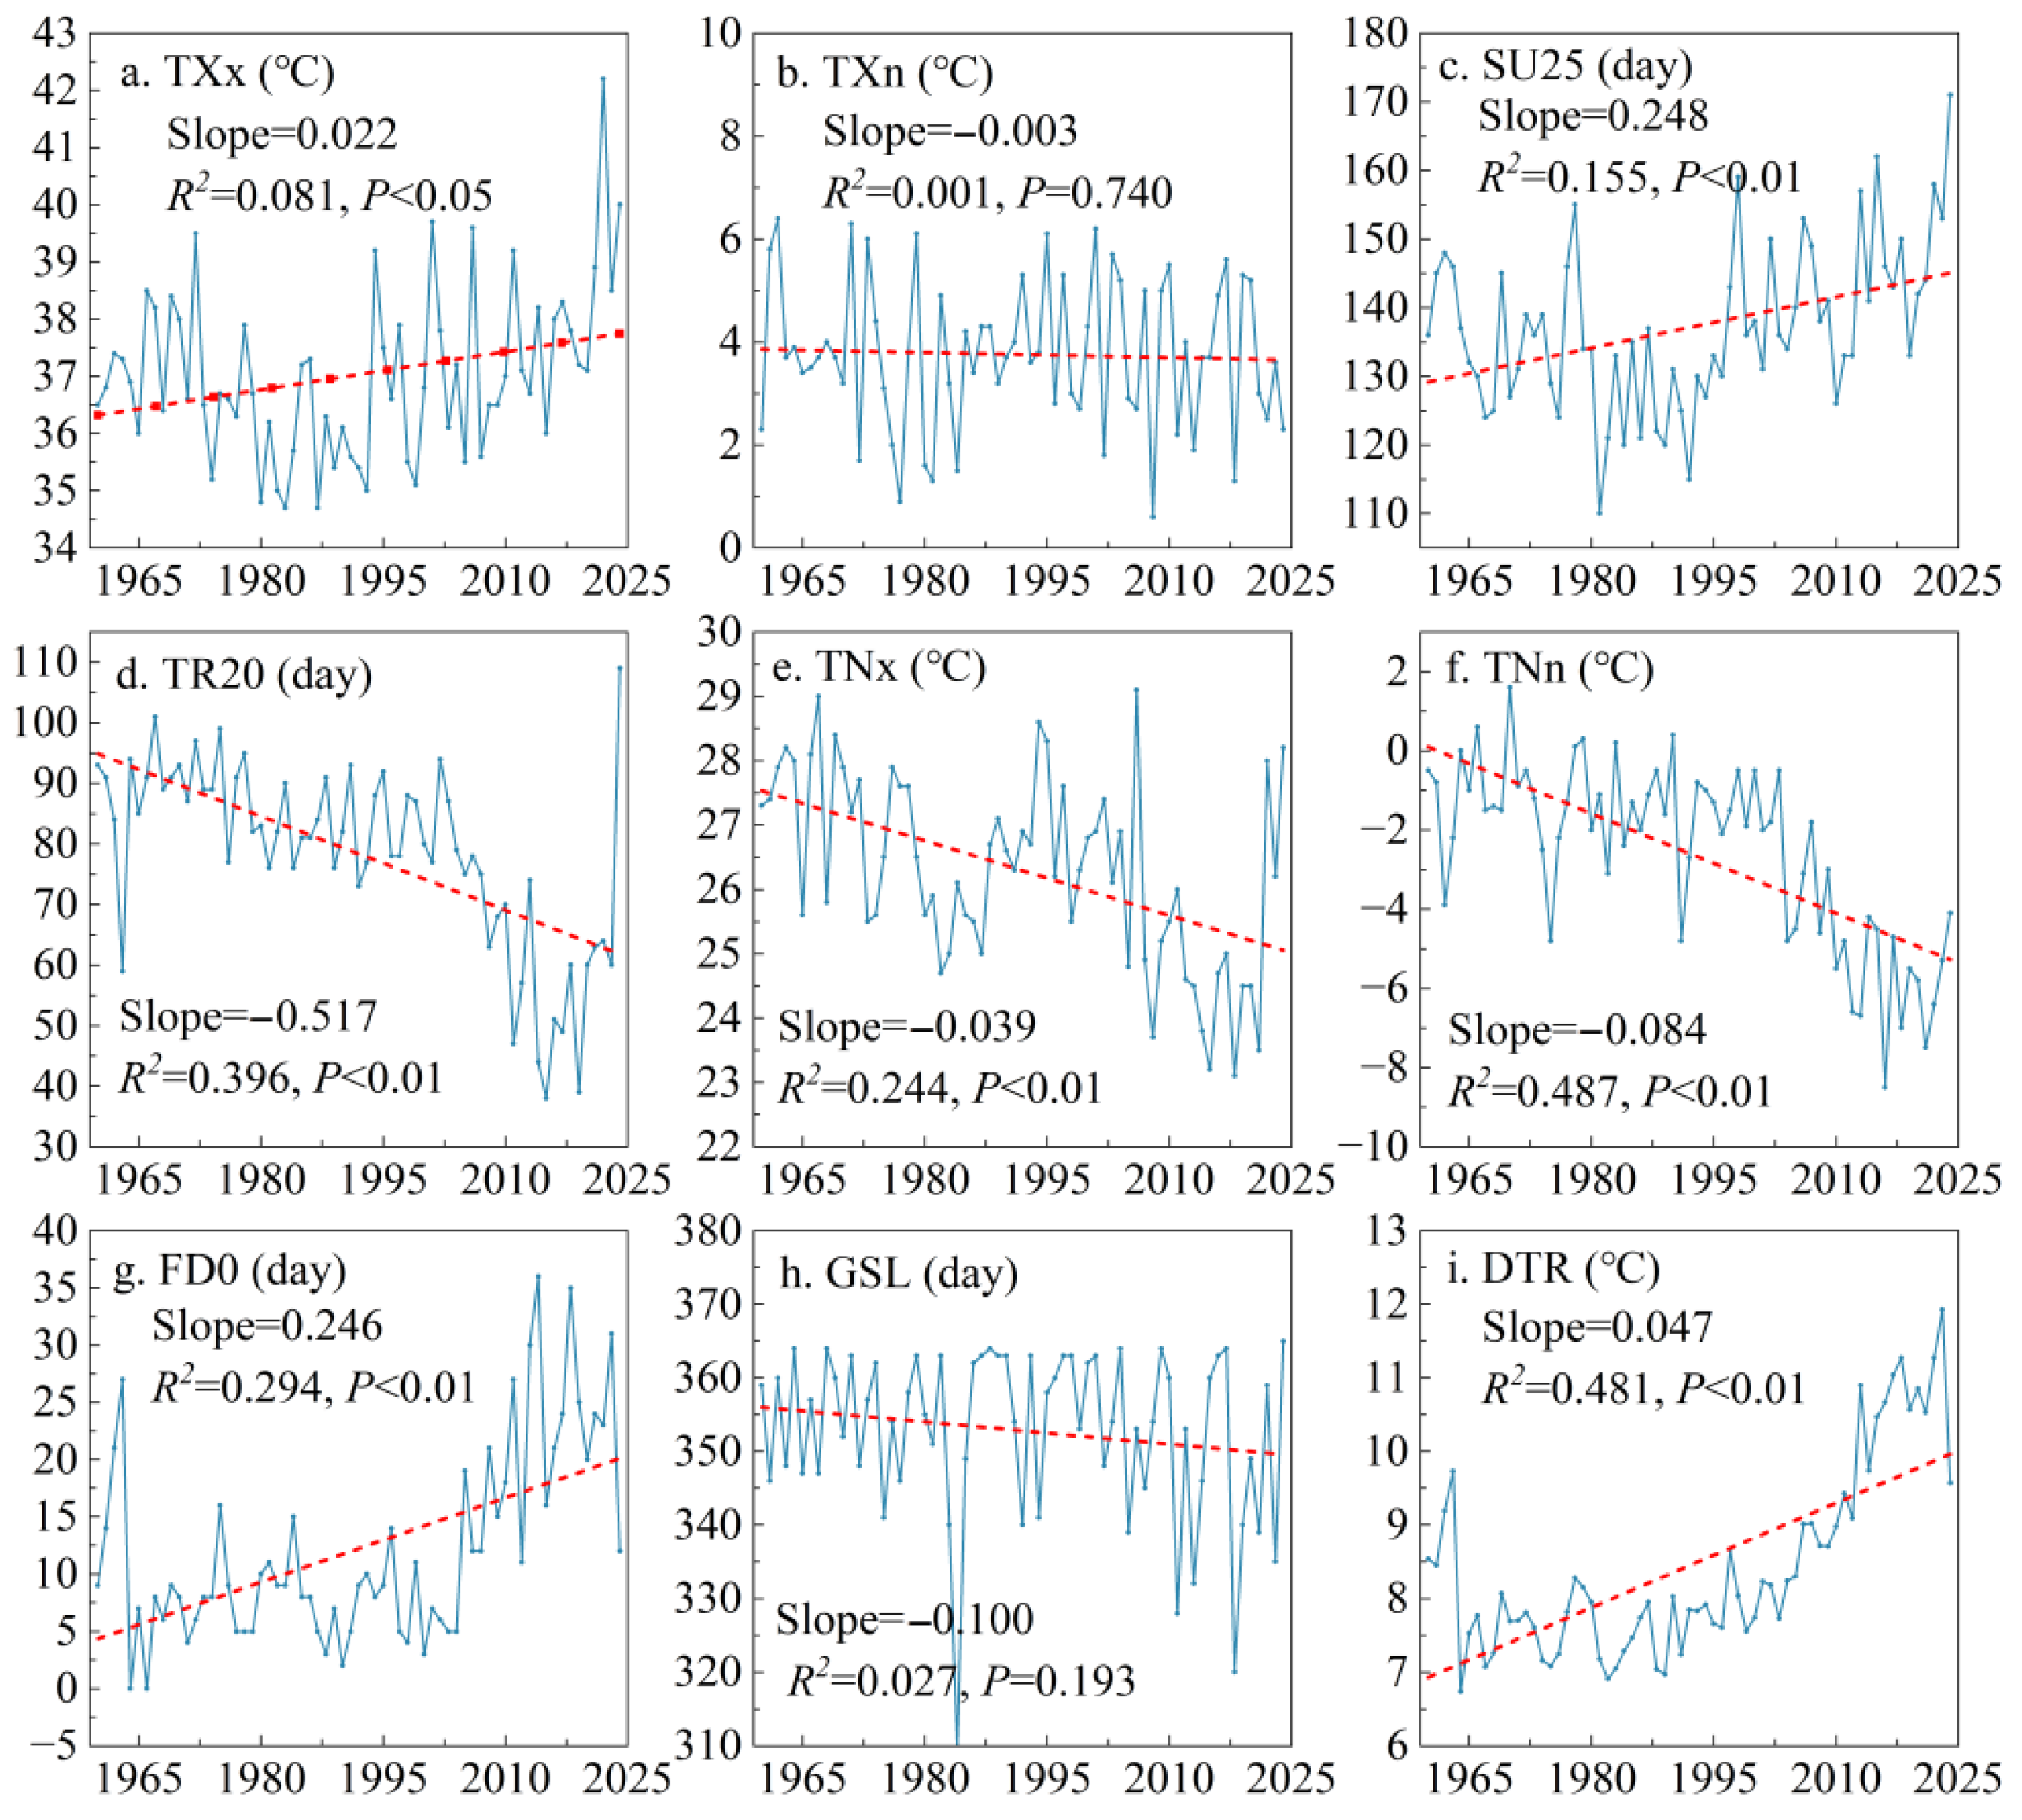
The increase in extreme temperatures in the hilly area of southwest China was significant, but not the case for extreme precipitation (Figure 1 and Figure 2). The hilly area of central Sichuan experienced a significant warming trend at the annual scale during 1960–2024 (Figure 1). The maximum value of daily maximum temperature (TXx) increased significantly (p < 0.05). Except for the number of tropical nights (TR20), the other extreme warm temperature indices all exhibited increasing trends (Figure 1). Among them, the number of summer days (SU25) showed a highly significant upward trend (p < 0.01).
In contrast, all extreme cold temperature indices (TNx and TNn) showed decreasing trends, except for the number of frost days (FD0), which exhibited a highly significant upward trend (p < 0.01), all indicating significant cooling trend. The maximum and minimum values of daily minimum temperature (TNx and TNn) decreased significantly (p < 0.01), with TNn showing a faster decline than TNx. The diurnal temperature range (DTR) presented a highly significant increasing trend (p < 0.01), indicating a possible unstable weather condition, whereas the growing season length (GSL) showed an insignificant decreasing trend (p > 0.05).
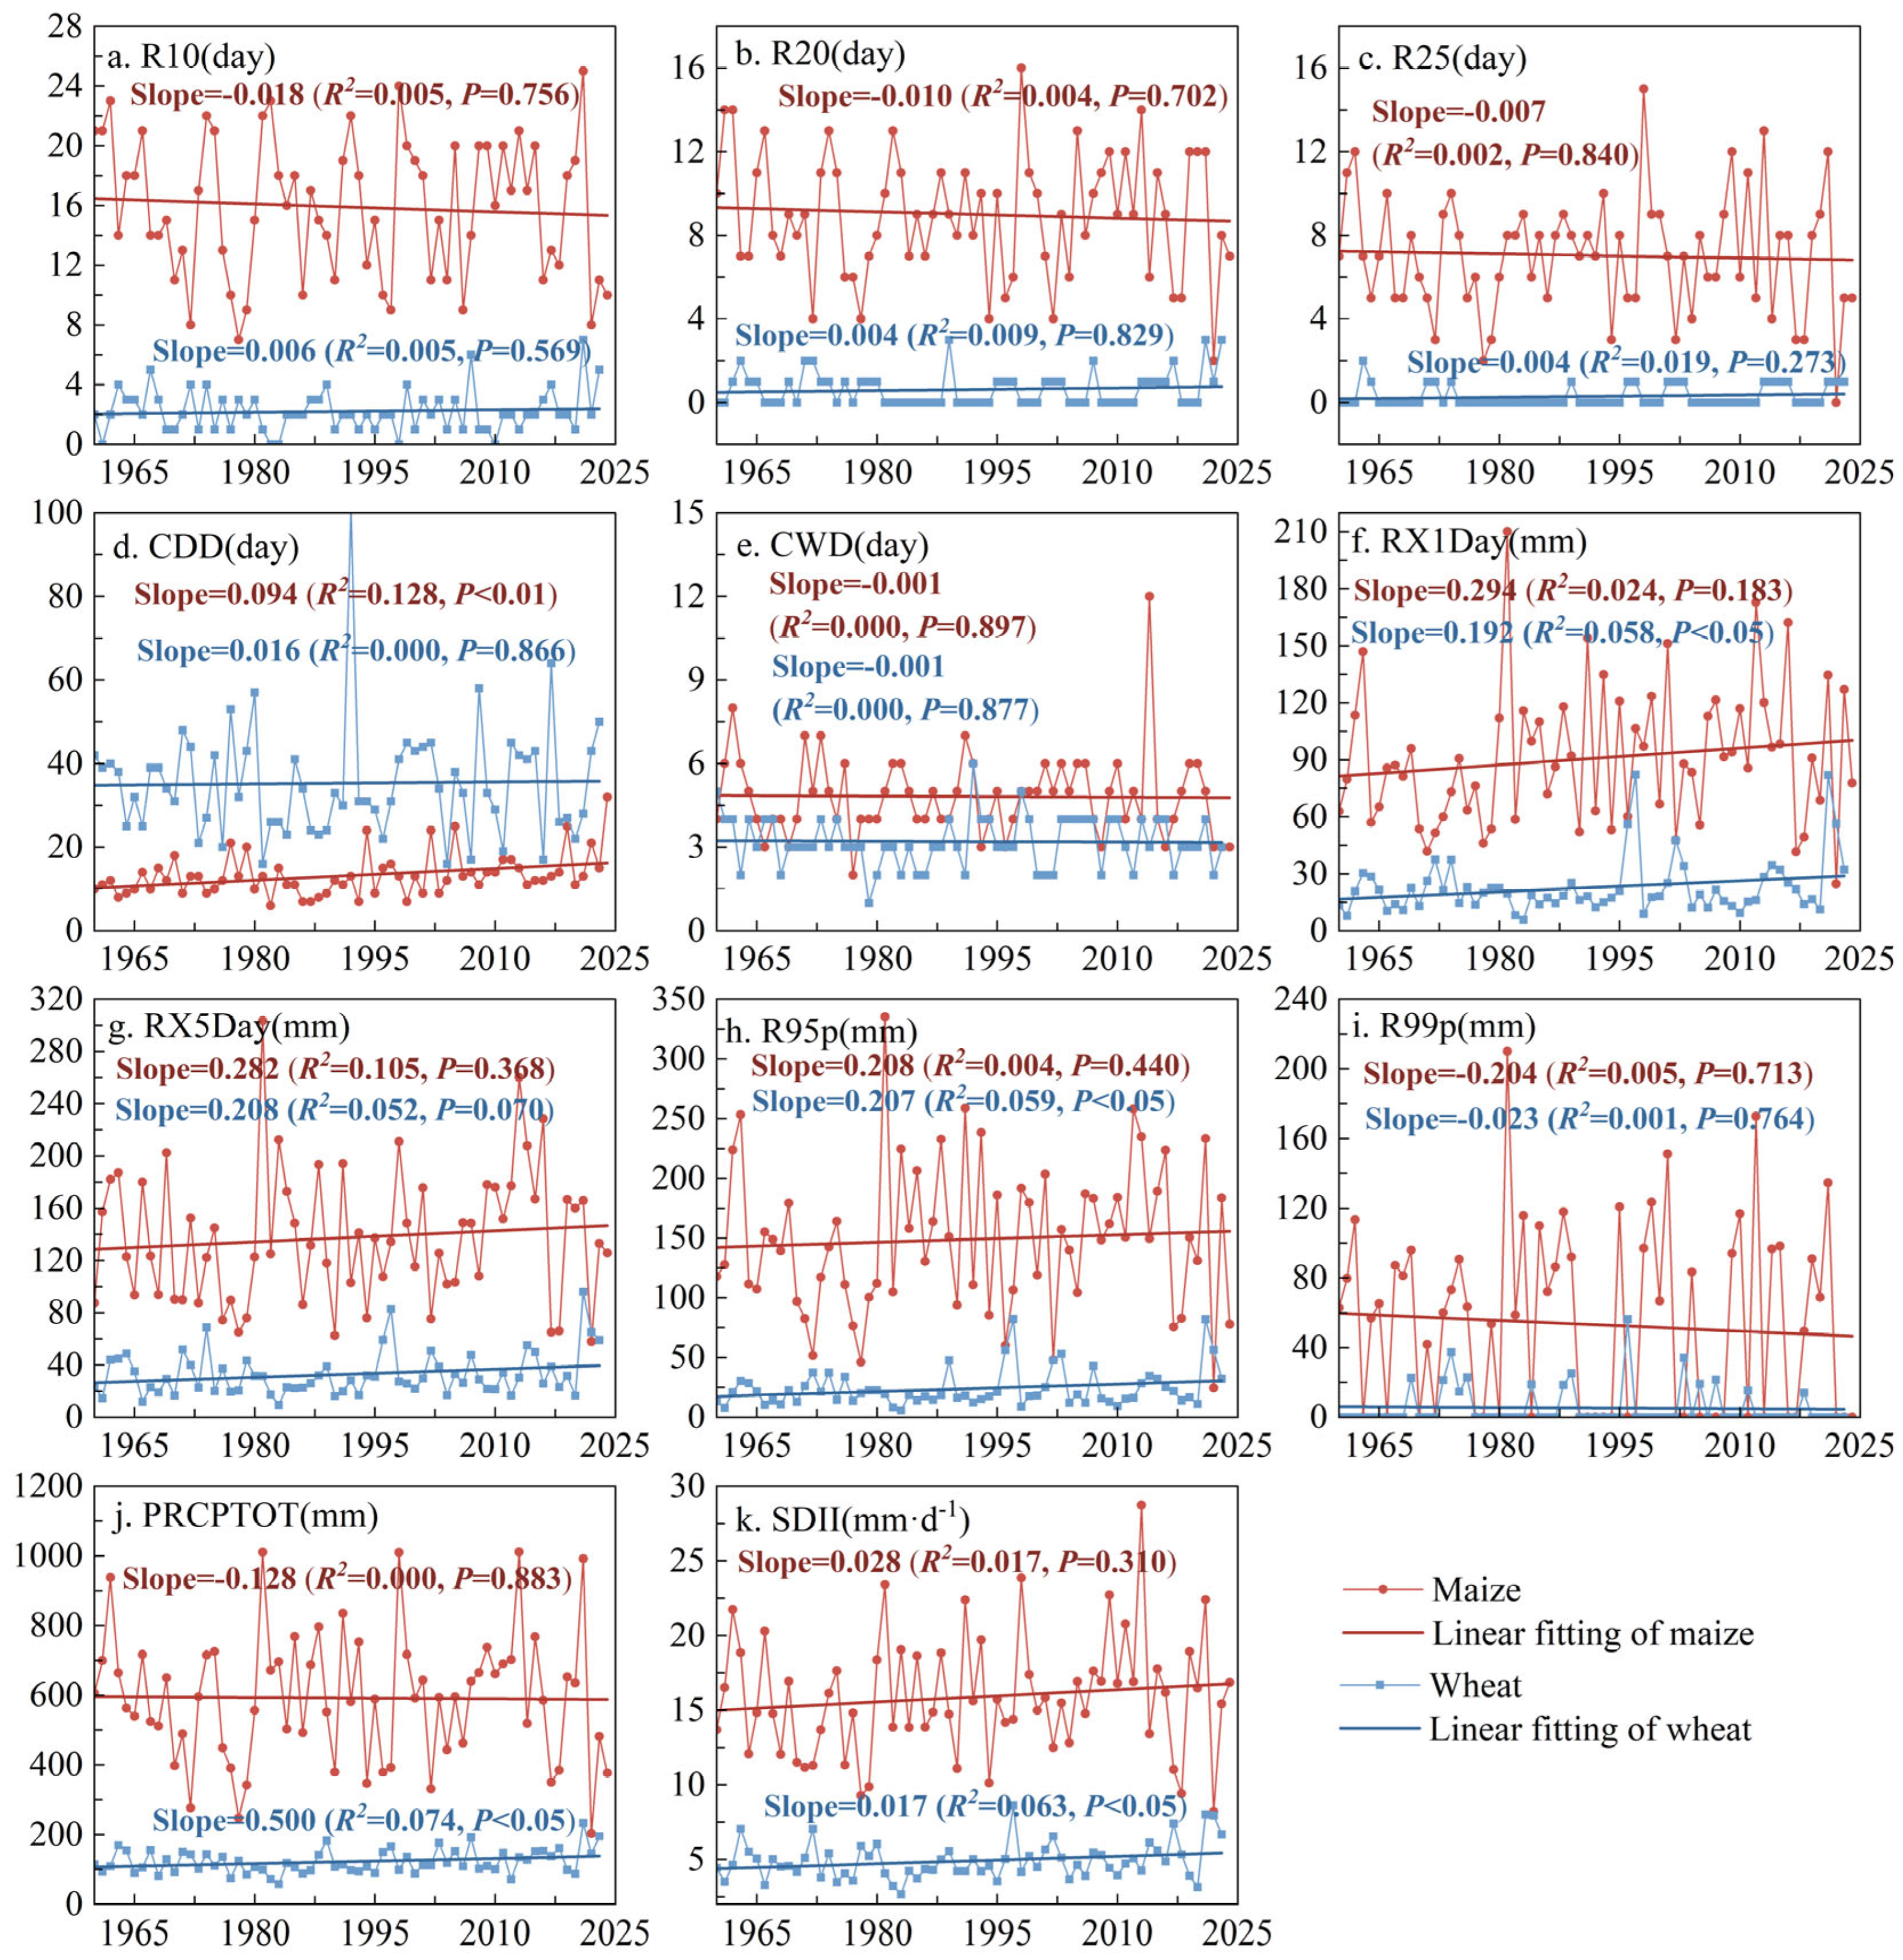
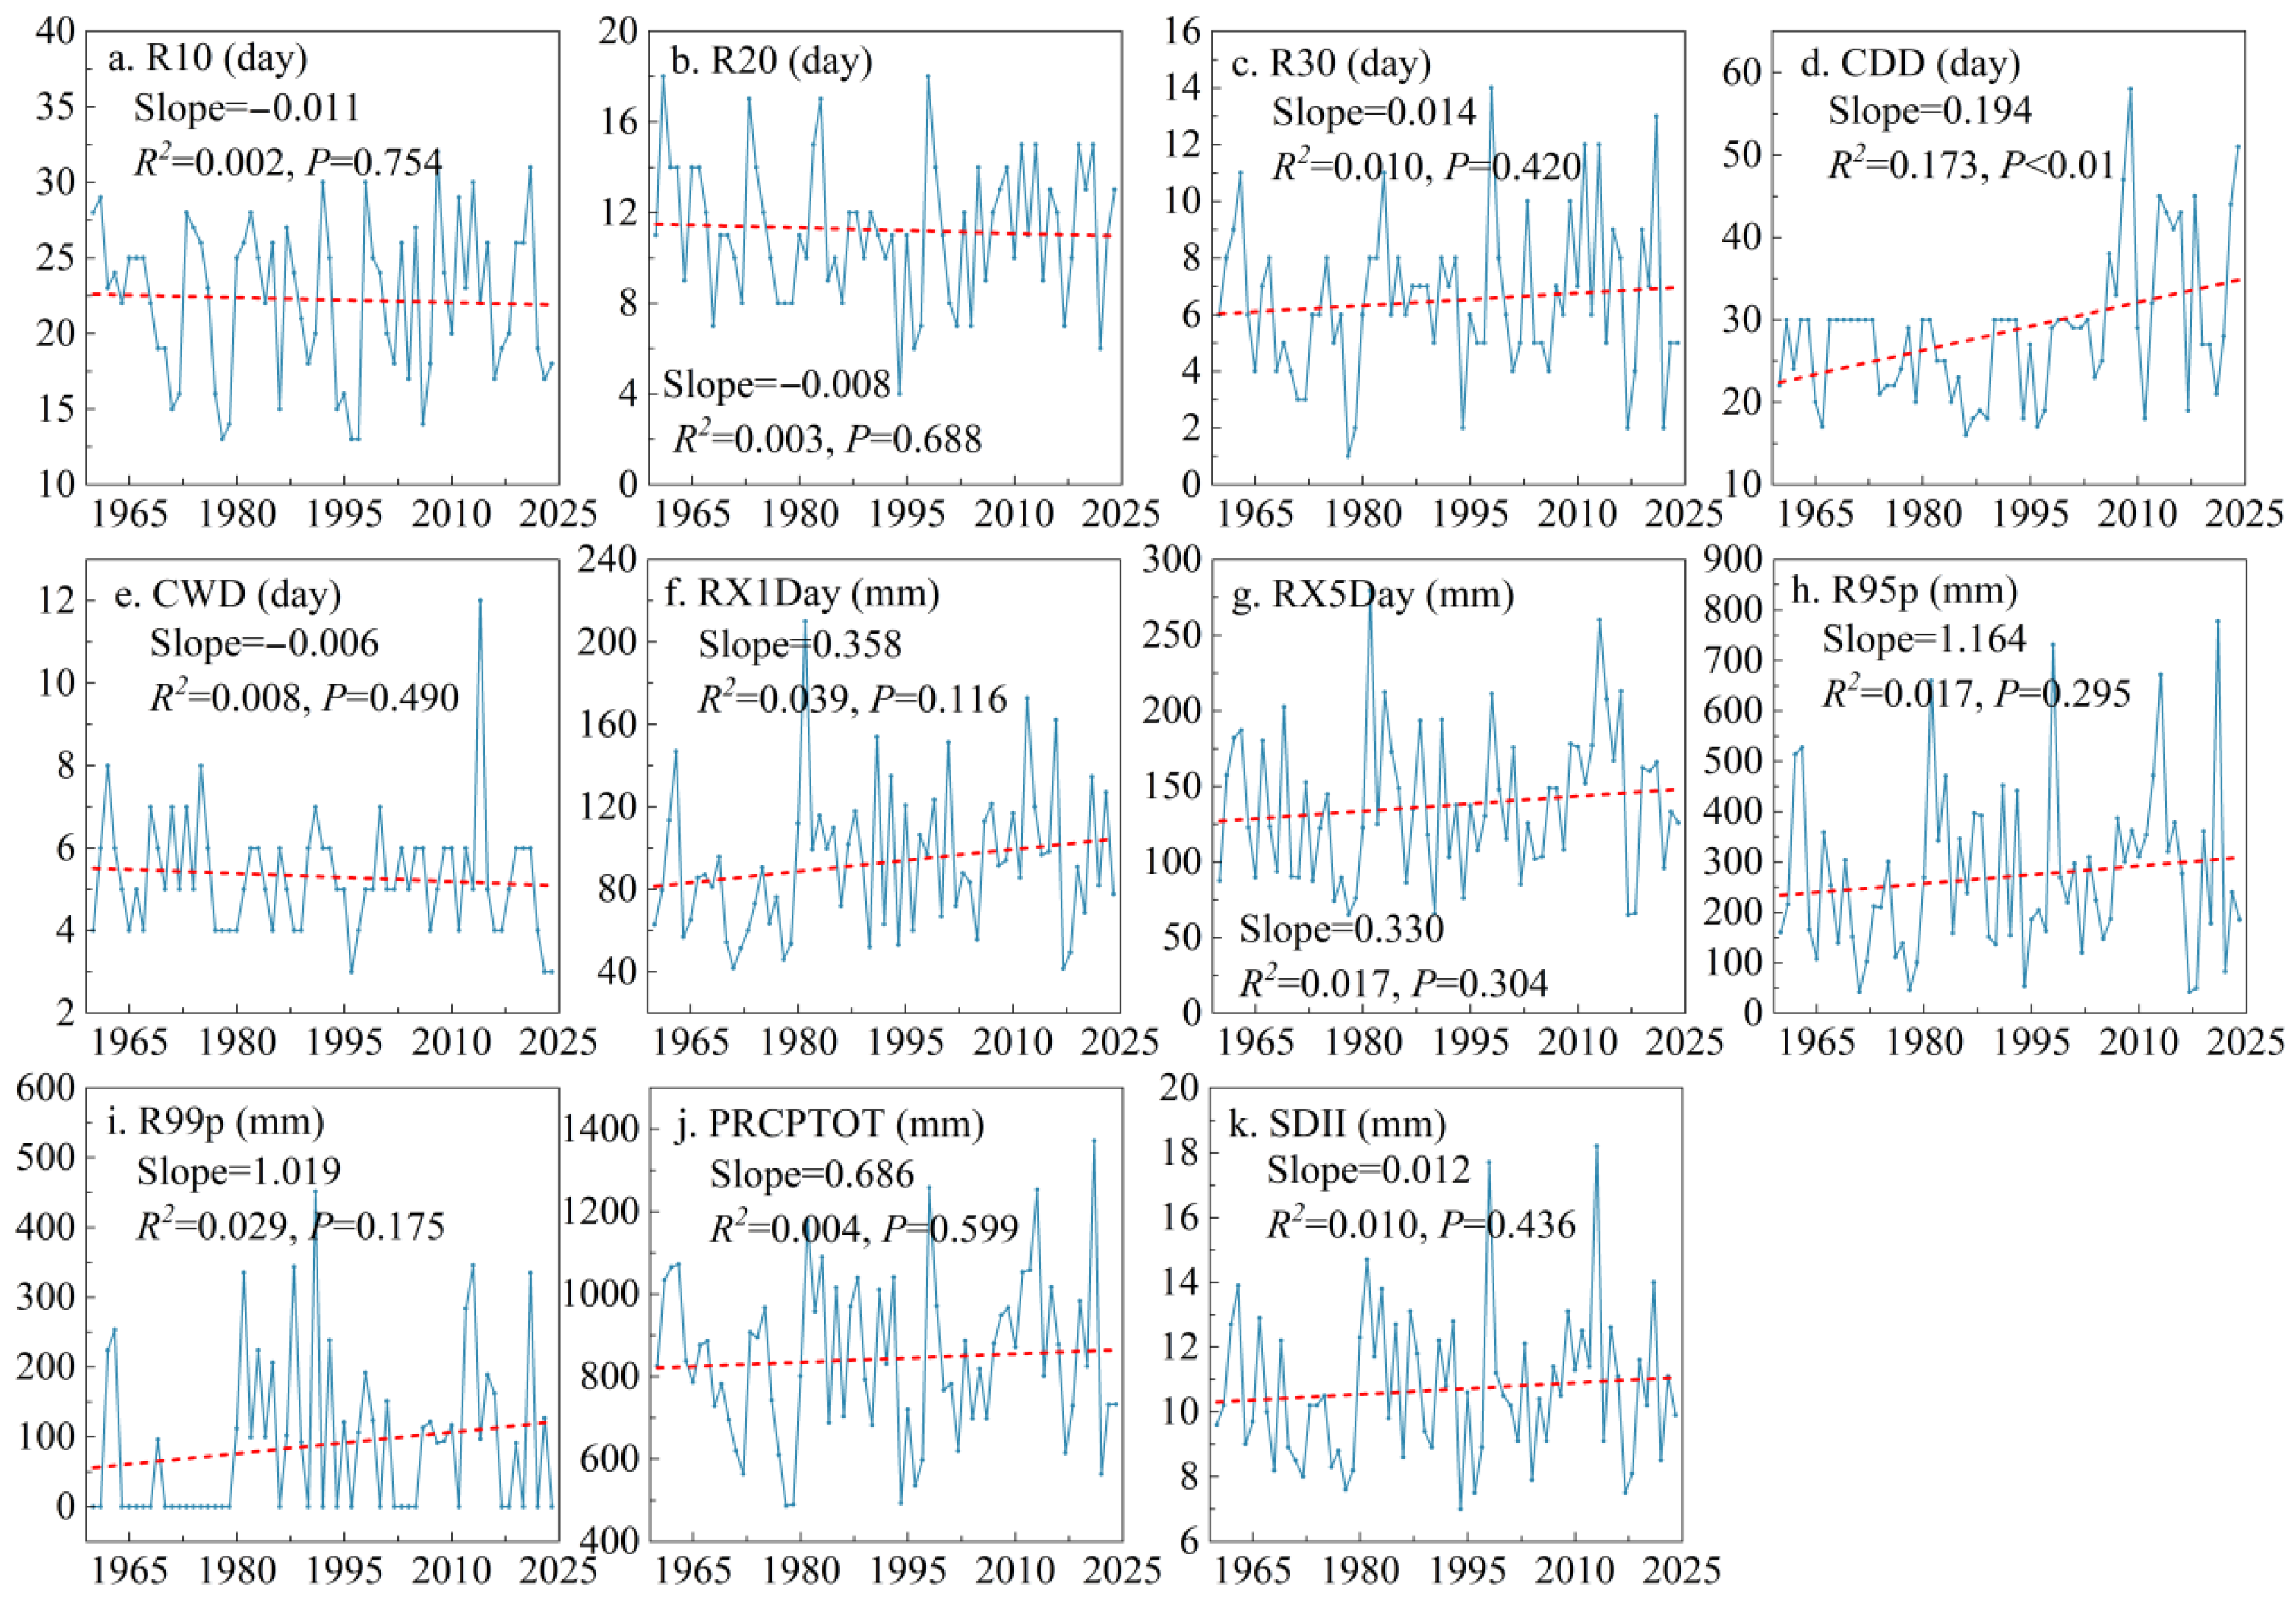
Interannual variation in the extreme precipitation indices generally showed insignificant trends in the hilly area of southwest China during 1960–2024 (Figure 2). Only the consecutive dry days (CDD) exhibited a highly significant upward trend (p < 0.01). The variation trends of precipitation frequency indices, including the number of precipitation days (R10), the number of heavy precipitation days (R20), the number of very heavy precipitation days (R25), and the consecutive wet days (CWD), were relatively small and insignificant (p > 0.05). All extreme precipitation intensity indices exhibited insignificant increasing trends (Figure 2, p > 0.05). The magnitude of increase for the maximum 5-day precipitation (RX5day) index was 3.58 mm per decade, slightly higher than that of the maximum 1-day precipitation index (RX1day). Similarly, the increase in the very wet days (R95p, 11.64 mm per decade) was greater than that for extremely wet days (R99p). The annual total precipitation (PRCPTOT) and the simple daily intensity index (SDII) showed interannual increasing trends of 6.86 mm per decade and 0.12 mm·day−1 per decade, respectively.
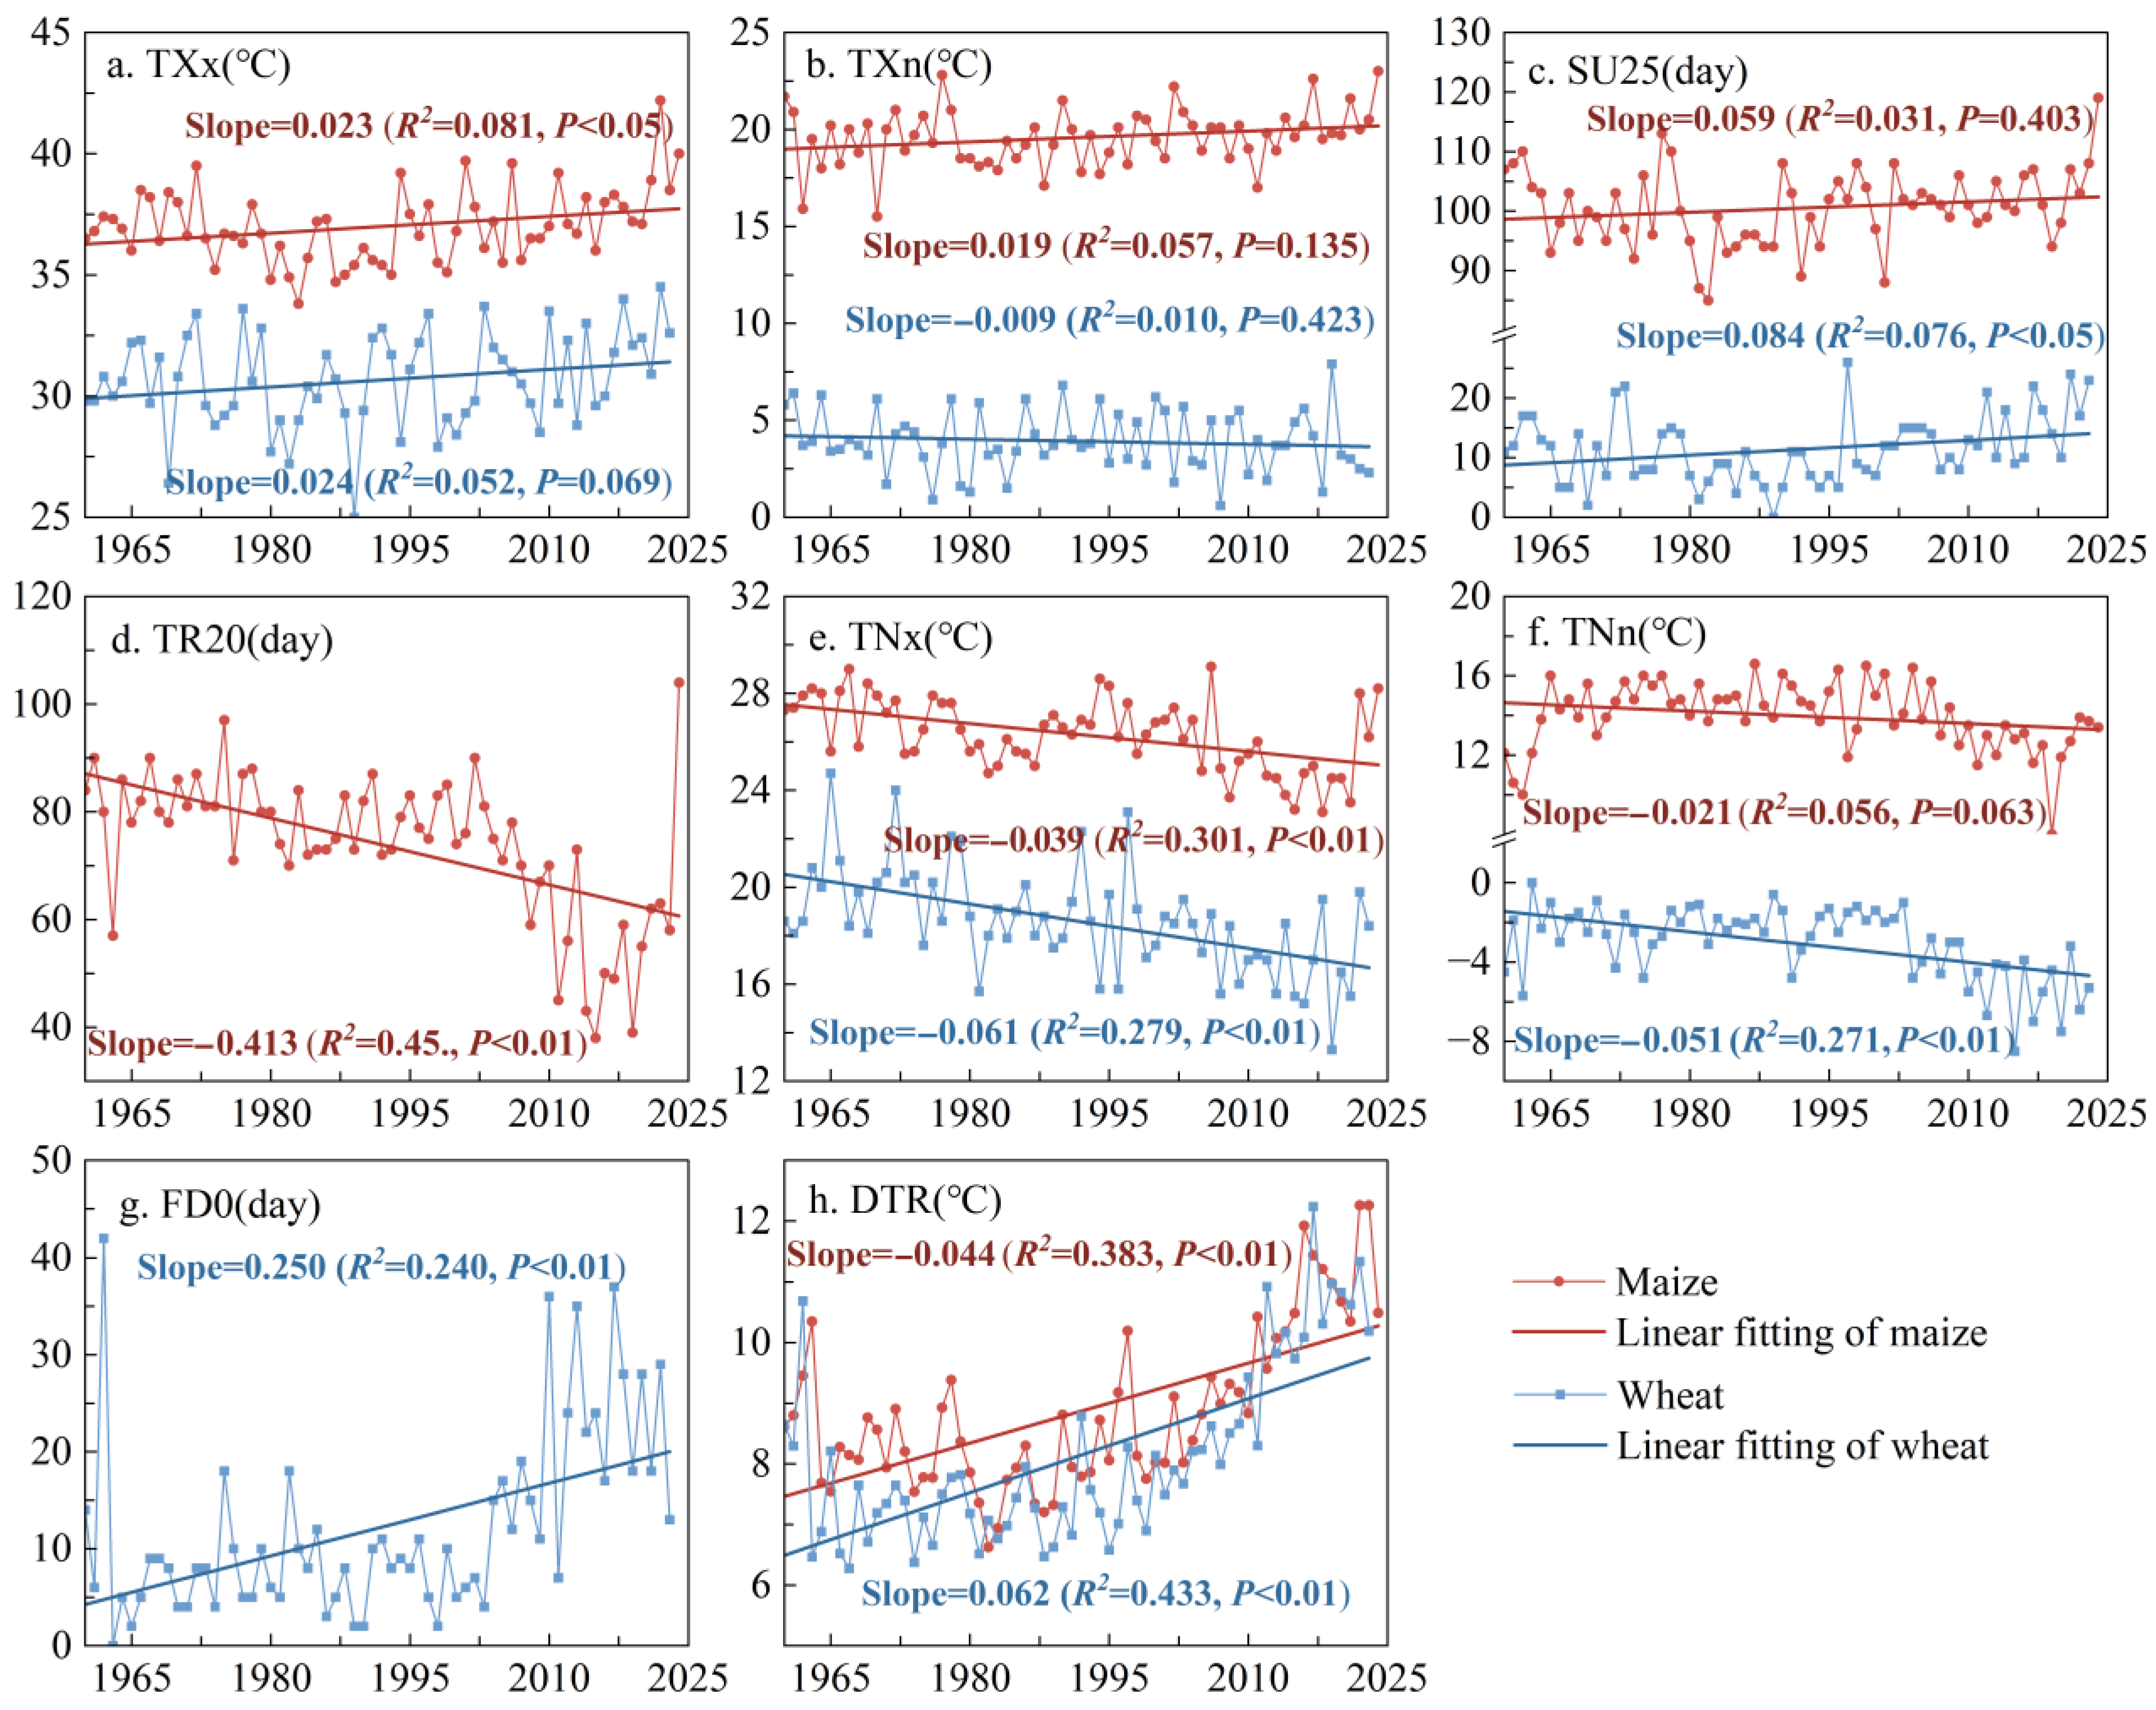
Extreme climate indices were calculated for different growing seasons (Figure 3 and Figure 4), and the results indicated that the extreme warm temperature indices TXx and TXn showed significant increasing trends (p < 0.05) during the maize growing season. However, these trends were not significant during the wheat growing season. In contrast, the extreme temperature cold indices TNx and TNn exhibited highly significant decreasing trends (p < 0.01) during the wheat season. Additionally, the number of summer days (SU25) showed a highly significant increasing trend during the wheat season (p < 0.05). In accordance, the diurnal temperature range (DTR) increased significantly (p < 0.01) during the maize season and the wheat season. These results showed more intensive fluctuations in temperature. The consecutive dry (rainless) days (CDD) showed a highly significant increasing trend during the maize growing season (p < 0.01), whereas the variation during the wheat season was not significant (p > 0.05). Except for CDD, all other precipitation intensity indices showed nonsignificant trends (p > 0.05) across both growing seasons. However, the increasing magnitudes of precipitation frequency indices were generally higher during the wheat season than the maize season. Specifically, RX1day, R95p, PRCPTOT, and SDII exhibited significant increasing trends (p < 0.05) during the wheat season. No significant trends were observed for these indices during the maize growing season (p > 0.05).
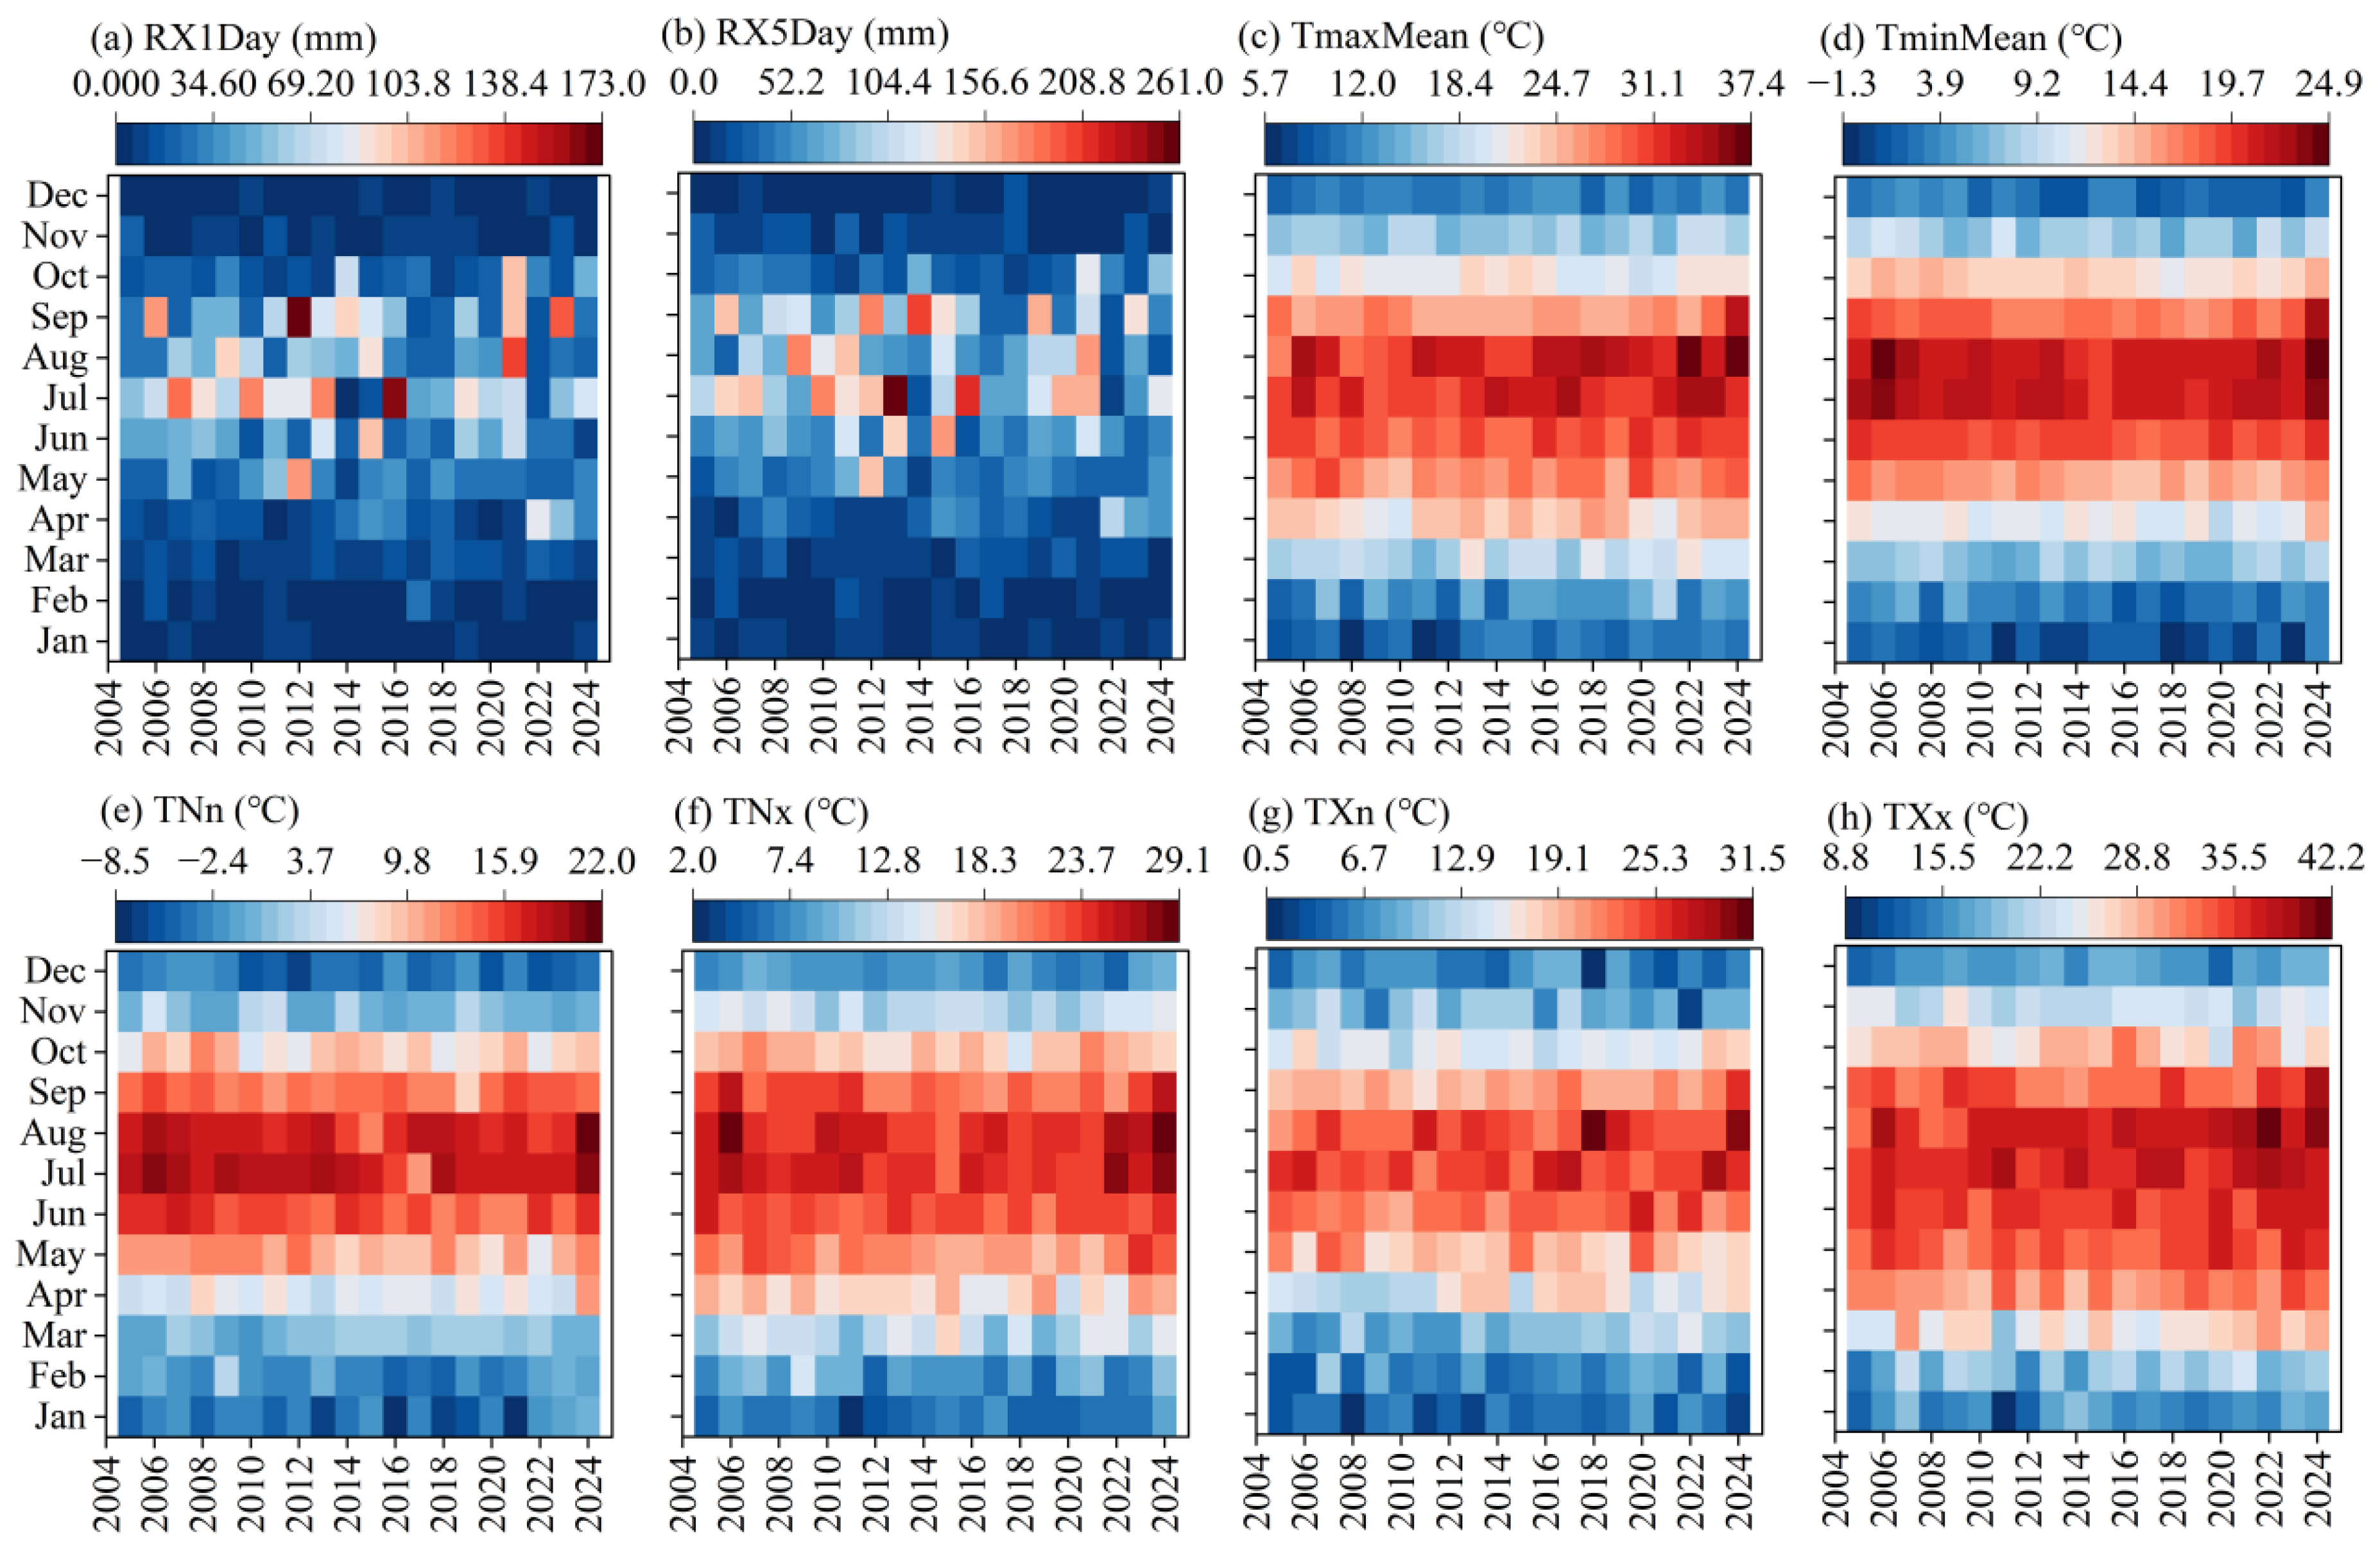
To examine the effects of extreme climate indices during different phenological stages on wheat and maize traits, eight extreme climate indices suitable for monthly scale analysis were selected (Figure 5). The results indicated that the extreme precipitation frequency indices (RX1day and RX5day), average of the daily maximum temperature (TmaxMean), average of the daily minimum temperature (TminMean), and the extreme temperature indices (TNn, TNx, TXn, and TXx) all exhibited a consistent monthly variation pattern characterized by a trend of increasing initially and then decreasing over the years. The peak values for these indices typically occurred between June and September (most probably in August), corresponding to the maize growing season.

3.2. Annual Characteristics of Crop Traits

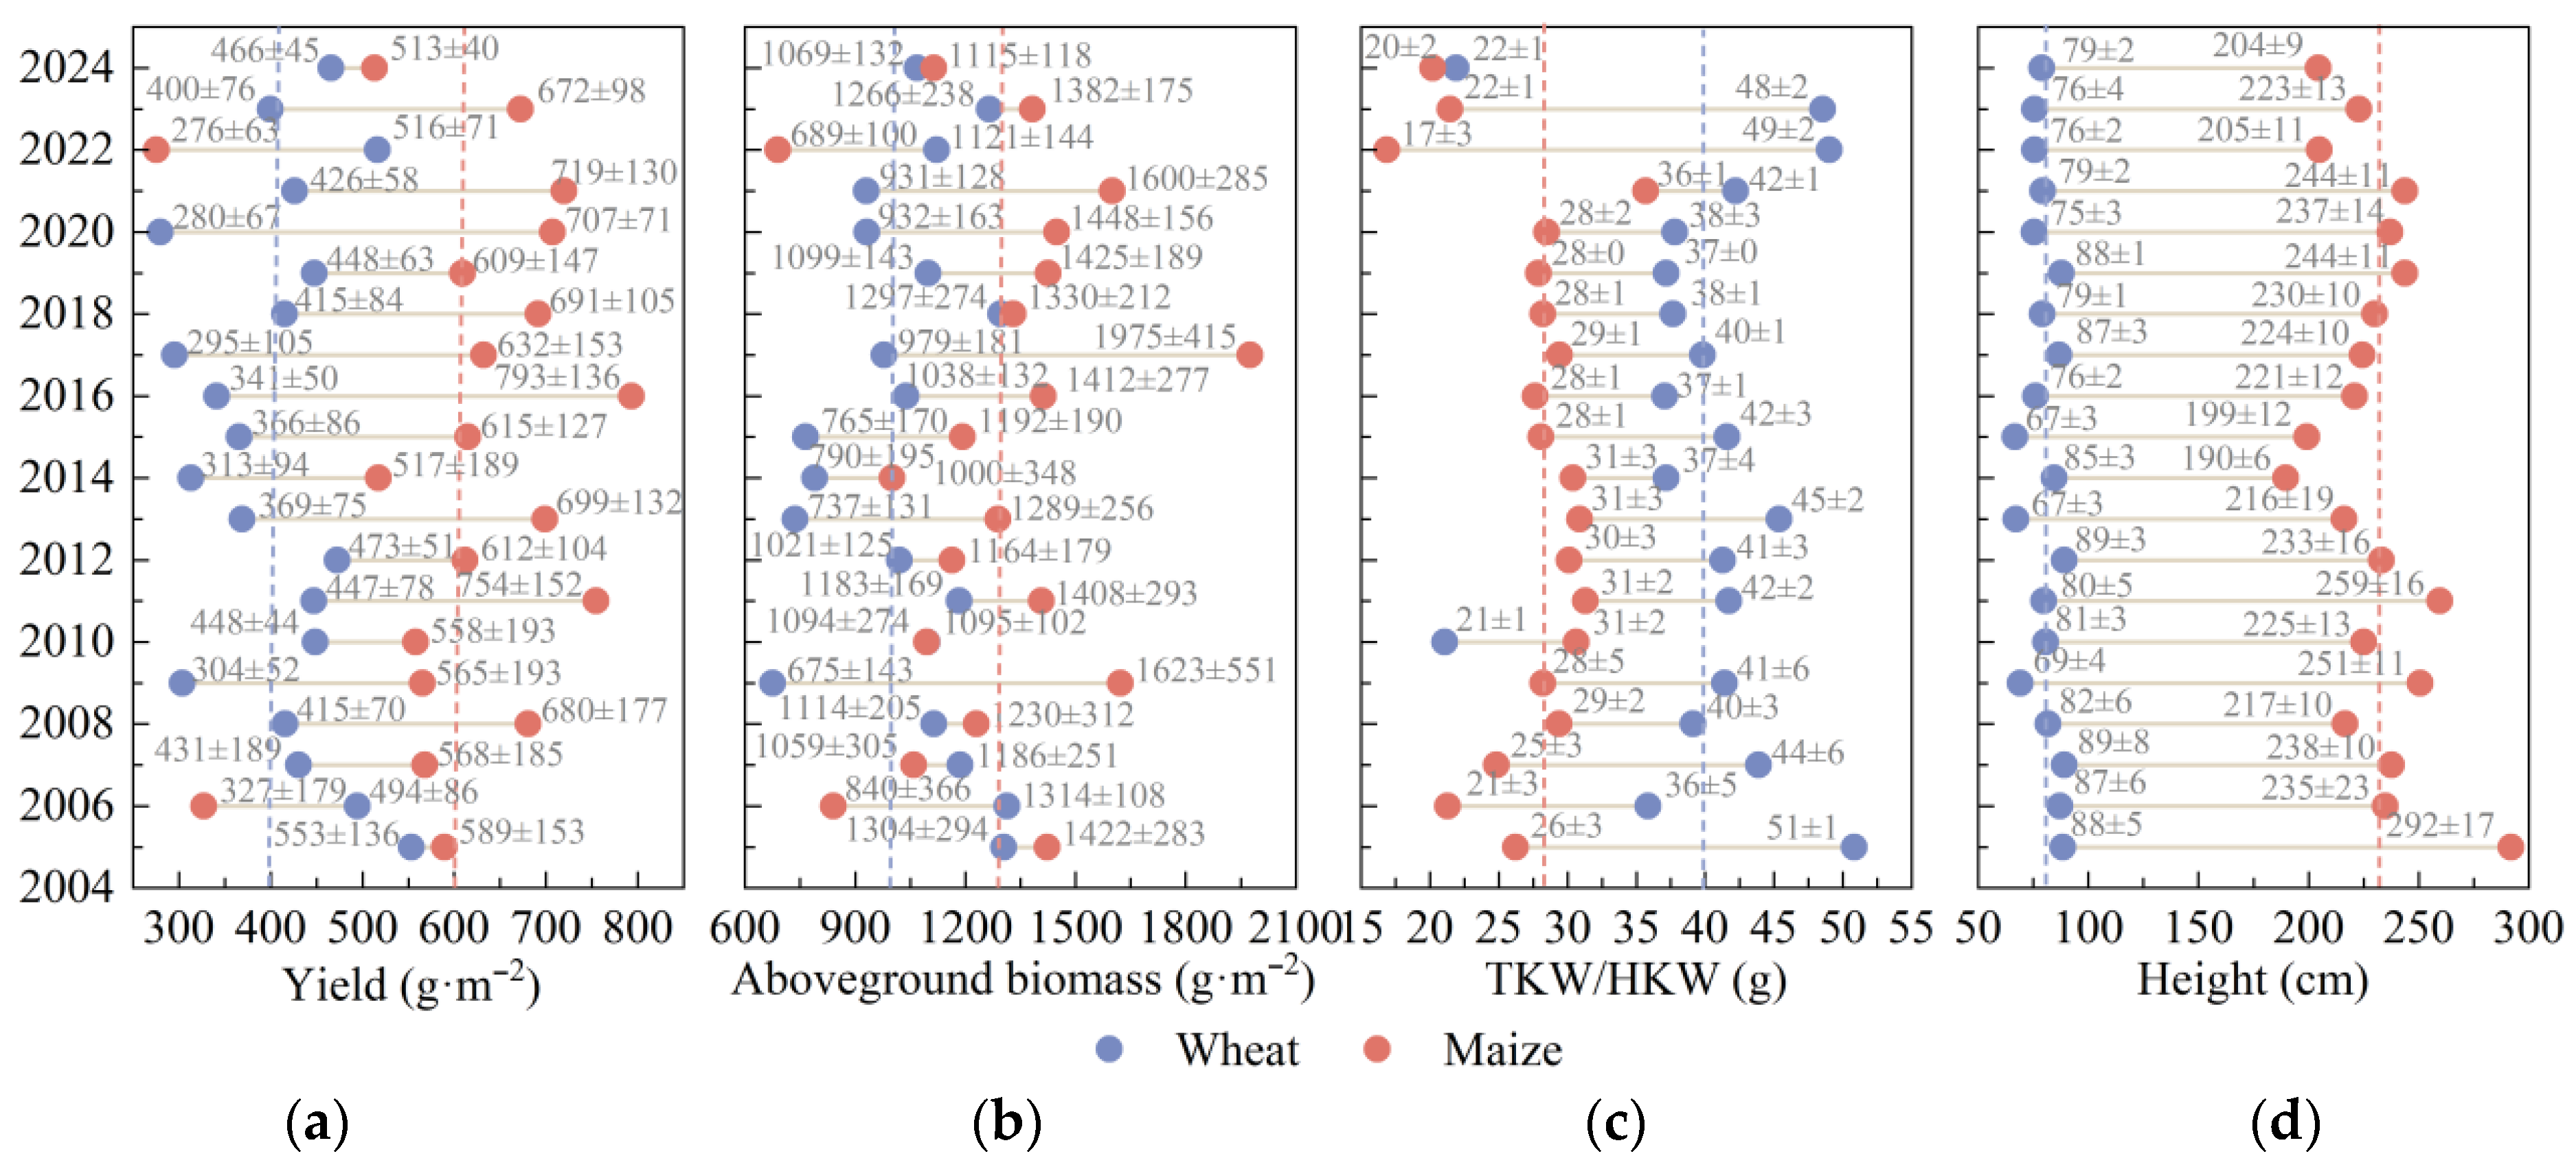
From 2005 to 2024, wheat traits were significantly below the average levels in the years 2009, 2014, 2016–2017, and 2020, while those of maize were markedly lower than average in 2006–2007, 2010, 2014, 2022 and 2024 (Figure 6). It is suggested that extreme climatic events caused these crop stresses when compared to normal climate regimes.

3.3. Relationship Between Crop Traits and Extreme Climatic Indices

Correlations between annual extreme climate indices and crop traits were generally weak (p > 0.05) (Tables S3 and S4). Since the growing periods of wheat and maize do not overlap, the use of total annual-scale data might obscure the specific responses of maize and wheat to climate extremes, due to their unique climate suitability.
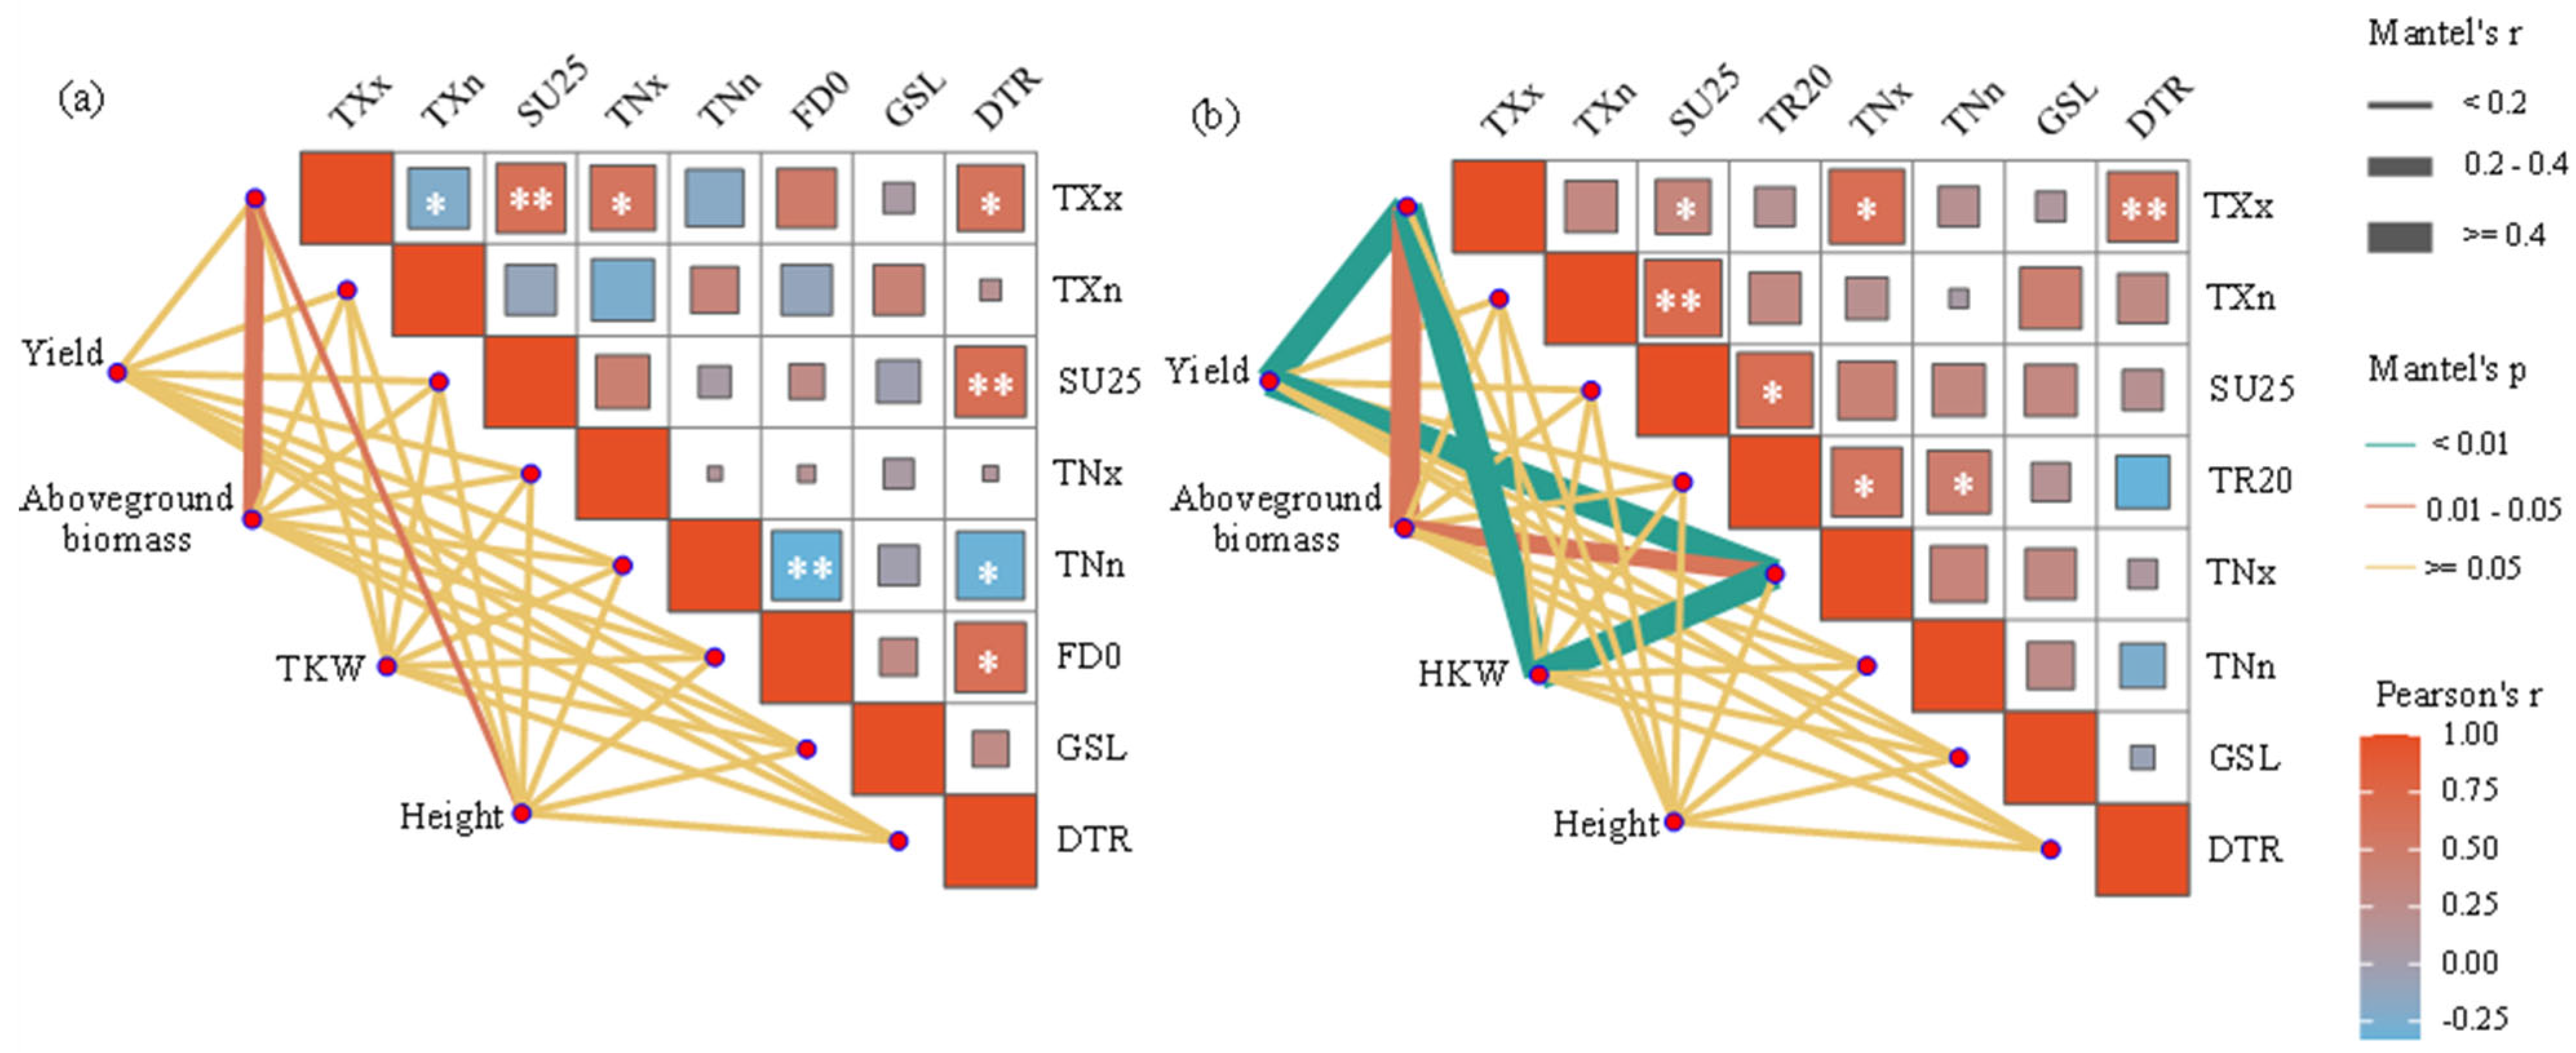
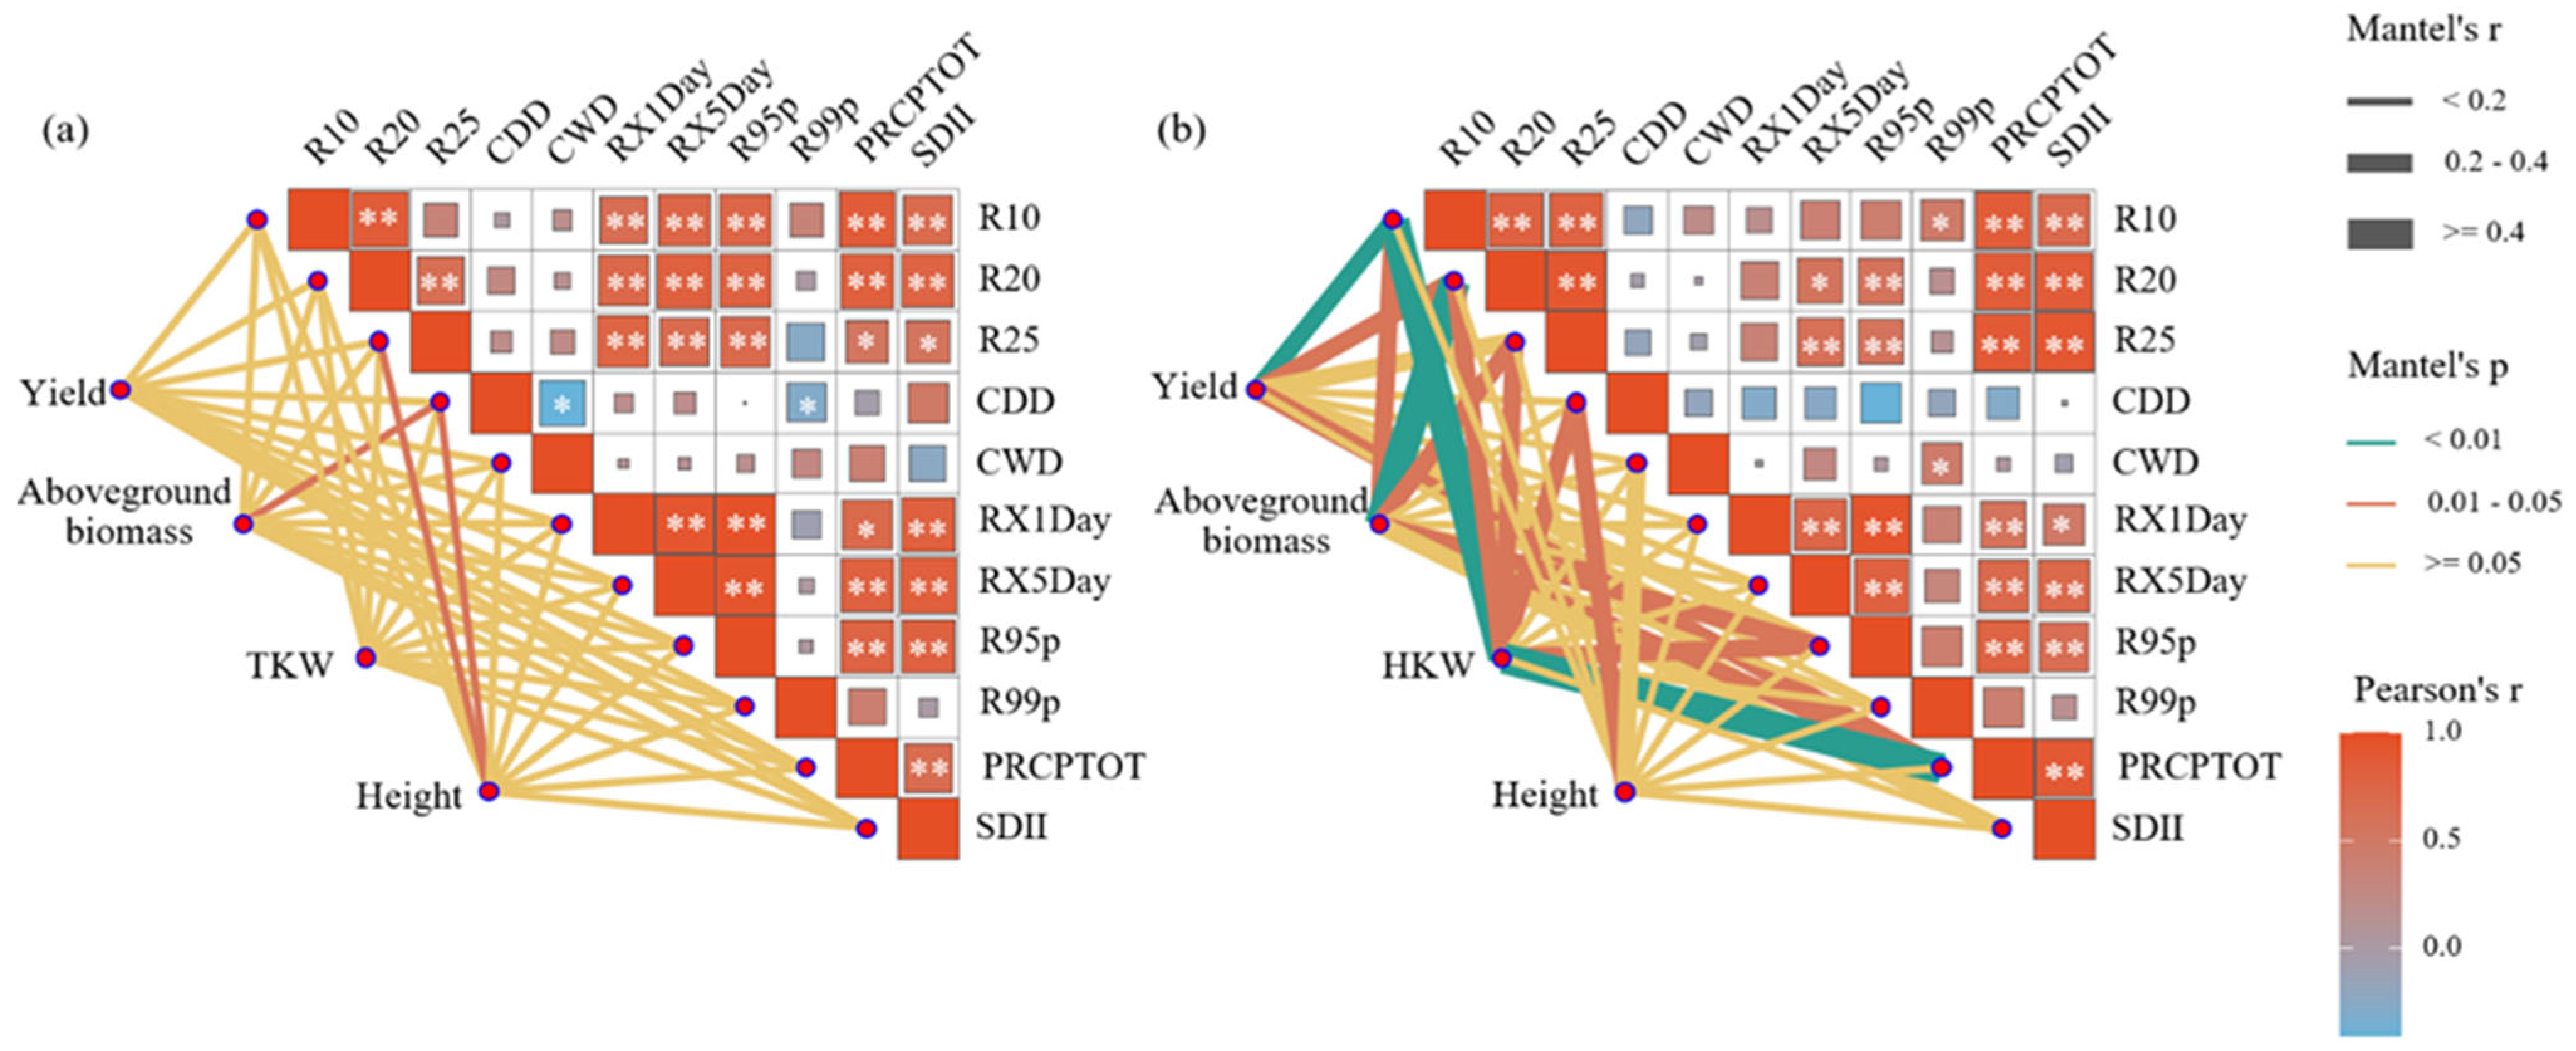
Therefore, to further analyze the effects of extreme climate events on crop traits, extreme climate indices were calculated separately for each wheat growing season (November to the following April) and maize growing season (June to September). TR20 was excluded from the wheat growing season, and FD0 was excluded from the maize growing season due to their null values. Mantel tests revealed weak correlations among extreme temperature indices within both growing seasons, whereas correlations among extreme precipitation indices were relatively strong (Figure 7 and Figure 8). Among the extreme temperature indices, only TXx showed a significant influence on wheat aboveground biomass and plant height (p < 0.05), correlations between other extreme temperature indices and wheat production indicators were not significant (p > 0.05) (Figure 7). Notably, TNx and TXx exhibited significant positive correlations with wheat aboveground biomass (p < 0.05) (Table S3). Maize was more sensitive to extreme temperature events, with grain yield, aboveground biomass and hundred-kernel weight all significantly affected by TXx and TNx (p < 0.05) (Figure 7). Among them, the yield and hundred-kernel weight had an extremely significant correlation with TXx and TNx (p < 0.01) (Figure 7), and TXx and TNx exhibited significant negative correlations with maize aboveground biomass (p < 0.05) (Table S4). The impact of extreme precipitation on wheat production was generally limited, with CDD exerting significant effects on aboveground biomass and height, while R25 showed a significant effect on aboveground biomass (p < 0.05) (Figure 8). Compared to extreme precipitation intensity indices, maize production was more strongly associated with extreme precipitation frequency indices. Significant correlations were observed between yield, aboveground biomass, and hundred-kernel weight (p < 0.05). R10, R20, R25, and CDD significantly affected maize hundred-kernel weight and height (p < 0.05). In addition, R95p had a significant impact on maize aboveground biomass and hundred-kernel weight (p < 0.05); PRCPTOT had a significant impact on maize yield, aboveground biomass and hundred-kernel weight (p < 0.05) (Figure 8).
The correlations between extreme climate and crop production varied across different growing stages (Tables S3 and S4). During the heading stage of wheat, the correlations with extreme climate indices were more pronounced, with TmaxMean, TminMean, TXn, and TXx showing significant positive relationships with aboveground biomass (p < 0.05) (Table S3). Extreme climate indices were not significantly correlated with wheat aboveground biomass or plant height at other growth stages (p > 0.05). Higher temperatures were beneficial to maize growth during the early stages, with TmaxMean showing significant positive correlations with aboveground biomass and plant height at the five-leaf and jointing stages, while TXx exhibited a significant positive correlation with aboveground biomass at the five-leaf stage (p < 0.05) (Table S4).

3.4. Identification of Lagged Responses of Crop Traits to Climate Extremes

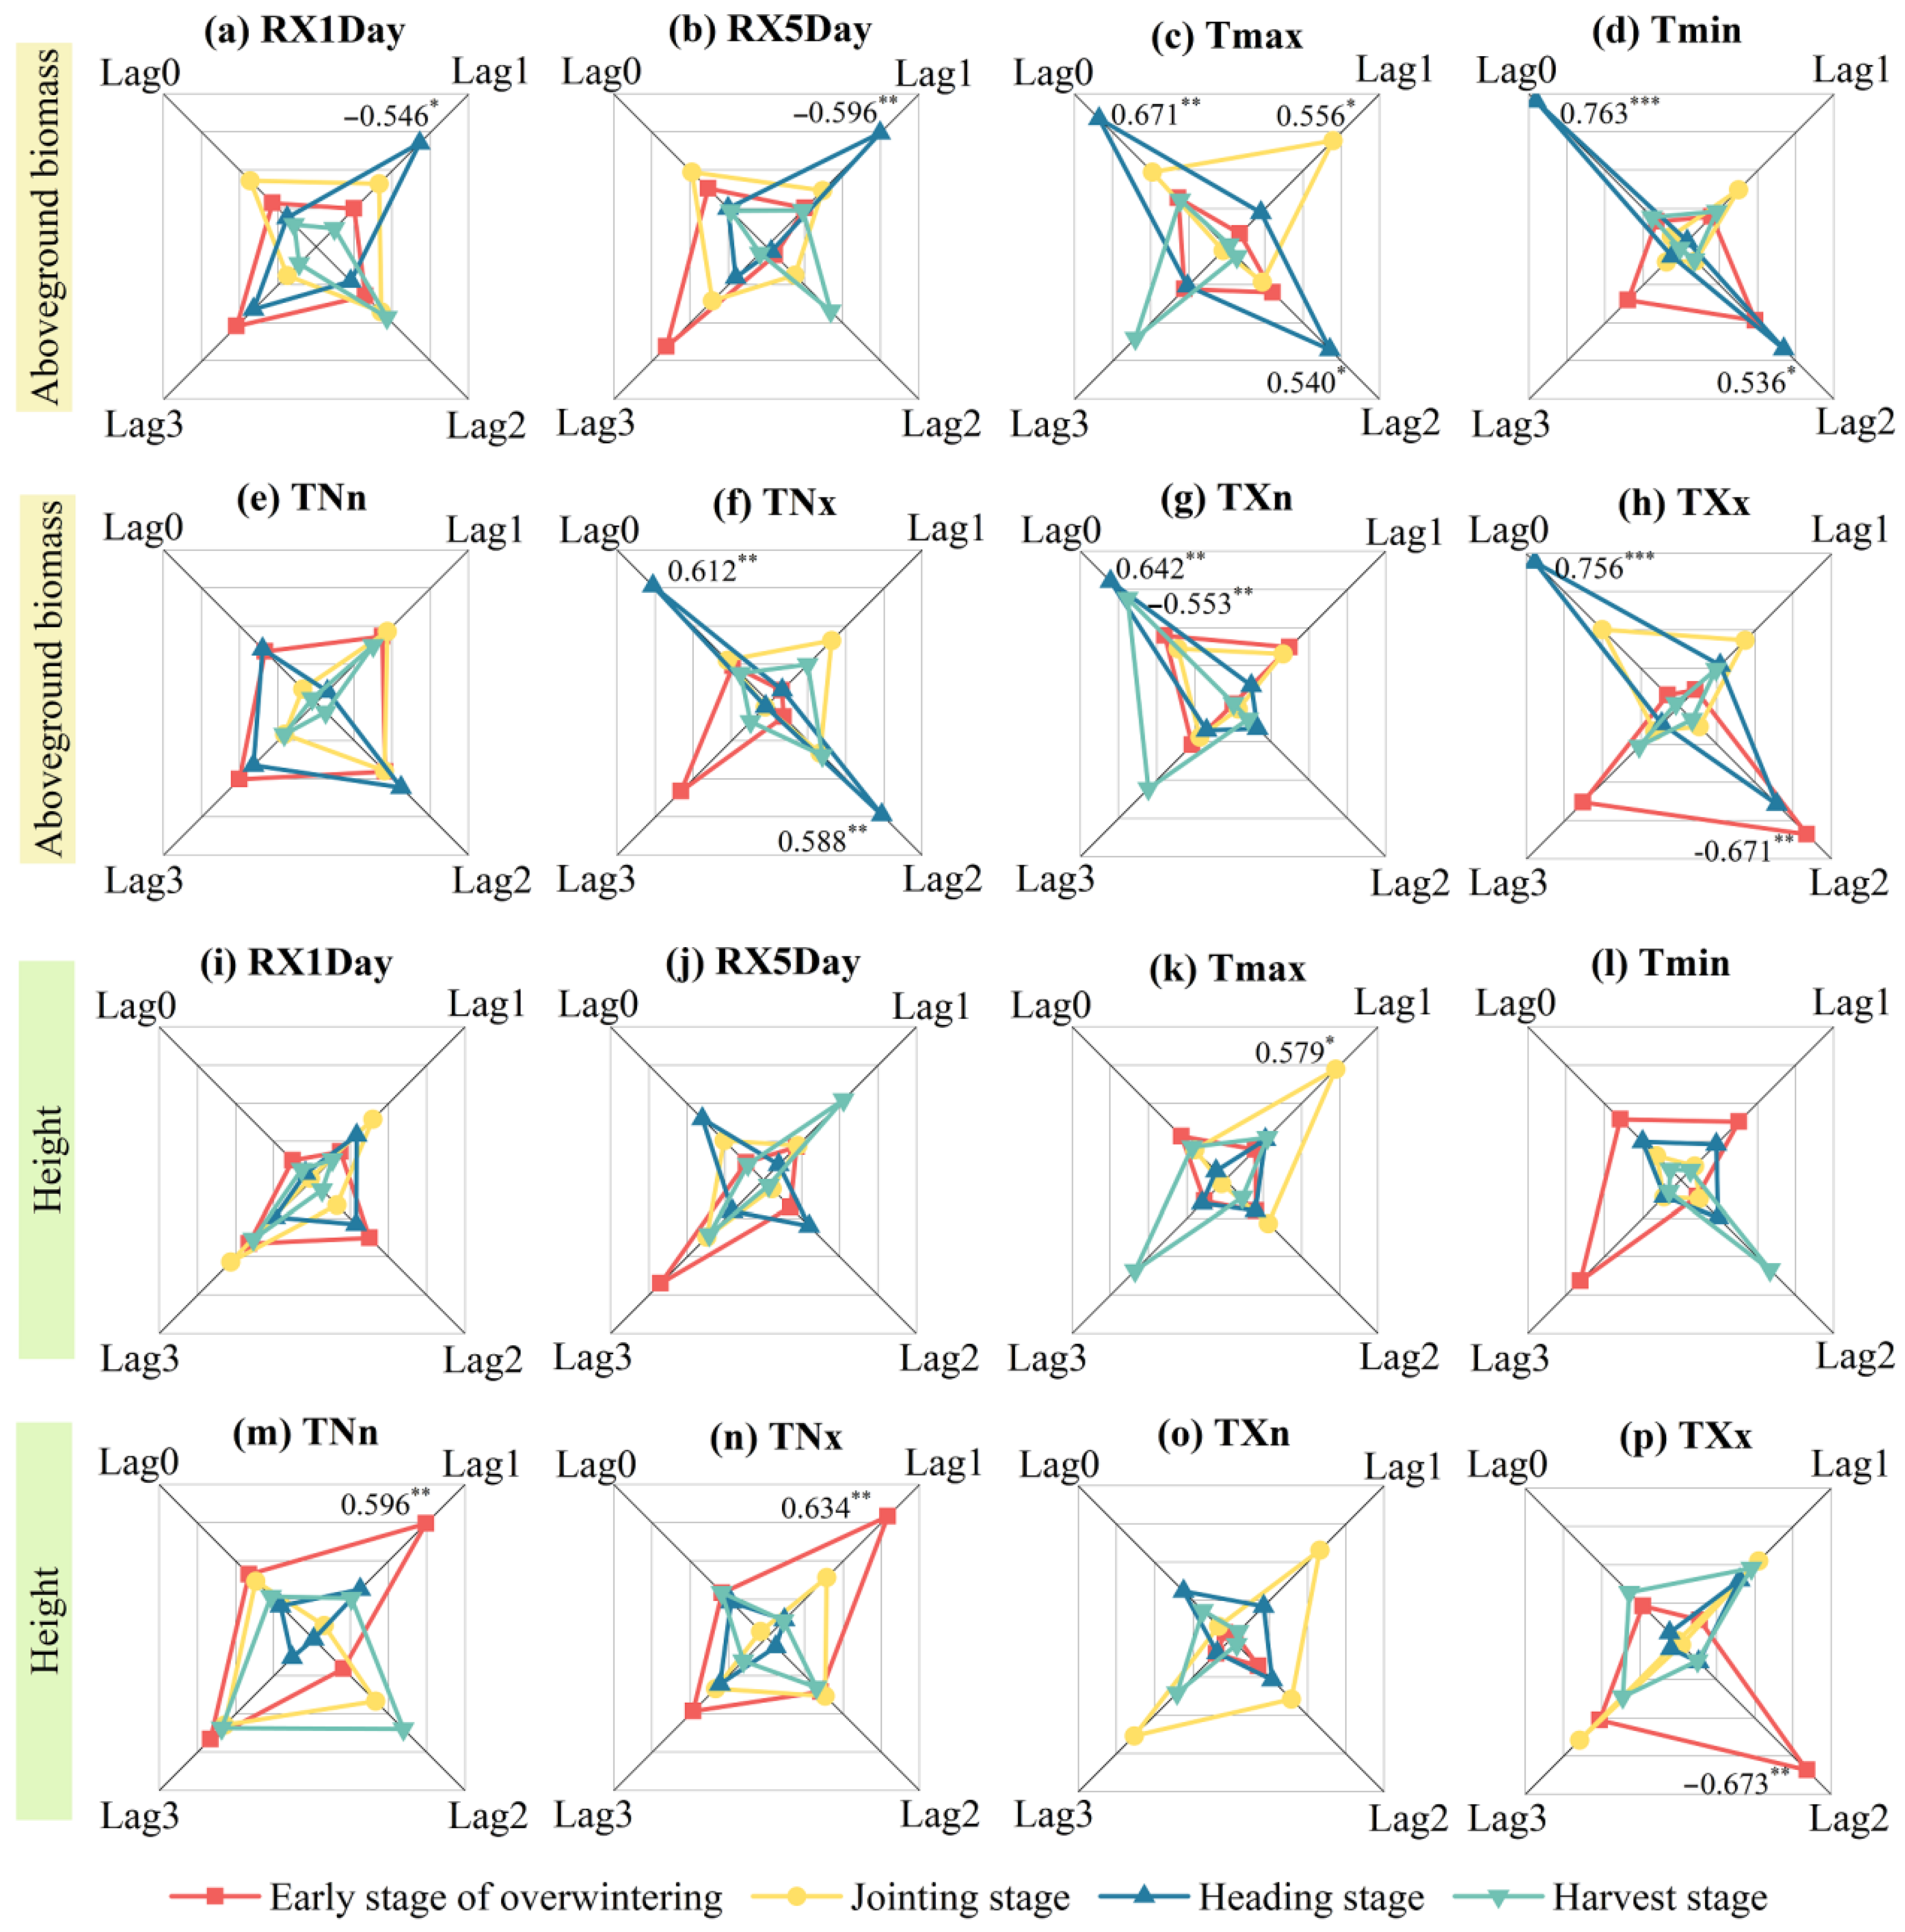
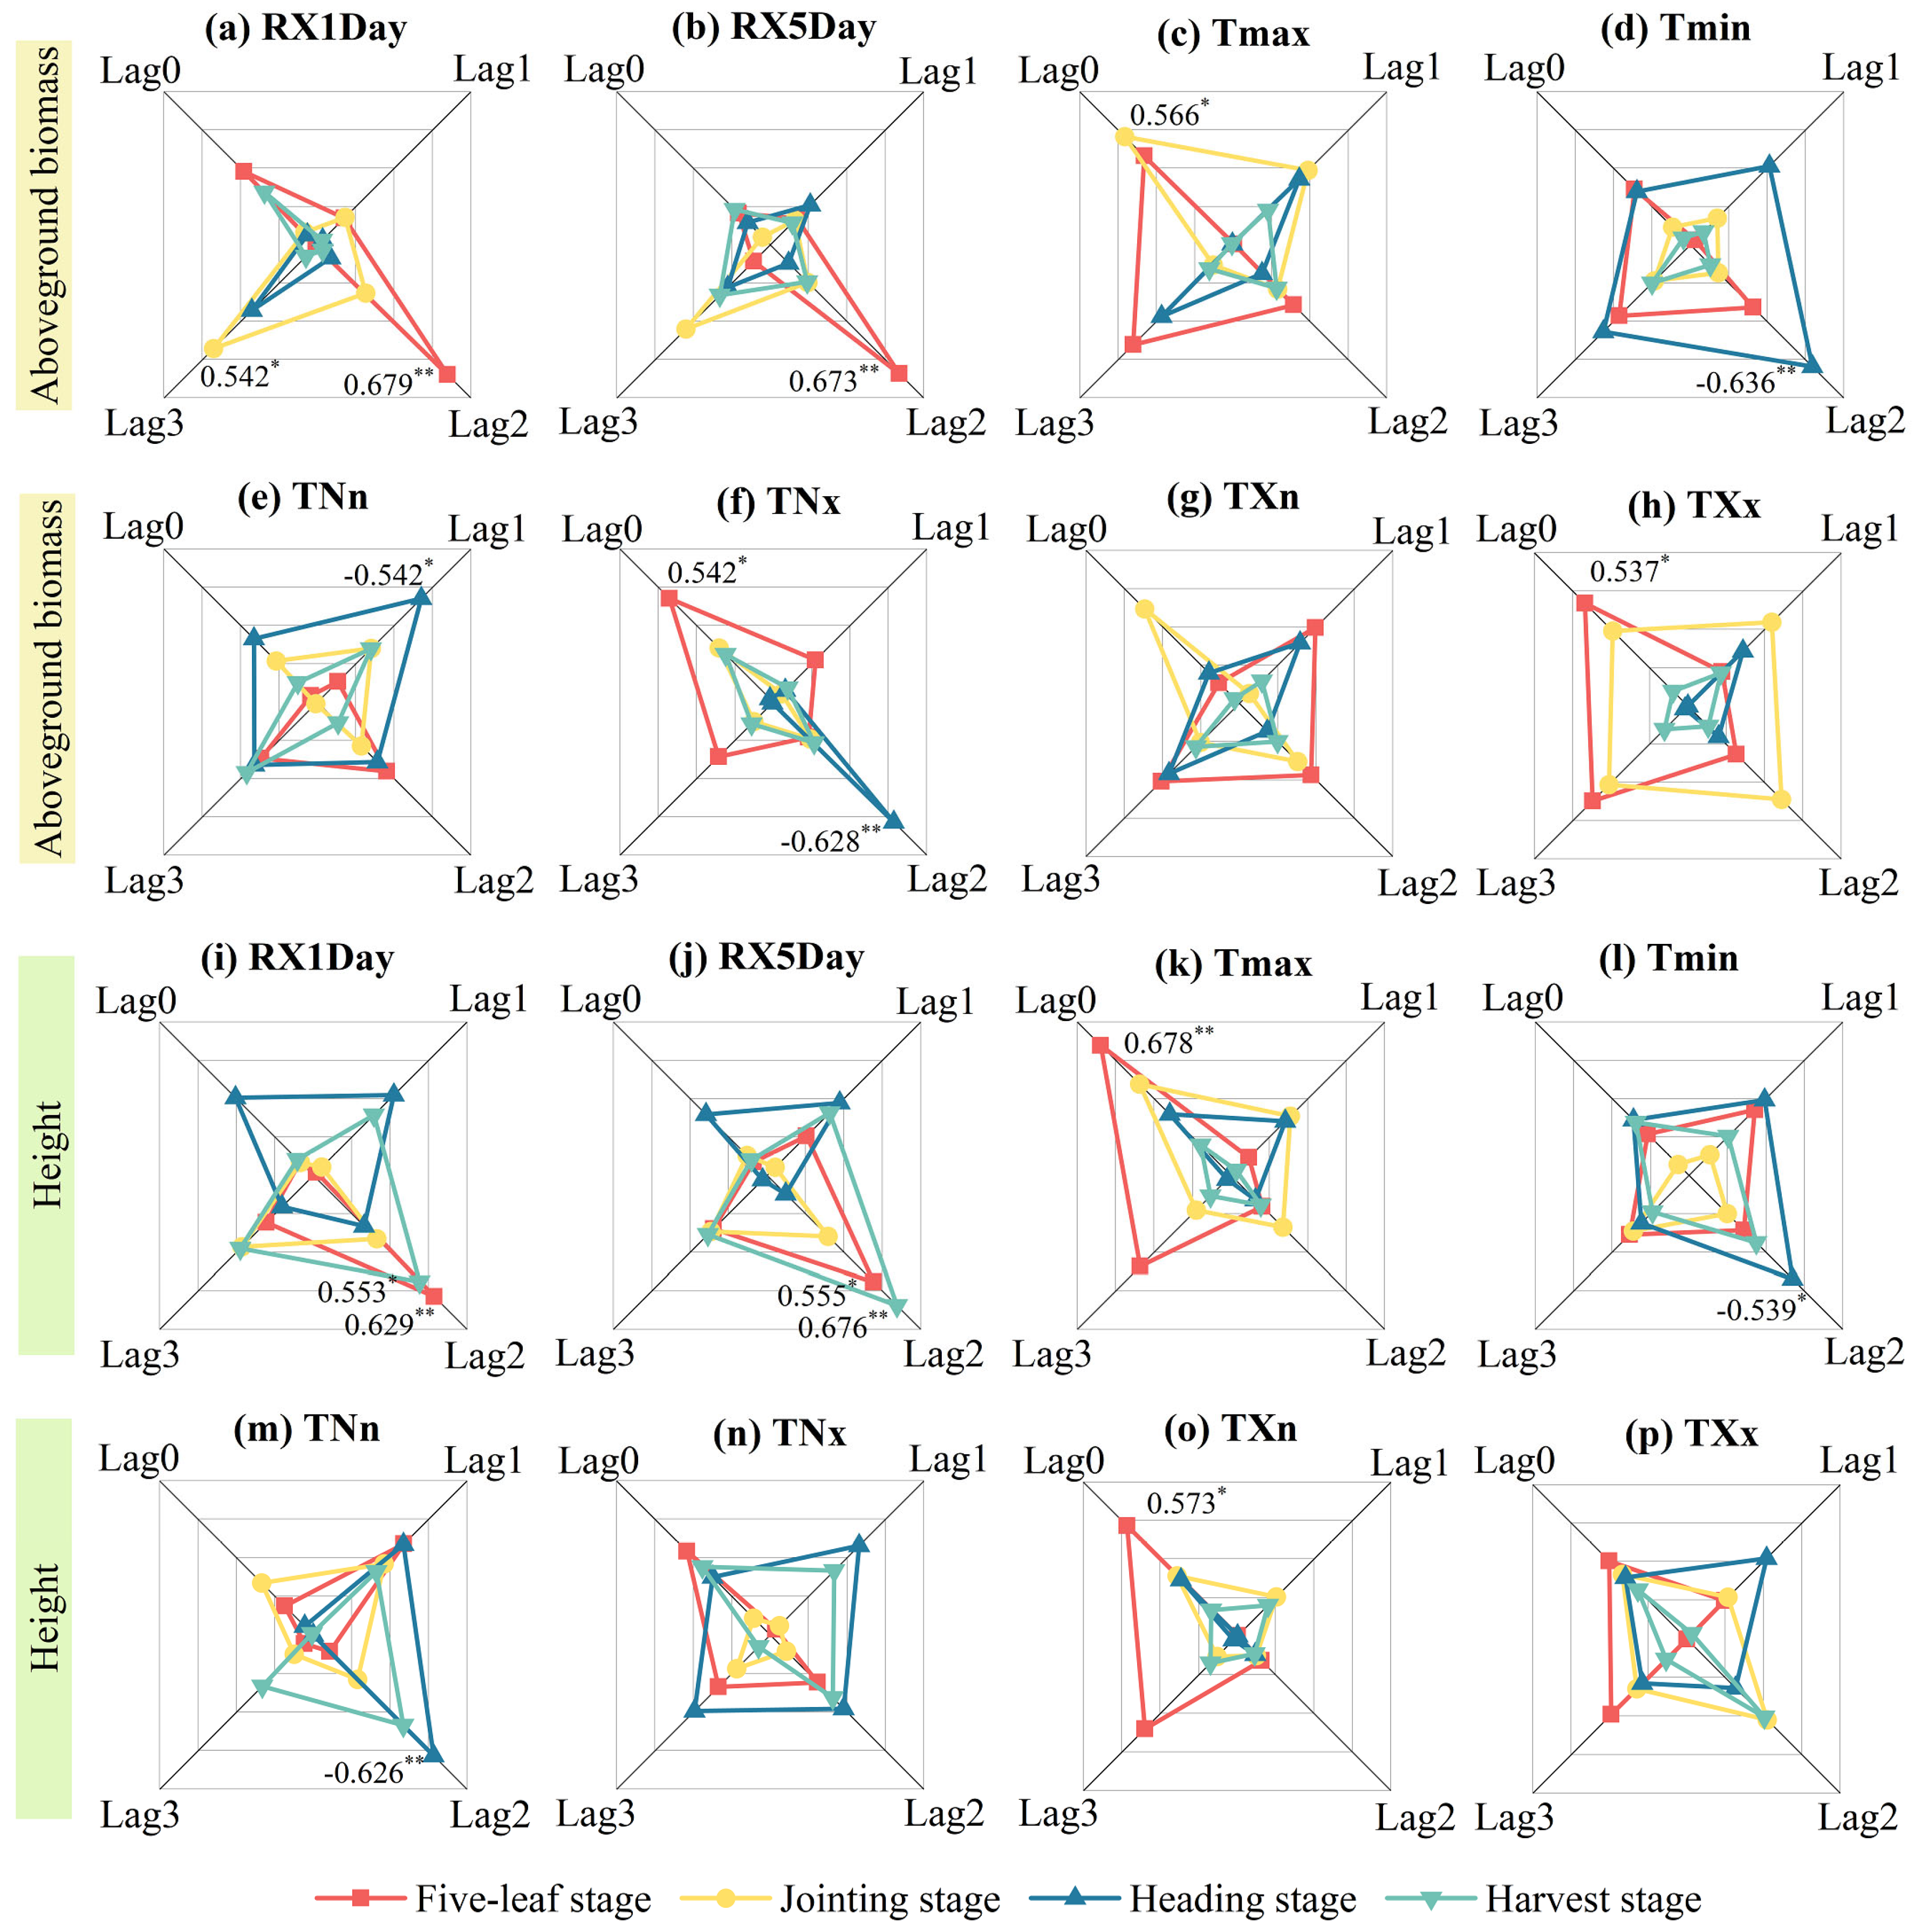
There were lags in the response of vegetation growth to changes in water and heat conditions, as well as disturbances by extreme weather events on a short-time scale (Figure 9 and Figure 10). Thus, it was difficult to fully reveal the correlation between crop production and climate factors at more specific periods [25]. Therefore, identification of the lags between crop growth and extreme climate indices in the growing months was key to accurately understanding of the climate–crop relationships in the region.
In this case, the time lag of aboveground biomass of wheat to precipitation extremes was one month at the heading stage (Figure 9), while the impact of temperature extremes at the same stage was not significant. RX1Day and RX5Day had a significant negative correlation with aboveground biomass (p < 0.05), and the remaining extreme temperature indices had a highly significant positive correlation (p < 0.01). In addition, TXx at the five-leaf stage exhibited a two-month lagged effect on aboveground biomass and plant height, showing a highly significant negative correlation (p < 0.01). Tmax at the early stage of overwintering showed a one-month lagged effect on aboveground biomass with a significant positive correlation (p < 0.05). In the early growth stage of wheat, plant height was mainly affected by preceding extreme temperature indices: TNn and TNx at the five-leaf stage had one-month lagged effects and were highly significantly positively correlated with plant height (p < 0.01), while Tmax at the early stage of overwintering had a one-month lagged effect with a significant positive correlation (p < 0.05).
During the maize growing season, the time lag of the response of aboveground biomass and height varied among different growth stages (Figure 10). At the five-leaf stage of maize, RX1Day and RX5Day showed two-month lagged effects on aboveground biomass and plant height, both with highly significant positive correlations (p < 0.01), whereas the effects of extreme temperature indices were contemporaneous, as, in the same month, TNx and TXx were significantly positively correlated with biomass, while Tmax and TXn were significantly positively correlated with plant height (p < 0.05). At the heading stage, extreme cold temperature indices had significant lagged negative effects on maize growth (p < 0.05). Specifically, Tmin affected aboveground biomass with a two-month lag, TNx with a one-month lag, and both Tmin and TNn affected plant height with a two-month lag. In contrast, the extreme precipitation indices and extreme warm temperature indices showed no significant effects on maize growth during this stage (p > 0.05). In addition, except for RX1Day and RX5Day at the harvest stage, which exhibited two-month lagged effects on maize plant height (p < 0.05), extreme climate indices at the jointing and harvest stages showed no significant or lagged effects on maize growth (p > 0.05).
To examine whether these lag patterns were consistent across years rather than driven by a few extreme seasons, we performed a leave-one-year-out (LOYO) sensitivity analysis. The selected lag windows were generally stable across iterations, with mean LOYO stability ranging from 76.9% to 93.8% across growth stages and traits (Table S1), indicating that the observed lag effects were not dominated by a single extreme season. In addition, bootstrap 95% confidence intervals for the selected lag correlations are provided to quantify uncertainty and further support robustness (Table S1).

3.5. Relative Contribution of Extreme Climate to Crop Growth

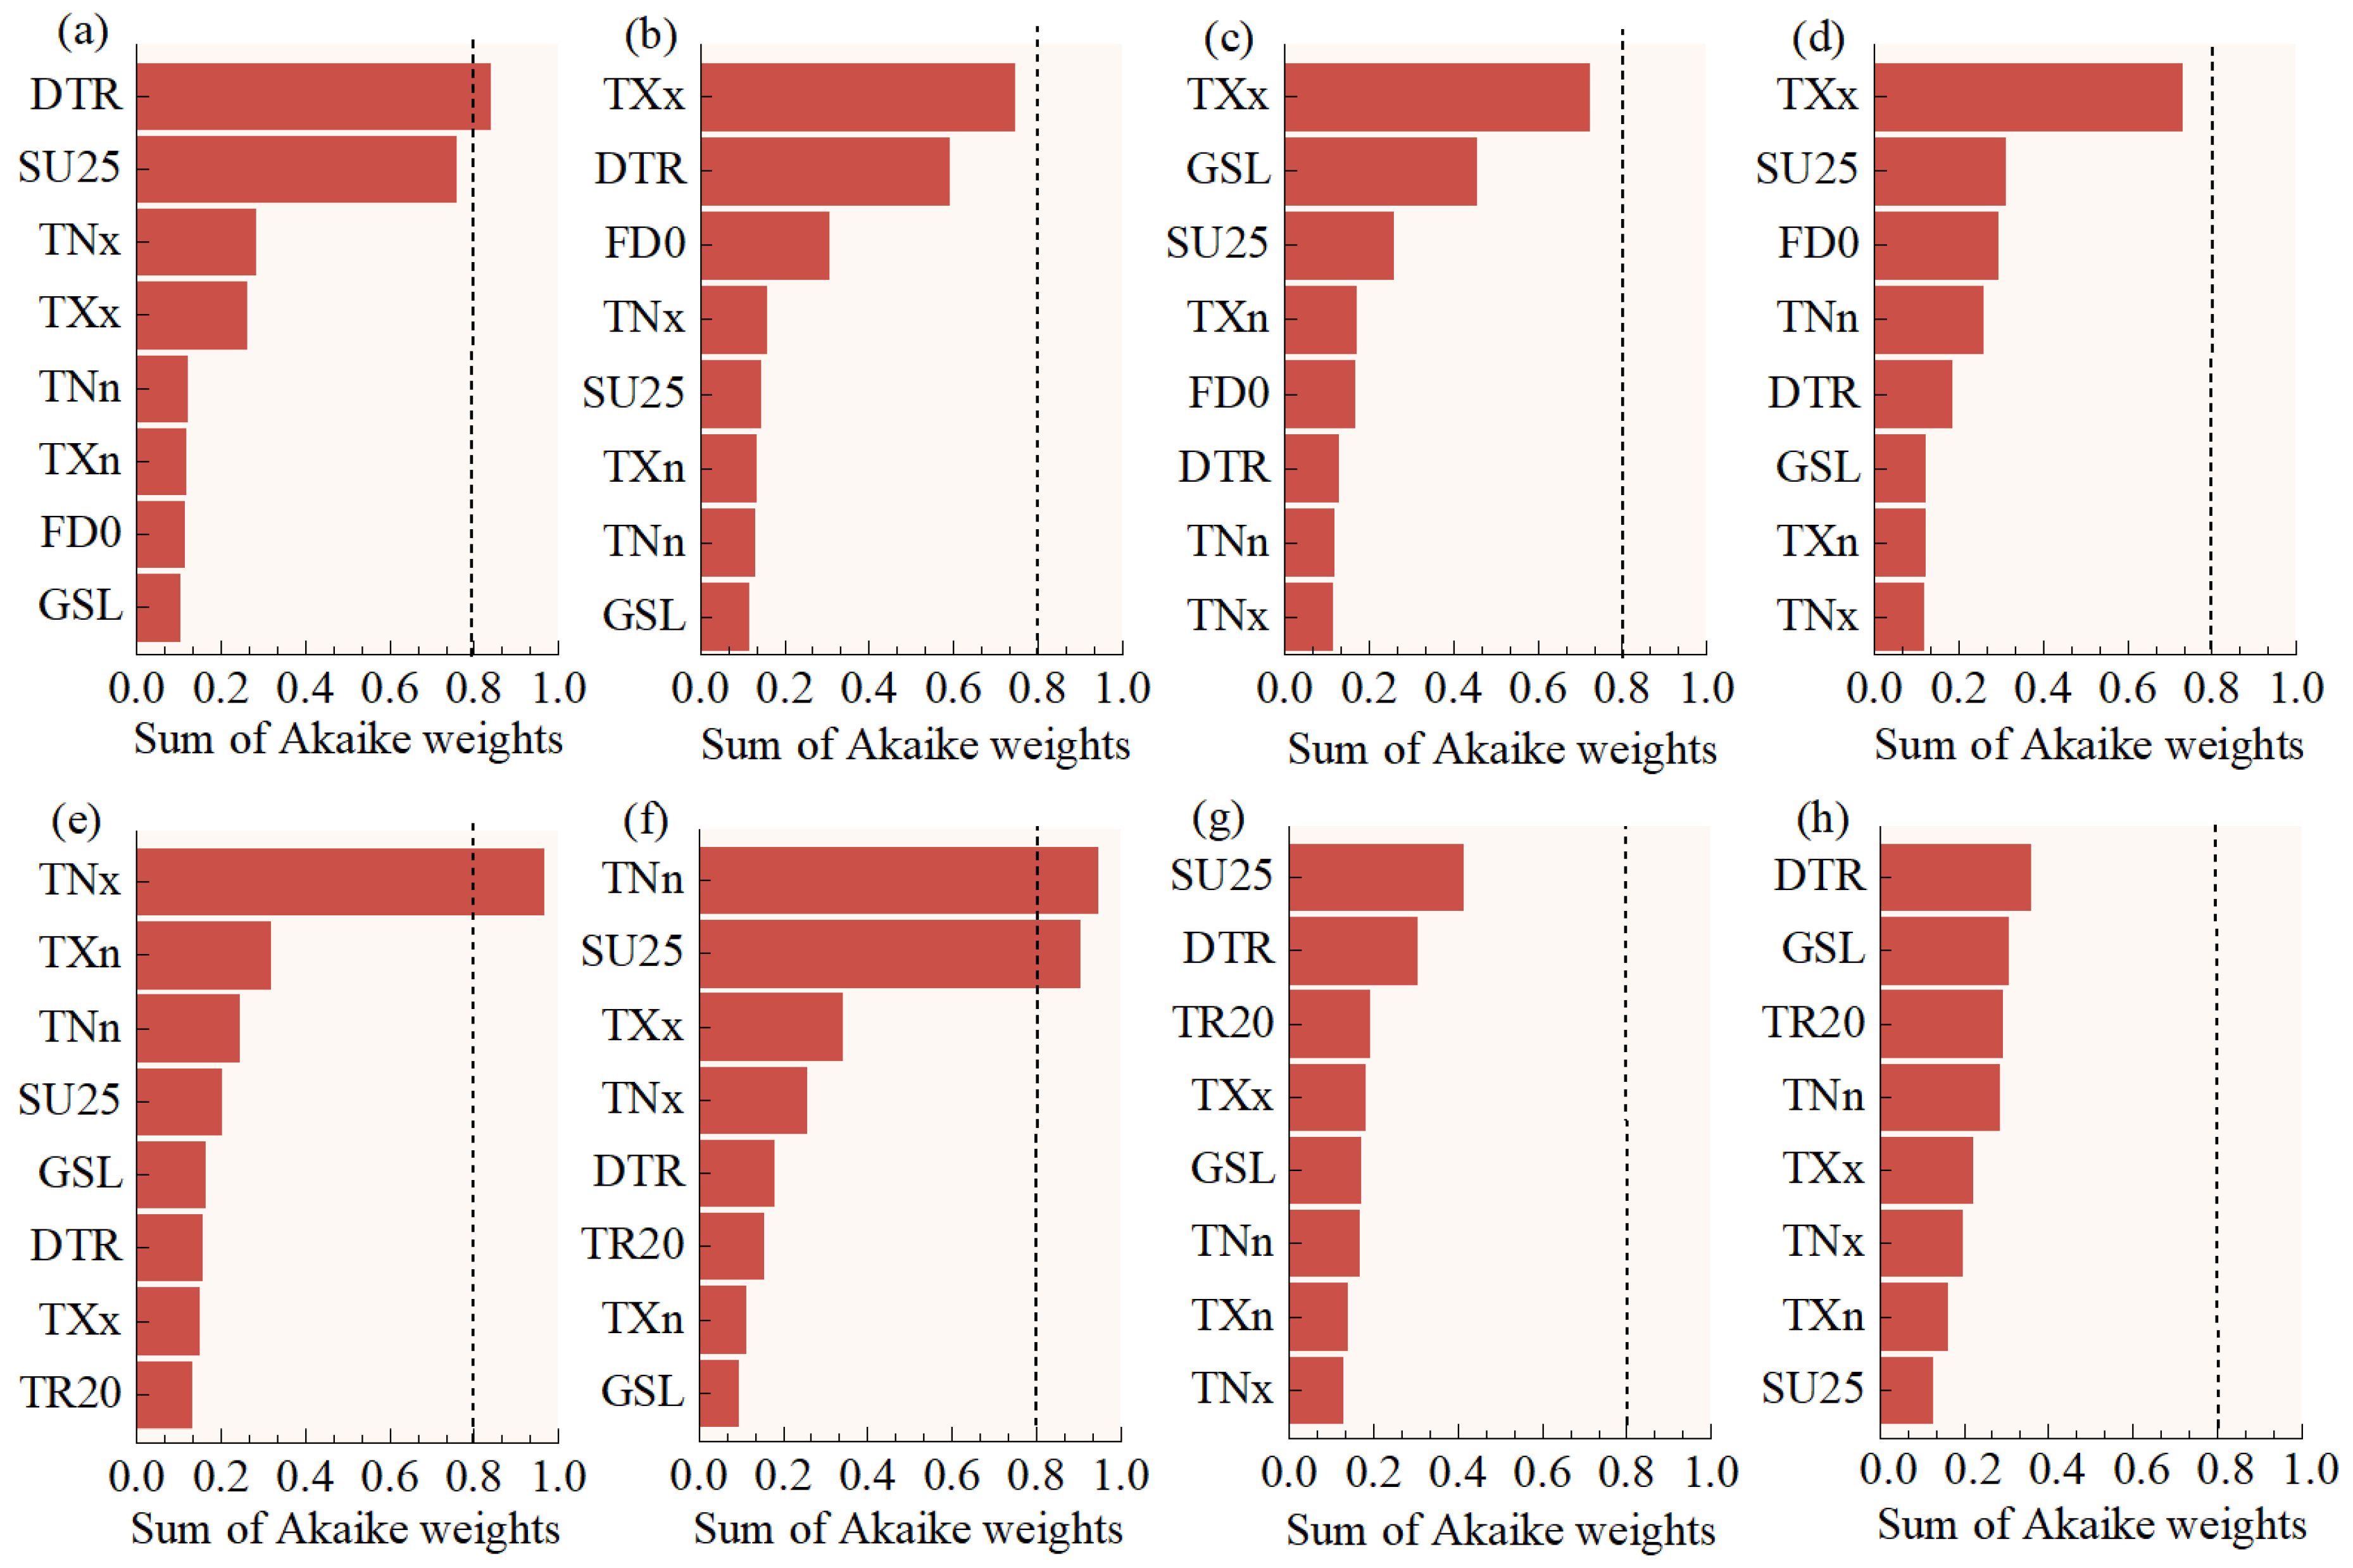
Generalized additive models (GAMs) were further employed to identify the key extreme climate indices influencing wheat and maize production, as well as their relative contributions (Figure 11 and Figure 12). The DTR was the primary predictor of explaining the effects of extreme temperature indices on wheat yield, while other temperature indices showed no significant influence on wheat production. For maize, TNx was the most important extreme temperature indicator explaining variations in yield, whereas TNn and SU25 contributed most significantly to plant height.
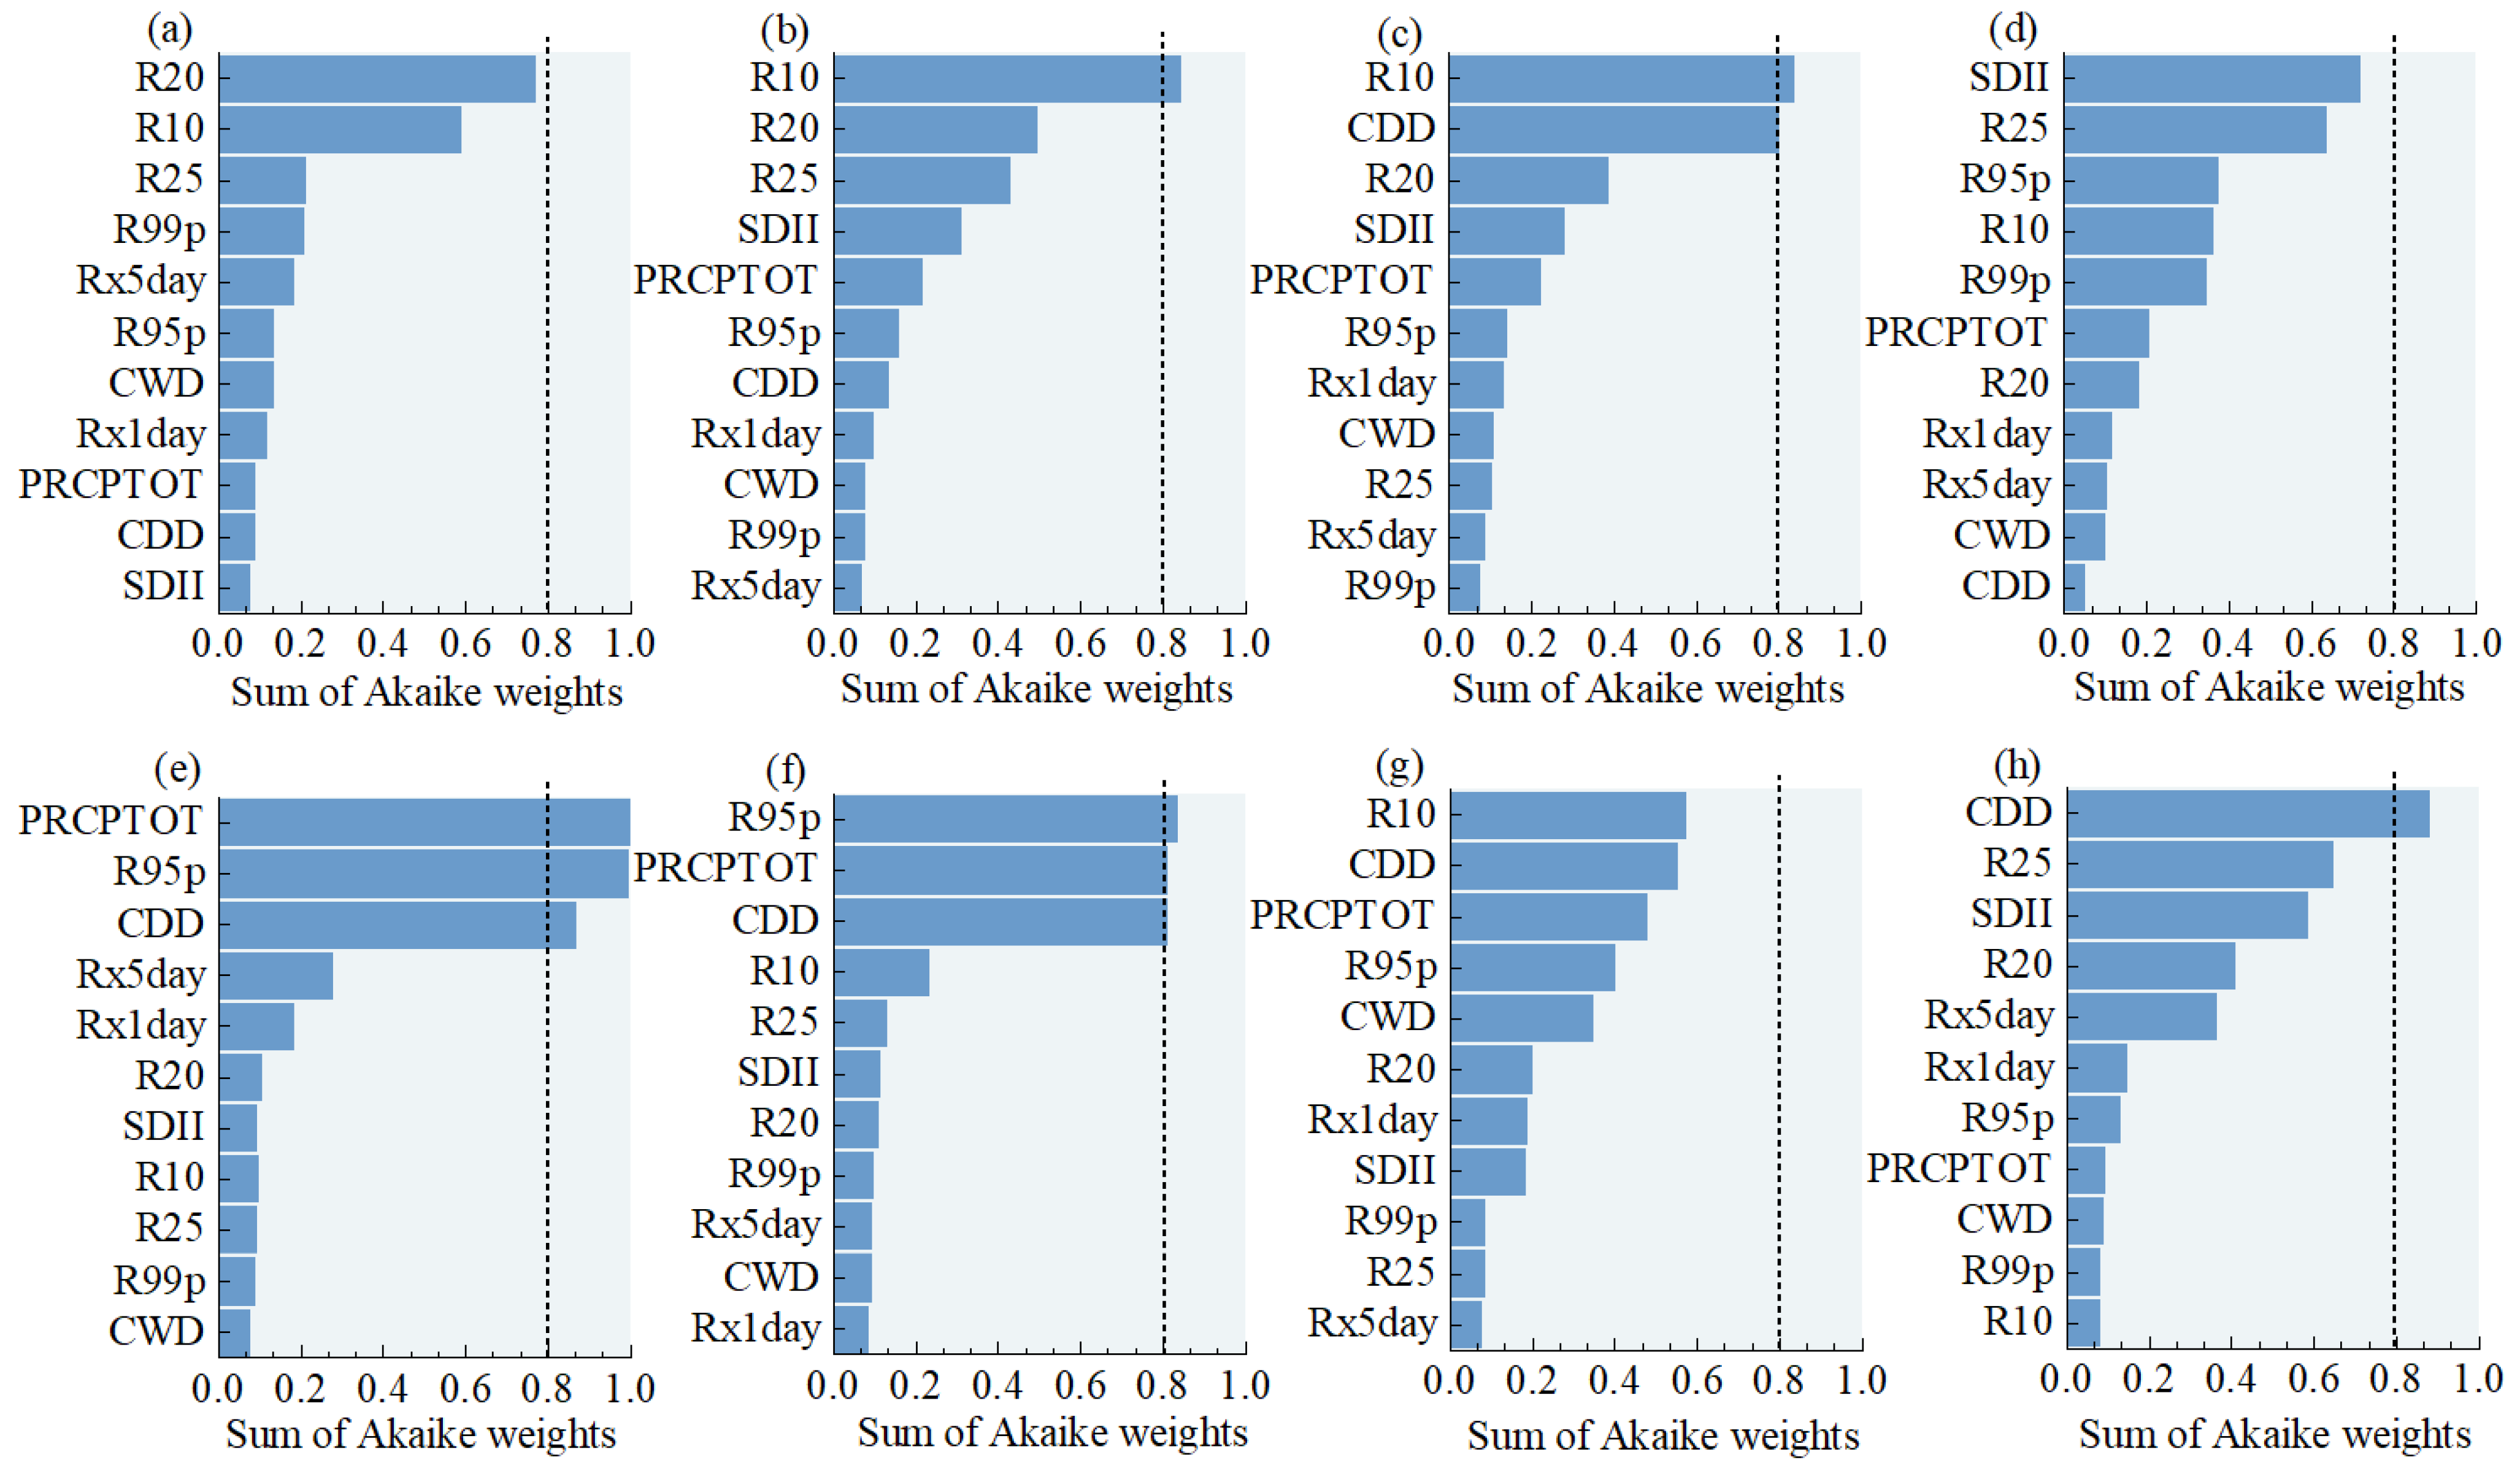
A model selection analysis showed that the effects of precipitation extremes on wheat yield and plant height could not be explained well by extreme precipitation indices (Figure 12). However, R10 contributed more to changes in aboveground biomass and the thousand-kernel weight of wheat. CDD was also identified as a key factor affecting thousand-kernel weight. The responses of yield and aboveground biomass of maize were affected by CDD, R95p, and PRCPTOT. CDD also contributed more to changes in maize plant height. Extreme precipitation had no significant effect on hundred-kernel weight.

3.6. The Future Trends of Extreme Climate Indices

The future trends of extreme climate indices were examined to study whether these observed patterns will persist or be intensified, aiming to bridge historical evidence with future risk assessment and to provide a basis for climate-resilient agricultural management. Based on the H exponent (R/S method) and Z exponent (Mann–Kendall test), most extreme climate indices during 1960–2024 exhibited significant persistence (H > 0.55), suggesting a tendency for these series to maintain their historical direction of change under comparable statistical properties (Table 2). For temperature indices, annual TXx, SU25 and DTR showed significant upward trends (p < 0.01). In contrast, extreme cold temperature indices (TNx and TNn) and TR20 declined significantly (p < 0.01), while FD0 increased markedly (p < 0.01), and GSL showed no significant change. For precipitation indices, trends were generally weaker. The most notable changes were an increase in consecutive dry days (CDD, p < 0.05), with RX1Day showing a near-significant increase. Other indices, PRCPTOT, SDII and extreme precipitation frequency indices (R10, R20, and R25), showed no significant long-term trends (p > 0.05).

4. Discussion

4.1. Synthesis of Variation Characteristics and Potential Causes of Extreme Climate Events in the Hilly Area of Southwest China

During 1960–2024, extreme temperature indices in the hilly area of southwest China indicated an overall warming tendency. Specifically, extreme warm indices generally exhibited significant upward trends (p < 0.05, Figure 1). These findings are largely consistent with regional-scale studies on extreme temperature trends across China, which reported increases in warm days and tropical nights and decreases in cold nights [37,38]. However, extreme cold indices showed decreasing trends, and the diurnal temperature range displayed a highly significant increase (p < 0.01, Figure 1), suggesting enhanced nighttime cooling and a larger day–night thermal amplitude in the study area. This differs from findings suggesting that nighttime temperatures likely rose due to elevated greenhouse gas concentrations, cloud cover, and precipitation [39]. Such differences from the broad-scale consensus may reflect strong regional heterogeneity in extreme climate responses. A plausible explanation is that reduced cloudiness or drier near-surface conditions can strengthen nighttime radiative cooling, lowering nighttime temperatures and increasing the DTR [40]. In addition, although the region is not generally water-limited, the shallow soil profile and rainfed farming, together with uneven seasonal rainfall, can lead to seasonal or episodic drought and short-term soil moisture constraints. This may weaken evaporative cooling during hot periods and contribute to larger diurnal temperature ranges [41]. Moreover, frost days and summer days also showed highly significant increases (p < 0.01, Figure 1), implying greater thermal variability and increased exposure to both cold- and warm-season extremes [1]. Meanwhile, we acknowledge that this analysis is based on a single station and thus reflects local-scale tendencies, which should be further verified using multi-site observation datasets.
In contrast, the intensity of annual extreme precipitation did not show a significant trend in the hilly area of southwest China except for consecutive dry days (CDD) (p > 0.05, Figure 2). This result aligns with previous findings in the Sichuan basin, which also concluded that the changes in extreme precipitation were not significant [36]. Most extreme precipitation intensity indices exhibited insignificant increasing trends (p > 0.05), whereas CDD showed a highly significant increasing trend (p < 0.01). These results suggest that the temporal distribution of precipitation has become more uneven, contributing to an increased risk of drought.
To further elucidate the impacts of extreme climate on different crops, we examined the variations in extreme climate indices across distinct growing seasons. During the maize season, most extreme warm temperature indices showed increasing trends except for tropical nights (Figure 3), and CDD exhibited a highly significant upward trend (p < 0.01, Figure 4), suggesting that maize was more likely to be affected by compound high-temperature and drought events. In contrast, during the wheat season, nearly all extreme cold temperature indices increased significantly except for frost days (Figure 3), while CDD showed no significant change (p > 0.05, Figure 4). Precipitation intensity indices had more pronounced impacts in the wheat season (Figure 4), indicating that wheat may be more vulnerable to extreme low-temperature and moisture-related events.
Overall, both extreme temperature and precipitation indices exhibited statistically significant persistence (Table 2), suggesting a tendency for the observed directions of change to continue under comparable statistical properties of the historical record. Interpreted in this way, the persistence signals are consistent with a climate that may feature heightened variability and potentially increased risk of climate extremes, including shifts in temperature extremes, amplified diurnal temperature range, prolonged drought conditions, and possible increases in short-duration heavy rainfall. Such changes could elevate the likelihood of compound heat–drought stress or episodic flooding risks for regional agricultural production. These inferences are broadly consistent with reports of intensifying extreme climate risks at larger scales [42,43,44], while acknowledging that future evolution may deviate under a non-stationary climate, forcing local boundary condition changes.
In southwest China, extreme precipitation was strongly influenced by its large-scale circulation background such as the western Pacific subtropical and monsoon systems [45,46]. Extreme temperature variability has also been linked to changes in regional circulation and ocean–atmosphere conditions that can modulate heat extremes [47]. Overall, both natural and anthropogenic factors may contribute to local climate change, and future work could conduct targeted attribution analyses to quantify their relative roles [48].

4.2. Impacting Mechanisms of Extreme Climate on Crop Traits

Previous studies indicated that different crops exhibited varying responses to extreme climate events. In this study, wheat–maize yield and aboveground biomass fluctuated considerably during 2005–2024 (Figure 6), and maize exhibited more significant responses to extreme climate indices than wheat in the hilly area of southwest China (Figure 7 and Figure 8). This contrast is consistent with their different hydrothermal adaptations and growing season environments. In particular, the extreme dry–hot weather events (e.g., higher CDD, TXx and TXn) in the study area mainly occurred during the rainy season, which was the growing season for maize (Figure 5), whereas winter wheat develops during the cooler and drier season.
For wheat, TXx and TNx were positively correlated with biomass (Table S3), which may suggest that modest winter warming alleviated thermal constraints on growth and thereby favored biomass accumulation. Warmer conditions can alleviate thermal constraints during overwintering and early spring regrowth, thereby supporting canopy development and biomass accumulation [49]. Warmer temperatures can also promote growth by increasing the mineralization and effectiveness of soil N [50,51], while enhanced photosynthesis may further accelerate vegetation growth [52,53]. In addition, higher TNx can be beneficial for wheat during the cool season because night warming reduces the cold limitation on metabolic activity and recovery after overwintering, supports tillering and early canopy development, and can lower the risk of frost-related damage during sensitive early stages [54]. FD0 is particularly relevant to wheat because repeated freezing during overwintering and early spring stages can delay regrowth and reduce canopy development, ultimately affecting subsequent growth and yield formation [55].
In contrast, both TXx and TNx were negatively correlated with maize growth (Table S4), underscoring the suppressive effect of high temperatures. Extreme daytime heat can directly depress photosynthesis and increase evaporative demand, which promotes stomatal closure and accelerates soil moisture depletion [56]. Moreover, high temperatures around tasseling–silking can impair flowering and pollination by reducing pollen viability and disrupting anthesis–silking synchrony, thereby reducing kernel number and yield potential [57]. Sustained warming also increases autotrophic respiration and may increase pest pressure such as corn borer [3,58]. Elevated nighttime temperature (higher TNx) can further increase maintenance respiration and accelerate carbon consumption, reducing net carbon gain and limiting biomass accumulation [59]. Moreover, although the region is not generally water-limited, uneven rainfall distribution can cause seasonal or episodic drought and short-term soil moisture constraints, which can amplify heat impacts by increasing evaporative demand and aggravating drought stress [60]. Higher temperatures were reported to benefit vegetation growth mainly in areas with less severe water limitation in arid and semi-arid regions [25,61]. However, in the hilly area of southwest China, winter wheat production during the dry season exhibited positive correlations with extreme temperature indices (Table S3). This suggests that crop responses to thermal extremes in the subtropical monsoon region are strongly season-dependent and differ from those in arid and semi-arid regions.
Moisture is the primary climatic factor limiting vegetation growth, and adequate precipitation is critical for crop growth and development. In this study, wheat production was more sensitive to extreme precipitation events (e.g., R10 and CDD) than to extreme temperatures (Figure 11 and Figure 12). This is because the wheat growing season coincides with the dry season in the hilly area of the subtropical monsoon climate in China; water availability is the primary limiting factor. This is consistent with findings from arid regions, where vegetation growth is primarily constrained by water availability and thus more strongly affected by extreme precipitation events [25,61]. Moreover, both extreme temperature and precipitation indices influenced maize production, with precipitation frequency indices (especially CDD) emerging as dominant drivers (Figure 8). Insufficient precipitation and inappropriate temperatures during critical growth stages could induce severe drought and reduce crop yield. In this study, both wheat and maize were significantly affected by CDD (Figure 8 and Figure 12), consistent with reports that drought during the heading and grain-filling stages significantly reduced the yield potential of wheat (by 18.8%) and maize (by 30.5%) [62]. Water deficits also affect root morphology [63] and grain formation [64] in wheat. In addition, droughts and floods triggered by climate extremes may further influence crop production by disrupting soil nutrient dynamics and microbial communities [65,66]. For example, excessive rainfall can lead to greater runoff and leaching, accelerated soil nutrient losses [67], impaired root health, and even cause crop mortality [68].

4.3. Lagged Crop Responses to Climate Extremes

The lag effect of climate on vegetation is very important for field management. Many studies have found that the effects of heat and moisture accumulated over a certain period on carbon exchange in plants, soils, and ecosystems may be more significant than the effects of current climatic conditions [69]. The lagged effects of precipitation on plants arise mainly because vegetation growth responds not directly to rainfall itself but to actual soil moisture availability, especially for grassland and agricultural vegetation [70]. This is because part of the rainfall can be stored in the soil profile and then used by crops in the following weeks, and the antecedent hydrothermal background can shape crop stress at later stages. Normally, the time lag is usually less than a quarter of a year [71]. Given the 20-year crop record, individual lagged correlations should be interpreted with appropriate caution; nevertheless, the combined evidence from LOYO stability and bootstrap confidence intervals supports the robustness of the inferred sensitivity windows (Table S1). This study found that the time lag of crop growth response to extreme climate events in different crop types was up to one month or two months (Figure 9 and Figure 10).
During the wheat heading stage, RX1Day and RX5Day had one-month lagged negative effects on aboveground biomass. It is suggested that consecutive extreme precipitation and cold weather might increase frost-related stress and disrupt grain formation, which could adversely affect wheat grain formation [72]. Moreover, the positive lagged associations between temperature indices and wheat growth in early stages are also reasonable, because winter wheat develops under cool-season conditions and relatively warmer antecedent temperatures can facilitate overwintering recovery and early canopy development, so their benefits may appear with a short delay [49].
In contrast, at the maize five-leaf stage, RX1Day and RX5Day exhibited two-month positive lagged effects on aboveground biomass, possibly because this stage coincided with the early summer drought period in the hilly area of central Sichuan, when maize relied on its root system to access deep soil water recharged by preceding rainfall [30]. In addition, the lagged negative effects of cold-related indices on maize growth around the heading stage suggest that temperature anomalies can influence maize development beyond the month of exposure. This may occur because cold stress can slow phenological development and reduce assimilate supply, and the resulting impacts may be carried over to subsequent biomass and height responses through altered carbon allocation and reduced reproductive performance during flowering and early grain setting [73].

4.4. Implications for Farmland Management Under the Future Projection

Research on variation in extreme climate events provides an important foundation for developing climate-adaptive farmland management. Historical analyses revealed that extreme climate events in the hilly region of southwest China had undergone significant changes, leading to greater instability in upland cropping systems [18,27]. Overall, these results highlight the need for climate-adaptive farmland management in subtropical regions to reduce vulnerability to thermal extremes and drought-related stresses.
The management implications differ across crop growing seasons. During the wheat growing season, warmer conditions (higher TXx and TNx) tended to alleviate thermal limitations and were positively associated with wheat biomass (Table S3), whereas strengthened cold extremes (Figure 3) may still constrain dry matter accumulation during overwintering and early spring regrowth. Moreover, although the increase in extreme precipitation intensity (Figure 4) might alleviate seasonal drought, abrupt thermal fluctuations could elevate frost damage risk in winter [72]. During the maize growing season, extreme warm indices and CDD increased markedly (Figure 3 and Figure 4), and these indices imposed negative impacts on maize (Table S4). This highlighted the potential risk of compound heat–drought stress for maize. Under the combined conditions of heat and drought, vegetation responded to the increased VPD by closing stomata to reduce water loss, but this also limits CO2 uptake and suppresses photosynthesis [30,74,75]. Meanwhile, soil water can be depleted rapidly, and the buffering capacity is limited in rainfed systems with shallow soils. As a result, compound drought–heat events could substantially decrease crop yields by lowering the harvest index, shortening the plant life cycle and altering seed number and size [62]. The 2022 Yangtze River basin drought exemplified this vulnerability, causing maize yield losses and even complete crop failure in Sichuan’s rainfed farmlands [76].
To further clarify the compound effects of heat and water conditions, we conducted a simple interaction analysis (Table 3). The results showed that some interactions between extreme heat and moisture indicators were statistically significant for maize traits, especially biomass and height. In addition, a significant interaction between extreme heat and seasonal precipitation availability was detected for maize yield and aboveground biomass (p < 0.05), suggesting that precipitation conditions can modulate maize responses to extreme heat.
Importantly, the lagged responses identified in this study imply that antecedent hydrothermal conditions within a 1–2 month window can set stress levels at subsequent sensitive stages (Figure 9 and Figure 10), providing a practical basis for risk anticipation. To facilitate practical implementation, key actions include:
  • Strengthen frost risk management for wheat, especially during overwintering and early spring stages, by integrating frost early warning and flexible field operations.
  • Mitigate compound heat–drought stress for maize by prioritizing soil moisture conservation and reducing exposure during the hottest reproductive stages (e.g., sowing date adjustment and tolerant cultivars), and by improving effective soil water holding capacity in shallow soils, for example through residue incorporation and conservation tillage to increase soil organic matter and moisture storage, as well as practices that increase effective solum thickness to enhance rooting depth and water retention [77,78,79,80,81].
  • Use the 1–2-month lag window for early warning by monitoring antecedent dry spells (CDD), heavy rainfall events (RX1Day/RX5Day), and temperature extremes (TXx/TNx) before key stages, and linking these signals to stage-targeted responses.
This study, based on long-term meteorological and field production data, provided a basis for assessing the agricultural vulnerability and adaptive capacity in purple soil sloping farmlands. The findings could contribute to early warning systems for extreme climate events and comprehensive mitigation strategies under global warming. We note that the seasonal contrast between maize and wheat may also be influenced by broader background changes over the study period. Rising atmospheric CO2 could benefit C3 wheat more than C4 maize through higher photosynthesis and water-use efficiency [81], while management adaptation and technological change (e.g., cultivar improvement and agronomic practices) may shift sensitivity windows. However, these factors were not explicitly quantified in this study and warrant further investigation. Finally, although the crop dataset provides valuable field evidence in this region, the 20-year record limits inference on complex climate–crop interactions. Longer-term datasets and broader multi-site validation are therefore needed, especially because crop responses may reflect combined heat–moisture effects rather than isolated drivers.

5. Conclusions

In this study, the long term (1960–2024) trends of climate extremes were investigated, and the responses of crop traits (2005–2024) to climate extremes were clarified in the hilly area of subtropical China. Extreme temperature indices showed an overall warming tendency, with TXx increasing at 0.22 °C decade−1, while CDD showed a highly significant increasing trend (p < 0.01), implying a growing risk of seasonal drought. Persistence analysis suggested statistical long-term dependence for several indices, implying that recent directions of change may tend to continue under comparable statistical properties of the historical record, although this should not be interpreted as a deterministic forecast under non-stationary forcing.
Wheat and maize exhibited contrasting vulnerability across seasons. Warm extremes strengthened during the maize growing season, whereas precipitation frequency indices became more prominent during the wheat growing season. These changes contributed to greater interannual variability in crop production, with maize showing stronger sensitivity to climate extremes. Wheat responses indicated that modest winter warming can alleviate thermal limitations, but outcomes remained contingent on the occurrence of sudden cold extremes. The responses of crop traits also exhibited a 1–2 months lag, highlighting the importance of antecedent conditions for subsequent sensitive stages.
Based on these findings, we provide management recommendations for climate-resilient cropping. For winter wheat, priority actions include adjusting sowing dates and selecting varieties more tolerant to sudden cold and frost risk during overwintering and early spring regrowth, supported by strengthened frost early warning systems. For summer maize, priority actions include conserving soil moisture, optimizing sowing dates to reduce exposure during the hottest reproductive stages, and adopting heat- and drought-tolerant varieties to mitigate compound heat–drought stress. Importantly, the identified 1–2-month lag window provides a practical basis for early warning strategies that monitor antecedent extremes and trigger timely field responses.
This study should be interpreted within the scope of a single-site observational dataset from central Sichuan. Longer-term datasets and multi-site validation are still needed to strengthen inference on lag structures and compound climate impacts. Nevertheless, the framework and key insights may be applicable to other humid subtropical rainfed upland systems with shallow soils and uneven rainfall distribution.

Supplementary Materials

The following supporting information can be downloaded at: https://www.mdpi.com/article/10.3390/agronomy16050572/s1.

Author Contributions

Conceptualization, J.C., J.T. and L.C.; methodology, L.C. and X.Z.; software, L.C.; investigation, Y.W. and M.G.; resources, B.Z. and J.T.; data curation, Y.W. and L.C.; writing—original draft preparation, L.C.; writing—review and editing, J.T.; visualization, L.C.; supervision, J.C., M.S.A. and J.T.; funding acquisition, J.C., M.S.A. and J.T. All authors have read and agreed to the published version of the manuscript.

Funding

This research was funded by the National Key R&D Plan (Grant No. 2023YFF0806002), the Natural Science Foundation of China (42371039) and the Chinese Academy of Sciences President’s International Fellowship Initiative (2026PVB0095).

Data Availability Statement

The original contributions presented in this study are included in the article/Supplementary Materials. Further inquiries can be directed to the corresponding authors.

Acknowledgments

We sincerely thank the staff at Yanting Station for their support during the field investigation and measurements.

Conflicts of Interest

The authors declare no conflicts of interest.

References

  1. IPCC. Climate Change 2021: The Physical Science Basis; IPCC: Geneva, Switzerland, 2021. [Google Scholar]
  2. Camps-Valls, G.; Fernandez-Torres, M.A.; Cohrs, K.H.; Hoehl, A.; Castelletti, A.; Pacal, A.; Robin, C.; Martinuzzi, F.; Papoutsis, I.; Prapas, I.; et al. Artificial intelligence for modeling and understanding extreme weather and climate events. Nat. Commun. 2025, 16, 1919. [Google Scholar] [CrossRef] [PubMed]
  3. Li, S.; Wei, F.L.; Wang, Z.; Shen, J.H.; Liang, Z.; Wang, H.; Li, S.C. Spatial heterogeneity and complexity of the impact of extreme climate on vegetation in China. Sustainability 2021, 13, 5748. [Google Scholar] [CrossRef]
  4. Zou, X.Y.; Peng, X.Y.; Zhao, X.X.; Chang, C.P. The impact of extreme weather events on water quality: International evidence. Nat. Hazards 2023, 115, 1–21. [Google Scholar] [CrossRef]
  5. Shi, W.J.; Wang, M.L.; Liu, Y.T. Crop yield and production responses to climate disasters in China. Sci. Total Environ. 2021, 750, 141147. [Google Scholar] [CrossRef]
  6. Xiao, K.; Sun, Y.; Wu, W.; Zhou, X.W.; Zhang, Z.C.; Lai, Q.Y.; Huang, C.; Xiong, Z.H.; Xin, Q.C. Quantifying the contribution of triple compound extreme events to global yield loss of major staple crops from 1982 to 2016. J. Integr. Agric. 2025, 24, 4078–4099. [Google Scholar] [CrossRef]
  7. Chen, W.; Piao, J.L.; Chen, S.F.; Wang, L.; Zhao, W.; Wang, Z.K.; Wang, Q.L. Multi-scale variations and future projections of dry-wet conditions over the monsoon transitional zone in East Asia: A review. Fundam. Res. 2025, 5, 1597–1606. [Google Scholar] [CrossRef] [PubMed]
  8. Han, J.H.; Fang, S.B.; Wang, X.Y.; Zhuo, W.; Yu, Y.R.; Peng, X.F.; Zhang, Y.D. The impact of intra-annual temperature fluctuations on agricultural temperature extreme events and attribution analysis in mainland China. Sci. Total Environ. 2024, 949, 174904. [Google Scholar] [CrossRef]
  9. Xia, J.; Chen, J.; She, D.X. Impacts and countermeasures of extreme drought in the Yangtze River Basin in 2022. J. Hydraul. Eng. 2022, 53, 1143–1153. (In Chinese) [Google Scholar]
  10. Duan, A.; Zhong, Y.L.; Xu, G.D.; Yang, K.J.; Tian, B.M.; Wu, Y.L.; Bai, H.B.; Hu, E. Quantifying the 2022 extreme drought in the Yangtze River Basin using GRACE-FO. J. Hydrol. 2024, 630, 130680. [Google Scholar] [CrossRef]
  11. Li, C.L.; Wang, J.; Hu, R.C.; Yin, S.; Bao, Y.H.; Ayal, D.Y. Relationship between vegetation change and extreme climate indices on the Inner Mongolia Plateau, China, from 1982 to 2013. Ecol. Indic. 2018, 89, 101–109. [Google Scholar] [CrossRef]
  12. Ren, Z.K.; Zhao, H.R.; Mu, X.Z.; Xu, Q.X.; Shi, K.M.; Yang, G.L. Spatiotemporal variations of extreme weather events and climate drivers in the Three Gorges Reservoir Area and its surrounding regions from 1960 to 2020. Atmos. Res. 2024, 304, 107379. [Google Scholar] [CrossRef]
  13. Zhou, B.T.; Xu, Y.; Wu, J.; Dong, S.Y.; Shi, Y. Changes in temperature and precipitation extreme indices over China: Analysis of a high-resolution grid dataset. Int. J. Climatol. 2016, 36, 1051–1066. [Google Scholar] [CrossRef]
  14. Filahi, S.; Tanarhte, M.; Mouhir, L.; El Morhit, M.; Tramblay, Y. Trends in indices of daily temperature and precipitations extremes in Morocco. Theor. Appl. Climatol. 2016, 124, 959–972. [Google Scholar] [CrossRef]
  15. Zhang, X.Q.; Chen, Y.N.; Fang, G.H.; Xia, Z.H.; Li, Z.; Duan, W.L.; Xia, Q.Q. Increasing multiscale variability in extreme precipitation under global warming in the Tienshan Mountains, Central Asia. J. Hydrol. 2023, 626, 130158. [Google Scholar] [CrossRef]
  16. Ali, S.; Basit, A.; Umair, M.; Makanda, T.A.; Khan, F.U.; Shi, S.Q.; Jian, N. Spatio-temporal variations in trends of vegetation and drought changes in relation to climate variability from 1982 to 2019 based on remote sensing data from East Asia. J. Integr. Agric. 2023, 22, 3193–3208. [Google Scholar] [CrossRef]
  17. Christina, M.; Jones, M.R.; Versini, A.; Mézino, M.; Le Mézo, L.; Auzoux, S.; Soulié, J.C.; Poser, C.; Gérardeaux, E. Impact of climate variability and extreme rainfall events on sugarcane yield gap in a tropical Island. Field Crops Res. 2021, 274, 108326. [Google Scholar] [CrossRef]
  18. Zhang, S.B.; Bai, J.X.; Zhang, G.X.; Xia, Z.Q.; Wu, M.K.; Lu, H.D. Negative effects of soil warming, and adaptive cultivation strategies of maize: A review. Sci. Total Environ. 2023, 862, 160738. [Google Scholar] [CrossRef] [PubMed]
  19. Zhao, J.; Yang, Y. Average amount and stability of available agro-climate resources in the main maize cropping regions in China during 1981–2010. J. Meteorol. Res. 2018, 32, 146–156. [Google Scholar] [CrossRef]
  20. Li, Y.; Guan, K.Y.; Schnitkey, G.D.; DeLucia, E.; Peng, B. Excessive rainfall leads to maize yield loss of a comparable magnitude to extreme drought in the United States. Glob. Change Biol. 2019, 25, 2325–2337. [Google Scholar] [CrossRef]
  21. Lv, T.; Peng, S.; Liu, B.; Liu, Y.; Ding, Y. Planting suitability of China’s main grain crops under future climate change. Field Crops Res. 2023, 302, 109112. [Google Scholar] [CrossRef]
  22. Meng, H.; Qian, L.; Duan, K. Evaluating the impacts of flooding on crop yields by different meteorological indices: A regional case study in the middle-lower reach of the Yangtze River, China. Ecol. Indic. 2024, 162, 112068. [Google Scholar] [CrossRef]
  23. Shoukat, M.R.; Wang, J.J.; Habib-ur-Rahman, M.; Hui, X.; Hoogenboom, G.; Yan, H.J. Adaptation strategies for winter wheat production at farmer fields under a changing climate: Employing crop and multiple global climate models. Agric. Syst. 2024, 220, 104066. [Google Scholar] [CrossRef]
  24. Jing, J.; Zhao, T.; Wang, Y.; Sun, J.; Fu, B. Response of vegetation to extreme climate in the karst core areas of southwest China. China Environ. Sci. 2024, 44, 3353–3364. (In Chinese) [Google Scholar]
  25. Liu, L.Y.; Gou, X.H.; Wang, X.J.; Yang, M.X.; Qie, L.Y.; Pang, G.J.; Wei, S.H.; Zhang, F.; Li, Y.J.; Wang, Q.; et al. Relationship between extreme climate and vegetation in arid and semi-arid mountains in China: A case study of the Qilian Mountains. Agric. For. Meteorol. 2024, 348, 109938. [Google Scholar] [CrossRef]
  26. Wang, P.; Cheng, Q.P.; Jin, H.Y. Divergent vegetation variation and the response to extreme climate events in the National Nature Reserves in Southwest China, 1961–2019. Ecol. Indic. 2023, 150, 110247. [Google Scholar] [CrossRef]
  27. Zhu, B.; Kuang, F.H.; Gao, M.R.; Wang, T.; Wang, X.G.; Tang, J.L. Effects of soil thickness on productivity of sloping cropland of purple soil. Mt. Res. 2009, 27, 735–739. (In Chinese) [Google Scholar]
  28. Liu, H.W.; Tang, J.L.; Zhang, X.F.; Wang, R.; Zhu, B.; Li, N.W.; Liang, C.; Zhao, P. Seasonal variations of groundwater recharge in a small subtropical agroforestry watershed with horizontal sedimentary bedrock. J. Hydrol. 2021, 596, 125703. [Google Scholar] [CrossRef]
  29. Zhao, P.; Tang, X.Y.; Zhao, P.; Wang, C.; Tang, J.L. Tracing water flow from sloping farmland to streams using oxygen-18 isotope to study a small agricultural catchment in southwest China. Soil Tillage Res. 2013, 134, 180–194. [Google Scholar] [CrossRef]
  30. Chen, L.; Luo, Y.; Tang, J.L.; Zhang, X.F.; Liu, H.W.; Cui, J.F.; Zheng, J.; Dong, X.M. Determination of optimum solum thickness of sloping cropland for maize plantation in an Entisol based on water use strategy and plant traits. Agric. Water Manag. 2024, 299, 108867. [Google Scholar] [CrossRef]
  31. Wu, L.Z.; Zhao, C.Y.; Li, J.Y.; Yan, Y.Y.; Han, Q.F.; Li, C.F.; Zhu, J.T. Impact of extreme climates on land surface phenology in Central Asia. Ecol. Indic. 2023, 146, 109832. [Google Scholar] [CrossRef]
  32. Prado, K.; Holland, B.L.; McSpadden Gardener, B.; Lundquist, P.K.; Santiago, J.P.; VanBuren, R.; Rhee, S.Y. Building climate-resilient crops: Genetic, environmental, and technological strategies for heat and drought stress tolerance. J. Exp. Bot. 2025, 76, 4395–4413. [Google Scholar] [CrossRef]
  33. Zhou, J.; Xiang, Y.Z.; Sheng, X.J.; Wu, J.P. Effects of grazing on soil nematodes in grasslands: A global meta-analysis. J. Appl. Ecol. 2023, 60, 814–824. [Google Scholar] [CrossRef]
  34. Jiang, L.L.; Jiapaer, G.; Bao, A.M.; Guo, H.; Ndayisaba, F. Vegetation dynamics and responses to climate change and human activities in Central Asia. Sci. Total Environ. 2017, 599, 967–980. [Google Scholar] [CrossRef]
  35. Ndayisaba, F.; Guo, H.; Bao, A.M.; Guo, H.; Karamage, F.; Kayiranga, A. Understanding the spatial temporal vegetation dynamics in Rwanda. Remote Sens. 2016, 8, 129. [Google Scholar] [CrossRef]
  36. Liu, Z.T.; Li, X.H.; Yang, J.K. Analysis on spatiotemporal change characteristics and future trends of extreme precipitation events in Sichuan Basin. J. Chengdu Univ. Inf. Technol. 2022, 37, 456–463. (In Chinese) [Google Scholar]
  37. Li, L.C.; Yao, N.; Li, Y.; Liu, D.L.; Wang, B.; Ayantobo, O.O. Future projections of extreme temperature events in different sub-regions of China. Atmos. Res. 2019, 217, 150–164. [Google Scholar] [CrossRef]
  38. Wang, L.Y.; Chen, S.F.; Zhu, W.B.; Ren, H.; Zhang, L.J.; Zhu, L.Q. Spatiotemporal variations of extreme precipitation and its potential driving factors in China’s North-South Transition Zone during 1960–2017. Atmos. Res. 2021, 252, 105429. [Google Scholar] [CrossRef]
  39. Ding, Z.Y.; Wang, Y.Y.; Lu, R.J. An analysis of changes in temperature extremes in the Three River Headwaters region of the Tibetan Plateau during 1961–2016. Atmos. Res. 2018, 209, 103–114. [Google Scholar] [CrossRef]
  40. Brunner, L.; Voigt, A. Pitfalls in diagnosing temperature extremes. Nat. Commun. 2024, 15, 2087. [Google Scholar] [CrossRef]
  41. Stumpe, B.; Bechtel, B.; Heil, J.; Jörges, C.; Jostmeier, A.; Kalks, F.; Schwarz, K.; Marschner, B. Soil texture mediates the surface cooling effect of urban and peri-urban green spaces during a drought period in the city area of Hamburg (Germany). Sci. Total Environ. 2023, 897, 165228. [Google Scholar] [CrossRef]
  42. Bevacqua, E.; Zappa, G.; Lehner, F.; Zscheischler, J. Precipitation trends determine future occurrences of compound hot-dry events. Nat. Clim. Change 2022, 12, 350–355. [Google Scholar] [CrossRef]
  43. Shrestha, A.; Subedi, B.; Shrestha, B.; Shrestha, A.; Maharjan, A.; Bhattarai, P.K.; Pandey, V.P. Projected trends in hydro-climatic extremes in small-to-mid-sized watersheds in eastern Nepal based on CMIP6 outputs. Clim. Dyn. 2023, 61, 4991–5015. [Google Scholar] [CrossRef]
  44. Zhao, W.X.; Chou, J.M.; Li, J.N.; Xu, Y.; Li, Y.M.; Hao, Y.D. Impacts of extreme climate events on future rice yields in global major rice-producing regions. Int. J. Environ. Res. Public Health 2022, 19, 4437. [Google Scholar] [CrossRef] [PubMed]
  45. Zhang, H.C.; Zhou, Y.S.; Lai, Z.Y.; Deng, G. Overshooting convection and torrential precipitation associated with the mesoscale northerly low-level jets in the Sichuan Basin, China. Atmos. Res. 2024, 310, 107604. [Google Scholar] [CrossRef]
  46. Chen, C.N.; Wang, L.Y.; Zhu, W.B.; Zhu, L.Q.; Dong, Q.D.; Li, Y.H.; Ren, H. Characteristics of extreme climate change in the Qinling-Daba mountains and its impact on vegetation dynamics. J. Soil Water Conserv. 2024, 38, 276–287. (In Chinese) [Google Scholar]
  47. Hong, C.C.; Chang, T.C.; Hsu, H.H. Enhanced relationship between the tropical Atlantic SST and the summertime western North Pacific subtropical high after the early 1980s. J. Geophys. Res. Atmos. 2014, 119, 3715–3722. [Google Scholar] [CrossRef]
  48. Li, B.F.; Chen, Y.N.; Chen, Z.S.; Xiong, H.G.; Lian, L.S. Why does precipitation in northwest China show a significant increasing trend from 1960 to 2010? Atmos. Res. 2016, 167, 275–284. [Google Scholar] [CrossRef]
  49. Malyshev, A.V.; Blume-Werry, G.; Spiller, O.; Smiljanić, M.; Weigel, R.; Kolb, A.; Nze, B.Y.; Märker, F.; Carl-Fried, F.; Sommer, J.F.; et al. Warming nondormant tree roots advances aboveground spring phenology in temperate trees. New Phytol. 2023, 240, 2276–2287. [Google Scholar] [CrossRef]
  50. Mulder, C.P.H.; Iles, D.T.; Rockwell, R.F. Increased variance in temperature and lag effects alter phenological responses to rapid warming in a subarctic plant community. Glob. Change Biol. 2017, 23, 801–814. [Google Scholar] [CrossRef]
  51. Zhang, B.W.; Zhou, M.H.; Zhu, B.; Xiao, Q.Y.; Zheng, X.H.; Zhang, J.B.; Müller, C.; Butterbach-Bahl, K. Soil clay minerals: An overlooked mediator of gross N transformations in Regosolic soils of subtropical montane landscapes. Soil Biol. Biochem. 2022, 168, 108612. [Google Scholar] [CrossRef]
  52. Wang, T.; Zhu, B.; Kuang, F.H. Reducing interflow nitrogen loss from hillslope cropland in a purple soil hilly region in southwestern China. Nutr. Cycl. Agroecosystems 2012, 93, 285–295. [Google Scholar] [CrossRef]
  53. Zhang, T.; Yang, S.B.; Guo, R.; Guo, J.X. Warming and nitrogen addition alter photosynthetic pigments, sugars and nutrients in a temperate meadow ecosystem. PLoS ONE 2016, 11, e0155375. [Google Scholar]
  54. Wang, R.; Zhao, C.; Asseng, S.; Liu, B.; Ruane, A.C.; Cong, J.; Wang, X.; Liu, Z.; Zhao, J.; Yang, X. Winter dormant wheat will benefit from mean temperature increase of 2 °C when well-watered and fertilized in the main producing regions of China. Glob. Change Biol. 2025, 31, e70324. [Google Scholar] [CrossRef]
  55. Han, W.; Wang, S.; Ma, L.; Ali, M.F.; Lin, X.; Wang, D. Four decades of temperature extremes reshape regional wheat yields and adaptation in China. J. Environ. Manag. 2025, 389, 126271. [Google Scholar] [CrossRef]
  56. Ghalami, R.Z.; Duszyn, M.; Karpiński, S. Absorption of energy in excess, photoinhibition, transpiration, and foliar heat emission feedback loops during global warming. Cells 2026, 15, 75. [Google Scholar] [CrossRef]
  57. Goel, K.; Kundu, P.; Sharma, P.; Zinta, G. Thermosensitivity of pollen: A molecular perspective. Plant Cell Rep. 2023, 42, 843–857. [Google Scholar] [CrossRef]
  58. Niu, S.D.; Du, X.; Wei, D.J.; Liu, S.S.; Tang, Q.; Bian, D.H.; Zhang, Y.R.; Cui, Y.H.; Gao, Z. Heat stress after pollination reduces kernel number in maize by insufficient assimilates. Front. Genet. 2021, 12, 728166. [Google Scholar] [CrossRef]
  59. Bruhn, D.; Newman, F.; Hancock, M.; Povlsen, P.; Slot, M.; Sitch, S.; Drake, J.; Weedon, G.P.; Clark, D.B.; Pagter, M.; et al. Nocturnal plant respiration is under strong non-temperature control. Nat. Commun. 2022, 13, 5650. [Google Scholar] [CrossRef] [PubMed]
  60. Claesson, J.; Nycander, J. Combined effect of global warming and increased CO2-concentration on vegetation growth in water-limited conditions. Ecol. Model. 2013, 256, 23–30. [Google Scholar] [CrossRef]
  61. Sun, W.Y.; Song, X.Y.; Mu, X.M.; Gao, P.; Wang, F.; Zhao, G.J. Spatiotemporal vegetation cover variations associated with climate change and ecological restoration in the Loess Plateau. Agric. For. Meteorol. 2015, 209, 87–99. [Google Scholar] [CrossRef]
  62. Cohen, I.; Zandalinas, S.I.; Huck, C.; Fritschi, F.B.; Mittler, R. Meta-analysis of drought and heat stress combination impact on crop yield and yield components. Physiol. Plant. 2021, 171, 66–76. [Google Scholar] [CrossRef]
  63. Naylor, D.; Coleman-Derr, D. Drought stress and root-associated bacterial communities. Front. Plant Sci. 2018, 8, 2223. [Google Scholar] [CrossRef]
  64. Zahra, N.; Wahid, A.; Hafeez, M.B.; Ullah, A.; Siddique, K.H.M.; Farooq, M. Grain development in wheat under combined heat and drought stress: Plant responses and management. Environ. Exp. Bot. 2021, 188, 104517. [Google Scholar] [CrossRef]
  65. Bi, W.X.; Weng, B.S.; Yan, D.H.; Wang, M.K.; Wang, H.; Jing, L.S.; Yan, S.Y. Soil phosphorus loss increases under drought-flood abrupt alternation in summer maize planting area. Agric. Water Manag. 2022, 262, 107426. [Google Scholar] [CrossRef]
  66. Nguyen, L.T.T.; Osanai, Y.; Anderson, I.C.; Bange, M.P.; Tissue, D.T.; Singh, B.K. Flooding and prolonged drought have differential legacy impacts on soil nitrogen cycling, microbial communities and plant productivity. Plant Soil 2018, 431, 371–387. [Google Scholar] [CrossRef]
  67. Xiao, Q.Y.; Dong, Z.X.; Han, Y.; Hu, L.; Hu, D.N.; Zhu, B. Impact of soil thickness on productivity and nitrate leaching from sloping cropland in the upper Yangtze River Basin. Agric. Ecosyst. Environ. 2021, 311, 107266. [Google Scholar] [CrossRef]
  68. Madamombe, S.M.; Nyamadzawo, G.; Oborn, I.; Smucker, A.; Chirinda, N.; Kihara, J.; Nkurunziza, L. Seasonal rainfall patterns affect rainfed maize production more than management of soil moisture and different plant densities on sandy soils of semi-arid regions. Field Crops Res. 2025, 331, 110007. [Google Scholar] [CrossRef]
  69. Shim, J.H.; Pendall, E.; Morgan, J.A.; Ojima, D.S. Wetting and drying cycles drive variations in the stable carbon isotope ratio of respired carbon dioxide in semi-arid grassland. Oecologia 2009, 160, 321–333. [Google Scholar] [CrossRef]
  70. Paudel, K.P.; Andersen, P. Response of rangeland vegetation to snow cover dynamics in Nepal Trans Himalaya. Clim. Change 2013, 117, 149–162. [Google Scholar] [CrossRef]
  71. Chen, T.; de Jeu, R.A.M.; Liu, Y.Y.; van der Werf, G.R.; Dolman, A.J. Using satellite based soil moisture to quantify the water driven variability in NDVI: A case study over mainland Australia. Remote Sens. Environ. 2014, 140, 330–338. [Google Scholar] [CrossRef]
  72. Bojórquez, A.; Martínez-Yrízar, A.; Alvarez-Yépiz, J.C. A landscape assessment of frost damage in the northmost Neotropical dry forest. Agric. For. Meteorol. 2021, 308, 108562. [Google Scholar] [CrossRef]
  73. Lainé, C.M.S.; AbdElgawad, H.; Beemster, G.T. A meta-analysis reveals differential sensitivity of cold stress responses in the maize leaf. Plant Cell Environ. 2023, 46, 2432–2449. [Google Scholar] [CrossRef]
  74. Yuan, W.P.; Zheng, Y.; Piao, S.L.; Ciais, P.; Lombardozzi, D.; Wang, Y.P.; Ryu, Y.; Chen, G.X.; Dong, W.J.; Hu, Z.M.; et al. Increased atmospheric vapor pressure deficit reduces global vegetation growth. Sci. Adv. 2019, 5, eaax1396. [Google Scholar] [CrossRef]
  75. Williams, A.P.; Cook, E.R.; Smerdon, J.E.; Cook, B.I.; Abatzoglou, J.T.; Bolles, K.; Baek, S.H.; Badger, A.M.; Livneh, B. Large contribution from anthropogenic warming to an emerging North American megadrought. Science 2020, 368, 314–318. [Google Scholar] [CrossRef]
  76. Xing, L.S.; Zhao, R.X.; Sun, H.Q.; Li, M.; Tan, Z.Y. Analysis of drought characteristics and comparison of historical typical years with 2022 drought in the Yangtze River Basin. Nat. Hazards 2024, 120, 3699–3718. [Google Scholar] [CrossRef]
  77. Tang, J.L.; Zhu, B.; Wang, T.; Cheng, X.Q.; Gao, M.R.; Lin, H.R. Subsurface flow processes in sloping cropland of purple soil. J. Mt. Sci. 2012, 9, 1–9. [Google Scholar] [CrossRef]
  78. Malik, R.; Khatri, K.; Saxena, R.; Warkar, S.G. Fabrication of carboxymethyl tamarind kernel gum-based hydrogel and its applicability in different types of soils for agronomy. Int. J. Biol. Macromol. 2024, 280, 135616. [Google Scholar] [CrossRef] [PubMed]
  79. Pramanick, B.; Kumar, M.; Naik, B.M.; Singh, S.K.; Kumar, M.; Singh, S.V. Soil carbon-nutrient cycling, energetics, and carbon footprint in calcareous soils with adoption of long-term conservation tillage practices and cropping systems diversification. Sci. Total Environ. 2024, 912, 169421. [Google Scholar] [CrossRef] [PubMed]
  80. Wang, J.G.; Wei, K.; Jing, Y.L.; Wang, Y.L.; Yan, J.L.; Wang, T.; Tang, J.L.; Zhu, B. Soil microbivorous nematodes contribute to the formation of microbial necromass carbon under full straw return. Agric. Ecosyst. Environ. 2026, 396, 109975. [Google Scholar] [CrossRef]
  81. Ancín, M.; Gámez, A.L.; Jauregui, I.; Galmes, J.; Sharwood, R.E.; Erice, G.; Ainsworth, E.A.; Tissue, D.T.; Sanz-Sáez, A.; Aranjuelo, I. Does the response of Rubisco and photosynthesis to elevated CO2 change with unfavourable environmental conditions? J. Exp. Bot. 2024, 75, 7351–7364. [Google Scholar] [CrossRef]
Figure 1. Interannual variation in the extreme temperature indices in the hilly area of southwest China during 1960–2024.
Agronomy 16 00572 g001
Figure 2. Interannual variation in the extreme precipitation indices in the hilly area of southwest China during 1960–2024.
Agronomy 16 00572 g002
Figure 3. Interannual variation in different growing seasons in the extreme temperature indices in the hilly area of southwest China during 1960–2024.
Agronomy 16 00572 g003
Figure 4. Interannual variation in different growing seasons in the extreme precipitation indices in the hilly area of southwest China during 1960–2024.
Agronomy 16 00572 g004
Figure 5. Monthly variation in the extreme climate indices in the hilly area of southwest China during 2005–2024.
Agronomy 16 00572 g005
Figure 6. Crop traits from 2005 to 2024: (a) yield; (b) aboveground biomass; (c) thousand-kernel weight of wheat / hundred-kernel weight of maize; (d) plant height.
Agronomy 16 00572 g006
Figure 7. Correlation analysis of extreme temperature indices and Mantel test analysis for crop production: (a) wheat; (b) maize. * and ** indicate statistical significance at p < 0.05 and p < 0.01, respectively.
Agronomy 16 00572 g007
Figure 8. Correlation analysis of extreme precipitation indices and Mantel test analysis for crop production: (a) wheat; (b) maize. * and ** indicate statistical significance at p < 0.05 and p < 0.01, respectively.
Agronomy 16 00572 g008
Figure 9. Time-lag coefficients of wheat at different growth stages with contemporaneous and preceding three-month extreme temperature and extreme precipitation indices. Note: “Lag0” indicates no time lag and “Lag1–3” indicates a time lag of 1–3 months. Star symbol (*) indicates the correlations passed the significant test at the 0.05 confidence level, star symbol (**) indicates the correlations passed the significant test at the 0.01 confidence level, and tar symbol (***) indicates the correlations passed the significant test at the 0.001 confidence level.
Agronomy 16 00572 g009
Figure 10. Time-lag coefficients of maize at different growth stages with contemporaneous and preceding three-months extreme temperature and extreme precipitation indices. Note: “Lag0” indicates no time lag and “Lag1–3” indicates a time lag of 1–3 months. Star symbol (*) indicates the correlations passed the significant test at the 0.05 confidence level, and star symbol (**) indicates the correlations passed the significant test at the 0.01 confidence level.
Agronomy 16 00572 g010
Figure 11. Model-averaged importance of the predictors of the effects of extreme temperature indices on different crops: (a) yield of wheat; (b) aboveground biomass of wheat; (c) thousand-kernel weight of wheat; (d) plant height of wheat; (e) yield of maize; (f) aboveground biomass of maize; (g) hundred-kernel weight of maize; (h) plant height of maize.
Agronomy 16 00572 g011
Figure 12. Model-averaged predictors of importance of extreme precipitation indices on different crops: (a) yield of winter wheat; (b) aboveground biomass of winter wheat; (c) thousand-kernel weight of winter wheat; (d) height of winter wheat; (e) yield of summer maize; (f) aboveground biomass of summer maize; (g) hundred-kernel weight of summer maize; (h) height of summer maize.
Agronomy 16 00572 g012
Table 1. Definitions of 20 climate extremes.
Index ClassificationIndexNameDefinitionUnit
Extreme temperature warm indicesTXxMax TmaxAnnual/monthly maximum value of daily maximum temperature°C
TXnMin TmaxAnnual/monthly minimum value of daily maximum temperature°C
SU25Summer daysAnnual count of days when TX (daily maximum temperature) > 25 °Cd
TR20Tropical nightsAnnual count of days when TN (daily minimum temperature) > 20 °Cd
Extreme temperature cold indicesTNxMax TminAnnual/monthly maximum value of daily minimum temperature°C
TNnMin TminAnnual/monthly minimum value of daily minimum temperature°C
FD0Frost daysAnnual count of days when TN (daily minimum) < 0 °Cd
Other extreme temperature indicesGSLGrowing season LengthAnnual count between first span of at least 6 days with TG > 5 °C and first span of 6 days with TG < 5 °Cd
DTRDiurnal temperature rangeDaily temperature range: monthly mean difference between Tmax and Tmin°C
Extreme precipitation frequency indicesR10Precipitation daysPrecipitation days ≥ 10 mmd
R20Heavy precipitation daysPrecipitation days ≥ 20 mmd
R25Very heavy precipitation daysPrecipitation days ≥ 25 mmd
CDDConsecutive dry daysMaximum number of consecutive dry days (precipitation < 1.0 mm)d
CWDConsecutive wet daysMaximum number of consecutive wet days (precipitation ≥ 1.0 mm)d
Extreme precipitation intensity indicesRX1DayMaximum one-day precipitationAnnual/monthly maximum 1-day precipitationmm
RX5DayMaximum five-day precipitationAnnual/monthly maximum consecutive 5-day precipitationmm
R95pVery wet daysAnnual total PRCP > 95th percentilemm
R99pExtremely wet daysAnnual total PRCP > 99th percentilemm
PRCPTOTTotal wet-day precipitationAnnual total wet-day precipitation (where precipitation is ≥1 mm)mm
SDIISimple daily intensity indexAnnual total precipitation divided by the number of wet daysmm/d
Table 2. The future trends of extreme climate indices in the hilly area of southwest China.
Extreme Temperature IndicesExtreme Precipitation Indices
IndicesZHIndicesZH
TXx1.8060.825R10−0.4360.637
TXn−0.4130.659R20−0.0790.572
SU253.0010.807R250.3910.754
TR20−5.8480.973CDD2.0660.735
TNx−4.1501.030CWD−0.9680.572
TNn−5.4630.837RX1Day1.8620.373
FD04.1160.892RX5Day1.1660.778
GSL−0.7080.649R95p1.1780.756
DTR5.8710.917R99p1.6470.818
PRCPTOT0.2430.760
SDII0.6450.788
Table 3. Interaction effects of temperature and precipitation extremes on maize traits.
IndicesβpR2
YieldTXx × CDD−6.020.890.10
TXx × PRCPTOT56.240.030.43
TNx × CDD2.970.960.35
TNx × PRCPTOT46.090.170.51
BiomassTXx × CDD−70.060.050.18
TXx × PRCPTOT125.920.030.20
TNx × CDD−37.270.790.08
TNx × PRCPTOT87.660.450.14
HKWTXx × CDD−0.850.540.26
TXx × PRCPTOT1.710.190.63
TNx × CDD−0.370.820.52
TNx × PRCPTOT0.950.400.71
HeightTXx × CDD−14.210.000.49
TXx × PRCPTOT6.360.610.04
TNx × CDD−14.000.050.42
TNx × PRCPTOT11.310.170.09
Note: β denotes the regression coefficient (main and interaction effects), p denotes the corresponding significance level (HC3 robust), and R2 denotes model explanatory power adjusted for model complexity.
Disclaimer/Publisher’s Note: The statements, opinions and data contained in all publications are solely those of the individual author(s) and contributor(s) and not of MDPI and/or the editor(s). MDPI and/or the editor(s) disclaim responsibility for any injury to people or property resulting from any ideas, methods, instructions or products referred to in the content.