Article

Biochar and Matric Suction: Modulators of Soil Resistance and Resilience Under Uniaxial Compression Loading Test

1
College of Land and Environment, Shenyang Agricultural University, Shenyang 110866, China
2
Jilin Institute of Meteorological Sciences, Changchun 130062, China
*
Authors to whom correspondence should be addressed.
Agronomy 2026, 16(5), 499; https://doi.org/10.3390/agronomy16050499
Submission received: 9 January 2026 / Revised: 11 February 2026 / Accepted: 23 February 2026 / Published: 24 February 2026
(This article belongs to the Section Soil and Plant Nutrition)

Abstract

Intensive agricultural mechanization in Northeast China has exacerbated soil compaction and degraded water retention. Although biochar modifies soil hydraulics, its combined effect with matric suction on compressive behavior remains unclear. This study investigated the hydraulic and mechanical responses of repacked sandy clay brown soil to biochar (0, 0.5, 1 g kg−1) under varying matric suction (6–1000 kPa). We utilized water retention curves and uniaxial compression tests to assess mechanical properties, including pre-compression stress (σp), penetration resistance (PR), compression index (Cc) and swelling index (Cs). Additionally, an integrated model using the Entropy Weight Method (EWM), the Technique for Order Preference by Similarity to Ideal Solution (TOPSIS), and the Adversarial Interpretive Structure Model (AISM) was developed to evaluate soil resistance and resilience. Results indicated that 1 g kg−1 biochar significantly enhanced field capacity (θFC) and readily extractable water (θMRE) (p < 0.05). While individual factors influenced all mechanical properties, the biochar–suction interaction significantly affected pre-compression stress and the compression index (p < 0.05). The model identified 1 g kg−1 biochar at 1000 kPa suction as the optimal combination for maximizing soil structural stability. These findings highlight the critical role of biochar–matric suction interactions in accurately assessing and managing soil mechanical behavior.

1. Introduction

The black soil region of Northeast China, one of the four largest such regions globally, encompasses Heilongjiang and Jilin Provinces, the northeastern part of Liaoning Province, and the “Eastern Four Leagues” of Inner Mongolia [1]. This vast area is characterized by flat to gently undulating terrain, a topography ideal for mechanized agriculture, making it a key area for this development in China [2]. However, this intensive mechanization has led to significant adverse effects, notably increased soil compaction and reduced soil–water retention capacity.
Within this broader region, brown soils are of particular importance in Liaoning Province. Brown soils cover 6.8 Mha, approximately 50% of Liaoning’s total area (14.8 Mha), and contribute up to 60% of the province’s total spring maize yield (11.7 Mt) [3]. Despite their importance, brown soils exhibit an inherent vulnerability to severe compaction and structural degradation, driven by a synergistic combination of factors. Physically, the medium-textured matrix, coupled with declining soil organic matter (SOM) and the prevalence of a legacy plow pan, provides a weak structural foundation [4,5]. Environmentally, this fragility is exacerbated by humid summers and intensive freeze–thaw cycles, the latter of which typically loosens only the topsoil while leaving the subsoil persistently compacted [5]. Anthropogenically, the frequent passage of heavy machinery under moist conditions, combined with a long-term reliance on shallow tillage, has rendered the soil highly sensitive to external loading [6,7]. Collectively, these factors result in a fragile soil structure that possesses limited natural recovery capacity once degraded.
Biochar, a porous and stable carbon-rich substance, is produced from the pyrolysis of plant and animal biomass under oxygen-limited conditions [8,9]. Its inherent physical characteristics, notably high porosity and large surface area, can lead to enhancements in soil physical properties such as overall porosity, bulk density, and aggregate stability. These structural modifications, in turn, exert a texture-dependent influence on soil hydrological functions, particularly water retention and hydraulic conductivity [8,10]. In coarse-textured soils, biochar typically reduces excessive hydraulic conductivity by filling macropores—a transition that enhances water retention capacity [11,12]. While biochar also improves retention in clayey soils (e.g., increasing field capacity by up to 20%), the magnitude of this improvement is typically smaller or more incremental compared to coarser textures [11,13]. Conversely, in fine-textured soils, pore-filling or particle-swelling effects can significantly decrease saturated hydraulic conductivity, potentially impairing drainage and aeration [13,14]. Furthermore, under specific conditions—such as the application of almond shell biochar to loamy sand—coarser particles or inherent hydrophobicity may temporarily reduce moisture retention in the short term [15]. Consequently, the use of biochar as a strategy for managing plant water availability [9] must be carefully tailored to the specific soil texture and matrix properties.
Research indicates that biochar amendments can increase soil field capacity (θFC) and several related metrics of water availability, such as total available water (TAW), plant available water (PAW), readily available water (RAW), and relative available water (RFC) [16,17,18]. Beyond these enhancements, biochar often demonstrates superior efficacy in improving soil physical quality compared to traditional organic amendments like compost or vermicompost. Recent comparative studies have shown that biochar significantly optimizes water availability metrics, even in challenging textures like sandy-loam, while offering greater long-term stability due to its slower degradation rate in the soil matrix [10]. However, the impact of biochar is not uniformly positive across all soil moisture parameters or conditions. For instance, ref. [19] observed no significant impact on soil moisture content at different tensions, even 30 months after biochar incorporation into a sandy loam. Supporting this variability, some studies report no significant effects on the permanent wilting point (θPWP) or maximum readily extractable water (θMRE) [18]. These contrasting findings, situated against the backdrop of biochar’s high potential as a persistent soil improver, underscore the need for further investigation into the effects of biochar on soil–water retention characteristics and associated parameters.
Previous studies suggest that incorporating biochar into soil can not only alter water retention characteristics but also improve important geotechnical properties [20,21,22]. Critical among these geotechnical properties are compressibility and swelling, which fundamentally influence the soil’s ability to withstand mechanical stresses (resistance) and recover from deformation (resilience) [23].
The capacity of soil to exhibit such resistance and resilience is characterized by several key indicators. Pre-compression stress (σp) is recognized as a measure of the soil’s inherent load-bearing capacity and thus its resistance to new compressive forces [24]. The compression index (Cc) further quantifies soil susceptibility to compaction under applied loads, providing insight into its structural resistance [25]. Penetration resistance (PR) also serves to assess the degree of soil compaction, a key factor governing soil strength and its resistance to root penetration, as well as influencing water infiltration and availability [26,27,28]. In contrast, the swelling index (Cs) indicates the soil’s ability to rebound upon stress removal, reflecting its mechanical resilience [29].
The influence of biochar on soil mechanical properties is complex, with reports in the literature presenting conflicting outcomes. Some research indicates that biochar enhances soil strength and resistance to compaction. For instance, ref. [20] reported that adding biochar to landfill cover soil increased its shear strength and reduced compressibility. Similarly, ref. [30] observed a reduction in the compression index during uniaxial compression tests, signifying improved resistance to compaction. Conversely, other studies have documented a weakening of soil mechanical properties following biochar application. Ref. [31] demonstrated a decrease in shear strength after incorporating three different biochar types into a clay loam soil, while other research has also linked biochar to decreased soil penetration resistance and overall mechanical strength [32,33]. Further complicating the picture, some studies have found no significant effect of biochar on key parameters like soil penetration resistance [34].
The divergent findings on biochar’s influence on soil mechanical properties may be attributed to several factors. A primary source of this variability is the wide range of biochar application rates and particle sizes employed across different studies. Furthermore, the complex interplay between biochar and ambient soil conditions, particularly matric suction, has often been overlooked. Finally, evaluations have typically relied on individual, and at times conflicting, indicators rather than a single, comprehensive index to evaluate soil resistance and resilience. Therefore, to resolve these inconsistencies and advance understanding, future research should utilize comprehensive evaluation models. Such models are essential for systematically analyzing the combined effects of biochar properties and soil matric suction on the overall mechanical behavior of soil. This approach will provide a more holistic assessment than is possible with single-metric evaluations.
Multi-criteria decision making (MCDM) provides a reliable framework for navigating trade-offs among conflicting objectives [35]. A prominent method within this framework is the Technique for Order Preference by Similarity to Ideal Solution (TOPSIS), which is widely recognized for its effectiveness in ranking and selecting alternatives [36]. A critical step in applying multi-criteria methods is the determination of factor weights [37]. A notable limitation of the conventional TOPSIS model is that this weight allocation process can be highly subjective, potentially compromising the reliability of the outcomes [38]. To address this challenge, the Entropy Weight Method (EWM) provides an objective approach. EWM derives criteria weights based on the intrinsic information within the dataset, thereby enhancing the dependability of the final assessment [39].
The Adversarial Interpretive Structure Model (AISM) is an extension of the conventional Interpretative Structural Model (ISM). Its primary advantage is the ability to present complex relationships in a clear, graphical format that is often more intuitive than raw text, tables, or mathematical notations. The AISM methodology involves analyzing the results from an ISM and then applying a set of adversarial rules. These rules, based on opposing cause-and-effect priorities, generate a pair of contrasting hierarchical diagrams, offering a dual perspective on the system’s structure [40]. Integrating AISM with the EWM–TOPSIS model provides a significant advantage for evaluating complex scenarios. The AISM component translates the quantitative rankings from the EWM–TOPSIS analysis into intuitive hierarchical diagrams. This graphical representation enhances the readability of the findings and clearly visualizes the relative performance of numerous alternatives.
EWM combined with the TOPSIS model (EWM–TOPSIS) is widely applied in agriculture, particularly for optimizing irrigation and fertilizer rates [41]. Building on this, ref. [42] recently utilized the EWM–TOPSIS model to comprehensively evaluate conflicting indicators of soil resistance under varied soil conditions and organic material levels. A related integrated approach, EWM–TOPSIS–AISM, has also been successfully used in similar agricultural contexts, such as optimizing treatments [38]. However, despite these parallel applications, the potential of the EWM–TOPSIS–AISM model for assessing soil resistance and resilience remains largely unexplored.
The primary objectives of this study were to (1) investigate the effects of biochar and matric suction on key soil mechanical properties regarding resistance and resilience; and (2) develop and implement an integrated EWM–TOPSIS–AISM framework to evaluate and identify the optimal biochar–suction combination for enhancing soil structural stability. We hypothesized that (1) biochar addition optimizes soil pore-size distribution and enhances water retention and (2) a synergistic interaction exists between biochar and matric suction, where their combined effect on soil resistance and resilience can be systematically quantified and prioritized through the proposed EWM–TOPSIS–AISM model.

2. Materials and Methods

2.1. Soils and Biochar

The brown soil used in this study was collected from the topsoil layer (0–20 cm) at an experimental site at Shenyang Agricultural University, Liaoning Province, China (123°57′ E, 41°83′ N). The study site is characterized by a temperate continental monsoon climate, with a mean annual temperature (MAT) of 7.6 °C and mean annual precipitation (MAP) of 730 mm. Prior to the experiment, the field had been under continuous maize (Zea mays L.) monoculture for 15 years, during which all crop residues were removed and only synthetic compound fertilizers were applied.
In the laboratory, the collected samples were air-dried, crushed, and passed through a 2 mm sieve prior to use. Soil bulk density (BD) was determined using the core method [43]. Particle size distribution was determined via the pipette method based on Stokes’ law [43]. Soil pH was measured potentiometrically in a 2.5:1 (w/v) soil-to-water suspension [44]. Soil organic carbon (SOC) content was measured by dry combustion using an elemental analyzer (Vario EL III, Hanau, Germany) [45]. Key physicochemical properties of the soil are summarized in Table 1.
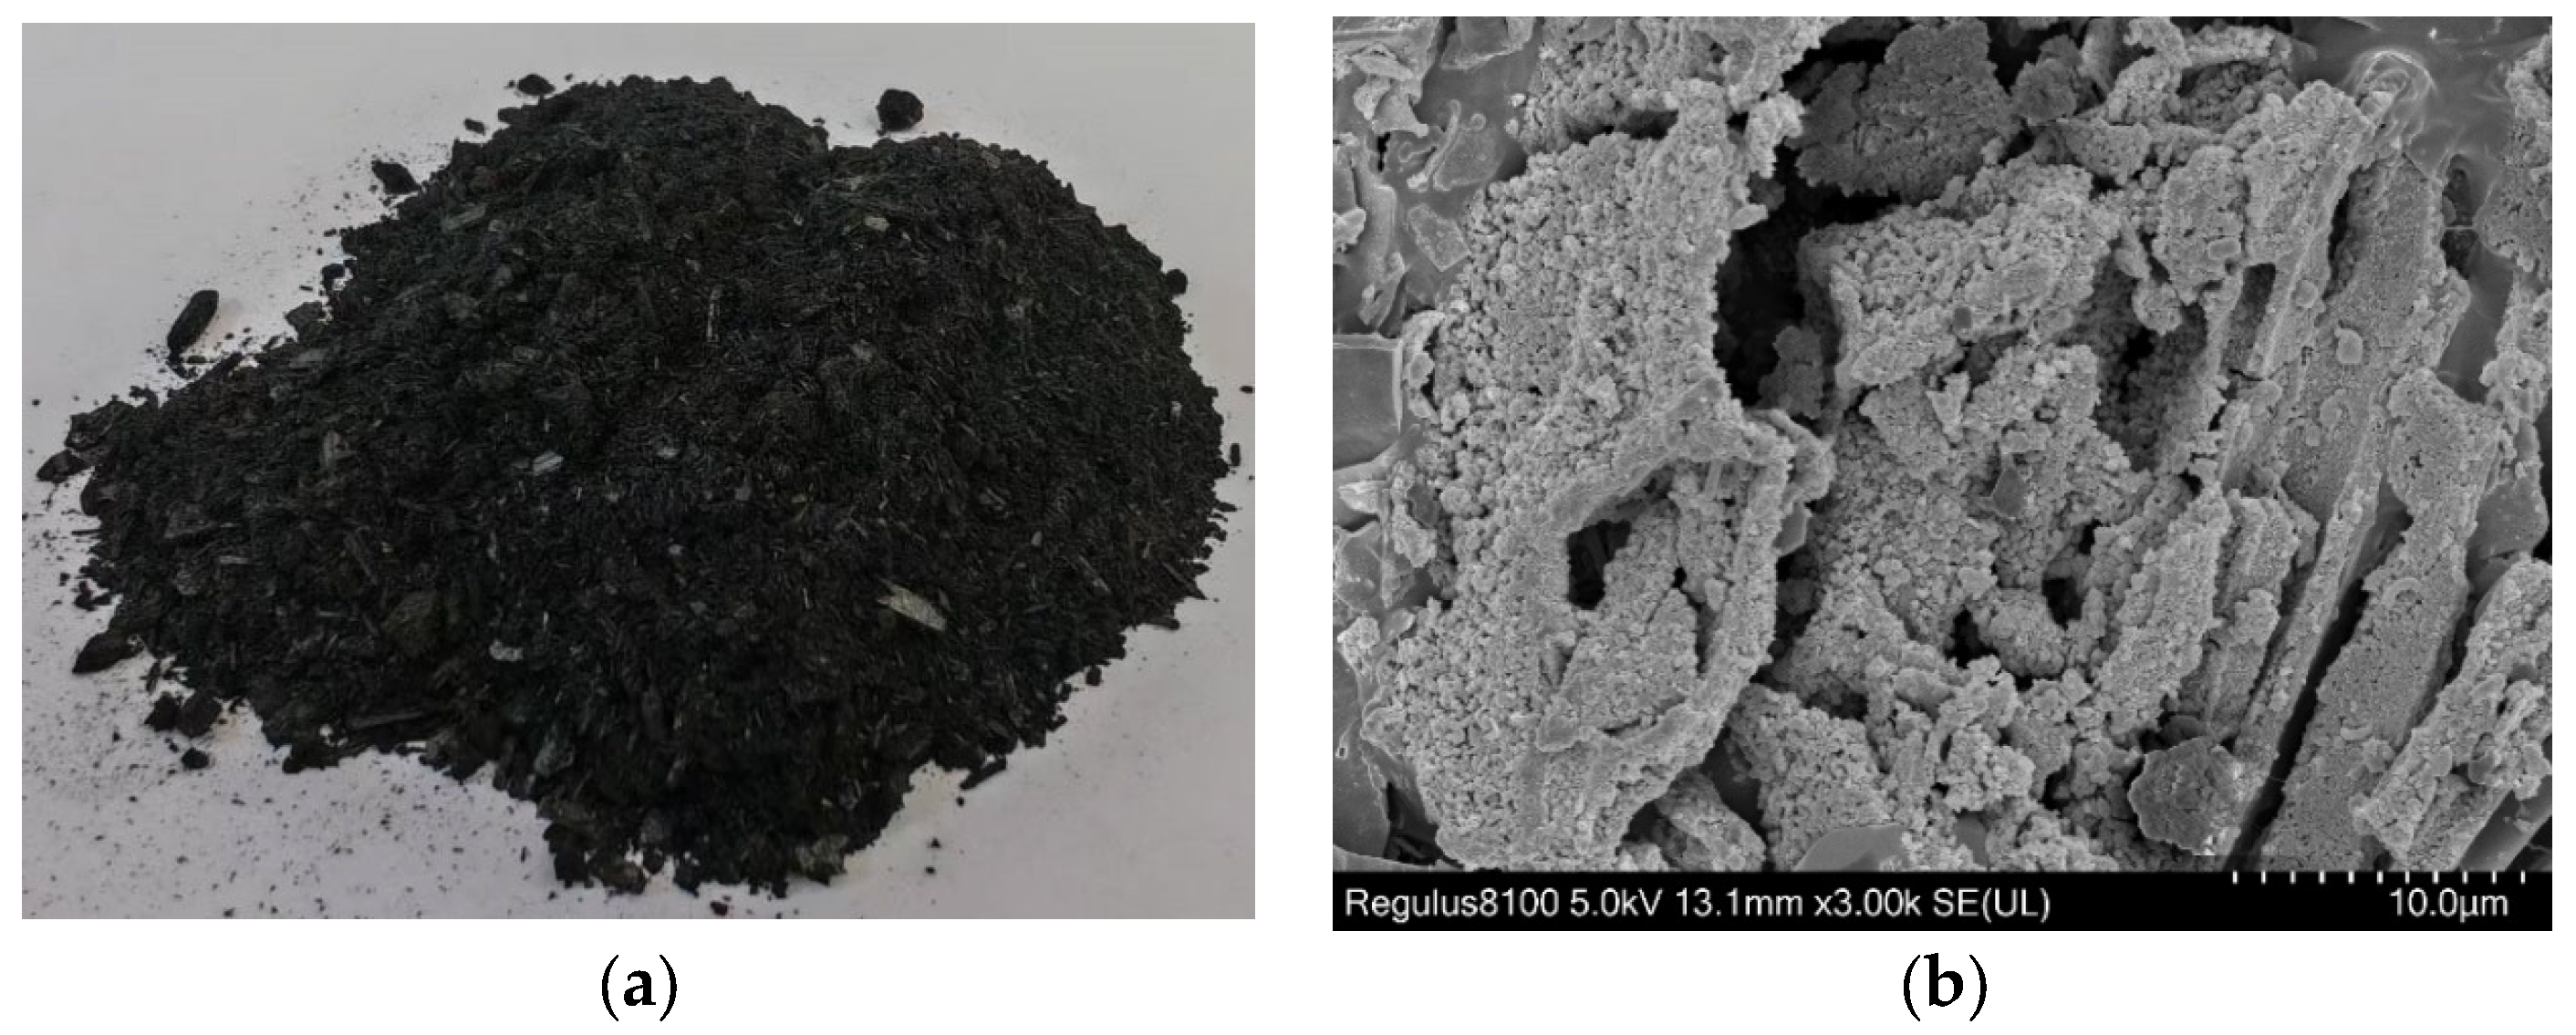
The biochar used in this study was derived from corn straw via pyrolysis at 500 °C for 5 h under oxygen-limited conditions. Key physicochemical properties of biochar are shown in Table 2. The resulting morphology and porous structure of the biochar are illustrated in Figure 1. Prior to the experiments, the biochar was oven-dried at 60 °C for 48 h, cooled to room temperature in a desiccator, and stored in sealed containers.

2.2. Experimental Procedures

2.2.1. Soil Sample Preparation

Three biochar treatments were prepared by amending the soil with biochar at rates of 0, 0.5, and 1 g kg−1 (dry weight basis), referred to as B1, B2, and B3, respectively (based on preliminary tests, the maximum biochar application rate that allowed for homogeneous soil packing was determined to be 1 g kg−1). Each soil–biochar mixture was moistened to a gravimetric water content of 0.16 g g−1 and then sealed and equilibrated for 24 h to ensure uniform moisture distribution. Subsequently, the soil was packed into cylindrical cores (50 mm height × 50 mm diameter) to a target initial bulk density of 1.30 g cm−3. A total of 81 samples were prepared, with 27 replicates for each of the three biochar treatments.

2.2.2. Water Retention Characteristics of the Mixture Soil

To determine the soil–water retention curve (SWRC), a subset of 9 samples (3 replicates from each biochar treatment) was selected. Following the standard laboratory procedure [46], these samples were first saturated by capillary rise for 24 h. Subsequently, the saturated samples were subjected to a sequence of increasing matric suctions-1, 3, 6, 10, 33, 100, 200, 300, 600, 1000, and 1500 kPa. The SWRC was determined using a combined approach to ensure data precision. For low matric suctions (1, 3, 6 and 10 kPa), equilibrium was achieved using the constant water-head pressures. For higher suction values (exceeding 10 kPa), the pressure plate apparatus was utilized, following the standard procedures described by [46]. At each suction level, the samples were weighed once equilibrium was reached. After the final measurement at 1500 kPa, the samples were oven-dried at 105 °C to a constant weight to determine their dry mass, which was then used to calculate the gravimetric water content at each matric suction.

2.2.3. Measurement of Soil Mechanical Properties

To assess soil mechanical properties, the remaining 72 cylindrical samples were prepared in a 3 × 4 factorial design. This design comprised three biochar rates (B1, B2, B3) and four matric suction levels (M1: 6 kPa, M2: 10 kPa, M3: 600 kPa, M4: 1000 kPa). All 72 samples were first saturated in water for 24 h. Subsequently, samples were randomly assigned to one of the four target matric suctions and allowed to equilibrate for one week. This process resulted in 12 distinct treatment combinations, with six replicate cylinders for each combination: three for compression tests and three for penetration tests.
Uniaxial compression tests were performed on 36 samples (3 replicates from each of the 12 treatment combinations). Each sample was subjected to a loading series of 12.5, 25, 50, 75, 100, 150, 200, 150, 100, 75, 50, 25, 12.5, 25, 50, 75, 100, 150, 200, 400, 800, 1200 and 1600 kPa. At each pressure step, a static load was maintained for 5 min, followed by a 2 min relaxation period. Vertical displacement was recorded continuously and used to calculate the void ratio (e). Soil compression, rebound, and re-compression curves were then generated from the resulting stress–void ratio (e-log σ) relationships to determine soil resistance and resilience parameters.
Penetration resistance was measured on the remaining 36 samples using a miniature cone penetrometer (2 mm base diameter, 60° angle) attached to a universal testing apparatus. The cone was pushed into the soil at a constant rate of 20 mm min−1 from the surface to a depth of 45 mm. The force required for penetration was continuously recorded. For each soil core, six independent penetration measurements were conducted to ensure a representative assessment.

2.3. Calculations

2.3.1. Soil–Water Retention Curve Modeling

SWRC for each sample was described by fitting the measured matric suction (h) and volumetric water content (θ) data to the van Genuchten (VG) model using non-linear regression (Equation (1)) [47]:
θ ( h ) = θ r + θ s θ r [ 1 + ( α | h | n ) ] m
where θs and θr are the saturated and residual volumetric water contents (cm−3 cm−3), respectively; α (kPa−1) is an empirical parameter related to the inverse of the air-entry pressure; and n is a dimensionless parameter reflecting the pore-size distribution. The parameter m was constrained using the relationship m = 1 − 1/n.

2.3.2. Hydrological Indicators

From the water retention data, several key hydrological indicators were determined. Specific volumetric water content values were identified, including macropore water content (θM at 1 kPa), field capacity (θFC at 33 kPa), maximum easily extractable water (θMRE at 600 kPa) and permanent wilting point (θPWP at 1500 kPa).
Following the methods of [18,48], these values were then used to calculate four soil–water capacitance indicators: total available water capacity (TAWC), plant available water (PAW), readily available water (RAW), and relative field capacity (RFC).

2.3.3. Calculation of Soil Compressive Characteristics

Parameters for soil resistance and resilience were derived from the uniaxial compression test data as follows:
The relationship between void ratio (e) and applied stress (σ) during the initial loading phase was fitted to the Gompertz model [49] using non-linear regression (Equation (2)):
e = a + c e x p { e x p [ b ( log σ m ) ] }
where a, b, c, and m are fitting parameters. The parameter m was constrained according to [50] to ensure accurate results, m ≤ log10 500 kPa = 2.70. The compression index (Cc) was then calculated from the Gompertz parameters b and c (Equation (3)):
C c = b c e x p ( 1 )
Pre-compression stress (σp) was determined by identifying the stress corresponding to the point of maximum curvature on the e-log σ compression curve. The curvature (κ) was calculated from the first and second derivatives of the fitted Gompertz curve using the following function (Equation (4)):
k = d 2 e / d ( log σ ) 2 [ 1 + ( d e / d ( log σ ) 2 ) ] 3 / 2
The unloading (rebound) and subsequent reloading (re-compression) portions of the data were fitted with polynomial functions. Swelling index (Cs) was determined from the slope of the unloading–reloading loop on the e-log σ plot, following the methodology of [51].

2.4. Evaluation Model

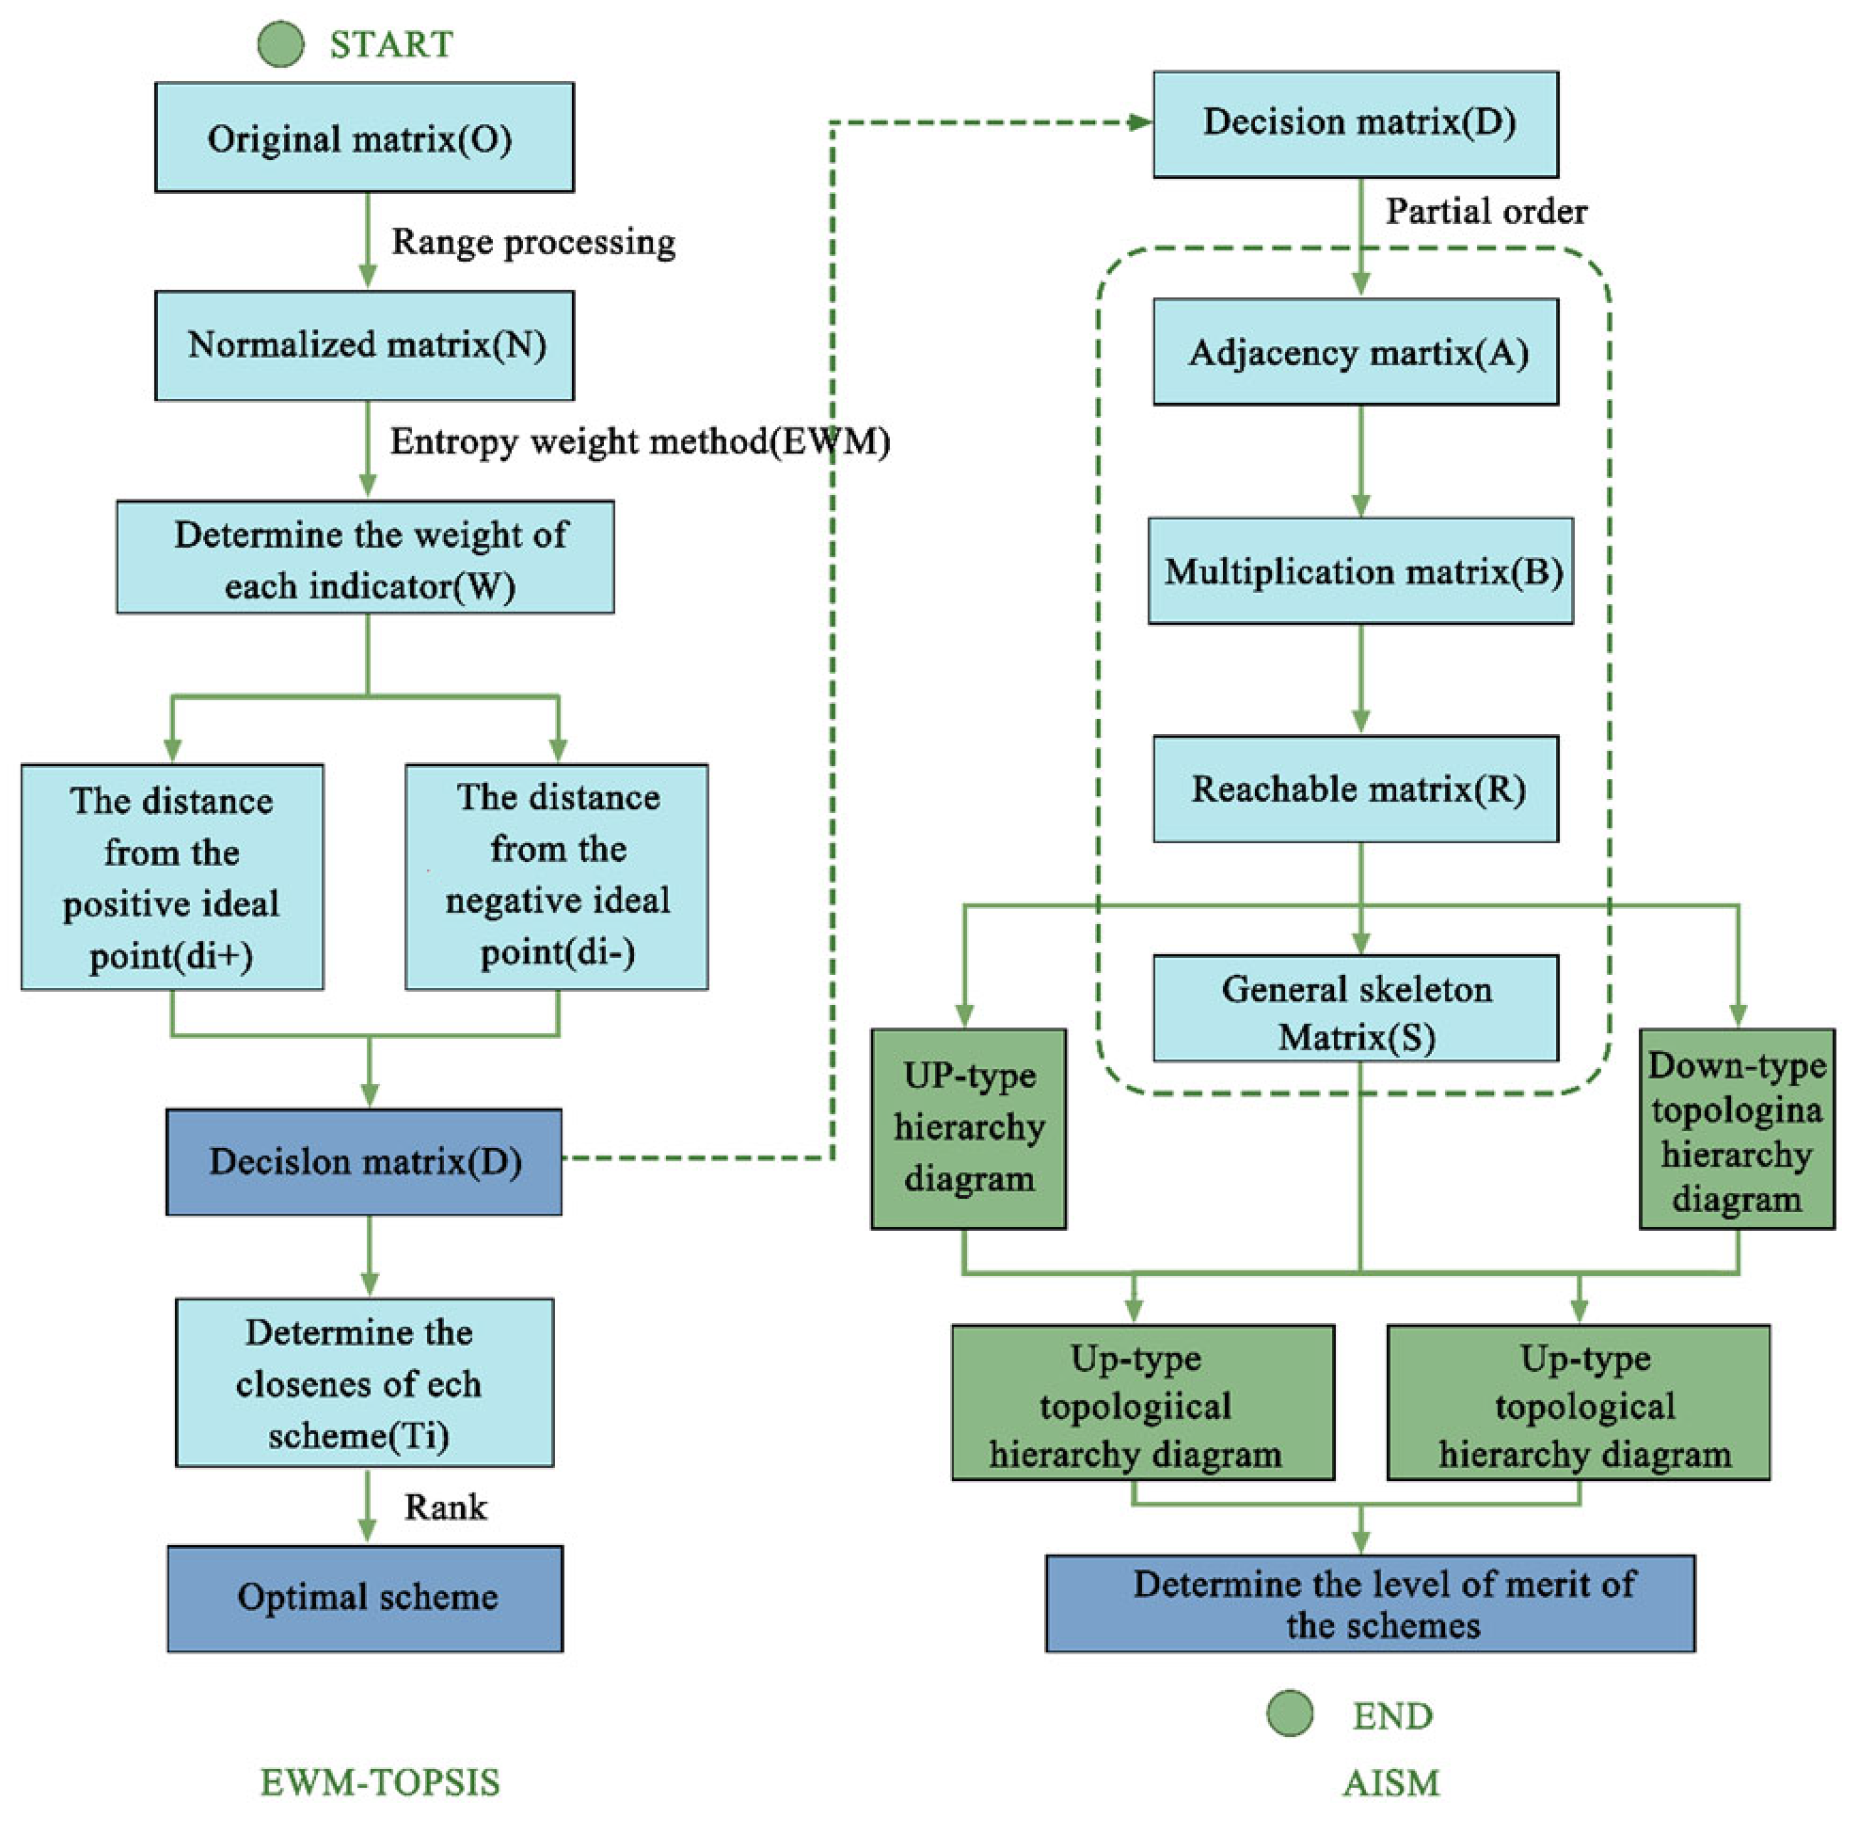
The calculation process for the integrated EWM–TOPSIS–AISM model was adapted from the methodology described by [38]. A schematic diagram illustrating the steps in this process is provided in Figure 2.

2.5. Statistical Analysis

All statistical analyses were conducted to evaluate treatment effects. A one-way analysis of variance (ANOVA) was used to assess the effect of biochar on soil–water retention parameters. The individual and interactive effects of biochar and matric suction on soil compressive characteristics and penetration resistance were analyzed using a two-way ANOVA. Following the ANOVA, mean separation was performed using the least significant difference (LSD) test. All statistical differences were considered significant at a probability level of p < 0.05. Statistical analyses were performed using SPSS (version 26.0, IBM Corp., Armonk, NY, USA) and R software (version 4.3.3). The integrated EWM–TOPSIS–AISM framework was implemented using Python 3.9. Figures were generated using OriginPro 2024.

3. Results

3.1. Soil–Water Retention Variables

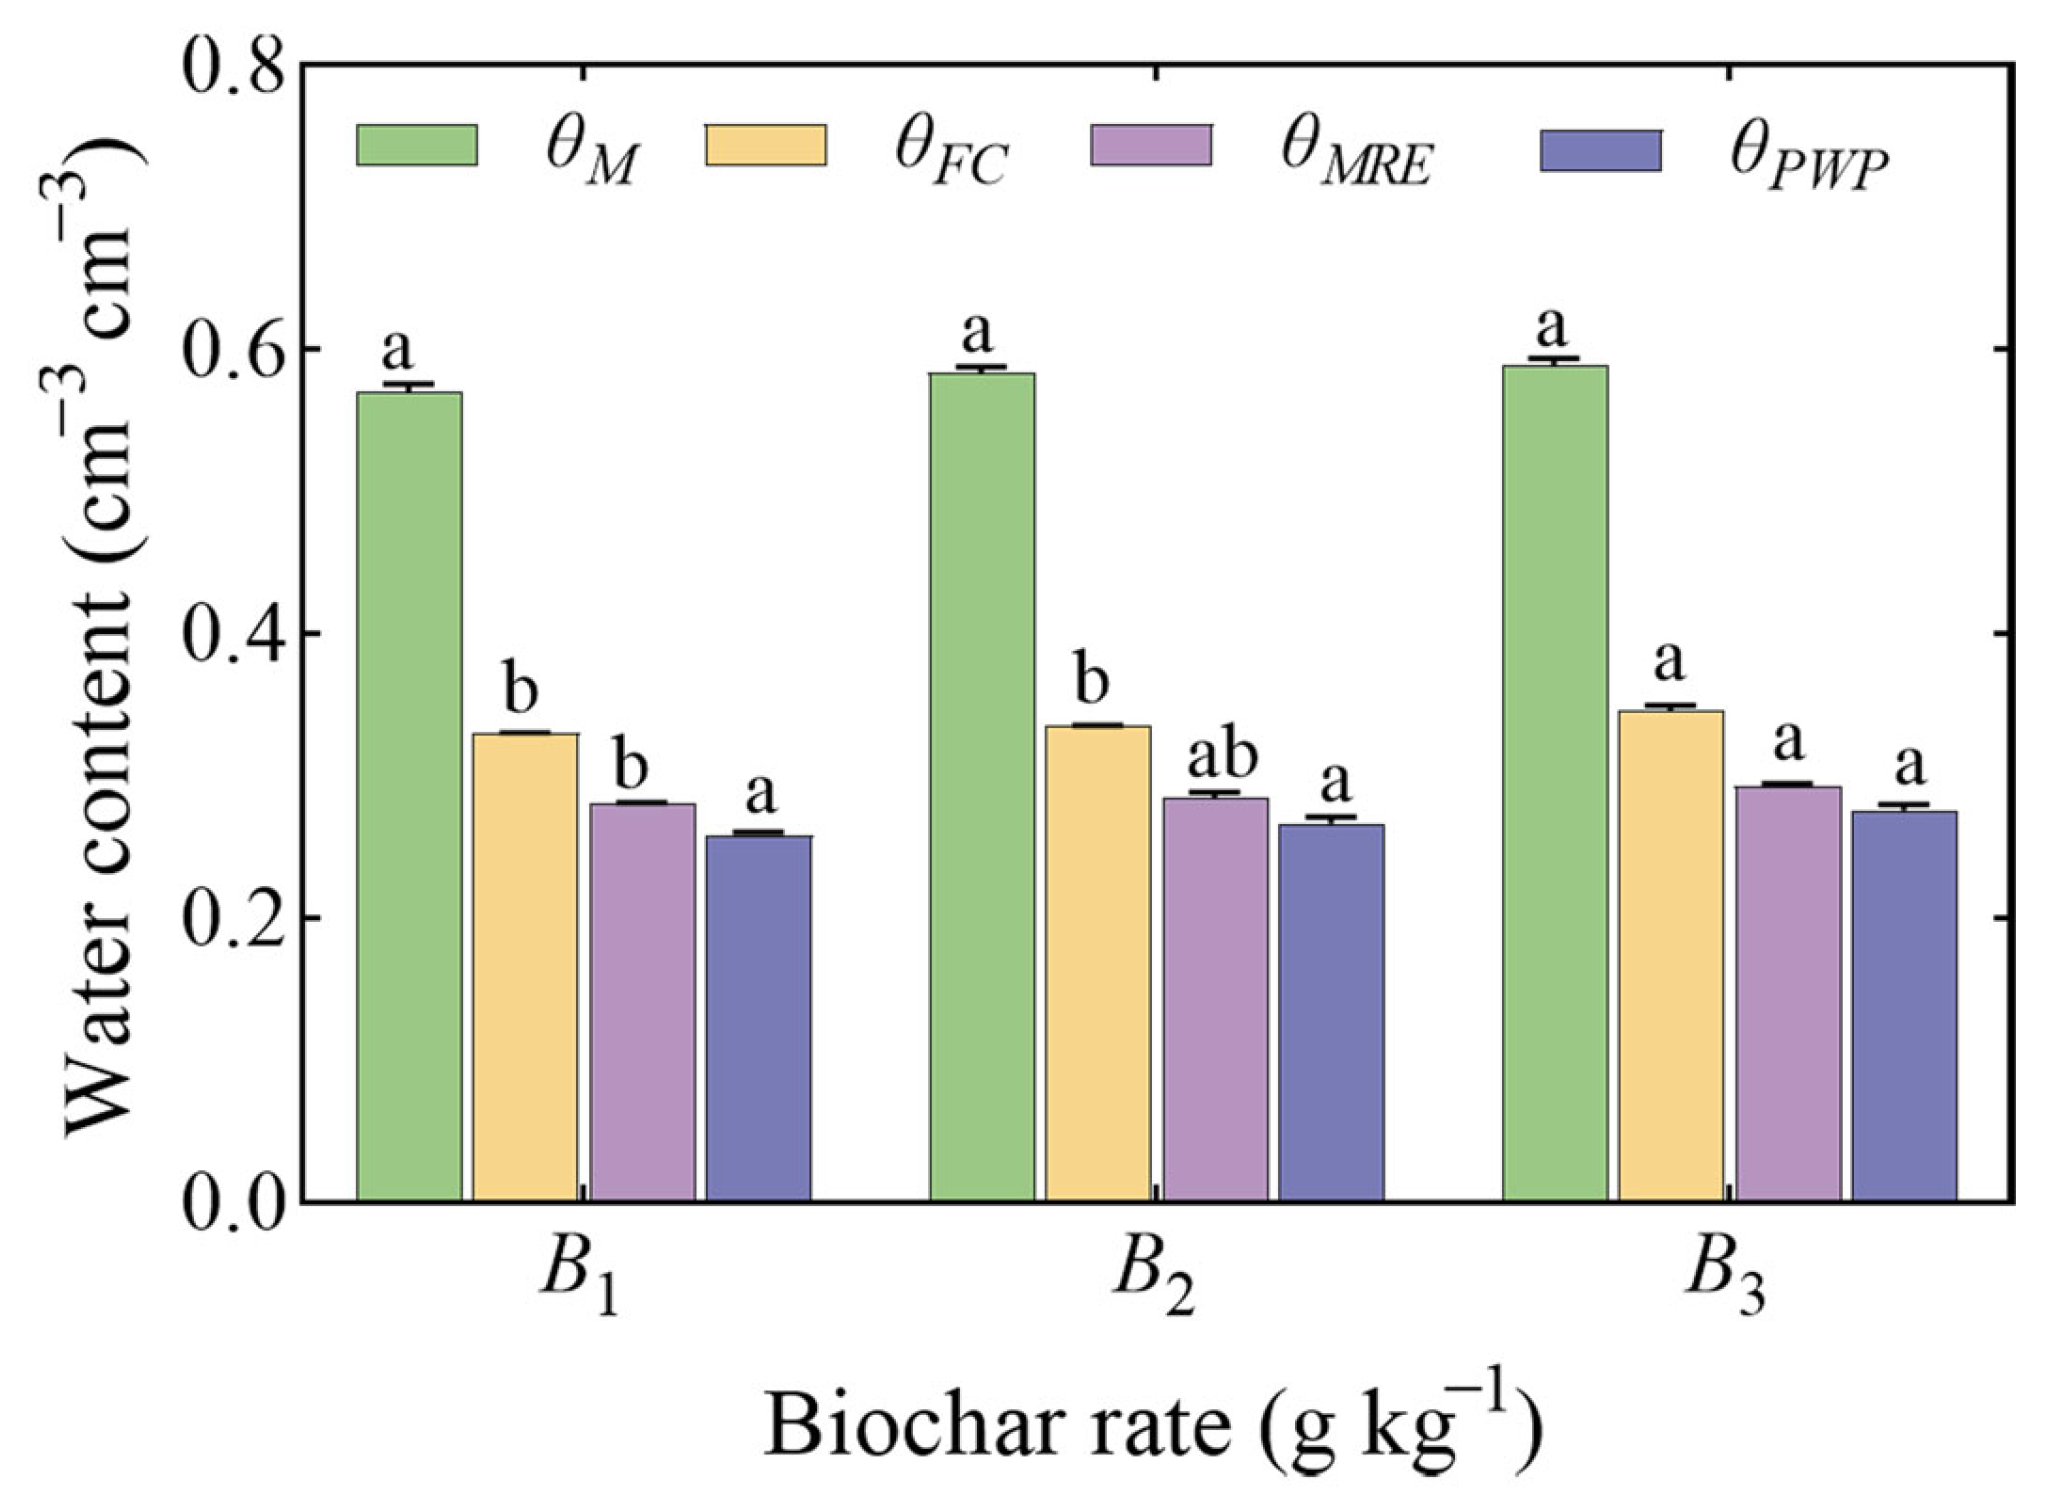
Figure 3 shows θM, θFC, θMRE, and θPWP for the three biochar rates. θM, θFC, θMRE and θPWP exhibited an increase with biochar amendment, while no significant changes were observed for θM and θPWP across treatments B1, B2, and B3 (p > 0.05). Compared to B1, B3 treatment showed substantially greater θFC and θMRE (p < 0.05). The mean values of θFC and θMRE did not change significantly between B1 and B2 treatments (p > 0.05).
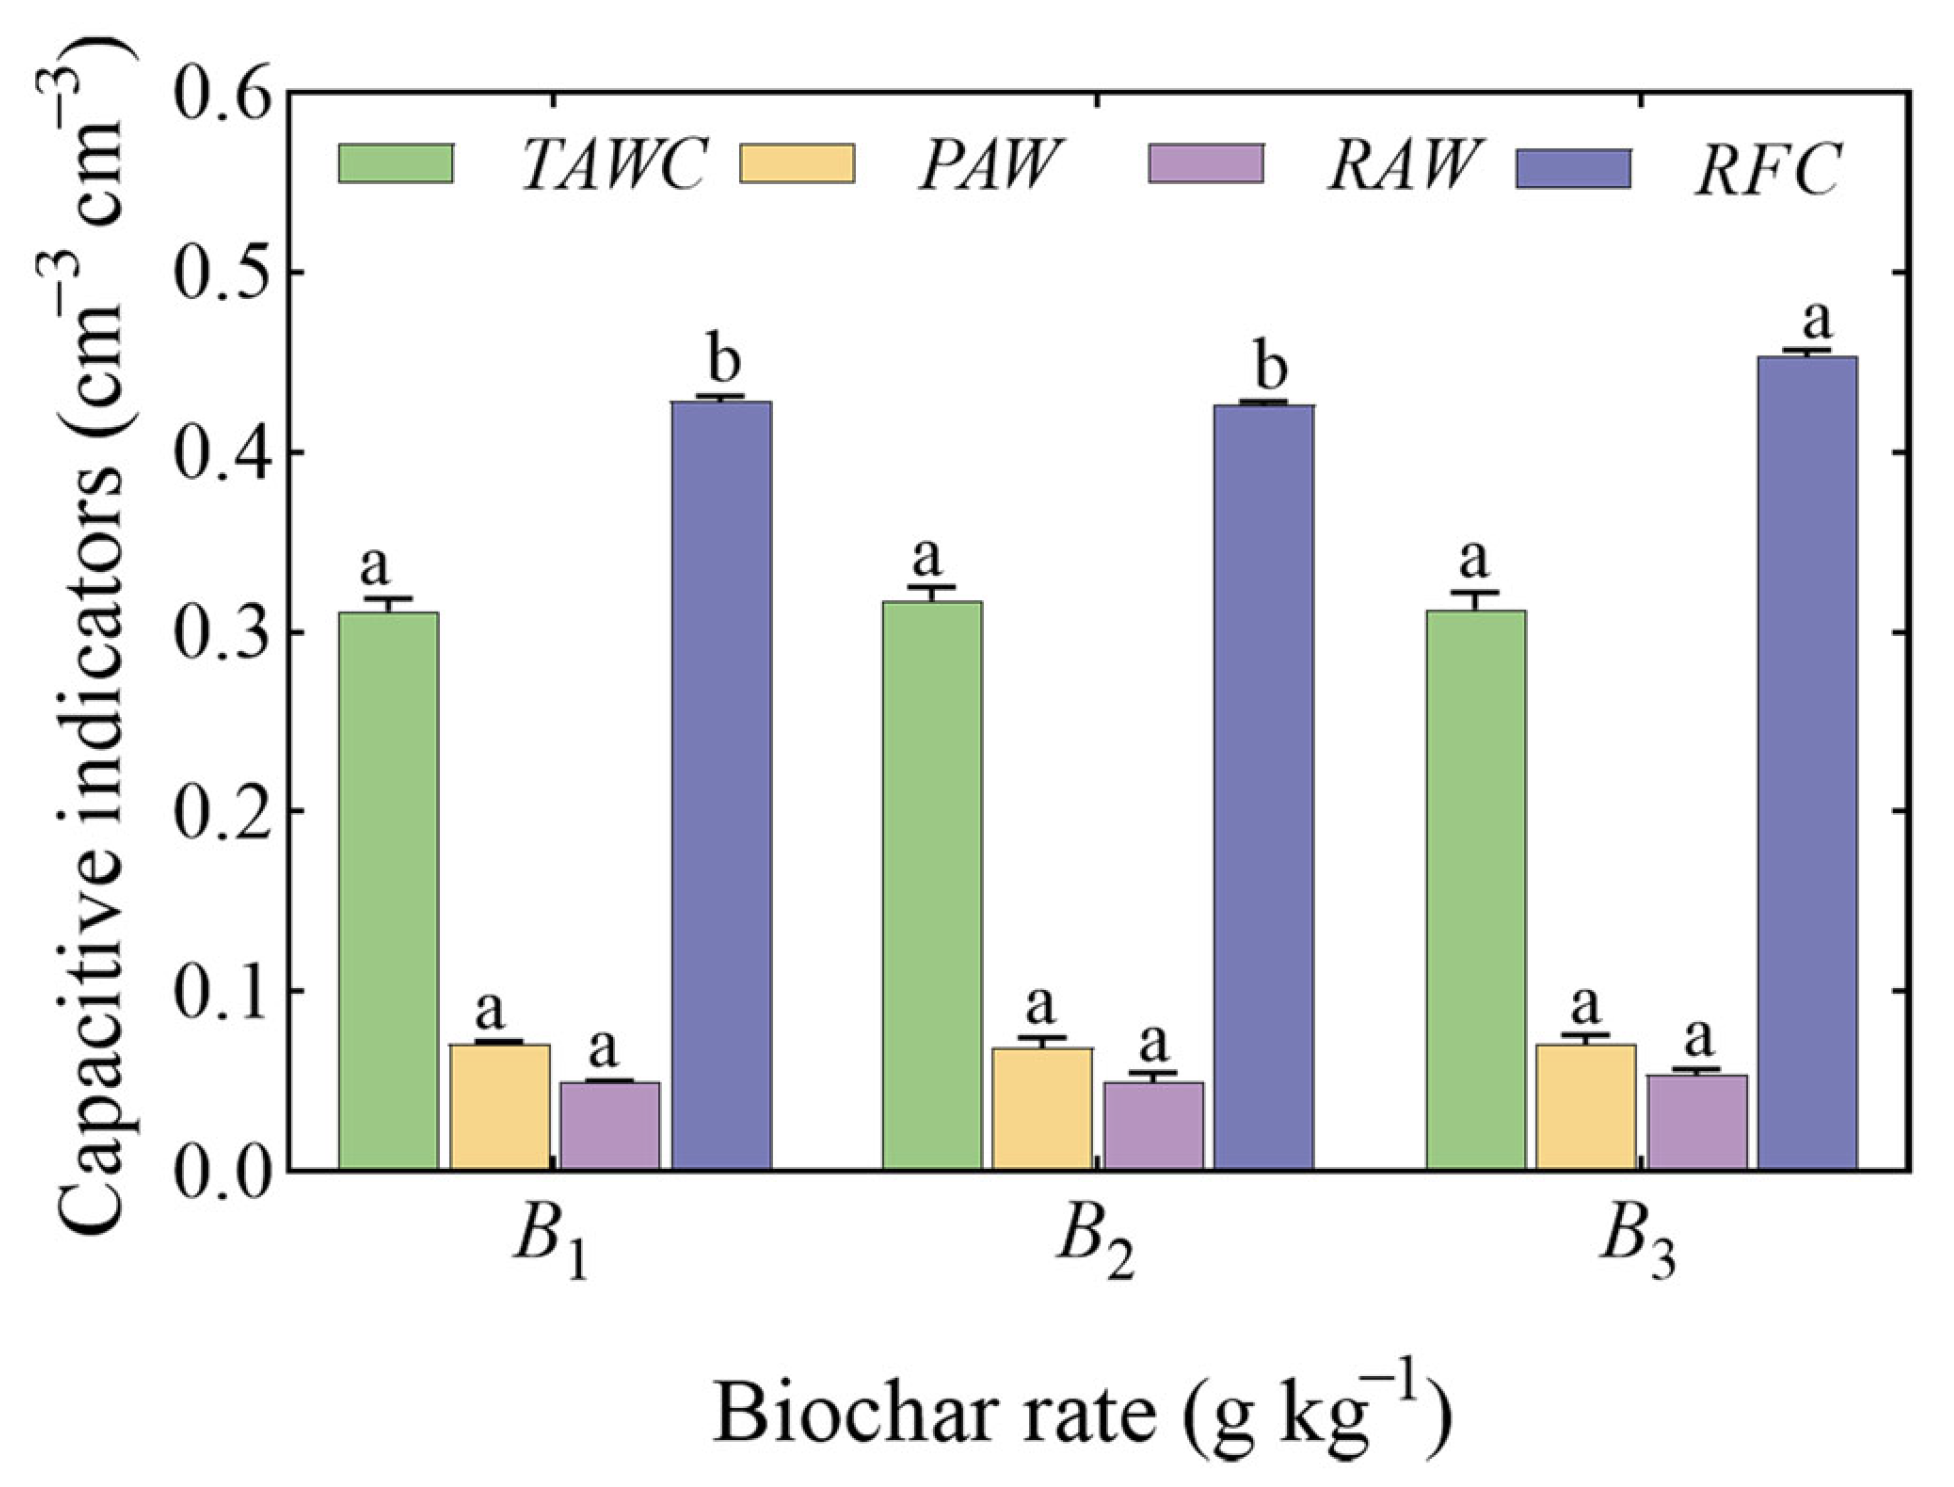
The primary findings from the one-way ANOVA regarding the impact of biochar on capacitive indicators are illustrated in Figure 4. No significant differences were observed in TAW, PAW, and RAW among the treatments (p > 0.05). The RFC of B3 was markedly higher than that of B1 and B2 (p < 0.05).

3.2. Pre-Compression Stress (σp)

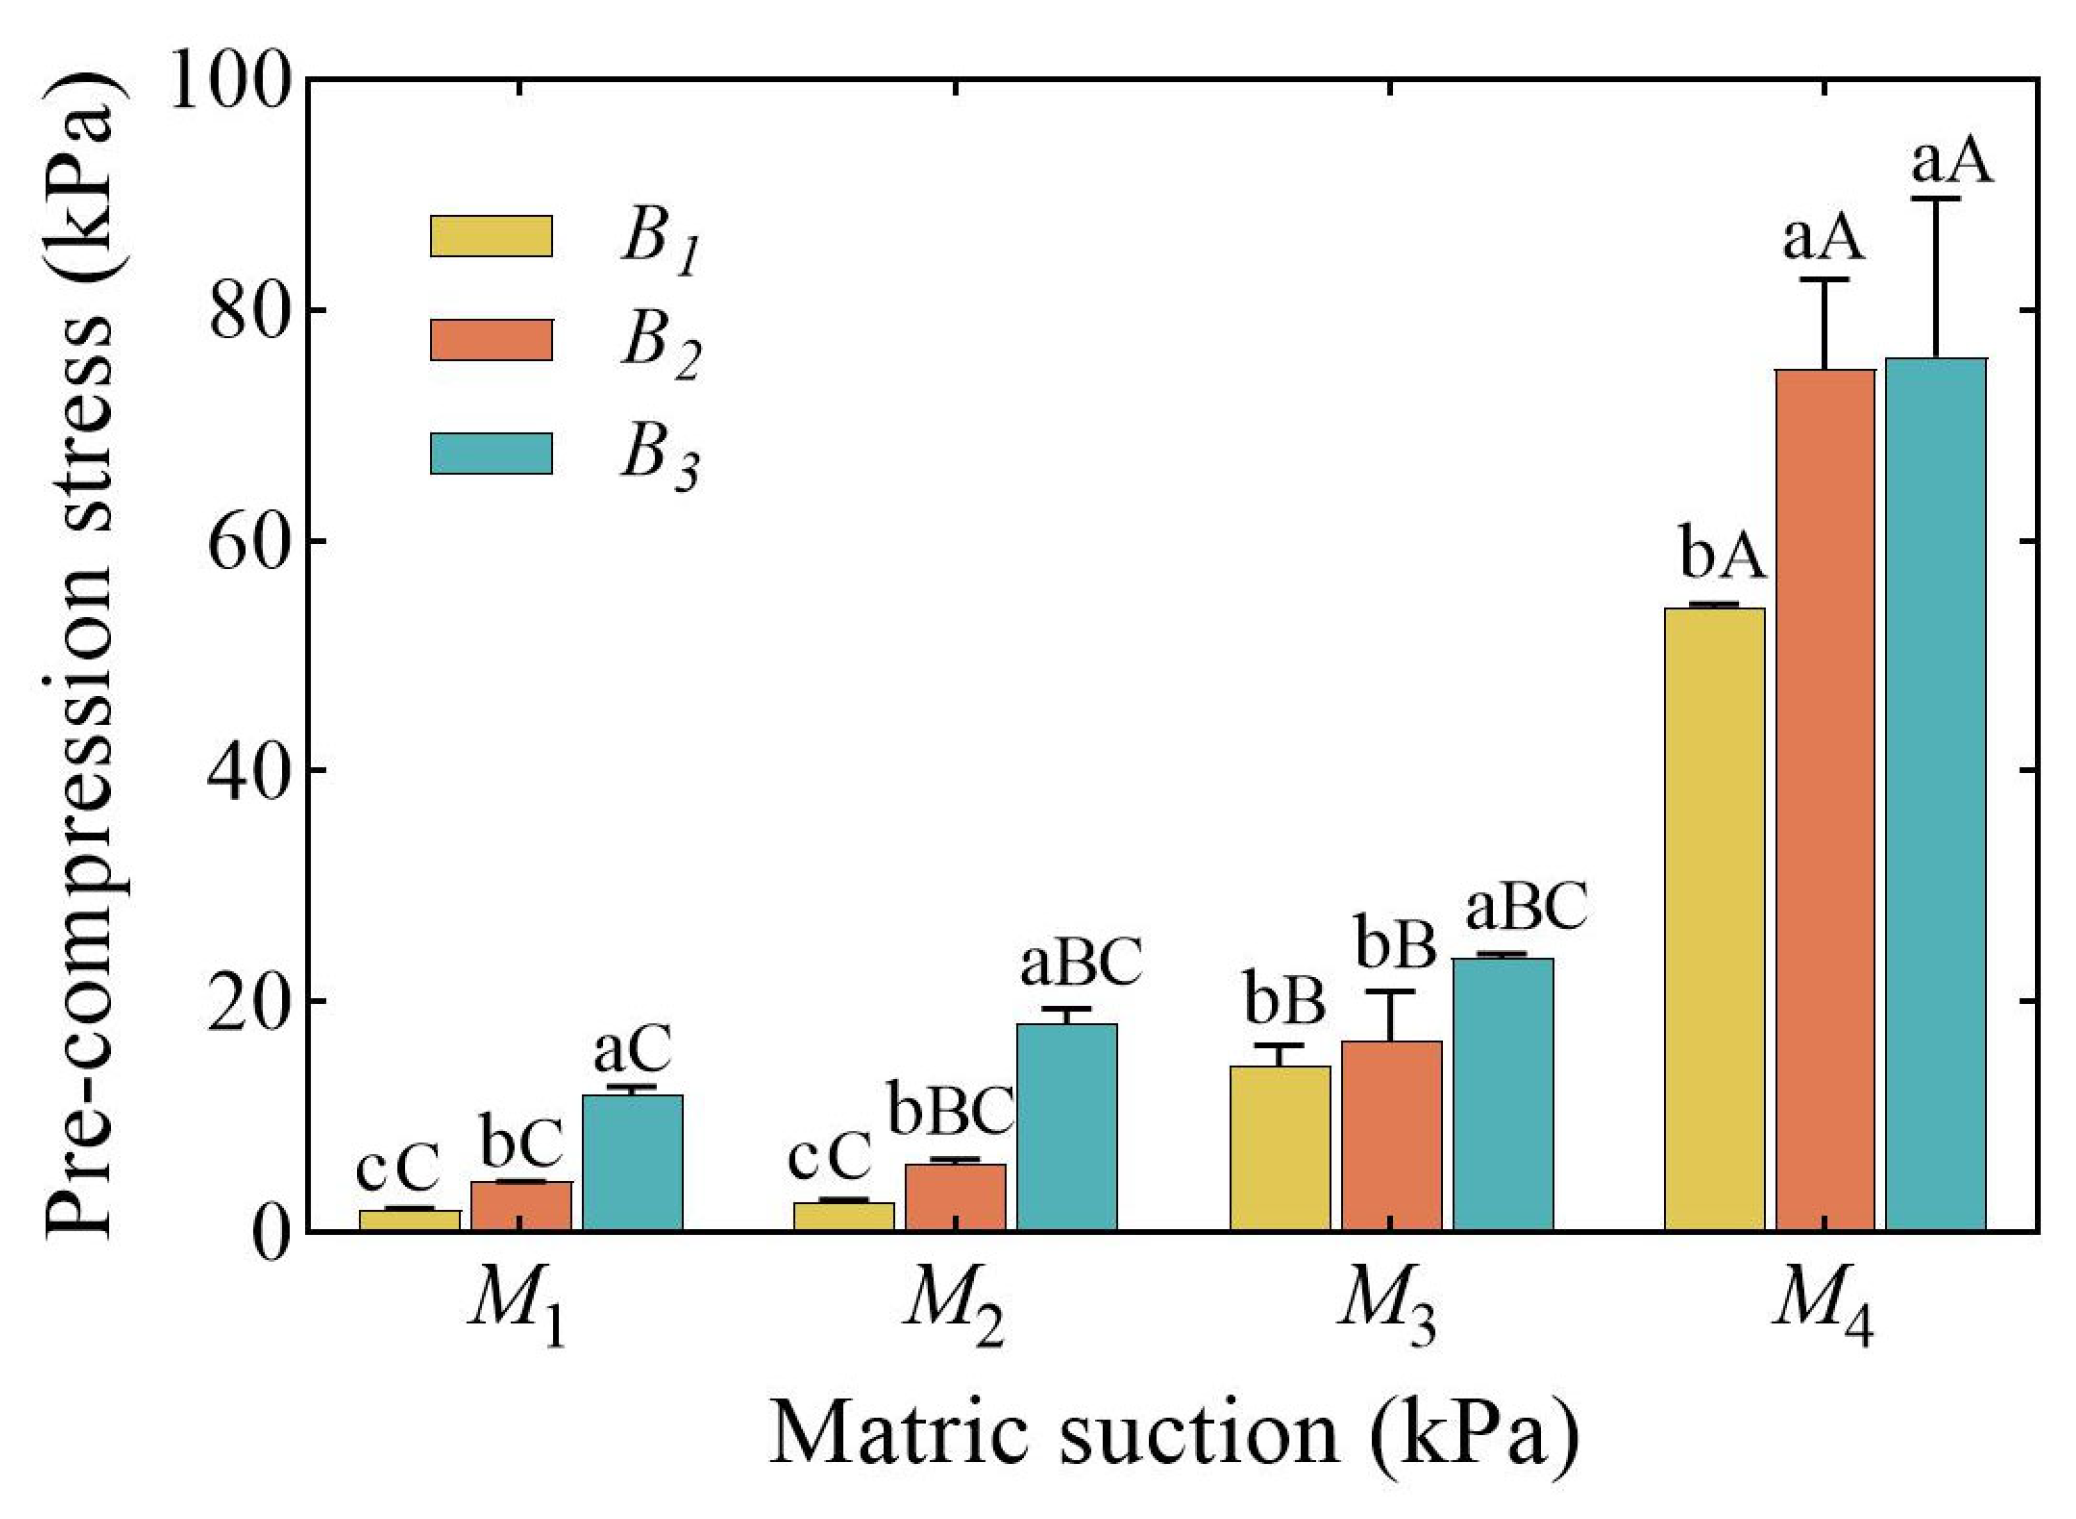
Figure 5 illustrates that the pre-compression stress conditions were influenced by differing matric suctions and varying rates of biochar application. These pre-compression stresses ranged from 1.96 to 75.99 kPa. The pre-compression stress reached its highest point at M4 = 1000 kPa and B3 = 10 g kg−1, and lowest point at M1 = 6 kPa and B1 = 0 g kg−1.
The pre-compression stress was significantly influenced by both the matric suction and the biochar application rate (p < 0.01), as well as their interaction (p < 0.05). The pre-compression stress increased with higher matric suction and greater biochar application rates.

3.3. Penetration Resistance (PR)

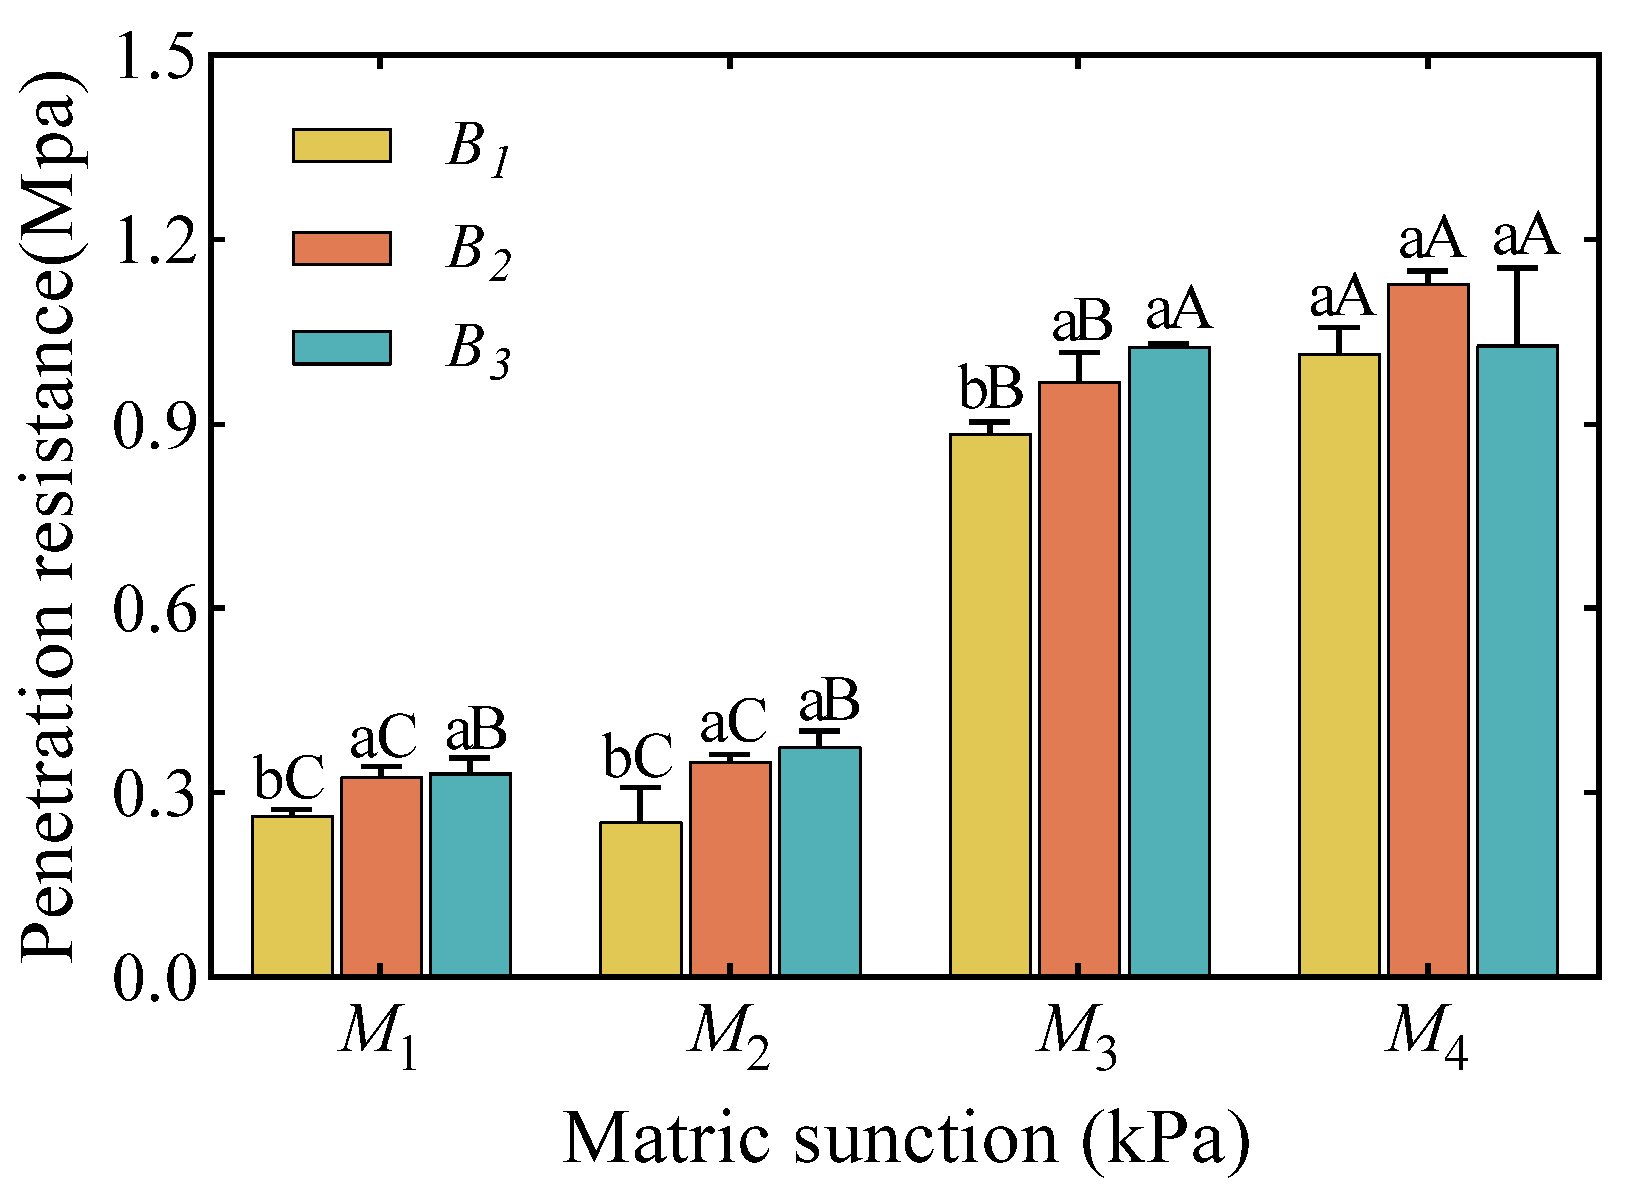
The findings of penetration resistance are displayed in Figure 6. Matric suction and biochar considerably influenced penetration resistance (p < 0.01) (Table 3). However, the interaction of matric suction and biochar has no effect on penetration resistance (p > 0.05).
With the exception of the M4 treatment, under identical matric suction, the incorporation of biochar markedly enhanced soil penetration resistance. However, no significant difference was seen between B2 and B3 (Figure 6) (p > 0.05). A positive correlation was observed between penetration resistance and matric suction at consistent biochar application rates (Figure 6).

3.4. Compression Index (Cc)

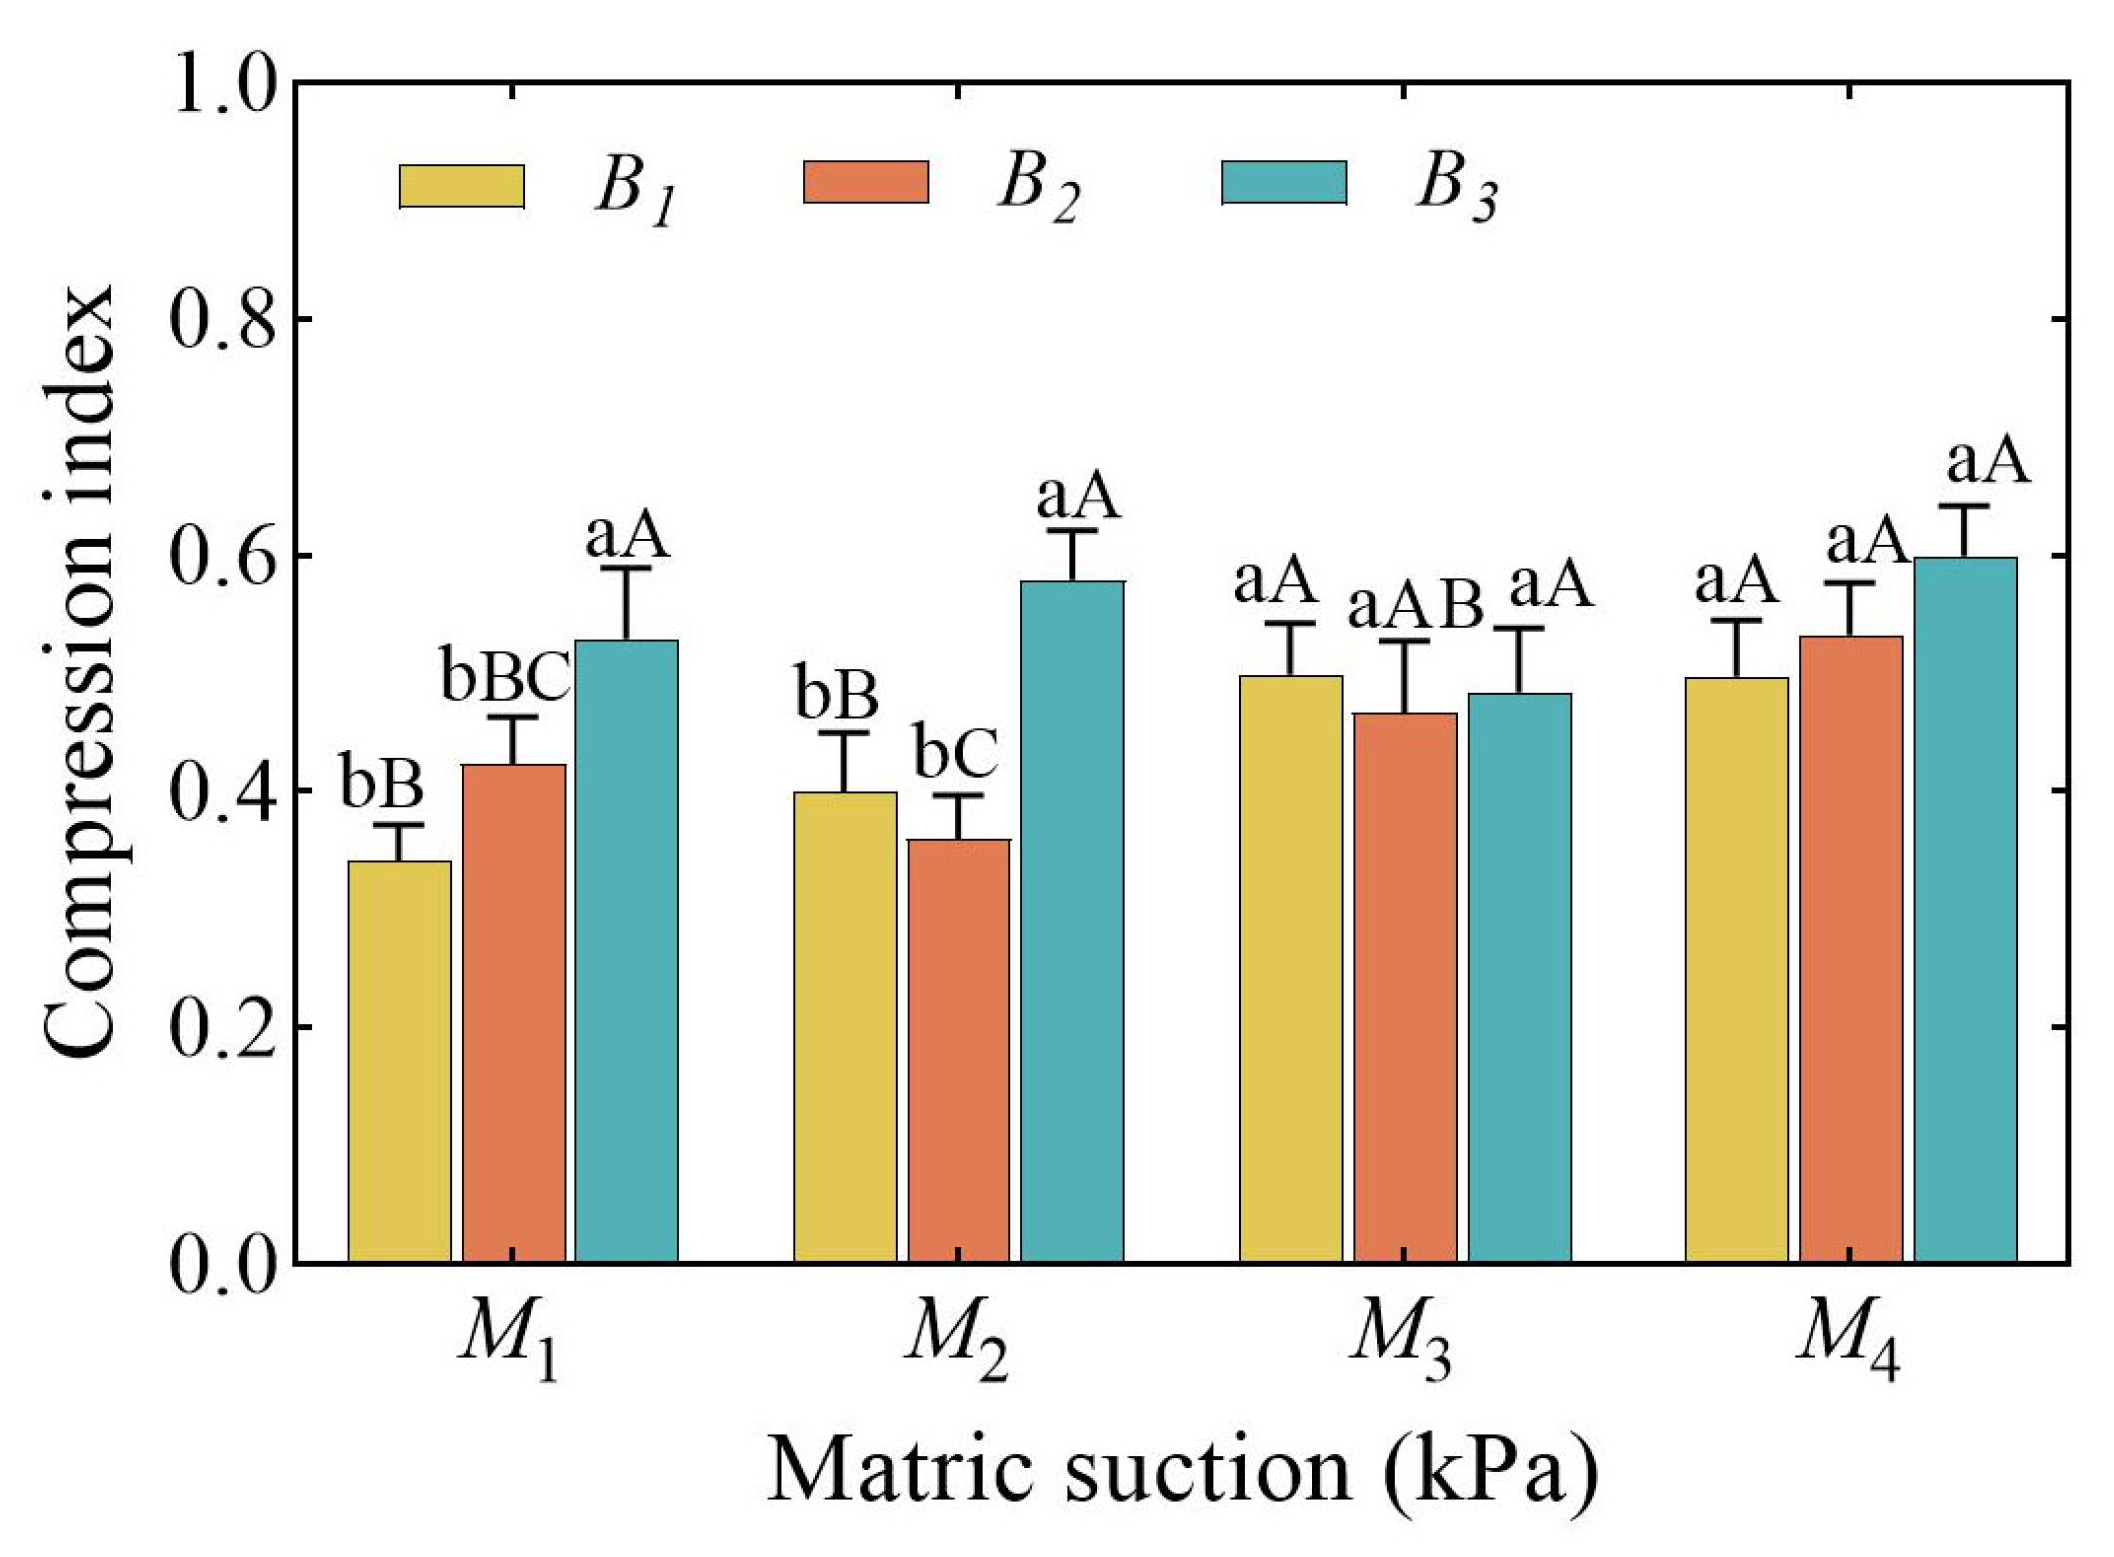
The influence of matric suction and biochar application rate on the compression index is shown in Figure 7. The compression index was markedly affected by both the matric suction and the biochar application rate (p < 0.01), along with their interaction (p < 0.05).
At reduced matric suction (M1 and M2), a greater application rate of biochar considerably elevated the compression index in comparison to B1 and B2 (p < 0.05). At elevated matric suctions (M3 and M4), the application rate of biochar did not significantly influence the compression index (p > 0.05). A positive association existed between the compression index and matric suction at identical biochar application rates.

3.5. Swelling Index (Cs)

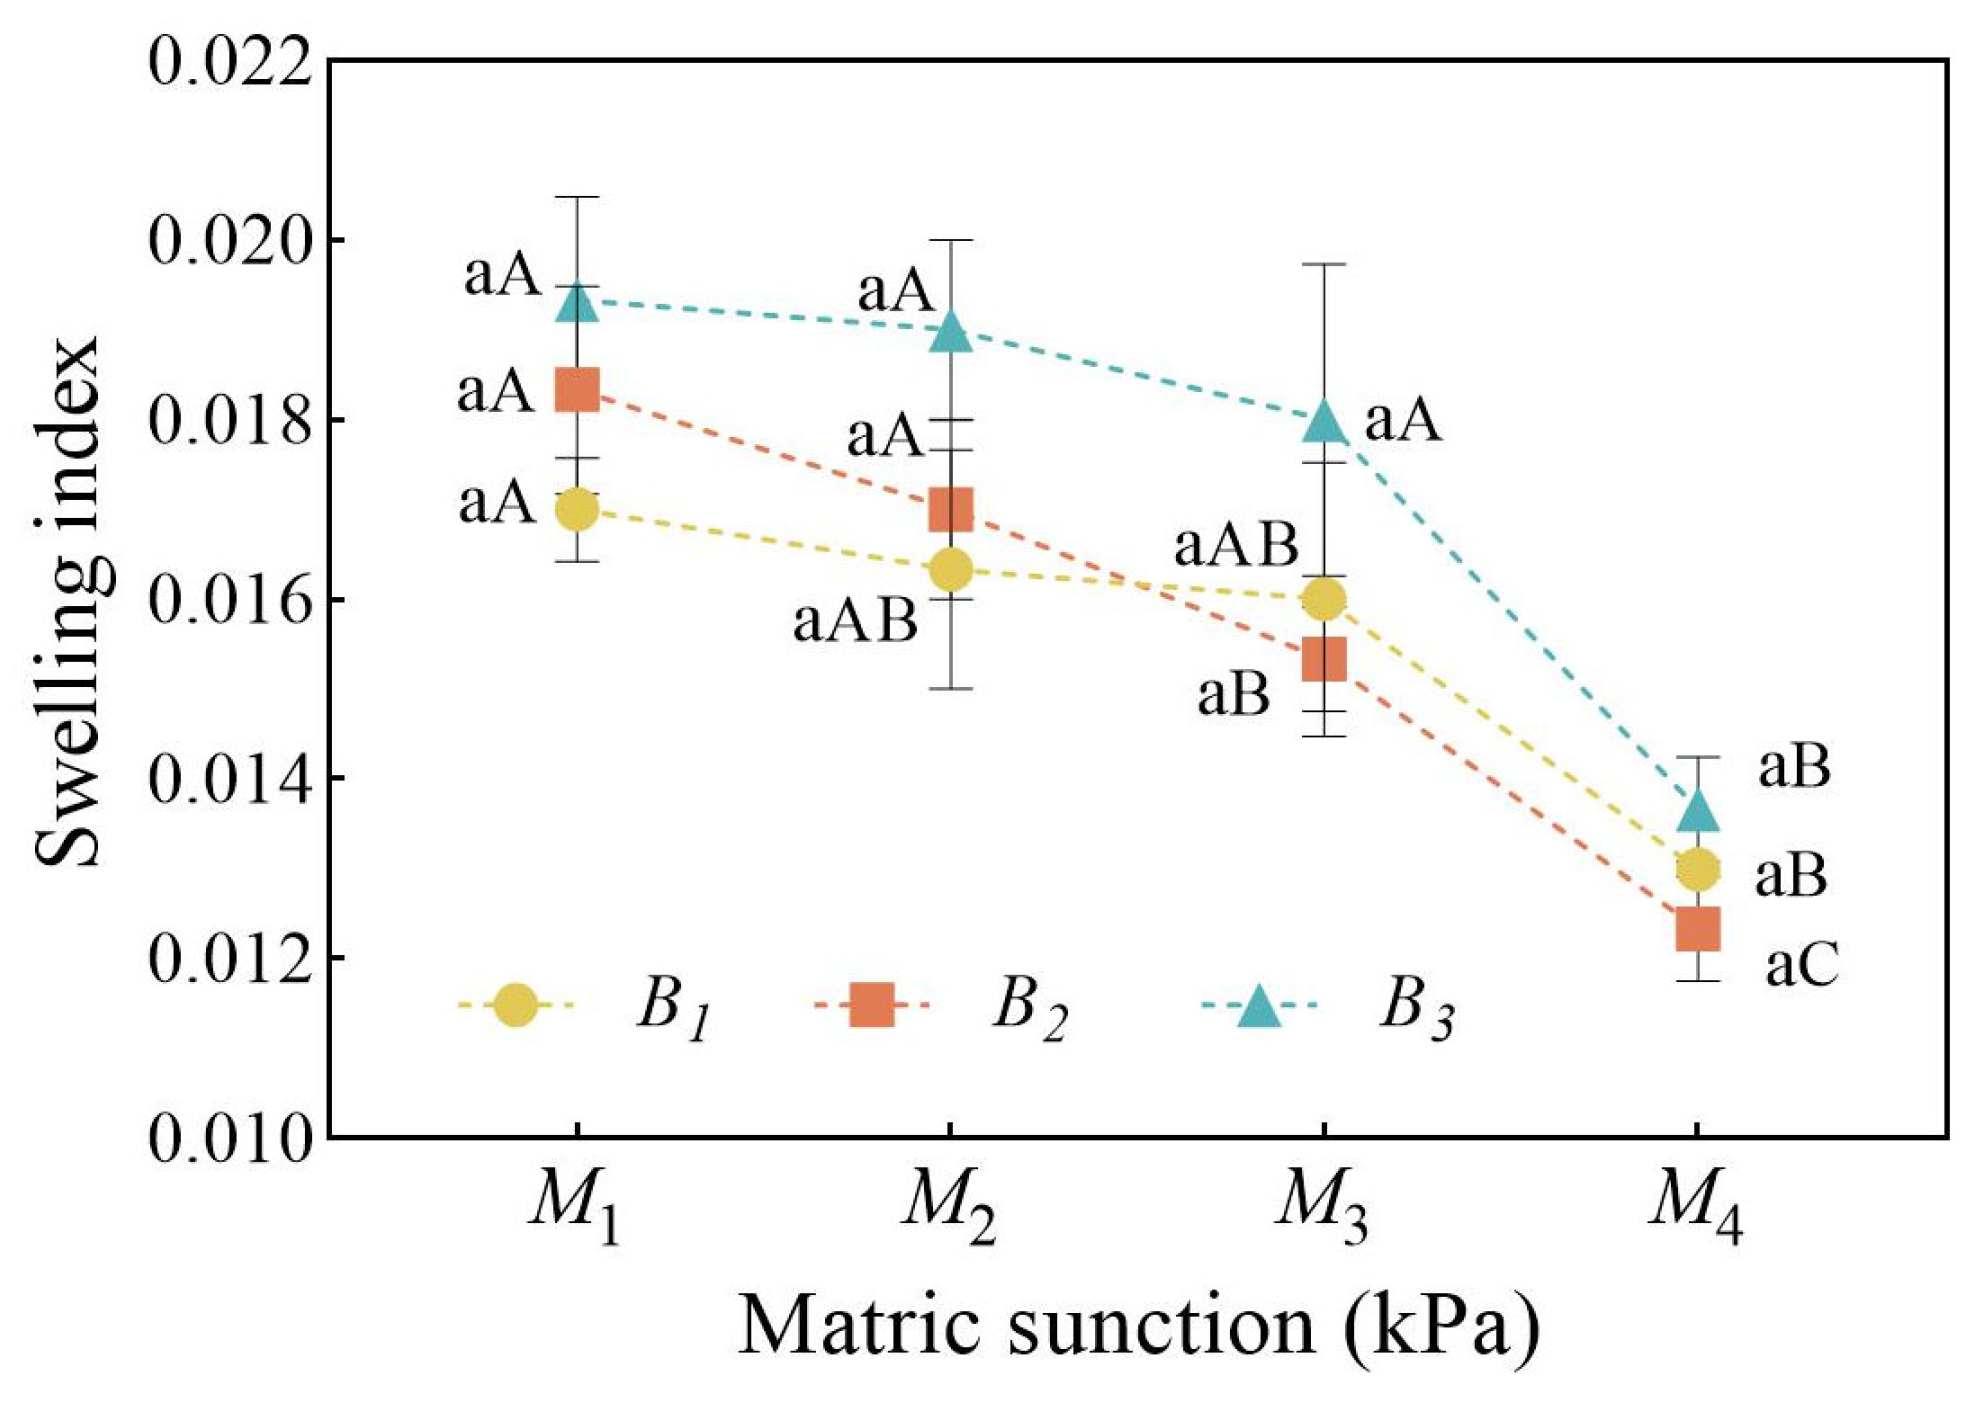
Matric suction and biochar significantly affected swelling index (p < 0.01) (Table 3). The interaction between matric suction and biochar does not influence swelling index (p > 0.05). The rebound index of treatment B3 was significantly higher than that of treatments B2 and B1 (p < 0.05), and there was no significant difference between treatments B1 and B2 (p > 0.05) (Table 3). An inverse association of statistical significance was seen between swelling index and matric suction with constant biochar application rates (Figure 8).

3.6. EWM–TOPSIS–AISM Analysis

The weight of each indication was determined using the EWM to find the high-weight indicator that influenced the ranking of each treatment. Table 4 indicates that the weights of pre-compression stress and penetration resistance were double that of compression index and swelling index.
The TOPSIS model is used to determine the distance and closeness (Ti) of different treatments to the positive and negative ideal solutions (Table 5). The final rankings indicate that B3M4 achieved the highest position, indicating that B3M4 was the superior biochar and matric suction supply approach in this experiment.
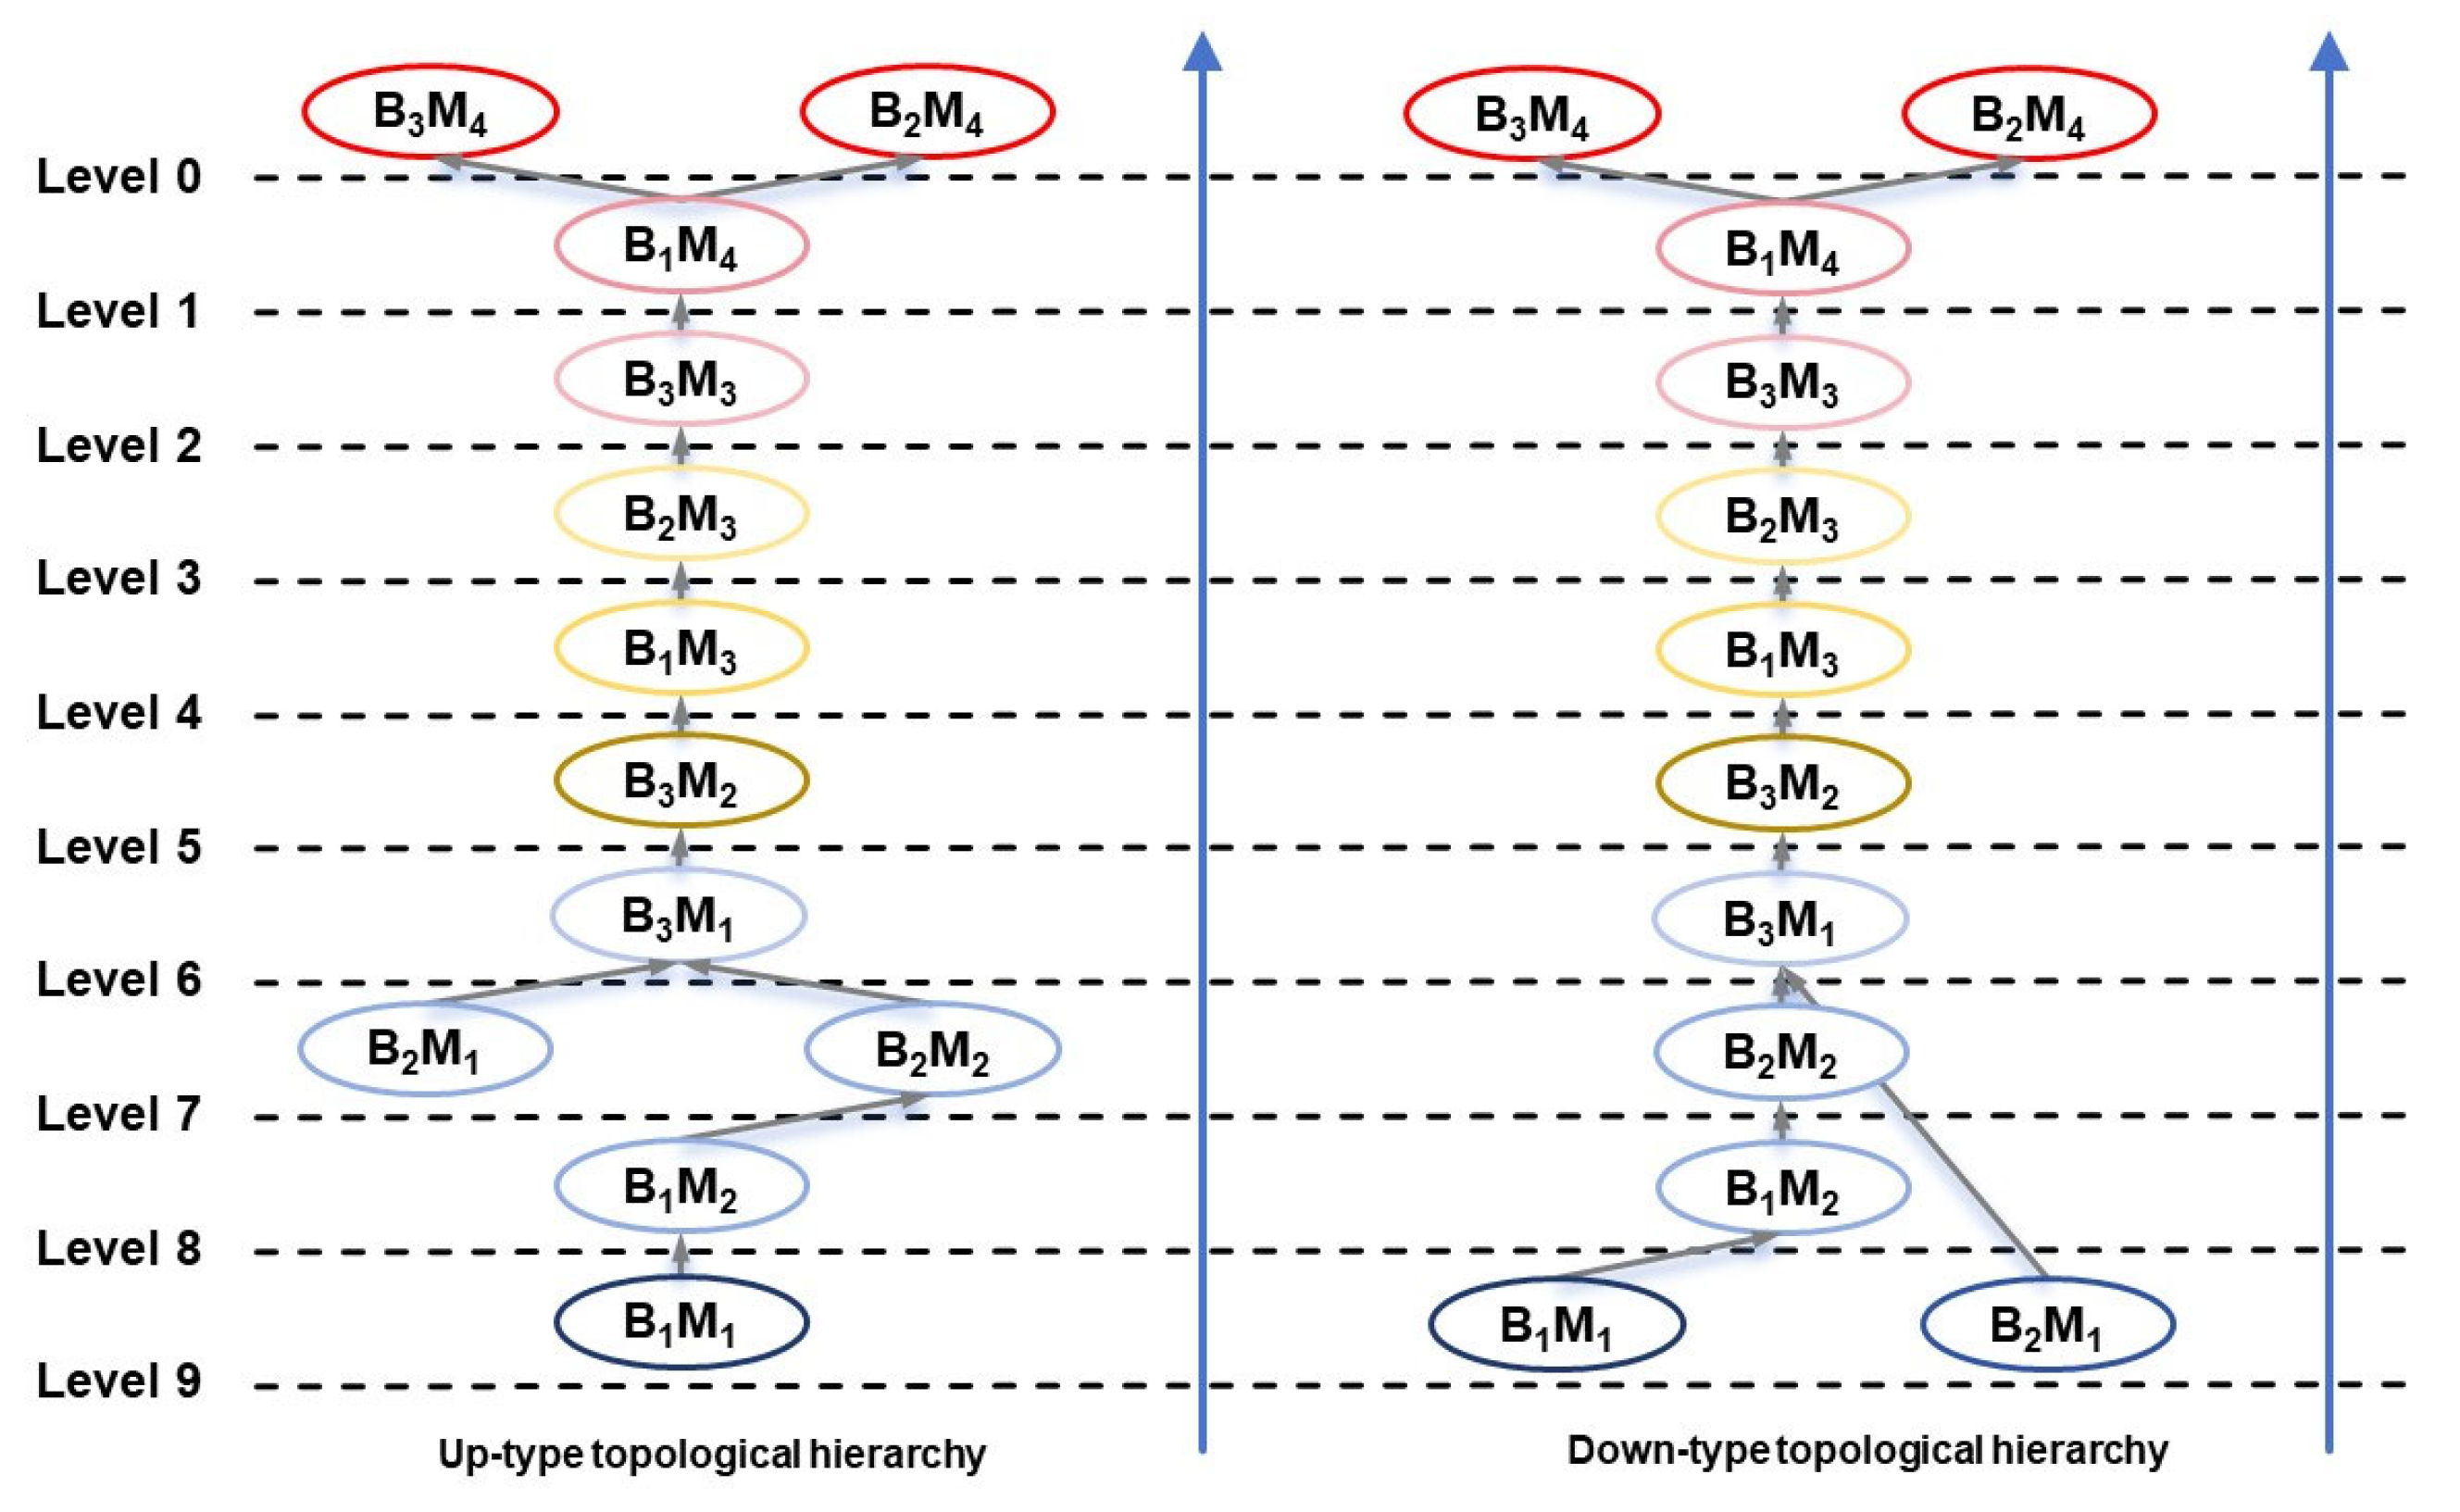
A directed graph representing the topological levels according to Up and Down type topological hierarchies is illustrated in Figure 9. The hierarchical structures exhibit a nine-level hierarchy. A superior level signifies enhanced therapy, whereas an inferior level denotes diminished treatment. The result indicates that B2M4 and B3M4 demonstrated optimal performance, whilst B1M1 displayed the worst performance. These results align with those obtained from the TOPSIS model.

4. Discussion

4.1. Influence of Biochar Amendment on Soil–Water Retention Characteristics

Previous research reports that biochar application to soil can alter its hydrological properties, particularly water retention characteristics [8,52]. Specifically, ref. [10] observed that increasing biochar application rates progressively enhanced several water retention metrics—PAW, RFC, θFC, and limited θMRE—while concurrently decreasing aeration capacity (AC). In contrast with these findings, the results of the present study indicate that biochar amendment did not exert a significant impact on the majority of water retention variables examined (p > 0.05). Significant effects were limited to θFC, RFC, and θMRE (Figure 3 and Figure 4).
Critically, the extent of biochar’s effect on SWRC is highly dependent on its amendment rate [11,53]. For instance, ref. [53] investigated clayey soil amended with 5% and 20% (w/w) biochar, concluding that the 5% rate had no significant effect on SWRC, whereas the 20% rate markedly increased water retention compared to unamended soil. In the present study, the highest amendment rate applied was 0.1%. This relatively low concentration may have been inadequate to substantially influence the soil’s pore distribution. Consequently, significant changes in overall soil hydrological properties were not observed. It was noted, however, that FC, RFC, and θMRE showed improvement even at this low amendment rate, suggesting these particular hydrological parameters may possess greater sensitivity to biochar incorporation.

4.2. Influence of Biochar Amendment on Soil Compressive Characteristics

The literature indicates that biochar amendment modifies key soil physical and mechanical properties. Reductions in dry bulk density and soil compressibility—the latter assessed via the compression index determined from uniaxial compression tests—have been reported following biochar addition [30]. In parallel, ref. [54] observed that the application of straw biochar to expansive soils decreased the compression coefficient while concurrently increasing the void ratio during stabilization. Furthermore, biochar application has been demonstrated to significantly reduce soil penetration resistance [9]. However, the findings of the present study were inconsistent with these previously reported trends. As detailed in Table 3, the application of biochar resulted in significantly increased soil compressive characteristics—specifically pre-compression stress, penetration resistance, compression index, and swelling index—when compared to the non-treated control soil.
These findings may be attributed to the behavior of fine biochar particles within the soil matrix. Biochar particles can fill and potentially clog intergranular voids, possibly displacing mineral particles or organo-mineral components [55,56], leading to more complex particle packing arrangements. This denser structure reduces space for particle movement and elevates interparticle friction forces. Consequently, both pre-compression stress and penetration resistance increased with higher rates of incorporated biochar. Simultaneously, while larger voids are filled by biochar particles with high porosity and large surface area, the process appears to generate an increased volume fraction of smaller pores and elevate soil total pore volume [57]. Such a shift in the pore size distribution towards finer porosity and higher pore volume could explain the concurrent increases observed in the compression and swelling index following biochar amendment.

4.3. Influence of Soil–Water Matric Suction on Soil Compressive Characteristics

Based on the experimental data (Table 3), this study observed that pre-compression stress, penetration resistance, and the compression index all increased as matric suction increased. Conversely, the swelling index decreased under the same conditions. This behavior can likely be attributed to the physical changes occurring as matric suction increases: the water films surrounding soil particles thin and weaken, potentially increasing the contact area between particles. Furthermore, the effective stress within the soil matrix increases under higher suction. These combined factors are understood to contribute to higher pre-compression stress and penetration resistance [58,59].
In this study, the compression index was observed to increase with rising matric suction, while the rebound index decreased accordingly. This relationship appears linked to the state of water within the soil pores. At low matric suction (e.g., 10 kPa, corresponding to high water content), thick water films coat the soil particles, leading to larger inter-particle distances. Under external load, this pore water provides significant support, resulting in lower soil compressibility (a low compression index) and greater elastic recovery upon unloading (a high swelling index). Conversely, at high matric suction (corresponding to low water content), much of the water has drained from the pores. The remaining thin water films offer reduced lubrication and buffering, and the pore water bears little of the applied external load. Consequently, the soil structure is more susceptible to compaction under load (a higher compression index), and its elasticity, or ability to rebound, is diminished (a lower swelling index).

4.4. Optimal Biochar Amendment and Soil–Water Matric Suction Strategy

Observations revealed that soil compressive parameters respond complexly to both biochar application rate and matric suction, leading to apparently conflicting indicators of soil compaction risk. Specifically, this study found that metrics associated with soil resistance (pre-compression stress and penetration resistance) increased as matric suction increased. Paradoxically, the compression index, which indicates susceptibility to compaction, also increased under these matric suction conditions (Table 3). This divergence—where higher soil resistance might suggest lower compaction risk, while a higher compression index suggests greater compaction risk under the same matric suction conditions—underscores the need for a comprehensive evaluation framework. Such a framework is required to balance these contrasting parameters and identify optimal management strategies.
In this study, a multi-objective comprehensive evaluation model based on pre-compression stress, penetration resistance, compression stress and swelling index was proposed. After a comprehensive evaluation by EWM–TOPSIS–AISM, the analysis revealed that achieving a state closer to the ideal compromise solution (i.e., optimal proximity) was generally favored by increasing both the biochar incorporation rate and the soil matric suction, as detailed in Table 5. Based on this evaluation, the specific combination of a 1% biochar application rate and a matric suction of 1000 kPa yielded the maximum proximity to the desired balance. This combination is therefore recommended as optimal for enhancing the evaluated aspects of soil resistance and resilience. These findings highlight the interactive importance of managing soil matric suction and utilizing biochar amendments for effectively modulating soil compressive characteristics.

5. Conclusions

This study quantified the individual and interactive effects of biochar and matric suction on soil–water retention, resistance, and resilience. Key findings revealed that biochar application demonstrably improved soil–water retention characteristics. Furthermore, both biochar and matric suction significantly influenced soil compressive properties (p < 0.05), with a notable interaction effect on pre-compression stress and the compression index (p < 0.05). A comprehensive evaluation using the EWM–TOPSIS–AISM model identified a 1 g kg−1 biochar application rate combined with 1000 kPa matric suction as the optimal treatment for enhancing soil resistance and resilience under the experimental conditions. Looking ahead, long-term field research is crucial to validate these findings and assess the persistence of biochar’s effects, as its properties and consequent influence on soil behavior can evolve.

Author Contributions

Conceptualization, J.A., X.T. and Y.Z.; methodology, J.A. and Y.Z.; investigation, J.A., M.L., N.Y. and Q.F.; data curation, X.T., M.L. and N.Y.; writing—original draft preparation, J.A.; writing—review and editing, J.A., X.T., M.L., Y.Z. and H.Z.; visualization, J.A. and X.T.; supervision, Y.Z. and H.Z.; project administration, Y.Z. and H.Z.; funding acquisition, J.A. All authors have read and agreed to the published version of the manuscript.

Funding

This work was supported by National Key R&D Program of China [Grant Number 2021YFD1500500], National Natural Science Foundation of China [Grant Number 41907005] and Liaoning Provincial Natural Science Foundation of China [Grant Number 2024-MS-090].

Data Availability Statement

The raw data supporting the conclusions of this article will be made available by the authors on request.

Conflicts of Interest

The authors declare no conflicts of interest.

Abbreviations

The following abbreviations are used in the manuscript:
Mechanical Indicators
σpPre-compression stresskPa
PRPenetration resistancekPa
CcCompression index-
CsSwelling index-
Hydraulic Parameters
SWRCSoil–Water Retention Curve-
TAWCTotal Available Water Capacitycm3 cm−3
PAWPlant Available Watercm3 cm−3
RAWReadily Available Watercm3 cm−3
RFCRelative Field Capacitycm3 cm−3
θMMacropore Water Contentcm3 cm−3
θFCField Capacitycm3 cm−3
θMREMaximum Easily Extractable Watercm3 cm−3
θPWPPermanent Wilting Pointcm3 cm−3
Modeling Terms
EWMEntropy Weight Method-
TOPSISTechnique for Order of Preference by Similarity to Ideal Solution-
AISMAdversarial Interpretive Structural Modeling-
eEntropy of Information-
dInformation Utility Value-
wWeight Coefficient-
d i + / d i The Distances Between the Evaluation Objects and the Positive and Negative Ideal Solutions-
TiThe Proximity of an Evaluation Object to the Optimal Scheme-

References

  1. Ding, B.; Tian, J.; Wang, Y.; Zeng, T. Land Cover Extraction in the Typical Black Soil Region of Northeast China Using High-Resolution Remote Sensing Imagery. Land 2023, 12, 1566. [Google Scholar] [CrossRef]
  2. Zhao, P.; Li, S.; Wang, E.; Chen, X.; Deng, J.; Zhao, Y. Tillage Erosion and Its Effect on Spatial Variations of Soil Organic Carbon in the Black Soil Region of China. Soil Tillage Res. 2018, 178, 72–81. [Google Scholar] [CrossRef]
  3. You, D.; Tian, P.; Sui, P.; Zhang, W.; Yang, B.; Qi, H. Short-Term Effects of Tillage and Residue on Spring Maize Yield through Regulating Root-Shoot Ratio in Northeast China. Sci. Rep. 2017, 7, 13314. [Google Scholar] [CrossRef]
  4. Sun, A.; Han, C.; Yu, N.; Fan, Q.; An, J.; Zou, H. Short-Term Effects of Different Tillage and Straw Return Practices on Soil Compression Characteristics in Northeast China. Soil Use Manag. 2025, 41, e70157. [Google Scholar] [CrossRef]
  5. Zhang, B.; Jia, Y.; Fan, H.; Guo, C.; Fu, J.; Li, S.; Li, M.; Liu, B.; Ma, R. Soil Compaction Due to Agricultural Machinery Impact: A Systematic Review. Land Degrad. Dev. 2024, 35, 3256–3273. [Google Scholar] [CrossRef]
  6. Ji, B.; Zhao, Y.; Mu, X.; Liu, K.; Li, C. Effects of Tillage on Soil Physical Properties and Root Growth of Maize in Loam and Clay in Central China. Plant Soil Environ. 2013, 59, 295–302. [Google Scholar] [CrossRef]
  7. Shen, P.; Wu, Z.; Wang, C.; Luo, S.; Zheng, Y.; Yu, T.; Sun, X.; Sun, X.; Wang, C.; He, X. Contributions of Rational Soil Tillage to Compaction Stress in Main Peanut Producing Areas of China. Sci. Rep. 2016, 6, 38629. [Google Scholar] [CrossRef] [PubMed]
  8. Hussain, R.; Ravi, K.; Garg, A. Influence of Biochar on the Soil Water Retention Characteristics (SWRC): Potential Application in Geotechnical Engineering Structures. Soil Tillage Res. 2020, 204, 104713. [Google Scholar] [CrossRef]
  9. Saffari, N.; Hajabbasi, M.A.; Shirani, H.; Mosaddeghi, M.R.; Owens, G. Influence of Corn Residue Biochar on Water Retention and Penetration Resistance in a Calcareous Sandy Loam Soil. Geoderma 2021, 383, 114734. [Google Scholar] [CrossRef]
  10. Castellini, M.; Bondì, C.; Leogrande, R.; Giglio, L.; Vitti, C.; Mastrangelo, M.; Bagarello, V. Evaluating the Effects of Compost, Vermicompost, and Biochar on Physical Quality of Sandy-Loam Soils. Appl. Sci. 2025, 15, 3392. [Google Scholar] [CrossRef]
  11. Barnes, R.T.; Gallagher, M.E.; Masiello, C.A.; Liu, Z.; Dugan, B. Biochar-Induced Changes in Soil Hydraulic Conductivity and Dissolved Nutrient Fluxes Constrained by Laboratory Experiments. PLoS ONE 2014, 9, e108340. [Google Scholar] [CrossRef]
  12. Botková, N.; Vitková, J.; Šurda, P.; Massas, I.; Zafeiriou, I.; Gaduš, J.; Rodrigues, F.C.; Borges, P.F.S. Impact of Biochar Particle Size and Feedstock Type on Hydro-Physical Properties of Sandy Soil. J. Hydrol. Hydromech. 2023, 71, 345–355. [Google Scholar] [CrossRef]
  13. Jačka, L.; Trakal, L.; Ouředníček, P.; Pohořelý, M.; Šípek, V. Biochar Presence in Soil Significantly Decreased Saturated Hydraulic Conductivity Due to Swelling. Soil Tillage Res. 2018, 184, 181–185. [Google Scholar] [CrossRef]
  14. Al-Omran, A.; Ibrahim, A.; Alharbi, A. Evaluating the Impact of Combined Application of Biochar and Compost on Hydro-Physical Properties of Loamy Sand Soil. Commun. Soil Sci. Plant Anal. 2019, 50, 2442–2456. [Google Scholar] [CrossRef]
  15. Thao, T.; Lopez, V.D.; Gonzales, M.; Berhe, A.A.; Diaz, G.; Ghezzehei, T.A. Impact of Almond Shell Biochar Properties and Application Rate on Soil Physical and Hydraulic Characteristics. Sustain. Environ. 2025, 11, 2485688. [Google Scholar] [CrossRef]
  16. Głąb, T.; Palmowska, J.; Zaleski, T.; Gondek, K. Effect of Biochar Application on Soil Hydrological Properties and Physical Quality of Sandy Soil. Geoderma 2016, 281, 11–20. [Google Scholar] [CrossRef]
  17. Alghamdi, A.G. Biochar as a Potential Soil Additive for Improving Soil Physical Properties—A Review. Arab. J. Geosci. 2018, 11, 766. [Google Scholar] [CrossRef]
  18. Ghazouani, H.; Ibrahimi, K.; Amami, R.; Helaoui, S.; Boughattas, I.; Kanzari, S.; Milham, P.; Ansar, S.; Sher, F. Integrative Effect of Activated Biochar to Reduce Water Stress Impact and Enhance Antioxidant Capacity in Crops. Sci. Total Environ. 2023, 905, 166950. [Google Scholar] [CrossRef]
  19. Hardie, M.; Clothier, B.; Bound, S.; Oliver, G.; Close, D. Does Biochar Influence Soil Physical Properties and Soil Water Availability? Plant Soil 2014, 376, 347–361. [Google Scholar] [CrossRef]
  20. Reddy, K.R.; Yaghoubi, P.; Yukselen-Aksoy, Y. Effects of Biochar Amendment on Geotechnical Properties of Landfill Cover Soil. Waste Manag. Res. J. Int. Solid Wastes Public Clean. Assoc. ISWA 2015, 33, 524–532. [Google Scholar] [CrossRef]
  21. Pardo, G.S.; Sarmah, A.K.; Orense, R.P. Mechanism of Improvement of Biochar on Shear Strength and Liquefaction Resistance of Sand. Géotechnique 2019, 69, 471–480. [Google Scholar] [CrossRef]
  22. Bian, X.; Ren, Z.; Zeng, L.; Zhao, F.; Yao, Y.; Li, X. Effects of Biochar on the Compressibility of Soil with High Water Content. J. Clean. Prod. 2024, 434, 140032. [Google Scholar] [CrossRef]
  23. Zhang, Y.; Gu, K.; Tang, C.; Shen, Z.; Narala, G.R.; Shi, B. Effects of Biochar on the Compression and Swelling Characteristics of Clayey Soils. Int. J. Geosynth. Ground Eng. 2020, 6, 22. [Google Scholar] [CrossRef]
  24. Lebert, M.; Horn, R. A Method to Predict the Mechanical Strength of Agricultural Soils. Soil Tillage Res. 1991, 19, 275–286. [Google Scholar] [CrossRef]
  25. Imhoff, S.; Pires, A.; Silva, D.; Fallow, D. Susceptibility to Compaction, Load Support Capacity, and Soil Compressibility of Hapludox. Soil Sci. Soc. Am. J. 2004, 68, 17–24. [Google Scholar] [CrossRef]
  26. Colombi, T.; Torres, L.C.; Walter, A.; Keller, T. Feedbacks between Soil Penetration Resistance, Root Architecture and Water Uptake Limit Water Accessibility and Crop Growth—A Vicious Circle. Sci. Total Environ. 2018, 626, 1026–1035. [Google Scholar] [CrossRef]
  27. Mohieddinne, H.; Brasseur, B.; Spicher, F.; Gallet-Moron, E.; Buridant, J.; Kobaissi, A.; Horen, H. Physical Recovery of Forest Soil after Compaction by Heavy Machines, Revealed by Penetration Resistance over Multiple Decades. For. Ecol. Manag. 2019, 449, 117472. [Google Scholar] [CrossRef]
  28. Souza, R.; Hartzell, S.; Freire Ferraz, A.P.; de Almeida, A.Q.; de Sousa Lima, J.R.; Dantas Antonino, A.C.; de Souza, E.S. Dynamics of Soil Penetration Resistance in Water-Controlled Environments. Soil Tillage Res. 2021, 205, 104768. [Google Scholar] [CrossRef]
  29. Culley, J.L.B.; Larson, W.E. Susceptibility to Compression of a Clay Loam Haplaquoll. Soil Sci. Soc. Am. J. 1987, 51, 562–567. [Google Scholar] [CrossRef]
  30. Petersen, C.T.; Hansen, E.; Larsen, H.H.; Hansen, L.V.; Ahrenfeldt, J.; Hauggaard-Nielsen, H. Pore-Size Distribution and Compressibility of Coarse Sandy Subsoil with Added Biochar. Eur. J. Soil Sci. 2016, 67, 726–736. [Google Scholar] [CrossRef]
  31. Zong, Y.; Chen, D.; Lu, S. Impact of Biochars on Swell–Shrinkage Behavior, Mechanical Strength, and Surface Cracking of Clayey Soil. J. Plant Nutr. Soil Sci. 2014, 177, 920–926. [Google Scholar] [CrossRef]
  32. Chan, K.Y.; Hulugalle, N.R. Changes in Some Soil Properties Due to Tillage Practices in Rainfed Hardsetting Alfisols and Irrigated Vertisols of Eastern Australia. Soil Tillage Res. 1999, 53, 49–57. [Google Scholar] [CrossRef]
  33. Busscher, W.J.; Novak, J.M.; Evans, D.E.; Watts, D.W.; Niandou, M.A.S.; Ahmedna, M. Influence of Pecan Biochar on Physical Properties of a Norfolk Loamy Sand. Soil Sci. 2010, 175, 10. [Google Scholar] [CrossRef]
  34. Blanco-Canqui, H. Does Biochar Application Alleviate Soil Compaction? Review and Data Synthesis. Geoderma 2021, 404, 115317. [Google Scholar] [CrossRef]
  35. He, Z.; Cao, H.; Hu, Q.; Zhang, Y.; Nan, X.; Li, Z. Optimization of Apple Irrigation and N Fertilizer in Loess Plateau of China Based on ANP-EWM-TOPSIS Comprehensive Evaluation. Sci. Hortic. 2023, 311, 111794. [Google Scholar] [CrossRef]
  36. Chamodrakas, I.; Alexopoulou, N.; Martakos, D. Customer Evaluation for Order Acceptance Using a Novel Class of Fuzzy Methods Based on TOPSIS. Expert Syst. Appl. 2009, 36, 7409–7415. [Google Scholar] [CrossRef]
  37. Mahdavi, I.; Mahdavi-Amiri, N.; Heidarzade, A.; Nourifar, R. Designing a Model of Fuzzy TOPSIS in Multiple Criteria Decision Making. Appl. Math. Comput. 2008, 206, 607–617. [Google Scholar] [CrossRef]
  38. Sun, L.; Li, B.; Yao, M.; Niu, D.; Gao, M.; Mao, L.; Xu, Z.; Wang, T.; Wang, J. Optimising Water and Nitrogen Management for Greenhouse Tomatoes in Northeast China Using EWM−TOPSIS−AISM Model. Agric. Water Manag. 2023, 290, 108579. [Google Scholar] [CrossRef]
  39. Zhang, Y.; Zhang, Y.; Zhang, H.; Zhang, Y. Evaluation on New First-Tier Smart Cities in China Based on Entropy Method and TOPSIS. Ecol. Indic. 2022, 145, 109616. [Google Scholar] [CrossRef]
  40. Liu, H.; Li, H.; Ning, H.; Zhang, X.; Li, S.; Pang, J.; Wang, G.; Sun, J. Optimizing Irrigation Frequency and Amount to Balance Yield, Fruit Quality and Water Use Efficiency of Greenhouse Tomato. Agric. Water Manag. 2019, 226, 105787. [Google Scholar] [CrossRef]
  41. Yu, X.; Zhang, J.; Zhang, Y.; Ma, L.; Jiao, X.; Zhao, M.; Li, J. Identification of Optimal Irrigation and Fertilizer Rates to Balance Yield, Water and Fertilizer Productivity, and Fruit Quality in Greenhouse Tomatoes Using TOPSIS. Sci. Hortic. 2023, 311, 111829. [Google Scholar] [CrossRef]
  42. An, J.; Shao, S.; Yu, N.; Fan, Q.; Zhang, Y.; Zou, H. Soil Condition Determines How Crop Residues Affect Soil Compressive Characteristics. Eur. J. Soil Sci. 2024, 75, e13499. [Google Scholar] [CrossRef]
  43. Dane, J.H.; Topp, C.G.; Campbell, G.S. Methods of Soil Analysis, Part 4: Physical Methods; SSSA Book Series; Wiley: Hoboken, NJ, USA, 2002; ISBN 978-0-89118-841-4. [Google Scholar]
  44. Sparks, D.L.; Page, A.L.; Helmke, P.A.; Loeppert, R.H. Methods of Soil Analysis, Part 3: Chemical Methods; SSSA Book Series; John Wiley & Sons, Ltd.: Hoboken, NJ, USA, 1996; ISBN 978-0-89118-825-4. [Google Scholar]
  45. Nelson, D.W.; Sommers, L.E. Total Carbon, Organic Carbon, and Organic Matter. In Methods of Soil Analysis; John Wiley & Sons, Ltd.: Hoboken, NJ, USA, 1996; pp. 961–1010. ISBN 978-0-89118-866-7. [Google Scholar]
  46. Dane, J.H.; Hopmans, J.W. 3.3.2 Laboratory. In Methods of Soil Analysis; John Wiley & Sons, Ltd.: Hoboken, NJ, USA, 2002; pp. 675–720. ISBN 978-0-89118-893-3. [Google Scholar]
  47. van Genuchten, M.T. A Closed-Form Equation for Predicting the Hydraulic Conductivity of Unsaturated Soils. Soil Sci. Soc. Am. J. 1980, 44, 892–898. [Google Scholar] [CrossRef]
  48. Reynolds, W.D.; Bowman, B.T.; Drury, C.F.; Tan, C.S.; Lu, X. Indicators of Good Soil Physical Quality: Density and Storage Parameters. Geoderma 2002, 110, 131–146. [Google Scholar] [CrossRef]
  49. Gregory, A.S.; Whalley, W.R.; Watts, C.W.; Bird, N.R.A.; Hallett, P.D.; Whitmore, A.P. Calculation of the Compression Index and Precompression Stress from Soil Compression Test Data. Soil Tillage Res. 2006, 89, 45–57. [Google Scholar] [CrossRef]
  50. Keller, T.; Lamandé, M.; Schjønning, P.; Dexter, A.R. Analysis of Soil Compression Curves from Uniaxial Confined Compression Tests. Geoderma 2011, 163, 13–23. [Google Scholar] [CrossRef]
  51. Xiao, Z.; Yu, N.; An, J.; Zou, H.; Zhang, Y. Soil Compressibility and Resilience Based on Uniaxial Compression Loading Test in Response to Soil Water Suction and Soil Organic Matter Content in Northeast China. Sustainability 2022, 14, 2620. [Google Scholar] [CrossRef]
  52. Razzaghi, F.; Obour, P.B.; Arthur, E. Does Biochar Improve Soil Water Retention? A Systematic Review and Meta-Analysis. Geoderma 2020, 361, 114055. [Google Scholar] [CrossRef]
  53. Wong, J.T.F.; Chen, Z.; Chen, X.; Ng, C.W.W.; Wong, M.H. Soil-Water Retention Behavior of Compacted Biochar-Amended Clay: A Novel Landfill Final Cover Material. J. Soils Sediments 2017, 17, 590–598. [Google Scholar] [CrossRef]
  54. Wang, K.; Hu, W.; Xu, Z.; Xue, Y.; Zhang, Z.; Liao, S.; Zhang, Y.; Li, X.; Ren, T.; Cong, R.; et al. Seasonal Temporal Characteristics of In Situ Straw Decomposition in Different Types and Returning Methods. J. Soil Sci. Plant Nutr. 2022, 22, 4228–4240. [Google Scholar] [CrossRef]
  55. Burgeon, V.; Fouché, J.; Leifeld, J.; Chenu, C.; Cornélis, J.-T. Organo-Mineral Associations Largely Contribute to the Stabilization of Century-Old Pyrogenic Organic Matter in Cropland Soils. Geoderma 2021, 388, 114841. [Google Scholar] [CrossRef]
  56. Zanutel, M.; Garré, S.; Sanglier, P.; Bielders, C. Biochar Modifies Soil Physical Properties Mostly through Changes in Soil Structure Rather than through Its Internal Porosity. Vadose Zone J. 2024, 23, e20301. [Google Scholar] [CrossRef]
  57. Liu, Z.; Dugan, B.; Masiello, C.A.; Gonnermann, H.M. Biochar Particle Size, Shape, and Porosity Act Together to Influence Soil Water Properties. PLoS ONE 2017, 12, e0179079. [Google Scholar] [CrossRef]
  58. Peng, X.H.; Horn, R.; Zhang, B.; Zhao, Q.G. Mechanisms of Soil Vulnerability to Compaction of Homogenized and Recompacted Ultisols. Soil Tillage Res. 2004, 76, 125–137. [Google Scholar] [CrossRef]
  59. Tang, A.-M.; Cui, Y.-J.; Eslami, J.; Défossez, P. Analysing the Form of the Confined Uniaxial Compression Curve of Various Soils. Geoderma 2009, 148, 282–290. [Google Scholar] [CrossRef]
Figure 1. Physical appearance and microstructure of the corn straw-derived biochar. (a) Macroscopic view of the biochar particles used in the study; (b) scanning electron microscope (SEM) image revealing the porous surface structure.
Agronomy 16 00499 g001
Figure 2. Flowchart illustrating the calculation process for the combined EWM–TOPSIS–AISM methodology.
Agronomy 16 00499 g002
Figure 3. Effect of biochar application rate on key soil–water content parameters: macropore (θM), field capacity (θFC), maximum easily extractable water (θMRE), and permanent wilting point (θPWP). Biochar treatments are B1 = 0, B2 = 0.5 and B3 = 1 g kg−1. Data are presented as mean ± standard deviation (n = 3). Different lowercase letters denote significant differences among treatments for a given parameter (p < 0.05) according to the least significant difference (LSD) test.
Agronomy 16 00499 g003
Figure 4. Fluctuation of water capacitive characteristics with varying biochar application rates. TAWC, PAW, RAW and RFC presented, respectively, total available water, plant available water, readily available water and relative field capacity. Data are presented as mean ± standard deviation (n = 3). Different lowercase letters indicate significant differences among biochar rates for the same critical water content. Significant differences are at the 5% level according to the least significant difference (LSD) test.
Agronomy 16 00499 g004
Figure 5. Pre-compression stress as a function of biochar application rate and matric suction. Treatments include three biochar rates (B1 = 0, B2 = 0.5 and B3 = 1 g kg−1) and four matric suctions (M1 = 6, M2 = 10, M3 = 600 and M4 = 1000 kPa). Data are presented as mean ± standard deviation (n = 3). Lowercase letters indicate significant differences among biochar rates within the same matric suction level. Uppercase letters indicate significant differences among matric suction levels within the same biochar rate. Significant differences are at the 5% level according to the least significant difference (LSD) test.
Agronomy 16 00499 g005
Figure 6. Penetration resistance at varying matric suctions (M1 = 6, M2 = 10, M3 = 600 and M4 = 1000 kPa) and biochar application rates (B1 = 0, B2 = 0.5 and B3 = 1 g kg−1). Data are presented as mean ± standard deviation (n = 3). The lowercase letter indicates a significant difference between biochar application rates in the same matric suction. The uppercase letter indicates a significant difference between matric suctions in the same biochar application rate. Significant differences are at the 5% level according to the least significant difference (LSD) test.
Agronomy 16 00499 g006
Figure 7. Compression index at varying matric suctions (M1 = 6, M2 = 10, M3 = 600 and M4 = 1000 kPa) and biochar application rates (B1 = 0, B2 = 0.5 and B3 = 1 g kg−1). Data are presented as mean ± standard deviation (n = 3). The lowercase letter indicates a significant difference between biochar application rates in the same matric suction. The uppercase letter indicates a significant difference between matric suctions in the same biochar application rate. Significant differences are at the 5% level according to the least significant difference (LSD) test.
Agronomy 16 00499 g007
Figure 8. Swelling index at varying matric suctions (M1 = 6, M2 = 10, M3 = 600 and M4 = 1000 kPa) and biochar application rates (B1 = 0, B2 = 0.5 and B3 = 1 g kg−1). Data are presented as mean ± standard deviation (n = 3). The lowercase letter indicates a significant difference between biochar application rates in the same matric suction. The uppercase letter indicates a significant difference between matric suctions in the same biochar application rate. Significant differences are at the 5% level according to the least significant difference (LSD) test.
Agronomy 16 00499 g008
Figure 9. Hierarchical ranking of all treatment combinations generated by the Adversarial Interpretive Structure Model (AISM). The directed graph integrates both “Up” (advantage-based) and “Down” (disadvantage-based) topological hierarchies. Treatments are ranked from best (top) to worst (bottom), with the treatment at the highest level representing the Pareto optimal solution for enhancing soil resistance and resilience.
Agronomy 16 00499 g009
Table 1. Various physiochemical properties of soil used in this study.
Soil TypepH (1:2.5)Organic Matter (g/kg) Bulk Density (g/cm3)Clay (g/kg) Sand (g/kg)Silt (g/kg) Textural Class
Brwon soil 5.713.241.3625764598Sand clay loam
Table 2. Basic physical and chemical properties of biochar.
BiomassPyrolysis Temperature (°C)Pyrolysis Time (h)Ash Content (%)Total Carbon (%)Total Nitrogen (%)Specific Surface Area (m2/g)
Corn straw50055.555.21.753.26
Table 3. Effects of biochar and matric potential on soil compressive characteristics.
TreatmentLevelPre-Compression Stress (kPa)Penetrometer Resistance (MPa)Compression IndexSwelling Index
Matric potentialM16.128 ± 1.428 c0.3072 ± 0.0115 c0.4238 ± 0.0281 b0.0182 ± 0.0004 a
M28.906 ± 2.235 c0.3265 ± 0.0201 c0.4468 ± 0.0339 b0.0174 ± 0.0005 ab
M318.31 ±1.528 b0.9597 ± 0.0210 b0.4838 ± 0.0151 ab0.0164 ± 0.0006 b
M468.33 ± 4.163 a1.0412 ± 0.0431 a0.5657 ± 0.0286 a0.0130 ± 0.0002 c
BiocharB118.30 ± 7.098 c0.5956 ± 0.1007 b0.4348 ± 0.0224 b0.0156 ± 0.00089 b
B225.47 ± 9.630 b0.6935 ± 0.1040 a0.4627 ± 0.0292 b0.0158 ± 0.00129 b
B332.49 ± 8.487 a0.6867 ± 0.0978 a0.5425 ± 0.0161 a0.0175 ± 0.00131 a
Analysis of varianceMp < 0.01p < 0.01p < 0.01p < 0.01
Bp < 0.01p < 0.01p < 0.01p < 0.01
M × Bp < 0.05nsp < 0.05ns
Note. Data are expressed as means ± standard deviation (n = 3 for each treatment combination). Different lowercase letters in the same column indicate significant differences among treatments at the p < 0.05 level according to the least significant difference (LSD) test. M, B, and M × B represent the main effects and their interaction, respectively. ns indicates no significant difference.
Table 4. The weight of each indicator calculated based on the Entropy Weight Method.
Indicatoredw
Pre-compression stress (kPa)0.8200.18033.54%
Penetrometer resistance (MPa)0.8190.18133.80%
Compression index0.9090.09117.03%
Swelling index0.9160.08415.62%
Note. e: entropy of information; d: information utility value; w: weight coefficient.
Table 5. Distance between the top 10 treatments and positive and negative ideal solutions, as well as their closeness.
Treatment d i + d i TiRanking
B1M10.2200.0130.05612
B1M20.2110.0190.08311
B1M30.1330.1040.4396
B1M40.0630.1630.7223
B2M10.2080.0230.10110
B2M20.2020.0230.1049
B2M30.1160.1210.5105
B2M40.0230.2160.9062
B3M10.1870.0480.2058
B3M20.1720.0620.2657
B3M30.0910.1420.6104
B3M40.0210.2130.9091
Note. The distances between the evaluation objects and the positive and negative ideal solutions are denoted by d i + and d i , respectively. Ti: the proximity of an evaluation object to the optimal scheme. A higher Ti indicates a closer approach to the optimal scheme.
Disclaimer/Publisher’s Note: The statements, opinions and data contained in all publications are solely those of the individual author(s) and contributor(s) and not of MDPI and/or the editor(s). MDPI and/or the editor(s) disclaim responsibility for any injury to people or property resulting from any ideas, methods, instructions or products referred to in the content.