Article

Enhanced PAH Degradation in Freeze–Thaw Farmland Soil Using Composite Biochar-Immobilized Cold-Tolerant Microbial Consortium

School of Environmental Science, Liaoning University, Shenyang 110036, China
*
Author to whom correspondence should be addressed.
Agronomy 2026, 16(4), 472; https://doi.org/10.3390/agronomy16040472
Submission received: 6 January 2026 / Revised: 7 February 2026 / Accepted: 16 February 2026 / Published: 19 February 2026
(This article belongs to the Section Soil and Plant Nutrition)

Abstract

This study focused on slightly to moderately PAH-contaminated farmland soils in freeze–thaw regions of Northeast China, aiming to fill the research gap in the in situ remediation mechanisms of PAHs under natural freeze–thaw conditions. A 12-month in situ experiment was conducted with four treatments—blank control (CK), biochar (BC), microbial agent (MA), and immobilized microorganisms (IM)—to verify that biochar-loaded IM alleviates temperature stress and sustains efficient PAH removal by regulating soil and microbial properties. PAH removal efficiency and soil chemical properties were monitored during both normal-temperature and freeze–thaw periods, and the soil bacterial community structure was analyzed at the end of the experiment. Results showed that IM achieved the optimal remediation performance with a total PAH removal rate of 72.53%, was least affected by temperature fluctuations, and maintained stable remediation during the freeze–thaw period. IM increased soil nutrient contents, with available potassium and nitrogen exerted positive effects on PAH degradation; it also enriched the functional genes K00626 and K00457 and comprehensively optimized the bacterial community. This study clarified the core remediation mechanism and provided scientific, technical, and theoretical support for related in situ remediation practices.

1. Introduction

Polycyclic aromatic hydrocarbons (PAHs), as persistent organic pollutants, are widely present in agricultural soils [1]. PAHs not only disrupt soil physicochemical properties and inhibit microbial activity but may also accumulate in crops, entering the food chain and posing a serious threat to agricultural product quality and human health [1,2]. PAH pollution in China’s agricultural soils is primarily caused by non-point source pollution, with relatively low concentrations but extensive contamination [3,4]. At low concentrations, PAHs in the soil mainly exist in adsorbed and bound forms, with poor water solubility and resistance to direct microbial degradation [2,5]. The unique seasonal freeze–thaw cycle of Northeast China’s agricultural soils further exacerbates the difficulty of remediation. Low temperatures inhibit the metabolic capacity of soil microbes for PAHs, while freeze–thaw-induced soil pore structure alteration traps PAHs in soil aggregates and reduces their bioavailability [6], posing great challenges for in situ PAH remediation in this region.
In recent years, bioremediation technology has become a research hotspot in the field of soil PAH remediation due to its sustainability, efficiency, and environmental friendliness [7]. Microbial degradation is the most widely used bioremediation technology and performs effectively in low-concentration PAH-contaminated agricultural soils. However, the remediation effect of single microorganisms is easily constrained by environmental conditions [8]. In contrast, the microbial consortium can efficiently degrade both high and low molecular weight PAHs (HMW PAHs and LMW PAHs) under harsh conditions such as low temperatures, significantly improving remediation efficiency and stability [9,10,11].
Biochar, as a commonly used carrier material, can simultaneously achieve pollution remediation and soil improvement when applied to soil. However, single-temperature pyrolyzed biochar has inherent limitations: high-temperature biochar excels in HMW PAH adsorption but poorly promotes their biodegradation [12,13], while low-temperature biochar favors microbial colonization but has insufficient adsorption capacity and poor desorption stability [14,15]. Biochar-based immobilized microbial technology synergistically combines the environmental buffering of carrier materials with the PAH-degrading function of functional microbes, and thus exhibits great potential for PAH remediation [16,17]. However, existing research mainly focuses on constant-temperature laboratory conditions, and studies on in situ remediation mechanisms and environmental adaptability under natural freeze–thaw cycles are still lacking.
This study hypothesizes that a composite biochar-immobilized cold-tolerant microbial consortium can alleviate freeze–thaw stress, synergistically optimize soil chemical properties and microbial communities, and thereby realize efficient and stable PAH removal in farmland soils. The study aims to: (1) evaluate the in situ remediation performance of the immobilized microbial system for total, HMW and LMW PAHs under natural freeze–thaw cycles in Northeast China; (2) elucidate the mechanisms of PAH degradation and soil quality improvement as regulated by soil chemical properties, bacterial communities, and PAH-degrading genes. The results are expected to provide a practical strategy for the remediation of low-to-moderate PAH-contaminated farmland soils in seasonal freeze–thaw regions.

2. Materials and Methods

2.1. Experimental Design

This study was conducted in a typical freeze–thaw soybean field in Northeast China to assess the remediation and soil improvement efficiency of a composite biochar-immobilized cold-tolerant PAH-degrading microbial consortium in low-to-moderate PAH-contaminated agricultural soils, and to elucidate the underlying mechanisms under natural freeze–thaw conditions.
All experiments and analyses were performed at the College of Environmental Science, Liaoning University, Shenyang, Liaoning 110036, China. The experimental site is located in the soybean field of Kuanchang Village, Xinjingtun Township, Liaozhong District, Shenyang City, Liaoning Province, China (41°37′ N, 123°40′ E). This village is situated along the Xi River in western Shenyang, and it is a long-term stable agricultural land dominated by dryland cultivation of soybean and maize. Affected by historical sewage irrigation from the Xi River, intensive agricultural cultivation and surrounding breeding activities, this area has potential non-point source inputs of PAHs. The site has freeze–thaw cycles from November to April, with an average annual temperature ranging from 4 to 16 °C. The minimum temperature in January is approximately −14 °C, and the maximum temperature in July is approximately 25 °C. Prior to the experiment, the pH of the experimental soil was mildly acidic, and the initial total PAH concentration, determined in April 2023, was 72.66 μg·kg−1. According to the Maliszewska-Kordybach [18] classification, the soil at this site was classified as non-contaminated, with its PAH contamination level falling into the low-to-moderate risk category overall. Background values of soil chemical properties were determined from the blank control group (CK) samples collected in May 2023.
The experiment followed a randomized block design with four treatment groups, each with three biological replicates. The basic experimental unit was a 3 m × 3 m square plot, with ≥2 m buffer zones between adjacent plots. Four treatments were established as follows: (1) Blank control (CK): No external materials were added, only conventional tillage was performed to control for tillage effects; (2) Biochar (BC): Composite biochar was applied at a rate of 1% (w/w) of dry soil weight; (3) Free microbial agent (MA): A cold-tolerant PAH-degrading fungal-bacterial agent was applied at a rate of 1% (w/w) of dry soil weight; and (4) Immobilized microorganism (IM): The prepared IM was applied at a rate of 2% (w/w) of dry soil weight. All amendments were thoroughly mixed into the 0–20 cm topsoil layer.
The experiment lasted 12 months (April 2023 to April 2024) and was divided into two phases: the ambient temperature period (May–October 2023) and the freeze–thaw period (November 2023–April 2024). Soil PAH removal efficiency and dynamic changes in soil properties were monitored throughout the experiment. At the end, the soil bacterial community structure and the abundance of PAH-degrading functional genes were quantified.

2.2. Experimental Materials and Preparation Methods

2.2.1. Preparation of Composite Biochar (BC)

Test Biochar: Corn cobs and wheat straw were purchased from Henan Lize Environmental Protection Technology Co., Ltd., China (Beijing, China).
The materials were washed three times with tap water, twice with distilled water, air-dried for 2 days, and further dried at 75 °C in an oven. The dried corn cobs and wheat straw were placed separately into iron cans (10 cm × 10 cm, diameter × length), compacted, and purged with nitrogen to expel oxygen. The corn cobs were pyrolyzed at 500 °C for 4 h (heating rate of 10 °C/min) in a muffle furnace, then cooled to room temperature to obtain corn cob biochar (C500). Similarly, the wheat straw was pyrolyzed at 300 °C for 4 h (heating rate of 10 °C/min) to obtain wheat straw biochar (B300). C500 and B300 were mixed in a 1:2 mass ratio, autoclaved at 121 °C for 60 min to obtain the composite biochar (BC).

2.2.2. Preparation of Free Microbial Consortium Agent (MA)

Test Strains: Pseudomonas sp. SDR4 (GCMCC NO. 14048) and Mortierella alpine JDR7 (GCMCC NO. 15183) are cold-tolerant and highly efficient PAH-degrading strains isolated by our research team in 2019. The cultivation methods for these strains are provided in Text S1.
Composition of Solid Medium: Peptone (10 g), yeast extract (5 g), NaCl (5 g), agar (20 g), distilled water to 1000 mL, sterilized at 121 °C for 20 min.
Composition of Liquid Medium: Sucrose (8 g), yeast extract (6 g), KH2PO4 (1.0 g), (NH4)2HPO4 (4 g), MgSO4·H2O (0.5 g), pH 6.0–6.5, sterilized at 121 °C for 20 min.
A 1:1 (v/v) mixture of bacterial suspension Pseudomonas sp. SDR4 and fungal suspension Mortierella alpine JDR7 was inoculated at a 10% (v/v) inoculum volume into the solid medium. After 2 days, the mixture was transferred to the liquid medium and incubated at 15 °C for 72 h in a shaking incubator to obtain the mixed microbial agent (MA).

2.2.3. Preparation of Immobilized Microorganisms (IM)

The composite biochar was mixed with the proliferation medium (sucrose 80 g, yeast extract 60 g, KH2PO4 10 g, (NH4)2HPO4 40 g, MgSO4·H2O 5 g, pH 6.0–6.5) in a 1:1 (w/v) ratio. After thorough soaking, the mixed microbial agent was inoculated at a 10% (v/v) inoculum volume daily for 3 days. After inoculation, the culture system was maintained at 15 °C for further cultivation to obtain the immobilized mixed microbial agent (IM).

2.3. Field Experiment Setup and Sample Collection

2.3.1. Field Experiment Setup

In April 2023, the experimental site underwent full plowing, plot division, and boundary isolation. The prepared composite biochar (BC), free microbial agent (MA), and immobilized microbial agent (IM) were applied to their corresponding plots. The materials were evenly broadcast onto the soil surface using a fertilizer spreader and thoroughly mixed into the top 0–20 cm layer using a rotary tiller. After setting up all treatment plots, the formal field experiment began with consistent field management practices across all plots.

2.3.2. Soil Sample Collection

A total of 13 soil sampling events were conducted at a 0–20 cm topsoil depth. Samples from different times served as initial background values for soil PAHs and physicochemical properties, with details as follows:
Pretreatment Sampling (April 2023): One random sample was taken from each plot (12 samples total) before the experimental setup, solely to determine the PAH concentrations as the initial contamination background. The ring-specific PAH concentrations were 12.36 μg·kg−1 (2-ring), 9.62 μg·kg−1 (3-ring), 23.54 μg·kg−1 (4-ring), 16.01 μg·kg−1 (5-ring), and 11.13 μg·kg−1 (6-ring).
Periodic Sampling (May 2023–April 2024): Three random sites were selected per plot monthly, and samples from these sites were mixed into one composite sample, resulting in 12 composite samples per event (3 per treatment). The first periodic sampling (May 2023) from the CK group (no exogenous materials) provided initial background values for soil physicochemical properties: pH 6.34; total carbon (TC) 16.02 g·kg−1; total nitrogen (TN) 1.53 g·kg−1; total phosphorus (TP) 0.92 g·kg−1; alkali-hydrolyzable nitrogen (AN) 94.2 mg·kg−1; available phosphorus (AP) 46.03 mg·kg−1; available potassium (AK) 92.18 mg·kg−1.
All samples were split into two aliquots: one frozen at −18 °C for PAH quantification and microbial community/functional gene analysis and the other air-dried at room temperature for physicochemical property determination.

2.4. Analytical Methods for Indicators

2.4.1. Extraction and Determination of PAHs

The air-dried soil samples were sieved through a 2 mm sieve for pretreatment. PAHs were extracted using accelerated solvent extraction (ASE) with a 1:1 (v/v) mixture of n-hexane and acetone at 100 °C and 100 MPa for 30 min. The extraction columns were packed with 1.5 g of diatomite and 1.5 g of soil. The extracts were concentrated by parallel evaporation, reconstituted with n-hexane, and the extraction was repeated three times to ensure complete PAH recovery.
The concentrated extracts were treated with ultrasonic acetone (60 s), filtered through a 0.22 μm organic membrane, and transferred to chromatographic vials for analysis. PAHs were quantified using gas chromatography-mass spectrometry (GC-MS) in Selected Ion Monitoring (SIM) mode. Detailed protocols are provided in Text S2.

2.4.2. Analysis of Soil Chemical Properties

Soil pH was measured by adding 25 mL of CO2-free deionized water to 10.00 g of sieved air-dried soil, stirring the mixture, and allowing it to stand for 30 min before measuring the pH using a 700 Bench pH Meter (Eutech Instruments, Singapore). Total carbon (TC) and total nitrogen (TN) were determined using an elemental analyzer (Elementar Analysensysteme Vario MACRO Cube, Langenselbold, Germany). Total phosphorus (TP) was measured using an acid digestion-molybdenum-antimony colorimetric method. Alkali-hydrolyzable nitrogen (AN) was determined by an alkaline diffusion method. Available phosphorus (AP) was measured by 0.5 mol/L NaHCO3 extraction and molybdenum-antimony colorimetry, while available potassium (AK) was determined by ammonium acetate extraction and flame photometry.

2.4.3. Soil Bacterial Community Analysis

DNA was extracted using the OMEGA Soil DNA Kit (M5635-02) (Omega Bio-Tek, Norcross, GA, USA). The extracted DNA was subjected to 0.8% agarose gel electrophoresis for molecular size determination, and its concentration was quantified using a Nanodrop spectrophotometer. Universal primers B341F (5′-CCTACGGGNGGCWGCAG-3′) and B785R (5′-GACTACHVGGGTATCTAATCC-3′) were used for amplification. The amplification products were analyzed using 2% agarose gel electrophoresis, and the target fragments were extracted using bead-based sorting for recovery. High-throughput sequencing was performed on the Illumina MiSeq platform (Illumina, San Diego, CA, USA).
PICRUSt 2 (Phylogenetic Investigation of Communities by Reconstruction of Unobserved States, version 2.0) was used to predict genes associated with PAH degradation. PAH degradation genes in each treatment were selected based on the KEGG database.

2.4.4. Air and Soil Temperature Monitoring

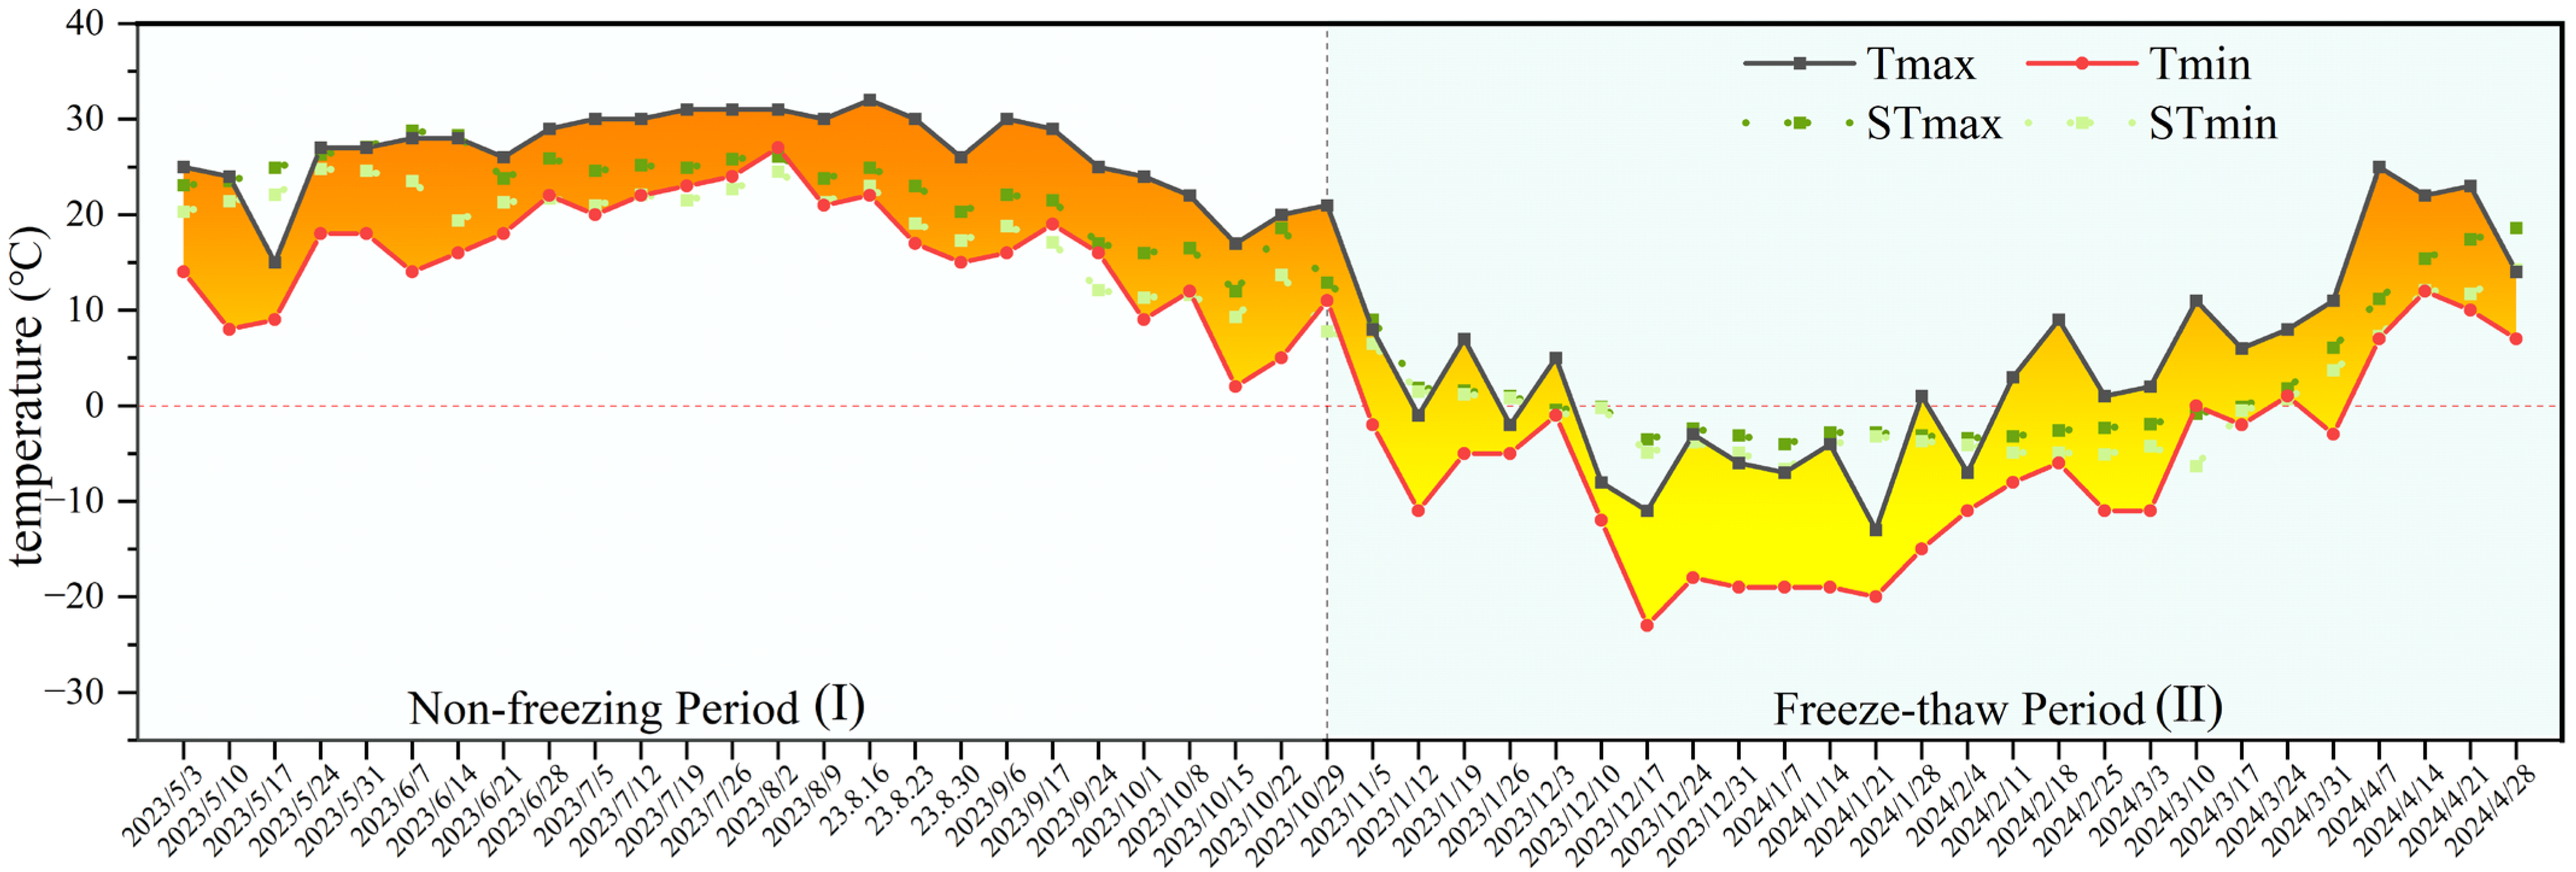
Air temperature data were obtained from the meteorological network of Shenyang City, Liaoning Province, China, while soil temperature data were collected using temperature sensors at the experimental site. We summarized air and soil temperature variations from 3 May 2023 to 28 April 2024. The data showed that from early May to the end of October 2023, the daily minimum air temperature remained above 0 °C (Figure 1). However, from early November 2023 to the end of March 2024, the daily minimum air temperature dropped below 0 °C and then gradually increased. Soil temperature stayed below 0 °C from early December 2023 to mid-March 2024, indicating a freeze–thaw cycle during this period. Specifically, the soil was frozen from early December 2023 to mid-March 2024, and was in a freeze–thaw phase from early November to early December 2023, and again from mid-March to April 2024. For easier analysis, the study divided the observation period into two phases: the normal temperature period (Phase I) from May 2023 to October 2023, and the freeze–thaw period (Phase II) from November 2023 to April 2024. Soil remediation effects were further evaluated based on these two phases.

2.5. Statistical Analysis and Data Analysis

To address temporal autocorrelation in monthly time-series data, a linear mixed model (LMM) with an autoregressive covariance structure of order 1 (AR1) [19,20] was used. Correlation analysis between environmental factors and total PAH removal efficiency was performed using Spearman’s rank correlation and the hierarchical weighted least squares (WLS) method [21,22,23]. Variables with high VIF values were retained if they showed strong statistical significance (p < 0.001) and ecological relevance to PAH removal, following ecological regression guidelines [21].
Statistical analysis was performed using SPSS 27.0, with data analysis and visualization conducted using Excel and Origin 2024. Data were derived from three independent biological replicates (n = 3) and are presented as mean ± standard deviation (SD). One-way analysis of variance (ANOVA) was used for mean comparisons, with the least significant difference (LSD) post hoc test to assess intergroup and intragroup differences. Independent-samples t-tests were also applied for verification. Diversity analysis was performed using QIIME2 software (https://qiime2.org/, accessed on 15 February 2026).

3. Results

3.1. Removal Efficiency of PAHs in Soil

3.1.1. Removal Rates of Total PAHs in Soils

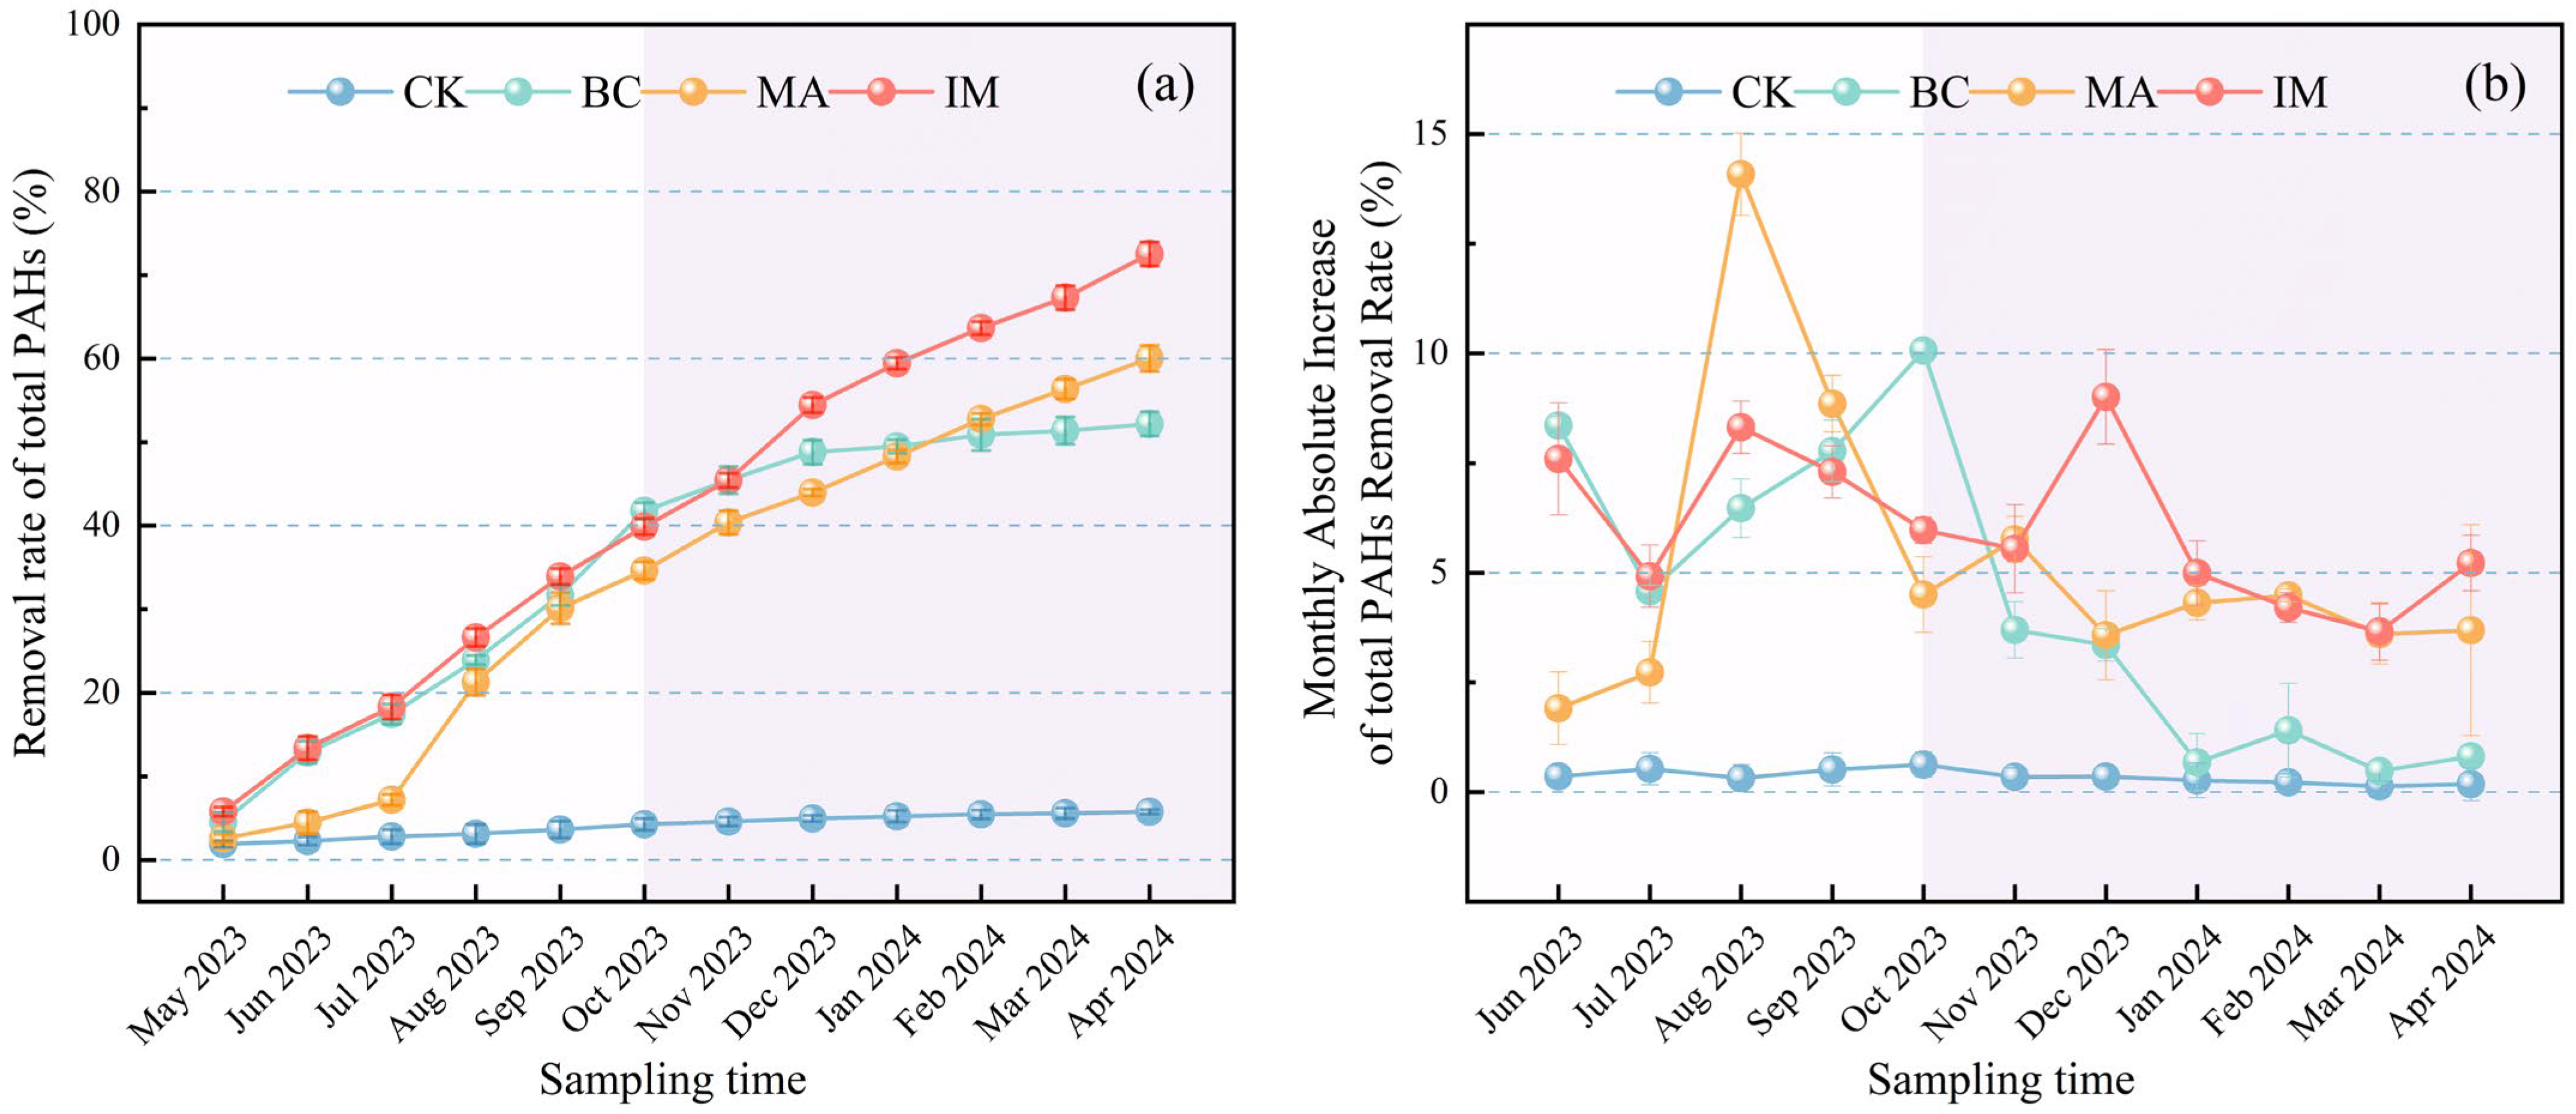
In the first sampling in May 2023, the total PAH removal rates in the soil of the control group (CK) and in the BC, MA and IM treatments were 1.91%, 4.53%, 2.56% and 5.89%, respectively (Figure 2a). At the end of the experiment, the total PAH removal rates of each treatment were 72.53% (IM), 60.05% (MA), 52.19% (BC) and 5.76% (CK), respectively. The residual concentrations of total PAHs in the soil showed the trend: IM (19.97 μg/kg) < MA (29.00 μg/kg) < BC (34.76 μg/kg) < CK (68.47 μg/kg). During the normal temperature period, the total PAH removal rates were 41.77% (BC), 39.90% (IM), 34.63% (MA) and 4.26% (CK). During the freeze–thaw period, the corresponding rates were 54.28% (IM), 38.87% (MA), 17.91% (BC) and 1.56% (CK).
From May to June 2023, the monthly growth rate of total PAH removal was ranked as BC (8.36%) > IM (7.59%) > MA (1.91%) (Figure 2b). The monthly growth rate of total PAH removal in the CK group increased to 0.53% from June to July 2023. From July to August 2023, the MA group had a higher monthly growth rate of total PAH removal (14.08%) than that of the IM group (8.31%). From September to October 2023, the CK and BC groups reached their peak monthly growth rates of total PAH removal, which were 0.63% and 10.06%, respectively.
With the onset of the freeze–thaw period in November 2023 (following October 2023), the monthly growth rate of total PAH removal in the CK and BC groups declined continuously, reaching the minimum values of 0.13% and 0.48% in March 2024, respectively (Figure 2b). The monthly growth rates of total PAH removal in the MA group were 5.76%, 3.57% and 3.60% in November 2023, December 2023 and March 2024, respectively; those in the IM group decreased from 9.01% in December 2023 to 3.66% in March 2024. All treatments showed an increase in the total PAH removal from March to April 2024, and the monthly growth rate was ranked as IM (5.22%) > MA (3.69%) > BC (0.81%) > CK (0.18%).

3.1.2. Temporal Dynamics and Treatment Effects on Total PAH Removal Rates

Results for the covariance parameters suggested a strong positive autocorrelation in the total PAH removal rates between adjacent months (AR1 ρ = 0.755, p < 0.001), confirming the temporal dependence. Sampling time was correlated with temperature in this study, and the effect of temperature is further elaborated subsequently.
Type III fixed effect tests revealed an extremely significant (p < 0.001) time × treatment group interaction for total PAH removal rates. The fixed-effect model estimates suggested that the baseline monthly growth rate of total PAH removal was 6.10% (Table 1). Compared with the reference IM group, the monthly increases in the total PAH removal rate of all other treatment groups (CK, BC, MA) were significantly (p < 0.05) lower. Among these, the CK group exhibited the largest difference, with a monthly growth difference of −5.75%/month and an actual growth rate of only 0.35% (p < 0.001), followed by the BC group, which had a monthly growth difference of −1.72%/month and an actual growth rate of 4.38% (p < 0.001). The MA group showed the smallest difference from the IM group, with a monthly growth difference of −0.76%/month and an actual growth rate of 5.34% (p = 0.040).

3.1.3. Residual Concentrations of Ring-Fractionated PAHs in Soil

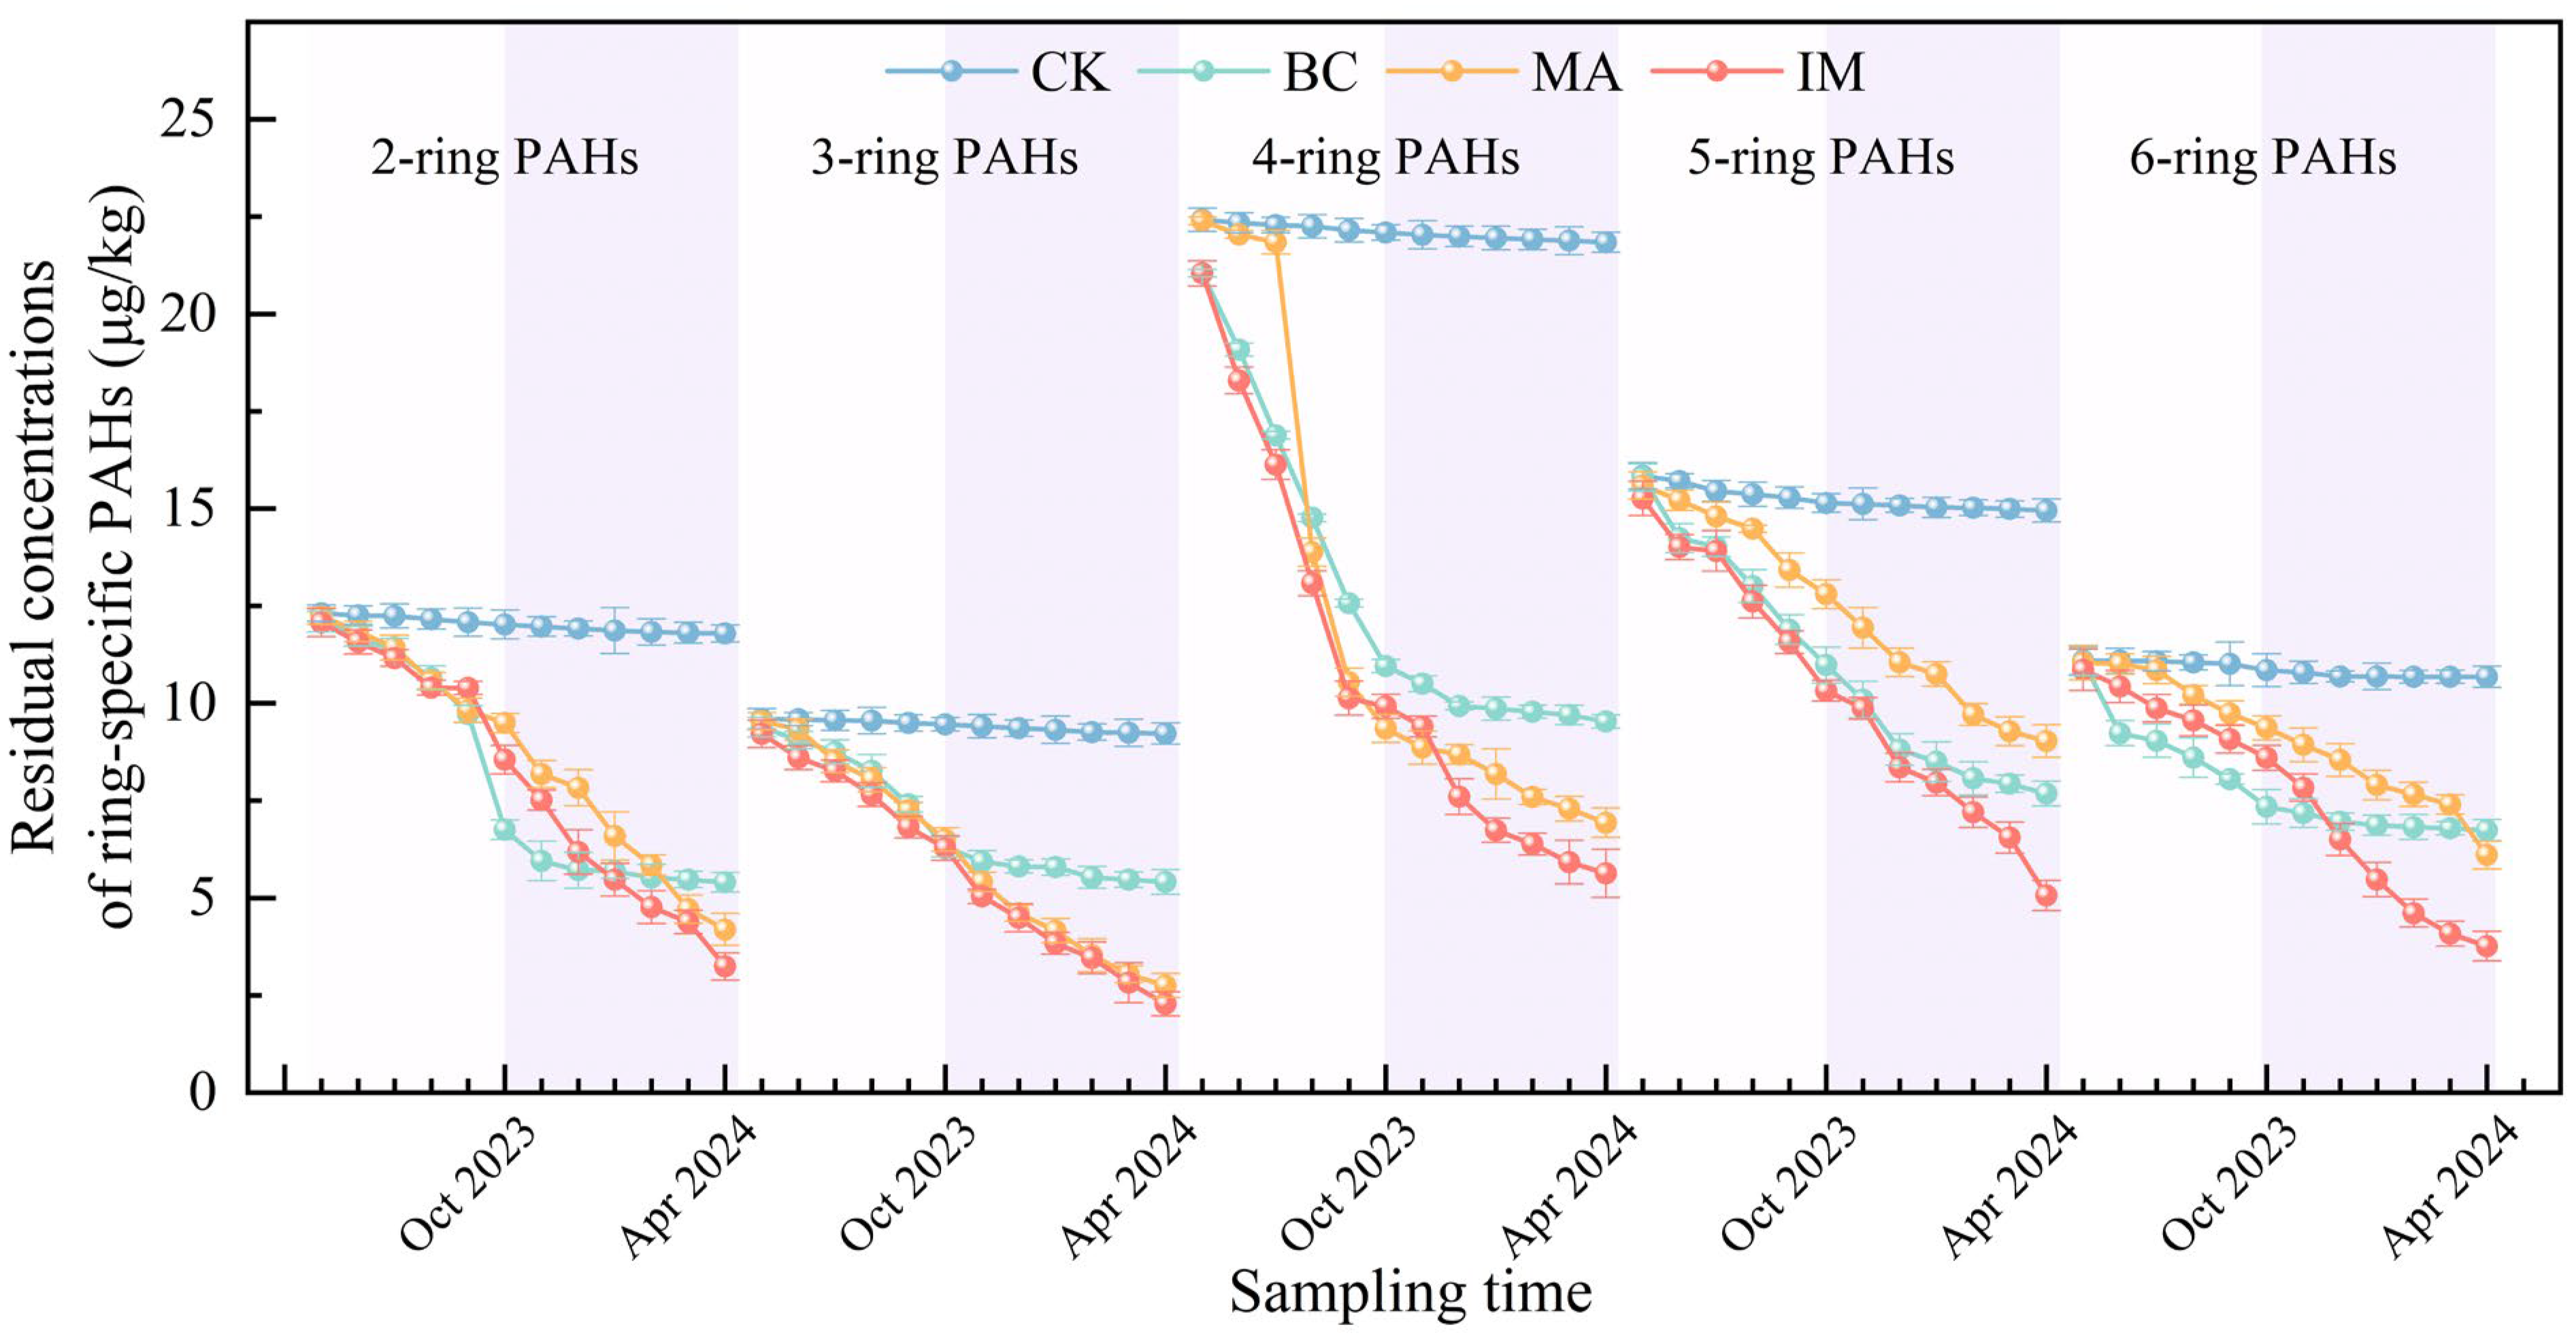
At the end of the experiment, the residual concentrations of PAHs with different ring numbers in the soil showed a clear distribution pattern: the residual concentration of 2-ring PAHs was in the order of IM (3.24 μg/kg) < MA (4.19 μg/kg) < BC (5.40 μg/kg) < CK (11.79 μg/kg); that of 3-ring PAHs was IM (2.28 μg/kg) < MA (2.75 μg/kg) < BC (5.41 μg/kg) < CK (9.22 μg/kg); that of 4-ring PAHs was IM (5.63 μg/kg) < MA (6.93 μg/kg) < BC (9.53 μg/kg) < CK (21.84 μg/kg); that of 5-ring PAHs was IM (5.06 μg/kg) < BC (7.68 μg/kg) < MA (9.03 μg/kg) < CK (14.95 μg/kg); and that of 6-ring PAHs was IM (3.76 μg/kg) < MA (6.10 μg/kg) < BC (6.74 μg/kg) < CK (10.68 μg/kg) (Figure 3). The IM treatment presented significantly (p < 0.05) superior PAH removal efficiency compared with MA and BC, and its residual PAH concentration was significantly lower than that of CK.
At the end of the experiment, the residual concentrations of all PAHs except 5-ring PAHs followed the order IM < MA < BC < CK, with significant iintergroupdifferences (p < 0.05, Table S1); the residual concentration of 5-ring PAHs showed slight numerical differences, with the order IM < BC < MA < CK and also significant (p < 0.05) inter-group differences (p < 0.05). In all PAH fractions, IM had the lowest residual concentration, which was significantly lower than that of MA, BC and CK.
In the original soil (April 2023), the proportions of low molecular weight (LMW) PAHs and high molecular weight (HMW) PAHs were 30.25% and 69.75%, respectively. At the end of the experiment, the proportion of LMW PAHs in the total residual PAHs among all treatment groups was ranked as BC (31.09%) > CK (30.68%) > IM (27.62%) > MA (23.94%), while the proportion of HMW PAHs in the total residual PAHs showed the opposite trend: MA (76.06%) > IM (72.38%) > CK (69.32%) > BC (68.91%).
During the entire experiment, the removal rates of LMW PAHs in soil were ranked as IM (74.09%) > MA (68.41%) > BC (50.83%) > CK (4.45%); the removal rates of HMW PAHs followed the same order: IM (71.48%) > MA (56.48%) > BC (52.74%) > CK (6.33%).
In the normal temperature period, all treatments had a significantly (p < 0.05) higher removal rate of HMW PAHs than that of LMW PAHs. The HMW PAH removal rates in this period were ranked as IM (43.11%) > BC (42.25%) > MA (37.82%) > CK (5.13%), while the LMW PAH removal rates were BC (40.58%) > IM (32.57%) > MA (27.27%) > CK (2.30%).
In the freeze–thaw period, IM, MA and CK treatments had higher removal rates for LMW PAHs, while BC treatment maintained a relatively high removal rate for HMW PAHs. The LMW PAH removal rates in this period were ranked as IM (42.34%) > MA (41.14%) > BC (10.25%) > CK (2.15%), and the HMW PAH removal rates were IM (28.37%) > MA (18.66%) > BC (10.48%) > CK (1.20%).

3.2. Changes in Soil Chemical Properties

3.2.1. Changes in Soil pH

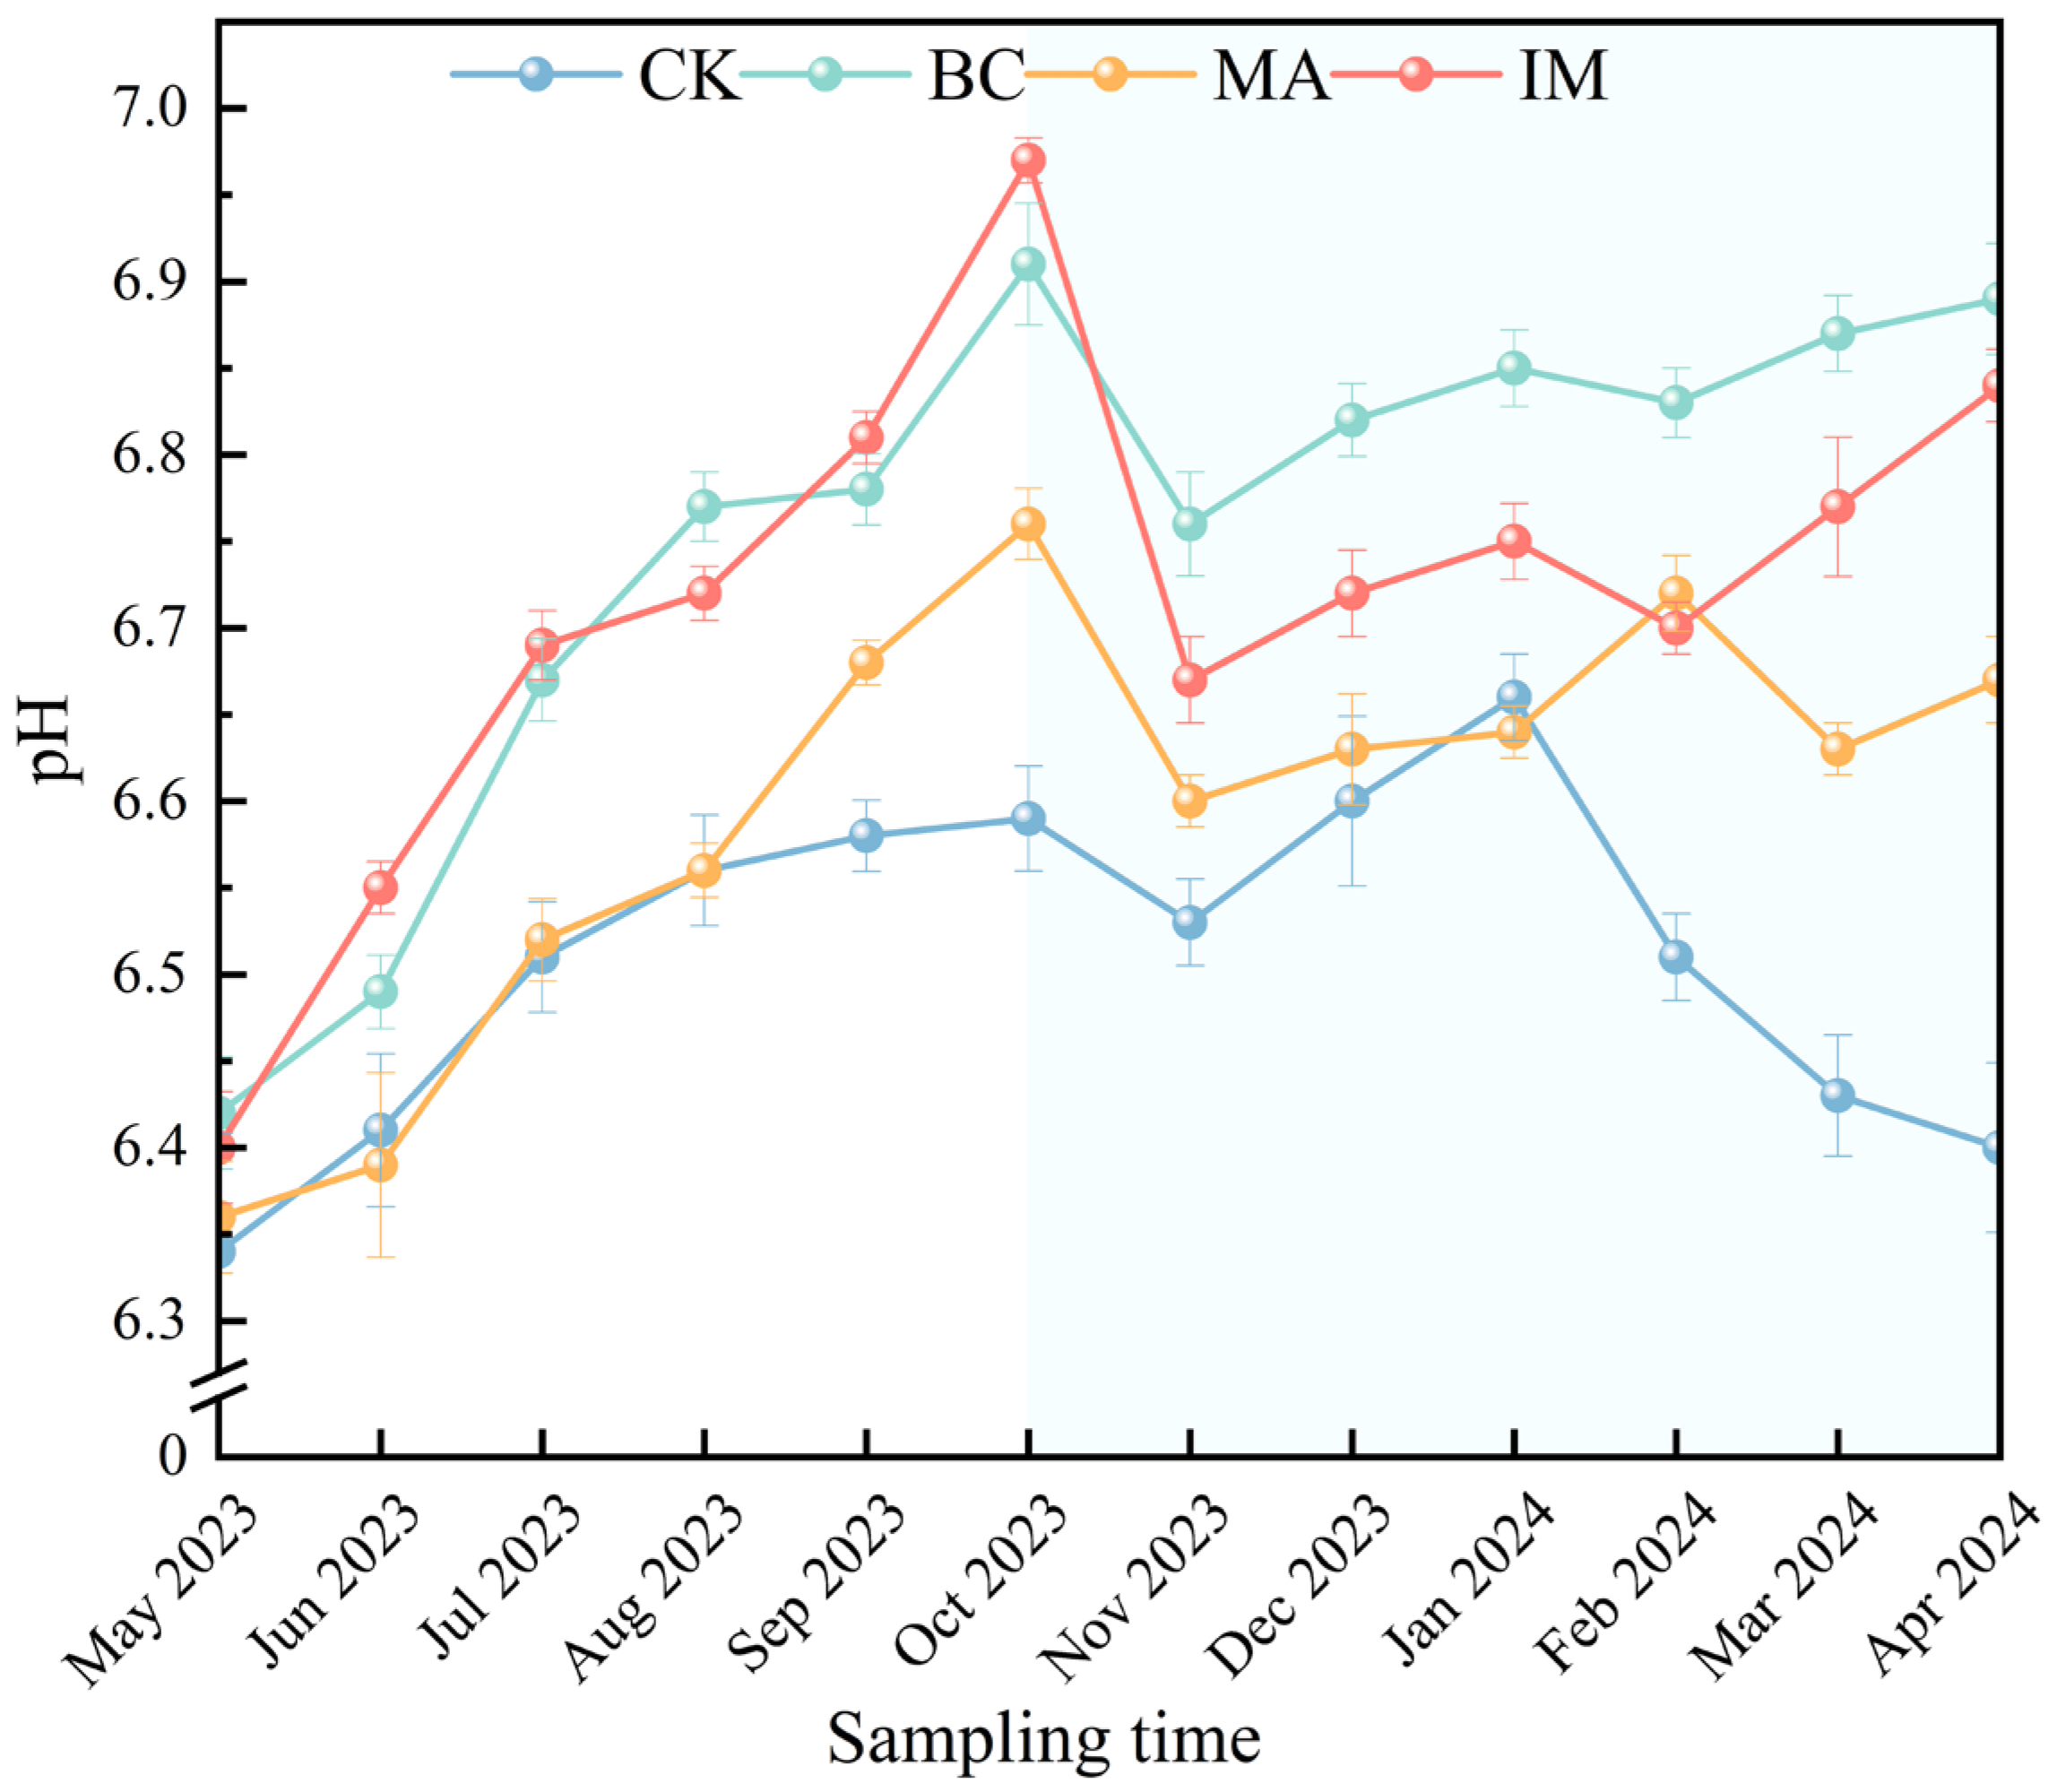
The initial pH of the in situ soil was 6.34, indicating a mild acidic property. At the end of the experiment, the pH of the control group (CK) rose slightly to 6.40, and the soil still exhibited mild acidity (Figure 4). The pH values of the other treatment groups were 6.89 (BC), 6.84 (IM) and 6.67 (MA), with the soils in these groups being neutral.
Soil pH fluctuated significantly throughout the study period. In October 2023, soil pH peaked, with the values of each group being 6.97 (IM), 6.91 (BC), 6.76 (MA) and 6.59 (CK). In November 2023, soil pH decreased by 4.30% in the IM group, 2.27% in the MA group, 2.17% in the BC group and 0.91% in the CK group. The CK group had the lowest pH value (6.53), and the soil in this group was neutral.

3.2.2. Changes in Total Nutrients in Soil

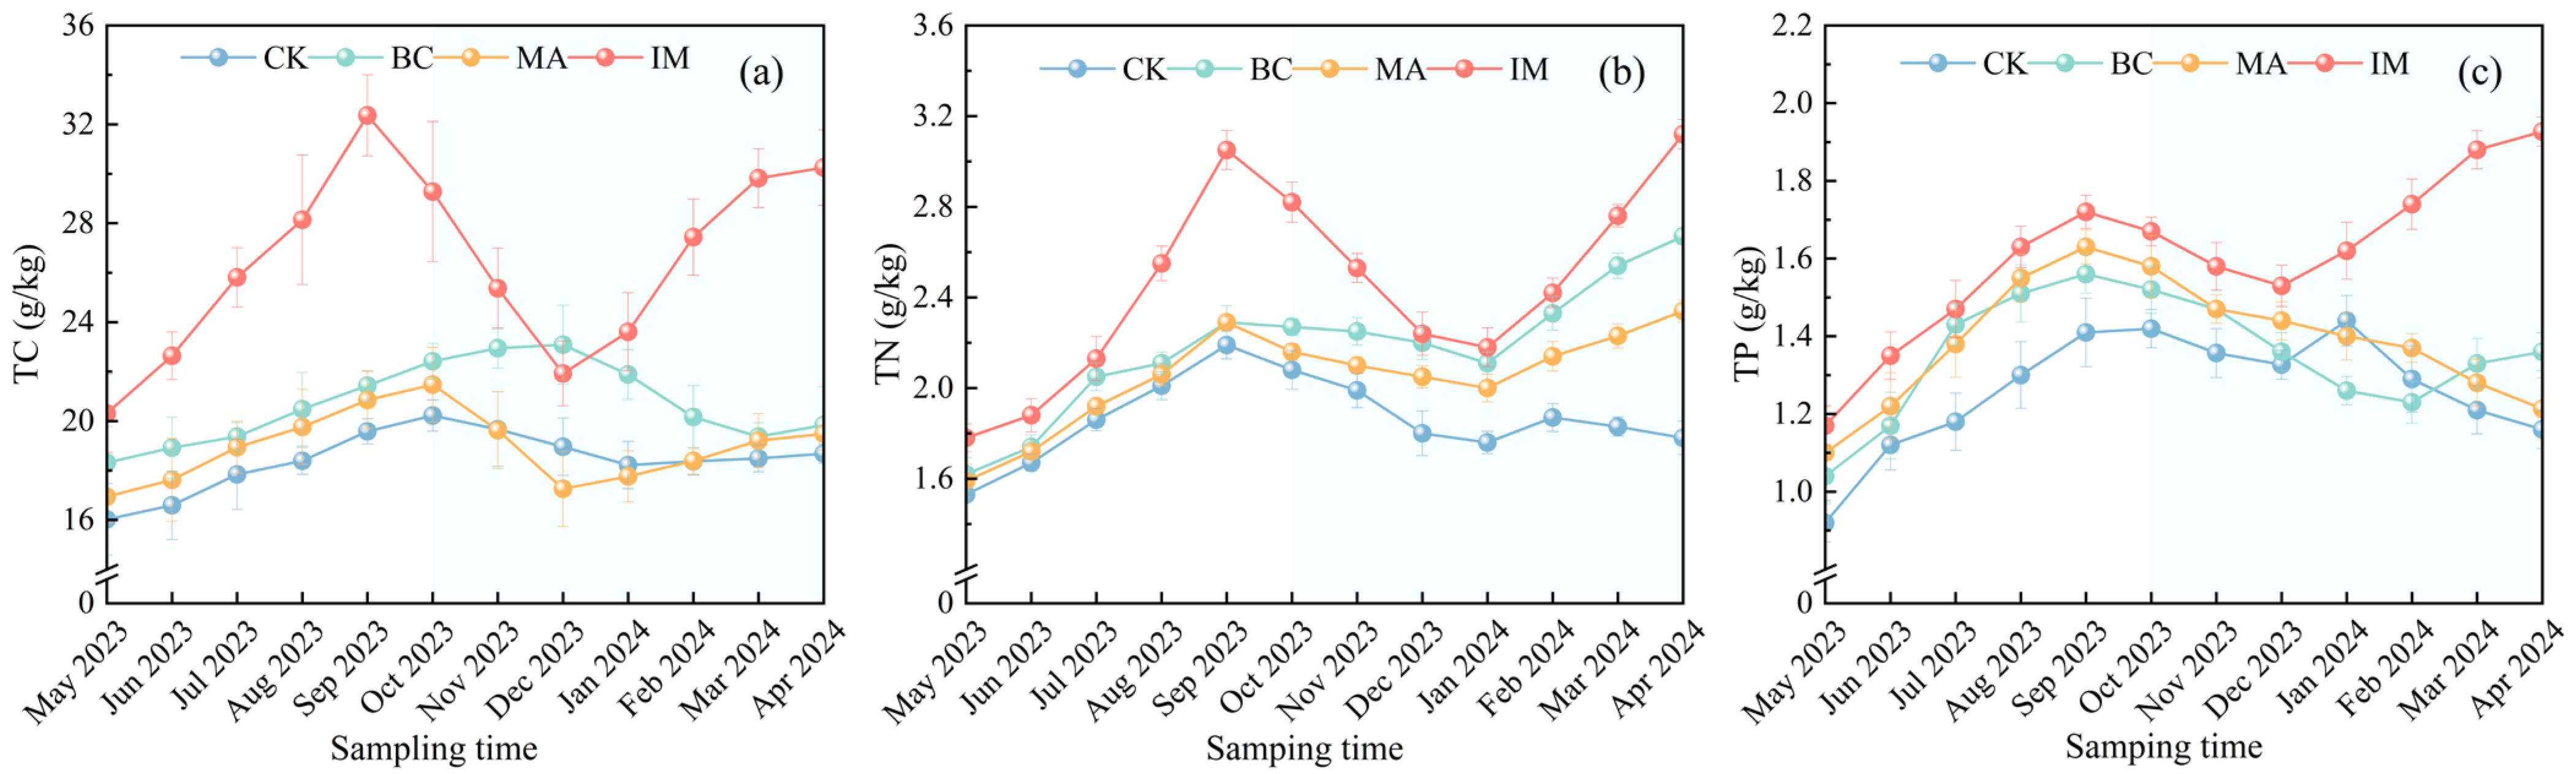
In April 2024, the total carbon (TC) contents in the soil were as follows: 30.25 g/kg (IM), 19.84 g/kg (BC), 19.48 g/kg (MA), and 18.68 g/kg (CK) (Figure 5a). At the end of the experiment, the TC content of all treatments increased significantly (p < 0.05) relative to the CK group in April 2023, with increases of 88.83% (IM), 23.85% (BC), 21.60% (MA) and 16.60% (CK). The IM treatment showed significant (p < 0.05) temporal variation in TC content. Its TC content increased by 59.33% to 32.26 g/kg in September 2023 compared with that in May 2023, then decreased by 32.26% to 21.92 g/kg, and resumed an increasing trend from December 2023 onwards.
In April 2024, the total nitrogen (TN) contents in the soil were as follows: 3.12 g/kg (IM), 2.67 g/kg (BC), 2.34 g/kg (MA), and 1.78 g/kg (CK) (Figure 5b). After the experiment, the TN content in each treatment increased significantly (p < 0.05) compared with the CK treatment in April 2023, with increases of 103.92% (IM), 74.51% (BC), 52.94% (MA), and 16.34% (CK). The TN content in all four treatments increased at the start of the experiment and peaked in September 2023, with increases of 71.35% (IM), 44.03% (MA), 43.14% (CK), and 41.36% (BC) relative to the initial value in May 2023. Subsequently, the TN content in each group decreased, reaching its lowest level in January 2024, with decreases of 28.52% (IM), 19.63% (CK), 12.66% (MA), and 7.86% (BC) relative to the September peak. The TN content in the IM group was 3.05 g/kg in September 2023 and decreased to 2.18 g/kg in January 2024.
In April 2024, the total phosphorus (TP) contents in the soil were as follows: 1.93 g/kg (IM), 1.36 g/kg (BC), 1.21 g/kg (MA), and 1.16 g/kg (CK) (Figure 5c). Compared to the CK group in April 2023, the TP content at the end of the experiment increased significantly (p < 0.05), with respective increases of 109.42% (IM), 47.83% (BC), 31.88% (MA), and 26.09% (CK). In September 2023, the TP content in all treatments peaked, with increases of 53.26% (CK), 50.00% (BC), 48.18% (MA), and 47.01% (IM) relative to the initial value. Additionally, the TP content in the IM treatment reached its lowest value of 1.53 g/kg in December 2023, representing an 11.05% decrease relative to its peak value. Moreover, the TP content in the CK treatment reached its maximum value of 1.44 g/kg in January 2024.

3.2.3. Changes in Available Nutrients in Soil

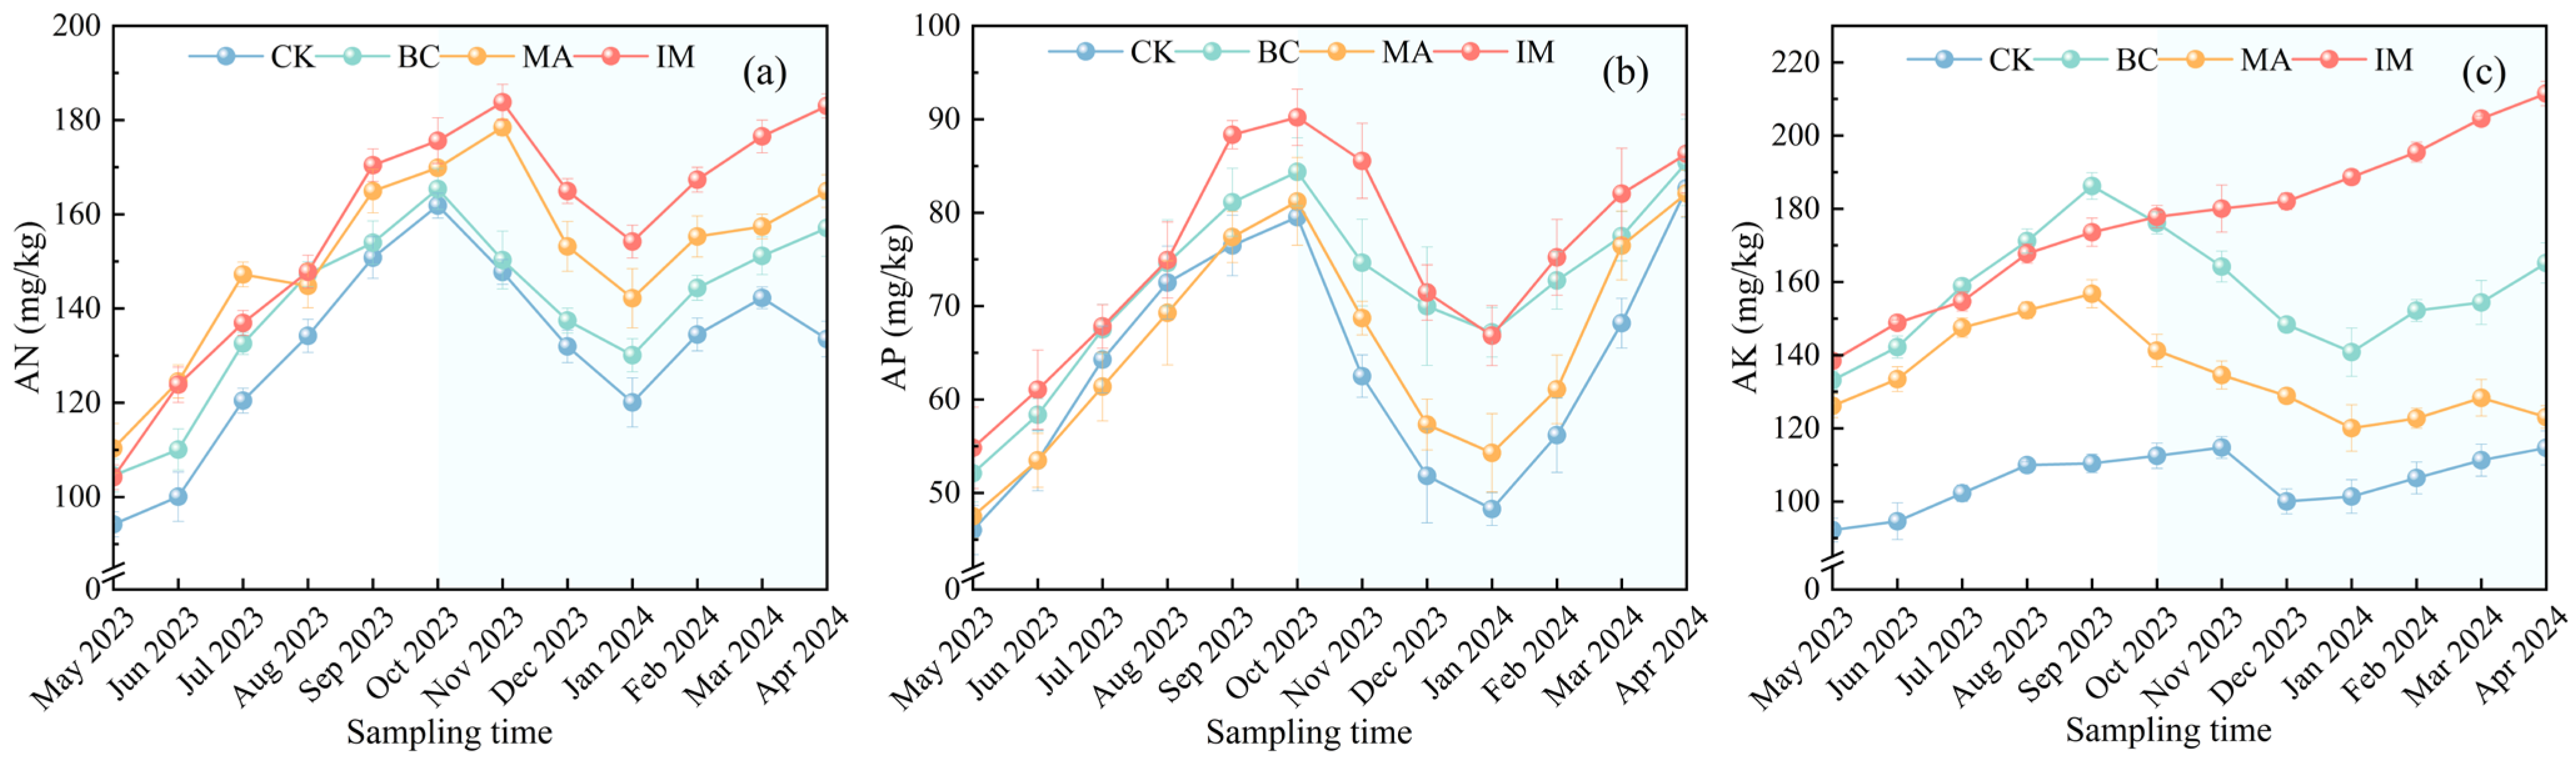
In April 2024, the alkali-hydrolyzable nitrogen (AN) contents in the soil were as follows: 183.00 mg/kg (IM), 164.93 mg/kg (MA), 157.08 mg/kg (BC), and 133.52 mg/kg (CK) (Figure 6a). After the experiment, the AN content in each treatment increased significantly (p < 0.05) compared with the CK treatment in May 2023, with increases of 94.27% (IM), 75.08% (MA), 66.75% (BC), and 41.74% (CK). The AN content in the IM and MA treatments peaked at 183.79 mg/kg and 178.47 mg/kg in November 2023, with respective significant (p < 0.05) increases of 76.42% and 61.76% compared with the initial value. The AN content in the CK and BC treatments reached the maximum in October 2023, with respective significant (p < 0.05) increases of 71.80% and 58.16% compared with the initial value. During the freeze–thaw period, the AN content across all treatments hit the lowest levels in January 2024, and decreased significantly (p < 0.05) from its peak values with respective reductions of 25.82% (CK), 21.34% (BC), 20.42% (MA), and 16.10% (IM).
In April 2024, the available phosphorus (AP) contents in the soil were as follows: 86.31 mg/kg (IM), 85.37 mg/kg (BC), 82.60 mg/kg (CK), and 85.37 mg/kg (MA) (Figure 6b). After the experiment, the AP content in each treatment increased significantly compared with the CK treatment in May 2023, with increases of 87.51% (IM), 85.47% (BC), 79.45% (CK), and 78.30% (MA). The increase in AP content in the CK treatment was particularly significant (p < 0.05). In October 2023, the AP content in the four treatment groups peaked at 79.53 mg/kg (CK), 84.36 mg/kg (BC), 81.20 mg/kg (MA), and 90.21 mg/kg (IM), with respective significant (p < 0.05) increases of 72.78% (CK), 70.95% (MA), 64.56% (IM), and 61.89% (BC) compared with the initial value.
In April 2024, the available potassium (AK) contents in the soil were as follows: 211.49 mg/kg (IM), 165.18 mg/kg (BC), 123.08 mg/kg (MA), and 114.65 mg/kg (CK) (Figure 6c). After the experiment, the AK content in each treatment increased significantly (p < 0.05) compared with the CK treatment in May 2023, with increases of 129.43% (IM), 79.19% (BC), 33.52% (MA), and 24.38% (CK). The AK content in the BC and MA treatment soils peaked at 186.23 mg/kg and 156.76 mg/kg in September 2023, respectively, with increases of 39.88% and 24.26% compared with the initial value. The AK content in the CK treatment peaked at 114.77 mg/kg in November 2023 relative to the initial value.

3.2.4. Temperature and Chemical Factors Associated with Total PAH Removal in Soil

Temperature was the only negatively associated factor in the CK treatment, and the magnitude of its effect was significantly higher than that in other treatment groups (β = −0.669, p < 0.001) (Table 2). Total carbon (TC) may exert a significant positive effect (B = 0.358, p < 0.0001): a 1 g·kg−1 increase in TC may lead to a 0.358% significant increase in the PAH removal rate.
For the BC group, the weighted least squares (WLS) baseline model with temperature as the sole variable yielded an R2 of 0.854 (p < 0.001), meaning temperature could explain 85.4% of the variation in the PAH removal rate. The weighted hierarchical extended WLS model, with the addition of AP, TN, pH and AN, saw the R2 rise to 0.997 with a ΔR2 of 0.144 (p < 0.001). AP, TN and pH showed extremely significant (p < 0.001) positive correlations with the total PAH removal rate (AP: β = 0.540; TN: β = 0.163; pH: β = 0.150), while AN exhibited an extremely significant (p < 0.001) negative correlation (β = −0.358).
In the MA treatment group, temperature had a highly significant (p < 0.001) negative correlation with the total PAH removal rate, and its standardized coefficient (−0.656 ***) was greater in magnitude than those of AN (−0.268 ***), AK (−0.206 ***) and pH (−0.147 *). TN and AP were potentially positively correlated with the total PAH removal rate (β = 0.518 and β = 0.338, respectively). The baseline model incorporating only AK showed a poor fitting effect in explaining the total PAH removal rate.
In the IM treatment group, temperature had the weakest highly significant (p < 0.001) negative effect on the PAH removal efficiency among all groups (β = −0.229). AK may have a positive correlation with the total PAH removal rate with the largest highly significant (p < 0.001) positive standardized coefficient (β = 0.774). AN and TN also showed significant (p < 0.01) positive correlations with the total PAH removal rate (β = 0.163 and β = 0.107, respectively), and AK and TN together accounted for 97.5% of the variation in the total PAH removal rate in the IM group. AP presented a highly significant (p < 0.001) negative correlation with the total PAH removal rate (β = −0.272 ***).

3.3. Bacterial Community Structure in Soil After the Experiment

3.3.1. Relative Abundance of Bacterial Communities in Soil

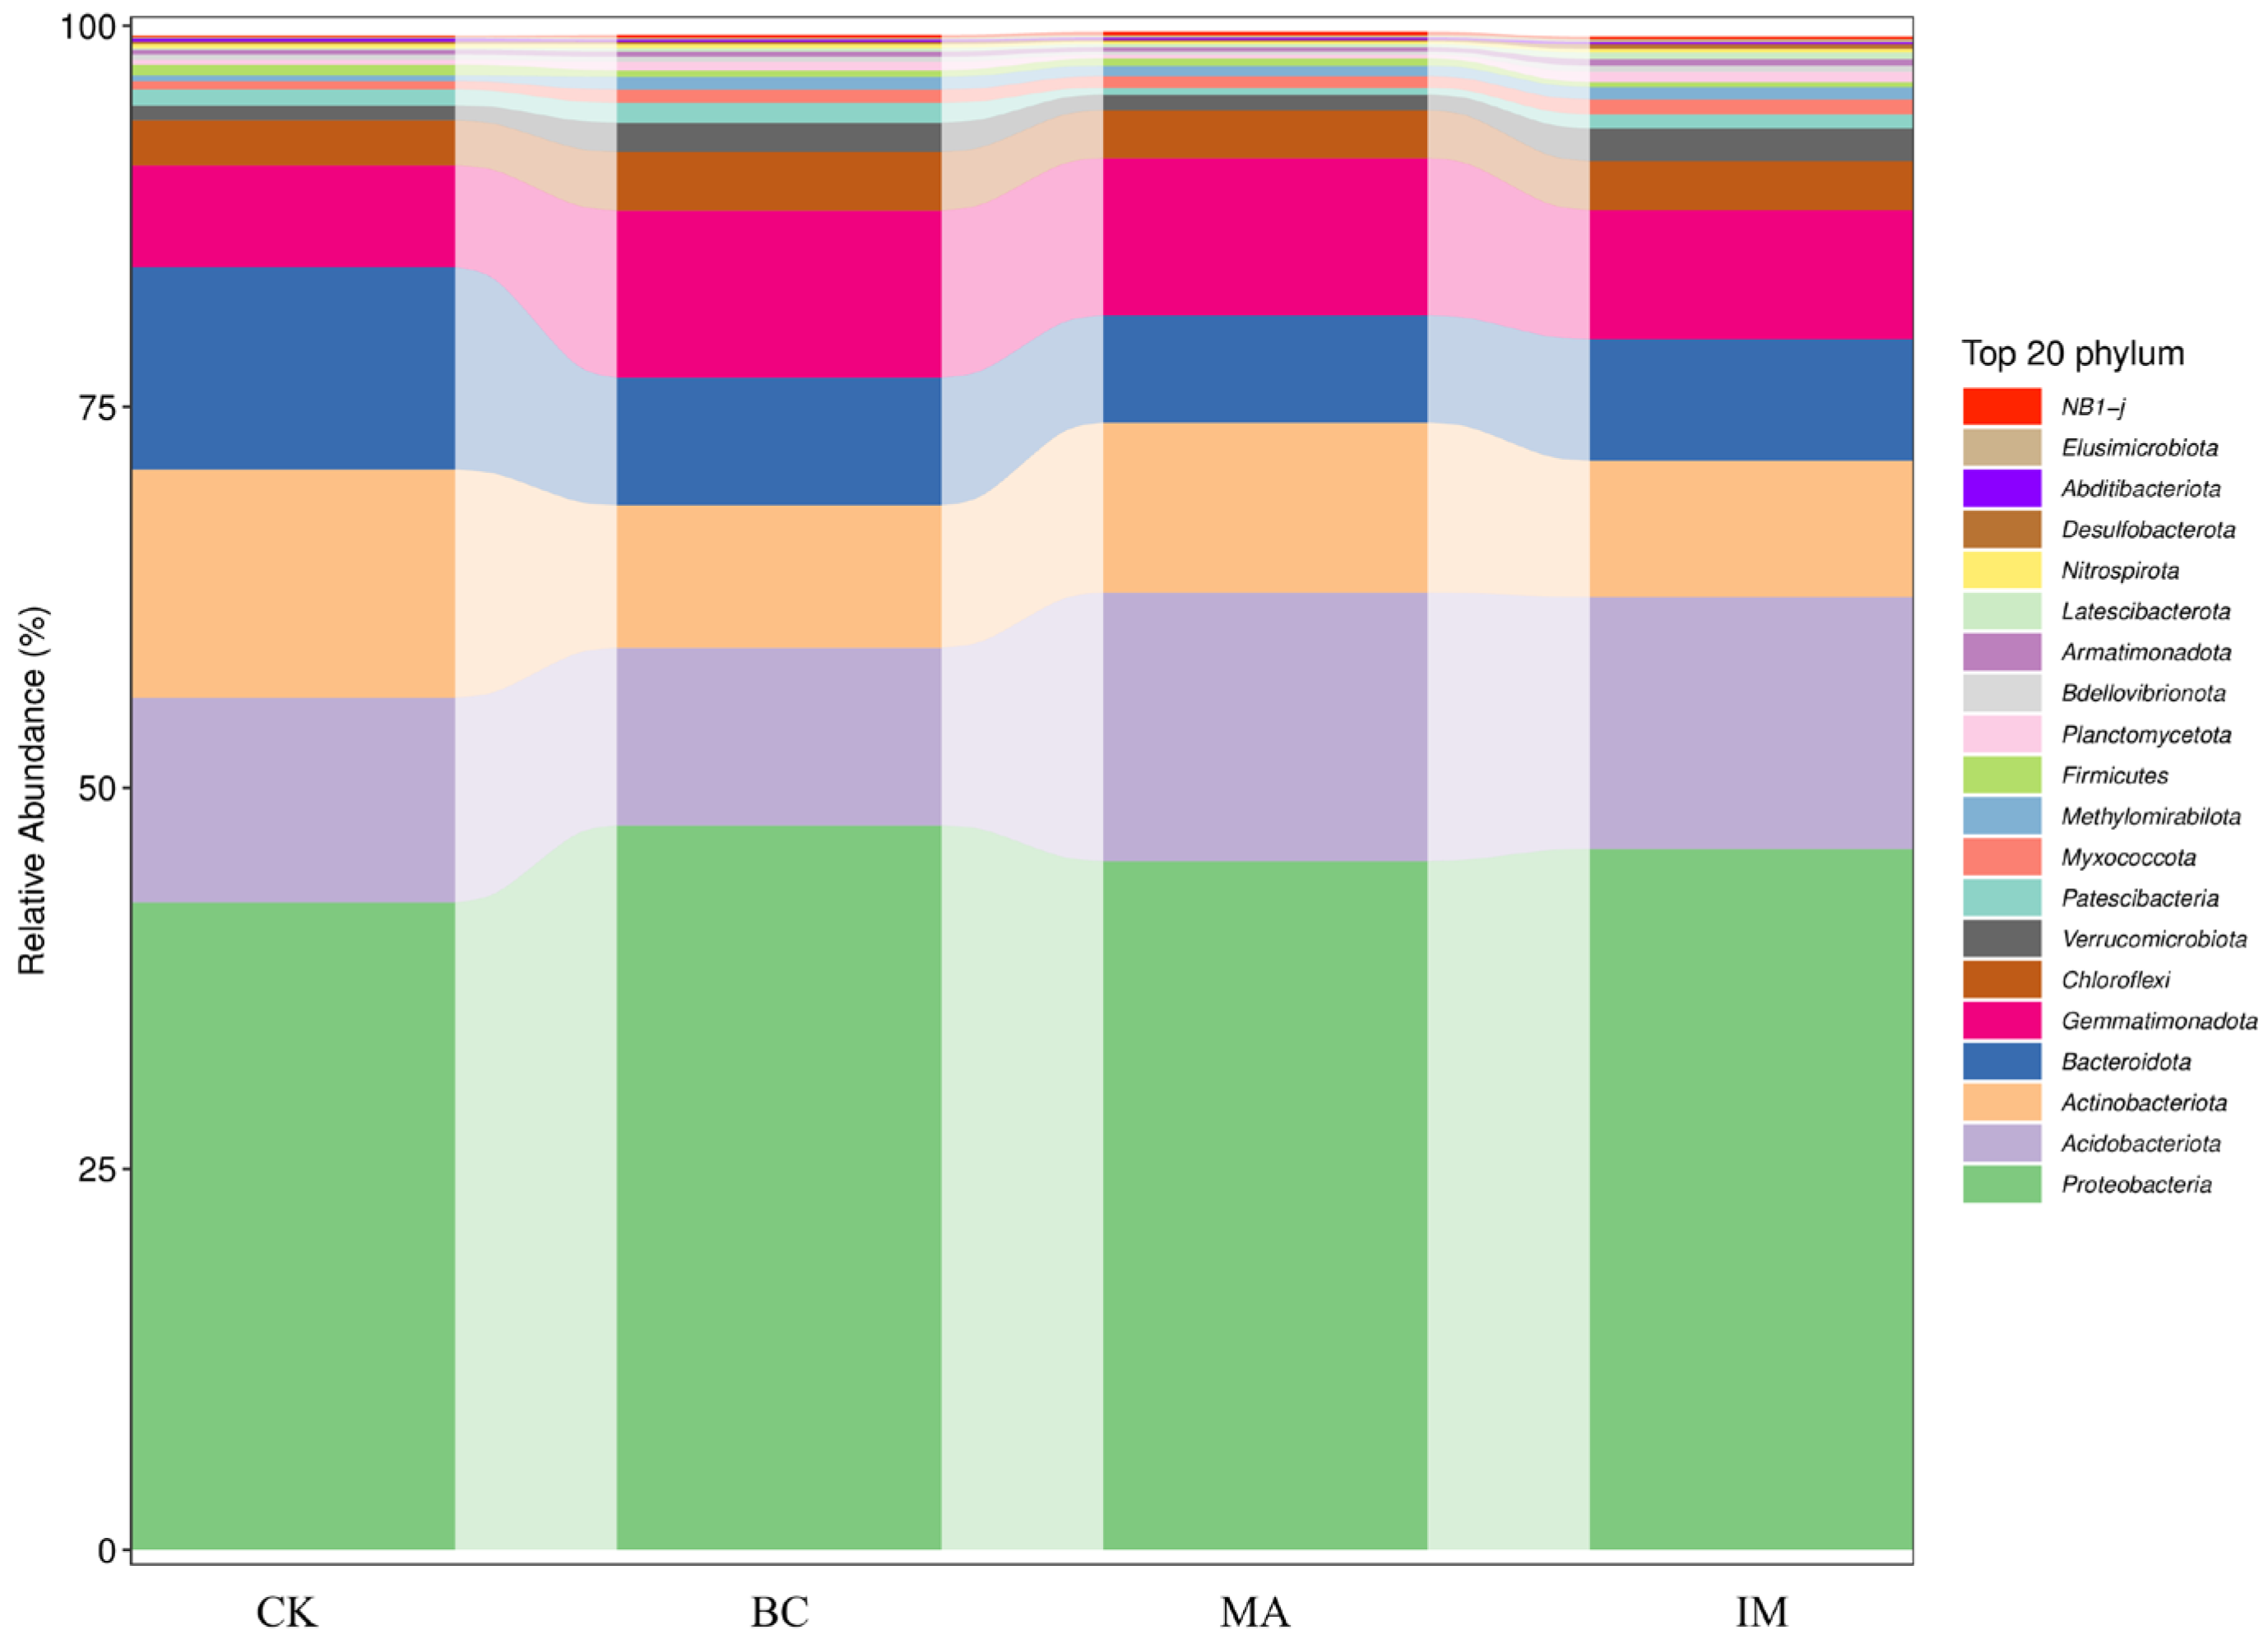
At the end of the experiment, based on the results of OTU species clustering analysis, we identified the top 20 phyla in terms of relative abundance at the phylum level (Figure 7). In the control group (CK), the dominant bacterial phyla were Proteobacteria (42.49%), Actinobacteriota (14.95%), Acidobacteriota (13.43%), Bacteroidota (13.29%), Gemmatimonadota (6.68%), Chloroflexi (2.95%) and Patescibacteria (1.04%). The relative abundance of Proteobacteria was elevated in all three treatment groups, reaching 47.53% (BC), 45.99% (IM) and 45.19% (MA).
In the BC group, Acidobacteriota, the second most abundant phylum, exhibited a 3.29% decrease in relative abundance compared with CK, falling to 11.66%. Gemmatimonadota emerged as the third most abundant phylum in the BC group, with its relative abundance rising to 10.97%, a 4.29% increase relative to CK.
The top eight bacterial phyla in the MA and IM groups showed the same ranking order, and their relative abundances were as follows: Proteobacteria (45.19%; 45.99%), Acidobacteriota (17.62%; 16.53%), Actinobacteriota (11.16%; 8.93%), Gemmatimonadota (10.33%; 8.46%), Bacteroidota (7.03%; 7.99%), Chloroflexi (3.13%; 3.22%), Verrucomicrobiota (1.02%; 2.15%).
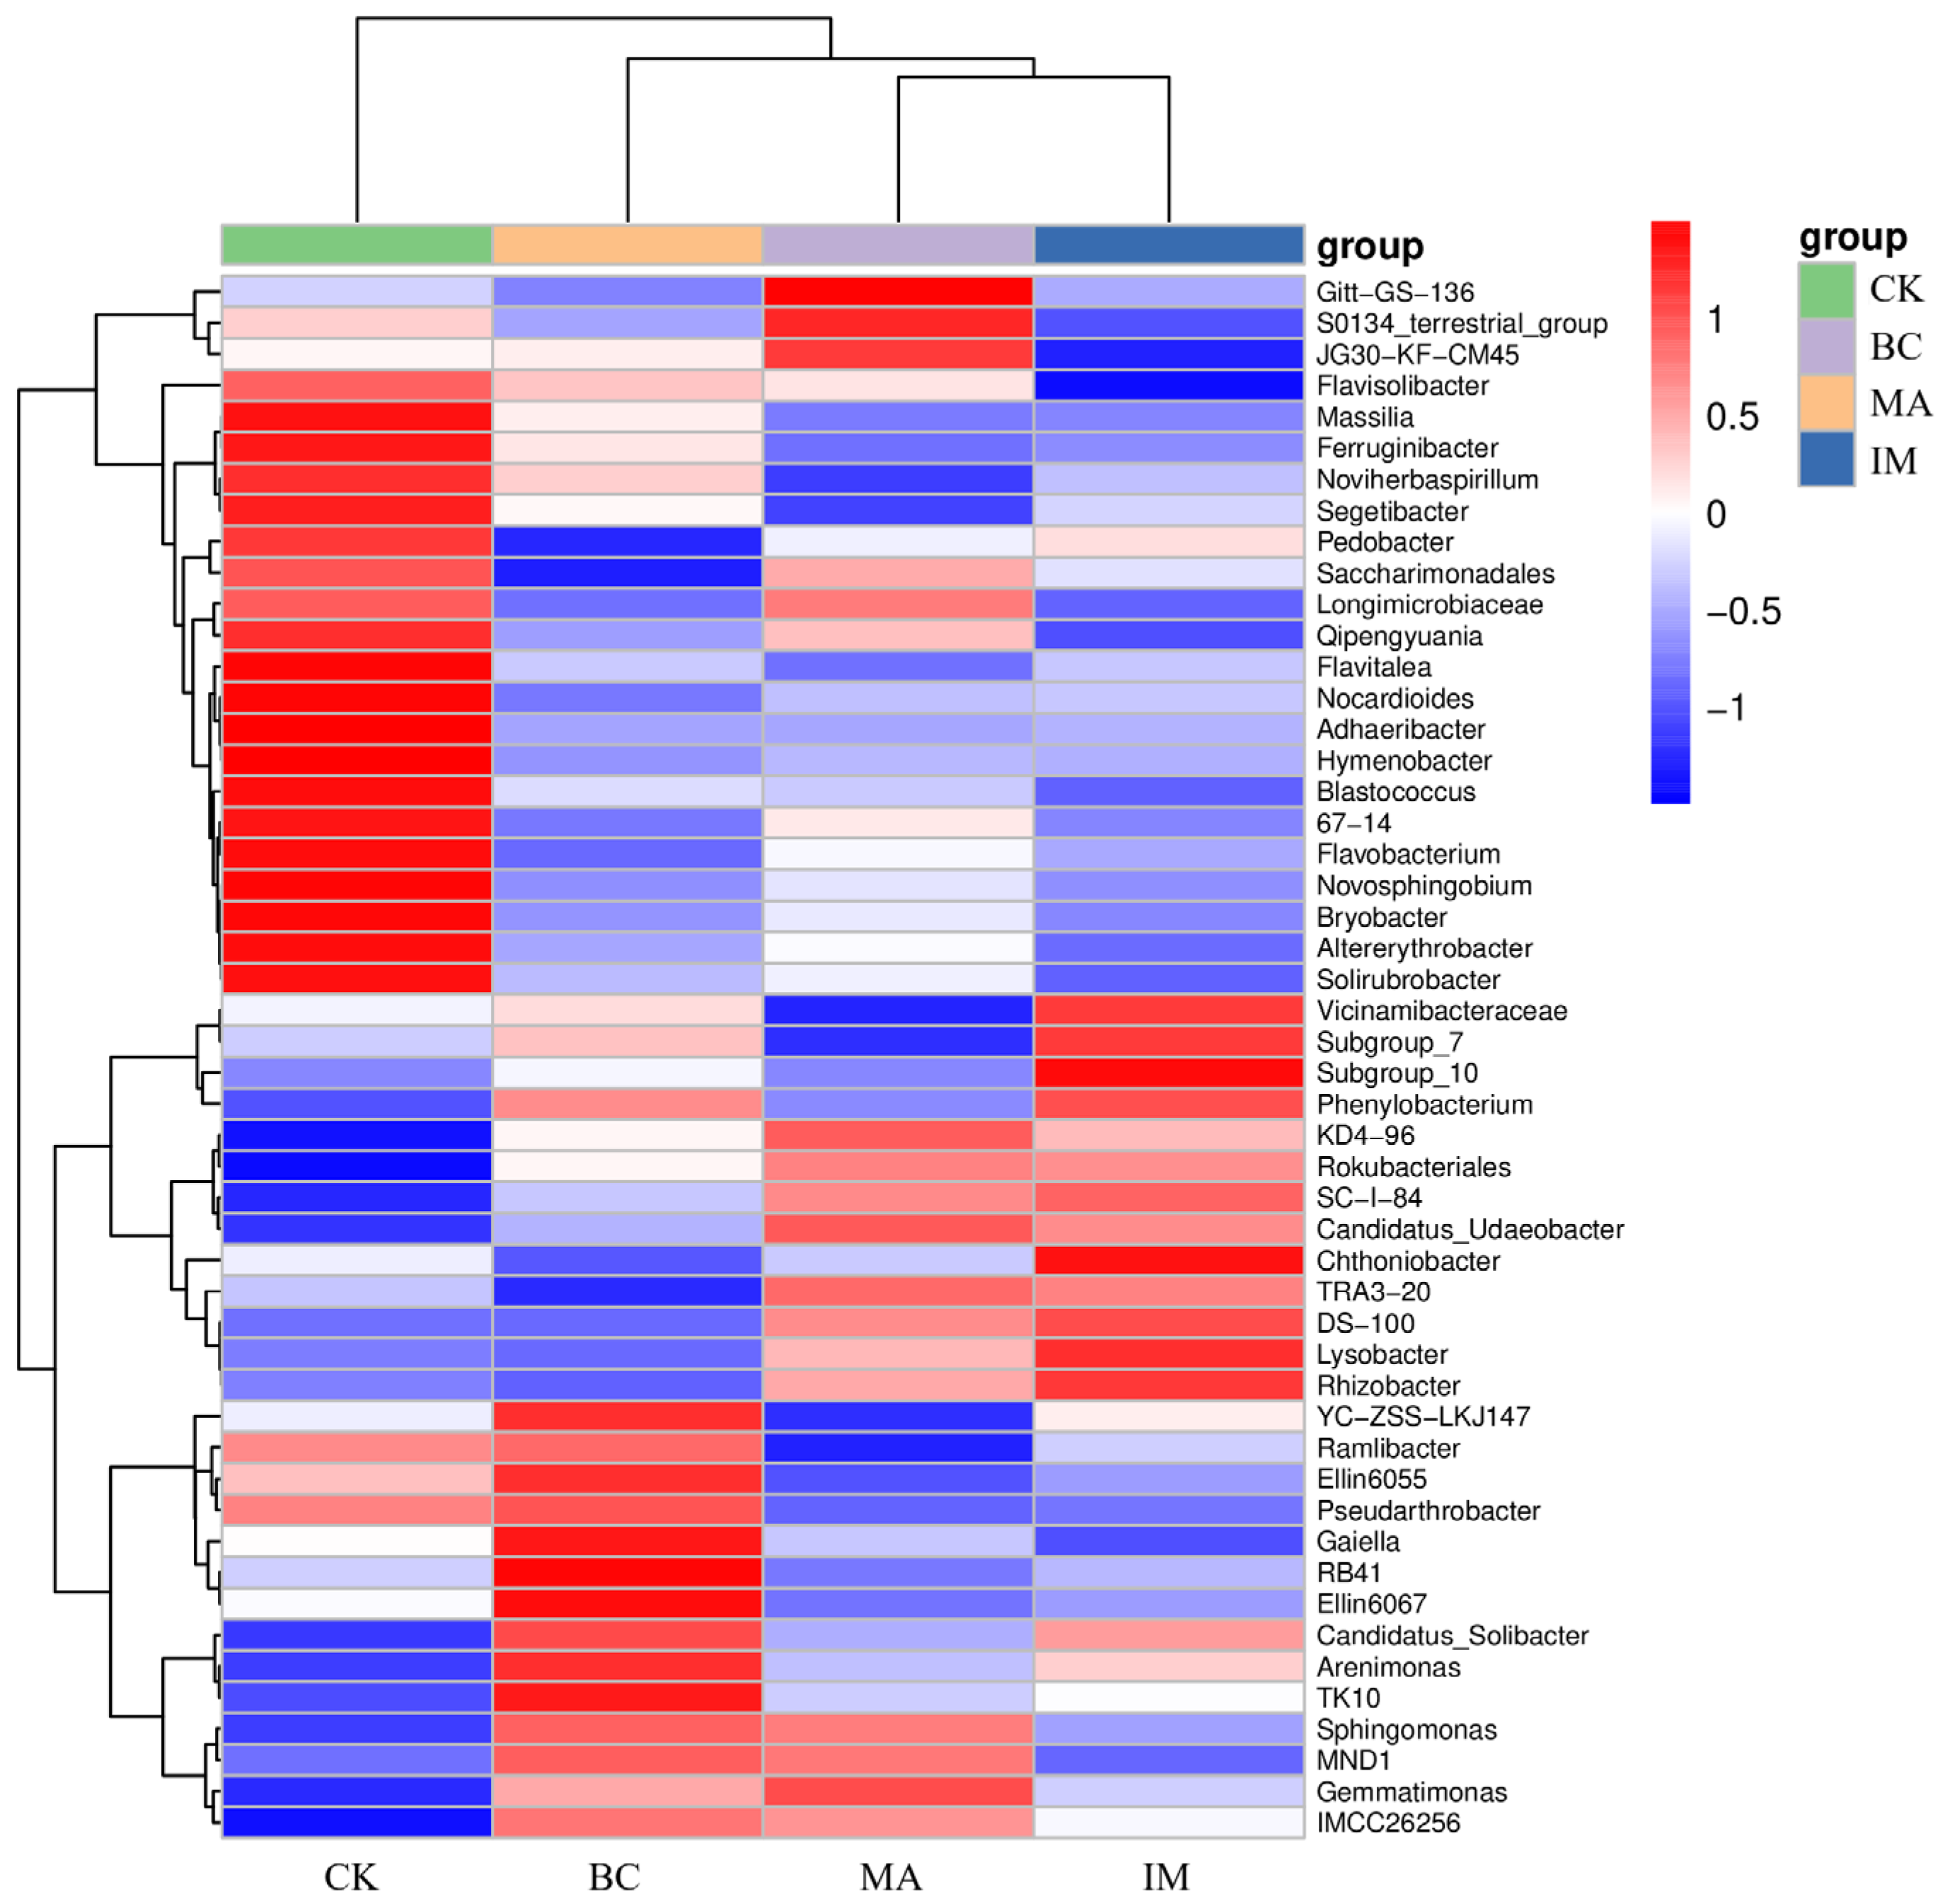
CK samples formed a distinct cluster, while BC, MA, and IM samples clustered more closely (Figure 8). Genera including Massilia, Flavobacterium, and Flavisolibacter were highly abundant in the CK group, whereas taxa such as Vicinamibacteraceae and Chthoniobacter were relatively more abundant in the IM group.

3.3.2. Alpha Diversity of Bacterial Communities in Soil

Relative to the control (CK), all treatments reduced soil bacterial Chao1 richness and observed species richness to varying degrees (Table 3). Specifically, MA and IM had no significant impact on these two richness indices, whereas BC caused a significant reduction in these two indices. Conversely, all treatments significantly increased (p < 0.05) both the Shannon diversity index (ranging from 5.059 to 5.467) and Pielou’s evenness index (ranging from 0.591 to 0.646) relative to CK, with BC producing the strongest enhancement (p < 0.05). Good’s coverage values for all treatments were near 1, indicating high sequencing depth and confirming the reliability of our diversity estimates.

3.3.3. Abundance of PAH Degradation Genes in Soil

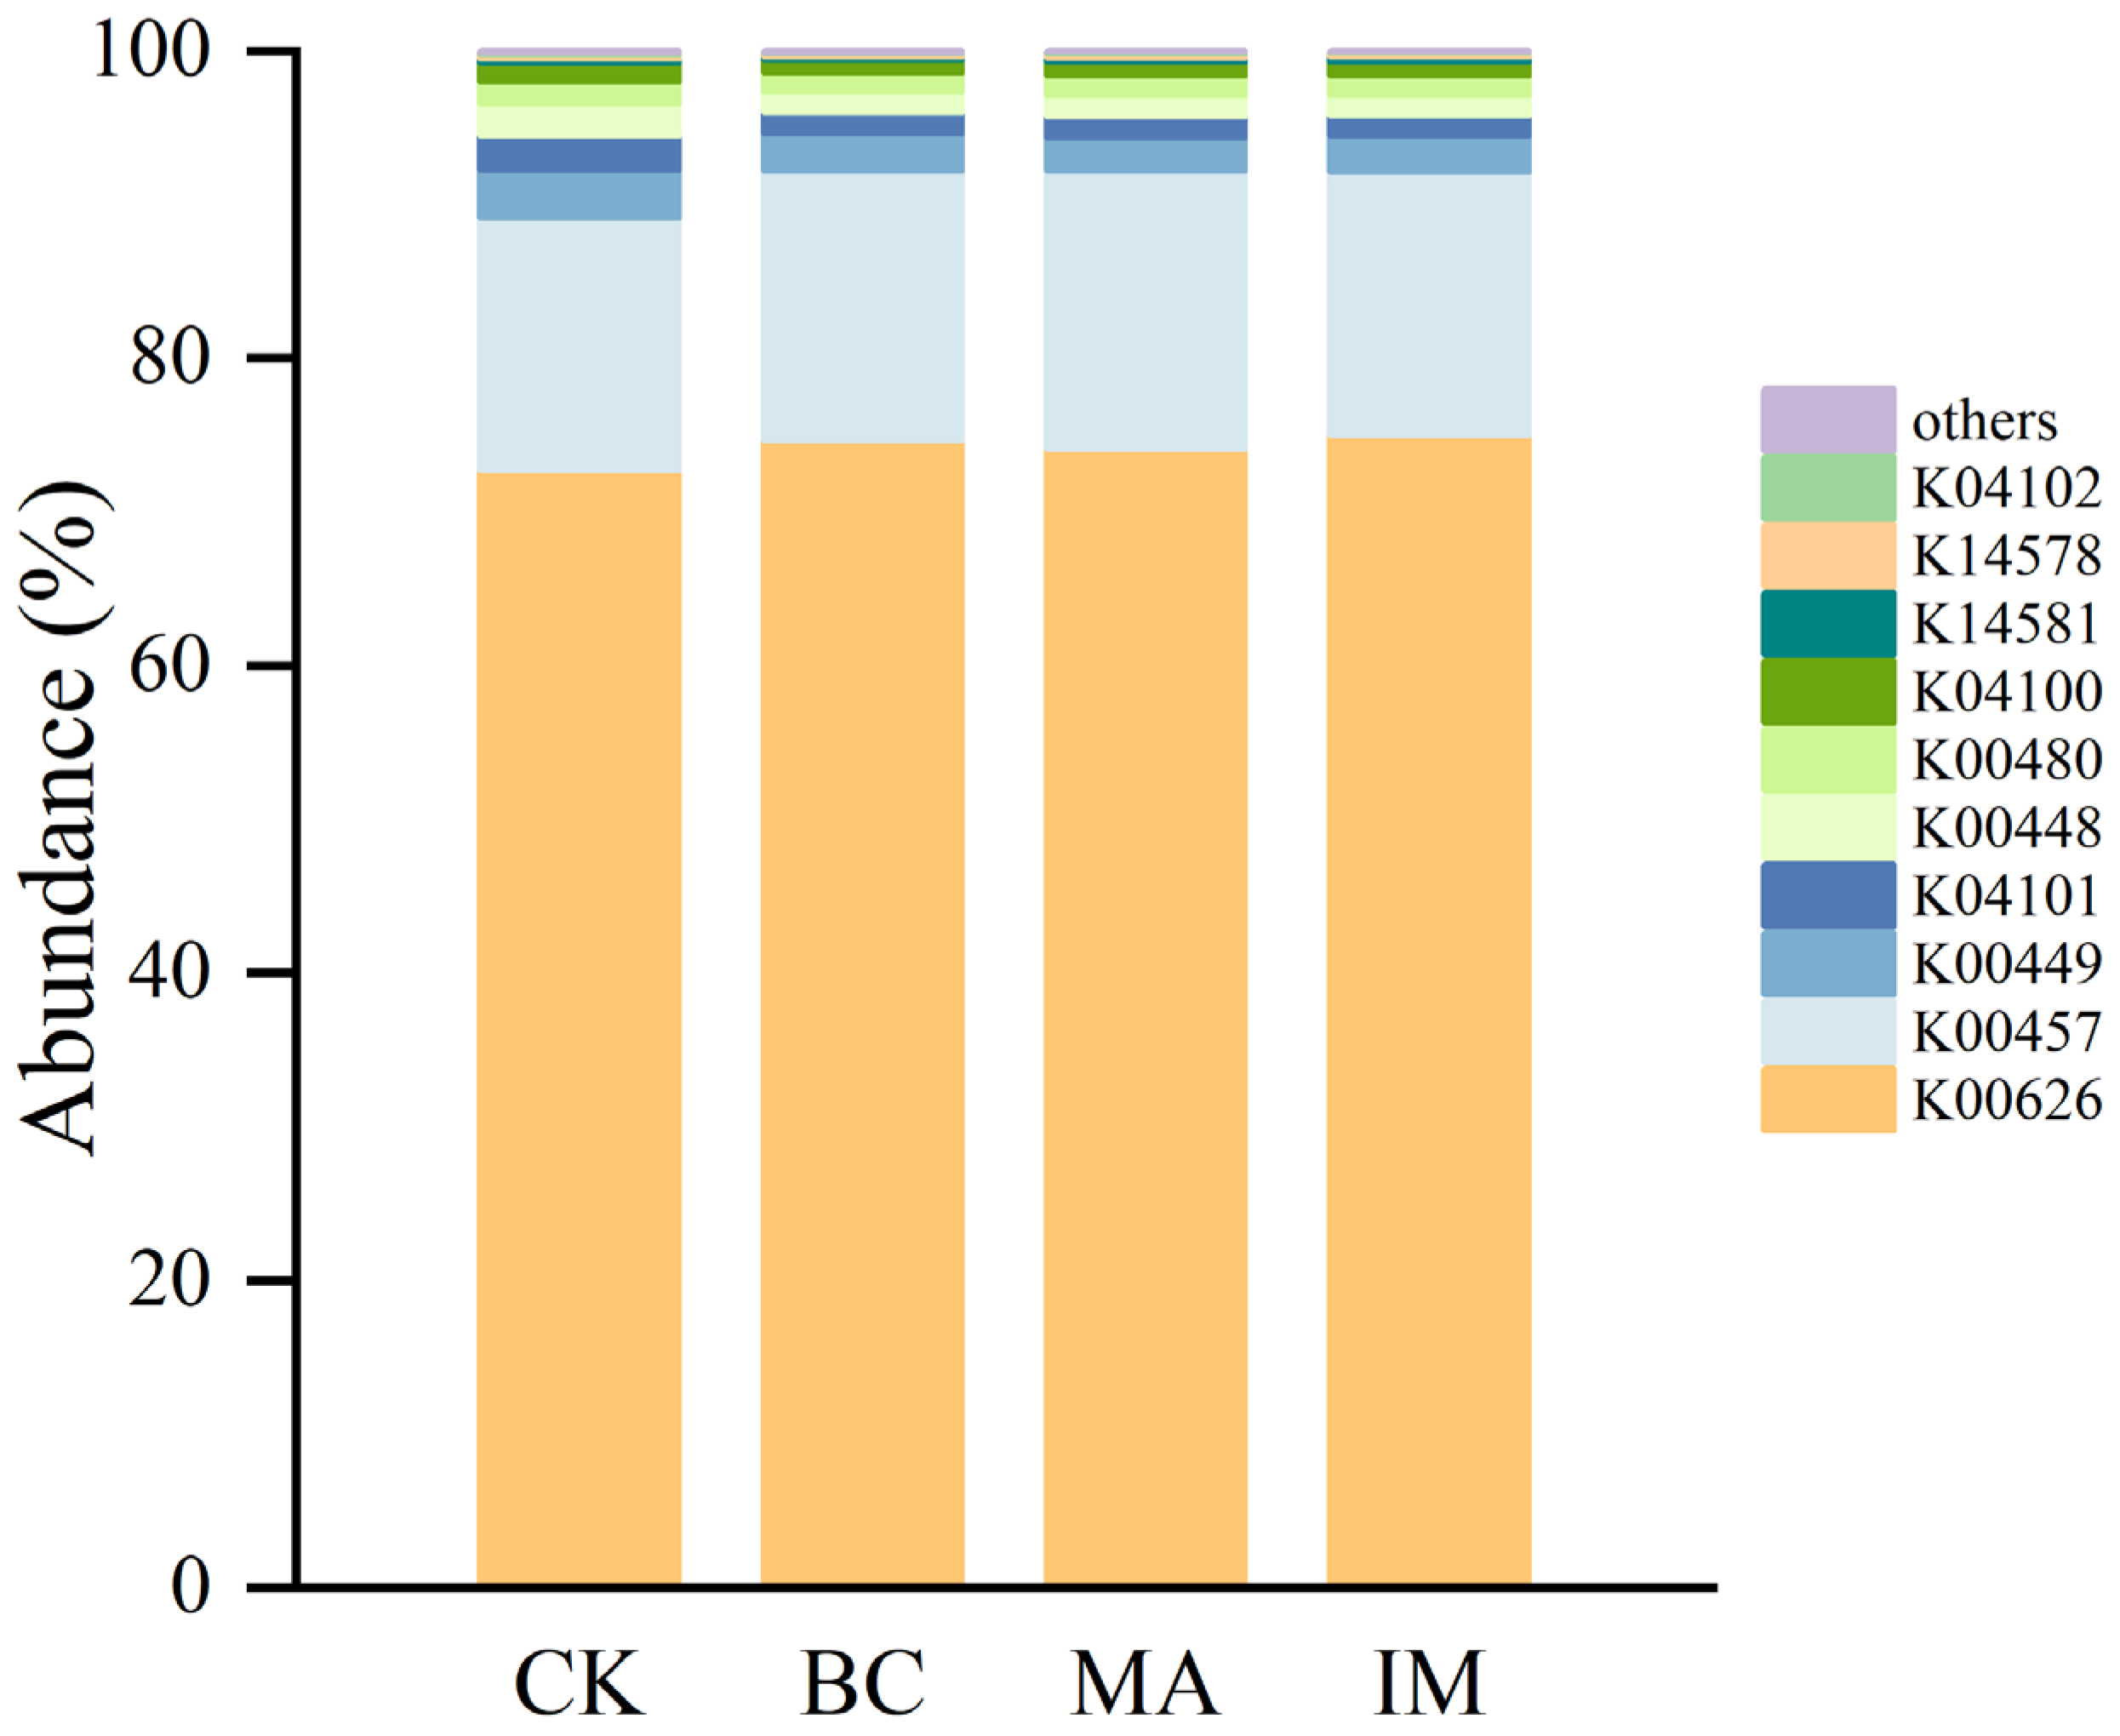
Gene prediction was performed using PICRUSt2 and annotated against the KEGG database. The relative abundance of functional genes associated with PAH degradation is shown in Figure 9 [24]. Two degradation genes, K00626 (acetyl-CoA acetyltransferase) and K00457 (4-hydroxyphenylpyruvate dioxygenase), exhibited high relative abundance in all treatments.
The relative abundance of K00626 was 75.88% (IM), 74.64% (BC), 74.12% (MA), and 71.38% (CK), while the relative abundance of K00457 was 18.10% (MA), 17.53% (BC), 17.17% (IM), and 16.40% (CK). In terms of quantity, the largest increases in K00626 and K00457 were observed in the IM and MA treatments, while the numbers of other functional genes decreased. The trends in the changes in specific PAH degradation genes were similar across the treatments.

4. Discussion

4.1. Removal Efficacy and Environmental Adaptability of Soil PAHs Under Different Remediation Treatments

A 12-month in situ experiment was conducted on slightly and moderately PAH-contaminated soils with natural freeze–thaw cycles to compare the remediation effects of blank control (CK), biochar (BC), free microbial agents (MA), and immobilized microorganisms (IM). The results confirmed that IM exhibited the optimal comprehensive remediation performance, with a total PAH removal rate of 72.53% at the end of the experiment, which was significantly (p < 0.05) higher than MA (60.05%), BC (52.19%) and CK (5.76%), while natural degradation of PAHs in CK was limited (Figure 2a). The PAH removal rate exhibited a positive temporal correlation (p < 0.001), indicating that the remediation effect increased progressively (Table 1). The average monthly increase in PAH removal for IM was 6.10%, higher than MA (5.34%), BC (4.38%), and CK (0.35%), suggesting its long-term effectiveness.
Remediation performance of the four treatments varied significantly between the normal temperature and freeze–thaw periods. During the normal temperature period (May–October 2023), all treatments showed an increasing trend in PAH removal (Figure 2a). BC achieved 41.77%, higher than IM (39.90%), likely due to biochar’s strong adsorption capacity at optimal temperatures, whereas microbial degradation in IM required an adaptation period. MA showed a sharp growth in PAH removal from July to August 2023 (Figure 2b) as the ambient temperature matched the optimal activity temperature (≈20 °C [16]) of the cold-tolerant strains in MA.
During the freeze–thaw period (November 2023–April 2024), the monthly absolute growth rate of total PAH removal decreased continuously in CK and BC; that of MA fluctuated slightly, while IM maintained a high removal rate (Figure 2b), reaching 54.28% for total PAH removal in this period (Figure 2a). In the early freeze–thaw period (December 2023), IM’s PAH removal rate increased by 9.01%, while MA’s rate of increase slowed and BC’s decreased slightly (Figure 2b). This differential performance may be attributed to the enhanced hydrophilicity and polarity of low-temperature pyrolyzed biochar (B300) surface [25], thus promoting PAH desorption and short-term bioavailability. The low temperature reduced the degradation capacity of free-living bacteria in MA. In the long term, the PAH removal rates in MA and BC dropped significantly during the freeze–thaw period, reaching 38.87% and 17.91%, respectively, with CK showing less than 2% (Figure 2a). The cold-tolerant strains in both IM and MA adapted to low temperatures to sustain PAH degradation [26]. Moreover, the porous structure of the composite biochar in IM further alleviated freeze–thaw stress, supporting a PAH removal rate of 54.28% in IM during this period and maintaining stable microbial enzyme production.
PAHs in the original soil were dominated by HMW PAHs (69.75%). IM showed high removal efficiency for both HMW (71.48%) and LMW PAHs (74.90%), outperforming other treatments for LMW PAHs (Figure 3).
During the normal temperature period, all treatments mainly targeted HMW PAH removal, with IM and BC reaching 43.11% and 42.25% removal rates, respectively; this may be attributed to the adsorption and enrichment of hydrophobic HMW PAHs by high-temperature biochar (C500), and the immobilized fungi and bacteria in IM accelerating the degradation of biochar-adsorbed HMW PAHs through co-metabolism and direct metabolism. For LMW PAHs, BC achieved the highest removal rate (40.58%) in the normal temperature period, followed by IM (32.57%). During the freeze–thaw period, IM, MA and CK showed higher LMW PAH removal rates, with IM reaching 42.34%, which was significantly (p < 0.05) higher than that of the other treatments, while BC still maintained a relatively high HMW PAH removal rate (10.48%). This may be because a freeze–thaw-induced structural collapse increased B300’s microporosity, enhancing residual HMW PAH adsorption capacity, while C500 exhibited high stability for continuous HMW PAH adsorption.

4.2. Evolution of Soil Chemical Properties: Regulatory Effects on PAH Removal and Soil Amelioration

Soil chemical properties significantly influenced PAH removal during the remediation process. BC, MA, and IM all significantly (p < 0.05) elevated soil nutrient levels, with distinct (p < 0.05) differences in their regulatory effects on soil properties by the end of the experiment.
The initial soil pH was slightly acidic (6.31). By the end of the experiment, BC, MA, and IM treatments increased soil pH to the neutral range (6.67–6.89), while CK remained slightly acidic (6.40) (Figure 4). Soil pH in the BC treatment increased from 6.34 to 6.89 (Figure 4); this was mainly attributed to the inherent alkalinity of biochar, and neutral pH favored PAH degradation, as supported by the positive correlation between pH and PAH removal in the BC treatment (β = 0.150; Table 2). In contrast, the pH in MA and IM treatments remained relatively stable at 6.67 and 6.84, respectively, with no further increase, likely due to organic acids produced during PAH degradation [27].
Regarding soil nutrient contents, the IM group exhibited the most significant increases in total nutrients, alkali-hydrolyzable nitrogen (AN), and available potassium (AK). By the end of the experiment, total carbon (TC), total nitrogen (TN), and total phosphorus (TP) in IM increased by 88.83%, 103.92%, and 109.42%, respectively (Figure 5). This improvement may be attributed to the carbon and nutrient inputs from biochar, as well as the metabolic activities of immobilized microorganisms, which may have facilitated the release of soil nutrients.
The IM treatment showed continuous increases in the total nutrient contents (TC, TN, TP) from May to September 2023, coinciding with rapid PAH degradation, particularly HMW PAHs (Figure 2 and Figure 3). TN was positively correlated with total PAH removal in all treatments (β = 0.150 for BC, 0.338 for MA, and 0.107 for IM) (Table 2), indicating that nitrogen availability regulated PAH degradation efficiency in the remediation systems. In the freeze–thaw period, total nutrients (TC, TN, TP) in the BC, MA, and IM groups fluctuated slightly but remained at high levels, sustaining the continuous degradation of PAHs.
IM showed the highest increase in available potassium (AK), with a 129.43% increase (Figure 6c). AK content was strongly correlated with PAH removal efficiency (β = 0.774) (Table 2), suggesting its role in promoting PAH degradation in IM-treated soil. AK enhances microbial enzymatic reactions and cell synthesis, boosting the activity of PAH-degrading taxa such as Proteobacteria [28,29]. AN and AP dynamics in IM were highly similar to MA, consistent with the higher similarity of their bacterial community structures, likely owing to exogenous microbes facilitating the conversion of soil organic phosphorus to AP and inorganic nitrogen to AN.
Notably, AN content across treatments followed the order IM (183.00 mg/kg) > MA (164.93 mg/kg) > BC (157.08 mg/kg) > CK (133.52 mg/kg), which matched the total PAH removal rate ranking (IM > MA > BC > CK). AN was significantly positively correlated with PAH removal only in IM (β = 0.163, p < 0.01), while showing a highly significant negative correlation in MA and BC (β = −0.268, −0.358, p < 0.001), supported by previous studies demonstrating nitrogen’s regulatory role in PAH degradation [30,31].
The negative correlation between temperature and PAH degradation rate (Table 2) reflects the average relationship over the experimental period, a pattern driven by the lagged recovery of microbial activity and reduced PAH bioavailability caused by freeze–thaw cycles. IM exhibited the weakest negative temperature effect (β = −0.229), confirming its ability to mitigate temperature fluctuation inhibition of PAH degradation during freeze–thaw.
According to the “Nutrient Classification Standard of the Second National Soil Survey of China, in Chinese” [32], IM achieved the best agricultural soil quality improvement (all indicators reaching Grade I), outperforming BC, MA and CK (Table 4); IM thus realized simultaneous efficient PAH removal and optimal soil amelioration.

4.3. Relationships Between Soil Bacterial Community, Functional Genes and PAH Removal

The remediation treatments not only modulated the chemical properties of PAHs in soil but also significantly reshaped the structure and function of soil bacterial communities. While the dominant bacterial phyla remained unchanged, the relative abundance of each phylum was altered by the treatments (Figure 7). The three remediation treatments significantly (p < 0.05) increased the relative abundance of Proteobacteria to 45.19–47.53%, compared to 42.49% in the CK group. Proteobacteria, known for their role in PAH degradation and nutrient cycling, served as the core driver in the microbial functional differentiation during remediation [17,34,35]. Pseudomonas sp. S4, a member of Proteobacteria, was inoculated in the MA and IM treatments. Actinobacteriota, the second dominant phylum in IM (16.53%), is one of the core taxa for PAH biodegradation, especially adaptable to freeze–thaw soils [36,37].
The CK group showed the highest number of observed bacterial species (387), but with relatively low community diversity (Table 3). In contrast, all three remediation groups showed an increase in the comprehensive diversity of bacterial communities, likely due to the reduced PAH concentration and improved soil nutrients. This provided better conditions for microbial growth, which in turn promoted nutrient cycling and further PAH degradation. BC significantly (p < 0.05) reduced bacterial richness (Chao1 = 352.048) but increased community diversity (Shannon = 5.467) and evenness (Pielou’s = 0.646) (Table 3). This resulted from the distinct ecological niches provided by composite biochar (B300 + C500): B300 promoted the colonization of specific PAH-degrading bacteria, whereas C500 restricted the overgrowth of non-functional strains, thereby reshaping the bacterial community structure [38].
MA and IM treatments showed no significant (p > 0.05) difference in bacterial richness but exhibited increased community diversity (Shannon = 5.145 and 5.059; Pielou’s = 0.600 and 0.591) (Table 3). The addition of cold-tolerant microorganisms in these treatments likely optimized the bacterial community structure, promoting a synergistic interaction between indigenous and exogenous microbes, which enhanced microbial adaptability to environmental stress.
Cluster analysis revealed distinct microbial community structures in the CK group, while the BC, MA, and IM groups clustered more closely, with MA and IM exhibiting greater similarity (Figure 8). This suggests that remediation treatments significantly altered the microbial community structure, which aligns with the improved PAH degradation observed in these treatments, demonstrating that the introduction of cold-tolerant microorganisms constructed a functionally optimized microbial system, which was more adaptable to the freeze–thaw soil environment and conducive to PAH remediation.
The IM treatment enriched specific bacterial taxa, including Vicinamibacteraceae, Phenylobacterium, Chthoniobacter, Lysobacter and Rhizobacter (Figure 8), which are likely key populations in the IM system. Among these, Phenylobacterium, Lysobacter and Rhizobacter belong to Proteobacteria: Phenylobacterium can utilize aromatic compounds (e.g., benzene, phenol) as carbon sources [39,40], Lysobacter secretes extracellular enzymes (e.g., peroxidase, laccase) to degrade PAHs directly [40,41], and Rhizobacter participates in rhizosphere PAH co-remediation, collectively enhancing the PAH-degrading capacity of the soil [42].
Functional gene prediction revealed the core functional advantage of the IM treatment (Figure 9). The key PAH-degrading genes K00626 (acetyl-CoA acetyltransferase) and K00457 (4-hydroxyphenylpyruvate dioxygenase) had the highest relative abundance in the IM treatment (75.88% and 17.17%, respectively). These two genes likely encode key enzymes for PAH metabolic pathways [24,43], and the combined addition of biochar and exogenous degrading microorganisms significantly upregulates their abundance, accelerating the microbial degradation of PAHs.

5. Conclusions

This study applied composite biochar-immobilized cold-tolerant microbial consortia for the remediation of low-to-moderate PAH-contaminated farmland soils in the seasonal freeze–thaw region of Northeast China.
The results demonstrate that the immobilized microorganism (IM) treatment group exhibited the best PAH removal performance, with a total PAH removal rate of 72.53%. The removal rates for low molecular weight (LMW) and high molecular weight (HMW) PAHs reached 74.90% and 71.48%, respectively. IM maintained a high total PAH removal rate of 54.28% during the freeze–thaw period and showed the most stable remediation efficiency under temperature fluctuations, effectively overcoming the low-temperature limitation of PAH biodegradation.
IM significantly improved soil quality by regulating soil chemical properties. It adjusted soil pH to the optimal neutral range and markedly increased both total nutrients (TC by 88.83%, TN by 103.92%, and TP by 109.42%) and available nutrients (AK by 129.43% and AN by 94.27%). Statistical analysis confirmed that the increases in AK, AN, and TN were positively correlated with PAH removal efficiency in the IM-treated soil. Given the limitations of the present analysis, however, further investigation is still required to verify the specific roles of these nutrients during the PAH remediation process.
IM was dominated by Proteobacteria and Actinobacteriota, which efficiently enriched PAH-degrading bacteria and significantly increased the abundance of PAH degradation-related functional genes K00626 and K00457. Meanwhile, IM enhanced the diversity and stability of the soil microbial community.
This study fills the research gap regarding PAH remediation mechanisms under natural freeze–thaw cycling and provides an innovative technical solution and scientific basis for the efficient remediation and soil quality improvement of low-to-moderate PAH-contaminated farmland in freeze–thaw regions. Future long-term field experiments could further evaluate the sustainability of the IM remediation effect, the stability of microbial activity, and the risk of PAH re-release, to support the large-scale application of this immobilization technology.

Supplementary Materials

The following supporting information can be downloaded at: https://www.mdpi.com/article/10.3390/agronomy16040472/s1, Text S1: Cultivation of Pseudomonas sp. SDR4 (CGMCC NO. 14048) and Mortierella alpine JDR7 (CGMCC NO. 15183). Text S2: Extraction and determination protocols for soil polycyclic aromatic hydrocarbons (PAHs). Table S1: The residual amounts of different ring PAHs in soil among different treatments in October 2023 and April 2024.

Author Contributions

Conceptualization, D.S. and S.X.; methodology, D.S. and S.X.; software, R.S., H.Z. and Y.D.; validation, D.S. and S.X.; formal analysis, D.S., R.S. and H.Z.; investigation, D.S., R.S., H.Z., Y.D. and S.X.; resources, H.Z., Y.D. and S.X.; data curation, R.S., Y.D. and H.Z.; writing—original draft preparation, D.S. and R.S.; writing—review and editing, D.S., R.S., H.Z., Y.D. and S.X.; visualization, R.S., H.Z. and Y.D.; supervision, D.S. and S.X.; project administration, D.S. and S.X.; funding acquisition, D.S. and S.X. All authors have read and agreed to the published version of the manuscript.

Funding

This study was funded by the general program of the National Natural Science Foundation of China (No. 52170163 and No. 42477526), Liaoning Provincial Natural Science Foundation Project (No. 2025-MS-112), and the Support Program for Young and Middle-Aged Scientific and Technological Innovation Talents (Grant No. RC220064).

Data Availability Statement

The original contributions presented in this study are included in the article. Further inquiries can be directed to the corresponding author.

Acknowledgments

During the preparation of this manuscript, the authors used ChatGPT 5.2 in order to improve language. After using this tool, the authors reviewed and edited the content as needed and take full responsibility for the content of the publication.

Conflicts of Interest

The authors declare no conflicts of interest.

References

  1. You, Q.; Yan, K.; Yuan, Z.; Feng, D.; Wang, H.; Wu, L.; Xu, J. Polycyclic aromatic hydrocarbons (PAHs) pollution and risk assessment of soils at contaminated sites in China over the past two decades. J. Clean. Prod. 2024, 450, 141876. [Google Scholar] [CrossRef]
  2. Kariyawasam, T.; Doran, G.S.; Howitt, J.A.; Prenzler, P.D. Polycyclic aromatic hydrocarbon contamination in soils and sediments: Sustainable approaches for extraction and remediation. Chemosphere 2022, 291, 132981. [Google Scholar] [CrossRef] [PubMed]
  3. Zhang, P.; Chen, Y. Polycyclic aromatic hydrocarbons contamination in surface soil of China: A review. Sci. Total Environ. 2017, 605–606, 1011–1020. [Google Scholar] [CrossRef] [PubMed]
  4. Sun, J.; Pan, L.; Tsang, D.C.W.; Zhan, Y.; Zhu, L.; Li, X. Organic contamination and remediation in the agricultural soils of China: A critical review. Sci. Total Environ. 2018, 615, 724–740. [Google Scholar] [CrossRef]
  5. Picariello, E.; Baldantoni, D.; De Nicola, F. Acute effects of PAH contamination on microbial community of different forest soils. Environ. Pollut. 2020, 262, 114378. [Google Scholar] [CrossRef]
  6. Eriksson, M.; Sodersten, E.; Yu, Z.; Dalhammar, G.; Mohn William, W. Degradation of Polycyclic Aromatic Hydrocarbons at Low Temperature under Aerobic and Nitrate-Reducing Conditions in Enrichment Cultures from Northern Soils. Appl. Environ. Microbiol. 2003, 69, 275–284. [Google Scholar] [CrossRef]
  7. Gupta, N.; Banerjee, S.; Koley, A.; Bharali, P.; GhoshThakur, R.; Hoque, R.R.; Balachandran, S. Strategies for remediation of polycyclic aromatic hydrocarbons in contaminated soil: A systematic review and bibliometric analysis. Appl. Soil Ecol. 2024, 204, 105688. [Google Scholar] [CrossRef]
  8. Haritash, A.K.; Kaushik, C.P. Biodegradation aspects of Polycyclic Aromatic Hydrocarbons (PAHs): A review. J. Hazard. Mater. 2009, 169, 1–15. [Google Scholar] [CrossRef]
  9. Boonchan, S.; Britz, M.L.; Stanley, G.A. Degradation and mineralization of high-molecular-weight polycyclic aromatic hydrocarbons by defined fungal-bacterial cocultures. Appl. Environ. Microbiol. 2000, 66, 1007–1019. [Google Scholar] [CrossRef]
  10. Lü, H.; Wei, J.-L.; Tang, G.-X.; Chen, Y.-S.; Huang, Y.-H.; Hu, R.; Mo, C.-H.; Zhao, H.-M.; Xiang, L.; Li, Y.-W.; et al. Microbial consortium degrading of organic pollutants: Source, degradation efficiency, pathway, mechanism and application. J. Clean. Prod. 2024, 451, 141913. [Google Scholar] [CrossRef]
  11. Naloka, K.; Kuntaveesuk, A.; Muangchinda, C.; Chavanich, S.; Viyakarn, V.; Chen, B.; Pinyakong, O. Pseudomonas and Pseudarthrobacter are the key players in synergistic phenanthrene biodegradation at low temperatures. Sci. Rep. 2024, 14, 11976. [Google Scholar] [CrossRef]
  12. Ahmad, M.; Rajapaksha, A.U.; Lim, J.E.; Zhang, M.; Bolan, N.; Mohan, D.; Vithanage, M.; Lee, S.S.; Ok, Y.S. Biochar as a sorbent for contaminant management in soil and water: A review. Chemosphere 2014, 99, 19–33. [Google Scholar] [CrossRef] [PubMed]
  13. Hale, S.E.; Lehmann, J.; Rutherford, D.; Zimmerman, A.R.; Bachmann, R.T.; Shitumbanuma, V.; O’Toole, A.; Sundqvist, K.L.; Arp, H.P.; Cornelissen, G. Quantifying the total and bioavailable polycyclic aromatic hydrocarbons and dioxins in biochars. Environ. Sci. Technol. 2012, 46, 2830–2838. [Google Scholar] [CrossRef] [PubMed]
  14. Beesley, L.; Moreno-Jiménez, E.; Gomez-Eyles, J.L.; Harris, E.; Robinson, B.; Sizmur, T. A review of biochars’ potential role in the remediation, revegetation and restoration of contaminated soils. Environ. Pollut. 2011, 159, 3269–3282. [Google Scholar] [CrossRef]
  15. Keiluweit, M.; Kleber, M.; Sparrow, M.A.; Simoneit, B.R.T.; Prahl, F.G. Solvent-Extractable Polycyclic Aromatic Hydrocarbons in Biochar: Influence of Pyrolysis Temperature and Feedstock. Environ. Sci. Technol. 2012, 46, 9333–9341. [Google Scholar] [CrossRef]
  16. Su, D.; Liu, Y.; Liu, F.; Dong, Y.; Pu, Y. Enhancing polycyclic aromatic hydrocarbon soil remediation in cold climates using immobilized low-temperature-resistant mixed microorganisms. Sci. Total Environ. 2024, 939, 173414. [Google Scholar] [CrossRef]
  17. Li, Y.; Chen, H.; Li, W.; Xi, B.; Huang, C. A novel immobilized bacteria consortium enhanced remediation efficiency of PAHs in soil: Insights into key removal mechanism and main driving factor. J. Hazard. Mater. 2025, 486, 137144. [Google Scholar] [CrossRef]
  18. Maliszewska-Kordybach, B. Polycyclic aromatic hydrocarbons in agricultural soils in Poland: Preliminary proposals for criteria to evaluate the level of soil contamination. Appl. Geochem. 1996, 11, 121–127. [Google Scholar] [CrossRef]
  19. Pinheiro, J.C.; Bates, D.M. Mixed-Effects Models in S and S-PLUS; Springer: New York, NY, USA, 2000; pp. 3–56, 97–132, 133–199, 201–270. [Google Scholar] [CrossRef]
  20. Zhao, M.; Li, Y.; Yuan, X.; Liang, G.; Wang, B.; Liu, C.; Khaing, M.M. Establishment of a dietary exposure assay for evaluating the toxicity of insecticidal compounds to Apolygus lucorum (Hemiptera: Miridae). Environ. Pollut. 2018, 237, 414–423. [Google Scholar] [CrossRef]
  21. Graham, M.H. Confronting multicollinearity in ecological multiple regression. Ecology 2003, 84, 2809–2815. [Google Scholar] [CrossRef]
  22. Dormann, C.F.; Elith, J.; Bacher, S.; Buchmann, C.; Carl, G.; Carré, G.; Marquéz, J.R.G.; Gruber, B.; Lafourcade, B.; Leitão, P.J. Collinearity: A review of methods to deal with it and a simulation study evaluating their performance. Ecography 2013, 36, 27–46. [Google Scholar] [CrossRef]
  23. Zhang, Y.; Peng, C.; Guo, Z.; Xiao, X.; Xiao, R. Polycyclic aromatic hydrocarbons in urban soils of China: Distribution, influencing factors, health risk and regression prediction. Environ. Pollut. 2019, 254, 112930. [Google Scholar] [CrossRef] [PubMed]
  24. Li, X.; Song, Y.; Wang, F.; Bian, Y.; Jiang, X. Combined effects of maize straw biochar and oxalic acid on the dissipation of polycyclic aromatic hydrocarbons and microbial community structures in soil: A mechanistic study. J. Hazard. Mater. 2019, 364, 325–331. [Google Scholar] [CrossRef]
  25. Krzyszczak, A.; Dybowski, M.P.; Zarzycki, R.; Kobyłecki, R.; Oleszczuk, P.; Czech, B. Long-term physical and chemical aging of biochar affected the amount and bioavailability of PAHs and their derivatives. J. Hazard. Mater. 2022, 440, 129795. [Google Scholar] [CrossRef]
  26. Song, Q.; Li, X.; Hou, N.; Pei, C.; Li, D. Chemotaxis-mediated degradation of PAHs and heterocyclic PAHs under low-temperature stress by Pseudomonas fluorescensS01: Insights into the mechanisms of biodegradation and cold adaptation. J. Hazard. Mater. 2024, 469, 133905. [Google Scholar] [CrossRef]
  27. Ghosal, D.; Ghosh, S.; Dutta, T.K.; Ahn, Y. Current State of Knowledge in Microbial Degradation of Polycyclic Aromatic Hydrocarbons (PAHs): A Review. Front. Microbiol. 2016, 7, 1369. [Google Scholar] [CrossRef]
  28. Shanker, U.; Jassal, V.; Rani, M. Degradation of toxic PAHs in water and soil using potassium zinc hexacyanoferrate nanocubes. J. Environ. Manag. 2017, 204, 337–348. [Google Scholar] [CrossRef]
  29. Shi, Y.; Qiu, L.; Guo, L.; Man, J.; Shang, B.; Pu, R.; Ou, X.; Dai, C.; Liu, P.; Yang, Y.; et al. K Fertilizers Reduce the Accumulation of Cd in Panax notoginseng (Burk.) F.H. by Improving the Quality of the Microbial Community. Front. Plant Sci. 2020, 11. [Google Scholar] [CrossRef]
  30. Wang, J.; Yang, Z.; Zhou, X.; Waigi, M.G.; Gudda, F.O.; Odinga, E.S.; Mosa, A.; Ling, W. Nitrogen addition enhanced the polycyclic aromatic hydrocarbons dissipation through increasing the abundance of related degrading genes in the soils. J. Hazard. Mater. 2022, 435, 129034. [Google Scholar] [CrossRef]
  31. Du, J.; Liu, J.; Jia, T.; Chai, B. The relationships between soil physicochemical properties, bacterial communities and polycyclic aromatic hydrocarbon concentrations in soils proximal to coking plants. Environ. Pollut. 2022, 298, 118823. [Google Scholar] [CrossRef]
  32. Zhou, Q.; Peng, Q.X.; Zhang, C.Q. Spatial Distribution and Evaluation of Nutrients in the Sediments of Caohai in Guizhou. J. Southwest Univ. (Nat. Sci. Ed.) 2021, 43, 33–39. (In Chinese) [Google Scholar] [CrossRef]
  33. Nelson, D.W.; Sommers, L.E. Total Carbon, Organic Carbon, and Organic Matter. In Methods of Soil Analysis; Page, A.L., Ed.; Agronomy Monographs; American Society of Agronomy: Madison, WI, USA, 1982; pp. 539–579. [Google Scholar] [CrossRef]
  34. Wu, X.; Peng, J.; Liu, P.; Bei, Q.; Rensing, C.; Li, Y.; Yuan, H.; Liesack, W.; Zhang, F.; Cui, Z. Metagenomic insights into nitrogen and phosphorus cycling at the soil aggregate scale driven by organic material amendments. Sci. Total Environ. 2021, 785, 147329. [Google Scholar] [CrossRef] [PubMed]
  35. Yi, M.; Zhang, L.; Qin, C.; Lu, P.; Bai, H.; Han, X.; Yuan, S. Temporal changes of microbial community structure and nitrogen cycling processes during the aerobic degradation of phenanthrene. Chemosphere 2022, 286, 131709. [Google Scholar] [CrossRef] [PubMed]
  36. Klemm, S. Microbial Responses to the Biostimulation of Subarctic Hydrocarbon-Contaminated Soils Under Seasonal Freeze-Thaw Conditions. Master’s Thesis, McGill University, Montreal, QC, Canada, 2010. Available online: https://escholarship.mcgill.ca/concern/theses/9g54xj123 (accessed on 1 February 2026).
  37. Chang, W.; Klemm, S.; Beaulieu, C.; Hawari, J.; Whyte, L.; Ghoshal, S. Petroleum Hydrocarbon Biodegradation under Seasonal Freeze−Thaw Soil Temperature Regimes in Contaminated Soils from a Sub-Arctic Site. Environ. Sci. Technol. 2011, 45, 2112–2119. [Google Scholar] [CrossRef]
  38. Masiello, C.A.; Chen, Y.; Gao, X.; Liu, S.; Cheng, H.Y.; Bennett, M.R.; Rudgers, J.A.; Wagner, D.S.; Zygourakis, K.; Silberg, J.J. Biochar and microbial signaling: Production conditions determine effects on microbial communication. Environ. Sci. Technol. 2013, 47, 11496–11503. [Google Scholar] [CrossRef]
  39. Rodgers-Vieira, E.A.; Zhang, Z.; Adrion, A.C.; Gold, A.; Aitken, M.D. Identification of anthraquinone-degrading bacteria in soil contaminated with polycyclic aromatic hydrocarbons. Appl. Environ. Microbiol. 2015, 81, 3775–3781. [Google Scholar] [CrossRef]
  40. Jiménez-Volkerink, S.N.; Vila, J.; Jordán, M.; Minguillón, C.; Smidt, H.; Grifoll, M. Multi-Omic Profiling of a Newly Isolated Oxy-PAH Degrading Specialist from PAH-Contaminated Soil Reveals Bacterial Mechanisms to Mitigate the Risk Posed by Polar Transformation Products. Environ. Sci. Technol. 2023, 57, 139–149. [Google Scholar] [CrossRef]
  41. de Bruijn, I.; Cheng, X.; de Jager, V.; Expósito, R.G.; Watrous, J.; Patel, N.; Postma, J.; Dorrestein, P.C.; Kobayashi, D.; Raaijmakers, J.M. Comparative genomics and metabolic profiling of the genus Lysobacter. BMC Genom. 2015, 16, 991. [Google Scholar] [CrossRef]
  42. Li, X.; Qu, C.; Bian, Y.; Gu, C.; Jiang, X.; Song, Y. New insights into the responses of soil microorganisms to polycyclic aromatic hydrocarbon stress by combining enzyme activity and sequencing analysis with metabolomics. Environ. Pollut. 2019, 255, 113312. [Google Scholar] [CrossRef]
  43. Zhang, Z.; Zhao, X.; Liang, Y.; Li, G.; Zhou, J. Microbial functional genes reveal selection of microbial community by PAHs in polluted soils. Environ. Chem. Lett. 2013, 11, 11–17. [Google Scholar] [CrossRef]
Figure 1. Dynamic variations in daily air and soil temperatures in agricultural fields during non-freezing and freeze–thaw periods (May 2023–April 2024). The filled area between Tmax and Tmin is colored orange (above 0°C) and yellow (below 0°C). Tmax. Daily maximum air temperature; Tmin. Daily minimum air temperature; STmax. Daily maximum soil temperature; STmin. Daily minimum soil temperature. Normal temperature period (May 2023–October 2023), freeze–thaw period (November 2023–April 2024).
Agronomy 16 00472 g001
Figure 2. Dynamics of cumulative removal rate and monthly absolute growth rate of total PAHs under different treatments over 12 months. (a) Total PAH removal rates in soils; (b) Temporal dynamics of monthly absolute increase in total PAH removal rate. CK. Control group; BC. Biochar; MA. Microbial agent; IM. Immobilized microorganism. Normal temperature period (May 2023–October 2023), freeze–thaw period (November 2023–April 2024). Data are presented as mean ± SD (n = 3).
Agronomy 16 00472 g002
Figure 3. Residual concentrations of ring-specific PAHs under different treatments over 12 months. CK. Control group; BC. Biochar; MA. Microbial agent; IM. Immobilized microorganism. Normal temperature period (May 2023–October 2023), freeze–thaw period (November 2023–April 2024). Data are presented as mean ± SD (n = 3).
Agronomy 16 00472 g003
Figure 4. Soil pH dynamics under different treatments over 12 months. CK. Control group; BC. Biochar; MA. Microbial agent; IM. Immobilized microorganism. Normal temperature period (May 2023–October 2023), freeze–thaw period (November 2023–April 2024). Data are presented as mean ± SD (n = 3).
Agronomy 16 00472 g004
Figure 5. Changes in total carbon, nitrogen, and phosphorus in soil under different treatments over 12 Months. (a) Total carbon, TC; (b) Total nitrogen, TN; (c) Total phosphorus, TP. CK. Control group; BC. Biochar; MA. Microbial agent; IM. Immobilized microorganism. Normal temperature period (May 2023–October 2023), freeze–thaw period (November 2023–April 2024). Data are presented as mean ± SD (n = 3).
Agronomy 16 00472 g005
Figure 6. Changes in alkali-hydrolyzable nitrogen, available phosphorus, and available potassium in soil. (a) Alkali-hydrolyzable nitrogen, AN; (b) available phosphorus, AP; (c) available potassium, AK. CK. Control group; BC. Biochar; MA. Microbial agent; IM. Immobilized microorganism. Normal temperature period (May 2023–October 2023), freeze–thaw period (November 2023–April 2024). Data are presented as mean ± SD (n = 3).
Agronomy 16 00472 g006
Figure 7. Variation in relative abundance of the top 20 soil microbial phyla among different treatments. CK. Control group; BC. Biochar; MA. Microbial agent; IM. Immobilized microorganism.
Agronomy 16 00472 g007
Figure 8. Hierarchical clustering heatmap of genus-level soil microbial community composition under different treatments. CK. Control group; BC. Biochar; MA. Microbial agent; IM. Immobilized microorganism.
Agronomy 16 00472 g008
Figure 9. Abundance of genes related to PAH degradation by soil bacteria under different treatments. CK. Control group; BC. Biochar; MA. Microbial agent; IM. Immobilized microorganism.
Agronomy 16 00472 g009
Table 1. Monthly growth rate differences in total PAH removal (reference: IM treatment).
TreatmentGrowth Difference vs. IM (%/Month)Actual Growth Rate (%)p-Value
IM0 (Ref)6.10
CK−5.750.35<0.001
BC−1.724.38<0.001
MA−0.765.340.040
Actual growth rate was calculated as the sum of the baseline monthly growth rate of total PAH removal (6.10%) and the group-specific growth difference vs. IM treatment. Ref. Reference. p-values indicate the statistical significance of growth rate differences relative to IM group. CK. Control group; BC. Biochar; MA. Microbial agent; IM. Immobilized microorganism.
Table 2. Statistical associations of temperature and chemical factors with total PAH removal across different treatment groups.
TreatmentTemperature (T) (β, B)Positively Associated Factors (β, B)Negatively Associated Factors (β, B)
CKT (−0.669 ***, −0.081 ***)TC (0.475 ***, 0.358 ***)
BCT (−0.636 ***, −0.938 ***)AP (0.540 ***, 0.990 ***)
TN (0.163 ***, 11.427 ***)
pH (0.150 ***, 16.175 ***)
AN (−0.358 ***, −0.358 ***)
MAT (−0.656 ***, −1.035 ***)TN (0.518 ***, 48.793 ***)
AP (0.338 ***, 0.667 ***)
AN (−0.268 ***, −0.177 ***)
AK (−0.206 ***, −0.437 ***)
pH (−0.147 *, −26.426 *)
IMT (−0.229 ***, −0.395 ***)AK (0.774 ***, 0.785 ***)
AN (0.163 **, 0.174 **)
TN (0.107 ***, 7.416 ***)
AP (−0.272 ***, −0.633 ***)
β. Standardized coefficient. B. Unstandardized coefficient. CK. Control group; BC. Biochar; MA. Microbial agent; IM. Immobilized microorganism. T. Temperature. TC. Total carbon. AP. Available phosphorus. TN. Total nitrogen. AN. Alkali-hydrolyzable nitrogen. AK. Available potassium. * p < 0.05, ** p < 0.01, *** p < 0.001. “—”. No associated factors in this category.
Table 3. Alpha diversity indices of soil bacterial communities under different treatments.
Chao1Observed_SpeciesShannonPielou’sGood’s_Coverage
CK387.159 ± 18.29 a387 ± 11.52 a4.362 ± 0.17 c0.507 ± 0.013 c0.999
BC352.048 ± 13.44 b352 ± 16.82 b5.467 ± 0.04 a0.646 ± 0.003 a0.999
MA382.149 ± 14.69 ab382 ± 6.28 a5.145 ± 0.02 b0.600 ± 0.037 b0.999
IM379.01 ± 9.75 ab378.8 ± 7.26 a5.059 ± 0.04 b0.591 ± 0.003 b0.999
Different lowercase letters indicate significant differences between treatment groups for the same Alpha diversity index (p < 0.05).
Table 4. Comparison of soil quality grades between original soil and post-experimental treatments.
OSCKBCMAIM
Organic matter (g/kg)IIIIIIIIII
Total nitrogen (g/kg)IIIIIII
Total phosphorus (g/kg)IIIIII
Alkali-hydrolyzable Nitrogen (mg/kg)IIIIIIII
Available Phosphorus (mg/kg)IIIII
Available Potassium (mg/kg)IVIIIIIIIII
pHMildly acidicMildly AcidicNeutralNeutralNeutral
Grade: I: Extremely rich; II: Rich; III: Relatively rich; IV: Moderate. Organic matter is estimated based on the classic Van Bemmelen conversion factor (1.724). According to the literature, this conversion method is considered to have certain applicability [33]. OS. Original soil. Data from the first sampling in May 2023 were obtained using the CK treatment; CK. Control group; BC. Biochar; MA. Microbial agent; IM. Immobilized microorganism. Data from the end of the experiment in April 2024.
Disclaimer/Publisher’s Note: The statements, opinions and data contained in all publications are solely those of the individual author(s) and contributor(s) and not of MDPI and/or the editor(s). MDPI and/or the editor(s) disclaim responsibility for any injury to people or property resulting from any ideas, methods, instructions or products referred to in the content.