Article

Impact of Soil Management Practices on Olive Orchard Soil Health and Arthropod Diversity in Messenia, Greece


1
Department of Physical Geography, Stockholm University, 106 91 Stockholm, Sweden
2
Navarino Environmental Observatory (NEO), Department of Physical Geography, Stockholm University, 240 01 Messenia, Greece
3
Laboratory of Climatology and Atmospheric Environment, Department of Geology and Geoenvironmental, National and Kapodistrian, University of Athens, 157 71 Athens, Greece
*
Authors to whom correspondence should be addressed.
Agronomy 2026, 16(4), 404; https://doi.org/10.3390/agronomy16040404
Submission received: 31 December 2025 / Revised: 24 January 2026 / Accepted: 3 February 2026 / Published: 7 February 2026

Abstract

Soil degradation driven by intensive management practices has become of increasing concern for olive cultivation, as trends for desertification and loss of arable land have emerged across the Mediterranean basin. Agroecological management practices, such as mulching made from olive tree pruning remains, have shown potential for improving soil structure, nutrient retention and biodiversity. This study aimed to enhance the understanding of how soil management influences soil properties and arthropod diversity in small-scale olive orchards in a heterogeneous landscape in south-west Greece. Soil was sampled from 11 orchards managed under one of two systems: conventional (herbicide use, tillage, mowing) and agroecological (cover cropping, mulching), encompassing a diversity of management practices. Physicochemical properties were measured alongside soil arthropod abundance and diversity, allowing for comparisons at two levels: between management systems and among practices nested within each system. When compared across broader systems, the agroecological orchards, compared to conventional orchards, had greater porosity (56.38% and 48.75%), and soil organic matter (8.99% and 6.87%), though differences in soil composition likely accounted for some of the variation. Additionally, metrics for arthropod diversity were improved under agroecological management, with 21% higher Shannon diversity and 16.8% greater evenness compared to conventional management. Ordination analysis and generalized linear models further supported these findings illustrating the relationship between agroecological management, soil health and arthropod diversity. These results support a growing body of research which illustrate the potential of agroecological management in enhancing soil health and biodiversity in olive orchards and contributing to the development of more resilient agroecosystems within the Mediterranean basin.

1. Introduction

Within the EU, 60–70% of soils are degraded as a direct impact of intensive agricultural management [1]. Intensive management, also known as conventional management, encompasses practices such as crop homogenization, extensive land use, tillage and chemical inputs [2,3]. Without intervention, soil degradation is projected to worsen, as 90% of the global growth in crop production is expected to come from higher yields and increased cropping intensity, with the remainder resulting from land expansion [4]. This degradation threatens the multifunctionality of agroecosystems—critically impairing ecosystem services, such as temperature regulation, carbon sequestration, nutrient cycling, and water infiltration [1,5]. Moreover, this has direct consequences to agro- and ecological biodiversity, manifesting as the loss of native plant species, microorganisms, and microhabitats [6,7], all of which are required for the persistence and resilience of global food systems [8].
Various policy and research platforms have begun to prioritize these challenges [2,9]. For example, the ‘EU Soil Strategy for 2030’, aims to restore degraded European soils by 2050 through various measures [10]. However, one key element to such a plan is accurate soil monitoring and assessment of soil health across a diversity of agroecosystems [11,12]. Soil health, characterized by its physical, chemical, and biological properties, can indicate a soil’s proneness to degradation [1,13]. Chemical and physical properties include pH, soil organic matter, and bulk density [7,14]. Biological properties include the activity of microorganisms, such as fungi and bacteria, and soil macrofauna such as soil arthropods [15]. Interestingly, attempts to use soil arthropod diversity and community composition as an indicator for soil health have been attempted [16,17]. However, more evidence is needed to support this relationship [15]. Another challenge is capturing the diversity of agricultural management as how this varies across crops, countries, and socioeconomic regions. While there is a growing body of research which helps explain the relationship between soil health and management, much of the existing data is based on experimental setups—testing an ideal that often does not exist in reality [13].
In Greece, olive farming exemplifies the aforementioned challenges. Olive (Olea europaea) cultivation covers an area of over 700,000 ha and is considered one of the most significant agricultural activities from a financial, social, and ecological perspective [18]. In recent decades, increased demand for olive oil and table olives has led to the industrialization and consequent expansion of olive farming into more accessible arable land [18,19]. This expansion has permitted the mechanization of olive production and harvest, as well as a need for more intensive use of irrigation and groundwater [20,21]. Farmers now prioritize management which requires minimal water usage and reduced physical maintenance such as low planting density, limiting canopy size, and the elimination of natural ground cover [22]. While many of these practices reduce the physical cost for the farmer, they simultaneously increase pests, fungal infections, and increase susceptibility to desertification [21,22]. Furthermore, the risk of drought, water insecurity and seasonal extremes has become increasingly prevalent in Greece due to climate change [1,20], all of which are actively feeding into a cycle of erosion, salinization, compaction, sealing, and contamination—ultimately degrading soil throughout the landscape [6,21]. The collective consequences of these factors have manifested as widespread ecological damage, declining olive yields, and increasing land abandonment [23,24,25]. Therefore, there is a pressing need for the adoption of management practices which support soil ecosystems and biodiversity [26].
Agroecological management is an increasingly popularized approach which supports soil function and biodiversity, through several principals including the limiting of mechanical disturbance to the soil, application of organic amendments, and the maintenance and diversification of ground cover [2,13,27]. These principals promote soil health, preventing further degradation [2,13]. Specific to olive orchards, promising results have been found in orchards applying cover crops and cover using mulching made of olive tree pruning remains. Studies have shown these practices increase soil organic matter (SOM), improving soil fertility and structure, preserve soil moisture, and prevent soil erosion [18]. Even when used in predominantly more intensive systems, these methods have been found to show generous benefits [18,28]. However, the use of these practices are still limited in Greece, and their effectiveness if implemented is not yet well understood due to the low availability of data in the country regarding soil health and management [29].
The aim of this study was to investigate the impact of soil management on soil health and biodiversity of olive orchards within the region of Messenia (Figure 1), one of the most productive olive growing regions in Greece [30]. To achieve this, the landscape was surveyed to identify the major practices used in the region. Once identified, representative orchards were selected, and soil samples were taken to both classify the soil texture and assess its physiochemical properties. Additionally, arthropod traps were set in several orchards within the landscape to measure several metrics of soil arthropod diversity. We hypothesized that orchards under agroecological management would have improved chemical and physical (structural) properties. We further expected that these improved physiochemical properties would correspond to higher arthropod diversity and community evenness.

2. Materials and Methods

2.1. Study Area and Orchard Selection

A total of twelve olive orchards were selected in the region of Messenia (36°59′33.8028″ N, 21°39′24.4476″ E), close to the Navarino Environmental Observatory. The landscape is characterized by a mosaic of coastal lowlands, mountainous terrain, and olive orchards resulting in a diverse range of microclimates within the region [30]. The climate is characteristic of a typical mediterranean climate, marked by hot, dry summers and mild, wet winters [8], with a mean annual air temperature (MAT) of 18 °C and mean annual precipitation (MAP) of 695 mm (mean between 1956 and 2011, from the Hellenic National Meteorological Service, Methoni) [31]. The local climatic conditions, combined with the underlying limestone geology, have resulted in the formation of a diverse range of soil types [32]. Furthermore, the interplay between climate, topography, and geology creates varied growing conditions (e.g., water availability and nutrient content) for olive trees [33].
The twelve orchards were managed under one of two systems: conventional (CON, hereafter) and agroecological (ECO, hereafter). Nested within each system were specific management practices (Figure 1). For ECO orchards, this included (i) mulching (MU) using olive tree pruning remains and (ii) cover cropping (CC). For CON orchards, this included (i) herbicide (H), (ii) tillage (T), and (iii) mowing (M) of the natural vegetation. For each management practice, two to three representative orchards were identified. Additional information on the specificities of each practice was collected through direct communication with the landowner (Table 1).
All orchards were comparable in terms of agronomical features (planting density, variety and age) as well as the slope (approximately <20%). For further details of each practice, see Appendix A (Table A1). All practices were established (>4 years) [34], with the exception of CC3, which had been applying cover crops for the last two years. Across agroecological orchards, no additional chemical amendments (fertilizers, pesticides, nor herbicides) were applied. The position of the orchards within the landscape varied due to the heterogeneity of the topography, with some orchards located in the hills and some within urban settlements.

2.2. Soil Sampling and Analysis

All soil samples were taken in November 2025 during the olive harvest season. Prior to sampling, a standard area of 0.25 ha was established for sampling, considering a ten-meter buffer zone for each orchard. The buffer zone was established to mitigate any edge effects from bordering orchards [35]. Within this plot, four transects of fifty meters in length were established. The transects were used as a reference for all soil and arthropod sampling points [35,36], all of which were pre-determined in QGIS (version 3.34.4, Zurich, Switzerland) using the research tool ‘random points on lines’ and exported to the app ‘SW Maps’ (version 1.2.4, New Delhi, India) for field reference.
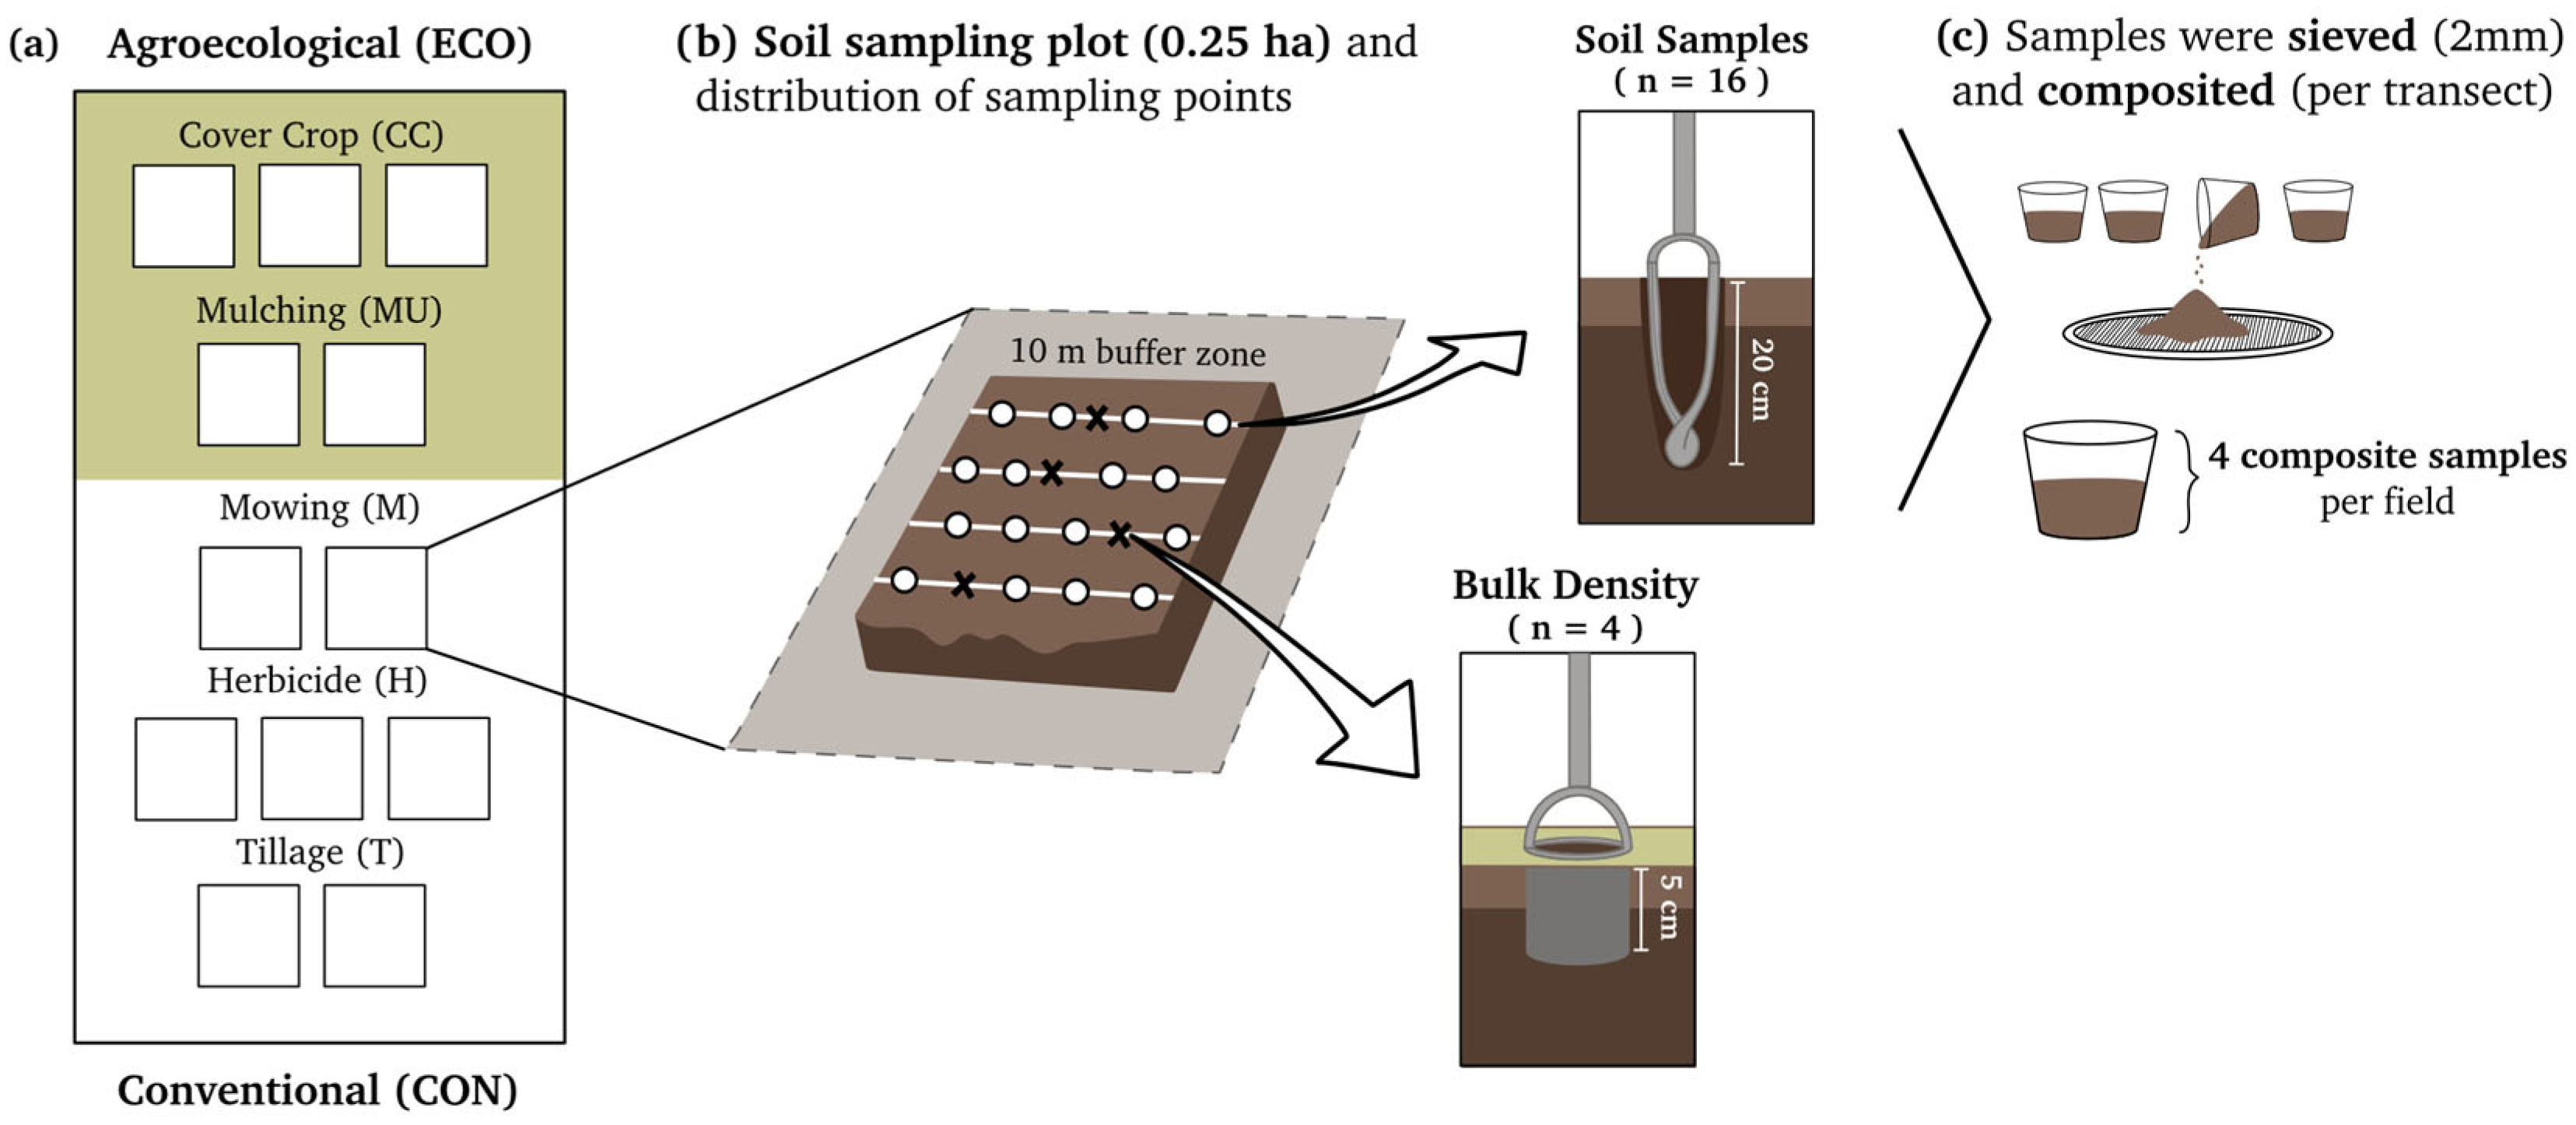
The soil sampling procedure involved randomly selecting four points per transect (Figure 2). From the selected points, soil samples were taken using an Edelman augur, at 0–20 cm soil depth [37]. The samples were combined into one composite sample per transect, resulting in four composite samples per orchard [38]. These samples were used for both the classification of the soil (in terms of texture) as well as the analysis for soil organic matter (SOM) and pH. All samples were sieved (<2 mm), air-dried and stored at 20 °C until further analysis. All bulk density (BD) measurements were taken in January, in which one point was randomly selected per transect. All samples were taken using a cylindrical augur, at 0–5 cm soil depth [39]. The BD samples remained inside of the cylinder in order to maintain the original structure of the soil and the analysis was conducted on the same day. All sampling was conducted outside the tree canopy [34].
The texture of the orchard was quantified using the ‘Hydrometer Method’ [33,39,40,41]. Soil preparation required the creation of one representative sample (50 g), consisting of approximately 12.5 g of each composite sample per orchard. All samples were pulverized using a pestle and mortar. Laboratory preparation involved placing deionized water into a cylinder and leaving it to rest overnight, as well as a control sample consisting of 100 mL of NaPO3 and 900 mL of deionized water. Each soil sample was mixed with a 2:1 ratio of deionized water and a sodium hexametaphosphate (NaPO3) dispersing solution and then placed in a sealable volumetric flask. Samples were placed in a shaker for 15 min. All solutions were left in the lab overnight to ensure they reached room temperature (20 °C).
The following day, the soil slurries were shaken for another 15 min and placed in 1000 mL volumetric flasks. The cylinder was then brought to its total volume using the deionized water that had been prepared. All samples were thoroughly mixed using a plunger before the first hydrometer reading. Following the mixing of the sample, readings were taken at 40 s and 2 h using a standard hydrometer (g L−1). Temperature (°C) was also recorded, and this value was used to adjust the recorded buoyancy. For each degree above 20 °C, 0.36 was added to the buoyancy value, or subtracted if below. Once the corrections were made, Equation (1) was used to calculate first the collective fraction of clay and silt (reading after 40 s in g L−1), followed by the clay fraction (reading after 2 h in g L−1).
S a m p l e g   L 1 R e a d i n g ( g   L 1 ) ) s a m p l e   w e i g h t g 100
Sample (g L−1) represents the initial concentration of total soil mass dispersed in the liquid suspension, while the reading (g L−1) corresponds to the concentration of particles remaining in the suspension at a given time (40 s and 2 h, respectively). The fraction of silt was calculated according to Equation (2):
% S i l t = ( % S i l t + % C l a y ) % C l a y
Lastly, Equation (3) was used to calculate the fraction of sand. The final percentages were used to classify each of the samples according to the USDA soil texture triangle [42].
% S a n d = 100 ( % S i l t + % C l a y )
The following soil properties were determined: soil organic matter (SOM), soil organic carbon (SOC), pH, bulk density (BD), porosity, and soil moisture. Organic matter was determined using a loss on ignition procedure (550 °C for 3 h) [43]. To estimate SOC, a conversion factor of 0.58 was multiplied by SOM [43]. Soil pH was measured in the lab [44] using a portable pH electrode (HI-99121; Hannah Instruments, Woonsocket, RI, USA). In order to measure pH, four replicates of 20 g of the air-dried soil samples were pulverized and mixed for one minute with 40 mL of deionized water in 100 mL cylinders [44]. Once all particles settled (taking approximately 30 min), the tip of the electrode was placed in the solution, and the pH was recorded [45].
In order to determine bulk density (BD; g/cm3), soil samples were heated at 105 °C for 24 h [46]. Prior to drying, the volume and mass (g) of the cylinder were recorded. After 24 h, the samples were cooled, and the dry weight was recorded. Porosity was derived from BD using an assumed particle density for limestone soils (s = 2.7 g) [47]. Equation (4) was used to calculate an approximation of soil porosity per BD sample where porosity is ϕ , ρ b is BD, and ρ s   is the particle density [48]:
ϕ   = 1   ρ b ρ s
Soil moisture was determined using a portable soil moisture sensor (TEROS 12, METER Group Inc., Pullman, WA, USA), measured as volumetric water content (m3/m3) [35]. Measurements required the creation of a borehole, allowing for the insertion of the sensor in the side wall of the cavity. Readings were taken every two to three days over the course of ten days, in which four readings were taken per field per sampling day [49]. The mean volumetric water content (m3/m3) per orchard was taken as the final metric for soil moisture.

2.3. Arthropod Sampling

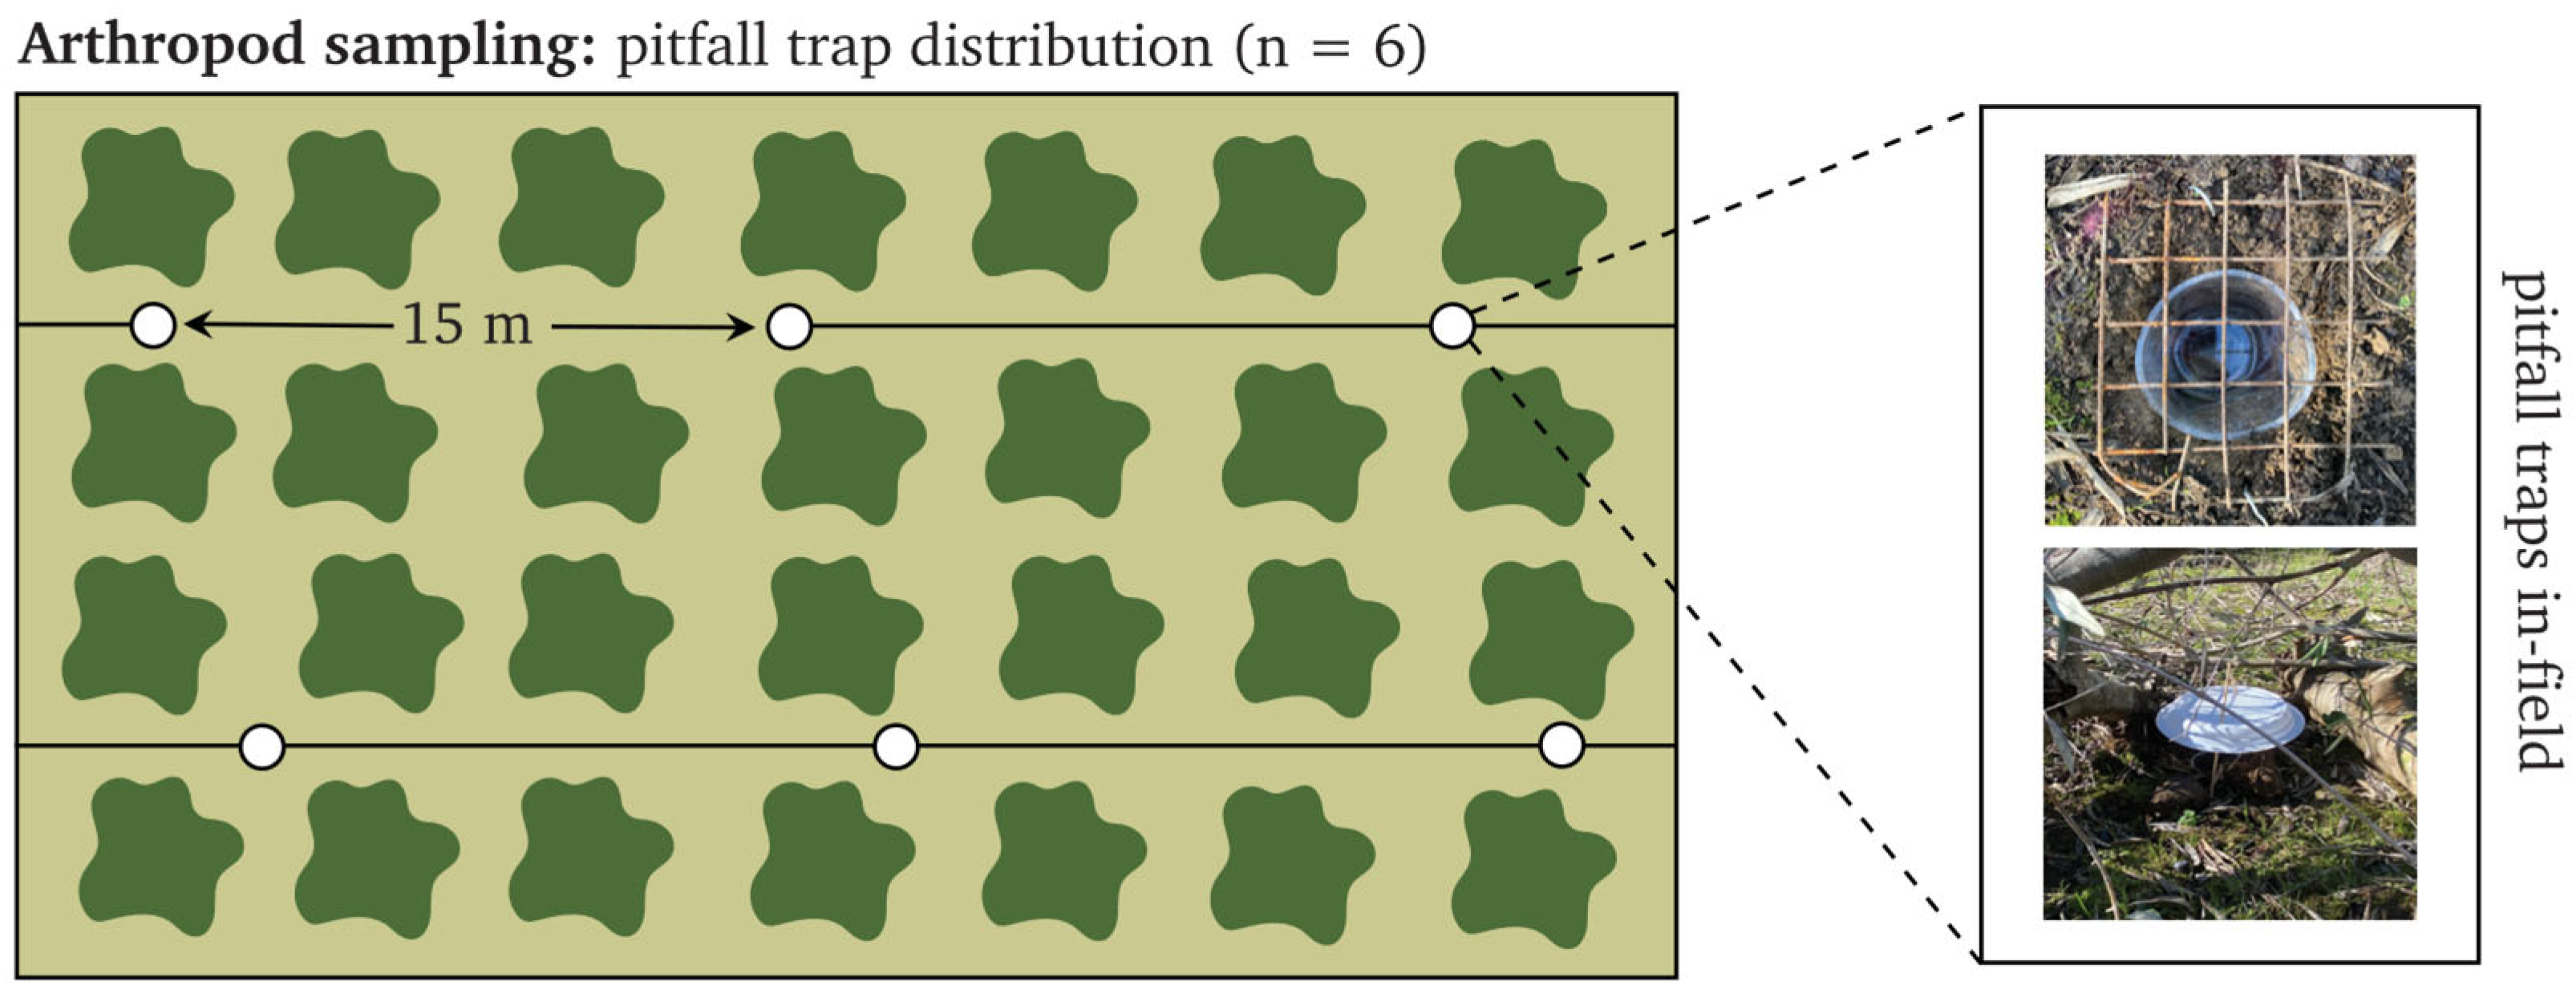
The arthropod sampling procedure involved the installation of pitfall traps, which were implanted over the course of two days in November [50,51]. Six pitfall traps were implanted per orchard, with three traps spaced 15 m apart along the two centermost transects [51]. The traps were installed with an Edelman augur, using cups 10 cm in depth, and 8 cm in diameter—making sure that the top of cup was level with the surface of the ground. The cups were filled one-fourth with propylene glycol for the preservation of the arthropods [50,51,52]. In an attempt to prevent the traps from flooding due to rainfall, a cover was created using a plastic plate and wooden skewers. Additionally, the plates were covered with surrounding foliage to weigh down the materials and provide some camouflage (Figure 3).
After seven days, the samples were collected and transported back to the lab in sealed containers. Arthropods were identified predominantly to order level [50,53], with the exception of a few taxa which were identified to family level [54]. If the abundance was less than five, individuals across all samples’ orders were combined into ‘Other’ [55]. The following metrics were used to quantify arthropod abundance, diversity and community composition: (i) total arthropod abundance, (ii) relative abundance (RA), (iii) order richness, (iv) Shannon diversity (H), (v) Pielous evenness index (J), and (vi) inverse Simpson diversity (1/D) [17,55]. All metrics were calculated in R using the ‘vegan’ package [54].

2.4. Statistical Analysis

Statistical analysis was conducted in R studio (2024.12.0, Boston, MA, USA). Orchard H1 was excluded from the analysis, due to excessive flooding which took place over the duration of the sampling. This resulted in five ECO orchards (3 cover crops and 2 mulching), and six CON orchards (2 orchards per management practice). Statistical comparisons of soil properties were conducted at two levels: between management systems and among practices nested within each system.
In order to determine the appropriate statistical test, normality was assessed using the Shapiro–Wilk test and Levene’s test was used for measuring homogeneity of variances (p < 0.05) [56]. If assumptions were met, ANOVA was used followed by a Tukey test if post hoc analysis was necessary; Welch’s ANOVA was used in the case of normality, but unequal variances, and otherwise the Kruskal–Wallis test was used, followed by a post hoc Dunn test [56]. The same steps were followed to compare management systems, applying a two-sample t-test when assumptions were held, a Welch’s t-test for unequal variances, or a Wilcoxon rank-sum otherwise [57]. Using principal component analysis (PCA) it was possible to explore the dynamics between soil properties, soil composition, and management systems [58]. Prior to the PCA, the soil property data was standardized (mean-centered and scaled to unit variance) using the ‘prcomp’ R base function [58]. The PCA scores and variable loadings were illustrated as a biplot using the ‘factoextra’ package [58]. Permutational multivariate analysis (PERMANOVA) was used to test differences in the composition of soil properties between management systems based on Euclidean distances calculated from the standardized soil properties [58].
The same analytical approach was used for the statistical comparison of arthropod abundance, richness, evenness, Shannon diversity and inverse Simpson diversity. However, if significant differences were detected, p-values were adjusted using the Bonferroni correction method [58]. Additionally, relative abundances were used to conduct an indicator species analysis (ISA) in order to isolate taxa-specific differences between management types [59,60]. Furthermore, generalized linear models (GLMs) were used to assess the effects of management and PCA soil gradients on arthropod diversity metrics [58]. Shannon diversity, inverse Simpson diversity, and Pielous evenness were modeled using Gaussian error distributions, with management system and the first two PCA axes of soil properties included as predictors. Likelihood-ratio tests (LRTs) were used to assess the significance of these predictors used in GLMs by comparing nested models [58].

3. Results

3.1. Soil Properties

The most predominant soil types were sandy-silt-loam to sandy-loam with clay (%), sand (%), and silt (%) in the range of 3–17%, 20–66%, and 30–66%, respectively. On the field level, some notable differences in composition were found. For example, in orchard T2, there was a substantially higher concentration of sand (80.24%) compared to the other fields, as well as in M1 (65.68%), suggesting that conventional orchards had greater fractions of sand compared to agroecological orchards. A summary of these findings is presented in Table A2, along with the corresponding soil type classification.
No significant differences were detected when comparing soil properties across individual management practices. However, when testing between broader systems, pH, porosity, and SOM (and SOC) were significantly higher in ECO orchards, while BD was significantly higher in CON orchards (Table 2).
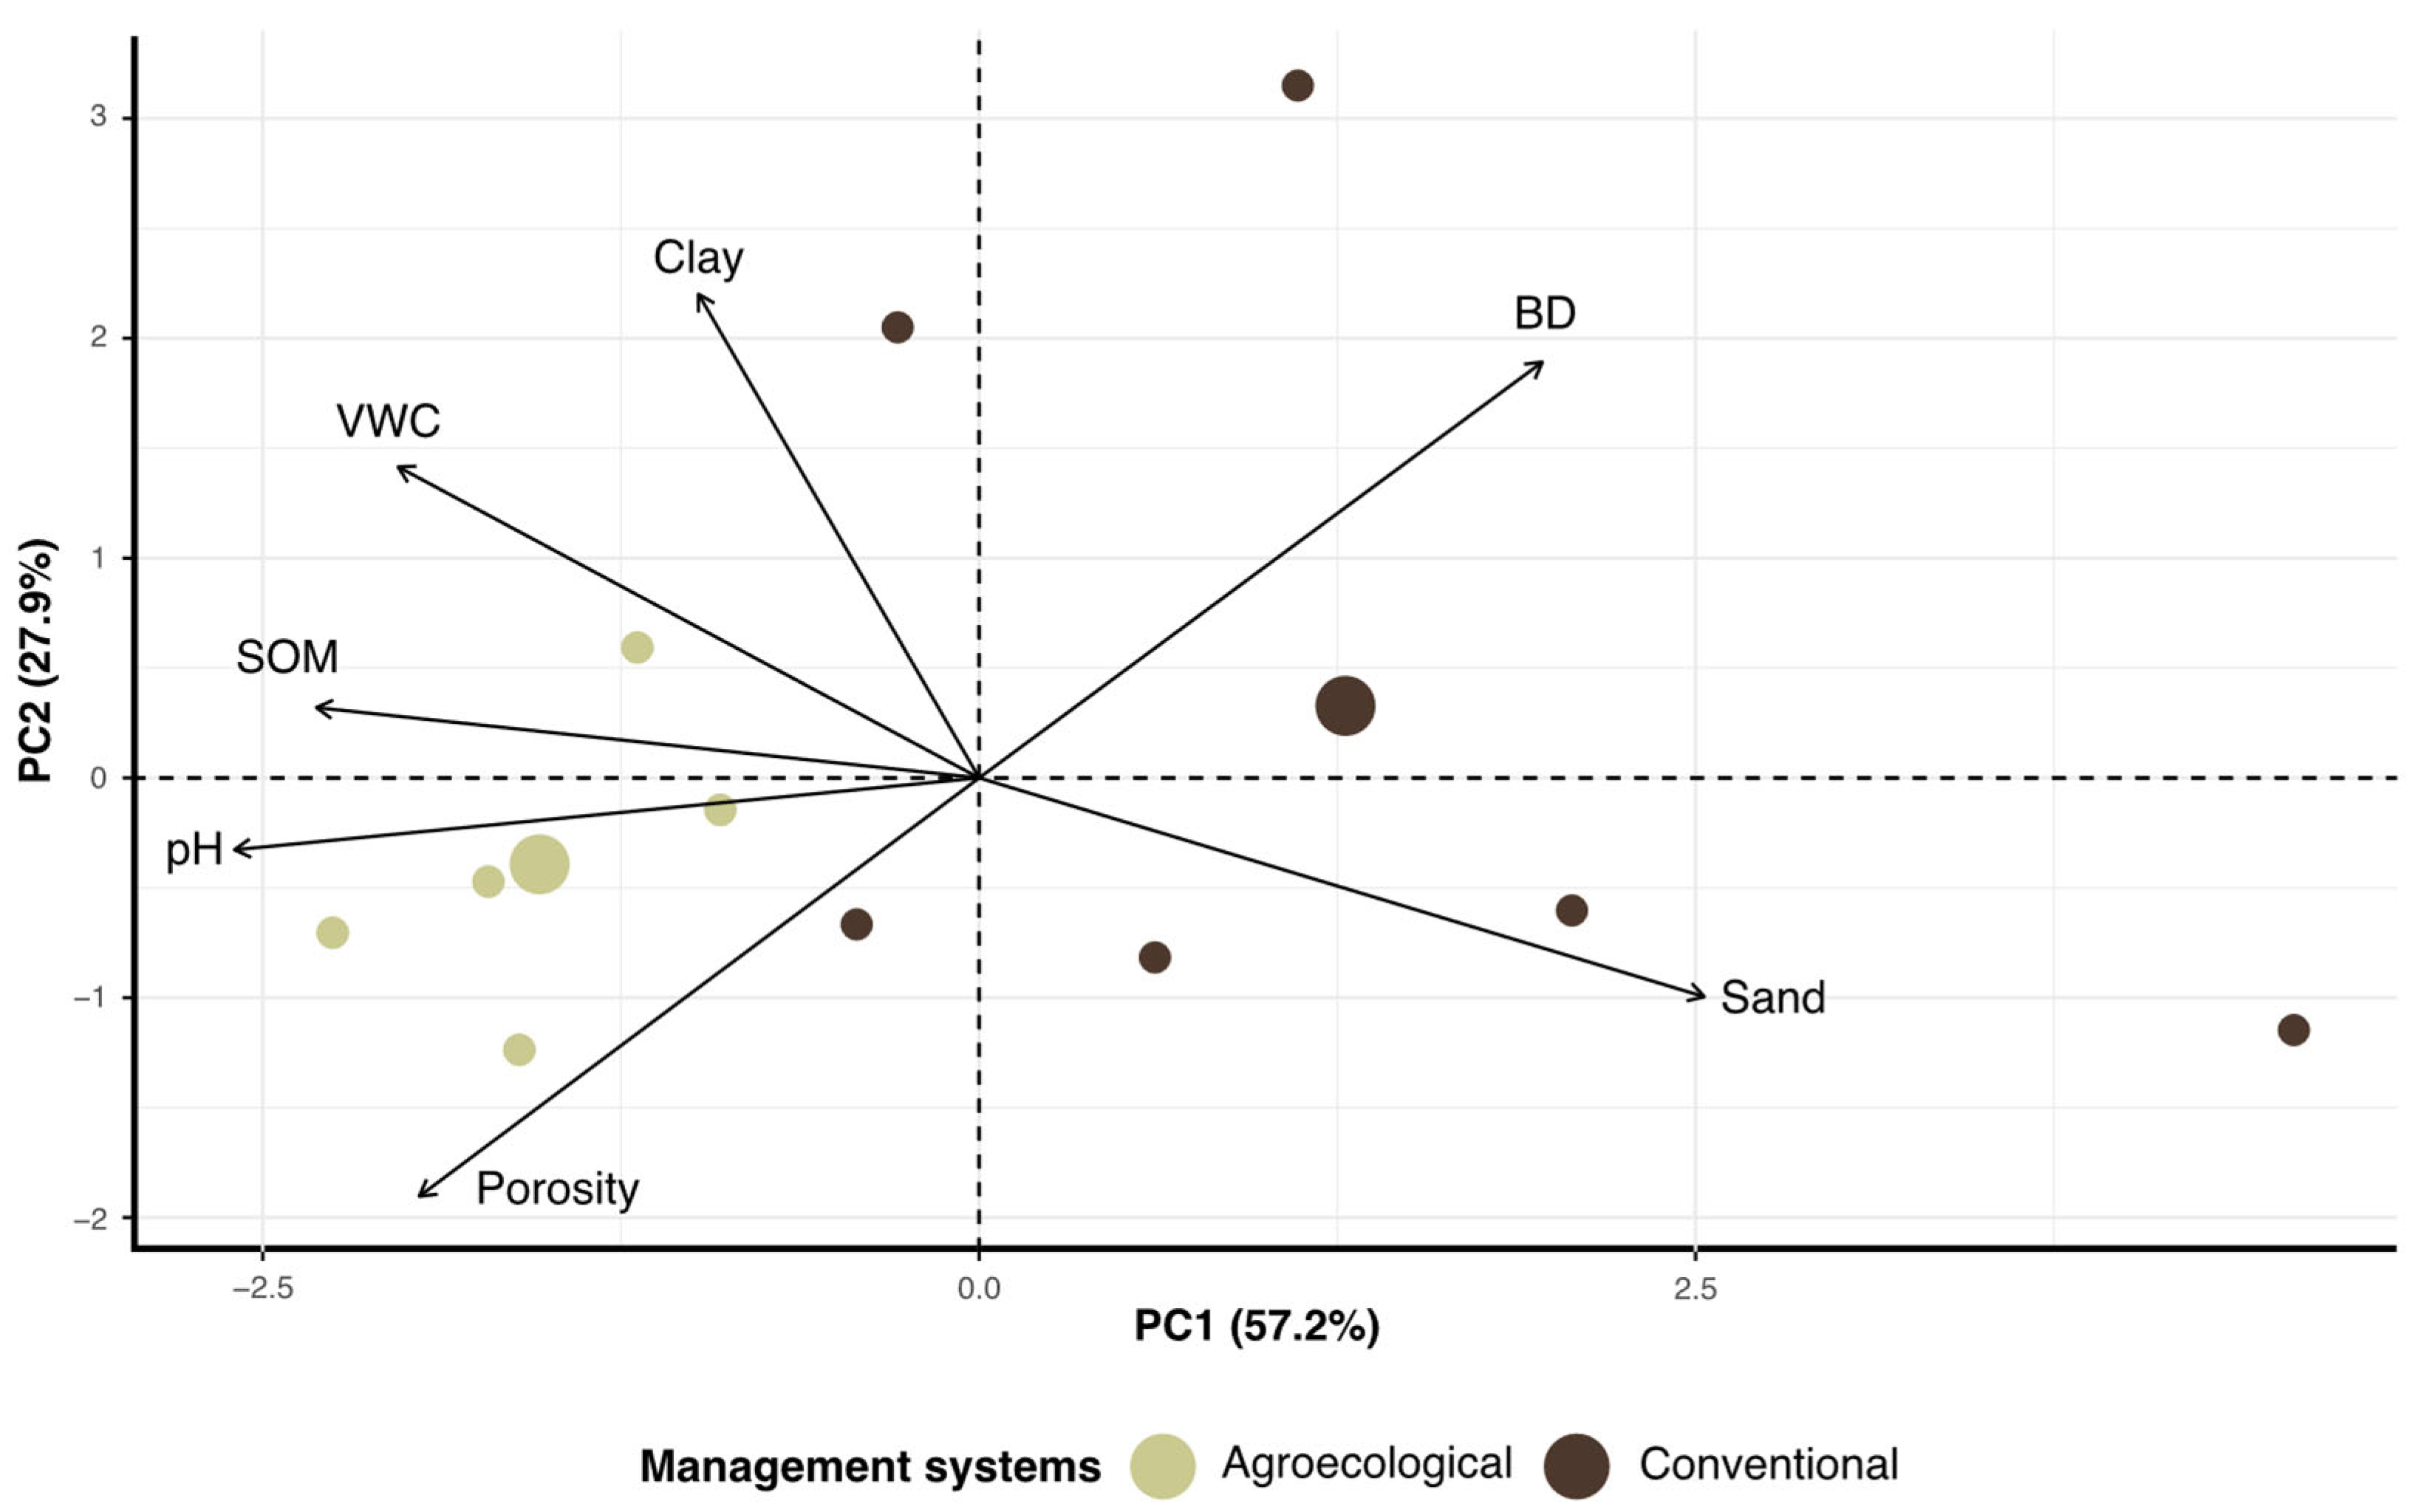
Comparing individual management practices using PCA was not conducted due to the low number of replicates (n = 2). However, a system-level comparison was sufficient. The variables used in the PCA included SOM, BD, porosity, pH, VWC, as well as clay (%) and sand (%). The results of the PCA (Figure 4) illustrated a moderate distinction between ECO and CON systems in terms of fundamental chemical and physical soil properties.
The PCA gave seven different principal components (Table A7). The first two principal components, PC1 (57.2%) and PC2 (27.9%), accounted for 85.1% of the total variance. The PCA ordination suggests that agroecological orchards were associated with nutrient-rich soils (higher SOM), wetter soils, and higher pH. This pattern was reflected by PC1, with negative loading for soil organic matter (−0.414), volumetric water content (−0.363) and pH (−0.465), and positive loading for sand (0.453), indicating that agroecological orchards tended to score negatively along PC1. Conventional orchards were associated with more compact soils (greater BD) and greater proportions of sand. This was reflected by the loadings of PC2, with negative loadings of BD (−0.484) and sand (−0.255). The independent loadings for each variable are summarized in Appendix C (Table A8). The results of PERMANOVA further supported the results of the PCA, indicating that the overall configuration of soil properties was significantly different between agroecological and conventional orchards (F1,9 = 4.45, R2 = 0.33, p = 0.007).

3.2. Soil Arthropods

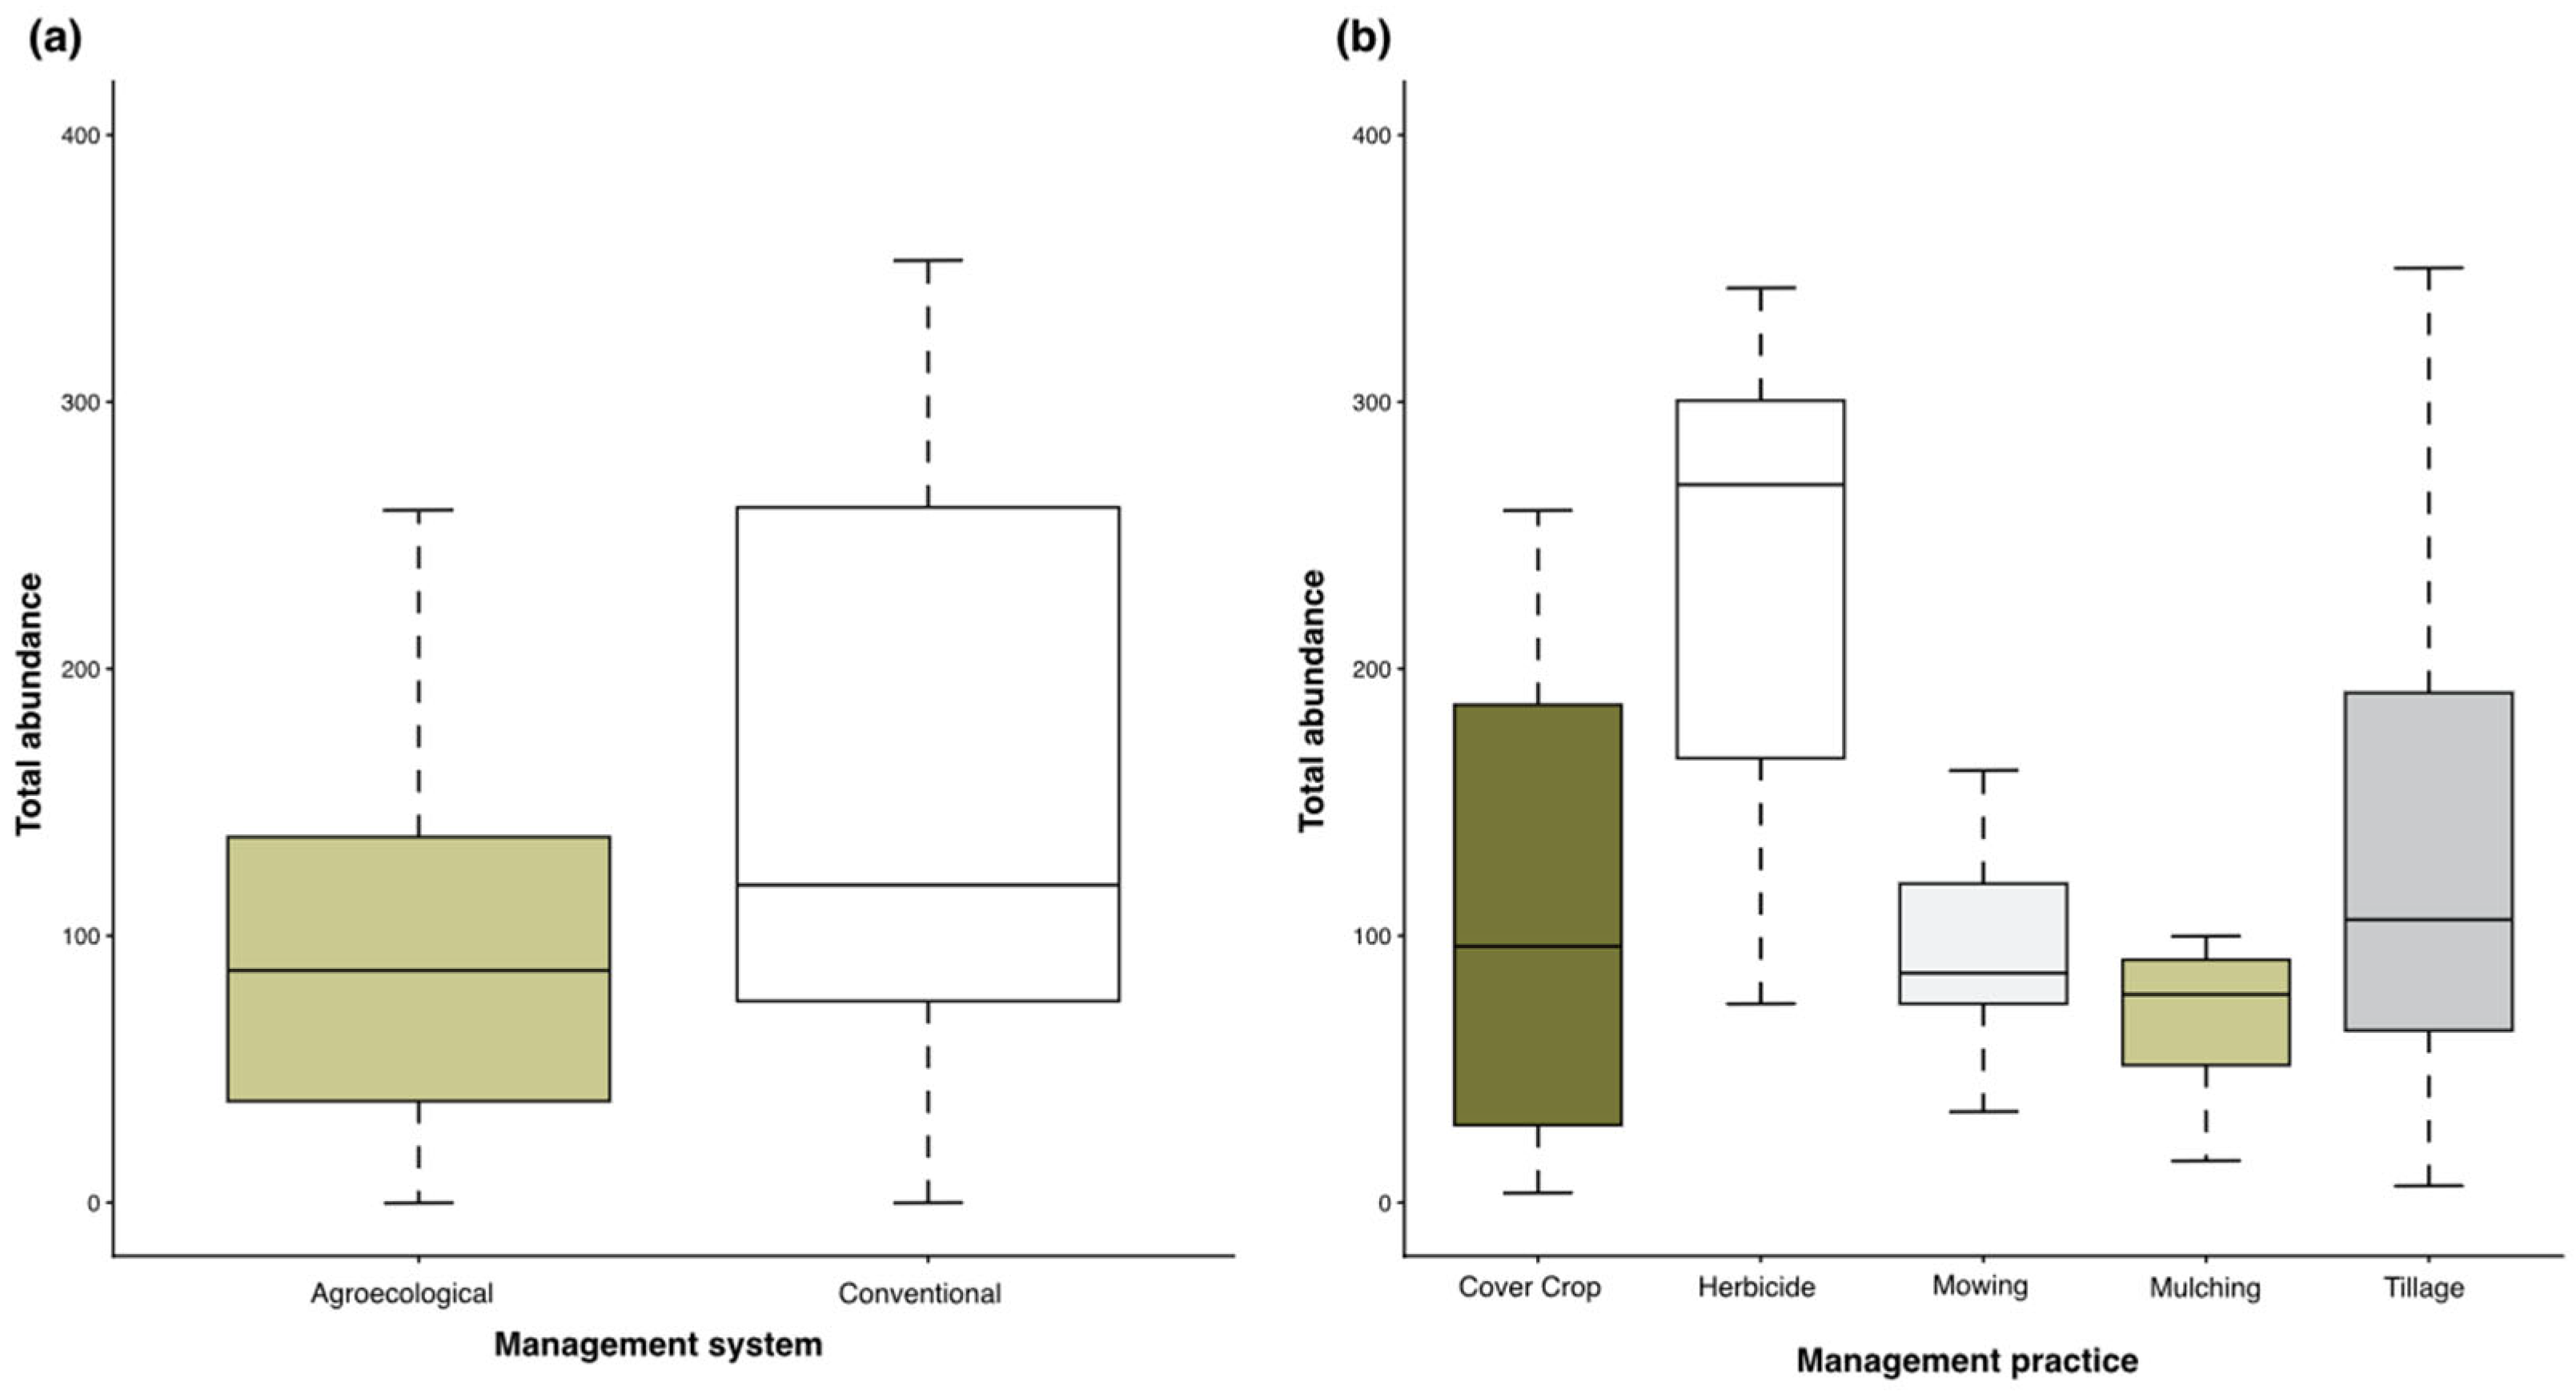
A total of 9138 arthropod specimens were collected over the course of the study. Cumulatively, orchards applying herbicides had the highest number of individuals (3100), followed by cover crops (2212), tillage (1640), mowing (1271) and mulching (915). When arthropod abundances were compared, using field-level replicates, no significant differences were found among management practices nor management systems (Figure A1). Among the arthropods collected, a total of 19 orders were identified. Among them included microarthropod orders, Collembola (Springtails) and Acari (Mites), as well as meso-arthropod orders including Isopoda (Woodlice), Coleoptera (Beetles), Julida (Millipedes) and more. Two orders were further identified to family level including Coleoptera: Carabidae, Scarabidae, and Tenebrionidae as well as Hymenoptera: Formicidae. Furthermore, nine taxa were merged into ‘Other’ due to low abundances across all traps: Geophilomorpha, Hemiptera, Hymenoptera, Isoptera, Lithobiomorpha, Orthoptera, Psocodea, Scolopendromorpha, and Staphylinidae (Table 3).
The results of the indicator species analysis (ISA) provided insight into the significant taxon-specific differences between management practices. Formicidae were significant to orchards applying cover crops (p = 0.015), while Opiliones were significant to mulching plots (p = 0.005). Collembola was explicitly associated with orchards that applied herbicides (p = 0.005), whereas Julida was associated with mowing (0.005). No orders were significant to orchards practicing tillage (Appendix B; Table A4). The same trends appeared across management systems, with the addition of Embioptera in ECO orchards (Table 3).
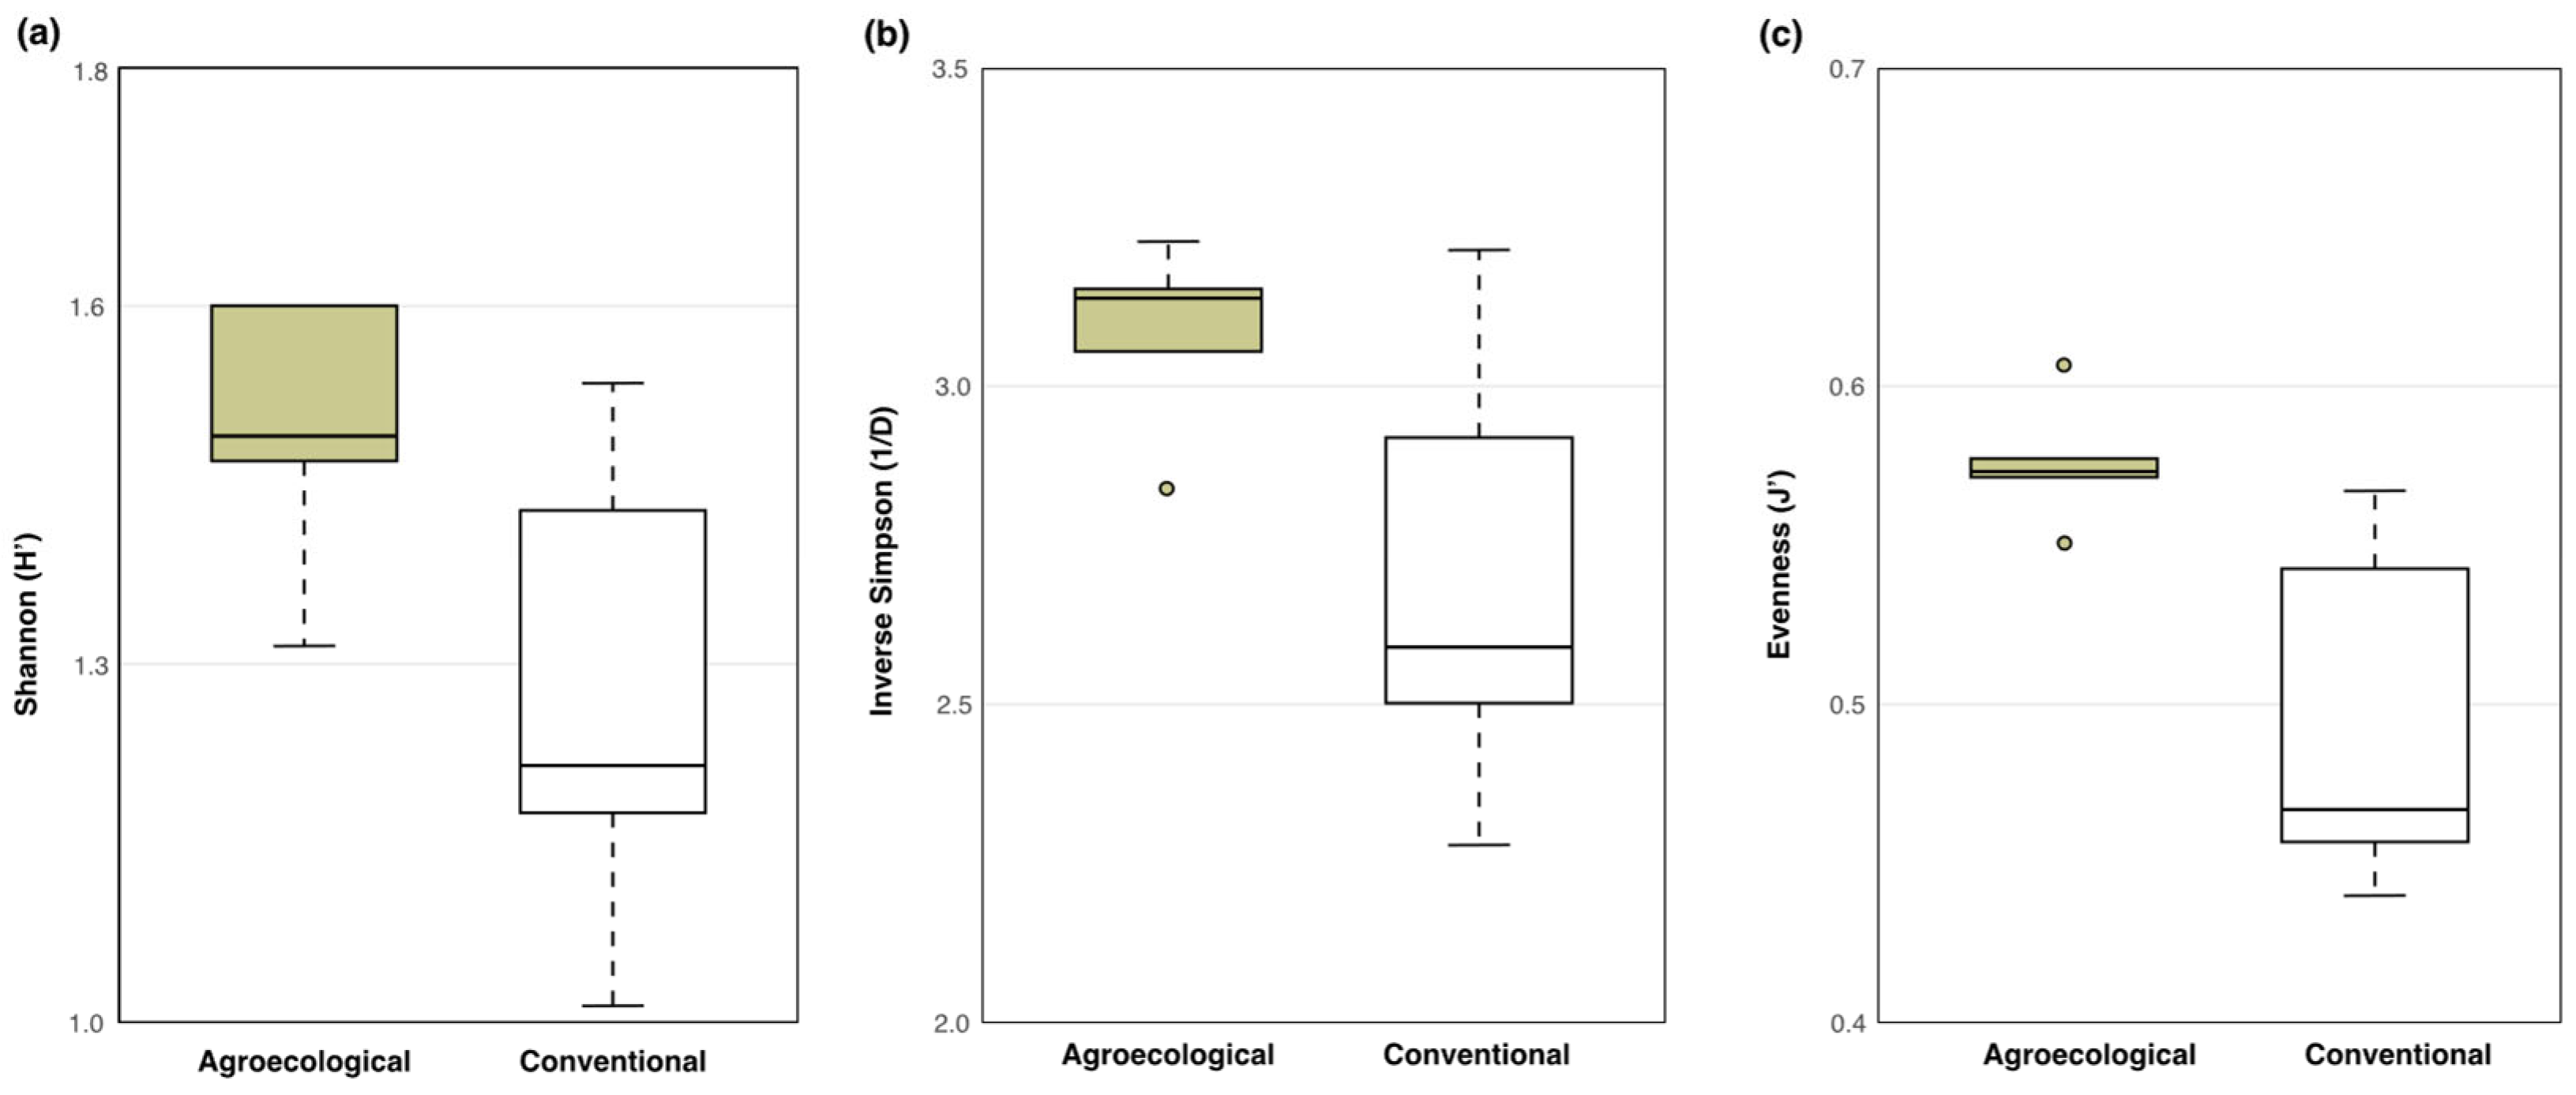
Management practices explained a significant proportion of variation in Shannon diversity (F = 13.58, p = 0.005), inverse Simpson diversity (F = 13.05, p = 0.005), and Pielous evenness (F = 42.95, p < 0.001). Post hoc analysis indicated that orchards managed with herbicides and tillage generally exhibited lower diversity and evenness compared to cover crops, mulching and mowing, with several significant associations across the management practices (Table A5). Across management systems, agroecological orchards exhibited higher Shannon diversity, inverse Simpson diversity, and evenness compared to conventional orchards (Figure 5); however, after Bonferroni correction, these differences were only marginally significant (p = 0.079 across all three). Unadjusted p-values indicated a marginally significant difference in Shannon diversity (t = 2.16, p = 0.058), and significant differences in inverse Simpson diversity (t = 2.29, p = 0.048), and evenness (W = 28, p = 0.022). No significant differences were found in taxonomic richness across management practices nor systems.
The results of the GLMs illustrate a relationship between management systems and arthropod diversity metrics (Appendix B; Table A6). The models indicate that CON management systems are related to lower diversity and evenness when compared to ECO orchards. The variation captured by PC2 significantly contributed to explaining differences in Shannon and inverse Simpson diversity, but not evenness; PC1 explained no variation in diversity metrics. These findings were supported by the results of the likelihood-ratio tests, reinforcing that management has an effect on arthropod diversity (Table A6). Soil variation captured by PC2 further explained differences in Shannon and inverse Simpson diversity, while PC1 explained no variation in diversity metrics.

4. Discussion

Linking soil management practices, orchard characteristics, and soil properties have revealed valuable insights into the effect of management on soil health and biodiversity. The findings of this study advocate for the adoption of agroecological practices and the reduction in tillage and herbicide use in olive orchards to preserve soil health, as also substantiated by previous studies [25,61,62]. When compared to conventionally managed orchards, the plots using mulching and cover crops were found to have higher greater soil organic matter. Generally, the range of pH across all orchards fell within the wide pH range for olive trees (5.5–8.0). However, the ECO plots generally had a higher pH (above 8.0), which could be attributed to the high levels of limestone in the soil in this region, a compound known to decrease soil acidity [63].
Mulching plots particularly stood out with the highest levels of organic matter (SOM). Several studies examining the effect of mulching using pruning remains support these findings [25,64]. Interestingly, the cover crop orchards were also applying pruning remains using an integrated approach, which has been suggested to be more effective [25,65]. However, the pruning remains were coarse and scarce compared to the more finely ground mulch used in the mulching plots, which is more effective than thicker mulch [64]. These findings are supported by a study conducted in Spain, which reported the most significant increase in OM from a finer mulch (<8 cm in diameter) at a higher density [64]. Nonetheless, the plots using cover crops presented similar findings to those of mulching, with a slightly reduced effect. The central construct of organic matter, SOC, is understood to improve soil structure as it acts as a binding agent for the aggregation process. This is reflected in the ECO orchards through findings of increased porosity and lower bulk density, which could suggest improved aggregate stability [20,29]. Studies investigating the impact of applying pruning remains have reported similar findings, as well as a correlated reduction in runoff and erosion [65]. While the trend for soil moisture was not as explicit in this study, there was generally higher volumetric water content in the ECO orchards, particularly in the plots using cover cropping. These findings are supported by a study which investigates the effect of cover cropping on soil moisture dynamics, which found cover crops to provide an immediate reduction in soil and/or water loss due to improved infiltration, particularly in clay-rich soils [66]. Moreover, a meta-analysis examined the relationship between ground cover management and soil moisture and identified a trend that both mulching and cover cropping enhance infiltration and retention capacities [61]. The link between these capacities and soil properties, including soil organic matter, porosity, and bulk density, is well documented and particularly relevant in drought-prone regions such as Messenia [16].
All conventional orchards were found to have relatively poor structure, with the highest bulk density and lowest porosity found in the tillage and mowing plots. While this might be attributable to the high percentage of sand in the soil, the use of heavy machinery for pruning and harvest in conventionally managed orchards would have contributed to the soil compaction [20,67]. Specifically, in plots applying herbicides, there was an additional effect of reduced or no ground vegetation (less than 60%), which likely contributed to the reduced organic matter (SOM), as well as the poor structure. There is strong evidence that maintaining a vegetative layer prevents compaction through the formation of aggregates and root channels in the soil [68]. Furthermore, conventionally managed orchards generally have lower volumetric water content (VWC). However, these orchards simultaneously had higher percentage of sand, which can directly impact water retention and infiltration [49]. This effect is visible in fields applying tillage which shows the lowest VWC across all orchards, as well as the highest fraction of sand (Table A2).
The principal component analysis (PCA) illustrated the dynamics between the selected soil properties, textural composition, and management. While many of the relationships observed in this model align with the findings of the univariate tests, this analysis provided a systems perspective, illustrating the interplay between the measured properties and how soil management practices influence them. More specifically, the model illustrated a dynamic in the ECO orchards, between soil organic matter (SOM), and VWC which was not visible from the univariate tests. A higher pH was also associated with a higher SOM content, which is not typically the case, as more acidic soils can inhibit the breakdown of organic matter [69]. Moreover, VWC followed a similar directionality to clay, whereas sand exhibited the opposite trend and was more associated with conventional orchards. There was also a clear structural difference between ECO and CON orchards, depicted by the directionality of bulk density and the clustering of conventional orchards in the biplot. This reinforces a consistent narrative that poor soil structure is linked to conventional management practices [65,67,70,71,72].
Overall, the results indicate that the composition of the soil was a strong driver of the variation in soil properties across orchards. This points to the complexity of measuring soil properties within such a heterogeneous region and isolating the effect of soil management. However, it could also be argued that these findings support the consideration of both soil composition and soil management practices in tandem. As the use of this ordination analysis was employed as an exploratory statistical tool rather than an inferential one, due to the limited size of the data set, the results should be interpreted with some caution. Regardless, the models suggest an interplay of properties and demonstrate how using multivariate projections has a greater capacity to capture more complex patterns than simply using univariate testing. Furthermore, it provides a means of quantifying soil health without the use of a soil quality index that requires a more extensive list of soil properties to be measured [56].
The results of the arthropod assemblages in winter were comparable to compositions found in a similar study conducted in olive orchards in Crete, Greece [15,73]. The five most dominant taxa in this composition included Collembola, Formicidae, Coleoptera, Diptera, and Isopoda which was consistent with other reports, making up more than 80% of the entire sample [52,60]. Interestingly, the plots applying herbicides had the greatest abundance of arthropods, while the lowest abundance was found in plots applying mulching, which does not align with other reports [74]. However, the main contributor to these higher abundances was Collembola, which corresponded with the findings of other studies [52]. The ISA allowed for investigation of taxa-specific variation between management types, revealing a trend where Coleoptera, and Formicidae were more strongly associated with ECO orchards. These are orders which have been reported as critical ecosystem engineers, contributing to detritus breakdown, and nutrient recycling [16,53]. In mulching plots, Opiliones were significant, alongside greater abundances of Aranae (non-significant) which are known to be important predators of common olive pests [53,75]. Collembola was significant to herbicide plots, and more broadly associated with CON orchards. However, this order is generally not found to be responsive to management intensity [74].
Diversity and evenness indices differed significantly between management systems. The highest values were found in ECO plots, possibly reflecting the improved soil health of these orchards. However, when compared across management practices, orchards implementing mowing had higher diversity and evenness than orchards applying cover crops. This was likely due to a greater volume of vegetation in the mowing plots compared to cover crops [60,75]. Furthermore, mowing is typically not as intensive, when compared to herbicide and tillage, making it somewhat of an intermediate practice. Despite the greater abundances, lower diversity was found in plots applying herbicides and practicing tillage. The use of GLMs to link observations made in the PCA to arthropod diversity metrics revealed PC2 as a potential driver of diversity variation. This principal component was defined by greater bulk density and greater concentrations of sand which aligns with the known impact of poor soil structure on soil arthropods [15]. However, PC1 which was defined by greater soil organic matter, pH, and improved soil moisture did not correspond to variation in diversity. This makes it difficult to say that arthropod diversity can act as an indicator for soil health alone, as there are likely several other drivers that were not accounted for in the models which could explain the presented differences in diversity between management systems.
The observed ambiguities in the results point to several limitations, which should be considered in the interpretation of these findings. Firstly, the number of replicates, as well as the range of soil properties and variables measured were limited. These constraints were primarily due to restrictions of time and resources. Furthermore, logistical constraints due to the region’s complex topography hindered accessibility to many orchards in the study area. Orchard accessibility was further diminished by the timing of the study, as it was conducted during both the rainy season and the harvest period (October to January). The timing of the study invoked additional uncertainty in the results due to weather phenomenon (e.g., flooding), which could have affected arthropod abundances. Simultaneously, the harvest period introduced human disturbances which could have influenced soil structure. Thus, future studies would benefit from increased orchard replication, which may require scaling up the study area. Furthermore, a broader set of soil indicators could offer a more holistic perspective. Multi-seasonal surveys of soil and biodiversity would capture temporal and seasonal variability. Lastly, farmer participation posed challenges, such as difficulties with communication, while variable willingness to participate reduced the number of orchards that could be sampled. Farmer reluctance also limited access to supplementary information such as data on the productivity of the orchards. Future research may benefit from compensation schemes, rewarding landowners for study participation. Feedback of the study results to the landowners may also encourage stronger participation willingness and cooperation.
Despite the presented limitations, the patterns in this study suggest that agroecological management is more beneficial than conventional management systems for physical, chemical, and biological soil properties. However, the regional bias towards conventional soil management is reflected by the poor soil structure, and low organic matter content of the orchards surveyed in this study. Previous studies have reported these conditions to enable desertification [1,21,76]. Reduced arthropod diversity was also found, which is supported by the findings of Seibold et al. [77] showing that the decline in arthropod populations, found in their study, occurred extensively across large spatial scales, and was intricately linked to conventional agricultural practices at the landscape scale. Collectively this can result in an irreversible loss of soil, inevitably impacting regional biodiversity, agricultural capacity, livelihood, as well as biogeochemical cycles and water balances [6,77]. This link between soil quality and poor soil structure, and consequently soil loss through erosion and runoff, has been captured by many studies investigating the effects of more intensive farming practices, particularly within the Mediterranean basin [40,78]. Moreover, the aforementioned consequences are further exacerbated by the impacts of climate change, which have already begun to impact olive growth and maturation in this region due to intense periods of drought. This was observed in the yellowing of the leaves due to water stress, despite the rather high tolerance of olive trees to drought [79]. Additionally, the soil becomes more susceptible to soil and water loss, intensifying the already high rates of erosion and runoff [62,67,78]. Therefore, applying practices which improve the fertility and overall structure of the soil serves as an important pillar of climate change adaptation in olive orchards and create resilience against soil loss on larger spatial scales [20,28,78,79].

5. Conclusions

The results of this study support the use of agroecological practices, including techniques such as soil mulching using olive tree pruning remains and cover cropping, all without the need for mechanical or chemical disturbance to the soil. These practices hold significant promise in enhancing soil health on both a field and landscape scale in terms of soil properties and arthropod diversity. On the contrary, conventional practices, particularly tillage and herbicide application, demonstrated a lesser capacity to support healthy soils and arthropod diversity.
A transition that supports the inclusion of agroecological practices could have a positive long-term impact on the ecology and resilience of the landscape and, thus, the livelihoods of stakeholders in this region. However, more efforts are needed to survey and collect data on the characteristics, soil properties, and biodiversity of these orchards, as the findings of this study were often predominated by the effect of soil composition. Therefore, similar studies should be conducted over long-term periods to provide a better understanding of how this agricultural landscape is affected by the various management practices implemented in this region. In addition, a study with a more integrated approach, examining ecological, social, and economic variables in relation to olive farming and soil management, could be of great value. Nevertheless, this study provides a strong foundation of data in an understudied region, supporting the development of resilient olive orchards and sustainable soil management, and lays the groundwork for future research in rural Greece.

Author Contributions

Conceptualization, K.C. and H.B.; methodology, K.C.; formal analysis, K.C.; investigation, K.C.; resources, C.P. and H.B.; software, K.C.; data curation, K.C.; writing—original draft preparation, K.C.; writing—review and editing, K.C., C.P. and H.B.; visualization, K.C.; supervision, C.P. and H.B.; project administration, K.C., H.B. and C.P.; funding acquisition, K.C. All authors have read and agreed to the published version of the manuscript.

Funding

This research was funded by Stiftelsen AAA (Stockholm, Sweden).

Data Availability Statement

The original contributions presented in this study are included in the article. Further enquiries can be directed to the corresponding authors.

Acknowledgments

The authors acknowledge the use of OpenAI (GPT-5.2) for the purposes of code formulation in R Studio in order to conduct statistical analysis and produce figures. The authors have reviewed and edited the output and take full responsibility for the content of this publication. The authors would like to acknowledge the resource contributions of Martina Hattenstrand, the current director of the Navarino Environmental Institute, who provided a laboratory and equipment for analysis. The authors would additionally like to thank the Navarino Environmental Observatory for financial contributions to this project. Additionally, the authors would like to acknowledge the insights of Stefano Manzoni. Lastly, the authors would like to acknowledge the farmers and landowners who participated in this study for their cooperation and trust in using their land.

Conflicts of Interest

The authors declare no conflicts of interest.

Abbreviations

The following abbreviations are used in this manuscript:
BDBulk Density
CCCover Crop
CONConventional
ECOAgroecological
GLMGeneralized Linear Model
HHerbicide
ISAIndicator Species Analysis
MMowing
MUMulching
PCAPrincipal Component Analysis
SOMSoil Organic Matter
SOCSoil Organic Carbon
TTillage
VWCVolumetric Water Content

Appendix A

Supporting data on orchard specific (Field ID) characteristics (Table A1), soil composition (Table A2) and the mean (±SD) of soil properties across specific management practices (Table A3). The characteristics in Table A1 were measured over the course of the study, but this data was not included in the statistical analysis.
Table A1. Additional characteristic of orchards sampled (Field ID) including an estimation of vegetation cover (%), size (ha)—calculated in QGIS, planting density of the olive tree (trees/ha), fertilizer use, and if the orchards apply pesticides.
Management
Practice
Field IDVegetation Cover (%)Size (ha)Density (Trees/ha)Fertilizer UsePesticides
Cover CropsCC175.001.29112Organicno
CC286.251.27108Organicno
CC384.501.4198Organicno
MulchingMU11000.9088Mulchingno
MU273.250.32100Mulchingno
HerbicideH116.002.08-Inorganicyes
H250.000.42100Inorganicyes
H356.250.5496Inorganicyes
MowingM195.000.60192Inorganic-
M297.500.4280Inorganicyes
TillageT188.750.53104Inorganicyes
T299.500.70144Inorganicyes
Table A2. Soil composition for each orchard (Field ID) showing the fraction of clay, sand, and silt (%) and the corresponding soil type according to the USDA soil triangle.
SystemPracticeField IDClay (%)Sand (%)Silt (%)Soil Type
ECOCover CropsCC111.6122.7465.65Sandy-Silt-Loam
CC212.9529.2757.78Sandy-Silt-Loam
CC316.8650.5732.57Sandy-Silt-Loam
MulchingMU110.8927.0362.08Sandy-Silt-Loam
MU28.8937.0954.02Sandy-Silt-Loam
CONHerbicideH1----
H216.4920.1363.39Sandy-Silt-Loam
H37.9039.7952.31Sandy-Silt-Loam
MowingM13.9565.6830.37Sandy-Loam
M26.9858.1134.91Sandy-Loam
TillageT119.8834.4045.72Clay-Loam
T25.9380.2413.84Loamy-Sand
Table A3. Soil properties for each management practice (mean ± SD) including bulk density (BD), porosity (%), pH, SOM (%), SOC (%), and volumetric water content (VWC; m3/m3).
Soil
Property
MulchingCover CropsMowingTillageHerbicide
BD1.18 ± 0.111.17 ± 0.131.33 ± 0.071.50 ± 0.111.32 ± 0.11
Porosity55.96 ± 4.3056.66 ± 4.6350.54 ± 2.3844.58 ± 4.3251.12 ± 4.18
pH8.22 ± 0.058.35 ± 0.077.68 ± 0.666.93 ± 0.398.15 ± 0.08
SOM9.47 ± 0.318.66 ± 0.967.39 ± 0.435.60 ± 3.027.63 ± 0.32
SOC5.49 ± 0.185.03 ± 0.564.29 ± 0.253.24 ± 1.754.43 ± 0.19
VWC0.30 ± 0.010.31 ± 0.010.29 ± 0.010.29 ± 0.040.30 ± 0.01
Clay9.89 ± 1.4113.81 ± 2.735.47 ± 2.1412.91 ± 9.8616.37 ± 11.97
Sand32.06 ± 7.1128.19 ± 5.0161.90 ± 5.355.32 ± 32.4151.12 ± 20.14

Appendix B

Supporting data on arthropod total abundance across management systems and practices (Figure A1), Specific arthropod abundances (mean ± SD) across management practices and the corresponding results of indicator species analysis (ISA) (Table A4), diversity metrics (mean ± SD) across management practices (Table A5) and the results of the GLM and LRT’s used the relate the results of the PCA and the arthropod diversity metrics (Table A6).
Figure A1. Total arthropod abundance between (a) management systems, and (b) management practices. The boxes represent the interquartile range (25th to 75th percentiles); the median is defined by the horizontal line inside of the boxes. Whiskers illustrate the min and max values within 1.5 times the interquartile range from the first and third quartiles, respectively.
Agronomy 16 00404 g0a1
Table A4. Arthropod abundances of specific taxa (mean ± SD) across management practices; p-values indicate significant taxon-management system associations identified by the indicator species analysis (ISA), which combines taxa specificity and constancy. Mean values are presented for descriptive purposes only. Management practice associations are denoted by asterisks (** indicates p < 0.01).
TaxonMulchingCover CropMowingTillageHerbicidep-Value
Acari2.5 ± 3.81.8 ± 2.50.5 ± 0.71.9 ± 2.31.6 ± 2.1-
Aranae2.0 ± 2.01.1 ± 1.62.0 ± 2.01.1 ± 1.02.2 ± 1.7-
Carabidae1.6 ± 1.31.7 ± 2.90.8 ± 1.00.2 ± 0.60.2 ± 0.5-
Coleoptera1.2 ± 1.20.2 ± 0.60.3 ± 0.51.2 ± 1.3 1.0 ± 1.2-
Collembola16.3 ± 16.625.6 ± 27.423.4 ± 13.555.9 ± 49.791.5 ± 56.5 **0.005
Diptera2.3 ± 2.52.1 ± 2.13.2 ± 2.11.7 ± 1.3 20.7 ± 18.6 **0.005
Embioptera0.3 ± 0.70.1 ± 0.50.1 ± 0.300.9 ± 0.9 **0.005
Formicidae8.3 ± 7.219.7 ± 27.7 **6.9 ± 6.92.7 ± 2.3 5.2 ± 3.90.010
Isopoda1.0 ± 1.06.7 ± 10.1 9.6 ± 15.50.9 ± 1.8 4.1 ± 6.3-
Julida0.8 ± 1.10.8 ± 0.94.8 ± 5.8 **2.1 ± 2.7 0.8 ± 0.90.010
Opiliones0.9 ± 0.9 **0.2 ± 0.40.2 ± 0.50.1 ± 0.3 0.1 ± 0.30.005
Pseudoscorpiones0.2 ± 0.40.1 ± 0.3 0.4 ± 1.20.1 ± 0.3 0.1 ± 0.3-
Scarabidae0.5 ± 0.90.1 ± 0.30.2 ± 0.600.4 ± 1.2-
Tenebrionidae 0.1 ± 0.30.4 ± 1.20.2 ± 0.600.2 ± 0.6-
Other1.0 ± 1.50.3 ± 0.60.2 ± 0.60.5 ± 0.9 0.2 ± 0.4
Table A5. Diversity metrics (mean ± SD) across management practices including Shannon diversity, inverse Simpson diversity, Pielous evenness, and taxon richness. Different lowercase letters indicate statistically significant differences among management practices based on post hoc comparisons following Kruskal–Wallis tests (p < 0.05). Metrics sharing the same letter in the same column are not significantly different.
Management PracticeShannon
Diversity
Inverse Simpson
Diversity
Pielous
Evenness
Taxon Richness
Cover Crop1.43 ± 0.096 a0.565 ± 0.013 a0.565 ± 0.013 a12.7 ± 2.520
Mulching1.60 ± 0.001 a0.592 ± 0.021 a0.592 ± 0.021 a15.0 ± 1.410
Mowing1.52 ± 0.023 a0.567 ± 0.001 a0.567 ± 0.001 a14.5 ± 0.707
Herbicide1.20 ± 0.041 ab0.459 ± 0.007 ab0.459 ± 0.007 ab13.5 ± 0.707
Tillage 1.11 ± 0.135 b0.455 ± 0.021 b0.455 ± 0.015 b11.5 ± 2.120
Table A6. Results of generalized linear model (GLM) assessing the effects of management system and soil principal component axes on arthropod diversity metrics. Models were fitted at the field level using management system (conventional vs. agroecological), PC1, and PC2. Estimates (β) represent regression coefficients. Likelihood-ratio tests were used to evaluate statistical significance—significance denoted by asterisks (. indicates p < 0.1; * indicates p < 0.05; ** indicates p < 0.01).
Response VariablePredictorEstimate (β)LR (X2)p-Value
Shannon diversityManagement system (CON)−0.1290.2590.015 *
PC1−0.0130.2580.781
PC2−0.0770.1600.039 *
Inverse Simpson diversityManagement system (CON)−0.1520.7000.009 **
PC1−0.0500.6980.858
PC2−0.1320.4120.028 *
Pielous EvennessManagement system (CON)−0.0630.0180.001 **
PC1−0.0020.0180.718
PC2−0.0180.0120.075 .

Appendix C

Supporting data for the principal component analysis (PCA) including a summary of principal components (Table A7) as well as variable loadings for PC1 and PC2 (Table A8)
Table A7. Summary of eigenvalues, variance, and cumulative proportion of total variance captured in the principal component analysis (PCA).
Principal ComponentEigenvalue (λ)Variance Explained (%)Cumulative Proportion
PC14.00457.200.572
PC21.95327.900.851
PC30.5447.800.929
PC40.2984.300.971
PC50.1562.200.994
PC60.0440.601.000
PC70.0000.001.000
Table A8. Summary of variable loadings for principal components—PC1 and PC2 across variables including pH, soil organic matter (SOM; %), bulk density (g/cm3), porosity (%), sand (%), clay (%), and VWC (m3/m3).
VariablePC1PC2
pH−0.465−0.084
SOM (%)−0.4140.082
Bulk Density (g/cm3)0.3520.484
Porosity (%)−0.349−0.487
Sand (%)0.453−0.255
Clay (%)−0.1750.564
VWC (m3/m3)−0.3630.362

References

  1. Ferreira, C.S.S.; Seifollahi-Aghmiuni, S.; Destouni, G.; Ghajarnia, N.; Kalantari, Z. Soil Degradation in the European Mediterranean Region: Processes, Status and Consequences. Sci. Total Environ. 2022, 805, 150106. [Google Scholar] [CrossRef] [Scilit]
  2. Virginia, A.; Zamora, M.; Barbera, A.; Castro-Franco, M.; Domenech, M.; De Gerónimo, E.; Costa, J.L. Industrial Agriculture and Agroecological Transition Systems: A Comparative Analysis of Productivity Results, Organic Matter and Glyphosate in Soil. Agric. Syst. 2018, 167, 103–112. [Google Scholar] [CrossRef] [Scilit]
  3. Sumberg, J.; Giller, K.E. What Is ‘Conventional’ Agriculture? Glob. Food Secur. 2022, 32, 100617. [Google Scholar] [CrossRef] [Scilit]
  4. Food and Agriculture Organization of the United Nations (FAO). How to Feed the World in 2050; FAO: Rome, Italy, 2009; Available online: https://www.fao.org/fileadmin/templates/wsfs/docs/expert_paper/How_to_Feed_the_World_in_2050.pdf (accessed on 12 February 2025).
  5. Assis, J.C.; Hohlenwerger, C.; Metzger, J.P.; Rhodes, J.R.; Duarte, G.T.; Da Silva, R.A.; Boesing, A.L.; Prist, P.R.; Ribeiro, M.C. Linking Landscape Structure and Ecosystem Service Flow. Ecosyst. Serv. 2023, 62, 101535. [Google Scholar] [CrossRef] [Scilit]
  6. Halbac-Cotoara-Zamfir, R.; Polinesi, G.; Chelli, F.; Salvati, L.; Bianchini, L.; Marucci, A.; Colantoni, A. Found in Complexity, Lost in Fragmentation: Putting Soil Degradation in a Landscape Ecology Perspective. Int. J. Environ. Res. Public Health 2022, 19, 2710. [Google Scholar] [CrossRef] [Scilit]
  7. Bünemann, E.K.; Bongiorno, G.; Bai, Z.; Creamer, R.E.; De Deyn, G.; De Goede, R.; Fleskens, L.; Geissen, V.; Kuyper, T.W.; Mäder, P.; et al. Soil Quality—A Critical Review. Soil Biol. Biochem. 2018, 120, 105–125. [Google Scholar] [CrossRef] [Scilit]
  8. Thanopoulos, R.; Drossinou, I.; Koutroumpelas, I.; Chatzigeorgiou, T.; Stavrakaki, M.; Bebeli, P.J. Hilly, Semi-Mountainous and Mountainous Areas Harbor Landraces Diversity: The Case of Messinia (Peloponnese-Greece). Diversity 2024, 16, 151. [Google Scholar] [CrossRef] [Scilit]
  9. Liu, R.; Thomas, B.W.; Shi, X.; Zhang, X.; Wang, Z.; Zhang, Y. Effects of Ground Cover Management on Improving Water and Soil Conservation in Tree Crop Systems: A Meta-Analysis. CATENA 2021, 199, 105085. [Google Scholar] [CrossRef] [Scilit]
  10. Panagos, P.; Montanarella, L.; Barbero, M.; Schneegans, A.; Aguglia, L.; Jones, A. Soil Priorities in the European Union. Geoderma Reg. 2022, 29, e00510. [Google Scholar] [CrossRef] [Scilit]
  11. Ruiz-Cátedra, G.; Calero, J.; Domouso, P.; García-Ruiz, R. Do Management Practices Which Enhance Nature-Based Processes Improve Soil Health in Olive Groves? Geoderma 2025, 457, 117276. [Google Scholar] [CrossRef] [Scilit]
  12. Winowiecki, L.; Vågen, T.-G.; Massawe, B.; Jelinski, N.A.; Lyamchai, C.; Sayula, G.; Msoka, E. Landscape-Scale Variability of Soil Health Indicators: Effects of Cultivation on Soil Organic Carbon in the Usambara Mountains of Tanzania. Nutr. Cycl. Agroecosystems 2016, 105, 263–274. [Google Scholar] [CrossRef] [Scilit]
  13. Jeanneret, P.; Aviron, S.; Alignier, A.; Lavigne, C.; Helfenstein, J.; Herzog, F.; Kay, S.; Petit, S. Agroecology Landscapes. Landsc. Ecol. 2021, 36, 2235–2257. [Google Scholar] [CrossRef] [Scilit] [PubMed]
  14. Viaud, V.; Santillàn-Carvantes, P.; Akkal-Corfini, N.; Le Guillou, C.; Prévost-Bouré, N.C.; Ranjard, L.; Menasseri-Aubry, S. Landscape-Scale Analysis of Cropping System Effects on Soil Quality in a Context of Crop-Livestock Farming. Agric. Ecosyst. Environ. 2018, 265, 166–177. [Google Scholar] [CrossRef] [Scilit]
  15. Menta, C.; Remelli, S. Soil Health and Arthropods: From Complex System to Worthwhile Investigation. Insects 2020, 11, 54. [Google Scholar] [CrossRef] [Scilit]
  16. Sofo, A.; Mininni, A.N.; Ricciuti, P. Soil Macrofauna: A Key Factor for Increasing Soil Fertility and Promoting Sustainable Soil Use in Fruit Orchard Agrosystems. Agronomy 2020, 10, 456. [Google Scholar] [CrossRef] [Scilit]
  17. Stork, N.E.; Eggleton, P. Invertebrates as Determinants and Indicators of Soil Quality. Am. J. Altern. Agric. 1992, 7, 38–47. [Google Scholar] [CrossRef] [Scilit]
  18. Raz, S.; Hila, S.; Assaf, S. Ecological, Social and Economic Benefits of Organic Olive Farming Outweigh Those of Intensive and Traditional Practices. Sci. Total Environ. 2024, 921, 171035. [Google Scholar] [CrossRef] [Scilit]
  19. Kavvadias, V.; Koubouris, G. Sustainable Soil Management Practices in Olive Groves. In Soil Fertility Management for Sustainable Development; Panpatte, D.G., Jhala, Y.K., Eds.; Springer: Singapore, 2019; pp. 167–188. ISBN 978-981-13-5903-3. [Google Scholar]
  20. Fraga, H.; Moriondo, M.; Leolini, L.; Santos, J.A. Mediterranean Olive Orchards under Climate Change: A Review of Future Impacts and Adaptation Strategies. Agronomy 2020, 11, 56. [Google Scholar] [CrossRef] [Scilit]
  21. Gómez, J.A. Sustainability Using Cover Crops in Mediterranean Tree Crops, Olives and Vines—Challenges and Current Knowledge. HunGeoBull 2017, 66, 13–28. [Google Scholar] [CrossRef] [Scilit]
  22. Tziolas, E.; Ispikoudis, S.; Mantzanas, K.; Koutsoulis, D.; Pantera, A. Economic and Environmental Assessment of Olive Agroforestry Practices in Northern Greece. Agriculture 2022, 12, 851. [Google Scholar] [CrossRef] [Scilit]
  23. Schismenos, S.; Emmanouloudis, D.; Stevens, G.J.; Katopodes, N.D.; Melesse, A.M. Soil Governance in Greece: A Snapshot. Soil Secur. 2022, 6, 100035. [Google Scholar] [CrossRef] [Scilit]
  24. Kairis, O.; Karamanos, A.; Voloudakis, D.; Kapsomenakis, J.; Aratzioglou, C.; Zerefos, C.; Kosmas, C. Identifying Degraded and Sensitive to Desertification Agricultural Soils in Thessaly, Greece, under Simulated Future Climate Scenarios. Land 2022, 11, 395. [Google Scholar] [CrossRef] [Scilit]
  25. Kavvadias, V.; Papadopoulou, M.; Vavoulidou, E.; Theocharopoulos, S.; Repas, S.; Koubouris, G.; Psarras, G.; Kokkinos, G. Effect of Addition of Organic Materials and Irrigation Practices on Soil Quality in Olive Groves. J. Water Clim. Change 2018, 9, 775–785. [Google Scholar] [CrossRef] [Scilit]
  26. Tscharntke, T.; Grass, I.; Wanger, T.C.; Westphal, C.; Batáry, P. Beyond Organic Farming—Harnessing Biodiversity-Friendly Landscapes. Trends Ecol. Evol. 2021, 36, 919–930. [Google Scholar] [CrossRef] [Scilit] [PubMed]
  27. Wezel, A.; Casagrande, M.; Celette, F.; Vian, J.-F.; Ferrer, A.; Peigné, J. Agroecological Practices for Sustainable Agriculture. A Review. Agron. Sustain. Dev. 2014, 34, 1–20. [Google Scholar] [CrossRef] [Scilit]
  28. Taguas, E.V.; Marín-Moreno, V.; Díez, C.M.; Mateos, L.; Barranco, D.; Mesas-Carrascosa, F.-J.; Pérez, R.; García-Ferrer, A.; Quero, J.L. Opportunities of Super High-Density Olive Orchard to Improve Soil Quality: Management Guidelines for Application of Pruning Residues. J. Environ. Manag. 2021, 293, 112785. [Google Scholar] [CrossRef] [Scilit] [PubMed]
  29. Efthimiou, N. The New Assessment of Soil Erodibility in Greece. Soil Tillage Res. 2020, 204, 104720. [Google Scholar] [CrossRef] [Scilit]
  30. Katrantsiotis, C.; Norström, E.; Smittenberg, R.H.; Finne, M.; Weiberg, E.; Hättestrand, M.; Avramidis, P.; Wastegård, S. Climate Changes in the Eastern Mediterranean over the Last 5000 Years and Their Links to the High-Latitude Atmospheric Patterns and Asian Monsoons. Glob. Planet. Change 2019, 175, 36–51. [Google Scholar] [CrossRef] [Scilit]
  31. Manzoni, S.; Maneas, G.; Scaini, A.; Psiloglou, B.E.; Destouni, G.; Lyon, S.W. Understanding Coastal Wetland Conditions and Futures by Closing Their Hydrologic Balance: The Case of the Gialova Lagoon, Greece. Hydrol. Earth Syst. Sci. 2020, 24, 3557–3571. [Google Scholar] [CrossRef] [Scilit]
  32. Kouri, M. Olive Heritage and Tourism in Messenia: A Path to Sustainable Development. Sustain. Dev. Cult. Tradit. J. 2024, 2024, 16–35. [Google Scholar] [CrossRef] [Scilit]
  33. Pantazis, C.; Solomos, S.; Nastos, P.; Maneas, G.; Kairis, O.; Centrito, M.; Marino, G.; Roggero, P.P.; Mihail, J.; Fountoulakis, I.; et al. Insights into the Effects of Climate Variability and Agricultural Practices on Olive Orchards in Messenia, Greece: A Field Experiment Study. SSRN Preprint 2025. [Google Scholar] [CrossRef] [Scilit]
  34. Soriano, M.-A.; Álvarez, S.; Landa, B.B.; Gómez, J.A. Soil Properties in Organic Olive Orchards Following Different Weed Management in a Rolling Landscape of Andalusia, Spain. Renew. Agric. Food Syst. 2014, 29, 83–91. [Google Scholar] [CrossRef] [Scilit]
  35. Boehm, M.M.; Anderson, D.W. A Landscape-Scale Study of Soil Quality in Three Prairie Farming Systems. Soil Sci. Soc. Am. J. 1997, 61, 1147–1159. [Google Scholar] [CrossRef] [Scilit]
  36. Velasquez, E.; Lavelle, P. Soil Macrofauna as an Indicator for Evaluating Soil Based Ecosystem Services in Agricultural Landscapes. Acta Oecologica 2019, 100, 103446. [Google Scholar] [CrossRef] [Scilit]
  37. Bechara, E.; Papafilippaki, A.; Doupis, G.; Sofo, A.; Koubouris, G. Nutrient Dynamics, Soil Properties and Microbiological Aspects in an Irrigated Olive Orchard Managed with Five Different Management Systems Involving Soil Tillage, Cover Crops and Compost. J. Water Clim. Change 2018, 9, 736–747. [Google Scholar] [CrossRef] [Scilit]
  38. Williams, H.; Colombi, T.; Keller, T. The Influence of Soil Management on Soil Health: An on-Farm Study in Southern Sweden. Geoderma 2020, 360, 114010. [Google Scholar] [CrossRef] [Scilit]
  39. Ioannidou, S.C.; Litskas, V.D.; Stavrinides, M.C.; Vogiatzakis, I.N. Linking Management Practices and Soil Properties to Ecosystem Services in Mediterranean Mixed Orchards. Ecosyst. Serv. 2022, 53, 101378. [Google Scholar] [CrossRef] [Scilit]
  40. Hunduma, S.; Kebede Bunare, G. Measurement of Soil Particle Size Distribution Using Hydrometer Analysis. Am.-Eurasian J. Agric. Environ. Sci. 2020, 20, 243–254. [Google Scholar]
  41. Miller, R. Particle Size Determination by Hydrometer Method. Soil Test Methods from the Southeastern United States. South. Coop. Ser. Bull. 2014, 419, 180–184. [Google Scholar]
  42. USDA Natural Resources Conservation Service, Soil Survey Staff. Soil Texture Calculator; Natural Resources Conservation Service, United States Department of Agriculture: Washington, DC, USA, 2019. [Google Scholar]
  43. Vitharana, U.W.A.; Casson, N.J.; Kumaragamage, D.; Mishra, U.; Friesen-Hughes, K. Factors Controlling the Spatial Heterogeneity of Soil Organic Carbon Concentrations and Stocks in a Boreal Forest. Geoderma Reg. 2024, 36, e00749. [Google Scholar] [CrossRef] [Scilit]
  44. Food and Agriculture Organization of the United Nations (FAO). Standard Operating Procedure for Soil pH Determination; FAO: Rome, Italy, 2021; Available online: https://openknowledge.fao.org/server/api/core/bitstreams/6ad6862a-eadc-437c-b359-ef14cb687222/content (accessed on 15 April 2025).
  45. Hanna Instruments. HI99121 Waterproof pH & Temperature Meter for Direct Measurement in Soil: Instruction Manual; Hanna Instruments: Woonsocket, RI, USA, 2025; Available online: https://www.documentation.hannainst.com/manuals/preview/238 (accessed on 15 April 2025).
  46. Food and Agriculture Organization of the United Nations (FAO). Standard Operating Procedure for Soil Bulk Density, Cylinder Method; FAO: Rome, Italy, 2023. [Google Scholar] [CrossRef] [Scilit]
  47. Wang, D.; Fan, L.-S. Particle Characterization and Behavior Relevant to Fluidized Bed Combustion and Gasification Systems. In Fluidized Bed Technologies for Near-Zero Emission Combustion and Gasification; Elsevier: Amsterdam, The Netherlands, 2013; pp. 42–76. ISBN 978-0-85709-541. [Google Scholar]
  48. Brogowski, Z.; Kwasowski, W.; Madyniak, R. Calculating Particle Density, Bulk Density, and Total Porosity of Soil Based on Its Texture. Soil Sci. Annu. 2014, 65, 139–149. [Google Scholar] [CrossRef] [Scilit]
  49. Arampatzis, G.; Hatzigiannakis, E.; Pisinaras, V.; Kourgialas, N.; Psarras, G.; Kinigopoulou, V.; Panagopoulos, A.; Koubouris, G. Soil Water Content and Olive Tree Yield Responses to Soil Management, Irrigation, and Precipitation in a Hilly Mediterranean Area. J. Water Clim. Change 2018, 9, 672–678. [Google Scholar] [CrossRef] [Scilit]
  50. De Pedro, L.; Perera-Fernández, L.G.; López-Gallego, E.; Pérez-Marcos, M.; Sanchez, J.A. The Effect of Cover Crops on the Biodiversity and Abundance of Ground-Dwelling. Agronomy 2020, 10, 580. [Google Scholar] [CrossRef] [Scilit]
  51. Blaise, C.; Mazzia, C.; Bischoff, A.; Millon, A.; Ponel, P.; Blight, O. Vegetation increases abundances of ground and canopy arthropods in mediterranean vineyards. Sci. Rep. 2022, 12, 3680. [Google Scholar] [CrossRef] [Scilit]
  52. Jerez-Valle, C.; García, P.A.; Campos, M.; Pascual, F. A Simple Bioindication Method to Discriminate Olive Orchard Management Types Using the Soil Arthropod Fauna. Appl. Soil Ecol. 2014, 76, 42–51. [Google Scholar] [CrossRef] [Scilit]
  53. Gallé, R.; Geppert, C.; Földesi, R.; Tscharntke, T.; Batáry, P. Arthropod Functional Traits Shaped by Landscape-Scale Field Size, Local Agri-Environment Schemes and Edge Effects. Basic Appl. Ecol. 2020, 48, 102–111. [Google Scholar] [CrossRef] [Scilit]
  54. Oksanen, J. Vegan: Ecological Diversity [R Package Vignette], Vegan Package Version 2.6-10. 2025. Available online: https://cran.r-project.org/web/packages/vegan/ (accessed on 30 December 2025).
  55. Gonçalves, F.; Nunes, C.; Carlos, C.; López, Á.; Oliveira, I.; Crespí, A.; Teixeira, B.; Pinto, R.; Costa, C.A.; Torres, L. Do Soil Management Practices Affect the Activity Density, Diversity, and Stability of Soil Arthropods in Vineyards? Agric. Ecosyst. Environ. 2020, 294, 106863. [Google Scholar] [CrossRef] [Scilit]
  56. Vignozzi, N.; Agnelli, A.E.; Brandi, G.; Gagnarli, E.; Goggioli, D.; Lagomarsino, A.; Pellegrini, S.; Simoncini, S.; Simoni, S.; Valboa, G.; et al. Soil Ecosystem Functions in a High-Density Olive Orchard Managed by Different Soil Conservation Practices. Appl. Soil Ecol. 2019, 134, 64–76. [Google Scholar] [CrossRef] [Scilit]
  57. Avila, C.C.E.; Schaefer, M.V.; Duro, A.M.; Haensel, T.P.; Garniwan, A.; Lin, Y.; Darrel Jenerette, G.; Nico, P.S.; Dubinsky, E.; Keiluweit, M.; et al. Carbon Dynamics as a Function of Soil Moisture Following Repeated Wet-Dry Cycles in Irrigated Soils. Geoderma 2023, 439, 116681. [Google Scholar] [CrossRef] [Scilit]
  58. Pearson, B.M.; Minor, M.A.; Robertson, A.W.; Clavijo McCormick, A.L. Plant Invasion down under: Exploring the below-Ground Impact of Invasive Plant Species on Soil Properties and Invertebrate Communities in the Central Plateau of New Zealand. Biol. Invasions 2024, 26, 4215–4228. [Google Scholar] [CrossRef] [Scilit]
  59. Solomou, A.D.; Sfougaris, A.I. Herbaceous Plant Diversity and Identification of Indicator Species in Olive Groves in Central Greece. Commun. Soil Sci. Plant Anal. 2013, 44, 320–330. [Google Scholar] [CrossRef] [Scilit]
  60. Gonçalves, M.F.; Pereira, J.A. Abundance and Diversity of Soil Arthropods in the Olive Grove Ecosystem. J. Insect Sci. 2012, 12, 20. [Google Scholar] [CrossRef] [Scilit]
  61. Ding, W.; Zvomuya, F.; Cao, M.; Wu, Y.; Liu, Z.; He, H. Ground Cover Management Improves Orchard Soil Moisture Content: A Global Meta-Analysis. J. Hydrol. 2024, 633, 130710. [Google Scholar] [CrossRef] [Scilit]
  62. Michalopoulos, G.; Kasapi, K.A.; Koubouris, G.; Psarras, G.; Arampatzis, G.; Hatzigiannakis, E.; Kavvadias, V.; Xiloyannis, C.; Montanaro, G.; Malliaraki, S.; et al. Adaptation of Mediterranean Olive Groves to Climate Change through Sustainable Cultivation Practices. Climate 2020, 8, 54. [Google Scholar] [CrossRef] [Scilit]
  63. Arrobas, M.; Conceição, N.; Pereira, E.; Martins, S.; Raimundo, S.; Brito, C.; Correia, C.M.; Rodrigues, M.Â. Dolomitic Limestone Was More Effective than Calcitic Limestone in Increasing Soil pH in an Untilled Olive Orchard. Soil Use Manag. 2023, 39, 1437–1452. [Google Scholar] [CrossRef] [Scilit]
  64. Repullo, M.A.; Carbonell, R.; Hidalgo, J.; Rodríguez-Lizana, A.; Ordóñez, R. Using Olive Pruning Residues to Cover Soil and Improve Fertility. Soil Tillage Res. 2012, 124, 36–46. [Google Scholar] [CrossRef] [Scilit]
  65. Hernández, A.J.; Lacasta, C.; Pastor, J. Effects of Different Management Practices on Soil Conservation and Soil Water in a Rainfed Olive Orchard. Agric. Water Manag. 2005, 77, 232–248. [Google Scholar] [CrossRef] [Scilit]
  66. Bombino, G.; Denisi, P.; Gómez, J.A.; Zema, D.A. Water Infiltration and Surface Runoff in Steep Clayey Soils of Olive Groves under Different Management Practices. Water 2019, 11, 240. [Google Scholar] [CrossRef] [Scilit]
  67. Repullo-Ruibérriz De Torres, M.A.; Pérez-Serrano, F.; Moreno-García, M.; Carbonell-Bojollo, R.M.; Ordóñez-Fernández, R.; Rodríguez-Lizana, A. The Use of Pruning Residue Mulch and Spontaneous Groundcovers to Control Erosion and Carbon Loss in Olive Orchards. Agriculture 2025, 15, 677. [Google Scholar] [CrossRef] [Scilit]
  68. Daryanto, S.; Fu, B.; Wang, L.; Jacinthe, P.-A.; Zhao, W. Quantitative Synthesis on the Ecosystem Services of Cover Crops. Earth-Sci. Rev. 2018, 185, 357–373. [Google Scholar] [CrossRef] [Scilit]
  69. Neina, D. The Role of Soil pH in Plant Nutrition and Soil Remediation. Appl. Environ. Soil Sci. 2019, 2019, 5794869. [Google Scholar] [CrossRef] [Scilit]
  70. Quintarelli, V.; Radicetti, E.; Allevato, E.; Stazi, S.R.; Haider, G.; Abideen, Z.; Bibi, S.; Jamal, A.; Mancinelli, R. Cover Crops for Sustainable Cropping Systems: A Review. Agriculture 2022, 12, 2076. [Google Scholar] [CrossRef] [Scilit]
  71. Keesstra, S.; Pereira, P.; Novara, A.; Brevik, E.C.; Azorin-Molina, C.; Parras-Alcántara, L.; Jordán, A.; Cerdà, A. Effects of Soil Management Techniques on Soil Water Erosion in Apricot Orchards. Sci. Total Environ. 2016, 551–552, 357–366. [Google Scholar] [CrossRef] [Scilit] [PubMed]
  72. Adetunji, A.T.; Ncube, B.; Mulidzi, R.; Lewu, F.B. Management Impact and Benefit of Cover Crops on Soil Quality: A Review. Soil Tillage Res. 2020, 204, 104717. [Google Scholar] [CrossRef] [Scilit]
  73. Gkisakis, V.D.; Kollaros, D.; Kabourakis, E.M. Soil Arthropod Biodiversity in Plain and Hilly Olive Orchard Agroecosystems, in Crete, Greece. Entomol. Hell. 2017, 23, 18. [Google Scholar] [CrossRef] [Scilit]
  74. Bagyaraj, D.J.; Nethravathi, C.J.; Nitin, K.S. Soil Biodiversity and Arthropods: Role in Soil Fertility. In Economic and Ecological Significance of Arthropods in Diversified Ecosystems; Chakravarthy, A.K., Sridhara, S., Eds.; Springer: Singapore, 2016; pp. 17–51. ISBN 978-981-10-1523-6. [Google Scholar]
  75. Prather, R.M.; Castillioni, K.; Welti, E.A.R.; Kaspari, M.; Souza, L. Abiotic Factors and Plant Biomass, Not Plant Diversity, Strongly Shape Grassland Arthropods under Drought Conditions. Ecology 2020, 101, e03033. [Google Scholar] [CrossRef] [Scilit] [PubMed]
  76. Doetterl, S.; Berhe, A.A.; Heckman, K.; Lawrence, C.; Schnecker, J.; Vargas, R.; Vogel, C.; Wagai, R. A Landscape-Scale View of Soil Organic Matter Dynamics. Nat. Rev. Earth Environ. 2025, 6, 67–81. [Google Scholar] [CrossRef] [Scilit]
  77. Seibold, S.; Gossner, M.M.; Simons, N.K.; Blüthgen, N.; Müller, J.; Ambarlı, D.; Ammer, C.; Bauhus, J.; Fischer, M.; Habel, J.C.; et al. Arthropod Decline in Grasslands and Forests Is Associated with Landscape-Level Drivers. Nature 2019, 574, 671–674. [Google Scholar] [CrossRef] [Scilit]
  78. Molénat, J.; Barkaoui, K.; Benyoussef, S.; Mekki, I.; Zitouna, R.; Jacob, F. Diversification from Field to Landscape to Adapt Mediterranean Rainfed Agriculture to Water Scarcity in Climate Change Context. Curr. Opin. Environ. Sustain. 2023, 65, 101336. [Google Scholar] [CrossRef] [Scilit]
  79. Majikumna, K.U.; Zineddine, M.; El Hilali Alaoui, A. Olive Tree Drought Stress: A Systematic Review. J. Water Clim. Change 2024, 15, 5741–5762. [Google Scholar] [CrossRef] [Scilit]
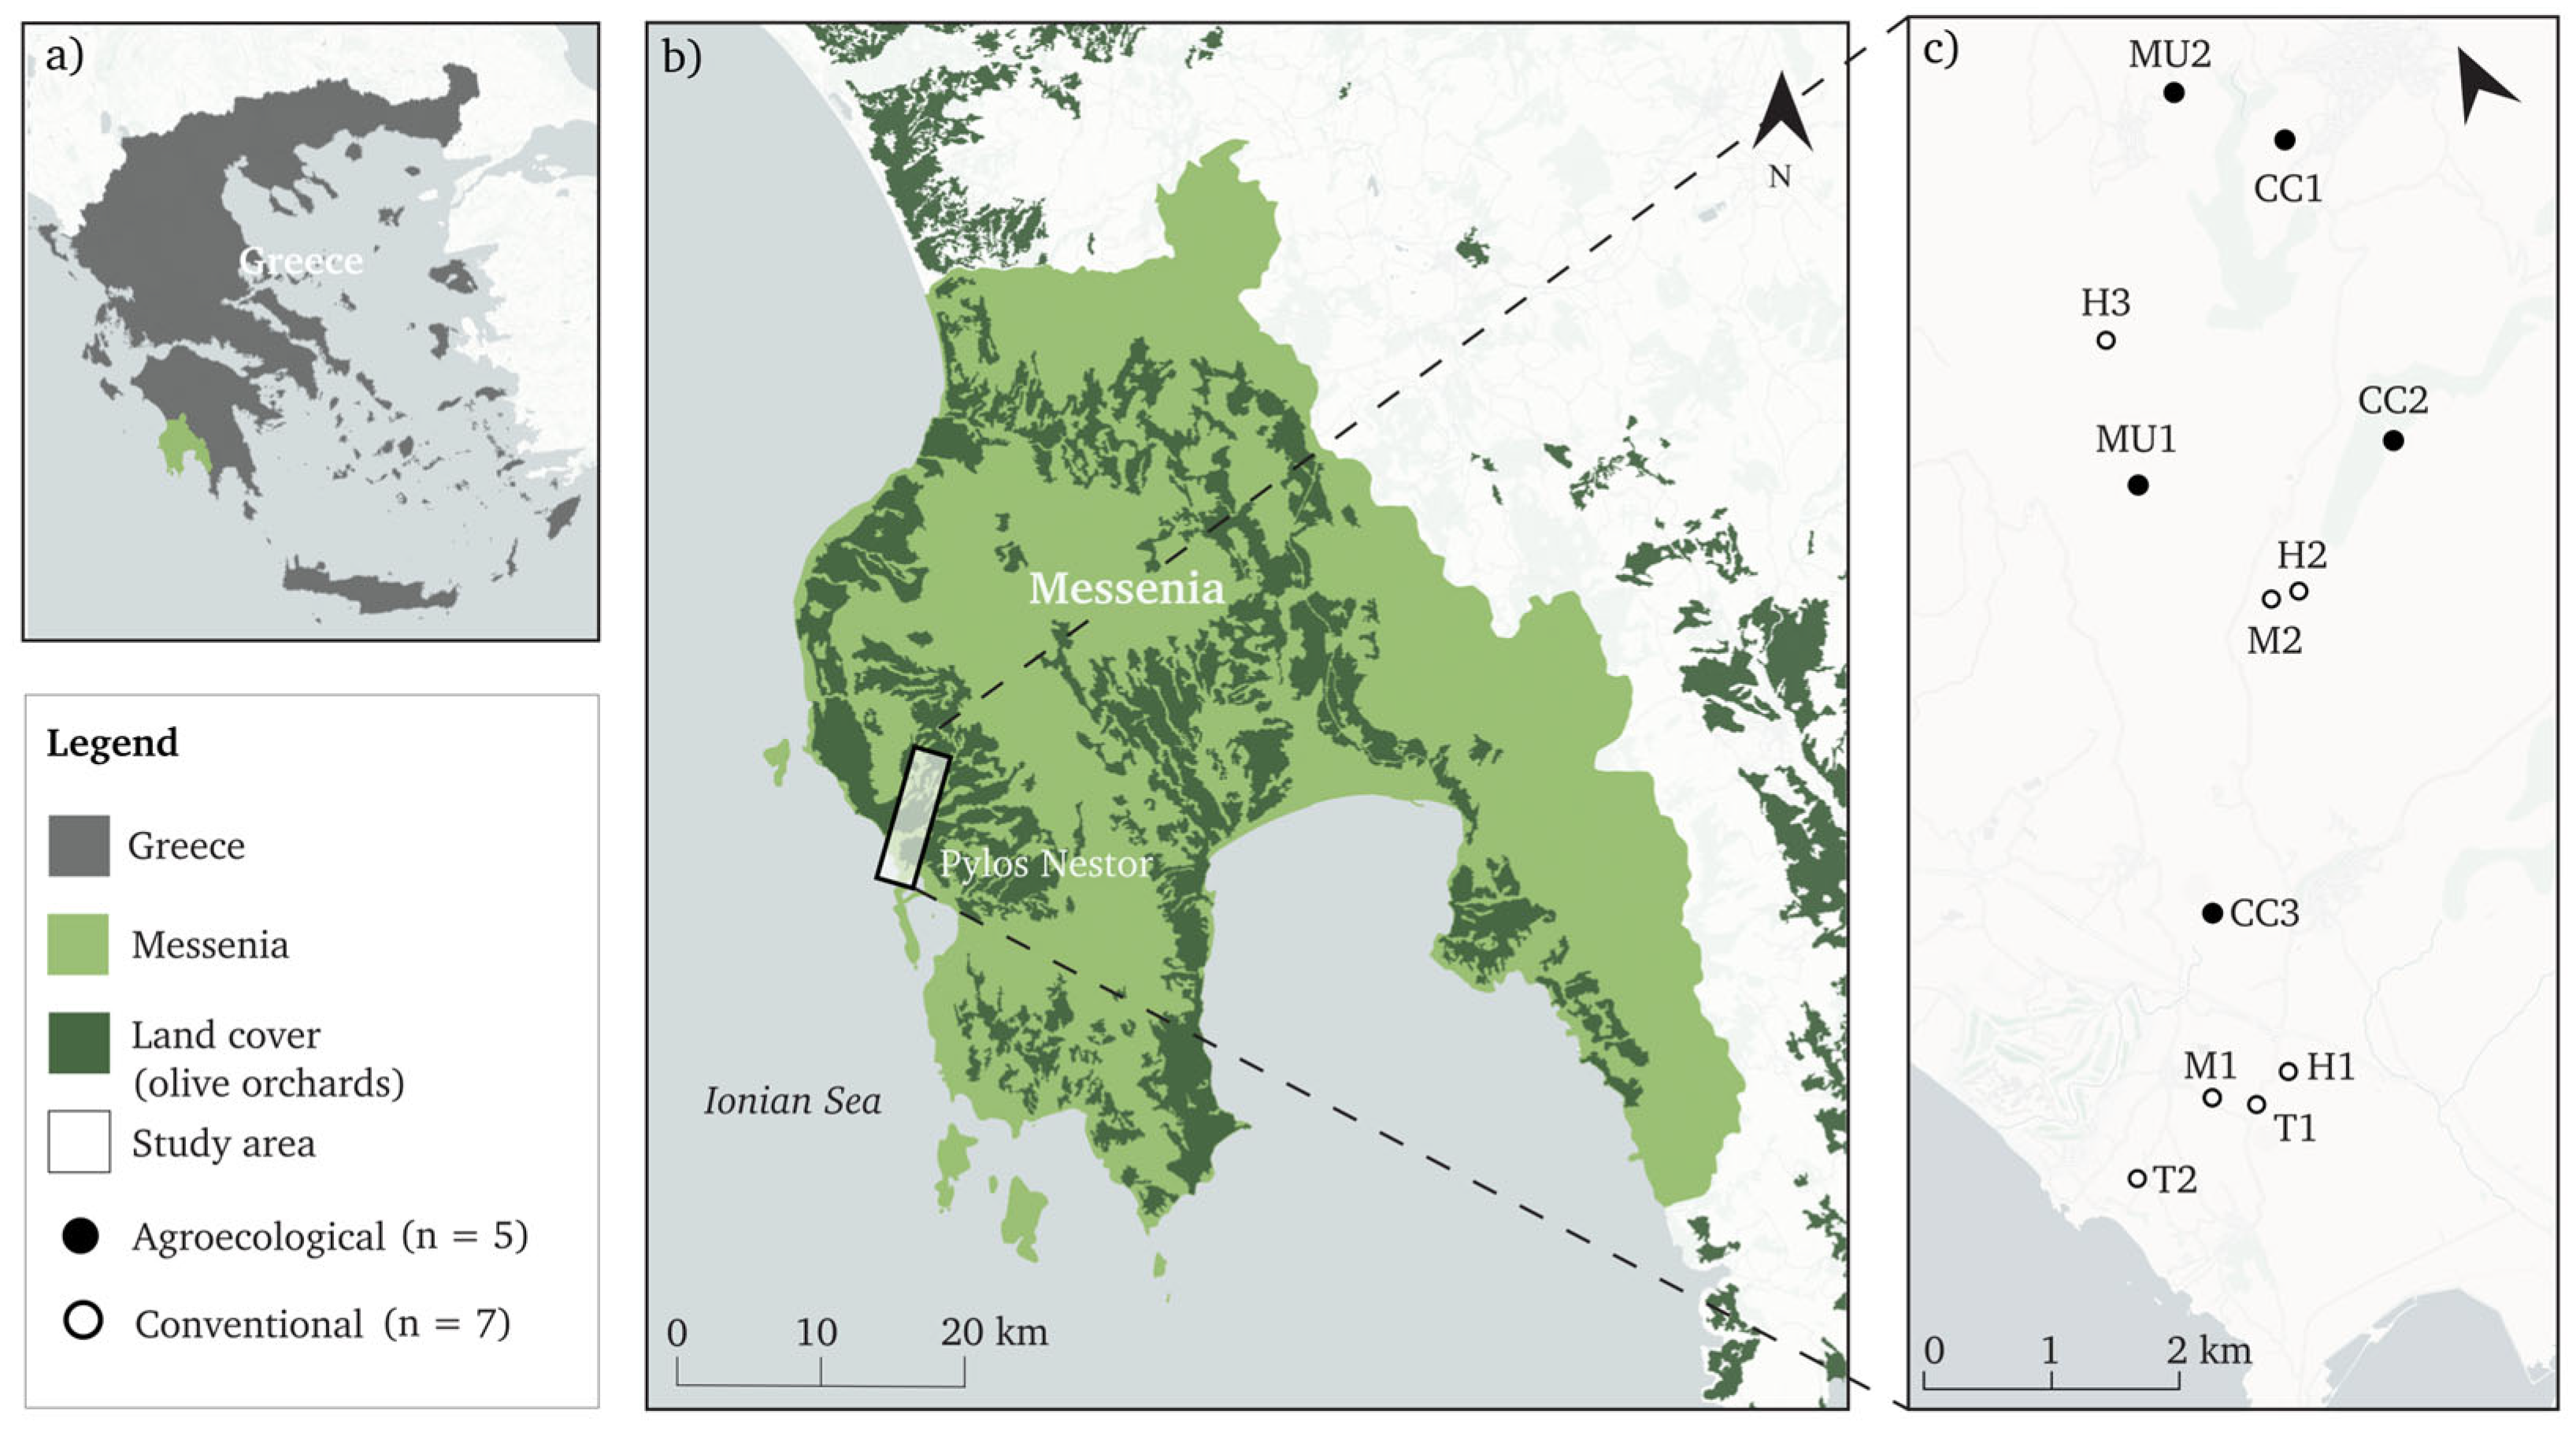
Figure 1. The study area including (a) the region of Messenia in relation to Greece, (b) the study area in reference to the region of Messenia, and (c) the distribution of the fields selected for sampling, including cover crops (CC): CC1, CC2 and CC3; mulching (MU): MU1 and MU2; herbicide (H): H1, H2 and H3; mowing (M): M1 and M2; and tillage (T): T1 and T2. Map layers were retrieved from QGIS (version 3.34.4, Zurich, Switzerland).
Agronomy 16 00404 g001
Figure 2. Schematic diagram of soil sampling procedure showing (a) orchard replicates of management practices; (b) standard soil sampling plot (0.25 ha) including 10 m buffer zone, distribution of transects (n = 4) and soil sampling points across orchards; white circles correspond to soil samples taken using an Edelman augur (n = 16; 0–20 cm), black x corresponds to the bulk density (BD) samples taken using a cylindrical augur (n = 4; 0–5 cm); and (c) post-sampling processing involving compositing the four samples per transect, and sieving (2 mm) the augur soil samples in preparation for laboratory analysis.
Agronomy 16 00404 g002
Figure 3. Schematic diagram illustrating the placement of pitfall traps for arthropod sampling per orchard (n = 6) (left) and photos showing the installation of the traps in field (top right) as well as protective measures taken to prevent damage and flooding of the traps (bottom right). Photos were taken by the author.
Agronomy 16 00404 g003
Figure 4. PCA biplot for soil properties, soil composition, and management systems. The directionality and proximity of the arrows illustrate the relationship between the variables used in the analysis. Arrows pointing in the same direction indicate a positive correlation, and arrows opposing one another indicate a negative relationship. The ellipses indicated in green (ECO) and brown (CON) exhibit the distribution of the data points and show the relationship between the different management practices within each system.
Agronomy 16 00404 g004
Figure 5. Boxplots of diversity metrics including (a) Shannon diversity, (b) inverse Simpson diversity index and (c) Pielous evenness index comparing agroecological (n = 30) and conventional (n = 36) management systems. The boxes represent the interquartile range (25th to 75th percentiles); The median is defined by the horizontal line inside of the boxes. Whiskers illustrate the min and max values within 1.5 times the interquartile range from the first and third quartiles, respectively. The green dots represent outliers.
Agronomy 16 00404 g005
Table 1. Summary of management practices found within the region of Messenia including a description of the practice as well as the general period in which each practice is executed.
SystemPracticeField IDDescriptionTime Period
ECOCover CropsCC1, CC2,
CC3
Seeding of Vicia sativa and Lupinus albus, followed by shallow tillage (5–10 cm depth) to mix the seeds into the soil.Every other year between October and November
MulchingMU1, MU2Pruning remains finely ground using a woodchipper and applied as a cover layer.Once a year between October and January
CONMowingM1, M2Mechanical mowing of the vegetation to prevent competition for water and nutrients.1–2 times per year between April and June
HerbicideH1, H2, H3Applied to ground vegetation to prevent growth. The dominant herbicide used is Flazasulfuron (Katana).1–2 times per year between January and May
TillageT1, T2Mechanical tillage of the topsoil layer (20–30 cm).1–2 times per year between April and May
Table 2. Soil properties for each management system (mean ± SD) including bulk density (BD), porosity (%), pH, soil organic matter (SOM), soil organic carbon (SOC), and volumetric water content (VWC). Asterisks denote statistical significance, (* p < 0.05; ** p < 0.01).
Soil PropertyAgroecological (ECO)Conventional (CON)p-Value
Bulk Density (g/cm3)1.18 ± 0.111.38 ± 0.130.01 **
Porosity (%)56.38 ± 3.9448.75 ± 4.340.01 **
pH8.30 ± 0.097.59 ± 0.650.04 *
SOM (%)8.99 ± 0.826.87 ± 1.700.04 *
SOC (%)5.21 ± 0.483.98 ± 0.980.04 *
VWC (m3/m3)0.31 ± 0.010.30 ± 0.02>0.10
Clay (%)12.24 ± 2.9711.58 ± 8.59>0.10
Sand (%)29.75 ± 5.4551.12 ± 20.140.05 *
Table 3. Arthropod taxa abundances (mean ± SD) across management systems; p-values indicate significant taxon-management system associations identified by the indicator species analysis (ISA), which combines taxa specificity and constancy. Mean values are presented for descriptive purposes only. Management system associations are denoted by asterisks (* p < 0.05; ** p < 0.01).
Arthropod TaxaAgroecologicalConventionalp-Value
Acari2.1 ± 3.11.3 ± 1.9-
Araneae1.4 ± 1.81.8 ± 1.5-
Carabidae1.7 ± 2.4 **0.4 ± 0.70.005
Coleoptera0.7 ± 1.00.9 ± 1.1-
Collembola21.9 ± 23.856.9 ± 51.4 **0.005
Diptera2.2 ± 2.28.5 ± 13.7 **0.010
Embioptera0.2 ± 0.60.3 ± 0.7-
Formicidae15.2 ± 22.4 **4.9 ± 4.90.005
Isopoda4.4 ± 8.24.9 ± 10.1-
Julida0.8 ± 1.02.6 ± 4.0 **0.010
Opiliones0.5 ± 0.7 *0.1 ± 0.40.015
Pseudoscorpiones0.1 ± 0.30.2 ± 0.7-
Scarabidae0.3 ± 0.60.2 ± 0.8-
Tenebrionidae0.3 ± 0.10.1 ± 0.5-
Other0.6 ± 1.10.3 ± 0.7-
Disclaimer/Publisher’s Note: The statements, opinions and data contained in all publications are solely those of the individual author(s) and contributor(s) and not of MDPI and/or the editor(s). MDPI and/or the editor(s) disclaim responsibility for any injury to people or property resulting from any ideas, methods, instructions or products referred to in the content.