Article

Identification of Specific Long-Lived mRNAs Associated with Seed Longevity in Sweet Corn Based on RNA-seq


1
College of Agriculture and Biology, Zhongkai University of Agriculture and Engineering, Guangzhou 510225, China
2
Guangzhou Key Laboratory for Research and Development of Crop Germplasm Resources, Guangzhou 510225, China
3
Crop Research Institute, Guangdong Academy of Agricultural Sciences, Guangzhou 510640, China
4
College of Agriculture, South China Agricultural University, Guangzhou 510642, China
5
Guangdong Provincial Key Laboratory of Plant Molecular Breeding, Guangzhou 510642, China
*
Author to whom correspondence should be addressed.
Agronomy 2026, 16(3), 375; https://doi.org/10.3390/agronomy16030375
Submission received: 26 December 2025 / Revised: 24 January 2026 / Accepted: 31 January 2026 / Published: 3 February 2026

Abstract

Seeds possess long-lived messenger RNAs (mRNAs), some of which are involved in triggering germination and supporting seed longevity. Nevertheless, comprehensive studies on longevity-associated long-lived mRNAs in sweet corn are still scarce. To address this, eight sweet corn inbred lines were subjected to artificial aging (AA) and natural aging (NA). Based on half-inhibition time (ID50), two representative lines—a high-longevity (HL, T7) and a low-longevity (LL, T3) line—were selected. Physiological and biochemical assays revealed significant reductions in superoxide dismutase (SOD) and peroxidase (POD) activities, along with increased malondialdehyde (MDA) content and electrical conductivity, with more severe membrane damage in the LL line. RNA sequencing (RNA-seq) showed a strong correlation in differentially expressed genes (DEGs) between AA and NA. The combined DEGs were enriched in mitogen-activated protein kinase (MAPK) signaling and tryptophan metabolism, while five common long-lived mRNAs, including Zm00001eb157210 and Zm00001eb164610, were consistently downregulated, suggesting their potential role in regulating seed vigor. These findings highlight key molecular players in sweet corn seed longevity.

1. Introduction

Seed vigor is a critical indicator of seed quality, directly influencing germination capacity, seedling establishment potential, and early seedling growth performance [1]. As the foundation of agricultural production, high-quality seeds are essential for achieving high and stable crop yields [2]. However, seeds inevitably undergo irreversible aging during storage, which causes progressive declines in vigor and longevity [3,4].
Seed longevity is co-determined by genetic, environmental, and physiological factors. It is influenced by seed coat structure and the antioxidant system, traits that vary among genotypes due to differences in gene expression [5]. High temperature and humidity accelerate the aging process [6], which is accompanied by protein degradation, loss of membrane integrity, and dysregulation of hormonal signaling—changes that collectively weaken seed aging tolerance [7,8]. In maize, multiple genes regulate seed longevity: ZmDREB2A modulates raffinose biosynthesis by binding to DRE (dehydration-responsive element) motifs in ZmGH3.2 and ZmRAFS promoters [9]; GA/ABA pathway genes are indirectly involved in longevity maintenance via germination regulation [10]; antioxidant enzyme genes (e.g., CAT, POD and SOD) scavenge ROS to mitigate lipid peroxidation and sustain cellular stability [11,12,13]. MDA, a product of membrane lipid peroxidation, accumulates positively with aging damage in maize seeds [4]. Transcriptomic data link differential expression of these genes in aging-sensitive lines to seed vigor loss, highlighting the core role of antioxidant mechanisms [14,15].
The genetic control of maize seed longevity involves multiple key transcription factors. Loss-of-function of DOF4.1 improves germination rates after accelerated aging [16]. bZIP23 and bZIP42 overexpression enhances seed vigor, while knockout reduces it [17]. The MADS26 transcription factor promotes germination via promoter haplotype variation [18]. Overexpression of ZmPIMT1 enhances seed vigor [19]. Members of the homeobox transcription factor family may indirectly influence seed vigor-related pathways [20]. HB21, HB40, and HB53 act synergistically with TCP transcription factors and BRC1 to upregulate NCED3 expression, leading to ABA accumulation and suppression of bud development [21], which suggests a potential role in germination and vigor maintenance. Metallothionein (MT) proteins play important roles in plant development and stress response to heavy metals [22], and may indirectly affect seed storage and aging. Together, these transcription factors and protein families form core components of the regulatory network controlling seed longevity in maize.
Long-lived mRNAs refer to a specialized class of messenger RNAs that are stably stored in mature, dry seeds and can be directly translated during the early stages of germination [23,24]. These mRNAs are typically transcribed during the late stages of seed development, and their protein products are crucial for maintaining seed vigor and initiating the germination process [25]. Research in rice has shown that long-lived mRNAs encompass key components such as gibberellin receptor genes, influencing seed longevity by regulating germination-related pathways [25]. For instance, the heat shock (HS) protein OsHsp20-25 can negatively regulate germination progression while positively influencing seed length [26]. Loss-of-function mutant analysis in Arabidopsis has demonstrated that heat-shock factors HSF1A and HSF1B contribute to longevity. Furthermore, mutants of the stress-granule zinc-finger protein TZF9 or the spliceosome subunits MOS4 or MAC3A/MAC3B exhibit extended seed longevity, positioning RNA metabolism as a novel player in the regulation of seed viability [27]. Studies across different crops have revealed a conserved regulatory mechanism for long-lived mRNAs. For example, research in wheat found that their 3′ UTR structures mediate differences in subgenomic mRNA stability [28]. A degradation rate (ΔCt) quantitative model established in Arabidopsis indicates that mRNA fragmentation follows a pattern of stochastic decay [29]. In maize, flint-type varieties possess a more pronounced advantage in mRNA stability compared to floury types [30]. These advances provide new perspectives for deciphering the mechanisms of seed aging.
Sweet corn seeds generally exhibit low vigor, and their poor storage tolerance significantly hampers sweet corn production. Despite extensive research on maize seed aging involving genetic mapping, transcriptomics, and proteomics [8,31,32], long-lived mRNAs have received comparatively little attention, representing a critical research gap in sweet corn. To address this gap, we selected eight sweet corn inbred lines with divergent aging tolerance, defining high-longevity (HL) and low-longevity (LL) genotypes. By integrating phenotypic, physiological, biochemical, and RNA-seq analyses of HL and LL lines under artificial aging (AA) and natural aging (NA) conditions, this study aims to: (1) characterize phenotypic and molecular differences between HL and LL sweet corn in response to aging; (2) identify specific long-lived mRNAs associated with sweet corn seed longevity; (3) provide candidate targets for elucidating the molecular mechanisms of seed longevity and genetic improvement of sweet corn storage tolerance.

2. Materials and Methods

2.1. Seed Materials and Growth Conditions

A total of eight sweet corn inbred lines (T1–T8) were used in this study. The seeds were provided by the Maize Research Laboratory of Zhongkai University of Agriculture and Engineering. All materials were cultivated under consistent field conditions in the teaching experimental base at the Baiyun Campus of Zhongkai University of Agriculture and Engineering (Campus Baiyun, Guangzhou, China) in 2021. Standard field management practices were implemented following the method described by Wang et al. [13]. After harvesting in the autumn of 2021, seeds were stored in a cold room at 4 °C until further use.

2.2. Initial Moisture Content Determination

Prior to aging treatments, all seeds were dried at a constant temperature of 40 °C until constant weight was achieved. Initial moisture content was measured using a grain moisture analyzer (LDS-1G, Comeasure Instrument Co., Ningbo, China). If the moisture content exceeded 15%, seeds were further dried at 30 °C and measured every 12 until it fell below 15%. Drying was terminated when the moisture levels of all varieties had stabilized and closely matched, ensuring uniformity for subsequent aging experiments.

2.3. Natural and Artificial Aging Treatments

Harvested seeds from eight sweet corn lines were divided into two groups for aging treatments. For the NA group, approximately 300 g of seeds per inbred line, with a moisture content of about 14%, were placed in gauze bags and stored under laboratory ambient conditions (5–33 °C, 60–80% relative humidity) for four months. For the artificial aging (AA) group, following the high-temperature and high-humidity protocol, approximately 100 g of seeds per line were sealed in gauze bags and treated in an aging chamber (LH-150S, Shanghai Qixin, Shanghai, China) maintained at 38 °C and 90% relative humidity. Seeds were sampled after 0, 2, 4, 6, 8, and 10 days of treatment.

2.4. Germination Assay and ID50 Determination

Germination tests were conducted using seeds from each inbred line at different aging time points. Seeds were surface-sterilized with 1% sodium hypochlorite (NaClO) solution for 10 min and rinsed three times with distilled water. For each sample, three biological replicates of 50 seeds each were placed on moist filter paper in Petri dishes and incubated in a growth chamber (Shanghai Yiheng Scientific Instruments Co., Ltd., Shanghai, China) at 30 °C. Moisture was replenished daily, and the number of germinated seeds was recorded on day 8. The median lethal time (ID50), defined as the aging duration required for the germination rate to decline to 50% of its initial value, was calculated by fitting germination rate curves across different aging times, following the method described by Wang et al. [24]. The ID50 served as an indicator of seed aging tolerance and was used, alongside other metrics, to classify inbred lines as HL or LL.

2.5. Conductivity Measurement

To assess cell membrane integrity, conductivity was measured for inbred lines T7 (HL) and T3 (LL). Seeds from the control (Ctrl), AA treatment for 10 days, and NA treatment for 4 months were selected. Twenty intact kernels per sample were rinsed three times with distilled water and blotted dry. The kernels were then immersed in 20 mL of distilled water in a 50 mL beaker and incubated at 25 °C for 12 h, with three blank controls (water only) included. The electrical conductivity of the sample (B) and the blank (A) was measured using a DDS-11A digital conductivity meter (Shanghai Leici Instrument Factory, Shanghai, China). The relative conductivity was calculated as (d2 − d1)/seed weight, where d1 and d2 represent the conductivity values of the blank and sample, respectively.

2.6. Determination of Antioxidant Enzyme Activities and MDA Content

Seeds from HL and T3, including Ctrl, AA for 10 days, and NA for 4 months, were selected for measuring antioxidant enzyme activities and MDA content. Each treatment included three biological replicates. Approximately 0.2 g of aged seeds were weighed, rinsed with ice-cold phosphate buffer, and blotted dry on filter paper. The seeds were then transferred to a 5 mL centrifuge tube, and phosphate buffer was added at a ratio of 1:9 (w/v). The mixture was thoroughly homogenized on ice using a bead mill homogenizer at 10,000–15,000 rpm. The homogenate was centrifuged at 3000 r/min for 10–15 min at room temperature, and the supernatant was collected for subsequent analysis.
The activities of CAT, POD, and SOD were determined using commercial assay kits (Plant Catalase Assay Kit, ZK-L0424; Plant Peroxidase Assay Kit, ZK-L0223; Plant Superoxide Dismutase Assay Kit, ZK-L4276; Zike Biological Technology Co., Ltd., Shenzhen, China). The MDA content was measured using the thiobarbituric acid method with a Plant Malondialdehyde ELISA Kit (ZK-P7111; Zike Biological Technology Co., Ltd.). All procedures were strictly performed according to the manufacturer’s instructions to ensure accuracy and reproducibility.

2.7. RNA-seq Analysis

Seeds from T7 (HL) and T3 (LL) under control (Ctrl), AA (10 days), and NA (4 months) conditions were sampled with three biological replicates per group, resulting in a total of 18 samples. The seeds were immediately frozen in liquid nitrogen and stored at –80 °C. All samples were shipped on dry ice to Shanghai Personalbio Biotechnology Co., Ltd. (Shanghai, China) for RNA sequencing. Total RNA was extracted using TRIzol reagent (Invitrogen, Carlsbad, CA, USA) according to the manufacturer’s instructions. RNA quality was assessed using an Agilent 2100 Bioanalyzer (Agilent Technologies, Santa Clara, CA, USA) and verified via RNase-free agarose gel electrophoresis. Sequencing libraries were constructed as described by Wang et al., and 18 mRNA-Seq libraries were prepared and sequenced on the Illumina HiSeq™ 4000 platform (Illumina, Inc., San Diego, CA, USA) with a paired-end 150 bp strategy.
Raw reads were quality-checked using FastQC v0.11.9. Clean reads were aligned to the reference genome (Zea_mays.Zm-B73-REFERENCE-NAM-5.0.dna.toplevel.fa.gz, downloaded from Ensembl Plants) using HISAT2 v2.1.1 with index built by Bowtie2 [33]. Subsequently, the reads were filtered through Tophat2 [34] and aligned to the reference index. Gene annotation was performed by aligning sequences to multiple databases including NT, GO, EC, KEGG, and Swiss-Prot. Gene expression levels were quantified using HTSeq [35]. Expression levels were normalized using reads per kilobase per million reads (RPKM), with RPKM values > 1 considered as the threshold for gene expression standard [36]. Differential expression analysis was conducted using DESeq v1.48.0 with thresholds of FDR < 0.05 and |log2FC| ≥ 1.0 [37]. Functional enrichment analyses of DEGs were performed using topGO [38] for GO and KAAS for KEGG [39] pathway annotation. The raw sequence data reported in this paper have been deposited in the Genome Sequence Archive (Genomics, Proteomics & Bioinformatics 2025) [40] in National Genomics Data Center (Nucleic Acids Res 2025) [41], China National Center for Bioinformation/Beijing Institute of Genomics, Chinese Academy of Sciences (GSA: CRA035713) that are publicly accessible at https://ngdc.cncb.ac.cn/gsa (accessed on 24 December 2025).

2.8. Identification of Long-Lived mRNAs

Long-lived mRNAs were identified following the method described by Wang et al. [25]. Transcripts that were downregulated in the HL inbred line but degraded more slowly than in the LL line were selected using the following criteria: log2FC(HL) < 0, log2FC(LL) < 0, and (log2FC(HL) − log2FC(LL)) > 0, with statistical significance set at p < 0.05. Two-way ANOVA was further applied to identify transcripts with significantly slower degradation rates in HL compared to LL lines during aging (p < 0.05).

2.9. RT-qPCR Validation

Five candidate long-lived mRNAs were selected for validation by quantitative real-time PCR (qRT-PCR). Gene-specific primers were designed using Primer 3.0 (Table S1). UBQ7 was used as the internal reference gene. Total RNA was extracted using TRIzol reagent (Takara Bio Inc., Otsu, Shiga, Japan), and genomic DNA was removed using the FastKing gDNA Removal RT SuperMix kit (Generay Biotech Co., Ltd., Shanghai, China). Reverse transcription and qPCR were performed using SYBR Green master mix (Tsingke Biotechnology Co., Ltd., Beijing, China) on a real-time PCR system. The amplification program consisted of an initial denaturation at 95 °C, followed by 42 cycles of 95 °C for 15 s and 60 °C for 20 s. Each sample was run in triplicate, and relative expression levels were calculated using the 2−ΔΔCt method [42].

2.10. Statistical Analysis

Statistical analyses were performed using SPSS 17.0. Student’s t-test or one-way ANOVA was applied for comparisons among groups. While a Two-way ANOVA was used to evaluate differences in aging responses between HL and LL inbred lines. Figures were generated using TBtools (v2.121) [43] and R software (v3.5.1).

3. Results

3.1. Classification of Seed Longevity in Sweet Corn Inbred Lines

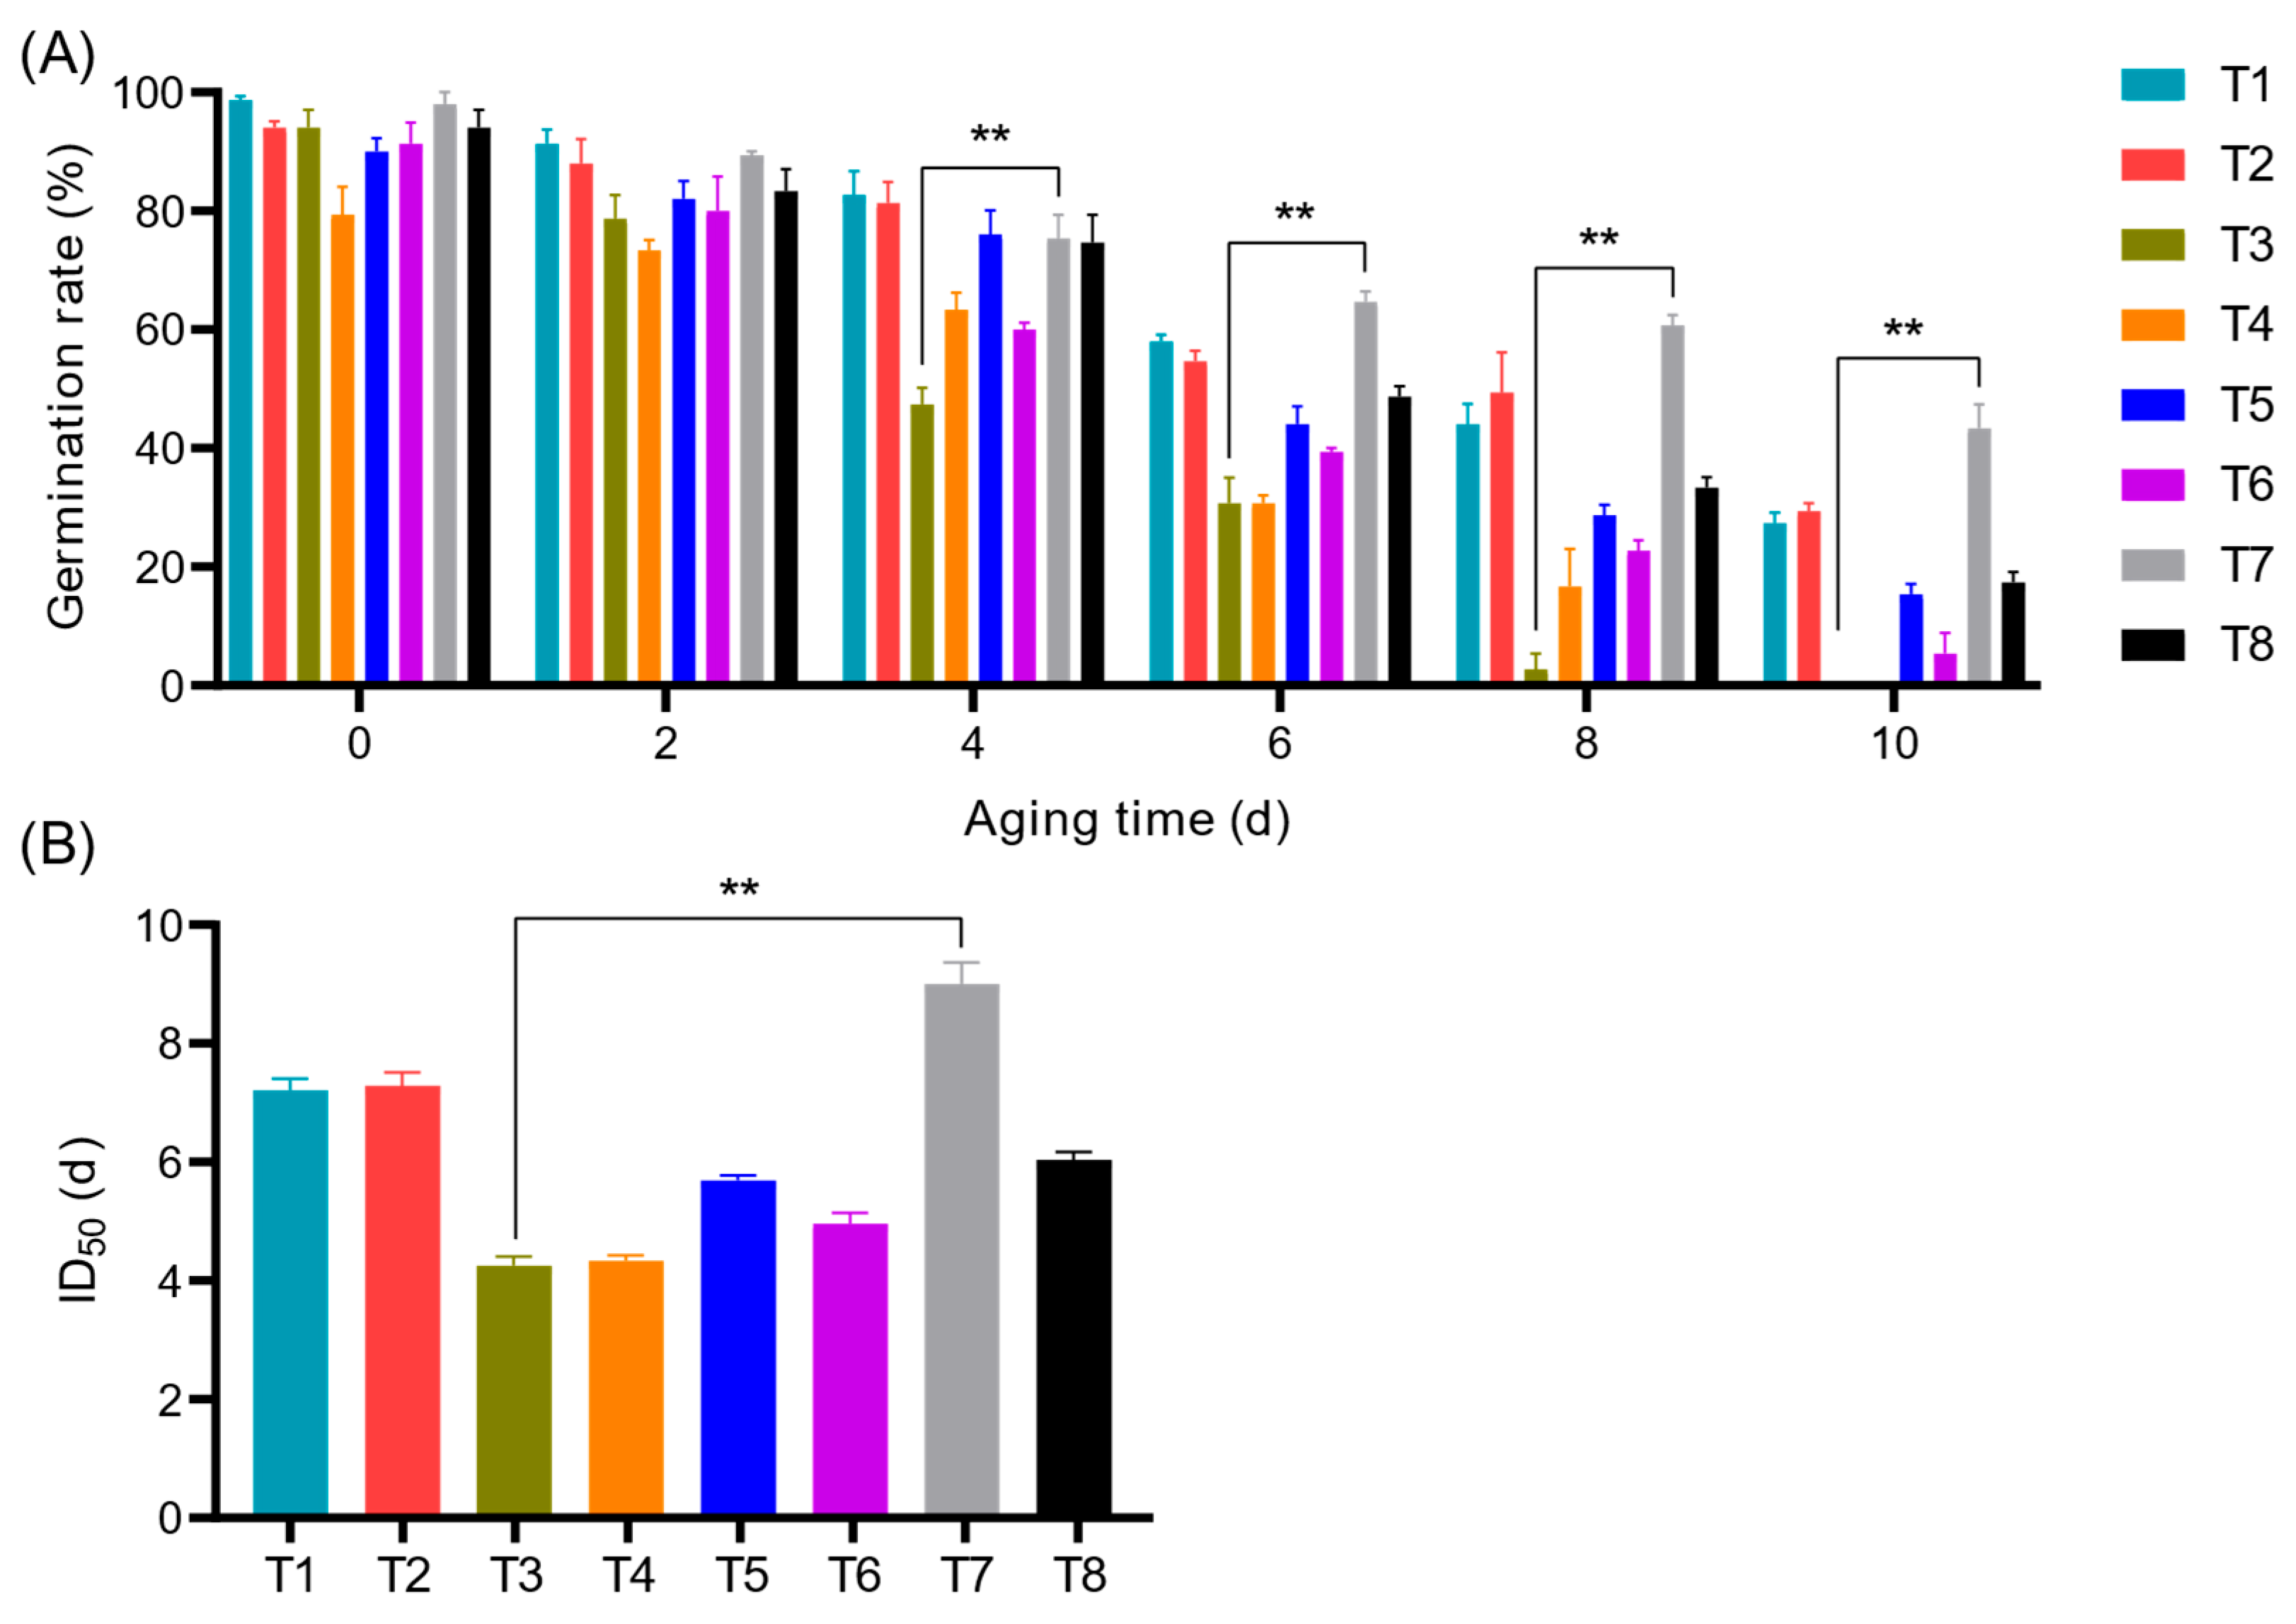
To screen for HL and LL lines, seeds from eight sweet corn inbred lines were subjected to AA treatment, and longevity was evaluated based on germination rate. Prior to aging, the average germination rate across the eight inbred lines was 92.42%. The germination rate of T4 was 79.33%, significantly lower than that of the other lines (Figure 1A). After 4 days of aging, the germination rate of T3 decreased to 47.33%, falling below 50%. By day 6 of aging, the average germination rate of all inbred lines was 46.33%. At this time point of 10 days, the average germination rate further decreased to 17.25%. Germination rates of T3 and T4 dropped to 0.00%, while T7 exhibited the highest germination rate at 43.33%.
Given the variation in initial germination rates among lines, the half inhibition time (ID50), which is defined as the time required for the germination rate to decline to half of its initial value, was introduced. A higher ID50 indicates slower aging and greater seed longevity. The average ID50 for the eight sweet corn inbred lines was 6.10 days. T7 showed the highest ID50 value of 9.01 days, while T3 had the lowest at 4.25 days (Figure 1B). Accordingly, T7 and T3 were selected as representative HL and LL materials, respectively, for subsequent analysis of physiological indicators and transcriptome sequencing.

3.2. Comparison of NA and AA Effects on Seed Longevity

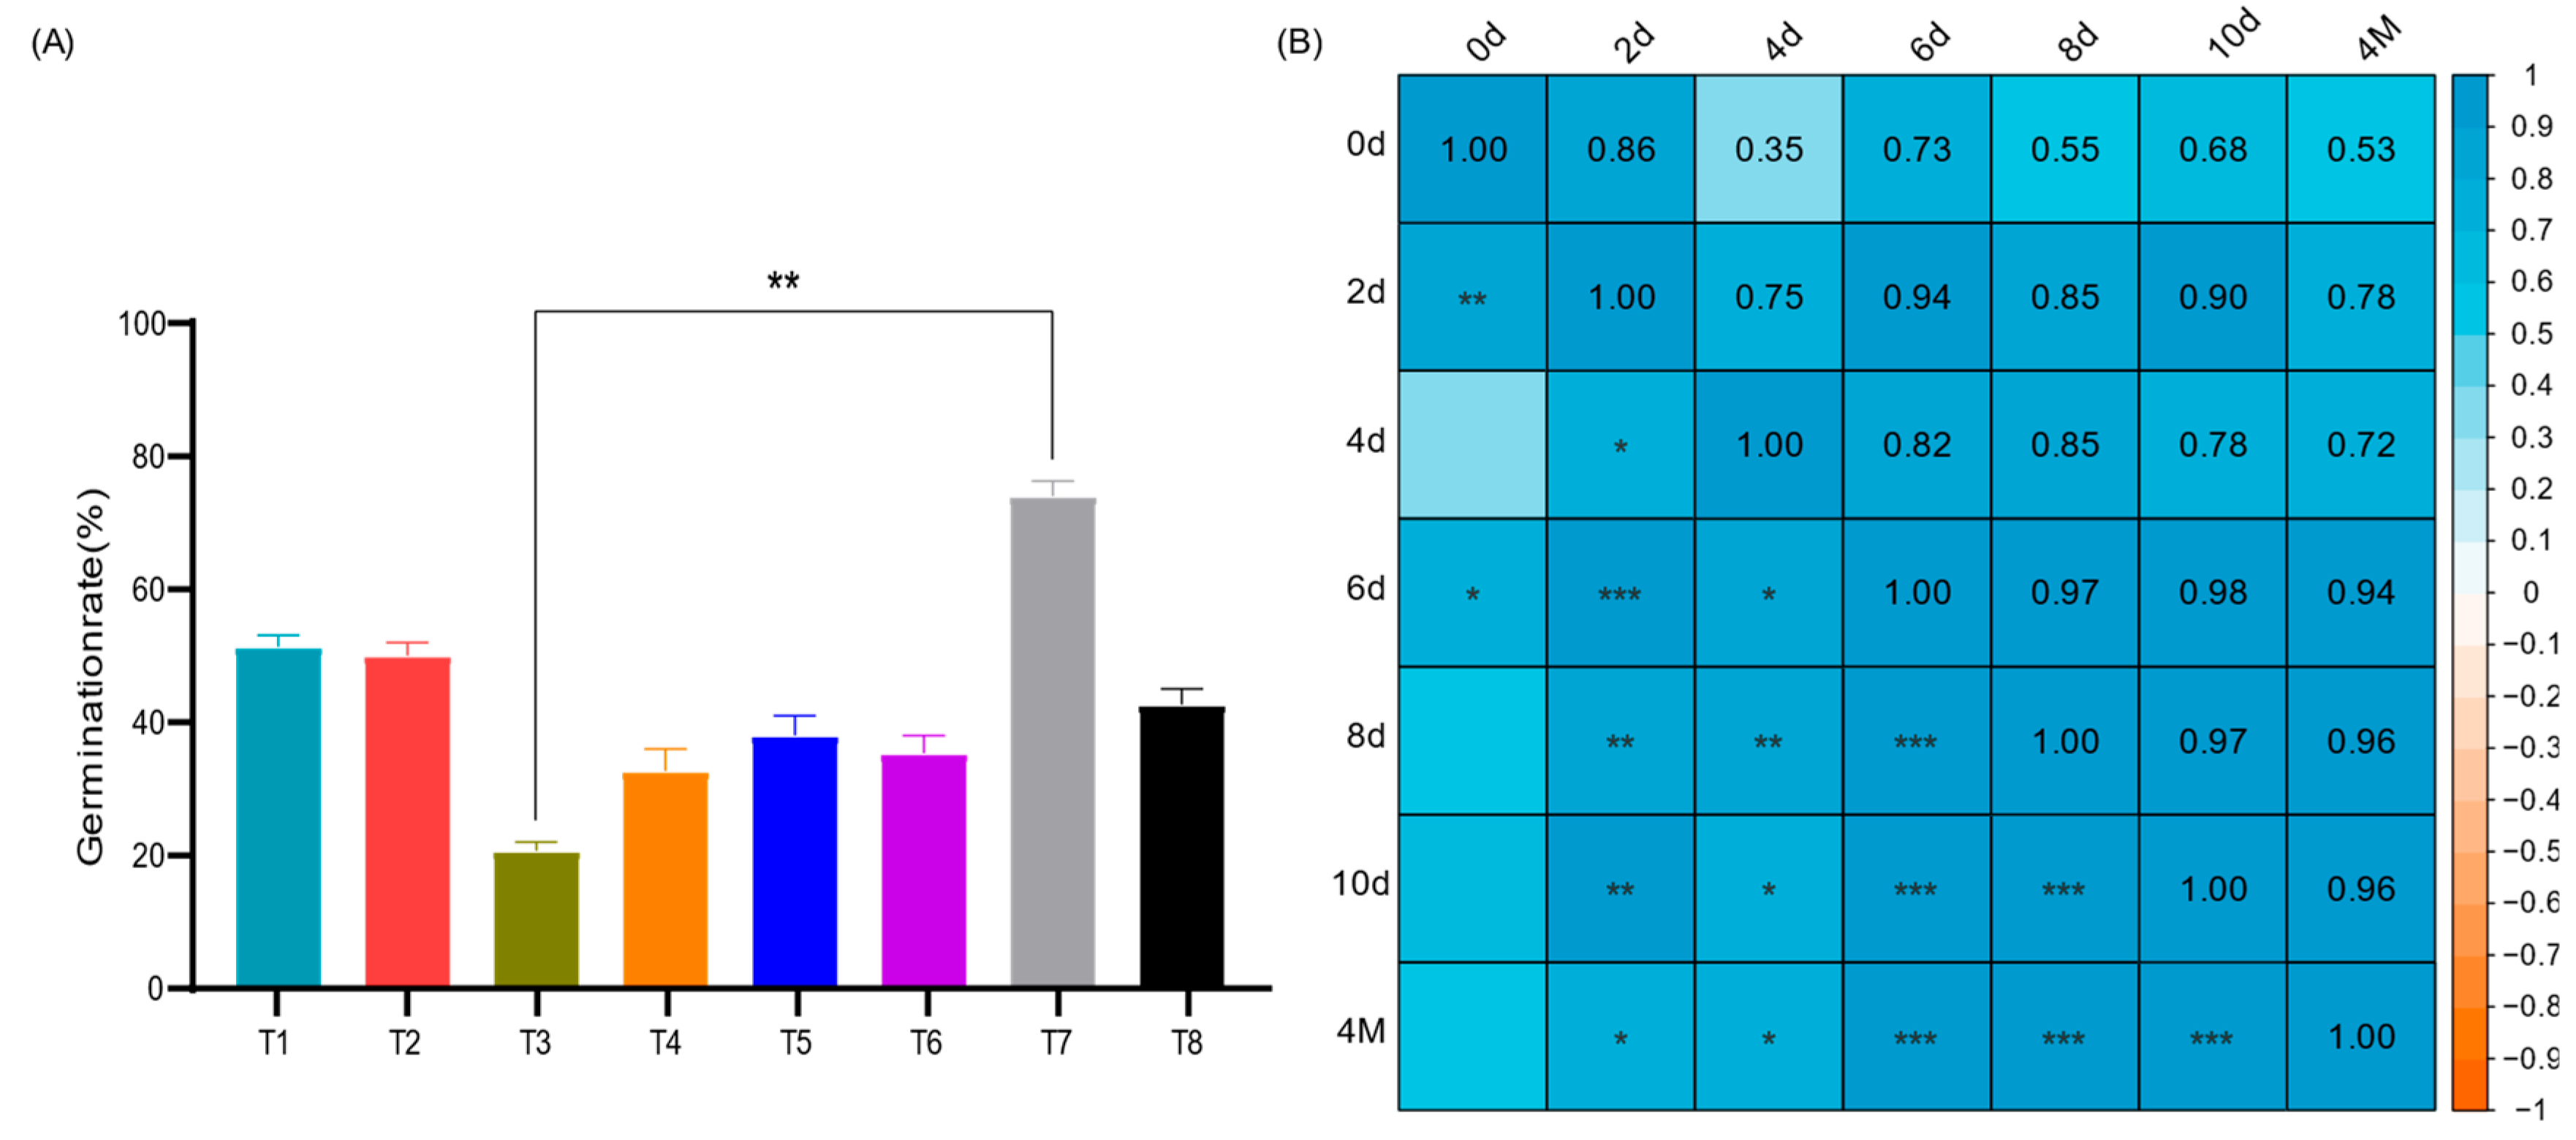
Aging is a natural but time-consuming process. AA can induce similar phenotypic changes within a shorter period [44]. To compare the effects of the two methods, an additional set of seeds underwent NA for four months, after which germination rates were assessed (Figure 2A). After NA, the average germination rate of the eight sweet corn inbred lines was 43.08%. Among them, T7 and T3 exhibited the highest and lowest germination rates, at 74.00% and 20.67%, respectively, with statistically significant differences—consistent with the results obtained under AA treatment. Correlation analysis revealed a strong positive correlation (R = 0.96) between germination rates after four months of NA and those after 8 and 10 days of AA (Figure 2B), indicating that AA for 8–10 days effectively simulated the effects of four months of NA.

3.3. Physiological and Biochemical Analysis of T7 and T3 Seeds Under AA and NA

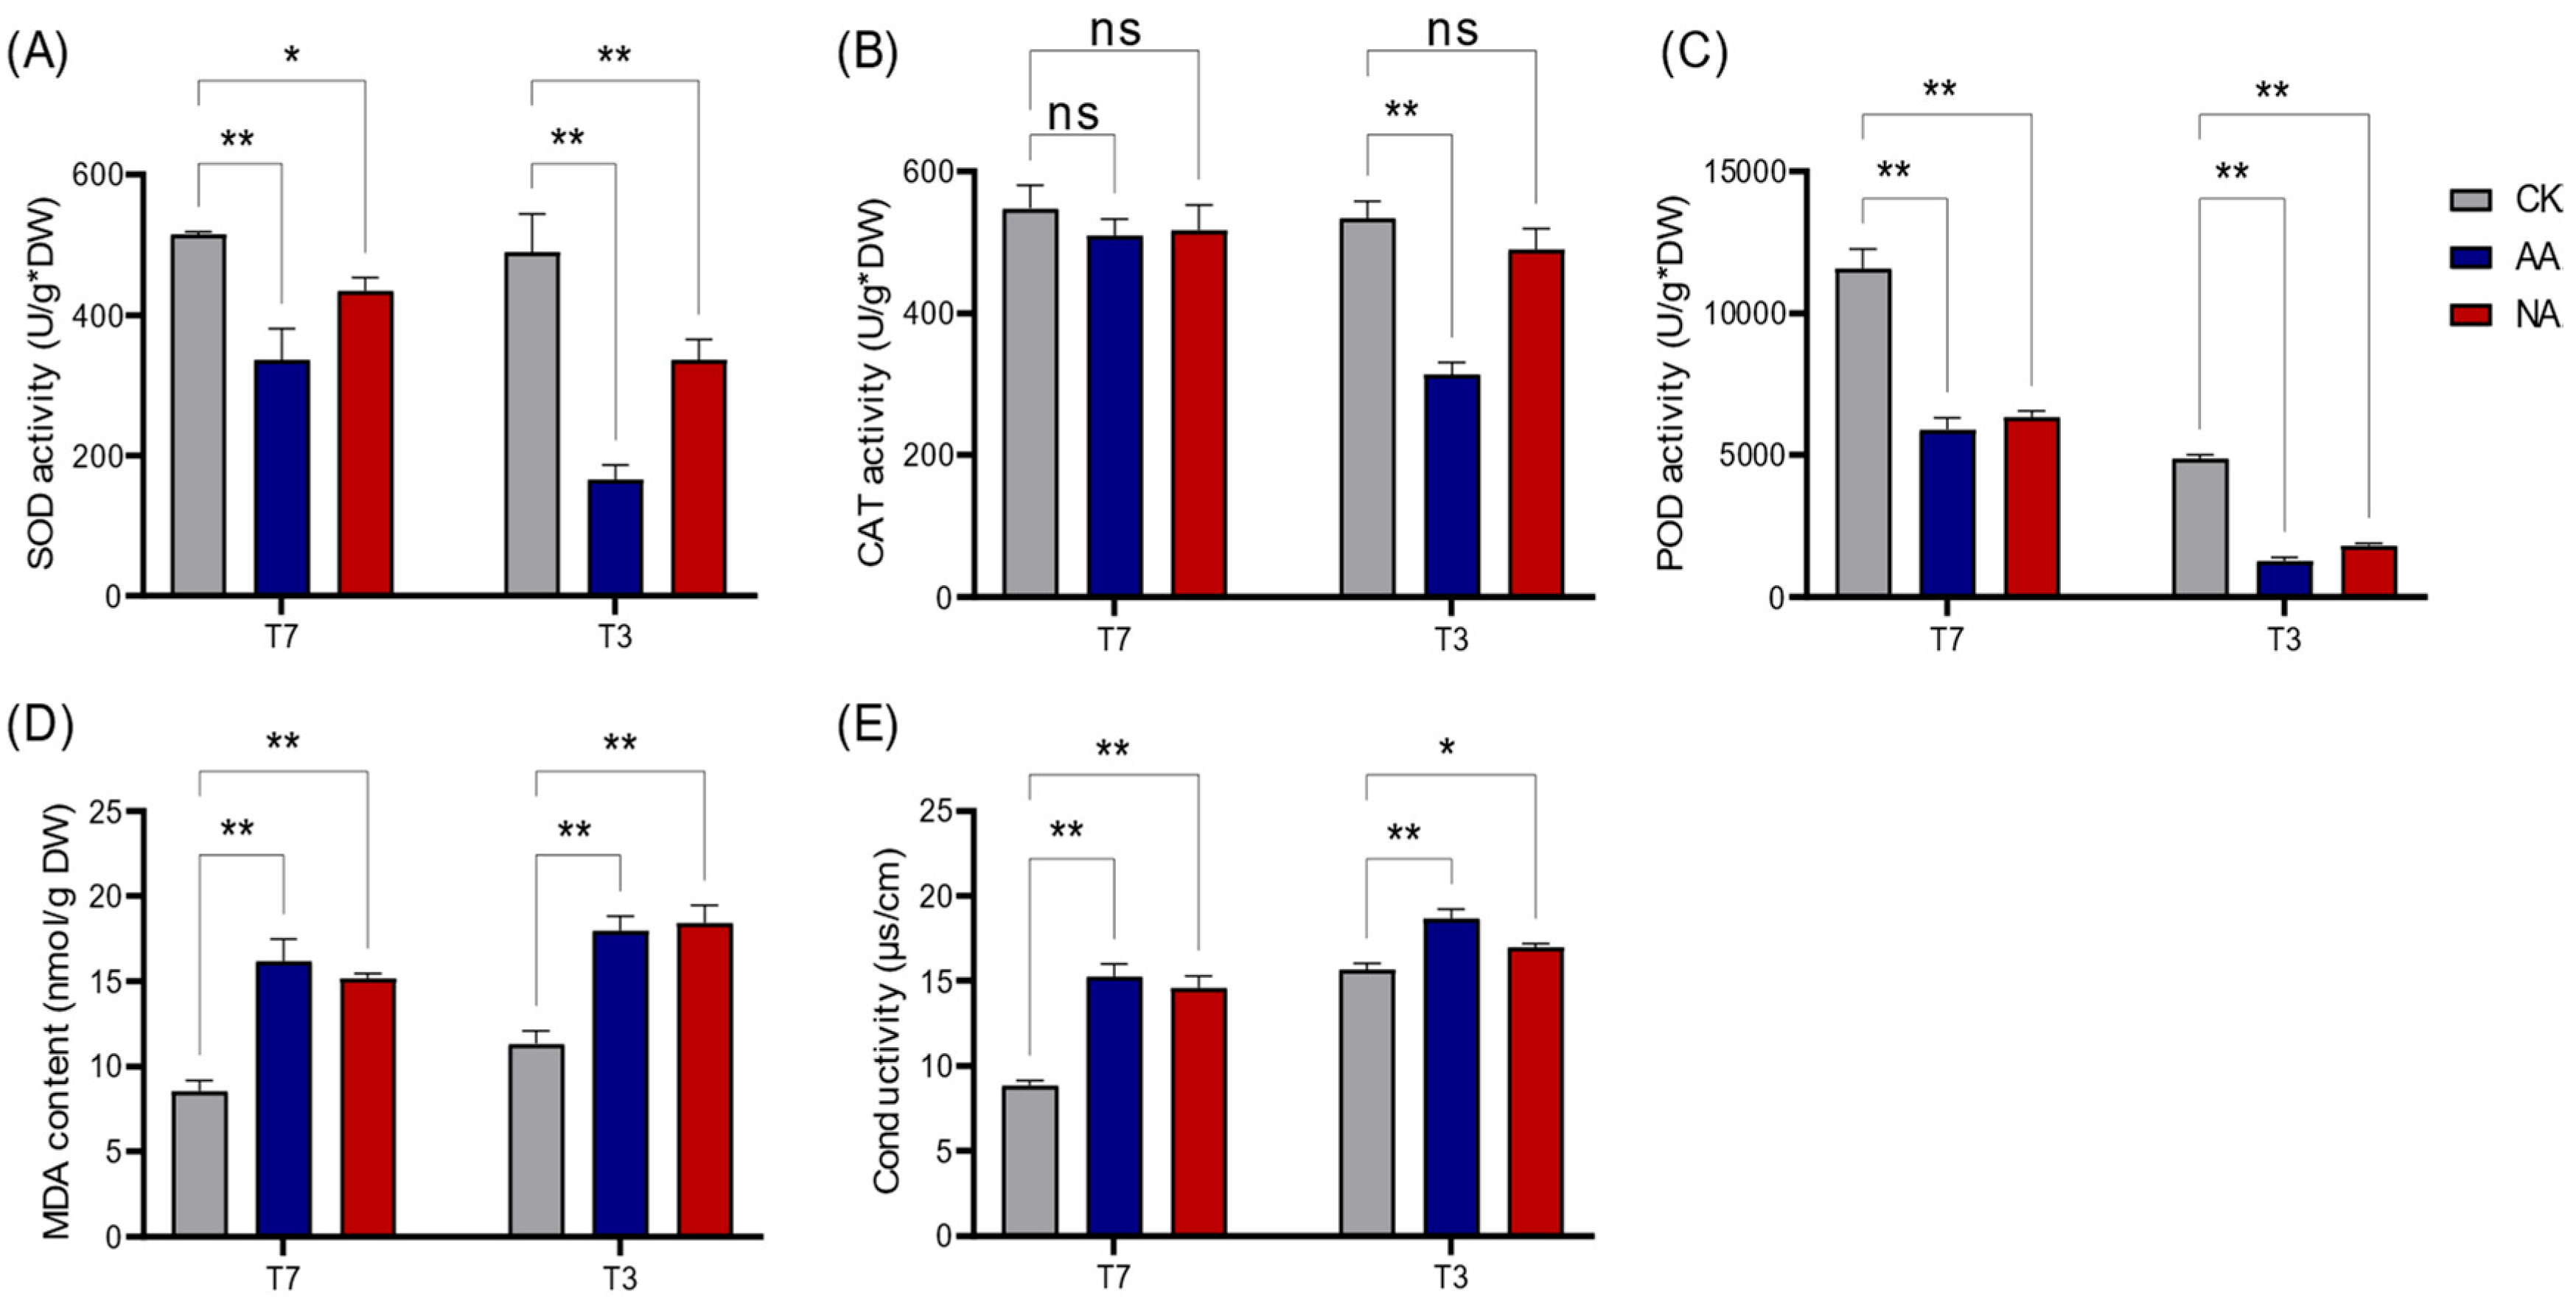
Seeds from T7 and T3 under control conditions (storage at −20 °C), AA for 10 days, and NA for 4 months were analyzed for antioxidant enzyme activities, malondialdehyde (MDA) content, and electrical conductivity. Both AA and NA treatments significantly reduced the activities of SOD and POD, with the lowest SOD activity observed in seeds after 10 days of AA (Figure 3A,B). The effect on CAT activity was less pronounced; only T3 seeds subjected to 10 days of AA showed a significant decrease compared to the control (Figure 3C). MDA, a characteristic product of lipid peroxidation during seed aging, increased in both T7 and T3 seeds under AA and NA conditions (Figure 3D). Aging also caused electrolyte leakage, resulting in increased conductivity of the seed soak solution. Conductivity was elevated in both T7 and T3 after aging, with a greater increase observed in T3 than in T7 (Figure 3E), a trend consistent with the changes in MDA content.
We also compared the physiological indices between the aging-tolerant line T7 and the aging-sensitive line T3 under Ctrl, AA, and NA treatments (Figure S1). Under Ctrl conditions, POD activity was significantly higher in T7 than in T3, whereas MDA content and electrical conductivity were lower. Following artificial aging, the activities of three antioxidant enzymes—SOD, CAT, and POD—were higher in T7 than in T3, while electrical conductivity showed the opposite trend; no significant difference in MDA content was observed. Under natural aging, SOD and POD activities remained significantly higher in T7 than in T3, whereas MDA content and electrical conductivity were lower in T7.

3.4. Evaluation of Transcriptome Data

Given that the germination rate after 10 days of AA was significantly correlated with that after 4 months of NA (Figure 2B), appropriate AA was considered a suitable method to simulate long-term NA effects. Therefore, RNA-seq was performed on seeds of T7 and T3 under control (Ctrl), AA (10 days), and NA (4 months) conditions (Table S2). Quality assessment of the sequencing data showed that raw reads ranged from 3.6 to 6.5 Gb per sample. After quality control, clean reads (3.5–5.3 Gb) were obtained, with Q30 scores all above 93% (mean 94.62%), indicating high base-call accuracy. Alignment to the reference transcriptome yielded total mapped reads ranging from 73.79% to 89.39% (mean 85.91%), of which uniquely mapped reads accounted for 70.84% to 96.35% (mean 92.40%). These results confirm the high quality of the transcriptome data, making them suitable for subsequent gene expression and functional analyses.
Principal component analysis (PCA) further characterized the gene expression patterns among samples (Figure S2 and Table S3). The first principal component (PC1) explained 59.2% of the expression variance, and the second (PC2) explained 14.6%, together covering approximately 73.8% of the total variation, effectively reflecting overall differences between samples. Biological replicates within the same treatment group clustered closely, indicating high reproducibility of gene expression patterns within groups.

3.5. Analysis of DEGs Among Different Aging Treatments

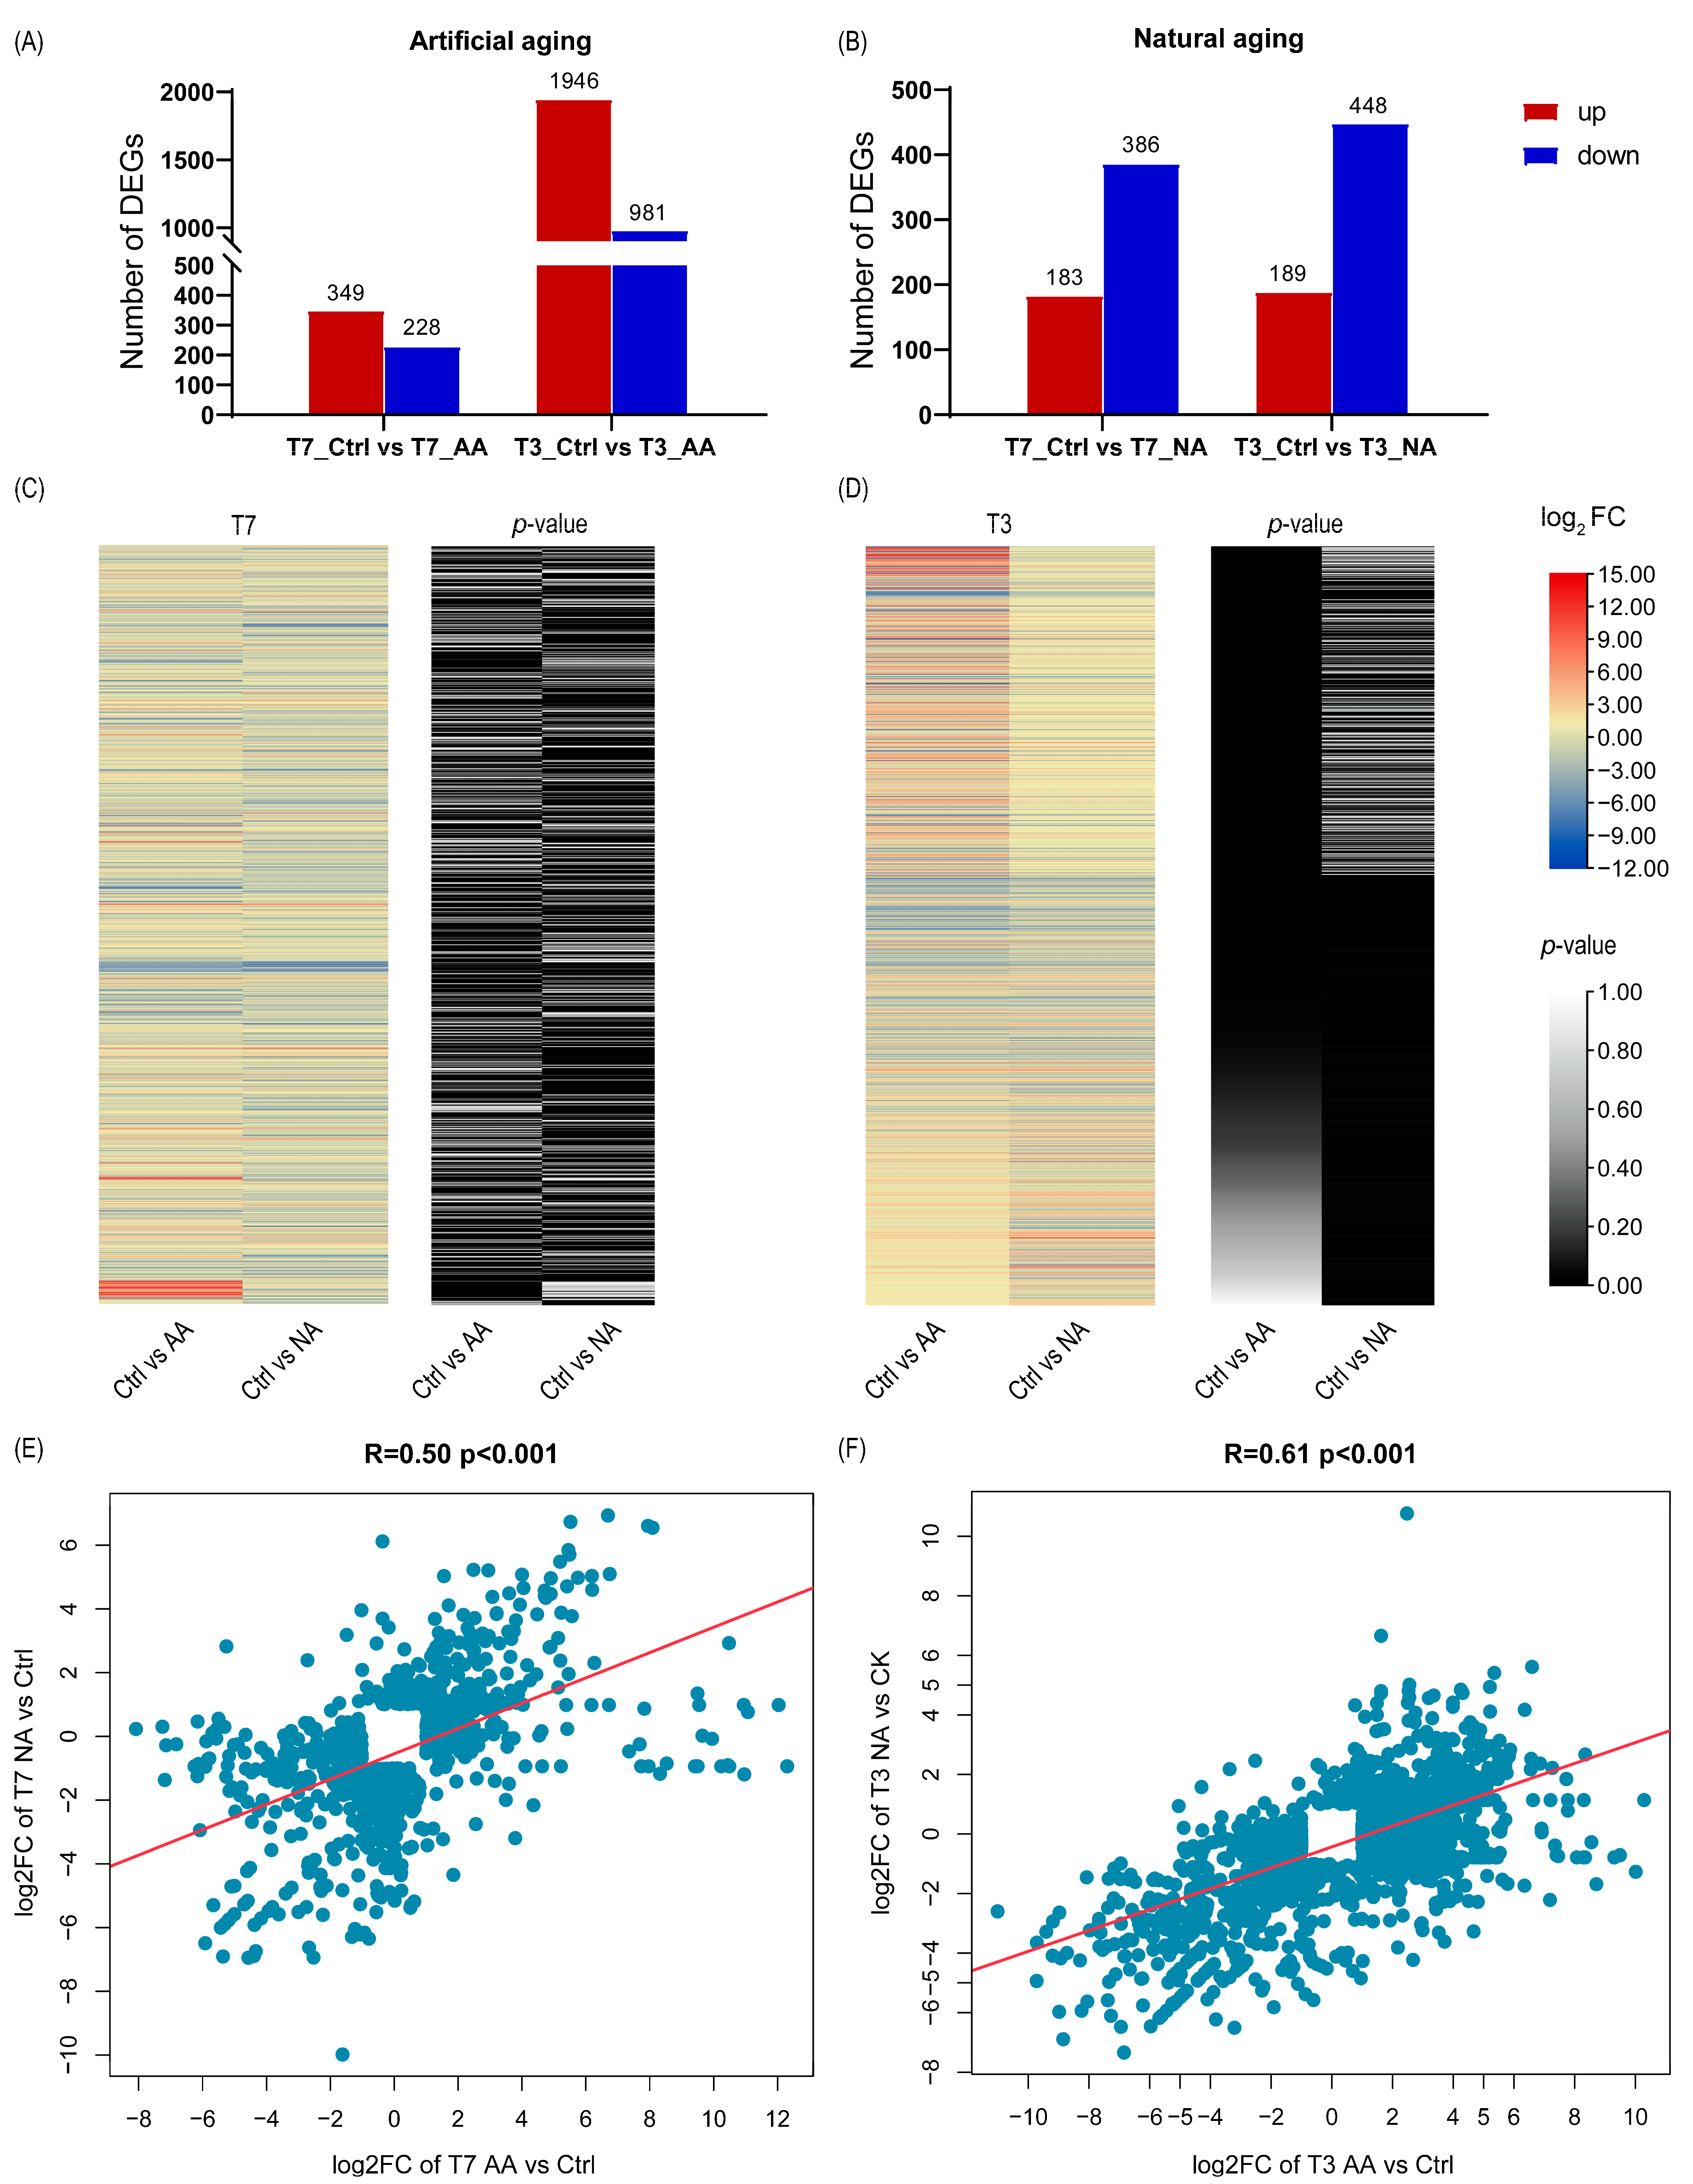
The number of DEGs in sweet corn seeds varied with both treatment type and aging duration. Under AA, 349 up-regulated and 228 down-regulated DEGs were identified in T7, whereas a significantly larger number—1946 up-regulated and 981 down-regulated DEGs—were detected in T3 (Figure 4A, Table S4). Under NA, 183 up-regulated and 386 down-regulated DEGs were found in T7, whereas T3 showed 189 up-regulated and 448 down-regulated DEGs (Figure 4A and Table S4).
Heatmap analysis revealed distinct clustering of DEG expression patterns in both T7 and T3, with similar expression trends between AA and NA treatments, indicating a consistent transcriptional response to different aging methods (Figure 4C,D). Correlation analysis of expression changes between AA and NA showed a moderate positive correlation in T7 (R = 0.50, p < 0.001; Figure 4E) and a stronger correlation in T3 (R = 0.61, p < 0.001; Figure 4F). These results demonstrate that both AA and NA induce significant transcriptomic responses in sweet corn seeds, with generally consistent regulatory trends, although the degree of correlation between the two aging methods varies slightly between the two lines.

3.6. Enrichment of DEGs Between Different Aging Treatments in HL and LL

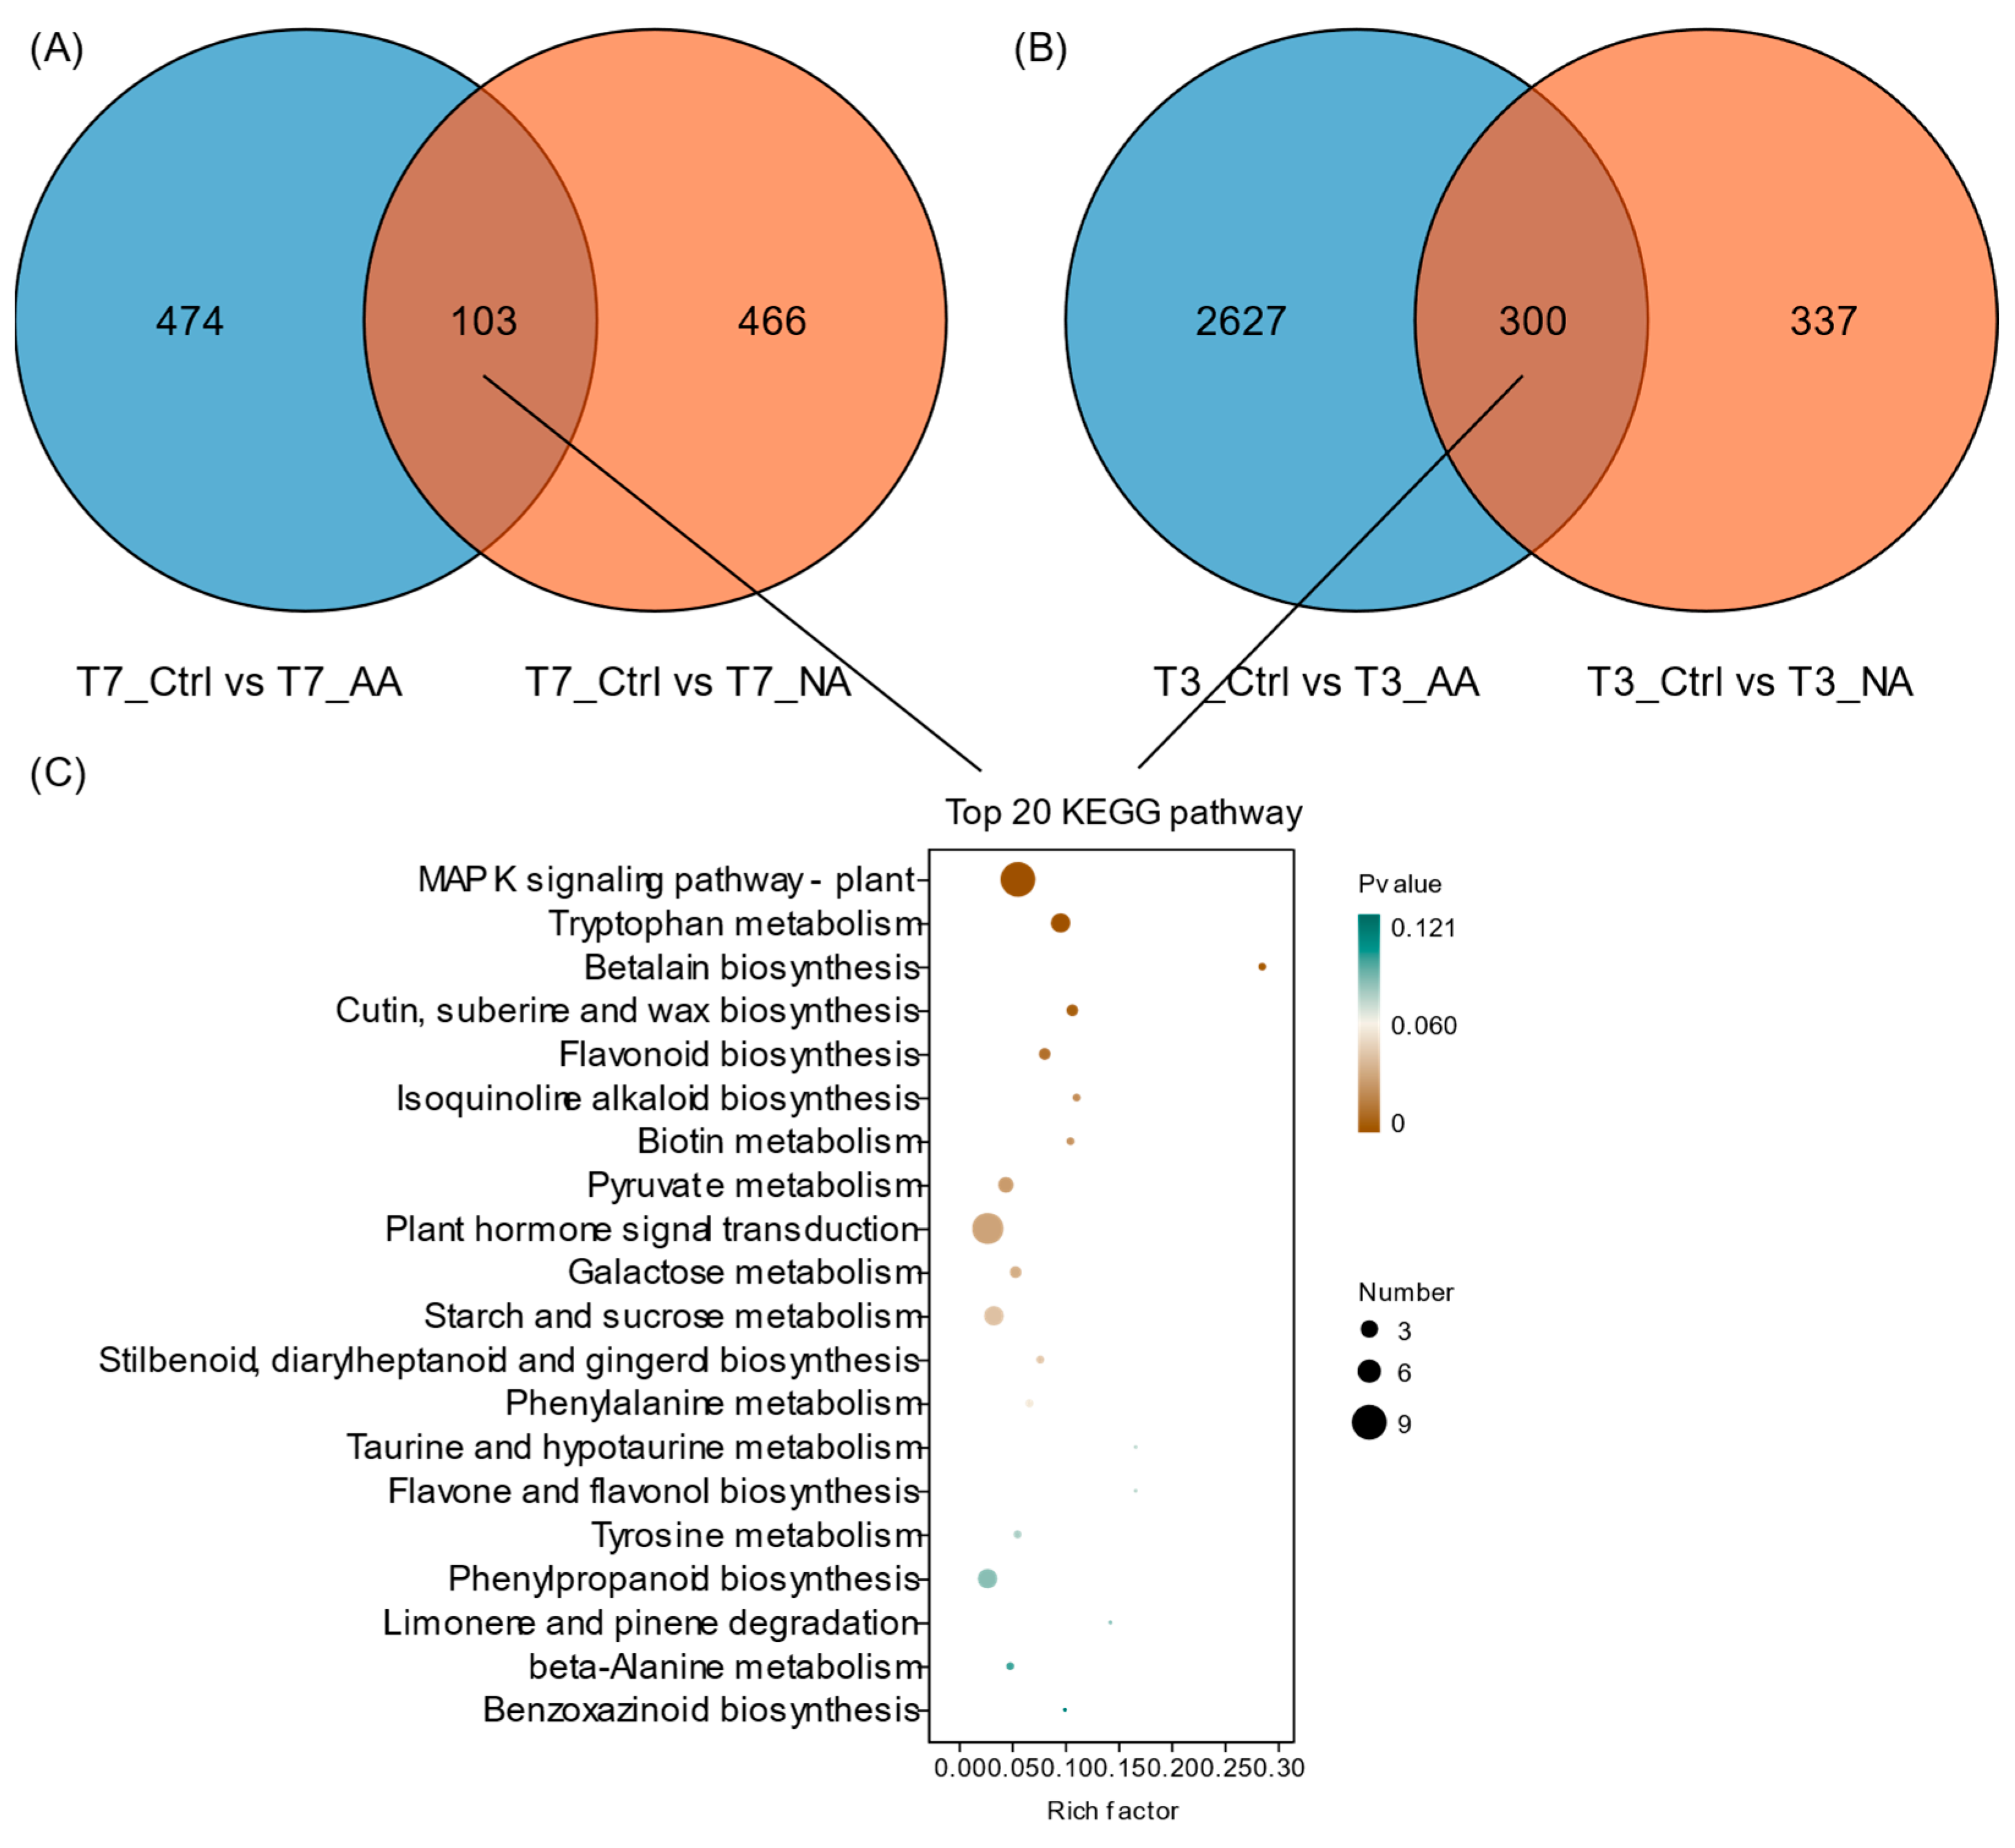
Differentially expressed genes between different aging treatments partially overlapped between materials. In T7, 103 DEGs were shared between AA (T7_Ctrl vs. T7_AA) and NA (T7_Ctrl vs. T7_NA), whereas 474 and 466 DEGs were specific to AA and NA, respectively (Figure 5A). In T3, the number of shared DEGs increased to 300, with 2627 and 337 DEGs specific to AA and NA, respectively (Figure 5B), suggesting a higher degree of transcriptional overlap in T3 under different aging treatments. The common DEGs between materials and treatments included 6 genes in the intersection and 397 genes in the union (Table S5).
KEGG enrichment analysis of the 397 union genes revealed significant enrichment in the plant MAPK signaling pathway (zma04016) and tryptophan metabolism pathway (zma00380) (Figure 5C). This suggests that zma04016 plays a key role in signal transduction during both AA and NA in sweet corn seeds, whereas tryptophan metabolism may be involved in secondary metabolism and stress responses, collectively mediating seed adaptation to aging stress. GO enrichment analysis of these DEGs showed significant enrichment in three categories: nutrient reservoir activity (GO:0045735), apoplast (GO:0048046), and extracellular region (GO:0005576) (Table S6 and Figure S3). The differential expression of nutrient reservoir activity-related genes may contribute to the mobilization of storage substances during seed aging.

3.7. Identification and Enrichment of DEGs Between HL and LL

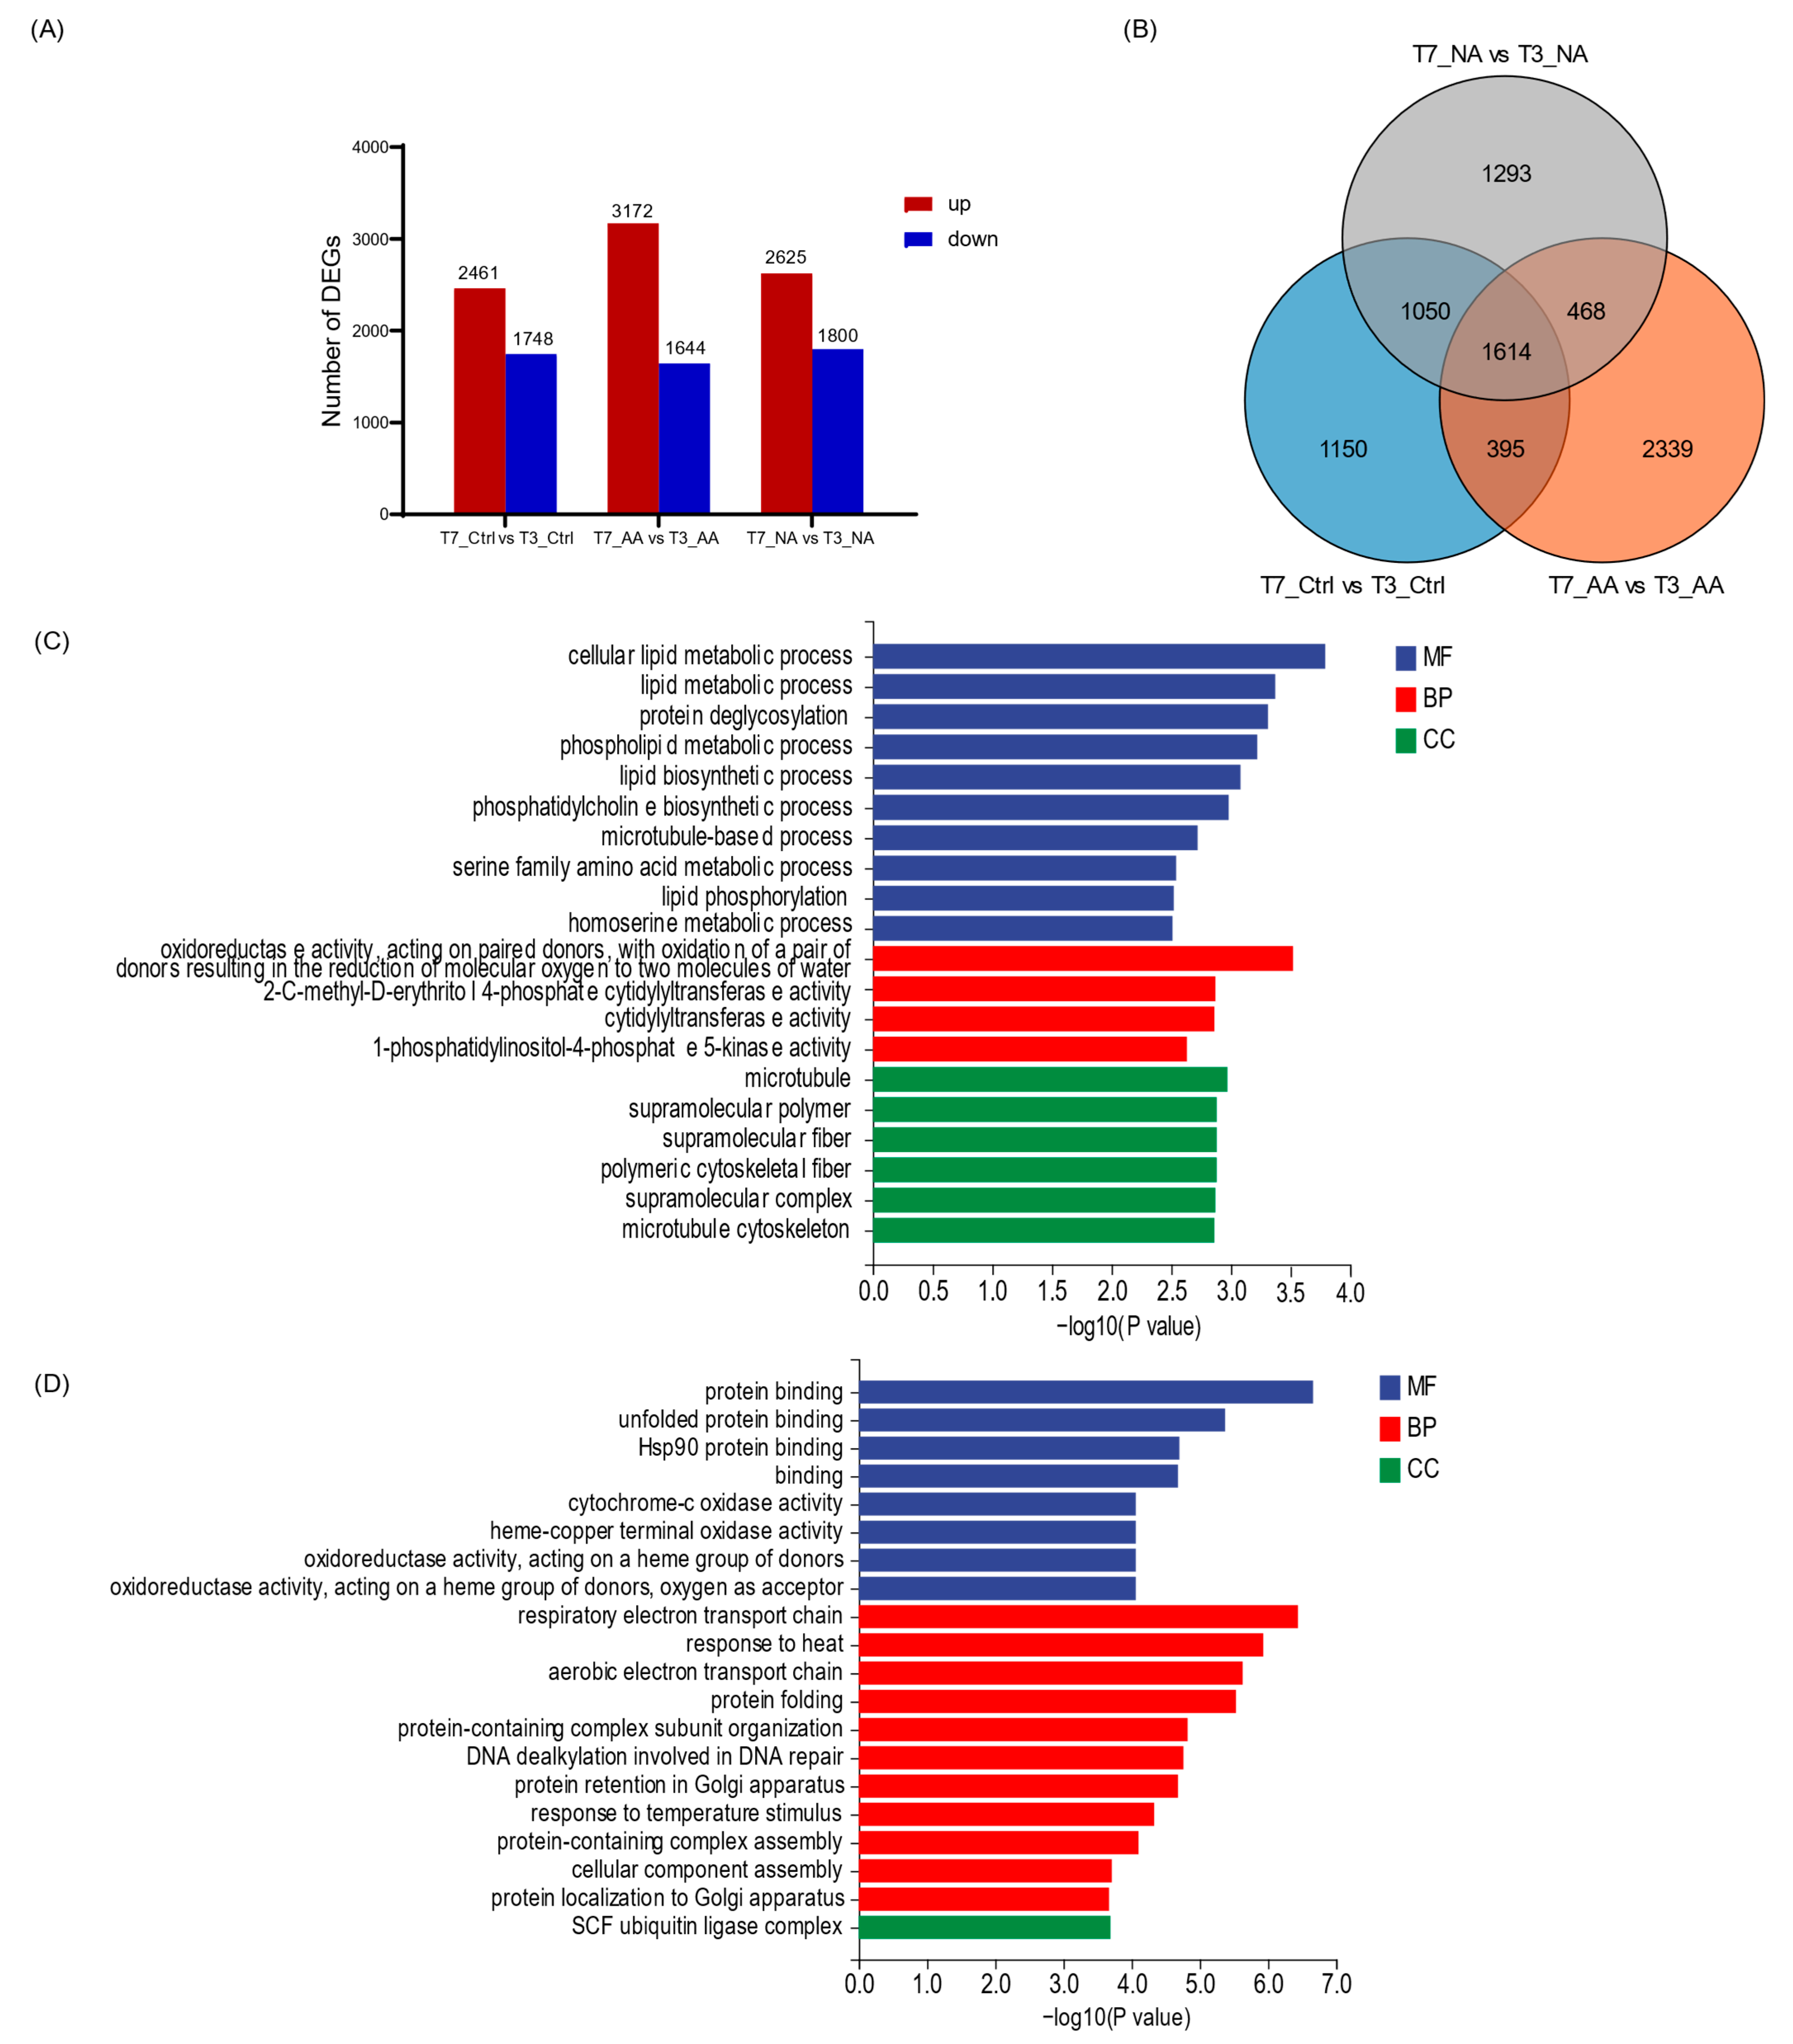
The number of DEGs between T7 and T3 varied across treatment groups (Figure 6A, Table S7). Comparing T7_Ctrl vs. T3_Ctrl, 2461 up-regulated and 1746 down-regulated DEGs were identified. T7_AA vs. T3_AA showed the highest number of up-regulated DEGs (3172) with 1644 down-regulated DEGs. T7_NA vs. T3_NA contained 2625 up-regulated and 1903 down-regulated DEGs. Venn diagram analysis revealed partial overlap of DEGs among the three comparison groups (Figure 6B): 1614 DEGs were common to all three, while T7_NA vs. T3_NA had 1293 unique DEGs, and T7_AA vs. T3_AA had the highest number of unique DEGs (2339), which may represent treatment-specific response genes in different sweet corn inbred lines.
GO enrichment analysis of the 1293 and 2339 unique gene sets showed no significantly enriched GO terms for the NA-specific DEGs (Figure 6C). In contrast, the AA-specific DEGs were significantly enriched in 9 GO terms, including protein binding (GO:0005515), respiratory electron transport chain (GO:0022904), response to heat (GO:0009408), aerobic electron transport chain (GO:0019646), and protein folding (GO:0006457) (Figure 6D). Enrichment of respiratory and aerobic electron transport chain terms may relate to adaptive adjustments in energy metabolism under AA. Enrichment of protein folding, unfolded protein binding, and Hsp90 binding suggests induction of protein damage repair responses. Enrichment of DNA dealkylation (GO:0006307) reflects regulatory mechanisms for maintaining genome stability during AA. KEGG pathway analysis of these two gene sets did not yield significantly enriched pathways.

3.8. Identification of Longevity-Related Long-Lived mRNAs

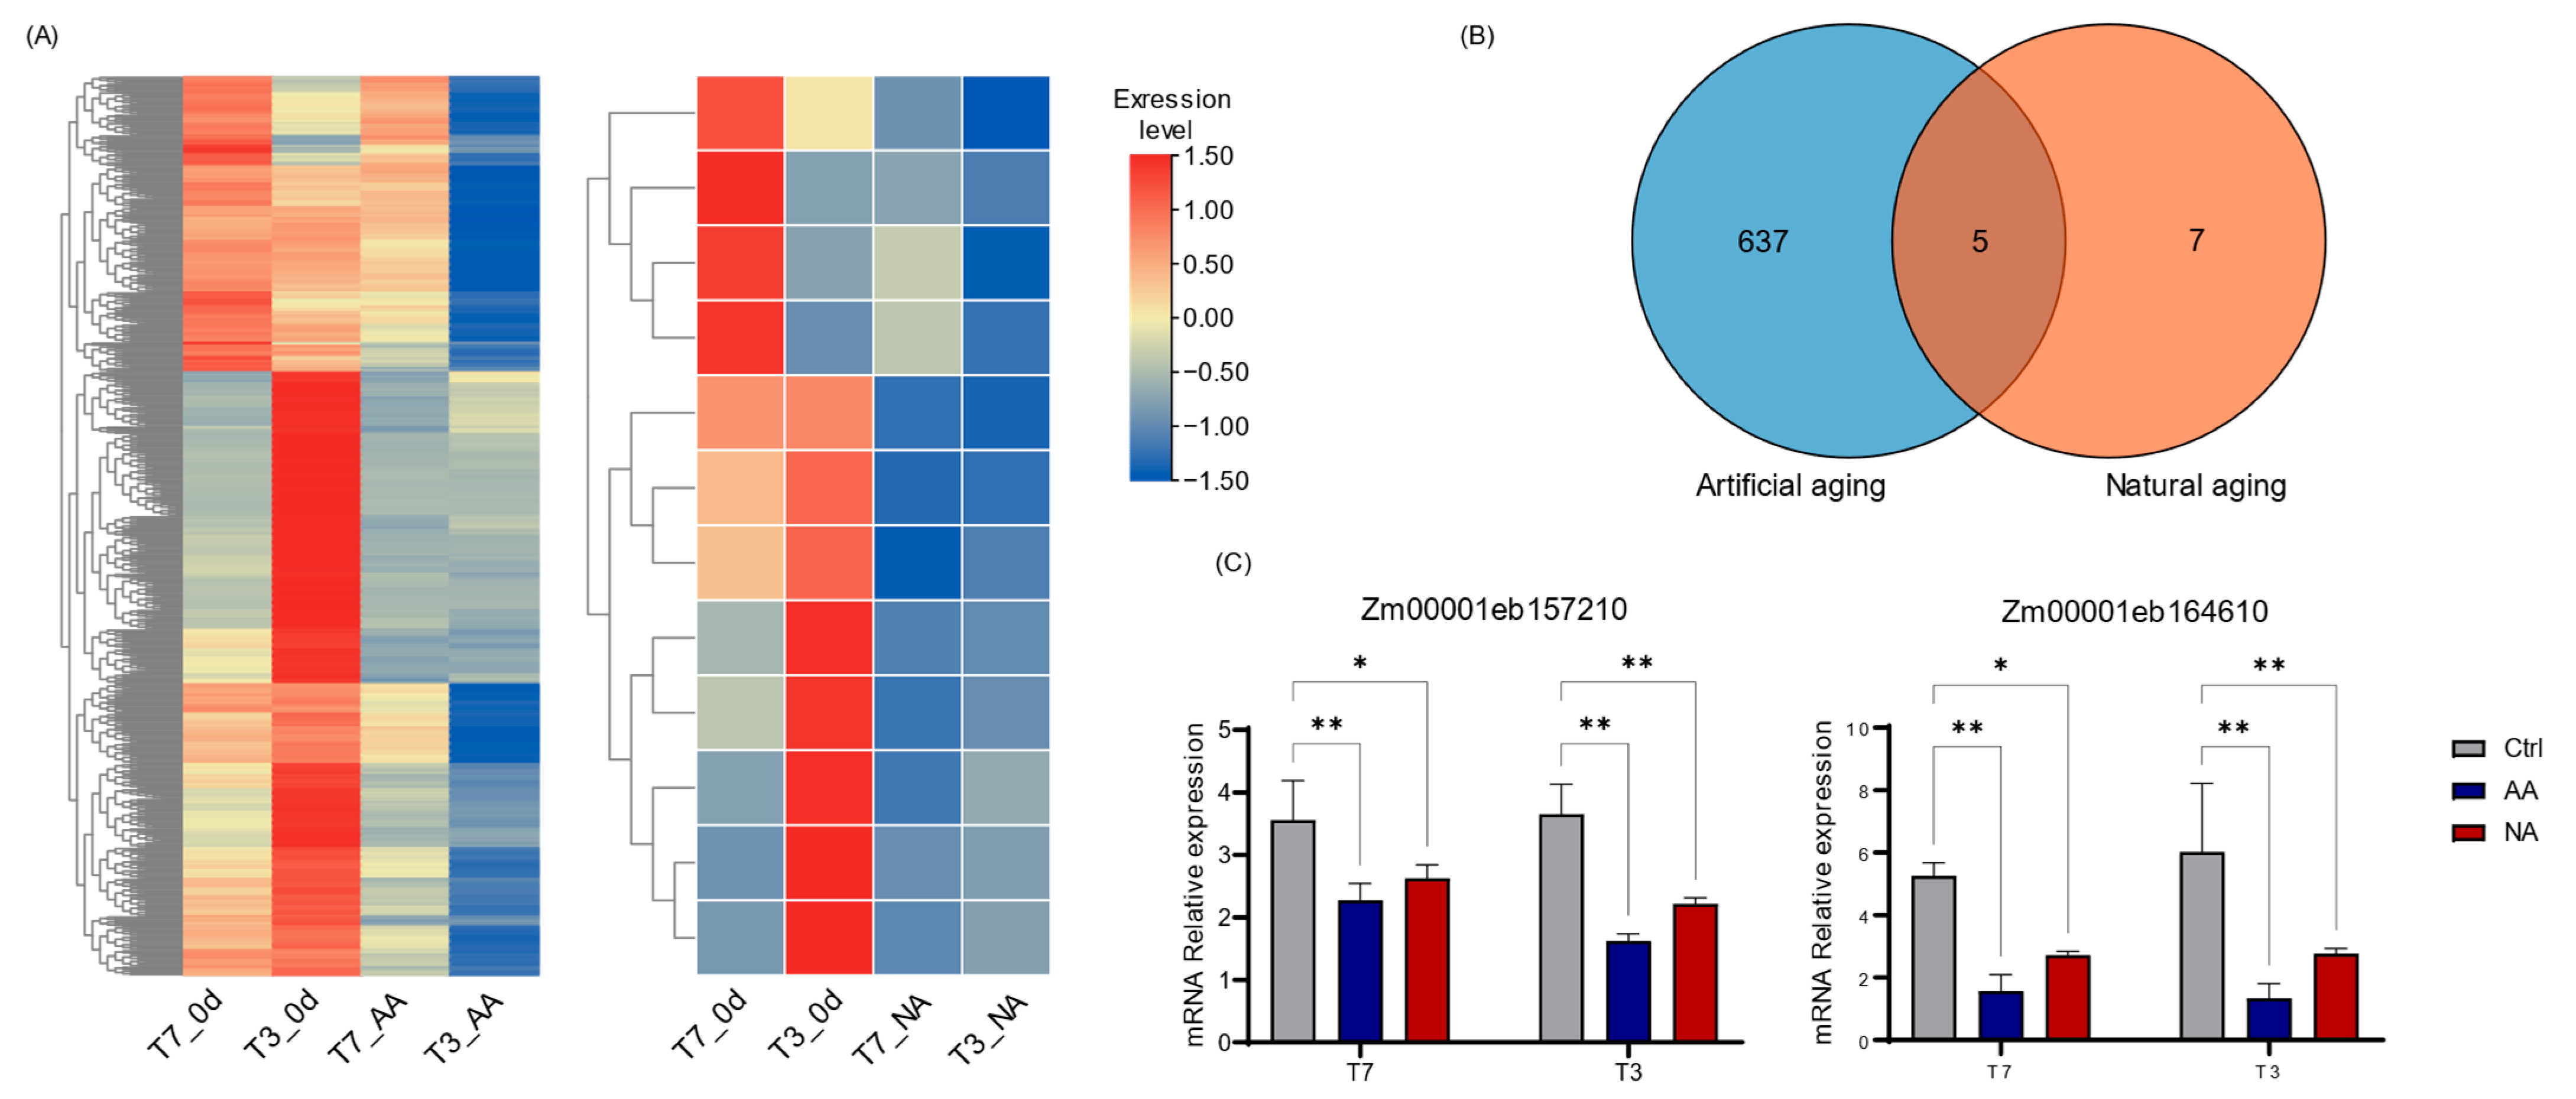
Previous studies have reported that RNA stability in embryos is closely associated with seed longevity [45], as long-lived mRNAs play crucial roles in protein synthesis during the early stages of germination. Since most transcripts are degraded during aging, we followed methods from Wang et al. [25] to identify long-lived mRNAs, analyzing their expression patterns and core genes under AA and NA treatments. In both T7 and T3, the expression profiles of long-lived mRNAs in control, AA, and NA groups showed clear clustering patterns, indicating that aging significantly altered the transcript expression patterns in sweet corn seeds (Figure 7A). A total of 642 long-lived mRNAs were identified under AA, while only 12 were identified under NA, with only 5 shared between the two treatments (Figure 7B and Tables S8 and S9). This suggests limited overlap between AA- and NA-induced transcriptomes and indicates that AA has a broader impact on the seed transcriptome.
We performed GO and KEGG enrichment analyses on 637 AA-specific long-lived mRNAs (Figure S4A,B). In the GO analysis, significant enrichment pathways were observed for the following terms: nutrient reservoir activity (GO:0045735), positive regulation of transcription by RNA polymerase II (GO:0045944), and cellular carbohydrate metabolic process (GO:0044262). The KEGG pathway analysis revealed significant enrichment pathways in starch and sucrose metabolism (zma00500) and tryptophan metabolism (zma00380). Five common long-lived mRNAs were selected for qRT-PCR validation. Only two genes, Zm00001eb157210 and Zm00001eb164610, showed significant differences between aging treatments and Ctrl (Figure 7C), while among the other three genes, only Zm00001eb335070 showed a significant difference between AA and Ctrl in T3 (Figure S5). Under AA and NA treatments, no significant differences in the expression levels of these five genes were detected between lines T7 and T3 (Figure S6). These results suggest that the down-regulation of these two mRNAs may be associated with aging responses in sweet corn seeds.

4. Discussion

Seed longevity is a critical trait in seed biology and agricultural sciences, with profound implications for germplasm conservation, crop yield improvement, and food security [46]. In this study, ID50 was introduced as a quantitative metric to minimize the interference caused by differences in initial germination rates among materials when assessing seed longevity [47]. ID50 is defined as the time required for the germination rate to decline to half of its initial value. A higher ID50 indicates greater resistance to aging and, consequently, longer seed longevity. This metric provides a standardized benchmark for comparison, allowing a more accurate characterization of seed deterioration dynamics under artificial accelerated aging conditions [25,47]. Using ID50, we successfully identified representative high-longevity (HL) and low-longevity (LL) sweet corn inbred lines, T7 (ID50 = 9.01 days) and T3 (ID50 = 4.25 days), respectively, thereby establishing a reliable foundation for subsequent physiological and transcriptomic analyses.
Both AA and NA treatments in this study significantly reduced the activities of SOD and POD, with SOD activity reaching its lowest level in seeds subjected to 10 days of AA treatment. This suggests that the aging process compromises the function of the antioxidant defense system, leading to an accelerated accumulation of reactive oxygen species (ROS). This observation is consistent with the established mechanism of enzyme inactivation and oxidative stress during seed aging [12,48]. In contrast, CAT activity was relatively stable, showing a significant decrease only in the artificially aged T3 line compared to its control. This finding partially differs from a report by Wang et al. [15], in which seed aging significantly reduced the activities of both SOD and CAT, while changes in POD activity were detected specifically on the sixth day of aging. This discrepancy suggests that antioxidant enzyme responses to seed aging may be genotype dependent. A significant increase in MDA content confirmed enhanced lipid peroxidation, directly reflecting severe membrane lipid damage and cellular oxidative stress [3,49]. Concurrently, the elevated electrical conductivity indicated a loss of membrane integrity and increased electrolyte leakage. The consistent trends between MDA content and conductivity further support the conclusion that membrane system damage is a key physiological hallmark of seed aging [6]. The larger increase in conductivity observed in the T3 genotype compared to T7 suggests inherent differences in aging sensitivity between genotypes. Following AA treatment, significant differences in the activities of all three antioxidant enzymes were observed between T7 and T3. In contrast, NA resulted in changes in two of these enzymes. Regarding MDA content and electrical conductivity, more pronounced differences between T7 and T3 were detected after NA treatment. These results collectively indicate that the AA treatment exerts a greater impact on the seed’s antioxidant system, whereas the NA process leads to a stronger accumulation of aging-related damage.
This study revealed that the 397 genes common to both AA and NA across the two materials were significantly enriched in the plant MAPK signaling pathway (zma04016) and the tryptophan metabolism pathway (zma00380). As a highly conserved signaling module, the MAPK cascade plays a crucial role in various plant stress and hormone responses, regulating oxidative stress responses and participating in osmotic stress signaling in coordination with ABA [50,51]. These transcriptional alterations are tightly linked to these physiological and biochemical changes in HL and LL lines, and the reduced SOD/POD activities in T3, explaining its higher MDA accumulation and electrolyte leakage (Figure 3). During seed aging, this pathway is likely involved in maintaining cellular homeostasis and modulating the aging process. The enrichment of the tryptophan metabolism pathway points to its role in stress regulation through the synthesis of secondary metabolites. Tryptophan is a precursor of the plant hormone indole-3-acetic acid (IAA), and alterations in its metabolism may influence the balance of endogenous hormones in seeds [9]. Furthermore, melatonin, a bioactive molecule derived from this pathway, has been shown to alleviate aging-related stress and enhance the vigor of aged seeds [11,49].
Respiration is a core physiological activity during seed storage, and its intensity directly influences storage stability and longevity. Our analysis revealed that the 2339 DEGs unique to the AA group (T7_AA vs. T3_AA) were significantly enriched in nine GO terms, including the respiratory electron transport chain (GO:0022904) (Figure 6D). The enrichment of genes related to the respiratory electron transport chain suggests that AA may accelerate seed deterioration by interfering with mitochondrial energy metabolism. This finding aligns with the well-documented senescence mechanism, where electron transport chain dysfunction leads to impaired ATP synthesis [52,53]. Concurrently, the enrichment of terms such as protein folding, unfolded protein binding, and Hsp90 binding indicates that AA may trigger an adaptive cellular response mediated by molecular chaperone systems to refold or stabilize damaged proteins [54]. Additionally, the enrichment of DNA dealkylation (GO:0006307) suggests that AA may activate pathways for maintaining genomic stability [55]. In contrast, the 1293 DEGs unique to the NA group (T7_NA vs. T3_NA) did not show significant GO (Figure 6C) or KEGG enrichment, suggesting that NA may involve more complex and coordinated regulation across multiple pathways, or that its gradual nature leads to more diffuse changes in gene expression. These differences highlight the molecular response specificity of AA as an accelerated senescence model, providing an important entry point for elucidating the mechanisms underlying seed deterioration.
Long-lived mRNAs, serving as key carriers of genetic information stored in mature dry seeds, play a central role in the initiation of seed germination and the maintenance of longevity [25]. Our comparative transcriptomic analysis between AA and NA revealed that AA treatment induced differential expression in 642 long-lived mRNAs, whereas NA affected only 12, with a mere 5 genes overlapping between the two conditions (Figure 7B). This indicates that the transcriptional changes in artificially aged seeds are more extensive, likely because the accelerated aging process amplifies molecular damage. KEGG enrichment analysis revealed that AA-specific long-lived mRNAs were significantly enriched in the pathways of starch and sucrose metabolism and tryptophan metabolism (Figure S3). The specific enrichment of associated genes implies that AA treatment may disturb seed carbon homeostasis, potentially affecting the energy supply required for seed germination [3]. The enrichment in tryptophan metabolism might be related to the accumulation of essential amino acids and the regulation of seed storage proteins [4]. GO analysis further supports their significant roles in maintaining seed storage substances, regulating gene expression in response to aging stress, and carbohydrate metabolism [8,26].
Based on expression change-derived degradation patterns, five common long-lived mRNAs were identified. Among these, the expression of the homeobox transcription factor gene Zm00001eb157210 (Homeobox-transcription factor 99) and the metallothionein-like protein gene Zm00001eb164610 (Metallothionein-like protein 1B) was significantly downregulated under both artificial aging (AA) and natural aging (NA) treatments (Figure 7C). Zm00001eb157210, a member of the homeobox (HOX) transcription factor family, may participate in the aging response by reprogramming developmental processes, given the known roles of HOX factors in regulating plant growth, development, and stress responses [56]. Zm00001eb164610, a metallothionein family member, is involved in ROS-mediated signaling pathways and has been associated with enhanced germination in magneto-primed tomato seeds [57], suggesting a potential role in oxidative stress management during aging. Although the other three genes did not reach statistical significance, their expression trends aligned with transcriptomic data (Figure S4). For instance, Zm00001eb335070 encodes Endonuclease 2, which may contribute to DNA repair [58]. Collectively, the coordinated changes in these genes imply that seeds activate multiple pathways to preserve cellular homeostasis during aging. The pronounced downregulation of Zm00001eb157210 and Zm00001eb164610 highlights them as promising candidate genes mediating the aging response in sweet corn seeds.
In this study, seven natural aging (NA)-specific long-lived mRNAs were identified based on expression change-derived degradation patterns. Notably, Zm00001eb353470 (C2C2-GATA transcription factor 32) may enhance antioxidant enzyme synthesis to scavenge reactive oxygen species (ROS), supported by the reported correlation between GATA transcription factors and seed longevity in soybean [59]. Zm00001eb171930 (zein Zd1) encodes a 19 kDa zein protein that accumulates in the endosperm, aligning with evidence that alterations in protein content influence seed longevity in plants [60]. Zm00001eb343530 (Golgin candidate 5) is involved in Golgi apparatus function and regulates vesicular transport, potentially aiding in the repair of cell structures damaged by aging [61]. Collectively, these NA-specific long-lived mRNAs constitute a collaborative regulatory network during natural aging, and their interactions underscore the polygenic basis of seed longevity. Future investigations into the functional mechanisms of these genes will help decipher the molecular network through which long-lived mRNAs modulate seed longevity in sweet corn.

5. Conclusions

This study delineates the phenotypic, physiological, biochemical, and transcriptomic differences in sweet corn inbred lines (T7 and T3) in response to AA and NA. Physiological and biochemical analyses indicated that both aging treatments significantly reduced the activities of SOD and POD, while increasing MDA content and electrical conductivity, with more pronounced membrane damage in the LL line. RNA-seq analysis revealed a high correlation in gene expression trends induced by NA and AA. The union set of DEGs from the AA vs. Ctrl and NA vs. Ctrl comparisons was significantly enriched in the plant MAPK signaling pathway and tryptophan metabolism. Furthermore, five long-lived mRNAs common to both AA and NA treatments were identified, among which Zm00001eb157210 and Zm00001eb164610 were significantly down-regulated. Additionally, seven NA-specific mRNAs were detected, along with three candidate genes potentially associated with seed longevity. These findings suggest their possible roles in regulating seed vigor. Our work provides novel insights into the molecular functions of long-lived mRNAs in sweet corn seed longevity.

Supplementary Materials

The following supporting information can be downloaded at: https://www.mdpi.com/article/10.3390/agronomy16030375/s1, Figure S1: Principal component analysis (PCA) plot of the first two PCs of total DEGs; Figure S2: The top 20 GO enrichments of 397 DEGs after artificial aging and natural aging treatment; Figure S3: The top 20 GO enriched terms and KEGG enriched pathways of 637 AA-specific long-lived mRNAs; Figure S4: qRT-PCR analysis of genes Zm00001eb335070, Zm00001eb286760, and Zm00001eb174960 in T7 and T3 under AA and NA conditions; Figure S5: qRT-PCR analysis of genes Zm00001eb335070, Zm00001eb286760, and Zm00001eb174960 in T7 and T3 under AA and NA conditions. Gene expression was normalized to UBQ7. Data are presented as mean ± standard deviation (n = 3). ns and * indicate no significant difference (p > 0.05) and significant difference (p < 0.05), respectively. Figure S6: The comparison of qRT-PCR analysis of five common genes between T7 and T3 under control, AA and NA conditions. Gene expression was normalized to UBQ7. Data are presented as mean ± standard deviation (n = 3). ns and ** indicate no significant difference (p > 0.05) and highly significant difference (p < 0.01), respectively. Table S1: Primers used for qRT-PCR analysis; Table S2: Summary of read mapping statistics; Table S3: The FPKM values of all expressed genes in each sample; Table S4: Lists of differentially expressed genes (DEGs) in the pairwise comparison of samples in T7 (T7_Ctrl vs. T7_AA and T7_Ctrl vs. T7_NA) and T3 (T3_Ctrl vs. T3_AA and T3_Ctrl vs. T3_NA), respectively; Table S5: The expression levels and descriptions of differentially expressed genes in shared 397 genes of distinct treatment groups in T7 and T3; Table S6: The top 20 GO-enriched terms in shared 397 genes of distinct treatment groups in T7 and T3; Table S7: Lists of differentially expressed genes (DEGs) in the pairwise comparison between T7 and T3 (T7_Ctrl vs. T3_Ctrl, T7_NA vs. T3_NA and T7_AA vs. T7_AA); Table S8: Lists of long-lived mRNA in the pairwise comparison between Ctrl and AA; Table S9: Lists of long-lived mRNA in the pairwise comparison between Ctrl and NA.

Author Contributions

Conceptualization, F.F. and P.L.; Data curation, F.F.; Formal analysis, X.W. and X.G.; Funding acquisition, Z.Z., F.F. and P.L.; Investigation, X.W. and X.G.; Methodology, Y.L. and Z.P.; Project administration, P.L.; Resources, Z.P. and G.L.; Software, F.J. and Q.C.; Supervision, F.J.; Validation, X.G.; Visualization, X.W.; Writing—original draft, Z.Z.; Writing—review and editing, Z.Z. and F.F. All authors have read and agreed to the published version of the manuscript.

Funding

This study was financially supported by the National Natural Science Foundation of China (31871713), the Guangzhou Science and Technology Plan (2025D04J0055), the 2025 Provincial Financial Special Fund (Seed Industry Revitalization Action Project) (2025-NBH-00-001), the Special Program for Key Fields of Natural Sciences in Ordinary Colleges and Universities in Guangdong Province (2023ZDZX4017), and the Special Fund for Rural Revitalization Strategy of Guangdong Province: Seed Industry Revitalization Project (2024-NJS-00-005).

Data Availability Statement

The data presented in this study are openly available in [sweet corn seed aging] at [https://ngdc.cncb.ac.cn/gsa, accessed on 24 December 2025], reference number [CRA035713].

Acknowledgments

We would like to thank Zhoufei Wang for his support in experimental techniques.

Conflicts of Interest

The authors declare no conflicts of interest.

References

  1. Ye, T.; Ma, T.; Chen, Y.; Liu, C.; Jiao, Z.; Wang, X.; Xue, H. The role of redox-active small molecules and oxidative protein post-translational modifications in seed aging. Plant Physiol. Biochem. 2024, 213, 108810. [Google Scholar] [CrossRef] [Scilit]
  2. Salvi, P.; Varshney, V.; Majee, M. Raffinose family oligosaccharides (RFOs): Role in seed vigor and longevity. Biosci. Rep. 2022, 42, BSR20220198. [Google Scholar] [CrossRef] [Scilit]
  3. Zhang, K.; Zhang, Y.; Sun, J.; Meng, J.; Tao, J. Deterioration of orthodox seeds during ageing: Influencing factors, physiological alterations and the role of reactive oxygen species. Plant Physiol. Biochem. 2021, 158, 475–485. [Google Scholar] [CrossRef] [Scilit]
  4. Ebone, L.A.; Caverzan, A.; Chavarria, G. Physiologic alterations in orthodox seeds due to deterioration processes. Plant Physiol. Biochem. 2019, 145, 34–42. [Google Scholar] [CrossRef] [Scilit] [PubMed]
  5. Rao, P.J.M.; Pallavi, M.; Bharathi, Y.; Priya, P.B.; Sujatha, P.; Prabhavathi, K. Insights into mechanisms of seed longevity in soybean: A review. Front. Plant Sci. 2023, 14, 1206318. [Google Scholar] [CrossRef] [Scilit] [PubMed]
  6. Satya Srii, V.; Nagarajappa, N. Impact of accelerated aging on seed quality, seed coat physical structure and antioxidant enzyme activity of maize (Zea mays L.). PeerJ 2024, 12, e17988. [Google Scholar] [CrossRef] [Scilit]
  7. Zhou, W.; Chen, F.; Luo, X.; Dai, Y.; Yang, Y.; Zheng, C.; Yang, W.; Shu, K. A matter of life and death: Molecular, physiological, and environmental regulation of seed longevity. Plant Cell Environ. 2020, 43, 293–302. [Google Scholar] [CrossRef] [Scilit]
  8. Song, Y.; Yu, J.; Xu, Y.; Wang, J.; Wang, M.; Wang, J.; Jia, Y.; Li, C.; Xing, J.; Zhou, Y.; et al. Integrative physiology, transcriptome, and metabolome analysis reveals pathways and the key gene ZmARF27 involved in vigor loss during artificial aging of maize seeds. J. Agric. Food Chem. 2025, 73, 15993–16010. [Google Scholar] [CrossRef] [Scilit]
  9. Han, Q.; Chen, K.; Yan, D.; Hao, G.; Qi, J.; Wang, C.; Dirk, L.M.A.; Downie, A.B.; Gong, J.; Wang, J.; et al. ZmDREB2A regulates ZmGH3.2 and ZmRAFS, shifting metabolism towards seed aging tolerance over seedling growth. Plant J. 2020, 104, 268–282. [Google Scholar] [CrossRef] [Scilit] [PubMed]
  10. Pirredda, M.; Fananas-Pueyo, I.; Onate-Sanchez, L.; Mira, S. Seed longevity and ageing: A review on physiological and genetic factors with an emphasis on hormonal regulation. Plants 2023, 13, 41. [Google Scholar] [CrossRef] [Scilit]
  11. Su, X.; Xin, L.; Li, Z.; Zheng, H.; Mao, J.; Yang, Q. Physiology and transcriptome analyses reveal a protective effect of the radical scavenger melatonin in aging maize seeds. Free Radic. Res. 2018, 52, 1094–1109. [Google Scholar] [CrossRef] [Scilit]
  12. Yue, G.; Yang, R.; Lei, D.; Du, Y.; Li, Y.; Feng, F. Physiological, biochemical, and ultrastructural changes in naturally aged sweet corn seeds. Agriculture 2024, 14, 1039. [Google Scholar] [CrossRef] [Scilit]
  13. Wang, B.; Yang, R.; Ji, Z.; Zhang, H.; Zheng, W.; Zhang, H.; Feng, F. Evaluation of biochemical and physiological changes in sweet corn seeds under natural aging and artificial accelerated aging. Agronomy 2022, 12, 1028. [Google Scholar] [CrossRef] [Scilit]
  14. Zhang, Z.; Yang, R.; Gao, L.; Huang, S.; Jiang, F.; Chen, Q.; Liu, P.; Feng, F. Dynamic transcriptome and metabolome analyses of two sweet corn lines under artificial aging treatment. BMC Genom. 2025, 26, 375. [Google Scholar] [CrossRef] [Scilit] [PubMed]
  15. Wang, B.; Yang, R.; Zhang, Z.; Huang, S.; Ji, Z.; Zheng, W.; Zhang, H.; Zhang, Y.; Feng, F. Integration of miRNA and mRNA analysis reveals the role of ribosome in anti-artificial aging in sweetcorn. Int. J. Biol. Macromol. 2023, 240, 124434. [Google Scholar] [CrossRef] [Scilit] [PubMed]
  16. Ninoles, R.; Ruiz-Pastor, C.M.; Arjona-Mudarra, P.; Casan, J.; Renard, J.; Bueso, E.; Mateos, R.; Serrano, R.; Gadea, J. Transcription factor DOF4.1 regulates seed longevity in Arabidopsis via seed permeability and modulation of seed storage protein accumulation. Front. Plant Sci. 2022, 13, 915184. [Google Scholar] [CrossRef] [Scilit] [PubMed]
  17. Wang, W.Q.; Xu, D.Y.; Sui, Y.P.; Ding, X.H.; Song, X.J. A multiomic study uncovers a bZIP23-PER1A-mediated detoxification pathway to enhance seed vigor in rice. Proc. Natl. Acad. Sci. USA 2022, 119, e2026355119. [Google Scholar] [CrossRef] [Scilit] [PubMed]
  18. Ma, L.; Wang, C.; Hu, Y.; Dai, W.; Liang, Z.; Zou, C.; Pan, G.; Lubberstedt, T.; Shen, Y. GWAS and transcriptome analysis reveal MADS26 involved in seed germination ability in maize. Theor. Appl. Genet. 2022, 135, 1717–1730. [Google Scholar] [CrossRef] [Scilit]
  19. Zhang, Y.; Dirk, L.M.A.; Zheng, J.; Chai, J.; Song, X.; Cao, J.; Wang, H.; Liu, Y.; Liu, Y.; Zhen, S.; et al. Natural variation in the ZmPIMT1 promoter enhances seed aging tolerance by regulating PABP2 repair in maize. Plant Cell 2025, 37, koaf217. [Google Scholar] [CrossRef] [Scilit]
  20. Bian, X.; Chen, C.; Wang, Y.; Qu, C.; Jiang, J.; Sun, Y.; Liu, G. Identification of a potential homeodomain-like gene governing leaf size and venation architecture in birch. Front. Plant Sci. 2024, 15, 1502569. [Google Scholar] [CrossRef] [Scilit]
  21. Gonzalez-Grandio, E.; Pajoro, A.; Franco-Zorrilla, J.M.; Tarancon, C.; Immink, R.G.; Cubas, P. Abscisic acid signaling is controlled by a BRANCHED1/HD-ZIP I cascade in Arabidopsis axillary buds. Proc. Natl. Acad. Sci. USA 2017, 114, E245–E254. [Google Scholar] [CrossRef] [Scilit] [PubMed]
  22. Gao, C.; Gao, K.; Yang, H.; Ju, T.; Zhu, J.; Tang, Z.; Zhao, L.; Chen, Q. Genome-wide analysis of metallothionein gene family in maize to reveal its role in development and stress resistance to heavy metal. Biol. Res. 2022, 55, 1. [Google Scholar] [CrossRef] [Scilit]
  23. Sano, N.; Rajjou, L.; North, H.M. Lost in translation: Physiological roles of stored mRNAs in seed germination. Plants 2020, 9, 347. [Google Scholar] [CrossRef] [Scilit] [PubMed]
  24. Gran, P.; Visscher, T.W.; Bai, B.; Nijveen, H.; Mahboubi, A.; Bakermans, L.L.; Willems, L.A.J.; Bentsink, L. Unravelling the dynamics of seed-stored mRNAs during seed priming. New Phytol. 2025, 247, 2196–2209. [Google Scholar] [CrossRef] [Scilit]
  25. Wang, B.; Wang, S.; Tang, Y.; Jiang, L.; He, W.; Lin, Q.; Yu, F.; Wang, L. Transcriptome-wide characterization of seed aging in rice: Identification of specific long-lived mRNAs for seed longevity. Front. Plant Sci. 2022, 13, 857390. [Google Scholar] [CrossRef] [Scilit]
  26. Zhu, X.; Dong, Z.; Liu, Y.; Mou, Q.; Hu, J.; Liu, J.; Chen, M.; Guan, Y. OsHsp20-25, a small heat shock protein, from long-lived mRNA regulates seed size and germination rate in rice. Planta 2025, 262, 18. [Google Scholar] [CrossRef] [Scilit]
  27. Ninoles, R.; Planes, D.; Arjona, P.; Ruiz-Pastor, C.; Chazarra, R.; Renard, J.; Bueso, E.; Forment, J.; Serrano, R.; Kranner, I.; et al. Comparative analysis of wild-type accessions reveals novel determinants of Arabidopsis seed longevity. Plant Cell Environ. 2022, 45, 2708–2728. [Google Scholar] [CrossRef] [Scilit]
  28. Wu, H.; Yu, H.; Zhang, Y.; Yang, B.; Sun, W.; Ren, L.; Li, Y.; Li, Q.; Liu, B.; Ding, Y.; et al. Unveiling RNA structure-mediated regulations of RNA stability in wheat. Nat. Commun. 2024, 15, 10042. [Google Scholar] [CrossRef] [Scilit]
  29. Zhao, L.; Wang, S.; Fu, Y.B.; Wang, H. Arabidopsis seed stored mRNAs are degraded constantly over aging time, as revealed by new quantification methods. Front. Plant Sci. 2019, 10, 1764. [Google Scholar] [CrossRef] [Scilit]
  30. Guzzon, F.; Gianella, M.; Velazquez Juarez, J.A.; Sanchez Cano, C.; Costich, D.E. Seed longevity of maize conserved under germplasm bank conditions for up to 60 years. Ann. Bot. 2021, 127, 775–785. [Google Scholar] [CrossRef] [Scilit] [PubMed]
  31. Du, Y.; Lin, J.; Jiang, H.; Zhao, H.; Zhang, X.; Wang, R.; Feng, F. Genetic Mapping for Seed Aging Tolerance Under Multiple Environments in Sweet Corn. Agronomy 2025, 15, 225. [Google Scholar] [CrossRef] [Scilit]
  32. Xin, X.; Lin, X.; Zhou, Y.; Chen, X.; Liu, X.; Lu, X. Proteome analysis of maize seeds: The effect of artificial ageing. Physiol. Plant. 2011, 143, 126–138. [Google Scholar] [CrossRef] [Scilit] [PubMed]
  33. Langdon, W.B. Performance of genetic programming optimised Bowtie2 on genome comparison and analytic testing (GCAT) benchmarks. BioData Min. 2015, 8, 1. [Google Scholar] [CrossRef] [Scilit]
  34. Kim, D.; Pertea, G.; Trapnell, C.; Pimentel, H.; Kelley, R.; Salzberg, S.L. TopHat2: Accurate alignment of transcriptomes in the presence of insertions, deletions and gene fusions. Genome Biol. 2013, 14, R36. [Google Scholar] [CrossRef] [Scilit]
  35. Anders, S.; Pyl, P.T.; Huber, W. HTSeq—A Python framework to work with high-throughput sequencing data. Bioinformatics 2015, 31, 166–169. [Google Scholar] [CrossRef] [Scilit]
  36. Wagner, G.P.; Kin, K.; Lynch, V.J. Measurement of mRNA abundance using RNA-seq data: RPKM measure is inconsistent among samples. Theory Biosci. 2012, 131, 281–285. [Google Scholar] [CrossRef] [Scilit] [PubMed]
  37. Wang, L.; Feng, Z.; Wang, X.; Wang, X.; Zhang, X. DEGseq: An R package for identifying differentially expressed genes from RNA-seq data. Bioinformatics 2010, 26, 136–138. [Google Scholar] [CrossRef] [Scilit] [PubMed]
  38. Alexa, A.; Rahnenführer, J. TopGO: Enrichment Analysis for Gene Ontology. Bioconductor 2024. Available online: https://www.bioconductor.org/packages/release/bioc/html/topGO.html (accessed on 4 November 2025).
  39. Moriya, Y.; Itoh, M.; Okuda, S.; Yoshizawa, A.C.; Kanehisa, M. KAAS: An automatic genome annotation and pathway reconstruction server. Nucleic Acids Res. 2007, 35, W182–W185. [Google Scholar] [CrossRef] [Scilit]
  40. The GSA Family in 2025: A Broadened Sharing Platform for Multi-Omics and Multimodal Data. Genom. Proteom. Bioinform. 2025, 23, qzaf072. [CrossRef] [Scilit]
  41. CNCB-NGDC Members and Partners. Database Resources of the National Genomics Data Center, China National Center for Bioinformation in 2025. Nucleic Acids Res. 2025, 53, D30–D44. [CrossRef] [Scilit]
  42. Livak, K.J.; Schmittgen, T.D. Analysis of relative gene expression data using real-time quantitative PCR and the 2−∆∆CT method. Methods 2001, 25, 402–408. [Google Scholar] [CrossRef] [Scilit]
  43. Chen, C.; Chen, H.; Zhang, Y.; Thomas, H.R.; Frank, M.H.; He, Y.; Xia, R. TBtools: An integrative toolkit developed for interactive analyses of big biological data. Mol. Plant 2020, 13, 1194–1202. [Google Scholar] [CrossRef] [Scilit]
  44. Hay, F.R.; Valdez, R.; Lee, J.S.; Sta Cruz, P.C. Seed longevity phenotyping: Recommendations on research methodology. J. Exp. Bot. 2019, 70, 425–434. [Google Scholar] [CrossRef] [Scilit] [PubMed]
  45. Saighani, K.; Kondo, D.; Sano, N.; Murata, K.; Yamada, T.; Kanekatsu, M. Correlation between seed longevity and RNA integrity in the embryos of rice seeds. Plant Biotechnol. 2021, 38, 277–283. [Google Scholar] [CrossRef] [Scilit]
  46. Choudhary, P.; Pramitha, L.; Aggarwal, P.R.; Rana, S.; Vetriventhan, M.; Muthamilarasan, M. Biotechnological interventions for improving the seed longevity in cereal crops: Progress and prospects. Crit. Rev. Biotechnol. 2023, 43, 309–325. [Google Scholar] [CrossRef] [Scilit] [PubMed]
  47. Fenollosa, E.; Jene, L.; Munne-Bosch, S. A rapid and sensitive method to assess seed longevity through accelerated aging in an invasive plant species. Plant Methods 2020, 16, 64. [Google Scholar] [CrossRef] [Scilit]
  48. Yao, R.; Liu, H.; Wang, J.; Shi, S.; Zhao, G.; Zhou, X. Cytological structures and physiological and biochemical characteristics of covered oat (Avena sativa L.) and naked oat (Avena nuda L.) seeds during high-temperature artificial aging. BMC Plant Biol. 2024, 24, 530. [Google Scholar] [CrossRef] [Scilit]
  49. Deng, B.; Yang, K.; Zhang, Y.; Li, Z. Can antioxidant’s reactive oxygen species (ROS) scavenging capacity contribute to aged seed recovery? Contrasting effect of melatonin, ascorbate and glutathione on germination ability of aged maize seeds. Free Radic. Res. 2017, 51, 765–771. [Google Scholar] [CrossRef] [Scilit] [PubMed]
  50. Lim, C.W.; Lee, S.C. Genome-wide identification and expression analysis of Raf-like kinase gene family in pepper (Capsicum annuum L.). Plant Signal. Behav. 2022, 17, 2064647. [Google Scholar] [CrossRef] [Scilit]
  51. Wu, J.; Liang, X.; Lin, M.; Lan, Y.; Xiang, Y.; Yan, H. Comprehensive analysis of MAPK gene family in Populus trichocarpa and physiological characterization of PtMAPK3-1 in response to MeJA induction. Physiol. Plant. 2023, 175, e13869. [Google Scholar] [CrossRef] [Scilit]
  52. Ratajczak, E.; Malecka, A.; Ciereszko, I.; Staszak, A.M. Mitochondria are important determinants of the aging of seeds. Int. J. Mol. Sci. 2019, 20, 1568. [Google Scholar] [CrossRef] [Scilit]
  53. Mao, C.; Zhu, Y.; Cheng, H.; Yan, H.; Zhao, L.; Tang, J.; Ma, X.; Mao, P. Nitric oxide regulates seedling growth and mitochondrial responses in aged oat seeds. Int. J. Mol. Sci. 2018, 19, 1052. [Google Scholar] [CrossRef] [Scilit]
  54. Kumsab, J.; Yingchutrakul, Y.; Simanon, N.; Jankam, C.; Sonthirod, C.; Tangphatsornruang, S.; Butkinaree, C. Comparative proteomic analysis of ridge gourd seed (Luffa acutangula (L.) Roxb.) during artificial aging. ACS Omega 2024, 9, 24739–24750. [Google Scholar] [CrossRef] [Scilit]
  55. Ahmed, Z.; Shah, Z.H.; Rehman, H.M.; Shahzad, K.; Daur, I.; Elfeel, A.; Hassan, M.U.; Elsafori, A.K.; Yang, S.H.; Chung, G. Genomics: A hallmark to monitor molecular and biochemical processes leading toward a better perceptive of seed aging and ex-situ conservation. Curr. Issues Mol. Biol. 2017, 22, 89–112. [Google Scholar] [CrossRef] [Scilit]
  56. Rasheed, H.; Shi, L.; Winarsih, C.; Jakada, B.H.; Chai, R.; Huang, H. Plant growth regulators: An overview of WOX gene family. Plants 2024, 13, 3108. [Google Scholar] [CrossRef] [Scilit]
  57. Anand, A.; Kumari, A.; Thakur, M.; Koul, A. Hydrogen peroxide signaling integrates with phytohormones during the germination of magnetoprimed tomato (Solanum lycopersicum L.) seeds. Sci. Rep. 2019, 9, 8814. [Google Scholar] [CrossRef] [Scilit] [PubMed]
  58. Waterworth, W.M.; Wang, D.; Dsilva, L.S.; West, C.E. DNA double strand break repair is important for the longevity of primed seeds. Plant Cell Environ. 2025, 48, 8469–8482. [Google Scholar] [CrossRef] [Scilit] [PubMed]
  59. Pereira Lima, J.J.; Buitink, J.; Lalanne, D.; Rossi, R.F.; Pelletier, S.; da Silva, E.A.A.; Leprince, O. Molecular characterization of the acquisition of longevity during seed maturation in soybean. PLoS ONE 2017, 12, e0180282. [Google Scholar] [CrossRef] [Scilit] [PubMed]
  60. Al-Obaidi, J.R.; Lau, S.E.; Liew, Y.J.M.; Tan, B.C.; Rahmad, N. Unravelling the Significance of Seed Proteomics: Insights into Seed Development, Function, and Agricultural Applications. Protein J. 2024, 43, 1083–1103. [Google Scholar] [CrossRef] [Scilit]
  61. Osterrieder, A.; Sparkes, I.A.; Botchway, S.W.; Ward, A.; Ketelaar, T.; de Ruijter, N.; Hawes, C. Stacks off tracks: A role for the golgin AtCASP in plant endoplasmic reticulum-Golgi apparatus tethering. J. Exp. Bot. 2017, 68, 3339–3350. [Google Scholar] [CrossRef] [Scilit]
Figure 1. Germination rates and ID50 of eight sweet corn inbred lines. (A) Germination rates of eight sweet corn inbred lines after different durations of AA. Germination was recorded 8 days after imbibition. Experiments were performed in triplicate. Error bars represent the standard deviation (SD) of three biological replicates (p < 0.01, two-way ANOVA with Tukey’s post hoc test). (B) ID50 of the eight sweet corn inbred lines. Data are presented as mean ± SD based on three biological replicates (p < 0.01, one-way ANOVA with Tukey’s post hoc test). ** represent a significant difference at the 0.01 level.
Agronomy 16 00375 g001
Figure 2. Germination rates of naturally aged seeds and correlation analysis between AA and NA. (A) Germination rates of eight sweet corn inbred lines after 4 months of NA (**, p < 0.01, one-way ANOVA with Tukey’s test). (B) Correlation analysis between germination rates after 4 months of NA and after 0, 2, 4, 6, 8, and 10 days of AA. Correlation coefficients are shown in the upper right, and their significance levels are indicated in the lower left (blank, nonsignificant; * p < 0.05; ** p < 0.01; *** p < 0.001).
Agronomy 16 00375 g002
Figure 3. Antioxidant enzyme activities, MDA content, and electrical conductivity of sweet corn seeds after AA and NA treatments. (A) SOD activity in T7 and T3 after different aging treatments. (B) CAT activity. (C) POD activity. (D) MDA content. (E) Electrical conductivity. ns, *, and ** indicate no significant difference (p > 0.05), significant difference (p < 0.05), and highly significant difference (p < 0.01), respectively, between aging treatments (AA or NA) and the corresponding control.
Agronomy 16 00375 g003
Figure 4. Comparison of gene expression between high-vigor (T7) and low-vigor (T3) sweet corn inbred lines under AA and NA conditions. (A,B) Number of DEGs in the two inbred lines after AA (A) and NA (B) compared to their respective controls (screening criteria: |log2FC| > 1 and p < 0.05). (C,D) Heatmaps showing gene expression changes in T7 (C) and T3 (D) after AA and NA treatments. The blue-red color scale represents the log2FC values of mRNA expression (red indicates higher expression after aging; blue indicates lower expression). The black-white color scale represents the p-values of transcript expression (darker black indicates smaller p-values; whiter indicates larger p-values). (E,F) Density scatter plots of transcriptional changes in T7 (E) and T3 (F) under AA versus NA conditions. The x-axis and y-axis represent log2FC values under AA and NA, respectively. Spearman correlation analysis was performed. The red line denotes the linear regression trend line.
Agronomy 16 00375 g004
Figure 5. Comparison of significantly DEGs in T7 and T3 under AA and NA conditions. (A,B) Venn diagrams showing the overlap of significantly altered transcripts (|log2FC| > 1 and p < 0.05) in T7 (A) and T3 (B) between NA and AA treatments compared to their controls. (C) The top 20 KEGG enrichened pathways of the 397 union genes.
Agronomy 16 00375 g005
Figure 6. DEG analysis, Venn diagram, and GO enrichment analysis between the two sweet corn inbred lines under control, AA and NA conditions. (A) Number of DEGs between T7 and T3 under Ctrl, AA, and NA conditions. (B) Venn diagram showing the overlap of DEGs identified from the three comparisons (T7_Ctrl vs. T3_Ctrl, T7_AA vs. T3_AA, T7_NA vs. T3_NA). (C) The top 20 GO enriched terms of DEGs unique to the T7_NA vs. T3_NA comparison in T7. (D) The top 20 GO enriched terms of DEGs unique to the T7_AA vs. T3_AA comparison in T7. The y-axis indicates functional subcategories, and the x-axis represents −log10 (p-value) to characterize the significance level of enrichment.
Agronomy 16 00375 g006
Figure 7. Heatmap and expression analysis of long-lived mRNAs in high-vigor and low-vigor sweet corn inbred lines. (A) Heatmap and cluster analysisshowing changes in long-lived mRNAs in the high-vigor inbred line (T7) and the low-vigor inbred line (T3). (B) Venn diagram illustrating the overlap of specific long-lived mRNAs identified from the comparisons T7_AA vs. T7_Ctrl, T7_NA vs. T7_Ctrl, T3_AA vs. T3_Ctrl, and T3_NA vs. T3_Ctrl. (C) qRT-PCR expression analysis of genes Zm00001eb157210 and Zm00001eb164610 in T7 and T3 under AA and NA conditions. UBQ7 was used as the internal reference. Data are presented as mean ± SD (n = 3). * and ** represent significant differences at the 0.05 and 0.01 levels, respectively.
Agronomy 16 00375 g007
Disclaimer/Publisher’s Note: The statements, opinions and data contained in all publications are solely those of the individual author(s) and contributor(s) and not of MDPI and/or the editor(s). MDPI and/or the editor(s) disclaim responsibility for any injury to people or property resulting from any ideas, methods, instructions or products referred to in the content.