Review

Research Progress on Machine Vision Detection Technology for Foreign Fibers in Cotton

1
College of Engineering, China University of Petroleum-Beijing at Karamay, Karamay 834000, China
2
College of Mechanical and Transportation Engineering, China University of Petroleum-Beijing, Beijing 102249, China
3
Mechanical and Aerospace Engineering, The Hong Kong University of Science and Technology, Hong Kong SAR, China
*
Author to whom correspondence should be addressed.
These authors contributed equally to this work.
Agronomy 2026, 16(3), 295; https://doi.org/10.3390/agronomy16030295
Submission received: 19 December 2025 / Revised: 17 January 2026 / Accepted: 23 January 2026 / Published: 24 January 2026
(This article belongs to the Special Issue Agricultural Imagery and Machine Vision)

Abstract

Foreign fiber (FF, plural: FFs) contamination has been demonstrated to have a substantial impact on the quality and profitability of cotton textiles. Machine vision technology, characterized by its non-contact approach and high efficiency, has emerged as the primary solution for detecting FFs in cotton. This paper commences with a precise definition and classification of FF and a concomitant analysis of the mechanisms of contamination. Subsequently, a systematic review of global research advancements in imaging technologies and the evolution of algorithms is conducted. This paper emphasizes the use of X-ray, ultraviolet fluorescence, line laser, polarized light, infrared imaging, and hyperspectral imaging techniques for FF detection. Through a comparative analysis, it reveals the applicable scope and effectiveness of various imaging schemes. Regarding the evolution of algorithms, this paper expounds on the technical development process from traditional image processing to machine learning (ML) and deep learning (DL). The study meticulously examines the strengths and weaknesses of each algorithmic stage. In conclusion, this paper synthesizes the prevailing technical challenges confronting machine vision detection of FFs in cotton and proffers recommendations for future research directions in this domain, emphasizing multi-technology integration, algorithm optimization, and hardware innovations.

1. Introduction

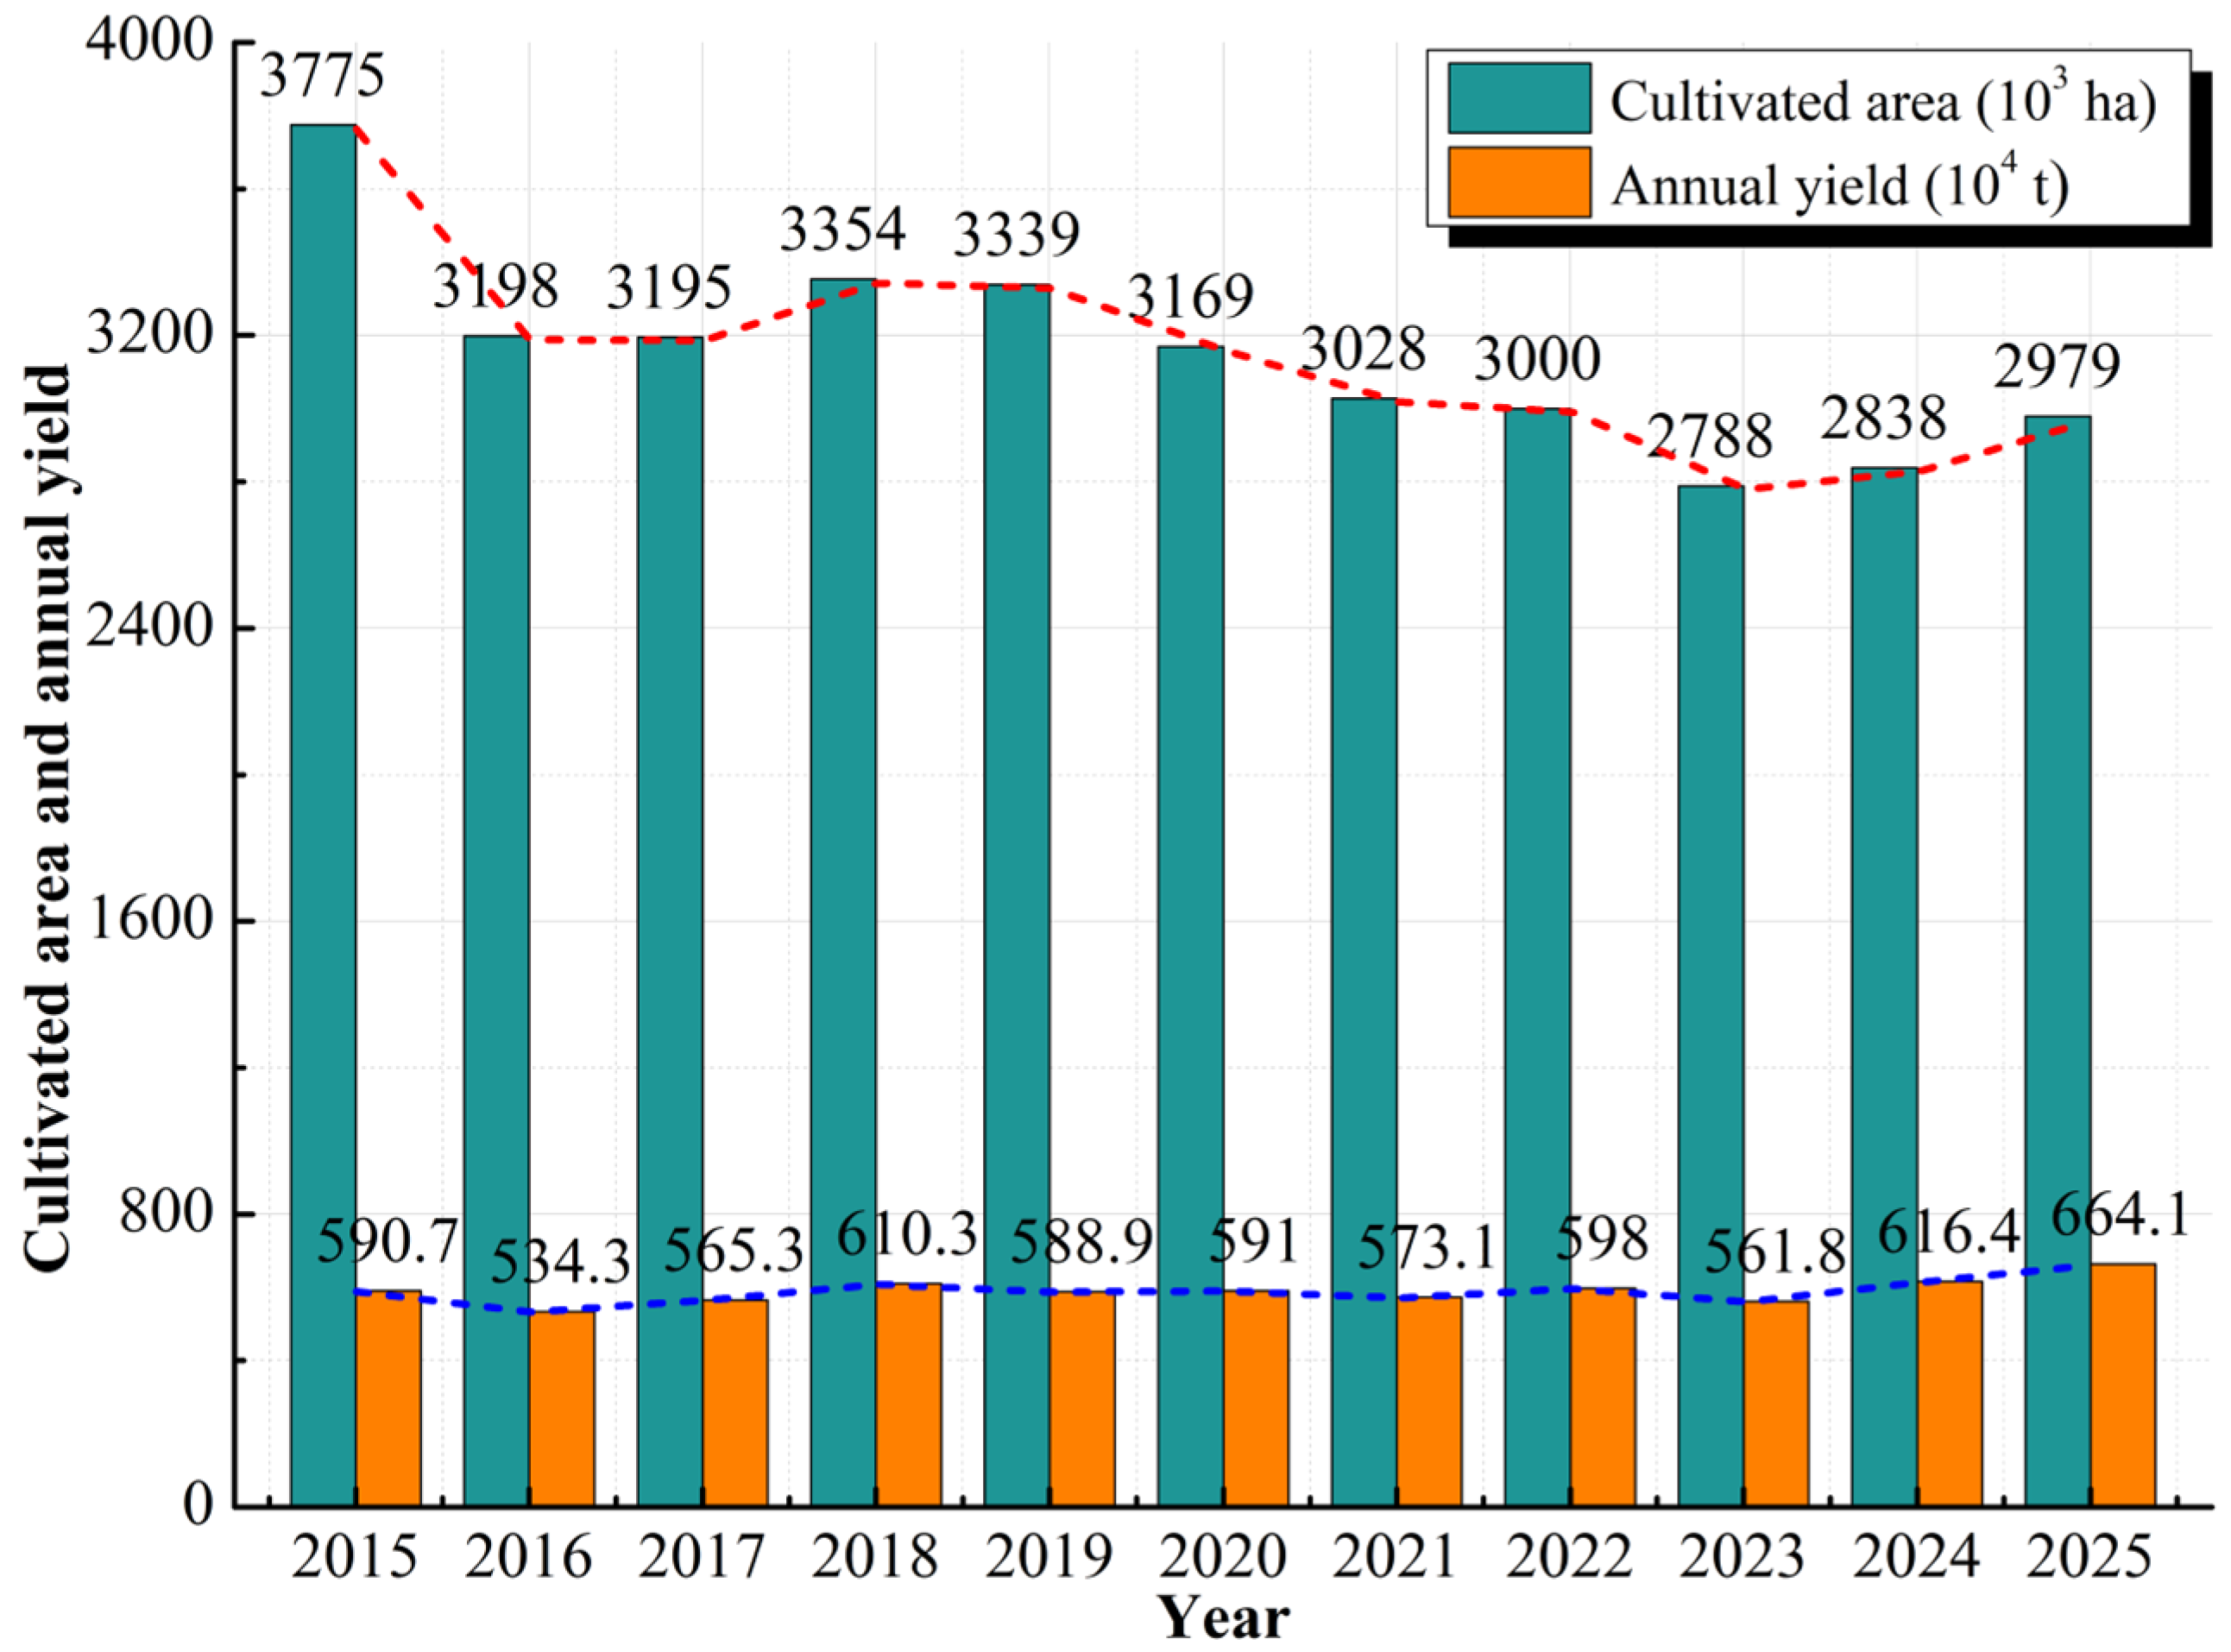
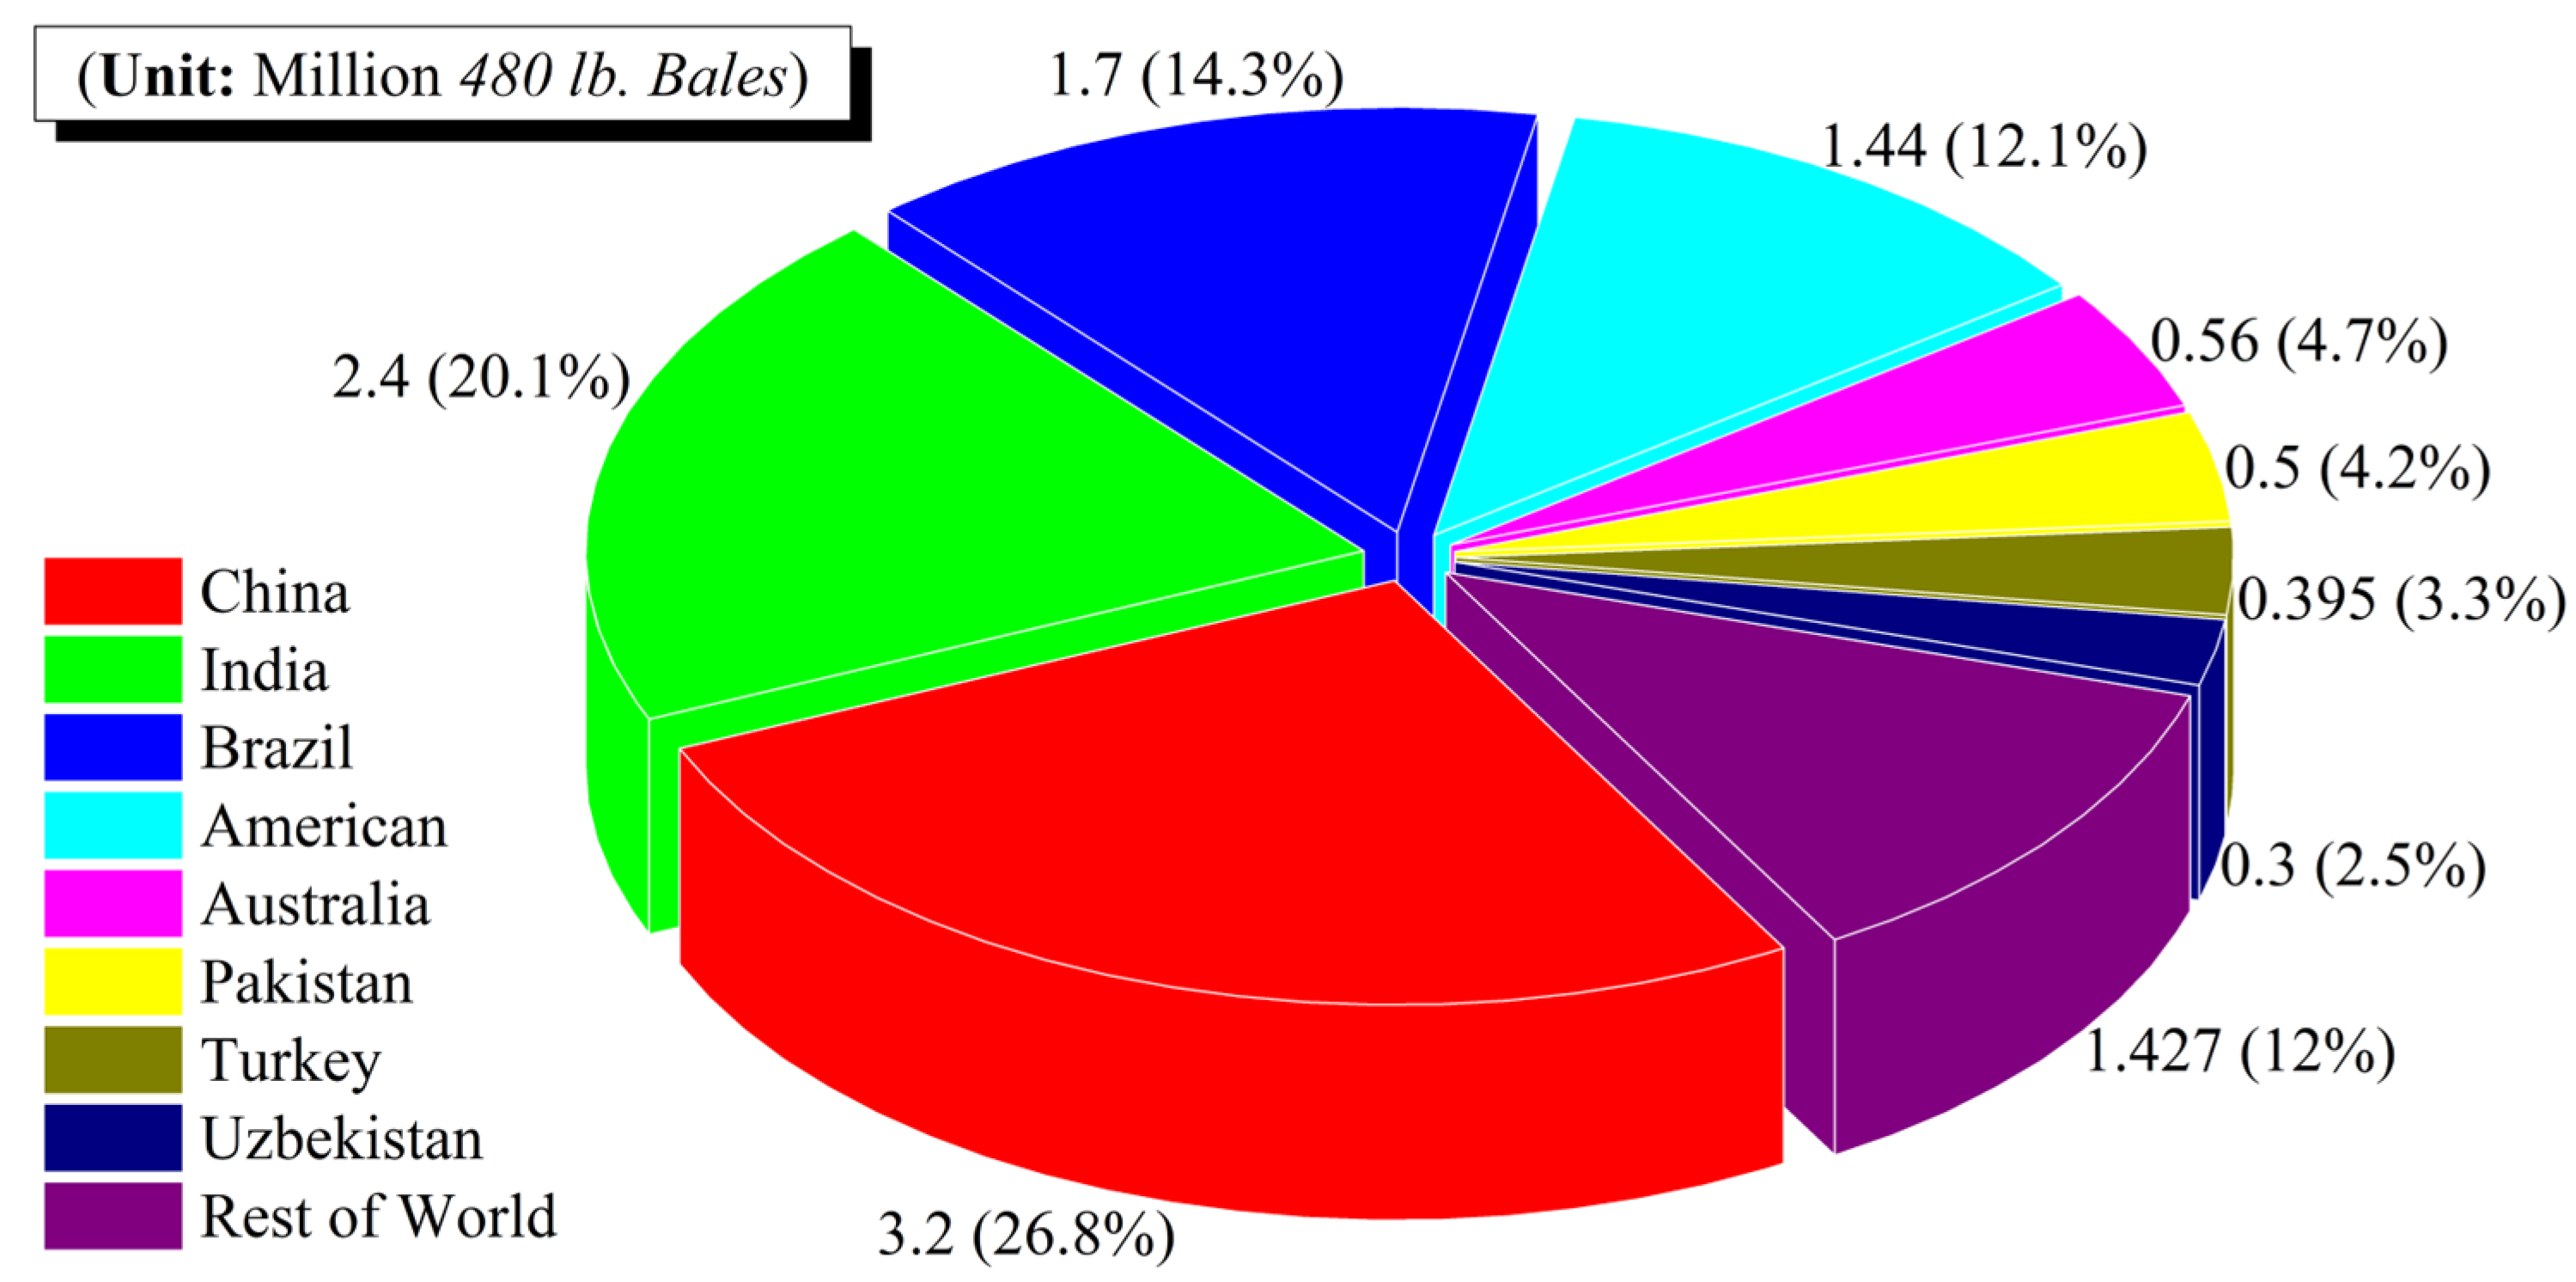
Cotton, a globally prominent economic crop, plays a pivotal role in the world economy. Recent statistics (as shown in Figure 1) indicate that China’s average annual cotton planting area exceeds 3,150,000 hectares, with an average output of 5.90 million tons [1]. Analysis of 2025 global production data (illustrated in Figure 2) reveals that China produced 3.2 million 480 lb. Bales, representing 26.8% of the global total [2], confirming its leading position in cotton production.
However, the challenges associated with improving cotton quality in China remain severe, with the mixing of FFs being a primary factor hindering economic benefits [3,4]. The sources of FFs are diverse, and the mixing mechanisms are complex, occurring across planting, harvesting, storage, and transportation stages [5]. During cotton processing, the labor-intensive task of removing FFs decreases production efficiency and leads to the fragmentation of undetected fibers during subsequent combing. This fragmentation generates FF debris, which can cause various textile defects such as yarn breakage, uneven dyeing, fabric roughness, and wear discomfort [6]. These issues significantly reduce the quality of cotton textiles, highlighting the need for research into FF detection technology to improve the competitiveness of the cotton industry.
Recent advancements in computer and artificial intelligence (AI) technologies have driven the widespread adoption of machine vision for cotton FF detection. This approach is recognized for its non-destructiveness, cost-effectiveness, and high efficiency [6,7]. Cotton image data are captured using an image acquisition system and analyzed through image processing or ML techniques, enabling real-time FF detection and classification. This paper provides a comprehensive review of machine vision-based FF detection research, clarifying the definitions, types, and contamination mechanisms of FF while systematically comparing existing methods. Focusing on imaging technologies and algorithm evolution, we discuss current technical challenges and propose future directions to enhance cotton quality in smart agriculture.

2. Review Methodology

The purpose of this review was to systematically look at how research on machine vision for detecting FFs in cotton has progressed. We searched for articles in major scientific databases like Web of Science, IEEE Xplore, and CNKI using combinations of keywords like “cotton,” “foreign fiber,” “machine vision,” “detection,” “imaging,” and “deep learning.” The main focus was on peer-reviewed articles and conference papers that were published between 2004 and 2025. We only looked at publications that were mostly about imaging technologies or detection algorithms for cotton FFs. From the selected literature, we extracted and synthesized key information pertaining to the following:
  • The imaging modality employed (e.g., X-ray, hyperspectral, etc.);
  • The detection algorithm or model utilized (e.g., traditional image processing methods, data-driven intelligent detection models);
  • The primary performance metrics reported (e.g., detection accuracy (Acc), mean average precision (mAP), and frames per second (FPS));
  • The type of cotton studied (e.g., seed cotton, raw cotton, etc.) and the corresponding categories of FFs targeted, given the significant impact of these factors on detection difficulty and methodological approach.

3. Cotton Foreign Fiber and Its Imaging Technology

3.1. Definition and Mixing Path of Foreign Fiber

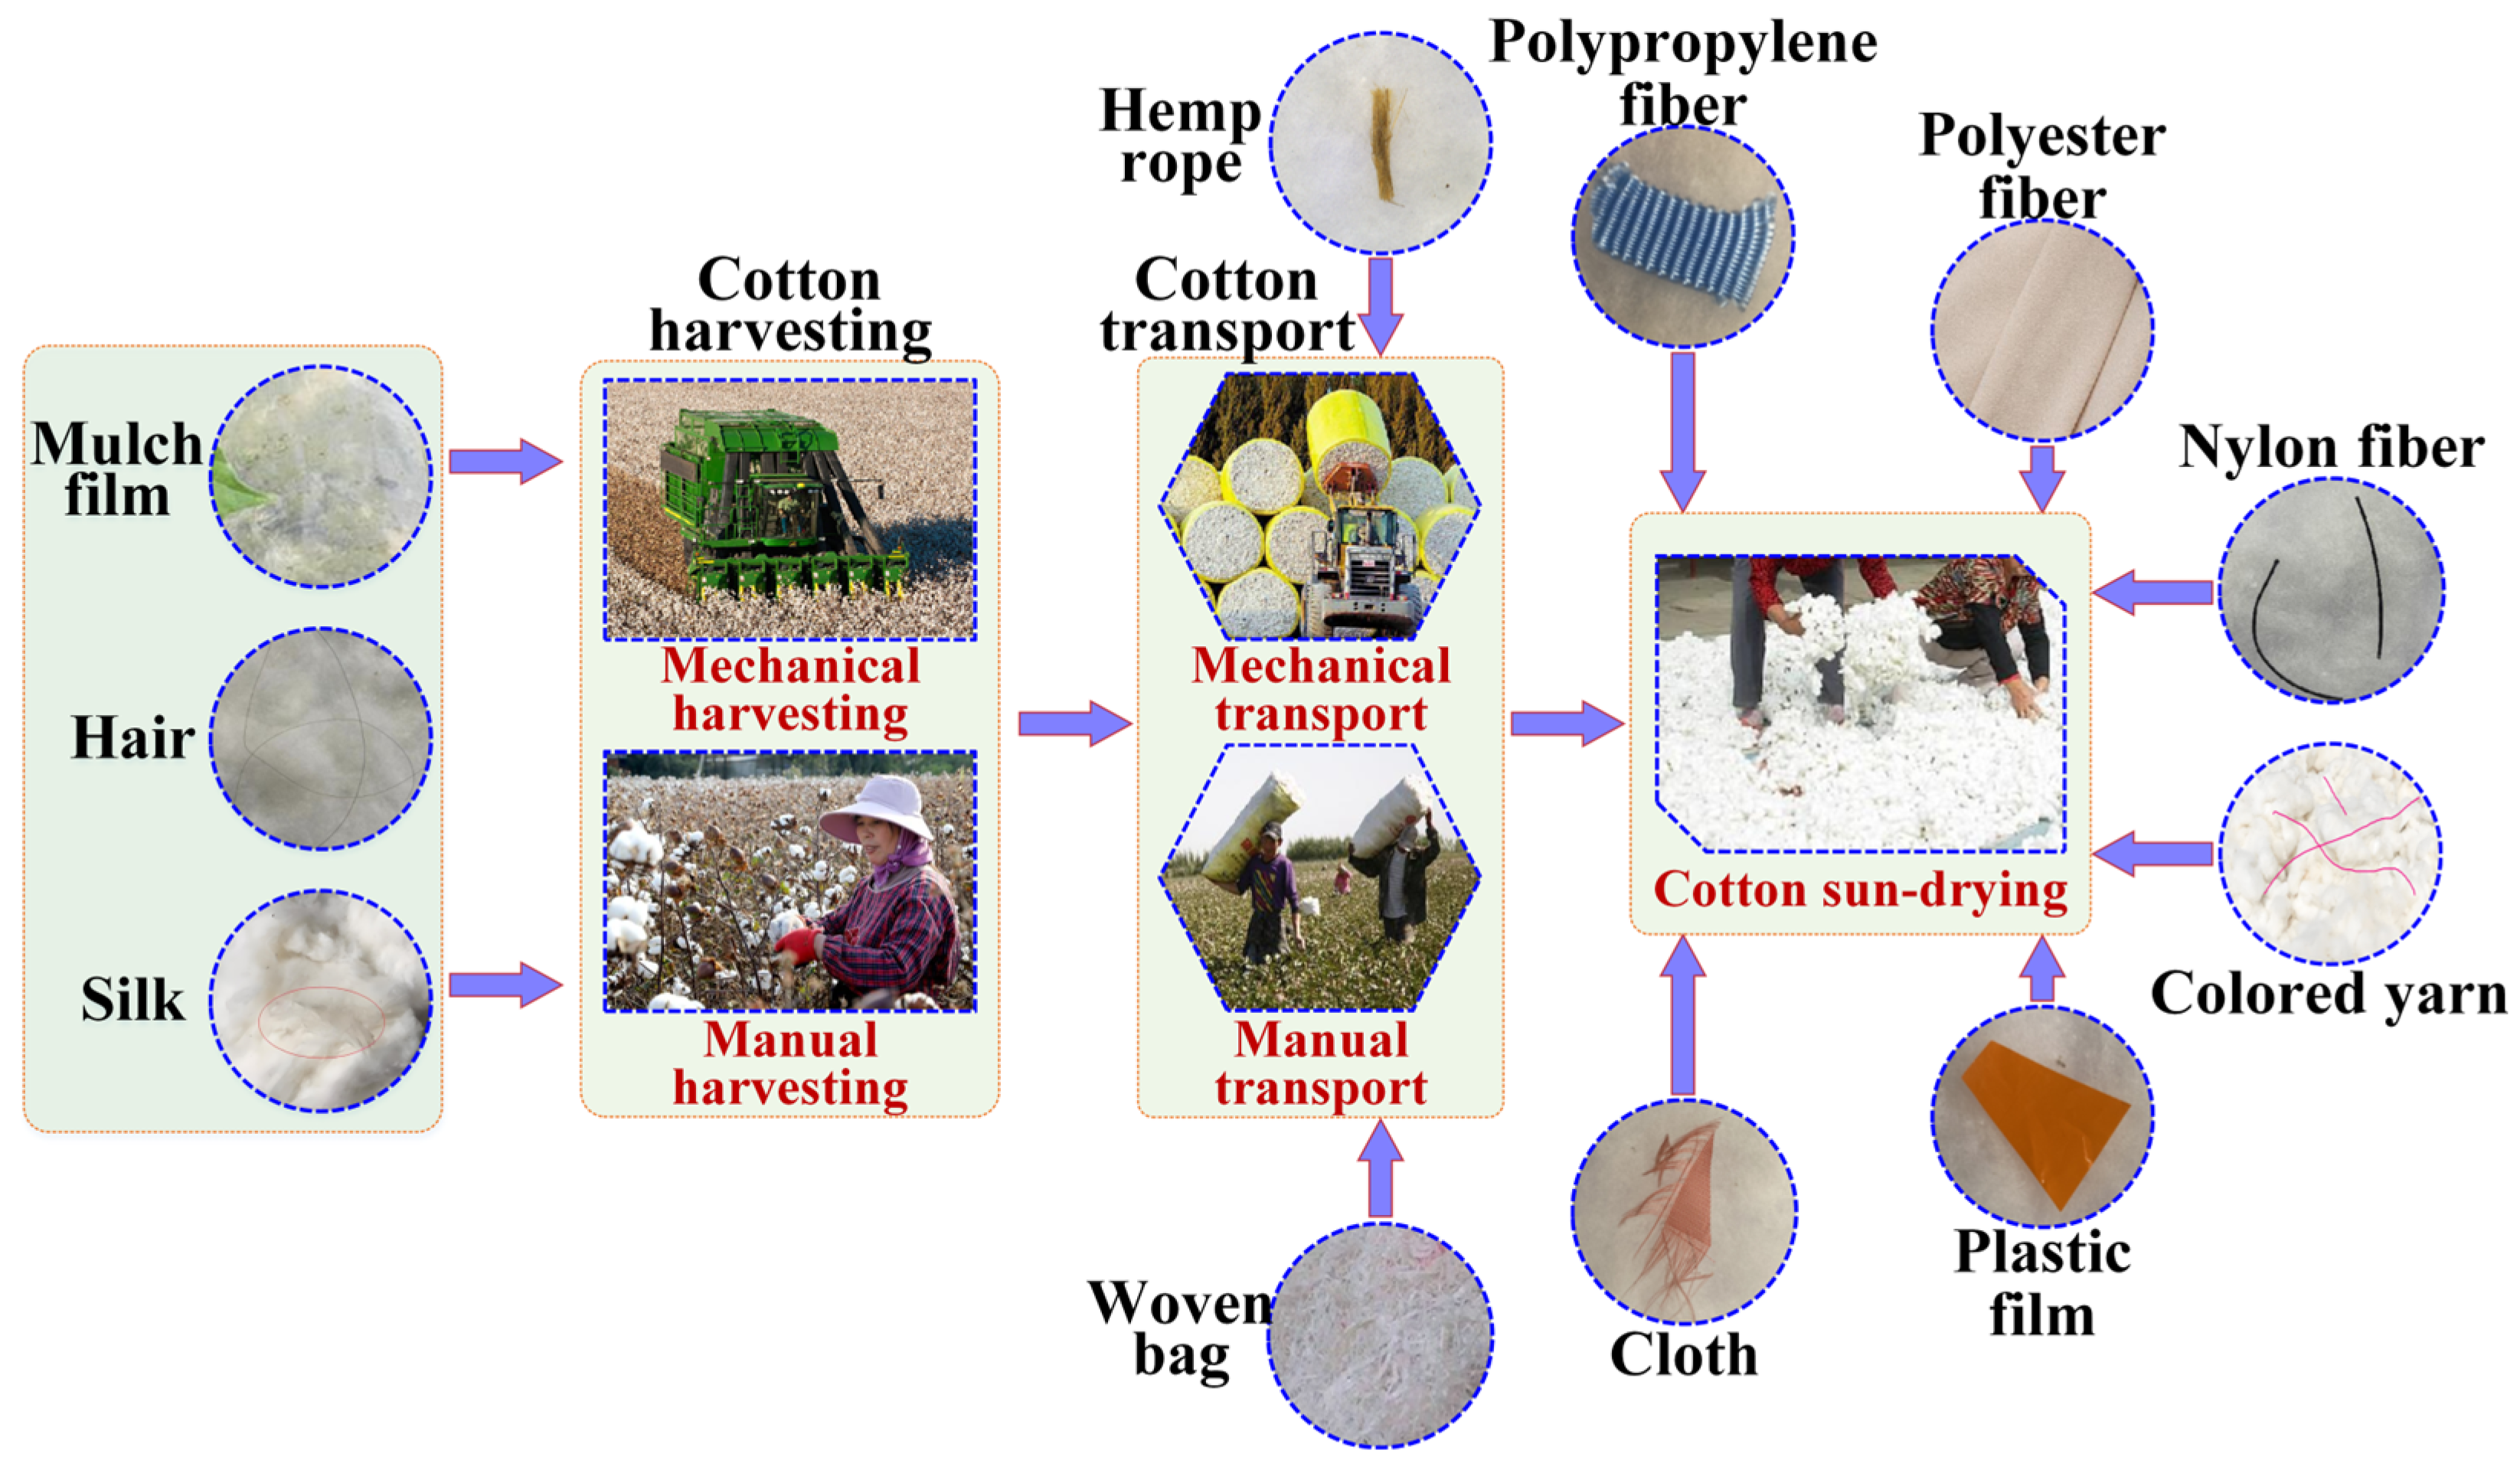
FF in cotton, also known as “three silks”, refers to a category of materials that includes non-cotton fibers and synthetic cotton-like fibers interwoven with cotton. This category encompasses chemical fibers, animal hair, silk, mulch film, hemp rope, and dyed thread, among others [8]. The process of FF mixing is characterized by its varied sources and randomness. Figure 3 shows three main methods for introducing FF into cotton. These methods are based on current harvesting, transportation, and storage practices. Firstly, wind can carry small remnants of film and spider silk from the field, which then mix with the raw cotton. Secondly, during the drying phase, foreign particles such as animal hair and sand can infiltrate the cotton in an open-air environment. Thirdly, during the storage and transportation stages, synthetic materials such as plastic ropes and debris from woven bags may contaminate the cotton during bagging or transit. The sources of FFs are extensive, and their mixing methods are diverse, making it challenging to eliminate their introduction. Consequently, the identification of efficient and accurate methodologies for the detection and elimination of FFs represents a pivotal challenge confronting the cotton processing industry.

3.2. Foreign Fiber Detection Imaging Technology

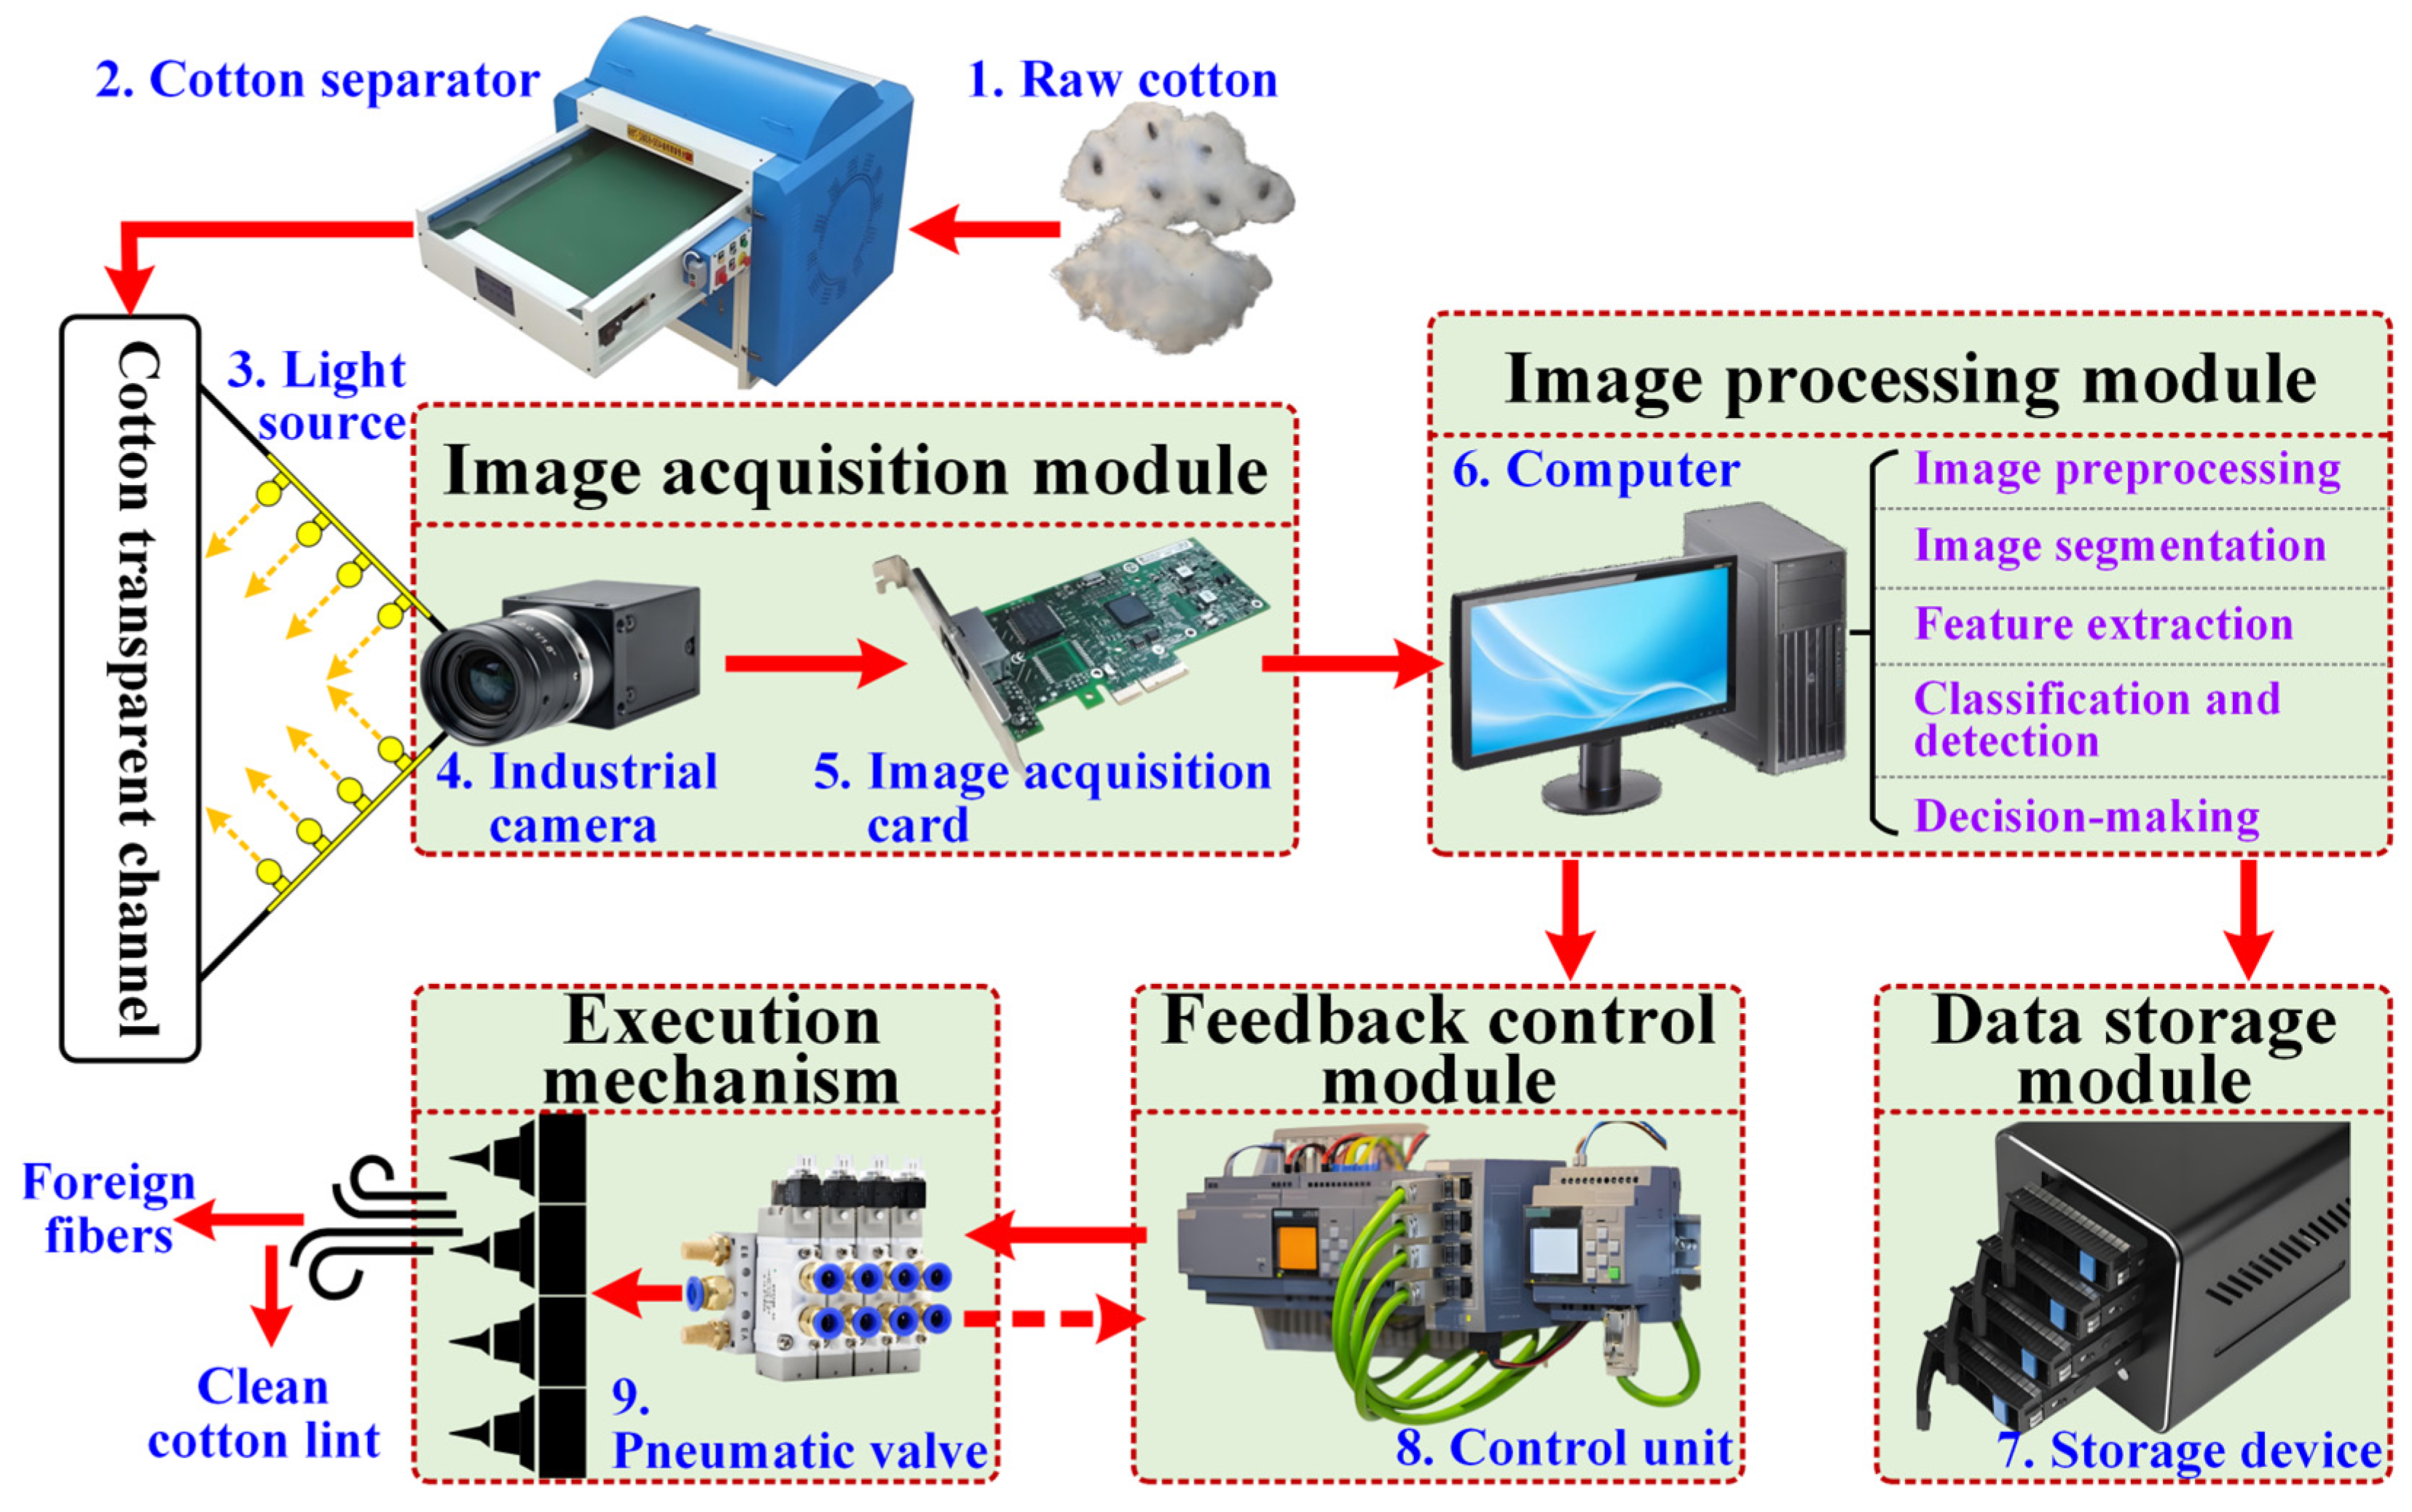
A conventional FF detection system, as shown in Figure 4, comprises five modules: image acquisition, processing, data storage, feedback control, and execution mechanism. After extraction and combing, the raw cotton enters a transparent channel where an industrial camera captures images under controlled illumination. The images are compressed and encoded before analysis [7]. Upon FF detection, the system automatically saves relevant data while the feedback control module activates the execution mechanism to remove FFs. Given FF’s morphological diversity, imaging technology selection critically affects detection accuracy by enhancing FF-cotton contrast [9]. Current leading technologies include X-ray, ultraviolet fluorescence, line laser, polarized light, infrared ray (IR), and hyperspectral imaging for FF detection.

3.2.1. X-Ray Imaging Detection

X-ray imaging can simultaneously acquire the density, shape, and size of impurity particles both on the surface and within the cotton layer, owing to its penetrating radiation properties. This technology is utilized for cotton detection primarily via two methods: two-dimensional (2D) ray imaging and three-dimensional (3D) tomography [10]. Regarding 3D tomography, Pai and Pavani et al. [11,12] successfully detected and classified four common impurities, including bark and polypropylene-based plastics, using X-ray microtomography technology. Dogan et al. [13,14] accomplished the “background feature normalization” of cotton in 2D X-ray imaging via scale space analysis, thereby creating a method for detecting and assessing cotton impurity content through image analysis. X-ray imaging provides significant penetration capabilities, enabling the identification of both surface and subsurface FFs. However, limitations exist due to high hardware costs, slow imaging speeds, and potential radiation hazards, which restrict its practical applications.
X-ray imaging is the best method for detecting contaminants that are firmly buried and have a different density than cotton, such as metal shards, dense polymers, or thick bark. This is because it can penetrate better. It normally costs a lot, takes a long time to take pictures, and has safety rules for radiation. The method does not work well for identifying thin, low-density pollutants or those that absorb X-rays at rates similar to cotton (such as some chemical fibers). It also has problems finding objects in real time on production lines that move quickly.

3.2.2. Ultraviolet Fluorescence Imaging Detection

The color of natural-color FF resembles that of cotton. Despite some visual similarities, their distinct molecular structures lead to different fluorescence characteristics when exposed to ultraviolet light. Specifically, natural-color FF emits bright fluorescence at wavelengths between 400 and 500 nm, whereas raw cotton does not change color. This difference is crucial for distinguishing raw cotton from natural-color FFs [15]. Song et al. [16] developed a device for detecting raw cotton FFs using ultraviolet fluorescence-induced imaging and image processing. They proposed an adaptive correction algorithm to address uneven illumination through median filtering, achieving segmentation and positioning for FFs with an improved Otsu algorithm. Their device demonstrated a detection rate of over 88% for natural-color FFs, including polypropylene filament. Zhou et al. [17,18] introduced an alternating imaging detection method that utilizes dual light sources of white and purple light. They created a model for optimal wavelength selection based on differences in feature responses, such as mean square error and the minimum values of various FFs compared to raw cotton. By optimizing the ratio of light intensity, they effectively mitigated the interference of white light on the ultraviolet fluorescence effect, allowing for the simultaneous detection of multiple FFs. Mustafic et al. [19] employed a combination of blue and ultraviolet light for excitation, expanding the range of detectable common FFs to 12 types. It is important to take into account that increasing illumination intensity is not always beneficial when selecting the quantity and types of light sources. Moderate brightness and darkness can enhance contrast differences and improve image quality [20]. Du et al. [21] analyzed the camera imaging-incident light energy relationship to determine required light source numbers. They established a camera target surface exposure function to identify optimal detection locations, ultimately yielding 95% detection accuracy with their optimized fuzzy clustering neural network (FCNN). Ultraviolet fluorescence imaging is cost-effective and operationally simple; however, precise control of light source intensity is vital to avoid spectral crosstalk.
Ultraviolet fluorescence imaging is most applicable to natural-color foreign FFs with inherent or added fluorescence characteristics, such as polypropylene filaments. Its successful application critically depends on precise control of light source intensity and spectral purity and requires avoidance of ambient white light interference. The technique is completely ineffective against non-fluorescent materials (e.g., cotton stalks, ordinary plastic films) and is prone to false positives when cotton fibers carry naturally fluorescent impurities (e.g., certain oils).

3.2.3. Line Laser Imaging Detection

The optical properties of fibers are determined by their ability to transmit light and diffuse reflection. According to Hua et al. [22], cotton fibers range in length from 23 to 45 mm and have an approximate diameter of 20 μm. After thorough loosening, the fibers take on a cloud-like appearance. The interiors of the fibers contain numerous pores, and their surfaces are uneven. The substance is loosely structured, rough-surfaced, and optically sparse. In contrast, many common FFs are optically dense substances with smooth surfaces that exhibit strong reflection to parallel light. Hua et al. [22] proposed a non-fluorescent method for detecting white FFs using line laser technology, based on the differences in optical reflection. This method enhances the contrast between white FF and cotton through line laser irradiation, thereby facilitating subsequent threshold segmentation detection. Consequently, line laser imaging detection has undergone three primary stages of development: optimization of image analysis, fusion of multiple light sources, and intelligent detection. In the optimization of the image analysis stage, Liu et al. [23] employed line laser scanning to produce cross-sectional images of cotton. The incorporation of image processing technology and examining changes in gray levels led to the successful identification of FFs, thereby enhancing detection accuracy and environmental adaptability. Furthermore, Liu et al. [24] developed a rapid laser imaging detection technique using a high frame rate camera and line laser system, which facilitates the acquisition of laser reflection images from cotton surfaces and enables effective detection across large-scale cotton samples. During the multi-light source fusion stage, researchers such as Zhang [25] and Wei et al. [26] created a composite light source system that integrates line laser and light-emitting diode (LED) technology along with ultraviolet light sources. In the intelligent detection stage, He et al. [27] incorporated DL technology to automate the identification and classification of laser images, thereby enhancing the system’s resilience to complex environments and improving the accuracy of FF detection.
Line laser imaging proficiently identifies smooth-surfaced, optically dense white FFs, such as white plastic film, by utilizing significant contrast in reflection. The performance is limited by the alignment of the laser line power, scanning velocity, and the uniformity of the cotton layer’s surface. When it comes across pollutants that are rough, black, or buried deep, its reflecting signal achieves much weaker or disappears, which means it misses detections.

3.2.4. Polarized Light Imaging Detection

The polarization characteristics of an object’s light wave are closely linked to its intrinsic properties, such as material composition, geometric features, and surface morphology [28]. This attribute provides a new technical approach for detecting transparent, film-like FFs. Peng et al. [29] first proposed a Monte Carlo method using extended Jones matrices to model polarized photon transitions and track phase information. They subsequently developed chromatic polarization imaging (CPI) technology for real-time detection of mulch films within 8 mm cotton layers. At the technical application level, Jia et al. [30] connected M-type FF sorting machines sequentially to conduct parameter configuration experiments. The FF identification module of the equipment featured four specialized cameras; the #4 camera was equipped with a polarizing film designed to detect mulch films. Test results indicate that this method effectively controls FF content, but the system lacks compactness and is costly. At the equipment development level, Zhang et al. [31] developed an FF removal machine based on an embedded system. This machine uses a hybrid lighting system that combines white and ultraviolet light. An additional polarized light channel is integrated into the ultraviolet channel. This enables the original ultraviolet detection camera to identify both fluorescent FF and transparent films simultaneously. This device increases the detection rate of transparent films without the need for additional cameras, unlike the method described by Peng et al. [29]. In their exploration of cutting-edge technology, Wang [32] used polarized photoacoustic imaging (PPI) to examine the structural attributes of collagen fibers and directional variations in optical properties. This sophisticated imaging technology integrates the principles of polarized light and acoustic imaging to provide a substantial enhancement over traditional optical imaging. It has the potential to provide theoretical support and technical guidance for the future identification of FF in cotton.
Polarized light imaging is good at finding FFs that are clear or semi-clear and look like film, like mulch films. The polarizer needs to be perfectly aligned with the optical axis of the contaminant for the system to work well, which makes calibration difficult. This method does not work very well on opaque or optically isotropic materials (like colored fibers or cotton stalks), and it is hard to use on its own in situations where there are different types of contaminants.

3.2.5. IR Imaging Detection

The IR imaging system consists of an IR camera and an IR spectrometer. When exposed to infrared light sources, different materials absorb infrared light at specific wavelengths. Analyzing these absorption properties using a spectrometer yields distinctive infrared spectra for the materials. Meanwhile, IR cameras acquire images of objects according to their IR characteristics [33]. Cintrón et al. [34] identified and assessed seven types of cotton FFs using a Fourier transform infrared (FTIR) microscope with a focal plane array detector. Their experimental results demonstrate that this system is highly effective in identifying tiny samples, single linear heterofibers, and spots. Cai et al. [35] scanned and imaged 12 types of cotton FFs using near-infrared spectroscopy (NIR) using a high-speed camera. Using traditional image processing techniques, they analyzed the detection results and grayscale characteristics of colored and natural-color FFs. Within the specific spectral range (400–1000 nm, 808 nm, and 905 nm) and experimental setup employed in their study, the researchers found that 808 nm was an effective detection band for the tested natural-color FFs. It is important to note that this finding pertains specifically to the conditions of Cai et al. [35] and may not be optimal for all natural-color FFs across the broader NIR spectrum. Nonetheless, false and missed detections persist. Du et al. [36] combined NIR spectrum ranging from 780 to 2360 nm with convolutional neural networks (CNNs), achieving impurity classification accuracy exceeding 99%. During cotton harvesting, cotton pickers collect cotton fibers along with numerous impurities, including cotton shells, stems, and leaves from the plants. In such cases, the preferred method for detecting impurities is Fourier transform infrared spectroscopy. However, current research primarily focuses on identifying impurity types, while the quantitative analysis of these impurities receives relatively less attention. To address this gap, Han et al. [37] used a long-wave FTIR spectrometer to analyze spectral data from seed cotton samples. They optimized, modeled, and compared six algorithms for extracting feature wavelengths. Their findings showed that the support vector machine (SVM) model optimized by the sparrow search algorithm and combined with feature wavelengths selected by the synergy interval partial least squares-successive projection algorithm (siPLS-SPA) provided the highest prediction accuracy for impurities in seed cotton. Additionally, Li et al. [38] developed a specialized spectral data acquisition system for seed cotton impurities and achieved quantification of impurity content in seed cotton.
Infrared imaging works best for finding FFs that have different absorption or reflection properties in certain infrared bands. This includes plant debris, hair, and some synthetic fibers. The main problems with it are that the equipment is expensive, the imaging speed is slow, and the temperature needs to be stable. When the spectral signatures of the contaminant and cotton are very similar, or when the target is very small or tightly wrapped in cotton, the method is likely to miss detections or make wrong classifications.

3.2.6. Hyperspectral Imaging Detection

Hyperspectral imaging technology can simultaneously acquire target images and their full-band continuous spectra, thereby achieving “image-spectrum integration” [39]. Wu et al. [40] comment that hyperspectral images of cotton and its impurities can be used with relevant spectral preprocessing methods and classification algorithms to detect and classify pure cotton. This study establishes a theoretical basis for forecasting and quantitatively assessing impurity levels. Liu et al. [41] established three imaging modes: hyperspectral reflection, transmission, and reverse transmission. The spectral data of raw cotton and impurities was extracted and analyzed, using selected feature wavelengths to distinguish between impurities and pure cotton. Their results demonstrate that the accuracy of impurity identification via the transmission imaging mode can attain 95.78%. Compared to raw cotton, machine-harvested seed cotton has more impurities and uneven cotton layer thickness, making impurity detection more difficult. Chang et al. [42] developed three classification discrimination models based on the spectral feature disparities between cotton and impurities, specifically targeting five common types of impurities found in machine-harvested seed cotton. The comparative analysis revealed that the linear discriminant analysis model had the highest detection accuracy and shortest time consumption, but under the influence of lighting, this model may misidentify mulch film. Liu et al. [43] proposed an intelligent method for detecting transparent film-like impurities using short-wave NIR hyperspectral imaging technology in conjunction with CNN, attaining a field recognition rate of 96.5%. To identify internal contaminants, Wei et al. [44] employed a push-broom hyperspectral imaging system to acquire image-spectrum data about raw cotton and 12 types of impurities mixed within the cotton layer in transmission mode. After annotating regions of interest, they explored impurity classification methods using both full-band and feature-band spectral data. Despite suboptimal experimental results, the study confirmed the feasibility of hyperspectral imaging technology for identifying impurities in the cotton layer.
Leveraging its “image-spectrum integration” capability, hyperspectral imaging is applicable to the detection and classification of a vast majority of FF types, particularly excelling at distinguishing visually similar contaminants of different materials. Its adoption is bottlenecked by huge data volumes, complex processing algorithms, and high system costs. Despite its rich information output, its performance can be significantly hampered in high-speed online sorting scenarios and when detecting deeply embedded contaminants within excessively thick cotton layers where signals are severely attenuated.
Table 1 shows the results of a comparative analysis of six commonly used imaging techniques for detecting FFs in cotton. Evaluating the strengths and weaknesses of each technique, as well as the types of FF they aim to identify, helps select a more effective detection method that enhances accuracy and efficiency. Due to the complex and varied distribution of FF in actual production, future research should focus on improving image quality by optimizing the quantity, intensity, and arrangement of light sources. Additionally, researchers should explore multiple synchronous detection methods that utilize light source fusion technology.

4. Evolution and Innovation of Cotton Foreign Fiber Detection Algorithms

4.1. Traditional Image Detection Methods and Their Applications

Image segmentation is fundamental for feature extraction, pattern recognition, and object classification. This process partitions images into non-overlapping regions where intra-region pixels share similar attributes while inter-region pixels show significant differences [45]. Cotton impurity detection typically employs traditional segmentation algorithms based on thresholding, edge detection, and regional characteristics. However, these methods often struggle to distinguish pseudo-FF (e.g., yellow cotton) from fragmented cotton leaves that visually resemble raw cotton.

4.1.1. Threshold Segmentation-Based Detection Methods

Threshold segmentation utilizes the grayscale value of an image to execute binary segmentation by determining a suitable threshold [46]. Otsu’s algorithm is widely used globally as an adaptive threshold segmentation method. However, cotton impurities’ small size, high background ratio, and low grayscale contrast often lead to missed detections or incorrect segmentations when this algorithm is applied directly [47,48]. To address these challenges, researchers have proposed various enhancement methods. Liu [49] combined the Roberts operator with the gray-level co-occurrence matrix (GLCM) to reduce the computational burden of two-dimensional Otsu while improving its noise resistance. Qi [50] proposed a particle swarm optimization algorithm that incorporates dynamic inertia weight and an adaptive learning factor, enabling the rapid identification of the optimal threshold through intelligent iteration, thereby enhancing the real-time performance and accuracy of impurity segmentation. Wang et al. [51] combined Canny edge detection with double-threshold techniques to enhance the segmentation of larger impurities, although detection accuracy for smaller targets with similar colors still requires improvement. Du et al. [52] found that local threshold segmentation can efficiently consider thresholds for both dark and bright points with low computational costs, demonstrating excellent performance in defect detection rates and real-time processing. Wan et al. [53] devised a rapid detection system for evaluating contamination rates in seed cotton utilizing this algorithm, which significantly reduced detection times. In conclusion, improving how thresholds are selected is essential for augmenting threshold segmentation outcomes. Using local adaptive search algorithms or intelligent optimization methods to ascertain the optimal threshold can enhance the accuracy and efficiency of cotton impurity detection. Although threshold segmentation is efficient for targets with distinct grayscale differences, its reliance solely on pixel intensity makes it susceptible to noise and low-contrast conditions, particularly for small or similarly colored impurities. This limitation necessitates more robust methods capable of capturing structural information.

4.1.2. Edge Feature Segmentation-Based Detection Methods

Edge detection is a prevalent method for image segmentation based on variations in grayscale, essential for extracting and analyzing FFs’ characteristics in intricate situations [54]. Grayscale variations can be detected by calculating the derivative at each pixel location. However, derivative operations are highly sensitive to noise. As a result, edge detection often incorporates smoothing filters to mitigate this issue. Table 2 delineates the characteristic differences among classical edge detection methods in FF detection applications. It should be noted that the Laplacian operator is isotropic, meaning its response is independent of edge direction; however, it is highly sensitive to image noise, which is why it is often employed alongside other methods. The Canny operator utilizes Gaussian filtering and dual-threshold mechanisms, demonstrating superior edge continuity, noise reduction, and localization accuracy [55,56]. To reduce noise while maintaining edge information, Yu et al. [57] utilized an iterative approach to adaptively determine the high and low thresholds of the Canny operator, thereby improving the detection efficacy and recognition precision of impurity edges. Zhang’s team [58,59] addressed the issues present in machine-harvested seed cotton images, which often contain excessive noise and entangled fibers. They replaced Gaussian filtering with mean and non-local mean denoising techniques. This change significantly improved the detection algorithm’s ability to resist interference. Edge detection effectively delineates the boundaries of FFs by capturing local intensity changes. However, in complex cotton backgrounds where fibers are entangled or textured, edge detection methods may produce fragmented contours. Researchers are investigating methods that incorporate wider regional features to achieve more comprehensive and consistent detection.

4.1.3. Region Feature Extraction-Based Detection Methods

Methods based on region feature extraction overcome the limitations of pixel-level and edge-based techniques by combining various features, including color, texture, and shape. This integration enables a more thorough analysis and ultimately improves the accuracy of detecting FFs in cotton. Color features offer global information regarding pixel-level color distribution and are commonly utilized for the initial screening of FF. Texture features measure the roughness, directionality, and structural orderliness of the targets using the GLCM, with common parameters including energy, contrast, correlation, and entropy. Shape features, including contour shapes and perimeter-area ratios, assist in identifying FF, typically in conjunction with color and texture features to enhance detection accuracy. Notable methods include Du et al. [60], who accurately located FF by clustering analysis of color features, combined with morphological parameters like area and perimeter; Zhang et al. [61], who achieved multi-feature fusion classification using the watershed algorithm and SVM; Dai et al. [62], who identified FF based on their deviation from the red-green-blue (RGB) “cylinder” color domain; and Wang [63] and Zhang et al. [64], who used GLCM to extract FF texture features and integrated them with an SVM classifier for recognition and classification.

4.1.4. Limitations of Traditional Image Detection Methods

Traditional image detection methods have established a technical foundation for detecting FFs in cotton. These methods provide certain advantages in relatively ideal imaging conditions, such as clear backgrounds and uniform lighting. For instance, grayscale difference-based threshold segmentation can rapidly extract targets [46]. Additionally, the enhanced Canny operator, which incorporates optimized filtering and threshold selection strategies, excels in edge detection completeness, noise resistance, and positioning accuracy [55,56,57,58,59]. Furthermore, region segmentation improves global analytical capabilities by utilizing multi-feature fusion [60,61,62,63,64]. However, the intricacies of cotton processing environments and the variety of FF types gradually expose the limitations of these traditional methods. Table 3 delineates the constraints of traditional image processing methods in identifying FFs in cotton, as summarized and analyzed in the pertinent literature.
In summary, traditional image processing methods that use low-level features like image grayscale and gradients have trouble fully describing the semantic information of foreign fibers. Their linear classifiers also do not work well for finding nonlinear relationships between features. These technical restrictions make it easy to find large, high-contrast FFs in raw cotton (ginned cotton fibers that have been preliminary pre-cleaned, with a relatively loose structure and uniform background). However, in the complex environment of seed cotton (uncleaned raw material with cotton seeds, numerous impurities, and fibers that are tightly tangled toachieveher), performance drops sharply because of seed occlusion, severe fiber entanglement, uneven layer thickness, and changing lighting. This leap in environmental complexity, stemming from the fundamental physical differences in the raw materials, is the core reason for the significant decline in the detection accuracy and robustness of traditional methods. Because of this, the research paradigm is changing from the conventional “manual feature design + rule-driven decision-making” method to data-driven machine vision methods as computer and AI technologies get better quickly. Cotton FF detection technology is moving from “reliance on human expertise” to a new level of “intelligent perception leap” by using the strengths of intelligent algorithms in autonomous feature learning and end-to-end decision optimization.

4.2. The Application and Challenges of Machine Learning Algorithms

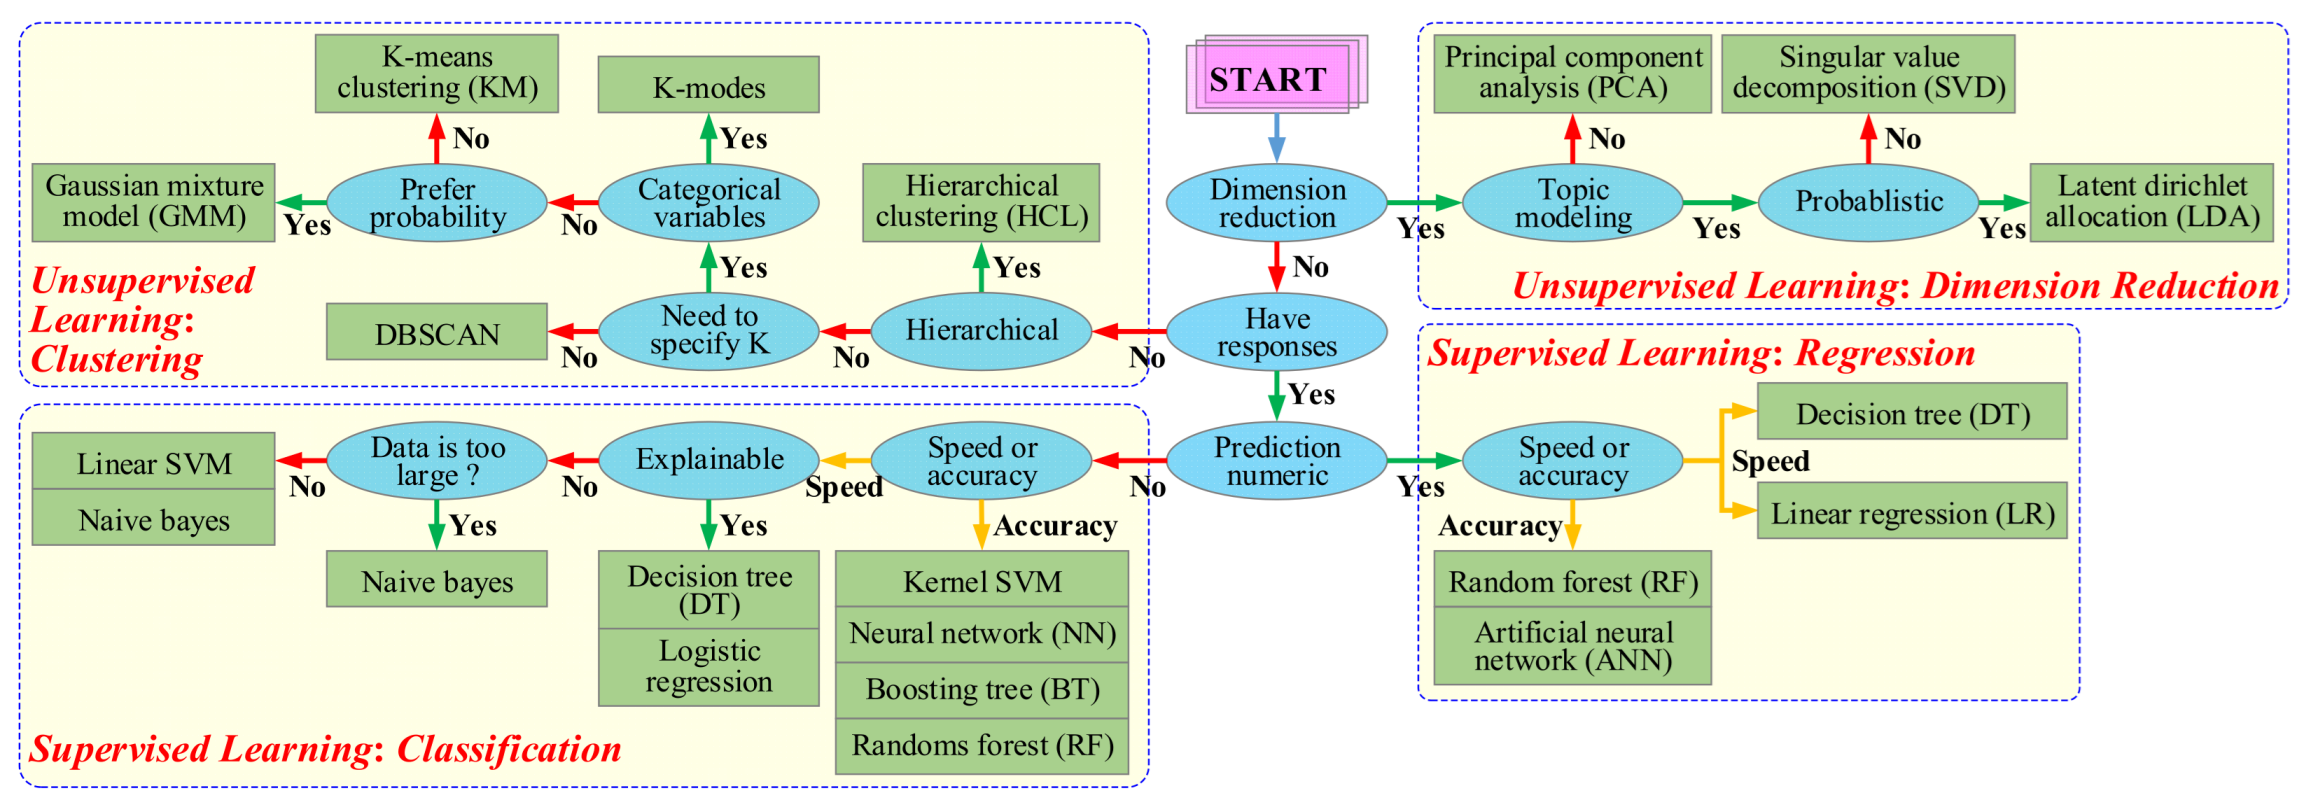
The objective of ML is to derive model parameters from data and subsequently employ the trained model for data analysis and informed decision-making. The fundamental tasks in ML encompass classification and prediction. Classification entails the synthesis of rules derived from existing data and categorizing newly input samples according to these rules. Prediction focuses on fitting the rules using historical data to infer the development trend of newly input samples based on those rules. The overview and classification of ML algorithms are shown in Figure 5. Methods include supervised, unsupervised, and reinforcement learning. Supervised learning depends on labeled data, providing benefits such as high model accuracy and robust interpretability. Conversely, unsupervised learning can reveal the intrinsic structure of data without necessitating labels, resulting in lower costs. However, it presents challenges in controlling model output and evaluating results. This aspect was validated in the research conducted by Fisher et al. [65], which evaluated the efficacy of three supervised learning models (artificial neural network (ANN), random forest (RF), and SVM) and three unsupervised learning models (K-means clustering (KM), hierarchical clustering (HCL), and Gaussian mixture model (GMM)) in the grades classification of Egyptian cotton lint. The results indicated that supervised learning models could classify effectively, although accuracy was influenced by human labeling errors. In contrast, unsupervised models encountered difficulties in fully classifying the grades. Furthermore, in the context of supervised learning, RF demonstrated the highest classification accuracy, attaining rates ranging from 82.13% to 90.21%. The main benefit of image processing was reducing impurities on color measurement impact. Dhanapal et al. [66] automated the classification of cotton fiber quality by integrating optimized principal component analysis (OPCA) with an improved fuzzy C-means clustering algorithm (IFCM), proposing the Hybrid-OPCA-IFCM framework and implementing it on the Hadoop platform. This hybrid algorithm significantly improved classification accuracy, but its generalization capabilities for other cotton varieties require further validation.
By integrating and advancing both supervised and unsupervised learning, the ML approach to cotton FF detection has gradually developed a technical system that spans from feature engineering to model optimization. This system offers essential technical assistance for improving cotton FF detection capabilities. However, it is important to note that the effectiveness of supervised learning is heavily dependent on the availability of large volumes of accurately labeled data. The accuracy of detection is susceptible to errors in manual labeling. Conversely, unsupervised learning encounters difficulties concerning result controllability and complex feature decoupling while also requiring higher-quality datasets.

4.3. The Evolution and Innovation of Deep Learning Models

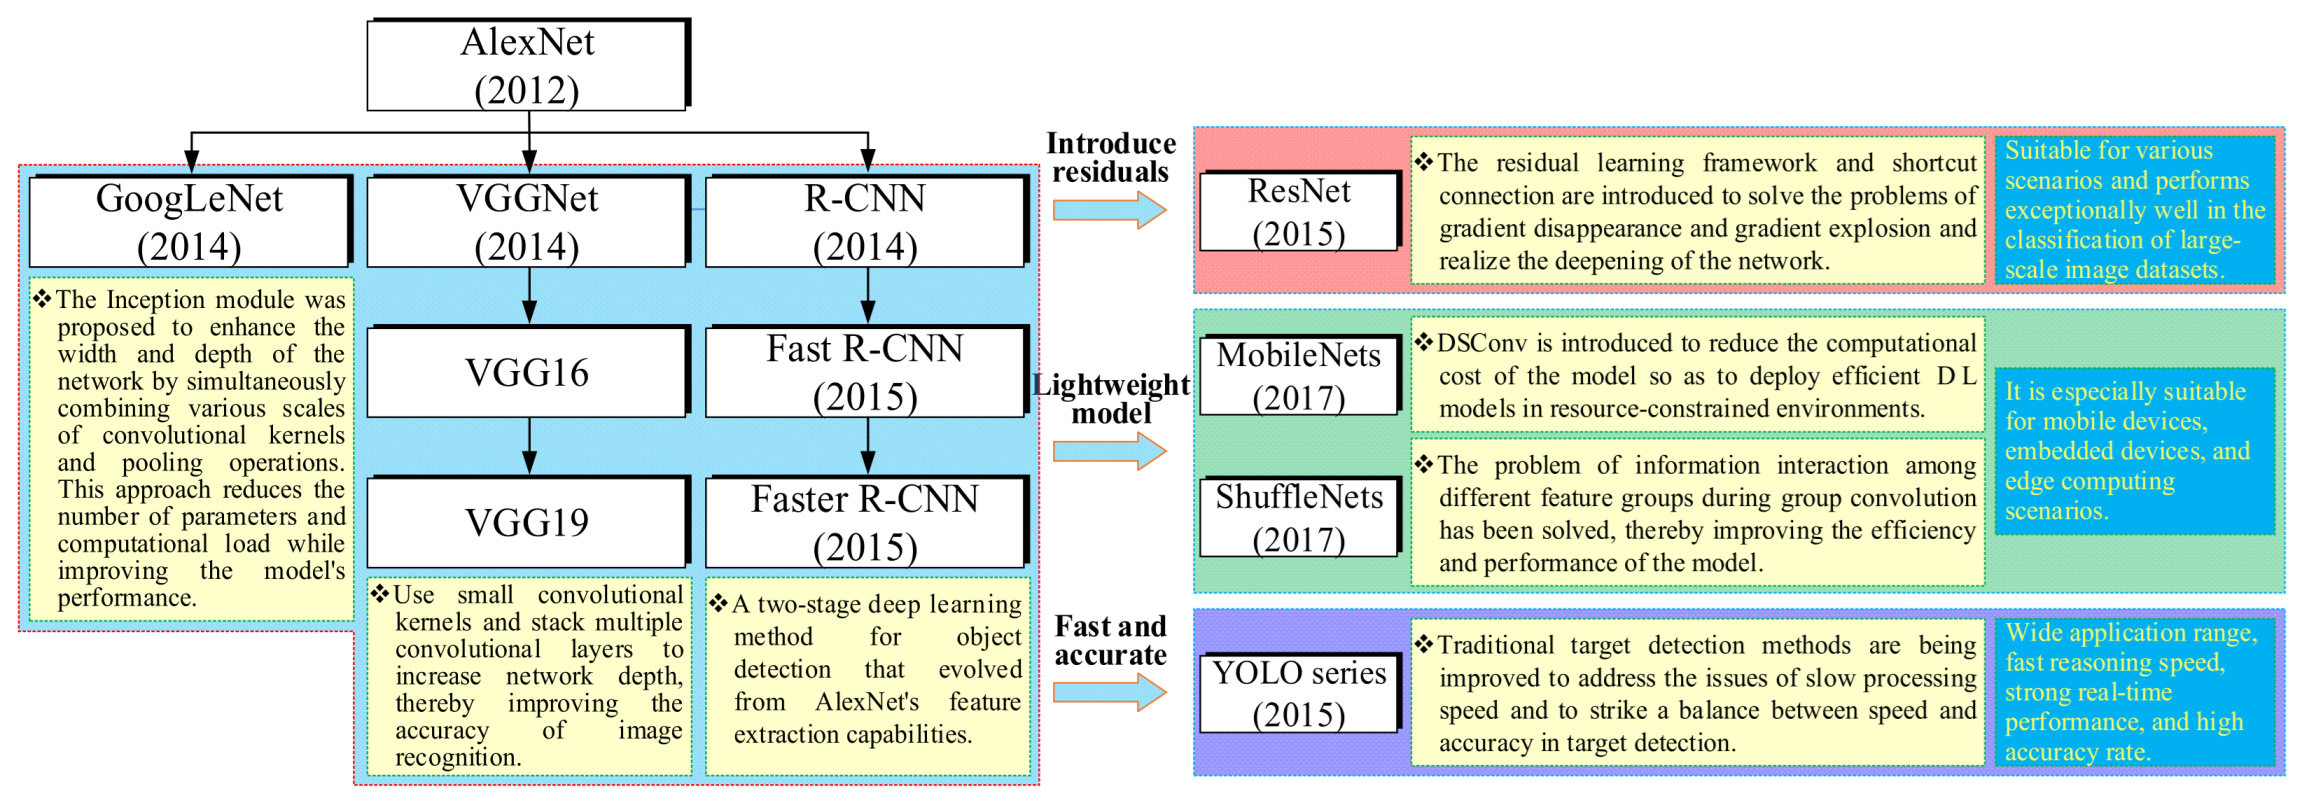
As one of the most significant branches of ML, DL has advanced rapidly in recent years. The introduction of the AlexNet model resolved the vanishing gradient problem and significantly increased computational speed by utilizing graphics processing units (GPUs), marking the beginning of a transformative period for DL technology. This advancement rapidly extended to the field of cotton FF detection. Distinct FF detection models can be constructed using the Visual Geometry Group (VGG) network, GoogLeNet, or Region-based Convolutional Neural Network (R-CNN) as foundational architectures and supplemented with additional technologies for modifications and enhancements. Figure 6 illustrates the evolution of DL in cotton FF detection. This ability to independently generate discriminative features via deep network architectures diminishes dependence on prior knowledge typically required in image processing methods, while simultaneously enhancing the model’s robustness against intricate environments and pseudo-FF through hierarchical abstraction mechanisms [67].

4.3.1. Breakthroughs in Feature Extraction with VGG and GoogLeNet

The VGG model builds upon the principles established by AlexNet. In contrast to AlexNet’s 8-layer pyramid structure, the VGG network can have as many as 19 layers, featuring a simpler and more diverse architecture. As the network depth increases, the features extracted by the convolutional layers become coarser. Cai et al. [68] utilized depthwise separable convolutions (DSConv) in their VGG16 model to augment the intricate features of each layer. They then combined and classified the output features from all layers using a fully connected layer, successfully achieving accurate classification of six types of FFs in cotton. Despite VGG’s greater depth, the increased complexity of the model results in more parameters, which can lead to overfitting, gradient vanishing, and a greater computational burden. In contrast, GoogLeNet diverged from merely deepening the network layers. Instead, it enhances complexity by broadening the network. This approach also helps avoid the complications associated with kernel selection. Moreover, GoogLeNet substitutes all fully connected layers with a simple global average pooling layer, thereby preserving parameters without a substantial increase in computational burden. Cai [69] conducted a comparative study on FF classification utilizing the AlexNet, VGG16, and GoogLeNet models. Their findings indicated that GoogLeNet achieved the highest classification accuracy at 86.22%. The integration of the rich-feature CNN from Cai et al. [68] led to a significant improvement in classification accuracy for all three models related to raw cotton FFs. The rich-feature-based GoogLeNet model achieved a peak classification accuracy of 93.53%, representing an approximate 7% increase compared to the original network.

4.3.2. Residual Network: Optimization of FF Detection in Complex Environments

The implementation of residual network (ResNet) mitigates the problems of gradient vanishing and network deterioration associated with increasing network depth. The fundamental concept of ResNet involves creating a “shortcut connection” between preceding and subsequent layers. This architecture not only reduces the problems of gradient vanishing and degradation—often caused by weights being less than 1 during the mapping process in network layers—but also improves the backpropagation of gradients during training. As a result, it facilitates the development of deeper CNNs [70]. Because of these advantages, ResNet has been widely utilized for identifying FFs in cotton within complex environments. A residual structure-based cotton FF detection model by Shi et al. [71] addresses the issues of FFs at different depths and hidden corners, which lead to subtle features and insufficient detection. This model combines surface-level FF details with deeper FF semantics. By enhancing the significance of FF features through an improved channel attention mechanism, the model significantly boosts the detection rate of both deep and surface-level mixed FFs. Li et al. [72] combined ResNet with NIR spectral features, attaining a remarkable accuracy of 99.7% in the classification of FFs within complex environments. However, the efficiency of NIR detection poses challenges for real-time applications. To address these issues, Wei [73] developed CottonNet, a foundational network for FF classification that strikes a balance between performance and computational efficiency. Targeted improvements included: (1) Enhancing the basic network to create CottonNet-Res, which offers better feature extraction of pseudo-FF by utilizing principles of ResNet; (2) Proposing a classification model known as CottonNet-Fusion, aimed at classifying FFs in complex environments and achieving over 90% classification accuracy. The aforementioned methods can attain more intricate and hierarchical FF features by augmenting the network’s “depth” and “width”. However, such approaches also result in complex network structures and cumbersome parameter settings, along with considerable deficiencies in computational power, speed, and storage capacity. These factors also hinder the application of certain theoretically beneficial network architectures in practical engineering projects.

4.3.3. Lightweight Model

In response to the demands of practical engineering applications, Google developed MobileNets, a lightweight and efficient neural network architecture designed specifically for mobile devices. The key innovation in MobileNets is the replacement of traditional convolution with DSConv. By defining DSConv as an independent layer, the architecture achieves significant parameter compression and enhances computational efficiency. In the context of cotton FF detection, challenges often arise from large model parameters and inadequate real-time performance, which can be attributed to issues such as diminished visibility of small target features and complex background interference. Current research typically employs a collaborative optimization strategy that combines a “lightweight backbone network” with an “enhancement mechanism”. This approach starts by utilizing DSConv to either reconstruct or directly transplant the MobileNets series as the backbone network for feature extraction, resulting in a lighter model. Following this, attention mechanisms and supplementary enhancement modules are added to boost detection accuracy [74,75]. For instance, Wu et al. [76] modified MobileNets by removing the pooling and fully connected layers to serve as the feature extraction network in the you only look once (YOLO) v3 model. This modification resulted in a 2.03% increase in the recognition accuracy of pseudo-FF and tripled the processing speed of the MobileNets-YOLOv3 model. Similarly, Guo et al. [77] substituted the backbone network of YOLOv8 with MobileNetv3, incorporating multi-dimensional collaborative attention (MCA) mechanisms to improve the model’s focus on small target FFs. They also developed a dynamic non-monotonic focusing loss function, WIoUv3, to optimize bounding box regression. The enhanced YOLOv8-MMW model achieves a detection accuracy of 95.2%, reduces the model weight by 56.7%, and reaches a detection frame rate of 367.8 FPS. In a similar vein, Hu et al. [78] replaced the backbone network in the single shot multibox detector (SSD) with MobileNetv2, employing the K-means++ algorithm to cluster the dimensions of cotton FF and adjust the sizes of candidate frames. Consequently, the lightweight model attained a mAP of 94.25% while reducing the parameter count by 80% compared to the original model.
The studies mentioned illustrate that employing a compressed DSConv implementation, along with an enhanced attention mechanism and an optimized loss function compensation strategy, can effectively address the challenges of speed and accuracy in lightweight models. This approach provides a reliable technical framework for detecting small target FFs in cotton and engineering applications.

4.3.4. Two-Stage Model and One-Stage Model

The primary objective of intelligent cotton fiber detection is to simultaneously generate category labels and positional coordinates for FF. R-CNN-based models, such as Fast R-CNN and Faster R-CNN, employ a cascaded processing flow: they first generate candidate target regions and then use classifiers for category classification. Faster R-CNN is particularly effective for detecting small FFs due to its robust multi-scale feature fusion capability. He et al. [27] tackled technical challenges, including shadow interference in seed cotton images and the complex, fragmented nature of FF. They developed a dual light source analysis framework that integrates Faster R-CNN with LED and line laser illumination. Their experiments revealed that the recognition rate for white FFs increased from 5.9% to 90.3% under a single LED illumination. However, when both light sources were used simultaneously, the accuracy dropped to 86.7%, lower than the single-light mode. Additionally, there was a lack of targeted performance evaluation for fiber classification. Following this, other researchers made strides in optimizing the feature extraction network. Du and Zhang et al. [79,80] replaced the original VGG16 backbone network with ResNet-50. Du [79] incorporated K-means++ to enhance the proposal generation strategy, resulting in an 18.6% increase in detection accuracy for slender and high-density FFs. Meanwhile, Zhang [80] introduced a feature pyramid network (FPN) to facilitate multi-scale feature fusion, which effectively mitigated the degradation of small target features caused by deep convolution. Comparative experiments indicated that the ResNet-50 + FPN method improved detection accuracy and recall rate by 9.2% and 15.8%, respectively, compared to the basic network, achieving 97.6% and 82.4%. Nevertheless, as the network depth increased, the model’s inference speed decreased, highlighting the trade-off between model accuracy and efficiency.
One-stage detection models, like the YOLO series, adopt an end-to-end regression strategy, unlike two-stage models that use a cascaded processing flow. This approach allows them to complete both object localization and classification tasks in a single forward pass. With their efficient network structures and robust feature extraction capabilities, the YOLO series has shown excellent generalization performance in cotton FF detection, establishing itself as one of the leading solutions in this field. Table 4 summarizes the recent applications of YOLO series models in cotton FF detection. Comparative analysis reveals that current research primarily focuses on identifying FFs in raw cotton and achieving high detection accuracy [75,81,82,83]. In contrast, studies targeting FFs in seed cotton are limited, largely due to complex factors such as fiber entanglement and seed occlusion, which pose greater challenges and lead to relatively lower speed or accuracy [84,85]. Employing the K-means clustering algorithm to refine bounding box sizes [81,82] can enhance detection performance and optimize accuracy. Additionally, incorporating attention mechanisms like the convolution block attention module (CBAM) [75] or the squeeze-and-excitation (SE) module has been found to significantly improve detection accuracy. For speed optimization, integrating lightweight networks, such as MobileNetv3 [76,77] and ShuffleNetv2 [83], can boost detection speed by at least 2%.
In general, the one-stage model streamlines the generation of target candidate regions relative to the two-stage model, yielding a more efficient structure and faster response speed. It is frequently utilized for detection tasks necessitating superior real-time performance. However, it encounters obstacles such as insufficient feature extraction and diminished detection capabilities for small targets, which constrain its efficacy in identifying minute FF in complex environments. The two-stage model can more accurately identify FF via a sequential cascaded screening process and exhibits enhanced adaptability to multi-scale targets. Nonetheless, this model has a slower detection speed, requires more complex parameter adjustments, and consumes more computational resources. In conclusion, both models exhibit unique advantages and disadvantages. Considering the complexities of the environment and the imperative for swift detection in cotton processing, it is advisable to tailor the model to particular engineering requirements to attain an equilibrium between detection accuracy and speed.
As shown in Table 4, current research is highly focused on FF detection in raw cotton, where the mAP generally exceeds 91%; in contrast, studies targeting seed cotton are scarce and report relatively lower speed or accuracy (approximately 88%). The main reason for this performance gap is that raw cotton is a pre-processed product that has been cleaned and had its seeds removed. It has smaller fiber interstices and a denser structure, which makes the contrast between FFs and cotton fibers stronger and makes detection easier for the algorithm. Conversely, seed cotton, which contains cotton seeds, impurities, and entangled fibers, must address complex technical challenges, such as unstable imaging quality due to uneven layer thickness, adhesion and entanglement between fibers and impurities, and seed occlusion.

4.3.5. Model Performance Evaluation Metrics

It is noteworthy that the model performance comparisons in Table 4 are primarily based on two metrics: mAP and FPS. This practice reflects a prevalent consensus in the current field. While mAP comprehensively reflects a model’s localization and classification capabilities, and FPS is crucial for its practical deployment, their combination provides an effective measure of overall model efficacy. However, a more in-depth and meticulous evaluation should also include the accuracy (Acc), precision (P), Recall (R), and average precision (AP) for each individual FF category to diagnose a model’s strengths and weaknesses on specific types. These metrics are calculated using the formulas shown in Equations (1)–(5).
Acc = TP + TN TP + TN + FP + FN ,
P = TP TP + FP ,
R = TP TP + FN ,
mAP = A P 1 + A P 2 + + A P n n ,
AP = 0 1 P ( R ) d R
where TP represents the count of positive samples correctly classified as positive, FN represents the count of positive samples incorrectly classified as negative, FP represents the count of negative samples incorrectly classified as positive, and TN represents the number of negative samples that are classified as negative. n represents the number of categories.
Currently, constrained by factors such as dataset scale, annotation costs, or evaluation priorities, most studies tend to report the aggregated mAP, while a widespread and standardized reporting convention for fine-grained, per-category performance analysis has yet to be fully established. Li et al. [85] did a great job with their improved YOLOv7 model. They reported the mAP and carefully listed the P, R, and AP values for different types of foreign fibers in Table 5. This more exhaustive evaluation approach facilitates a comprehensive understanding of model performance and the identification of detection bottlenecks for specific categories, providing an invaluable reference for subsequent research.

5. Conclusions and Outlook

5.1. Summary of Research Status

Recent progress in machine vision technology for detecting FFs in cotton has produced significant research outcomes. The main trend in development is toward more variety, more accuracy, and lighter solutions. Different types of imaging, such as X-ray, ultraviolet fluorescence, line laser, polarized light, IR, and hyperspectral imaging, present us with a lot of optical feature data that we need to determine complex and varied FFs. Threshold segmentation, edge detection, and region feature extraction are examples of traditional image processing algorithms that have laid the groundwork for FF detection. The incorporation of DL technology has progressed the intelligent detection of cotton FFs from theoretical research to practical engineering applications. Nonetheless, ongoing research still faces numerous unresolved fundamental challenges that impede further advancement.

5.2. Key Technical Bottlenecks: Linking Challenges to Reviewed Technologies

Based on the thorough review, we identify and connect the following specific technical problems to the shortcomings of current technologies.
Real-time processing vs. high-accuracy detection. There is a basic trade-off between how quickly something can be detected and how accurately it can be, which is worsened by the way some imaging methods work and how complicated the algorithms are. Hyperspectral and X-ray imaging, for instance, offer us a lot of information about features. However, their high data dimensionality and, in the case of X-ray, slower acquisition speeds make it very challenging to process data in real time. Two-stage DL models, like Faster R-CNN, are also very accurate, especially for small targets. However, they are too hard to use in real time. One-stage models that are lightweight, like the YOLO series, might not be able to find small or low-contrast FFs as well as traditional threshold-based methods can when the contrast is low.
Not having standardized, high-quality datasets. Data-driven methods, especially DL, work best when they have large, high-quality datasets that are always annotated. There are many different types of imaging modalities, each with its own data format and feature representation. There are also many different types of FF, which makes data sources fragmented. Because there are no standards, it is harder to make universal datasets, models cannot be generalized, and it is hard to compare results fairly across different studies. Furthermore, even when using similar data, there is a widespread lack of consistent performance evaluation protocols across studies (e.g., whether per-category metrics are reported, definitions of positive/negative samples, etc.). This absence of standardized evaluation makes the model performance metrics (e.g., precision, recall, average precision) reported in different literature strictly incomparable, further hindering a clear assessment of technological progress and direct cross-study benchmarking.
Effective multi-modal information fusion. There is no one imaging technology that works best for all FF types in all situations (see Table 1). Ultraviolet fluorescence works well for some synthetic fibers but fails for contaminants that do not fluoresce. Polarized light works well for clear films but may not work for colored fibers. The current challenge is to create strong frameworks that can effectively combine information from multiple sensors or imaging modalities (multi-light source systems, combined spectral-spatial data) to achieve full and accurate detection in environments that are complex and changeable.

5.3. Directions for Future Research

To tackle the aforementioned bottlenecks, subsequent research should prioritize the following avenues.
Creating algorithm-hardware co-designed systems for real-time precision. Future work should focus on co-designing lightweight yet accurate DL architectures (like improved versions of YOLO and neural architecture search) with efficient dedicated hardware (such as edge computing devices and FPGA/ASIC acceleration). This includes leveraging knowledge distillation and pruning methods to transfer the capabilities of accurate but complicated models into lightweight versions that meet the high-speed demands of real production lines. However, it is crucial to recognize that there is no universally “optimal” single-point technology for engineering cotton FF detection systems. Instead, an optimal balance must be found for a specific application scenario between several goals: detection accuracy, processing speed, system cost, and environmental robustness. For instance, high-end textile production lines with strict quality standards may prefer high-precision imaging with complex algorithms, even though it costs more and takes longer to process. In contrast, the initial sorting of bulk raw materials should prioritize lightweight solutions characterized by high frame rates, low cost, and ease of integration and maintenance.
Creating open, standardized, and multi-modal datasets. We need to quickly make large, annotated datasets that cover a wide range of FF types, cotton varieties (especially seed cotton), and imaging conditions available to the public. These datasets should ideally contain aligned data from various imaging modalities (e.g., synchronized RGB, near-infrared, and laser scan images). Standardized annotation protocols and benchmark challenges will advance the field and mitigate the issues of data scarcity and inconsistency.
Advancing intelligent multi-modal fusion and adaptive systems. Research should evolve from fundamental feature concatenation to advanced fusion methodologies (e.g., attention-based fusion, cross-modal learning) that dynamically evaluate the relevance of diverse imaging modalities based on contextual factors. Furthermore, it is important to build systems with adaptive lighting (multi-light source precision systems) and algorithms that can change themselves based on the weather (e.g., when the lighting changes or the cotton layer density changes). This direction is meant to create strong systems that use the best parts of different technologies to navigate around the problems that come up with any one method. This plan directly addresses the need for effective multi-modal fusion.

Author Contributions

Conceptualization, G.G. and F.Z.; methodology, G.G.; software, Y.W. (Yasong Wang); formal analysis, F.Z.; investigation, F.Z.; resources, L.H.; data curation, F.Z., L.H. and Y.W. (Yasong Wang); writing—original draft preparation, G.G. and F.Z.; writing—review and editing, F.Z., Y.W. (Yiping Wang) and X.Z.; visualization, L.H. and Y.W. (Yasong Wang); supervision, G.G.; project administration, G.G.; funding acquisition, L.H., Y.W. (Yasong Wang) and Y.W. (Yiping Wang). All authors have read and agreed to the published version of the manuscript.

Funding

This research was funded by the Regional Innovation Cooperation Project of Sichuan Provincial Department of Science and Technology (grant No. 2025YFHZ0283), the Basic Scientific Research Business Expenses Projects of Autonomous Region Universities (grant No. XJEDU2024Z008), the Xinjiang Uygur Autonomous Region “Tianshan Talent” Training Program Projects (grant No. 2023TSYCJC0036), the Scientific Research Start-up Fund of China University of Petroleum-Beijing at Karamay (grant No. XQZX20250016), and the Research Foundation of China University of Petroleum-Beijing at Karamay(grant No. XQZX20240021).

Data Availability Statement

All relevant data are within the paper.

Conflicts of Interest

The authors declared no potential conflicts of interest with respect to the research, authorship, and/or publication of this article.

References

  1. National Bureau of Statistics of China. China Statistical Yearbook 2025; Statistics Press: Beijing, China, 2025; pp. 379–383. [Google Scholar]
  2. USDA Foreign Agricultural Service. Available online: https://www.fas.usda.gov/data/production/commodity/2631000 (accessed on 16 January 2025).
  3. Khan, M.A.; Wahid, A.; Ahmad, M.; Tahir, M.T.; Ahmed, M.; Ahmad, S.; Hasanuzzaman, M. World cotton production and consumption: An overview. In Cotton Production and Uses; Ahmad, S., Hasanuzzaman, M., Eds.; Springer: Singapore, 2020; pp. 1–7. [Google Scholar]
  4. Zhang, J.; Zhu, Y.; Kole, C. World cotton production, genetic diversity, genetic grain, and genomics. In The Cotton Genome; Zhang, J., Kole, C., Zhu, Y., Eds.; Springer: Cham, Switzerland, 2025; pp. 1–20. [Google Scholar]
  5. Mishra, P.K.; Sharma, A.; Prakash, A. Current research and development in cotton harvesters: A review with application to Indian cotton production systems. Heliyon 2023, 9, e16124. [Google Scholar] [CrossRef] [Scilit]
  6. Sun, S.; Gao, G.; Tan, J.; Xu, L.; Huang, L. Segmentation method for foreign fibers in cotton based on improved simple linear iterative clustering algorithm and SVM. Text. Res. J. 2025, 1–14. [Google Scholar] [CrossRef] [Scilit]
  7. Mei, S.; Li, K.; Wu, X.; Chen, J. Analysis of progress in research on technology for the detection and removal of foreign fibers. Text. Res. J. 2025, 95, 175–193. [Google Scholar]
  8. GB1103.1-2023; Cotton-Part 1: Saw Ginned Upland Cotton. National Standardization Administration of the People’s Republic of China: Beijing, China, 2012; pp. 1–13.
  9. Chen, Y.; Wu, T.; Shi, S.; Zhao, B.; Yang, S. Review of cotton foreign fiber detection method using optical imaging. Laser Optoelectronics. Prog. 2021, 58, 138–154. [Google Scholar]
  10. Shu, Y.; Zhao, L.; Jiang, J.; Yan, Z.; Luo, J.; Liu, X. Research progress of X-ray luminescence optical tomography. Chin. Sci. Bull. 2017, 62, 3838–3850. [Google Scholar] [CrossRef] [Scilit]
  11. Pai, A.; Sari-Sarraf, H.; Hequet, E.F. Recognition of cotton contaminants via X-Ray microtomographic image analysis. IEEE Trans. Ind. Appl. 2004, 40, 77–85. [Google Scholar] [CrossRef] [Scilit]
  12. Pavani, S.K.; Dogan, M.S.; Sari-Sarraf, H.; Hequet, E.F. Segmentation and classification of four common cotton contaminants in X-ray microtomographic images. In Proceedings of the Machine Vision Applications in Industrial Inspection XII, San Jose, CA, USA, 18–22 January 2004. [Google Scholar]
  13. Dogan, M.S. Assessment of Trash Content of Cotton Using 2D X-Ray Imagery. Master’s Thesis, Texas Tech University, Lubbock, TX, USA, 2004. [Google Scholar]
  14. Dogan, M.S.; Sari-Sarraf, H.; Hequet, E.F. Cotton trash assessment in radiographic X-ray images with scale-space filtering and stereo analysis. In Proceedings of the Machine Vision Applications in Industrial Inspection XIII, San Jose, CA, USA, 17–20 January 2005. [Google Scholar]
  15. Luo, D.; Zhu, B.; Li, X. Fluorescence effect of ultraviolet and its application in detection of foreign fibers in cotton. J. Henan Univ. Sci. Technol. (Nat. Sci.) 2007, 28, 63–66. [Google Scholar]
  16. Song, X.; Qi, Q.; Zhou, X.; Zeng, Z.; Wu, Q.; Xu, W.; Wang, K.; Zhou, B. Detection of foreign fibers in cotton based on ultraviolet fluorography and image processing. Shanghai Text. Sci. Technol. 2019, 47, 86–88, 92. [Google Scholar]
  17. Zhou, F.; Ding, T. White trash detection of cotton lint with ultraviolet-induced fluorescence imaging method. In Proceedings of the Sixth International Symposium on Precision Engineering Measurements and Instrumentation, Hangzhou, China, 8–11 August 2010. [Google Scholar]
  18. Zhou, F.; Ding, T. Detection of cotton lint trash within the ultraviolet-visible spectral range. Appl. Spectrosc. 2010, 64, 936–941. [Google Scholar] [CrossRef] [Scilit] [PubMed]
  19. Mustafic, A.; Li, C.; Haidekker, M. Blue and UV LED-induced fluorescence in cotton foreign matter. J. Biol. Eng. 2014, 8, 29. [Google Scholar] [CrossRef] [Scilit]
  20. Zheng, P. The Design and Implementation of Automatic Detection System of Foreign Fiber in Cotton Based on Multi Pattern Classification Algorithm. Master’s Thesis, Henan University of Science and Technology, Luoyang, China, 2017. [Google Scholar]
  21. Du, Y.; Yang, C.; Jiang, X.; Liu, R.; Cai, W. Optimization design of multi-light source for foreign fiber detection based on clustering neural network. J. Text. Res. 2017, 38, 104–112. [Google Scholar]
  22. Hua, C.; Su, Z.; Qiao, L.; Shi, J. White foreign fibers detection in cotton using line laser. Trans. Chin. Soc. Agric. Mach. 2012, 43, 181–185. [Google Scholar]
  23. Liu, F.; Su, Z.; Qiao, L. Linear laser detecting method of white foreign fibers in cotton based on sample cross-section imaging. Trans. Chin. Soc. Agric. Mach. 2013, 44, 215–218+256. [Google Scholar]
  24. Liu, X.; He, X.; Su, Z.; Liu, F.; Wang, D.; Gu, Q. Laser imaging method for fast detecting white foreign fibers in cotton. Trans. Chin. Soc. Agric. Eng. 2014, 30, 190–196. [Google Scholar]
  25. Zhang, L.; Wei, P.; Wu, J.; Liu, X.; Su, Z. Detection method of foreign fibers in cotton based on illumination of line-laser and LED. Trans. Chin. Soc. Agric. Eng. 2016, 32, 289–293. [Google Scholar]
  26. Wei, P.; Zhang, L.; Liu, X.; Wang, D.; Su, Z. Detecting method of foreign fibers in seed cotton using double illumination imaging. J. Text. Res. 2017, 38, 32–38. [Google Scholar]
  27. He, X.; Wei, P.; Zhang, L.; Deng, B.; Pan, Y.; Su, Z. Detection method of foreign fibers in seed cotton based on deep-learning. J. Text. Res. 2018, 39, 131–135. [Google Scholar]
  28. Ren, L.; Liang, J.; Qu, E.; Zhang, W.; Du, B.; Ma, F.; Guo, S.; Zhang, J. Polarimetric optical imaging: Devices, technologies and applications (Invited). Acta Photonica Sin. 2022, 51, 0851505. [Google Scholar]
  29. Peng, B.; Huang, S.; Li, D. Detection of colorless plastic contaminants hidden in cotton layer using chromatic polarization imaging. Chin. Opt. Lett. 2015, 13, 81–85. [Google Scholar] [CrossRef] [Scilit]
  30. Jia, X. Application of Chaoyue M foreign fiber cleaner. Cotton Text. Technol. 2016, 44, 48–51. [Google Scholar]
  31. Zhang, C.; Sun, S.; Shi, W.; Zeng, L.; Deng, D. Design and test of foreign fiber removal machine based on embedded system. Trans. Chin. Soc. Agric. Mach. 2017, 48, 43–52. [Google Scholar]
  32. Wang, T. Research on Anisotropy of Collagen Fibers Based on Polarized Photoacoustic Imaging. Ph.D. Thesis, Beijing Union Medical College, Beijing, China, 2021. [Google Scholar]
  33. Tang, F.; Yao, Y.; Shao, Y.; Cai, J.; Shen, X.; Liao, W. Wavelength selection method for cotton fibers based on theoretical absorption spectra. Jiangsu Agric Sci. 2019, 47, 207–209+219. [Google Scholar]
  34. Cintrón, M.S.; Rodgers, J.E. Identification of common cotton contaminants using an FTIR microscope with a focal plane array detector. AATCC J. Res. 2017, 4, 12–17. [Google Scholar] [CrossRef] [Scilit]
  35. Cai, X.; Wu, L.; Liang, H.; Chen, J. Cotton foreign fiber detection based on near-infrared imaging technology. Cotton Text. Technol. 2021, 49, 6–10. [Google Scholar]
  36. Du, Y.; Li, X.; Ren, W.; Zuo, H. Application of near-infrared spectroscopy and CNN-TCN for the identification of foreign fibers in cotton layers. J. Nat. Fibers. 2023, 20, 2172638. [Google Scholar] [CrossRef] [Scilit]
  37. Han, J.; Guo, J.; Zhang, Z.; Yang, X.; Shi, Y.; Zhou, J. The rapid detection of trash content in seed cotton using near-infrared spectroscopy combined with characteristic wavelength selection. Agriculture 2023, 13, 1928. [Google Scholar] [CrossRef] [Scilit]
  38. Li, Q.; Zhou, W.; Zhang, X.; Li, H.; Li, M.; Liang, H. Cotton-Net: Efficient and accurate rapid detection of impurity content in machine-picked seed cotton using near-infrared spectroscopy. Front. Plant Sci. 2024, 15, 1334961. [Google Scholar] [CrossRef] [Scilit]
  39. Liang, H.; Zhang, H.; Cong, M.; Chen, Z.; Sun, C. Research progress of hyperspectral imaging technology in textile testing. Adv. Text. Technol. 2022, 30, 211–218+260. [Google Scholar]
  40. Wu, Y.; Jin, X.; Feng, J.; Zhang, H.; Qiu, Y.; Yang, J.; Cong, M.; Zhu, C. Cotton impurity detection based on hyperspectral imaging technology. Adv. Text. Technol. 2024, 32, 46–54. [Google Scholar]
  41. Liu, W.; Shi, Y.; Tian, H.; Guo, J.; Li, X.; Huang, H.; Shi, Z. Detection method for ginned cotton impurities based on hyperspectral reflection, transmission and reflection-transmission imaging mode. Adv. Text. Technol. 2019, 27, 44–49. [Google Scholar]
  42. Chang, J.; Zhang, R.; Pang, Y.; Zhang, M.; Zha, Y. Classification of impurities in machine-harvested seed cotton using hyperspectral imaging. Spectrosc. Spectr. Anal. 2021, 41, 3552–3558. [Google Scholar]
  43. Liu, Z.; Zhao, L.; Yu, X.; Zhang, Y.; Cui, J.; Ni, C.; Zhang, L. Intelligent identification of film on cotton based on hyperspectral imaging and convolutional neural network. Sci. Prog. 2022, 105, 1–21. [Google Scholar] [CrossRef] [Scilit]
  44. Wei, Z.; Wang, J.; Zhang, R.; Zhang, M. Classification of foreign matter in cotton using line scan hyperspectral transmittance imaging. Spectrosc. Spectr. Anal. 2023, 43, 3230–3238. [Google Scholar]
  45. Xiao, L. Research on Improvement and Application of Otsu Image Segmentation Method. Ph.D. Thesis, Hunan University, Changsha, China, 2022. [Google Scholar]
  46. Yang, L. A Review of Threshold-based Image Segmentation Algorithms: Principles, Classification and Typical Algorithms. J. Shenyang Norm. Univ. Nat. Sci. 2023, 41, 526–529. [Google Scholar]
  47. Yuan, X.; Huang, Z.; Ma, Y.; Liu, B. Analysis of characteristics and application of Otsu threshold method. J. Nanchang Inst Technol. 2019, 38, 85–90. [Google Scholar]
  48. Liu, G.; Wang, S.; Cao, Y.; Zhao, E.; Zhang, L.; Su, L.; Xing, C. Application of several classical threshold segmentation methods in image processing. J. Huanggang Polytech. 2022, 24, 99–103. [Google Scholar]
  49. Liu, J. Research on Key Techniques of Cotton Foreign Fiber Recognition Based on Image Vision. Ph.D. Thesis, Shandong University, Jinan, China, 2020. [Google Scholar]
  50. Qi, Y. Rapid detection of raw cotton seed-breaking impurities using improved OTSU method. Wool Text. J. 2022, 50, 90–94. [Google Scholar]
  51. Wang, Z.; Xia, B. Design of cleaning system for large size seed cotton foreign fiber incorporating image processing. Electron. Des. Eng. 2023, 31, 173–176. [Google Scholar]
  52. Du, L.; Li, L.; Wang, J.; Wan, X.; Chen, X.; Li, G. Comparison of several fabric defect detection methods based on image self-adaptive threshold segmentation. J. Text. Res. 2014, 35, 56–61. [Google Scholar]
  53. Wan, L.; Pang, Y.; Zhang, R.; Jiang, Y.; Zhang, M.; Song, F.; Chang, J.; Xia, B. Rapid measurement system for the impurity rate of machine-picked seed cotton in acquisition. Trans. Chin. Soc. Agric. Eng. 2021, 37, 182–189. [Google Scholar]
  54. Ren, W.; Du, Y.; Zuo, H.; Yuan, R. Research progress in image segmentation and edge detection methods for alien fibers detection in cotton. J. Text. Res. 2021, 42, 196–204. [Google Scholar]
  55. Xia, B.; Wang, Z.; Gao, H. Applicability analysis of image segmentation methods in cotton fiber visual inspection. China Cotton Process. 2019, 3, 7–10. [Google Scholar]
  56. Wang, F.; Jin, X. Applicability analysis of raw cotton impurity image recognition based on edge detection algorithm. Adv. Text. Technol. 2019, 27, 39–43. [Google Scholar]
  57. Yu, H.; Xia, B.; Wang, Z. Automatic identification of cotton surface impurities based on image processing. Shanghai Text. Sci. Technol. 2020, 48, 17–19. [Google Scholar]
  58. Zhang, C.; Li, T.; Li, J. Detection of impurity rate of machine-picked cotton based on improved canny operator. Electronics 2022, 11, 974–997. [Google Scholar] [CrossRef] [Scilit]
  59. Li, T. Research on Classification, Identification and Detection Technology of Impurities in Machine-Picked Seed Cotton. Master’s Thesis, University of Jinan, Jinan, China, 2022. [Google Scholar]
  60. Du, Y.; Wang, J.; Jiang, X.; Zhou, G.; Luo, Y. Algorithm for pattern detection of cotton foreign fibers based on cluster statistic analysis. J. Text. Res. 2015, 36, 135–139. [Google Scholar]
  61. Zhang, C.; Li, L.; Dong, Q.; Ge, R. Detection method for machine-harvested cotton impurities based on region color segmentation. J. Text. Res. 2017, 38, 135–141. [Google Scholar]
  62. Dai, Y.; Jiao, Z. Research and implementation of cotton foreign fiber real-time sorting algorithm based on DSP. Bull. Sci. Technol. 2017, 33, 203–207. [Google Scholar]
  63. Wang, F.; Xu, Z.; Wang, Z.; Wang, S.; Tao, W. Identification technology of cotton flax fiber based on textural feature. Cotton Text. Technol. 2016, 44, 1–5. [Google Scholar]
  64. Zhang, Y.; Xu, J.; Wang, Z.; Shi, P. Optimization of cotton heterosexual detection technology based on machine vision. J. Chin. Agric. Mech. 2018, 39, 61–65. [Google Scholar]
  65. Fisher, O.J.; Rady, A.; El-Banna, A.A.; Watson, N.J.; Emaish, H.H. An image processing and machine learning solution to automate Egyptian cotton lint grading. Text. Res. J. 2023, 93, 2558–2575. [Google Scholar] [CrossRef] [Scilit]
  66. Dhanapal, R.; Selvapandian, D. Optimized fuzzy C-means clustering algorithm for cotton fibre quality analysis. Mater. Today Proc. 2021, 45, 2082–2086. [Google Scholar] [CrossRef] [Scilit]
  67. Yan, Y.; Li, C.; Chen, Y.; Ji, X.; Tan, X. Application of real-time machine vision technology in intelligent textile production. J. Donghua Univ. (Nat. Sci.) 2025, 12, 5–24. [Google Scholar]
  68. Cai, Y.; Wu, J.; Zhang, C. Classification of trash types in cotton based on deep learning. In Proceedings of the 38th Chinese Control Conference (CCC), Guangzhou, China, 27–30 July 2019. [Google Scholar]
  69. Cai, Y. Research on Classification of Foreign Fibers in Cotton Based on Deep Learning. Master’s Thesis, Wuhan University of Science and Technology, Wuhan, China, 2019. [Google Scholar]
  70. Shafiq, M.; Gu, Z. Deep residual learning for image recognition: A survey. Appl. Sci. 2022, 12, 8972. [Google Scholar] [CrossRef] [Scilit]
  71. Shi, H.; Wei, Y.; Guan, S.; Li, Y. Cotton foreign fibers detection algorithm based on residual structure. J. Text. Res. 2023, 44, 35–42. [Google Scholar]
  72. Li, X.; Du, Y.; Ren, W.; Zuo, H. Classification and identification of foreign fibers based on near-infrared spectroscopy and ResNet. J. Text. Res. 2023, 44, 84–92. [Google Scholar]
  73. Wei, W. Research and Implementation on Defect Detection Model for Foreign Fibers and Fabrics. Ph.D. Thesis, Wuhan University, Wuhan, China, 2021. [Google Scholar]
  74. Wu, Z.; Shi, H. Recognition of foreign fiber in cotton based on DSConv and CBAM. Cotton Text. Technol. 2022, 50, 19–23. [Google Scholar]
  75. Pan, Y.; Zhang, S.; Yang, W. Detection method of foreign fiber in cotton based on improved YOLOv5. Cotton Text. Technol. 2022, 50, 37–43. [Google Scholar]
  76. Wu, M.; Wu, J.; Zhang, C.; Zhu, L. Detection of foreign fiber in cotton based on improved YOLOv3. Chin. J. Liq. Cryst. Disp. 2020, 35, 1195–1203. [Google Scholar] [CrossRef] [Scilit]
  77. Guo, D.; Li, J.; Hu, L.; Nie, J.; Yang, S.; Yang, H.; Zhang, L.; Zhou, J.; Feng, Y. Research on defective cotton foreign fiber detection algorithm based on lightweight YOLOv8. J. Shihezi Univ. (Nat. Sci.) 2024, 42, 765–774. [Google Scholar]
  78. Hu, S.; Wang, Z.; Zhang, S.; Li, B.; Zhao, X.; Liu, W. Improved SSD foreign fiber detection method based on convolutional neural network lightweighting. Comput. Integr. Manuf. Syst. 2025, 31, 171–181. [Google Scholar]
  79. Du, Y.; Dong, C.; Zhao, D.; Ren, W.; Cai, W. Application of improved Faster RCNN model for foreign fiber identification in cotton. Laser Optoelectron. Prog. 2020, 57, 132–141. [Google Scholar] [CrossRef] [Scilit]
  80. Zhang, Y.; Zhang, S.; Feng, Z. Improved Faster RCNN target detection method for foreign fiber in cotton. Cotton Text. Technol. 2022, 50, 37–41. [Google Scholar]
  81. Zuo, H. Research on Foreign Fibers Recognition Based on Deep Learning. Master’s Thesis, Tiangong University, Tianjin, China, 2022. [Google Scholar]
  82. Feng, J. Southern Xinjiang Cotton Based on YOLOv5 and U-Net++ Research on Abnormal Fiber Image Detection Technology. Master’s Thesis, Tarim University, Alar, China, 2023. [Google Scholar]
  83. Wang, R.; Zhang, Z.; Yang, B.; Xi, H.; Zhai, Y.; Zhang, R.; Geng, L.; Chen, Z.; Yang, K. Detection and classification of cotton foreign fibers based on polarization imaging and improved YOLOv5. Sensors 2023, 23, 4415. [Google Scholar] [CrossRef] [Scilit]
  84. Zhang, C.; Li, T.; Zhang, W. The detection of impurity content in machine-picked seed cotton based on image processing and improved YOLO V4. Agronomy 2021, 12, 66–86. [Google Scholar] [CrossRef] [Scilit]
  85. Li, Q.; Ma, W.; Li, H.; Zhang, X.; Zhang, R.; Zhou, W. Cotton-YOLO: Improved YOLOV7 for rapid detection of foreign fibers in seed cotton. Comput. Electron. Agric. 2024, 219, 108752. [Google Scholar] [CrossRef] [Scilit]
Figure 1. Cotton cultivated area and production in China (2015–2025).
Agronomy 16 00295 g001
Figure 2. Global cotton production ranking and share by country (2024–2025).
Agronomy 16 00295 g002
Figure 3. Schematic of cotton FF types and their contamination routes. The arrows show the primary pathways through which FFs are introduced during harvesting, transportation, and storage.
Agronomy 16 00295 g003
Figure 4. FF detection system schematic diagram. Arrows indicate the direction of cotton flow and information processing within the system.
Agronomy 16 00295 g004
Figure 5. Overview and classification of ML algorithms.
Agronomy 16 00295 g005
Figure 6. The evolution of DL in cotton FF detection. The black arrows illustrate the evolution of foundational network architectures. The blue arrows highlight three key developmental directions of cotton FF detection models throughout this evolution: introducing residual connections to create deeper networks, implementing lightweight model design, and balancing detection speed and accuracy.
Agronomy 16 00295 g006
Table 1. Comparative analysis of imaging modalities: applicability, advantages, and limitations.
Imaging MethodRange of ApplicationAdvantagesLimitationsRef. *
X-rayThis method effectively identifies FFs in raw cotton that exhibit distinct morphological differences compared to cotton fibers.Its superior penetrability facilitates precise imaging of FFs through different thicknesses of cotton, yielding high classification accuracy.The high hardware cost, slow imaging speed, and radiation safety constraints present challenges for widespread adoption.[9,10,11,12,13,14]
Ultraviolet fluorescenceThis method is suitable for detecting natural-color FFs with fluorescence properties, such as polypropylene.Different fibers can be distinguished based on their fluorescence characteristics, offering low cost and easy operation.It requires high-intensity light sources, which typically need to be combined with other illumination. Improper adjustment can lead to spectral interference.[15,16,17,18,19,20,21]
Line laserThis method is suitable for detecting white FFs, especially those that are optically dense.Its high brightness, contrast, and directionality enable the rapid detection of large cotton samples.Maintaining optimal wavelength and camera exposure requires continuous adjustment of the line light source’s parameters, such as wavelength and power.[22,23,24,25,26,27]
Polarized lightThis method detects transparent or semi-transparent film-like FFs.It enables accurate identification of transparent films and is effective for detecting embedded FFs within cotton.Precise alignment of the polarizer angle is challenging when dealing with diverse FF types, affecting consistent detection.[28,29,30,31,32]
Infrared-rayThis method detects wood chips, non-fluorescent white fibers, feather-like fibers, and other impurities with significant differences in infrared characteristics.It enables effective analysis of small samples and individual fibers with a high detection rate, achieved by combining image and spectral information.It suffers from high hardware costs and slow imaging speed.[33,34,35,36,37]
HyperspectralThis method is effective for detecting most types of FF contaminants and is suitable for impurity classification and quantitative assessment.It provides both target image information and full-band spectral data, facilitating “image-spectrum integration” and leading to higher detection rates.It involves complex data processing and high experimental costs.[39,40,41,42,43,44]
* Ref. is the abbreviation of reference.
Table 2. Characteristic analysis of edge detection operators.
OperatorOrderCharacteristic AnalysisRef. 1
PrewittFirst-order differential operatorThis operator is easy to implement and computationally efficient. It generally provides more accurate edge detection than the Roberts operator and offers modest noise suppression. However, its edge continuity and smoothness are inferior to those of the Sobel and Canny operators, which can lead to false edges. It is suitable for general edge detection tasks where processing speed is prioritized over high precision.[54,59]
RobertsThis algorithm employs local differential operators for edge detection and provides high localization accuracy for edges. It is particularly effective for image segmentation tasks in high signal-to-noise ratio scenarios. However, it lacks inherent noise suppression, which can lead to substantial loss of edge information under low signal-to-noise conditions.[54,55,56,59]
SobelThis operator effectively suppresses noise and is particularly adept at detecting horizontal and vertical edges. However, its performance on diagonal edges is poor, resulting in inaccurate edge positioning and a tendency to miss fine edges.
CannyThis operator achieves precise edge detection with superior detection accuracy and continuity. It uses a Gaussian filter for robust noise reduction, and its performance surpasses that of the LoG operator. However, it has high computational complexity, limiting its real-time applicability. Additionally, parameter configuration requires expertise and is not easily adaptable to different application scenarios.
LoG 2Second-order differential operatorThis operator uses Gaussian filtering, followed by the Laplacian operator, to extract edges. It provides excellent noise suppression and precise edge positioning. However, it is computationally intensive, requires empirical parameter tuning, and often requires extensive tuning in practice. Therefore, it is not suitable for scenarios that require high real-time performance.
LaplacianThis operator detects edges in all directions. However, it is highly sensitive to noise and exhibits a strong response. It is ineffective at detecting the edges of irregular or entangled cotton fibers in complex imaging environments. In practice, it is typically combined with others, such as the LoG operator, to create complementary systems.[59]
Improvement of CannyFirst-order differential operatorAn improved Canny operator incorporates adaptive selection of high and low thresholds, effectively suppressing false edges in images of cotton FFs.[57]
Improvement of CannyThis improved Canny operator uses mean filtering and non-local mean denoising instead of Gaussian filtering. Compared to the old Canny operator, it does a better job of deminihing noise and processing faster. This makes it especially useful for tasks that need to be able to handle a lot of noise and work in real time, like finding impurities in machine-harvested seed cotton.[58,59]
1 Ref. is the abbreviation of reference. 2 The LoG operator stands for the Laplacian of Gaussian operator.
Table 3. Limitations of image processing-based cotton FF Detection.
LimitationsSpecific Manifestations and Relevant Literature Descriptions
Restricted capacity to adapt to complex environments.(1) Light sensitivity and low-contrast interference: Threshold segmentation relies on the difference in grayscale between the target and the background. However, uneven lighting or overlapping grayscales of impurities and cotton fibers can lead to missed detections or over-segmentation [47,48]. Enhanced algorithms, such as particle swarm optimization for thresholding [50] and non-local mean denoising [58], can mitigate some of these challenges. Nevertheless, manual compensation strategies are still necessary to address environmental interference, which limits their ability to generalize.
(2) Fiber entanglement and noise interference: Edge detection has limited sensitivity to weak edges. In areas where cotton fibers intertwine with FFs, fractures or false contours are likely to occur. These conditions can result in cotton knots being misidentified as FF [57]. Region segmentation uses multi-feature fusion to improve positioning accuracy. However, the merging process relies on manually defined similarity criteria, making it difficult to adapt to the diverse morphologies of FF [61].
The ability to distinguish pseudo-fibers is weak.(1) Conventional methods that use rigid criteria to differentiate FFs often misjudge color and texture similarity. However, these methods struggle to distinguish visually similar pseudo-FF from cotton fibers. Examples include yellow cotton, cotton stalks, and fragmented cotton leaves. The RGB color domain judgment [62] lacks the specificity necessary to effectively identify FF within the same color. Additionally, GLCM texture analysis [63,64] often misclassifies variations in fiber texture as extraneous fibers, especially when evaluating cotton-linen blends.
(2) Feature representation and decision-making bottleneck: Traditional methods rely on manually crafted features, such as thresholds, filtering parameters, and GLCM parameters, as well as linear classifiers like SVM. These approaches lack the capability to model high-dimensional nonlinear relationships. When heterogeneous fibers and background features exhibit nonlinear distributions, ambiguity in the classification boundary increases, resulting in a higher false detection rate [52,64].
Table 4. Comparison of YOLO series models in cotton FF detection.
ModelTypes of FFsResearch SubjectDataset
Source
mAP 1
(%)
FPS 2Primary ContributionRef. 3
Improved MobileNet-YOLOv3Block-shaped FF;
Bock-shaped pseudo-FF;
Strip-shaped FF;
Strip-shaped pseudo-FF.
Cotton flowCreated a dataset from FF remover images84.8266.67A lightweight MobileNet architecture serves as the feature extraction network. The original MobileNet structure is modified by removing its final pooling and fully connected layers. This modified backbone is then integrated with YOLOv3’s multi-scale feature fusion network. Furthermore, a segmented learning rate strategy is employed to optimize training, mitigate overfitting, and enhance model learning.[76]
Improved YOLOv4Broken leaves;
Cotton stalks;
Cotton shells,
Weeds.
Seed cottonLab-built dataset92.38-This work suggests an algorithm for multi-channel fusion segmentation that uses saturated channels (S-channels) and blue-yellow component channels (B-channels). The algorithm works with the YOLOv4 model to make a better network for finding impurities in machine-harvested seed cotton.[84]
Improved YOLOv5Waste paper;
Plastic;
Mulch film;
Cotton stalk;
Cotton thread;
Feathers.
Raw cottonCreated a dataset from FF remover images98.104.3An improved YOLOv5 model is created by adding the CBAM and DSConv, which is specifically for finding small cotton FFs.[75]
DSCE-YOLOv5s 5Polypropylene fiber; Feathers;
Plastic film;
Hemp rope; Cloth; Hair
Chemical fiber.
Raw cottonLab-built dataset91.6083The YOLOv5s model is improved by adding DSConv to make it lighter, using the K-means algorithm to find the best anchor box sizes, and adding an attention mechanism to make FF features more discriminative.[81]
YOLOv5-U-Net++Leaves;
Cotton stalks;
Dead cotton;
Iron wire; Hair;
Woven bags;
Waste paper;
Cotton thread.
Raw cottonLab-built dataset97.7026.4The YOLOv5 network is improved by adding the CBAM, using K-means clustering to find the best anchor box sizes, and using GIoU 4 loss. Furthermore, a U-Net model with improved convolutional attention is created specifically to find FFs that are shaped like strips.[82]
YOLOv5-CFD 620 types of FFs.Raw cottonLab-built dataset96.90385An improved YOLOv5 model is proposed, which uses ShuffleNetv2 as the backbone network and incorporates Hard-Swish activation functions. The PANet 7 connections are changed to make fine-grained feature maps, and the coordinate attention module is added to enhance detection accuracy.[83]
Cotton-YOLOFabric; Film;
Feathers; Chemical fibers, Hair.
Seed cottonLab-built dataset88.57132.2The Cotton-YOLO algorithm is developed by optimizing the YOLOv7 model with ConvNext and SwinTransformer modules. It achieves high detection speed and accuracy even in complex environments.[85]
YOLOv8-MMWDark-colored FF,
Fluorescent FF
Defective cottonLab-built dataset95.80367.8This paper presents MobileNetv3, a multi-dimensional collaborative attention mechanism, and the dynamic non-monotonic focusing mechanism WIoUv3. This combination makes it possible to build a lightweight detection model that can find small objects like defective cotton or small FFs.[77]
1 mAP stands for mean average precision. 2 FPS stands for frames per second, which is a unit used to measure speed. 3 Ref. is the abbreviation of reference. 4 GIoU stands for generalized intersection over union (IoU). 5 DSCE-YOLOv5s is an improved model integrating SE, CBAM, and efficient IoU. 6 YOLOv5-CFD is an improved model integrating coordinate attention module, feature fusion and a decoupled network. 7 PANet stands for path aggregation network.
Table 5. Comparison of experimental results [8,85].
ModelCategoryP
(%)
R
(%)
AP50
(%)
Acc
(%)
mAP50 *
(%)
FPSDetection Speed
(ms/per Image)
YOLOv4Fabric;94.8497.3593.1697.0694.5868.7014.60
Film;98.1794.8593.82
Feathers;96.0997.1994.79
Chemical fibers;98.5997.3895.83
Hair98.0398.4495.77
YOLOv5sFabric;95.2497.7793.6797.4094.8697.8010.20
Film;98.9395.2994.15
Feathers;96.3597.8395.27
Chemical fibers;98.6097.6995.37
Hair98.3098.3095.86
YOLOv7Fabric;95.9298.3394.8897.9995.75101.209.90
Film;99.1096.3295.12
Feathers;97.4697.8395.87
Chemical fibers;99.0798.6196.17
Hair98.8798.8796.73
YOLOv7-SwinFabric;97.3999.0295.3698.6195.97113.608.80
Film;98.9597.5095.05
Feathers;98.7298.4796.11
Chemical fibers;99.5398.7796.45
Hair98.8799.2996.88
YOLOv7-ConvNextFabric;96.0598.4795.1298.0595.77150.306.70
Film;99.1096.3294.86
Feathers;97.3497.9695.88
Chemical fibers;99.2298.4696.17
Hair98.8799.0196.83
Cotton-YOLOFabric;98.2199.4496.4599.1296.92132.207.60
Film;99.5598.2396.13
Feathers;99.1199.1197.21
Chemical fibers;99.5499.2397.43
Hair99.2999.5697.36
* mAP50: mAP calculated at a single intersection over union (IoU) threshold of 0.5. A detection is considered a true positive if the IoU between the predicted and ground-truth bounding box is ≥0.5.
Disclaimer/Publisher’s Note: The statements, opinions and data contained in all publications are solely those of the individual author(s) and contributor(s) and not of MDPI and/or the editor(s). MDPI and/or the editor(s) disclaim responsibility for any injury to people or property resulting from any ideas, methods, instructions or products referred to in the content.