Article

Multi-Stage Phenotyping Identifies Promising Drought-Responsive Upland Rice Germplasm for Tropical Breeding Programs

by
Sirilak Chuakudroo
,
Jirawat Sanitchon
,
Sompong Chankaew
and
Tidarat Monkham
*
Department of Agronomy, Faculty of Agriculture, Khon Kaen University, Khon Kaen 40002, Thailand
*
Author to whom correspondence should be addressed.
Agronomy 2026, 16(20), 2006; https://doi.org/10.3390/agronomy16202006
Submission received: 10 September 2026 / Revised: 4 October 2026 / Accepted: 7 October 2026 / Published: 9 October 2026

Abstract

Global climate change severely challenges crop production in tropical and subtropical ecosystems, driving the need for germplasm evaluation. In this study, a sequential evaluation approach was used to identify drought-resilient Thai indigenous upland rice (Oryza sativa L.) accessions. A large-scale screening of 336 accessions at the seedling stage (2022 and 2023) using leaf rolling (LR) scores yielded 23 promising accessions, which were further evaluated across seedling, active tillering, and reproductive flowering stages under severe water-deficit stress. At the seedling stage, accessions ULR 014, ULR 018, and ULR 092 demonstrated consistently outstanding performance, with low leaf rolling scores (LR). At the tillering stage, accessions ULR 086, ULR 014, and ULR 397 exhibited superior post-drought vegetative plasticity, achieving exceptionally high tiller regeneration rates (31.5–36.9%) after re-watering, which serves as a vital recovery mechanism for rainfed direct-seeded systems. Under terminal drought at the flowering stage, accessions ULR 026 (14.8 g/plant; 3.27% yield reduction), ULR 130 (14.3 g/plant; 0.00% yield reduction), ULR 129 (13.0 g/plant; 8.45% yield reduction), and ULR 014 (11.4 g/plant; 12.31% yield reduction) maintained high grain yield potential and yield stability, while ULR 014, ULR 254, and ULR 397 achieved high proportions of 100% completely filled grains under severe stress. Hierarchical cluster analysis classified the selected germplasm into four groups (G1, G2, G3, and G4) based on stage-specific traits. Genotypes in Group 4 (ULR 014, ULR 254, ULR 032, ULR 346, and IR62266) demonstrated comprehensive multi-stage drought resilience with high 100% seed filling (36.9%) and total filled grain (66.5%), while Group 2 (ULR 026, ULR 130, ULR 129, ULR 075, ULR 071, and ULR 003) exhibited the lowest yield reduction under drought (13.3%). The phenotypic variations observed across developmental stages underscore the strong stage dependence of drought response in these local landraces, demonstrating that early-stage resilience does not guarantee reproductive tolerance. The candidate parental sources identified in this study, particularly ULR 014 (high yield maintenance and 100% filled grain under flowering stress), ULR 026 and ULR 130 (yield stability and minimal yield loss), and ULR 397 (strong tiller recovery), offer valuable breeding materials for developing further breeding program.

1. Introduction

Rice (Oryza sativa L.) is a paramount staple crop for global food security, yet its production is increasingly threatened by unpredictable drought events under changing global climates [1,2] especially tropical and subtropical ecosystems. Direct broadcasting, an increasingly adopted practice to reduce labor, exposes young seedlings to severe early-season dehydration. However, rice production is increasingly threatened by shifting global climate patterns and intensified abiotic stress, among which drought remains the most destructive and widespread constraint [3,4]. Water deficits severely disrupt rice growth at molecular, physiological, biochemical, and phenotypic levels, causing devastating yield reductions that range from 20% to 100% depending on the severity, duration, and developmental timing of the moisture deficit [5]. In Thailand, a substantial portion of rice cultivation relies entirely on rainfed ecosystems, and crop success is dependent on the distribution of rainfall. Relying on this creates a major risk of unexpected droughts during the crop growing period.
So, under the effect of rainfed agro-ecosystems, farmers are increasingly adopting direct broadcasting methods over traditional transplanting to reduce labor inputs and help with the unpredictable timing of rainfall. However, this method significantly increases the risk of early-season crop drought stress. If a prolonged dry spell occurs after germination, the young seedlings face extreme dehydration, stunted vegetative growth, or complete dryness, resulting in poor crop establishment [6,7,8]. Concurrently, drought stress during the vegetative tillering stage restricts crop development and fundamentally caps the crop’s yield potential. In addition, water deficits occur as terminal drought at the flowering stage, and the consequences are major: in anthesis, they disrupt microsporogenesis and floret fertility, leading to spikelet sterility or incomplete starch synthesis, which severely impairs the late grain-filling process [9,10,11]. Thai indigenous upland landraces, conserved through generations of natural and human selection, harbor unique physio-morphological adaptations for dehydration tolerance. Systematically mapping these traits bridges the gap between germplasm conservation and modern genetic improvement initiatives. So, to mitigate these climate risks sustainably and cost-effectively, the development of drought-tolerant rice cultivars is widely recognized as the most viable long-term solution. Thailand is a recognized geographic center of rice genetic diversity, where the utilization of indigenous upland rice germplasms is useful. These local landraces, traditionally cultivated on upland areas or hillsides or high-altitude fields without standing water, with generations of natural and human selection, have evolved unique physio-morphological adaptations for dehydration tolerance that are largely absent in high-yielding modern cultivars [12,13,14]. Consequently, screening large-scale indigenous collections offers a strategic opportunity to identify premium genetic donors for breeding initiatives. To effectively identify elite germplasms, the concept of multi-stage drought resilience must be precisely defined as the integrated capacity of a genotype to express distinct adaptive mechanisms across successive growth phases. In rice, drought response comprises related yet physiologically distinct components that should not be confounded: (1) drought avoidance, such as stomatal regulation and leaf rolling to limit transpiration water loss under early moisture deficits [15,16]; (2) dehydration tolerance, reflected in delayed leaf drying and cell membrane preservation during prolonged stress [17]; (3) post-drought vegetative recovery, characterized by active meristematic regrowth and tiller regeneration upon re-watering [18,19]; and (4) maintenance of reproductive performance, defined as the maintenance grain-filling efficiency or grain yield during terminal drought [11,20]. Because these component traits are governed by stage-specific and independent genetic pathways [21,22], strong performance in one trait (e.g., seedling leaf rolling) does not imply resilience in another (e.g., flowering grain filling). Therefore, a true multi-stage resilient ideotype is one that seamlessly integrates these distinct physiological components across seedling, tillering, and reproductive stages.
Large-scale germplasm characterization requires robust and rapid phenotyping trait to track real-time physiological status under stress. Visual scoring criteria, particularly leaf rolling (LR) and leaf drying (LD) scores, serve as practical screening for evaluating canopy turgor retention and delaying tissue desiccation under water stress [8,15,23]. While LR and LD scores do not directly quantify specific physiological mechanisms such as stomatal conductance, osmotic adjustment, or cell membrane integrity, they provide reliable visual estimates of plant hydration status and desiccation damage during early-stage screening. Previous studies on Thai indigenous upland rice germplasm have demonstrated substantial genetic diversity and strong early-season drought avoidance mechanisms, particularly at the seedling stage [12,13,14]. However, these historical screening initiatives have largely relied on single-stage evaluations, most notably focusing on early seedling survival [8,12,21]. Much remains largely unknown about landraces systematically coordinating drought responses across developmental phases, particularly from vegetative tillering recovery to reproductive grain-filling. Because drought-resistance mechanisms are stage-specific and governed by independent genetic and physiological pathways [21,22,24], strong vegetative survival under early moisture deficits does not necessarily translate to high post-drought recovery or grain yield preservation during terminal stress. Therefore, a comprehensive multi-stage phenotyping approach integrating seedling, tillering recovery, and reproductive is essential to uncover true all-stage resilient ideotypes within Thai upland germplasms.
To address these limitations, this study evaluated the drought resilience and recovery capacity of a Thai indigenous upland rice germplasm across multiple developmental phases. The hypothesized drought response mechanisms in upland rice are strictly stage-dependent, such as favorable seedling-stage performance not necessarily predicting post-drought recovery at the tillering stage or reproductive sink strength under terminal drought [2,3]. To test this hypothesis, our primary objectives were to execute a multi-seasonal screening of 336 accessions at the seedling stage to identify the top-performing genotypes using leaf rolling and drying scores [1,3]. After that, we evaluated the selected high-performing accessions across seedling, tillering, and flowering stages under severe water deficits to characterize functional response groups. We also identify elite donor lines capable of serving as materials for breeding programs.

2. Materials and Methods

2.1. Plant Materials and Experimental Site

A total of 336 Thai indigenous upland rice (Oryza sativa L.) landrace accessions were evaluated in this study. The germplasm collection was obtained from the Indigenous Rice Germplasm Conservation and Utilization Project at Khon Kaen University, Thailand. These accessions originate from diverse rainfed upland agricultural zones across southern to northern Thailand (around Lat. 5°37′ to 20°27′ N, Long. 97°22′ to 105°37′ E) representing traditional local landraces. Across the germplasm set, growth duration and maturity groups ranged from early to late maturing (flowering between 75 and 115 days after sowing depending on the genotype and photo-period sensitivity). Two standard drought-tolerant check cultivars, IR62266 (Oryza sativa L. ssp. indica) and Surin 1 (SRN 1), were included as benchmark controls in all experiments. IR62266 (IR62266-42-1-2) was chosen as an international standard tolerant check due to its well-documented osmotic adjustment capacity, deep rooting architecture, and stable reproductive performance under severe water-deficit conditions in international screening networks. Surin 1 (SRN 1) was selected as a national recommended drought-tolerant check cultivar, recognized for its strong early vegetative vigor, high tillering capacity, and stable adaptation to rainfed lowland and upland ecosystems in northeastern Thailand. All experiments were conducted under greenhouse conditions at the Agronomy Research Station, Faculty of Agriculture, Khon Kaen University, Khon Kaen, Thailand (16°28′ N, 102°48′ E).

2.2. Screening for Drought Tolerance at the Seedling Stage (Experiment 1)

2.2.1. Experimental Design and Crop Management

The screening was carried out across two consecutive seasons: the rainy season (22 June–20 July 2022) and the dry season (18 April–20 May 2023). The experiment was arranged in a split-plot design arranged in a randomized complete block design (RCBD) with three replications. The main plots consisted of two water regimes (well-watered control and drought stress), which were randomly assigned to independent concrete raised beds. Rice seeds were directly sown in concrete raised beds randomly in each block. The concrete beds were 2.0 m wide, 3.0 m long, and 1.0 m high and separate in each water regime (drought and well watered), each concrete bed was separated into three blocks as a replication using the permanent plastic board, and each block was sealed with polyethylene sheets at the bottom to prevent water leakage and ensure uniform soil moisture within the plot. The beds were filled with soil to a depth of 70 cm. Each accession was directly sown in a single row with a spacing of 5 cm between accessions. For both water regimes, plots were irrigated daily (morning and evening) to maintain optimum moisture levels until 14 days after sowing (DAS). In the drought stress treatment, watering was completely withheld for 21 days (from 14 to 35 DAS) to induce seedling drought stress, followed by re-watering from 36 to 42 DAS. Weeds were manually removed. Chemical control (Provado at 5 g per 20 L of water) was applied to manage thrip infestation when necessary. Fertilizer applications were uniform across treatments as 47.7 N, 21.6 P2O5, and 21.6 K2O kg/ha, calculated based on the surface area of the raised beds, at 7 days after re-watering.

2.2.2. Agro-Meteorological and Soil Moisture Monitoring

Daily weather data, including rainfall, maximum and minimum temperatures, and relative humidity (RH), were obtained from the meteorological station located at the experimental site. Soil moisture content (%) was monitored using the gravimetric method. Soil samples were collected from three positions (head, middle, and tail of the plots) at a depth of 30 cm. Fresh soil samples were weighed immediately, dried in a hot-air oven at 105 °C for 72 h until a constant weight was achieved, and reweighed to calculate the soil moisture percentage using the following formula: soil moisture content (%) = {[(Fresh soil weight) − (Dry soil weight)]/(Dry soil weight)} × 100.

2.2.3. Phenotypic Measurements for Drought Response

Leaf rolling score (LR): Visual scoring of leaf rolling was performed between 10:00 AM and 2:00 PM every two days during the drought stress period, based on the standard protocol described by De Datta et al. [25]. LR was rated on a scale of 1 to 9: 1 = leaves healthy with slight tip drying; 3 = leaves starting to fold (V-shape); 5 = leaves fully cupped (U-shape); 7 = leaf margins tightly rolled; and 9 = leaves completely rolled and dried.
Leaf drying/dead score (LD): Visual scoring was conducted at the same time as leaf rolling every day when the plant leaf tip appeared to be dying during the drought stress period, following the standard evaluation system of rice (SES) [26]. LD was rated on a scale of 0 to 9: 0 = no symptoms, 1 = slight tip drying, 3 = tip drying extended up to 1/4, 5 = 1/4 to 1/2 of all leaves dried, 7 = more than 2/3 of all leaves fully dried, and 9 = all plants apparently dead, with most of the leaves fully dried.

2.3. Evaluation of Selected Germplasm Across Growth Stages (Experiment 2)

Based on the multi-seasonal screening in experiment 1 across two consecutive years (2022 and 2023), a subset of 23 top-performing accessions was selected alongside 2 standard check cultivars (IR62266 and Surin 1) for detailed multi-stage evaluation (experiment 2). Genotypes were selected based on visual leaf rolling scoring at the significant different between tolerance check and landrace germplasm (35 days after sowing and 21 DAS in year 1 and 2, respectively). The selection was based on a mean leaf rolling score (LR) < 5.0 in both years. Although selection saved time and resources, experiment 2 only tested lines with early-stage drought tolerance selected. Consequently, genotypes that were sensitive at the seedling stage were not evaluated. The experiment was conducted between 21 May and 14 October 2024, using a completely randomized design (CRD) with four replications. Rice plants were grown in plastic pots containing 15 kg of soil packed to match the bulk density of the upland fields.

2.3.1. Seedling Stage Evaluation

Rice seeds were sown in plastic pots containing 15 kg of soil. Each pot contained four hills with one seed per hill. A higher plant density (four plants per pot) was maintained during the 45-day seedling evaluation phase, prior to the active tillering stage, to simulate dense direct-seeded broadcasting conditions. This arrangement ensured rapid canopy closure, which minimized direct soil surface evaporation and standardized transpirational water depletion within the confined pot volume during early screening. Drought stress was imposed at 28 DAS by withholding water completely for 17 days (up to 45 DAS), after which re-watering was resumed until harvest. The fertilizer application rate (47.7 N, 21.6 P2O5, and 21.6 K2O kg/ha) was split into two or three at 14, 30, and 50 DAS; at 30 DAS, it was provided only under well-watered conditions.

2.3.2. Tillering Stage Evaluation

Plants were grown in plastic pots following similar planting procedures but thinned to two plants per pot. Thinning to two plants per pot provided sufficient soil volume (7.5 kg soil/plant) and 15 cm between plant. This experiment accommodated root development and minimized root confinement, allowing for accurate expression of tillering potential and post-drought tiller regeneration plasticity. Drought stress was initiated at the active tillering stage (61 DAS) by withholding irrigation for 14 days (up to 75 DAS), followed by regular re-watering until maturity. Fertilizer application (47.7 kg N, 21.6 kg P2O5, and 21.6 kg K2O/ha) was split into applications at 14, 30, and 50 DAS under well-watered conditions. Under seedling drought stress, to prevent root damage from nutrient toxicity under low moisture, the second application scheduled for 30 DAS was withheld and instead applied as a top dressing immediately after re-watering at 45 DAS (together with the 50 DAS application) to ensure equal cumulative nutrient supply across all treatments.

2.3.3. Flowering Stage Evaluation

Plants were grown in plastic pots following the same planting procedures as the seedling stage but with one plant per pot. Maintaining a single plant per pot during the reproductive stage eliminated plant root competition and canopy shading, ensuring that terminal drought stress directly targeted panicle development and grain yield. Drought stress was imposed when 50% of the main stem panicles reached the anthesis/flowering stage (approximately 75–85 DAS), depending on the variety. Irrigation was completely withheld from the 50% flowering stage until harvest, with slight variations in each variety. The harvesting day was approximately 20 to 25 days of stress or after 50% flowering, reflecting realistic terminal drought scenarios encountered in rainfed field environments. Fertilizer application (47.7 kg N, 21.6 kg P2O5, and 21.6 kg K2O/ha) was split into three equal applications. Under control conditions, applications occurred at 14, 45, and 60 DAS. Under tillering drought stress (induced from 61 to 75 DAS), the final fertilizer split was intentionally delayed from 60 DAS to 80 DAS (5 days after re-watering at 75 DAS). This adjustment ensured that the fertilizer was applied when soil moisture was adequate for nutrient uptake and avoided localized salt stress around roots during severe dehydration while maintaining identical total nutrient inputs between treatments.

2.4. Phenotypic, Agronomic Traits, and Yield Component Measurements (Experiment 2)

2.4.1. Physiological and Visual Drought Scores

The leaf rolling score (LR) and leaf drying score (LD) were monitored using the standard visual scoring scales (1–9) developed by De Datta et al. [25] and IRRI [26]. The drought recovery score (RE) was evaluated at 7 days after re-watering by estimating the percentage of surviving or revived plants on a 1–9 scale, where 1 = 90–100% recovery, 3 = 70–89% recovery, 5 = 40–69% recovery, 7 = 20–39% recovery, and 9 = 0–19% recovery [26].

2.4.2. Agronomic Trait and Yield Components

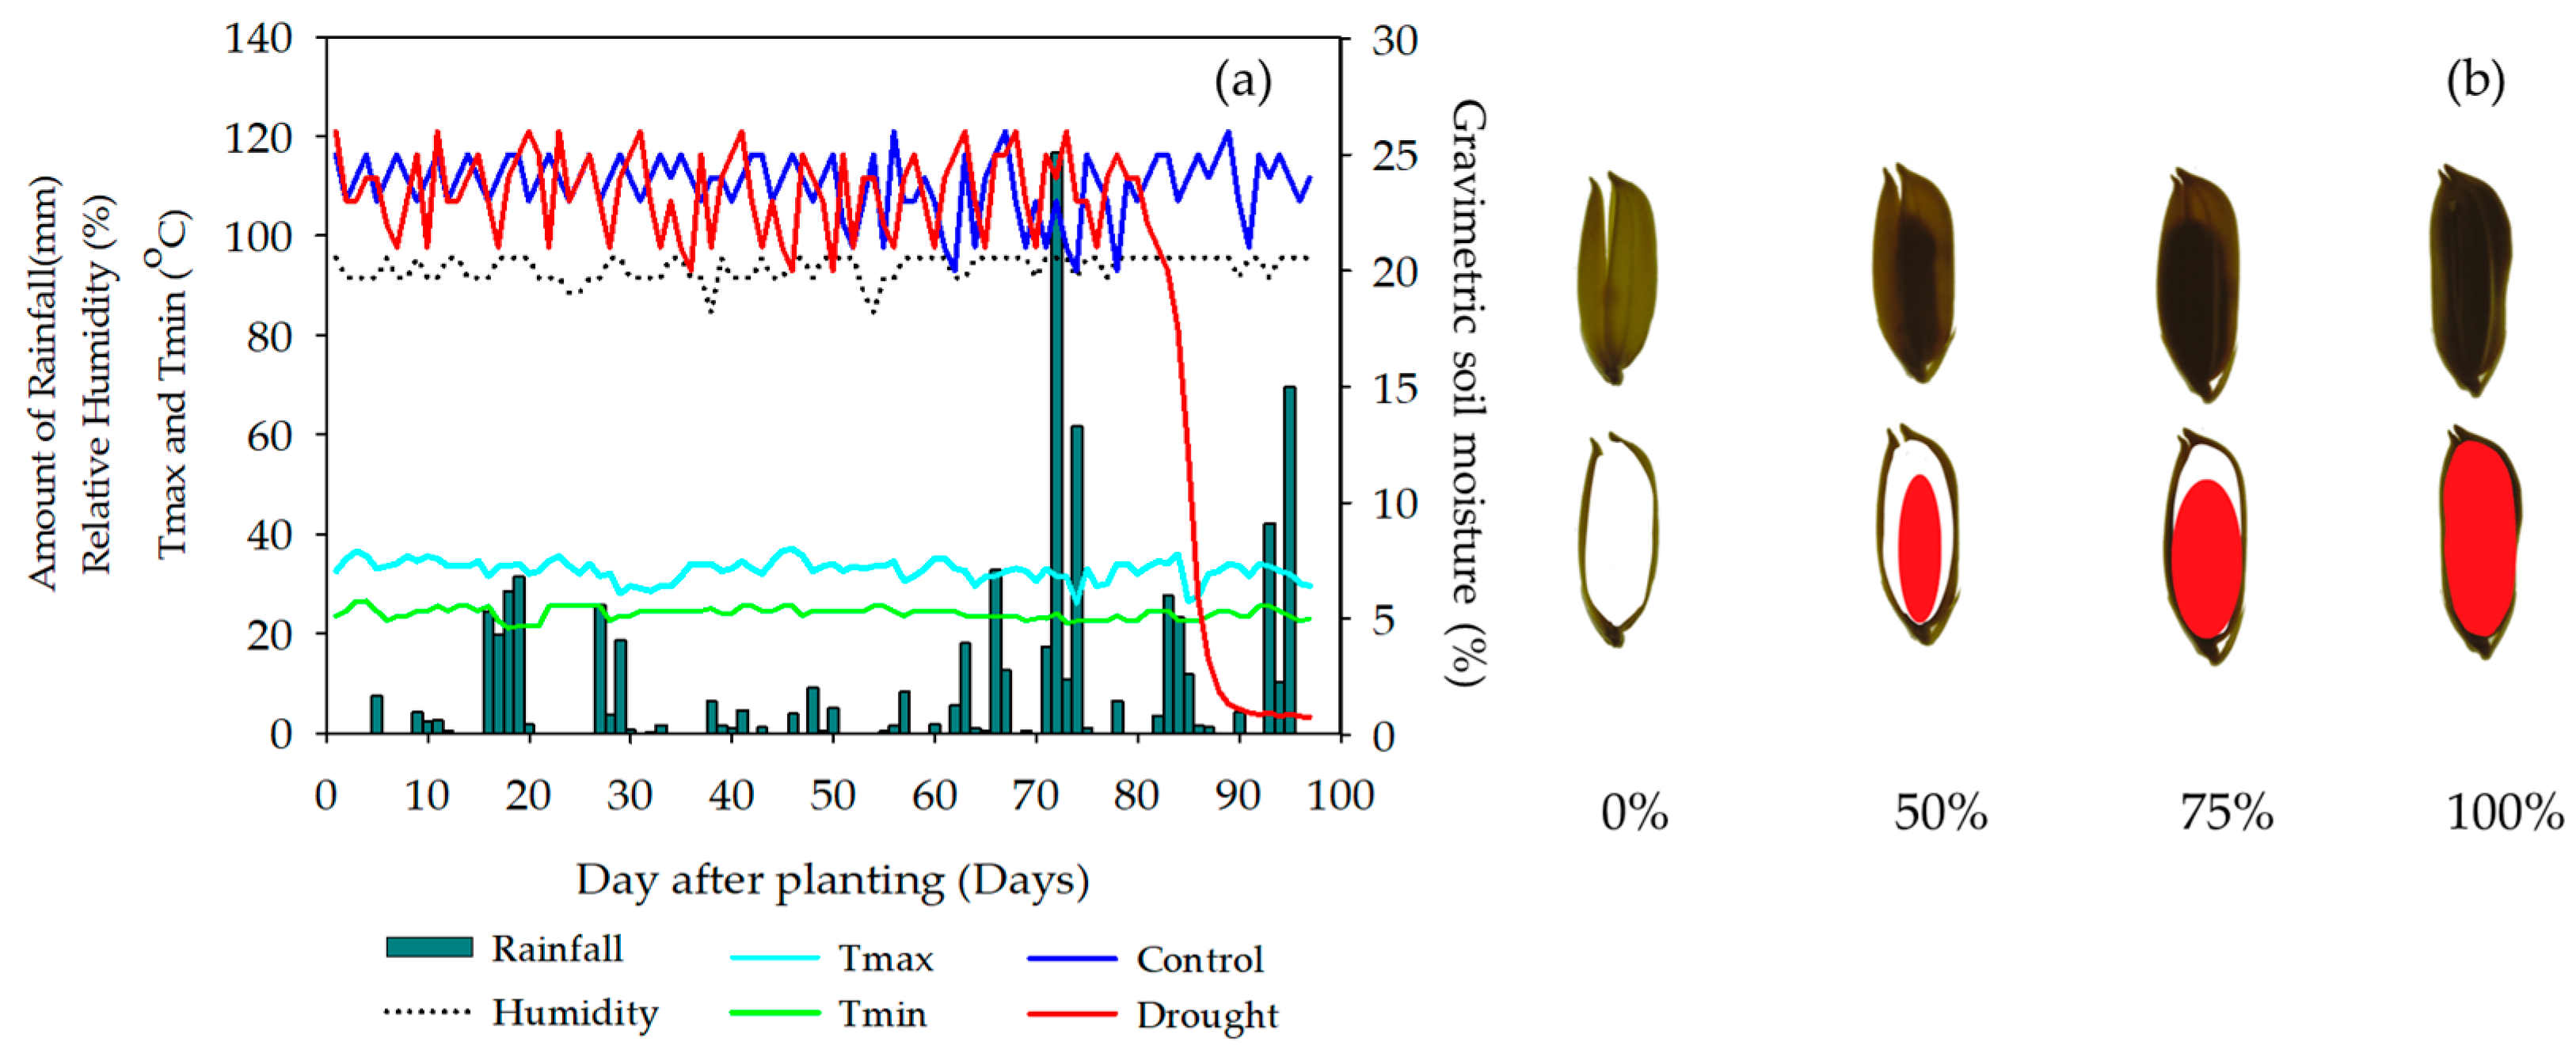
Tiller number per hill was counted prior to stress induction, during the stress period, and after re-watering. The panicle number per hill was counted for each hill during the fully emerged panicle stage. Panicle weights were determined by weighing each panicle under both drought and control conditions. Grains were harvested, cleaned, and processed. Total grain yield per plant and individual panicle weights were determined. The total grains were separated using a light source to determine the quantity of filled and unfilled grains. The percentage reduction in yield components due to drought stress was calculated using the following formula: reduction (%) = [(Control value − Drought value)/Control value] × 100. For the grain-filling pattern (flowering stage), grains from the flowering-stage experiment were meticulously categorized into four distinct filling levels based on visual inspection thought the light source as 100% filled grain, 75% filled grain, 50% filled grain, and completely unfilled/sterile grain.

2.5. Statistical Analysis

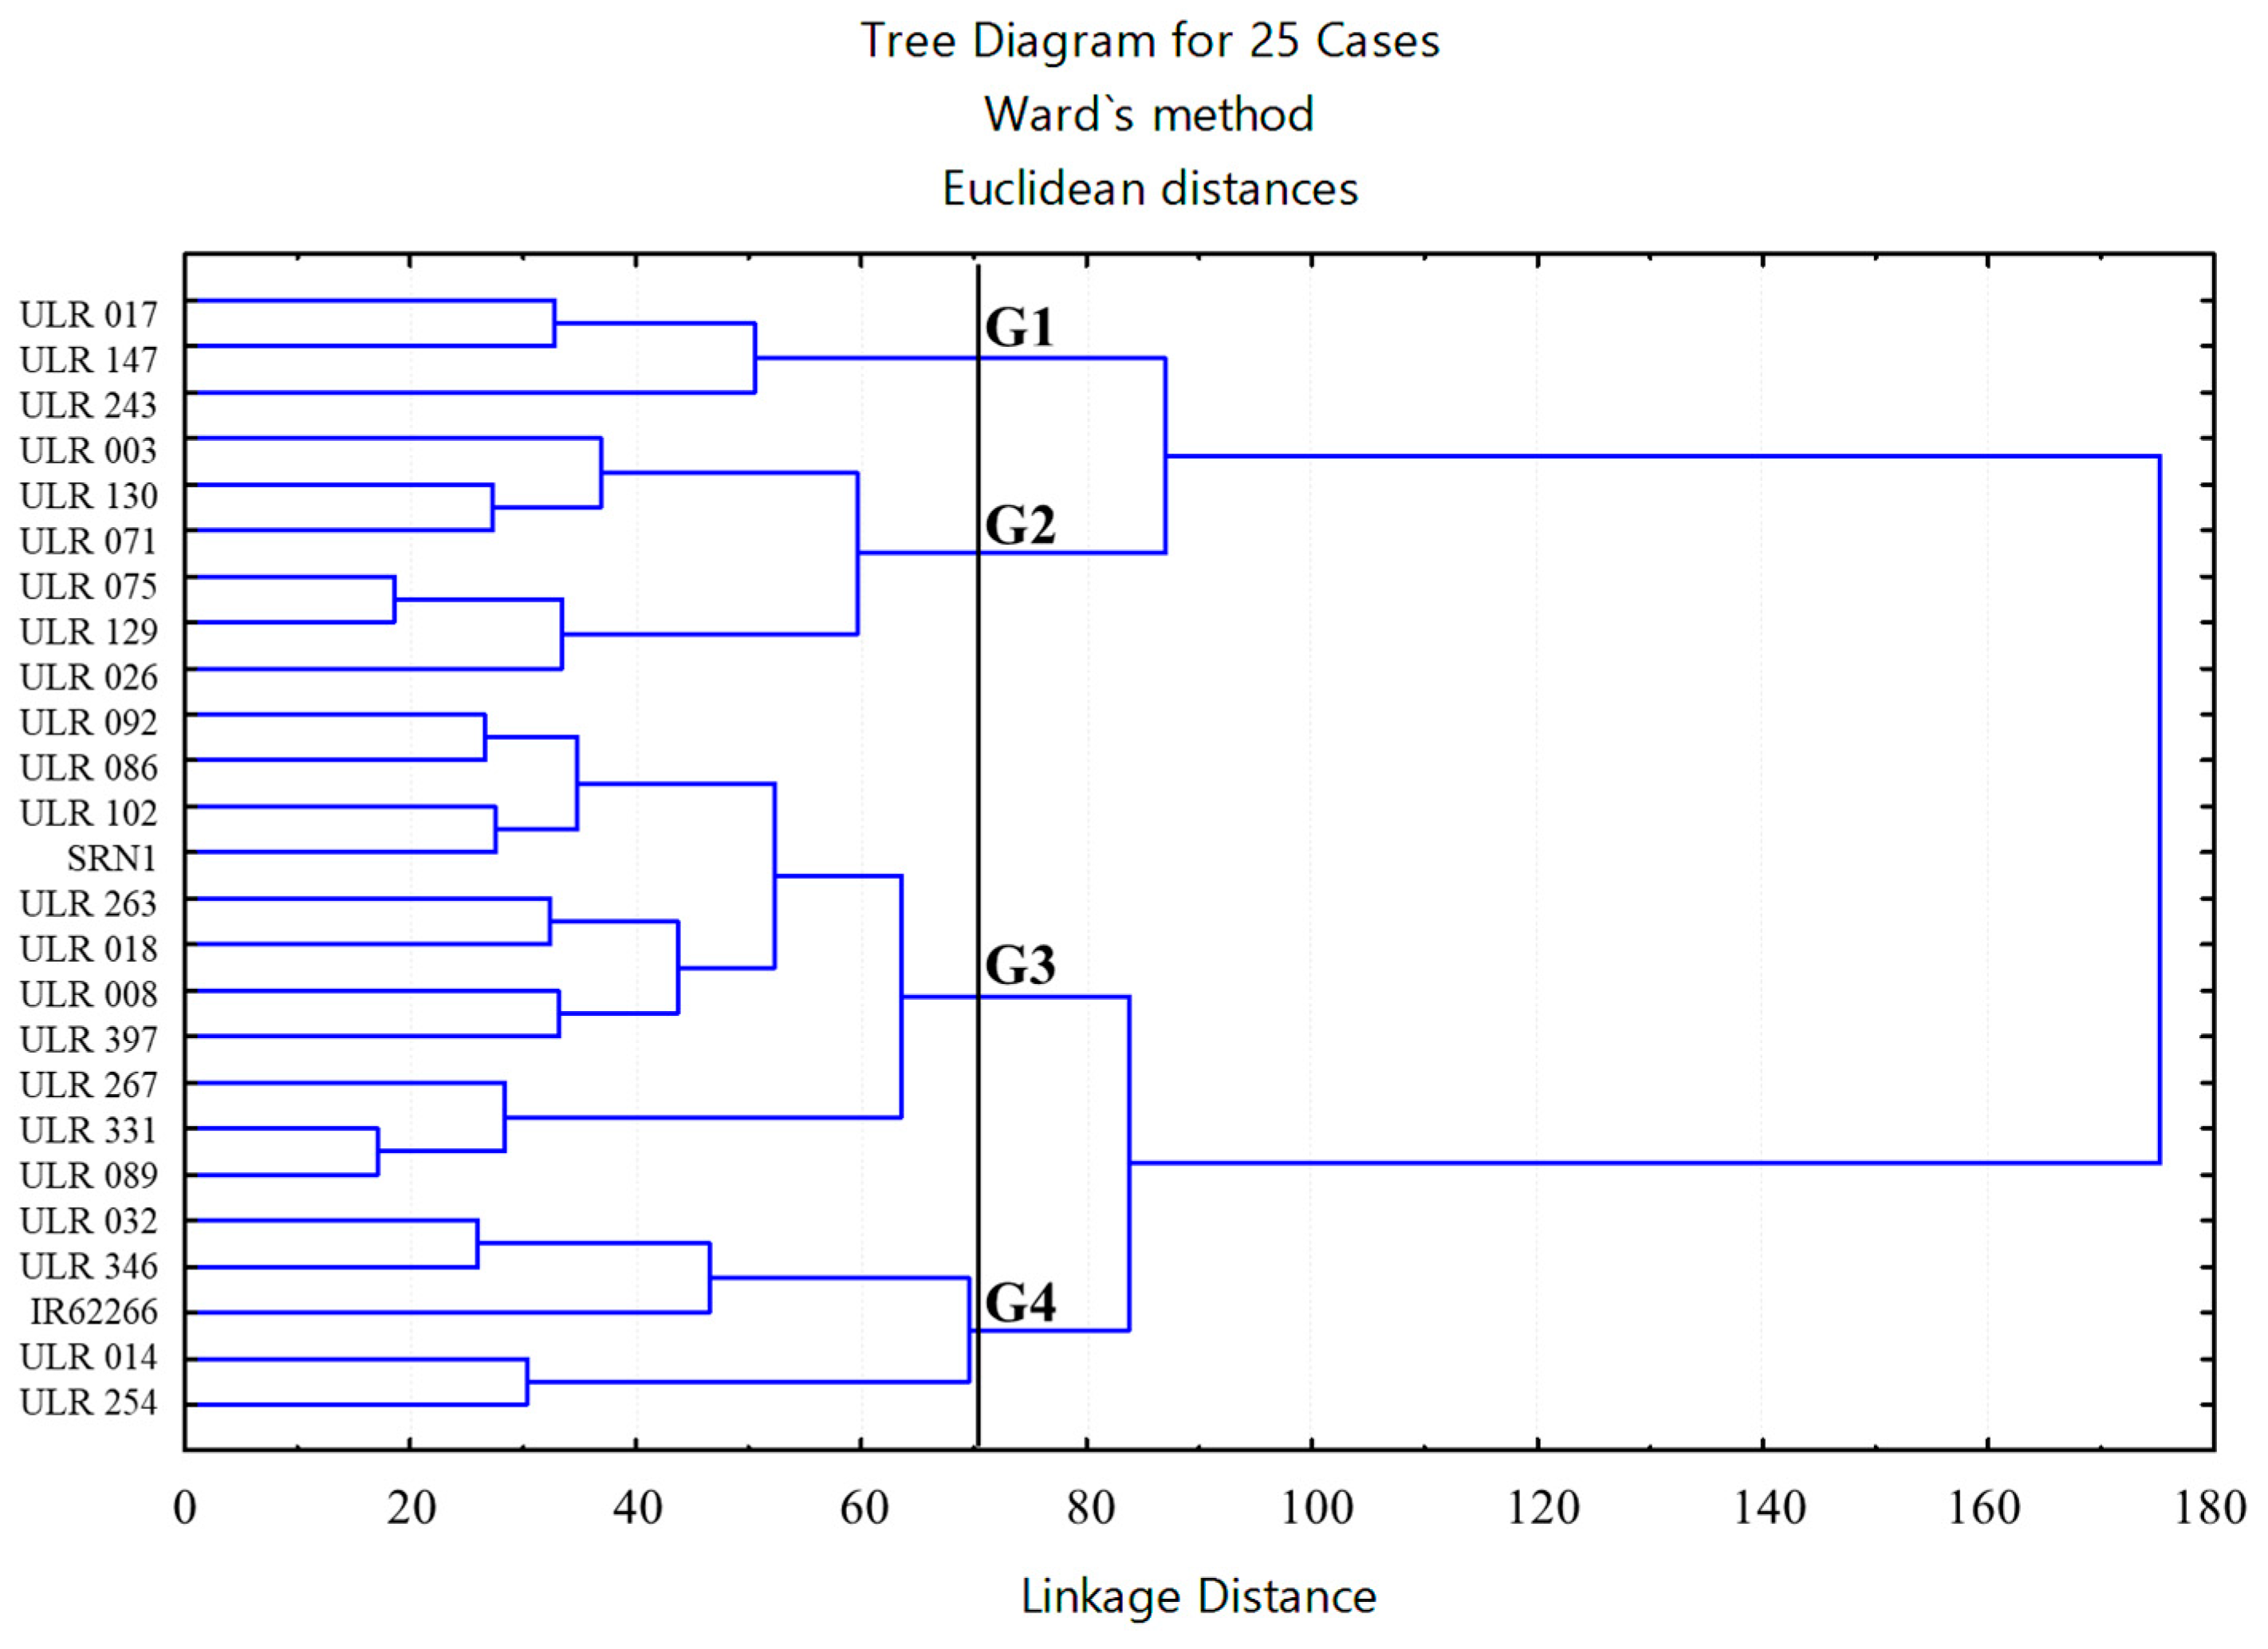
Prior to statistical analysis, the data such as LR, LD, and the recovery score were examined under the assumptions of normality and homogeneity of variance using the Shapiro–Wilk test and Bartlett’s test, respectively, performed in R software (version 4.3.2; R Core Team, Vienna, Austria). All data met these assumptions and were subsequently subjected to analysis of variance (ANOVA) using Statistix 10 software (Analytical Software, Tallahassee, FL, USA) according to the respective experimental design. Treatment means were compared using the least significant difference (LSD) test at significance levels of p < 0.05 or p < 0.01. For experiment 1, data were analyzed according to a split plot in a RCBD. To evaluate phenotypic consistency and genotype-by-environment interactions across years in experiment 1, a combined analysis of variance across two screening seasons (2022 and 2023) was performed using a linear mixed model structure, and homogeneity of variance across the two evaluation years was verified using Bartlett’s test prior to combining data at p < 0.05. The statistical model included the main effects of year (Y), water regime (W), replication within year, genotype (G), and their respective interaction terms (G × W, G × Y, W × Y, and G × W × Y) using R software (version 3.5.1; R Core Team, 2024). Prior to cluster analysis, all evaluated physiological and agronomic variables with differing units (including LR and LD scores, recovery percentage, grain yield under control, 100% filled grain, and total filled grain percentage) were standardized using Z-score transformation Z = ( X − X ¯ ) / SD to ensure equal weighting among traits. Hierarchical cluster analysis was subsequently performed on the standardized matrix using Ward’s minimum variance method based on squared Euclidean distances in JMP software (version 17.0, SAS Institute Inc., Cary, NC, USA). The optimal number of functional clusters (G1, G2, and G3) was determined at a phenon line threshold corresponding to a Linkage Distance of approximately 70, based on the sharp increase in fusion distance (elbow criterion) and biological relevance. Heat maps were created using the Microsoft Excel 2019 conditional formatting function with selected color scales.

3. Results

3.1. Large-Scale Screening of Drought Tolerance Germplasm at the Seedling Stage

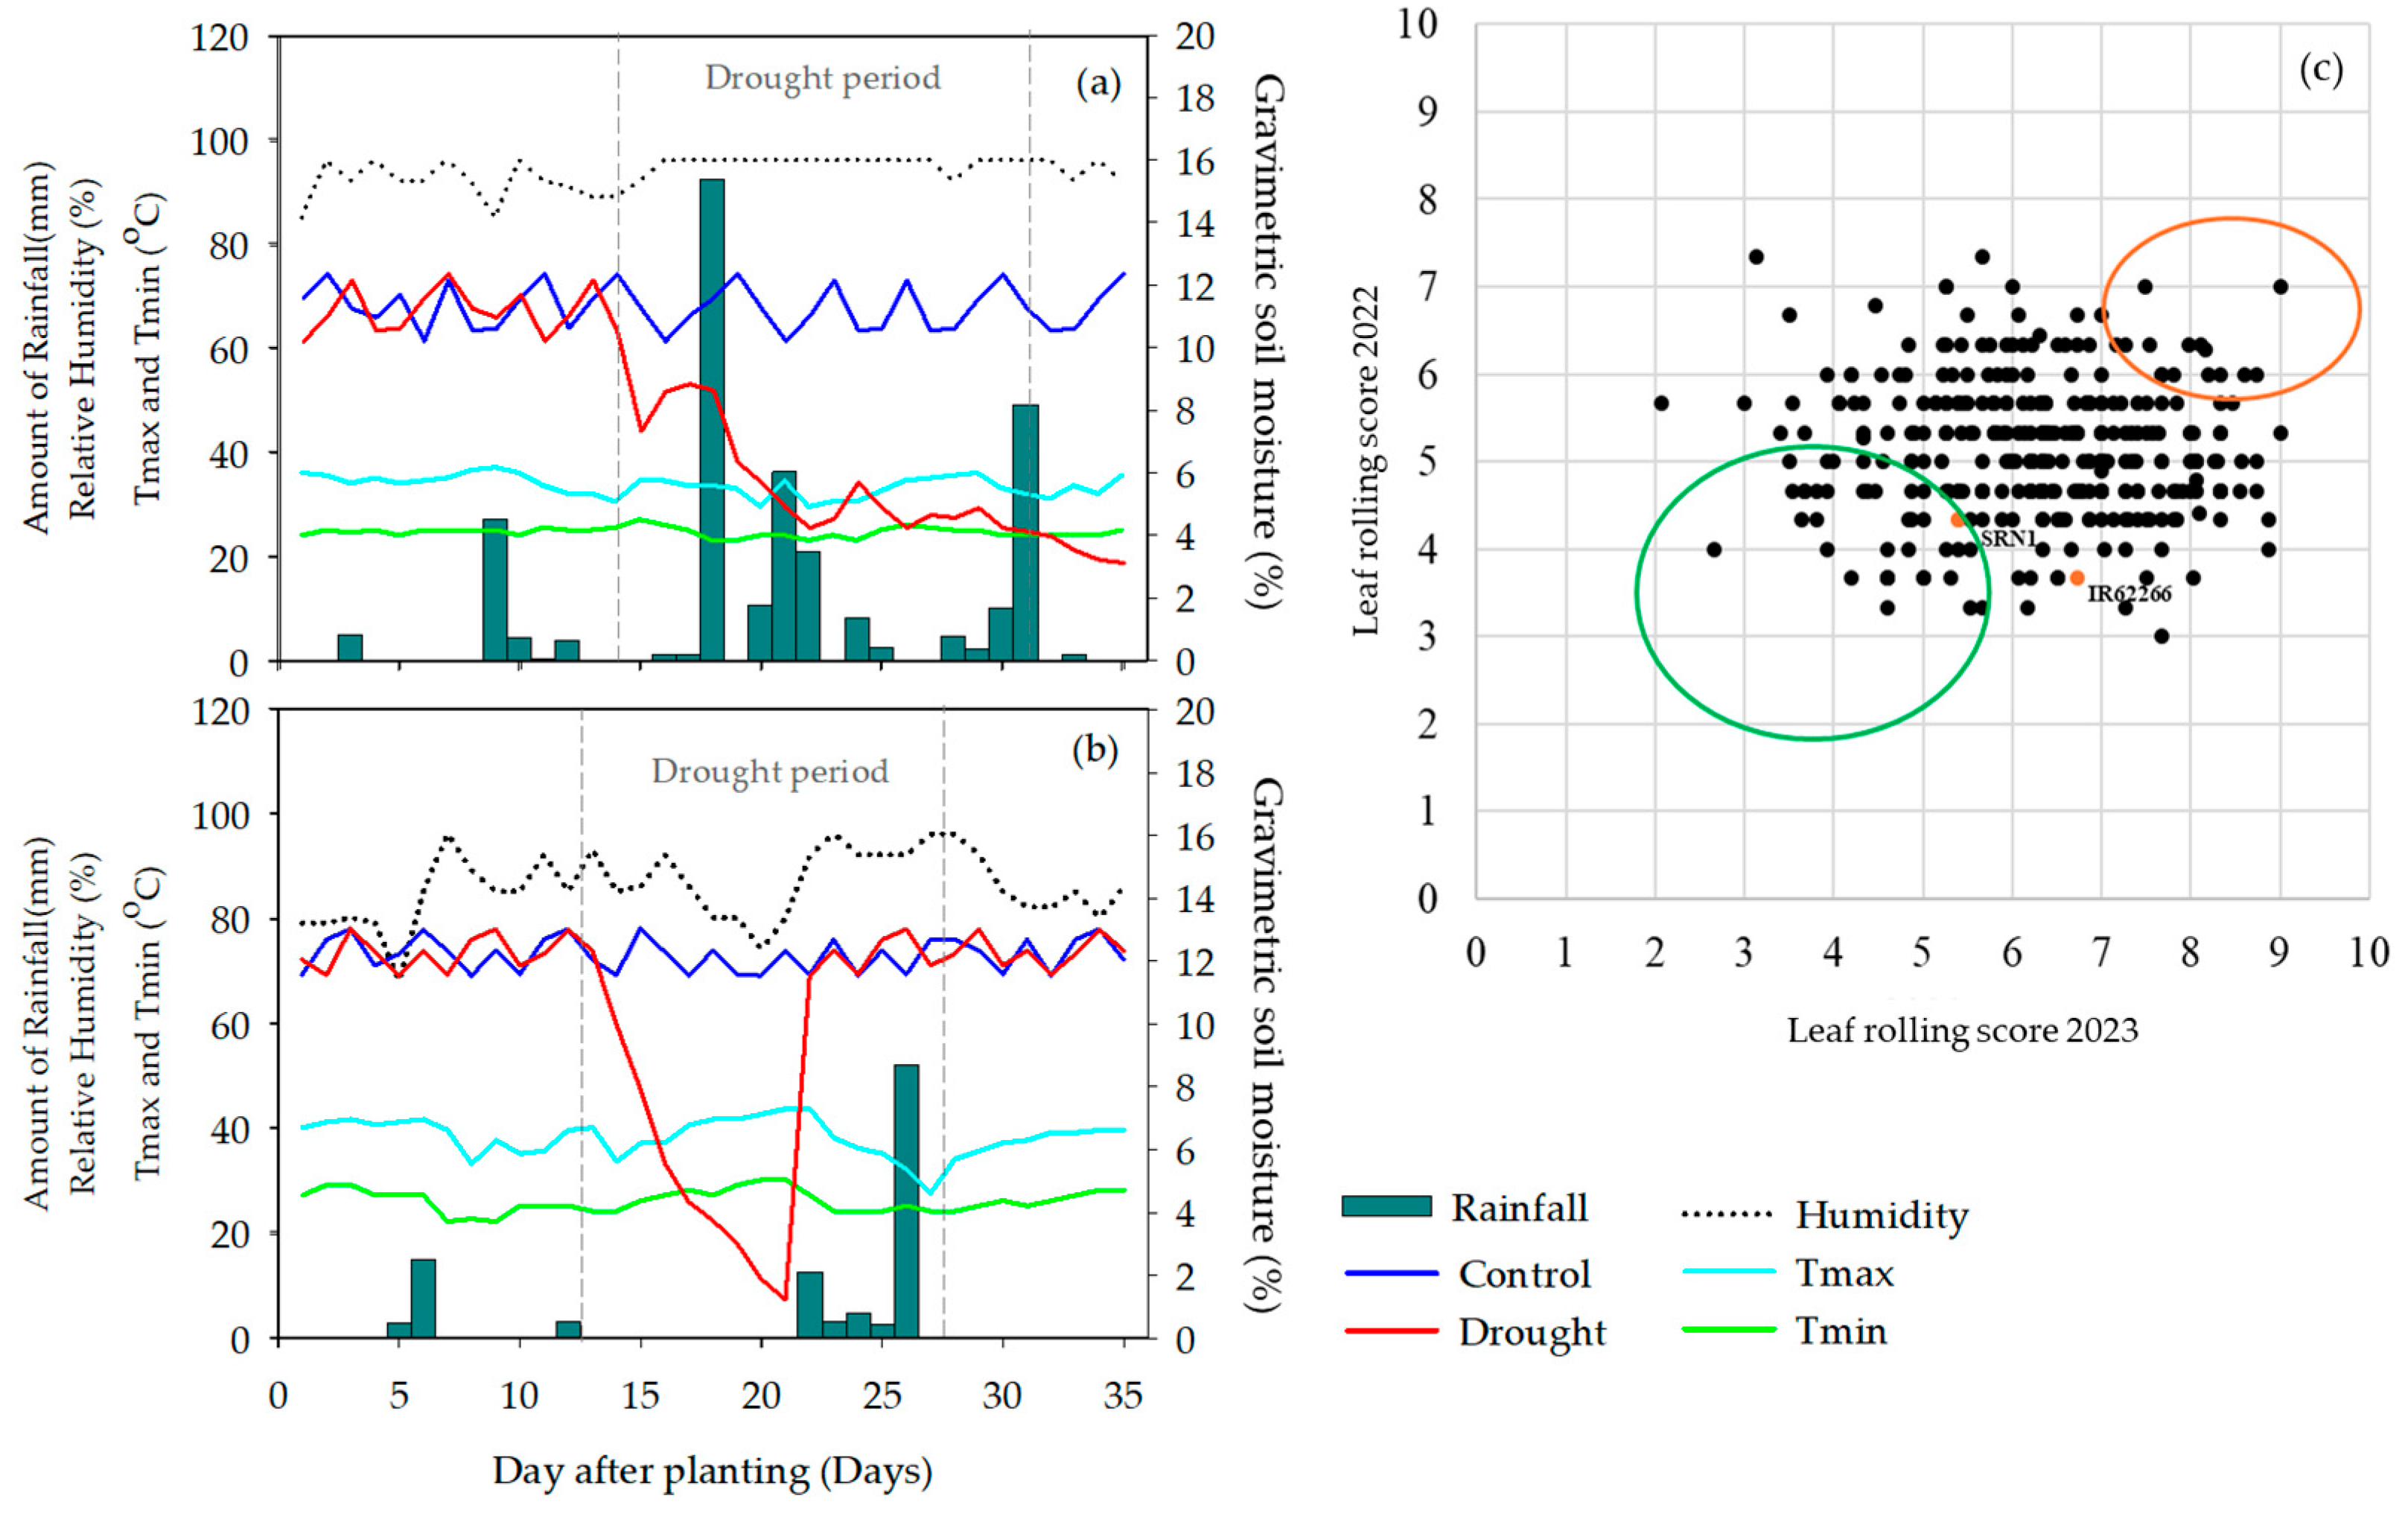
Combined analysis of variance across the two years (2022 and 2023) confirmed significant main effects for the genotype (G) and water regime (W) (p < 0.05) for leaf rolling (Supplementary Table S1). Notably, the genotype × year (G × Y) and genotype × water regime × year (G × W × Y) interactions were non-significant for the selected accessions, demonstrating strong phenotypic stability across different evaluation seasons. Based on the formal combined analysis and multi-year visual scoring, a total of 23 highly drought-tolerant upland rice accessions exhibiting stable low leaf rolling were consistently identified across both years. The weather data and soil moisture dynamics monitored during the 2022 and 2023 trial periods confirmed the effective induction of drought stress under field conditions (Figure 1). During the drought imposed, gravimetric soil moisture levels in the stress treatment continuously declined, dropping significantly below the control levels (between days 13 and 28 after planting). The field capacity (FC) of sandy loam under upland field condition was 15–22% (w/w gravimetric water content) [27,28], and the permanent wilting point (PWP) was 4–6% [29]; Pantuwan et al. [28] report that gravimetric moisture lower than 5% indicates severe water deficit. This reduction coincided with the amount of rainfall, even though the experiment was conducted under greenhouse conditions, but the humidity was affected by soil moisture, especially very low soil moisture. Environmental fluctuations successfully imposed atmospheric and soil water deficits on the evaluation, providing a reliable environment for phenotyping.
Leaf rolling and leaf dead scores are criteria for physiological indices commonly used to evaluate drought avoidance and cell turgor maintenance in rice under water stress conditions [15]. Visual scoring based on two consecutive years (2022 and 2023) demonstrated substantial phenotypic diversity among the 336 upland rice germplasm lines and two check varieties (SRN1 and IR62266). The analysis comparing leaf rolling scores from 2022 and 2023 revealed distinct phenotypic clusters: the high leaf rolling cluster (orange circle) exhibited consistently high leaf rolling scores in both years, reflecting rapid turgor loss and high susceptibility to water deficit conditions, while the low leaf rolling cluster (green circle) maintained lower leaf rolling scores across both years. Based on the combined selection criteria of low leaf rolling scores (LR < 5.0) and evaluation after stress imposition across two consecutive years, a total of 23 accessions were selected for further multi-stage evaluation. To select superior drought-tolerant candidates, the selection index was low leaf rolling (LR < 5.0). In this study, 336 evaluated landraces, exactly 23 accessions, consistently maintained LR < 5.0 in both 2022 and 2023, demonstrating high phenotypic stability relative to the drought-tolerant check cultivars (IR62266 and SRN1). These 23 stable accessions were advanced to experiment 2 for multi-stage evaluation. Screening for drought tolerance across multiple years accounts for environmental variation and genotype-by-environment (G × E) interactions, which often obscure true genetic potential in field evaluations [30]. The 23 identified accessions demonstrated stable phenotypic responses across two years and were used for evaluation at different developmental growth stages (seedling, tillering, and flowering stages) to characterize stage-specific drought resistance.

3.2. Multi-Stage Evaluation of Selected Upland Varieties Under Drought Stress

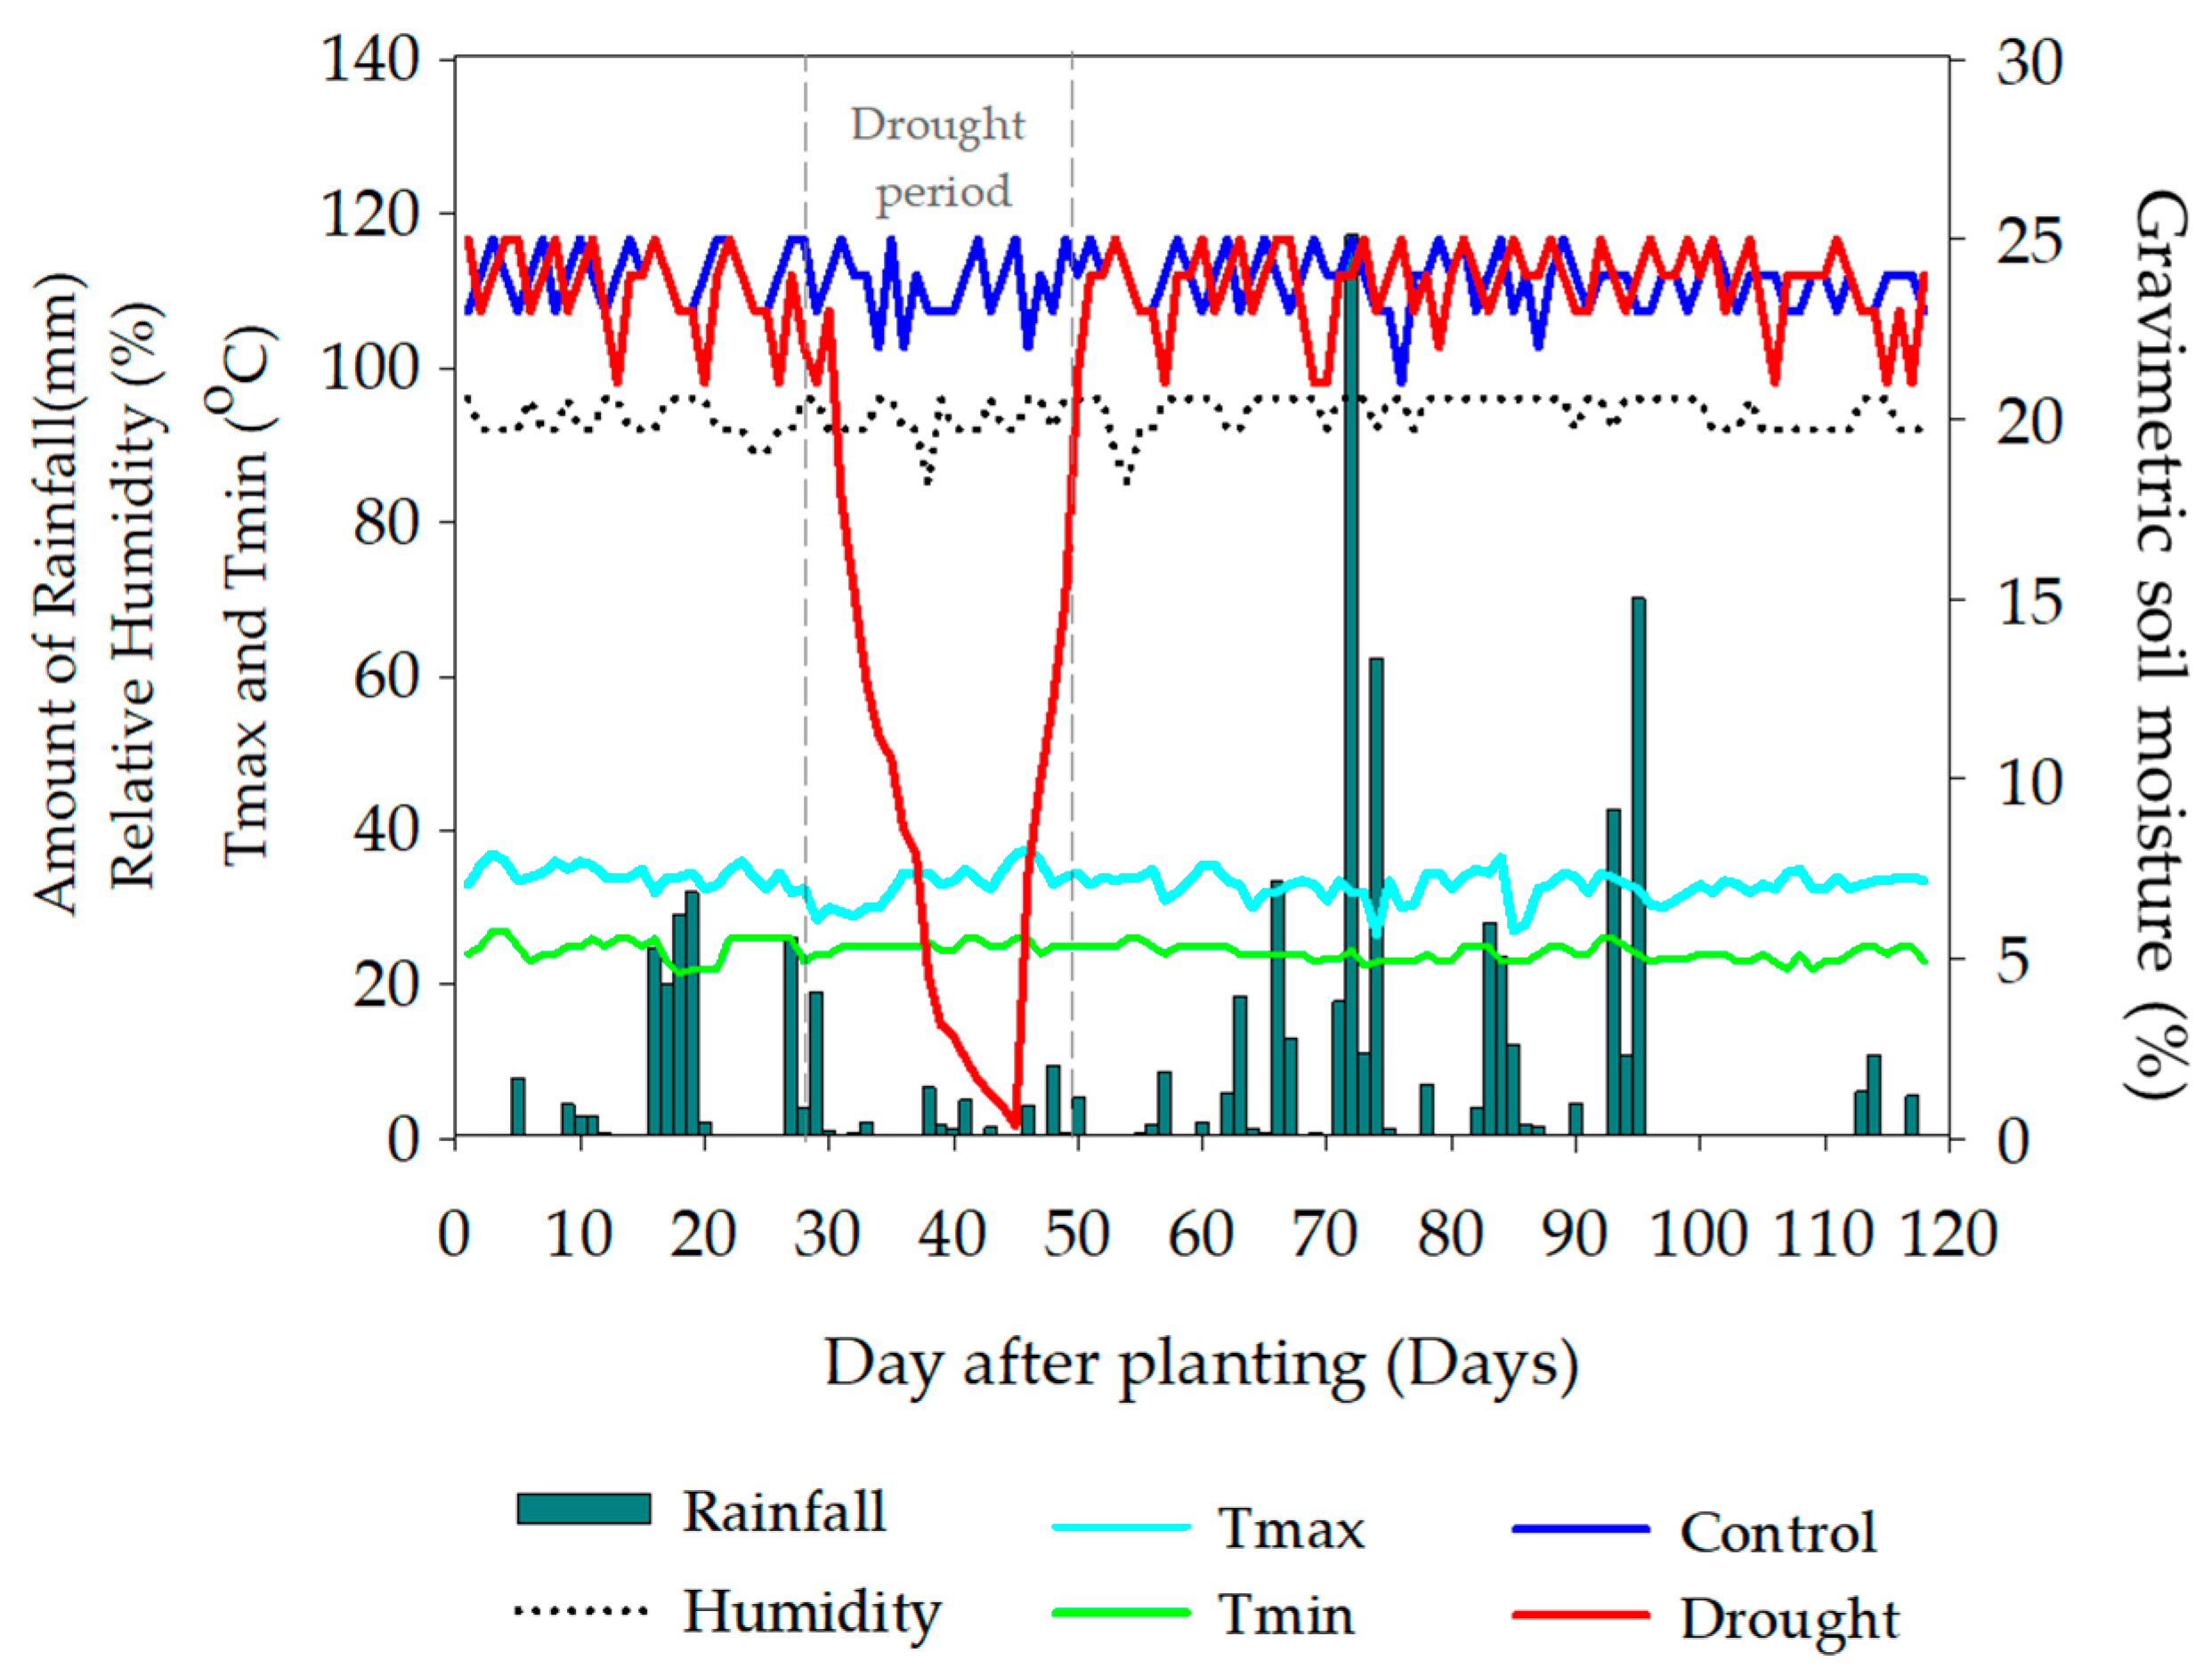
Screening evaluation at the seedling stage revealed that drought stress was effectively induced during the seedling stage at 29 to 45 days after planting (around 15 days). Soil moisture under stress conditions continuously dropped after the withholding of water (around days 28 to 45 after planting), reaching near-zero soil water content before re-watering. During this stress period, low rainfall and fluctuating relative humidity were observed, which accelerated transpiration demand and created severe water deficit conditions suitable for phenotypic screening (Figure 2).
During the seedling drought treatment, significant genotypic variations were observed among the selected upland rice accessions during the drought treatment period. Leaf rolling scores increased progressively with prolonged stress duration (from days 3 to 9 after stress), with initial responses at day 3 showing statistically significant differences (p < 0.01). Several accessions, including ULR 075, ULR 008, ULR 014, ULR 018, ULR 026, ULR 092, ULR 130, ULR 267, ULR 331, ULR 089, and ULR 397, exhibited significantly low leaf rolling scores (1.0) early in the stress period (3 DAIS). Furthermore, leaf dead scores progressed rapidly as water deficits intensified from days 8 to 14 after stress. At day 8, significant variation (p < 0.01) was detected. Based on the integrated evaluation of leaf rolling dynamic and low leaf death rates, specific accessions stood out as highly promising donor lines. Notably, accessions ULR 014, ULR 018, ULR 092, ULR 086, and ULR 397 demonstrated consistently outstanding performance. Varieties ULR 014, ULR 018, and ULR 092 maintained minimal leaf rolling (1.0) at 3 days after stress, and superior performance is explicitly framed as time-point-specific, lower leaf dead scores (0.0–0.5 at day 8; 0.5–2.5 at day 10). On the other hand, ULR 086 and ULR 397 maintained exceptionally low leaf dead scores through the mid-stress period (0.3–0.8 at day 8; 1.5–1.8 at day 10), outperforming or performing comparably to the check varieties (IR62266 and SRN1) (Table 1).
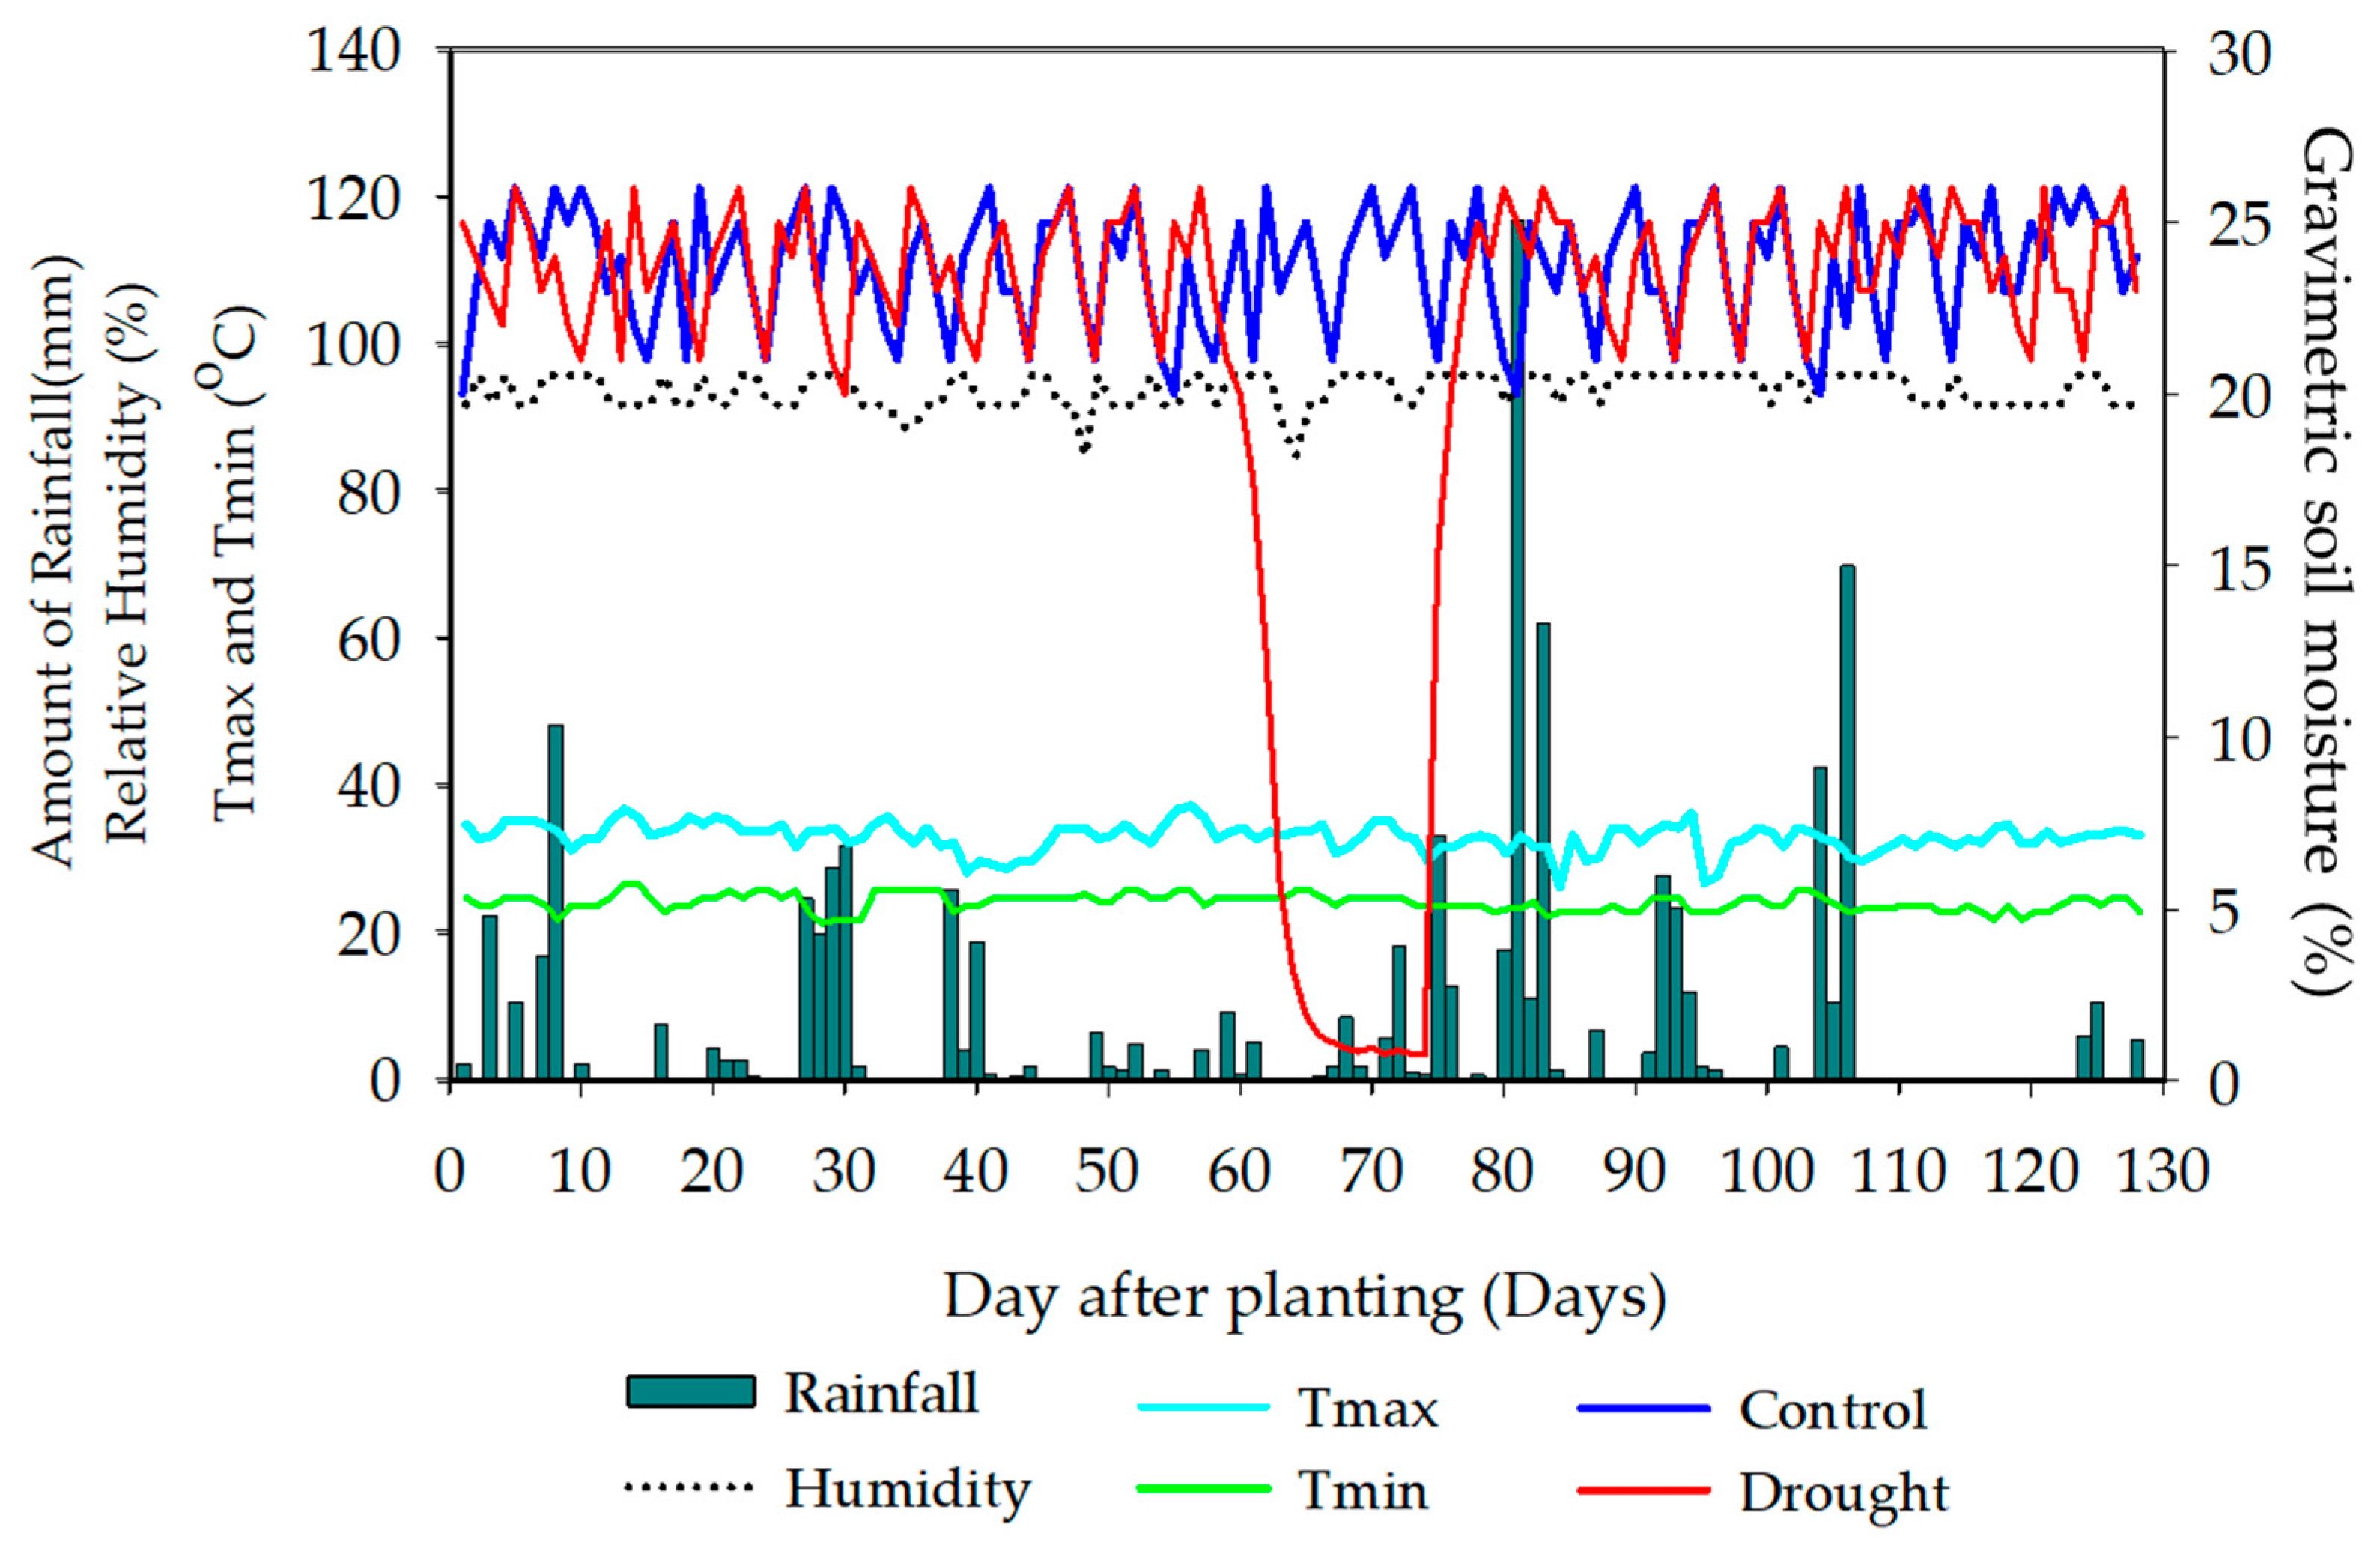
Monitoring of environmental parameters and soil moisture revealed that under well-watered conditions (control), soil moisture content was maintained consistently between 18% and 22% as the field capacity of sandy soil and permanent wilting point were lower than 6% [27,28,29]. In this study, under drought stress conditions, gravimetric water content (%) sharply declined starting at 61 days after planting (DAP), dropping below the permanent wilting point threshold to near 0% plant-available water between 65 and 75 DAP. Following re-watering at 77 DAP, soil moisture rapidly recovered to normal levels (Figure 3).
Evaluation of drought at the tillering stage revealed statistically highly significant differences (p < 0.01) among varieties, with a mean overall tiller number of 9.64 tillers/plant. The highest tillering potential before drought was SRN 1 (check), exhibiting the highest tillering capacity prior to stress at 15.50 tillers/plant, which was significantly higher than all other evaluated cultivars. This was followed by ULR 075 (12.60 tillers/plant), ULR 267 (12.40 tillers/plant), and IR62266 (check) (12.30 tillers/plant). To properly evaluate post-drought vegetative performance, both relative recovery percentage (%) and absolute tiller production per plant were interpreted separately (Table 2). Prior to drought imposition, check cultivar SRN1 exhibited the highest baseline tillering capacity (15.50 tillers/plant), followed by ULR 075 (12.60 tillers/plant) and IR62266 (12.30 tillers/plant). Following re-watering, relative recovery percentages evaluated at 35 days after re-watering were highest in accessions ULR 086 (36.9%), ULR 014 (32.9%), ULR 397 (31.5%), and the check SRN1 (30.6%). However, when evaluating absolute tiller regrowth, check variety SRN1 produced the highest final number of regenerated tillers (4.75 new tillers/plant at 35 days after re-watering), whereas ULR 014 (3.25 tillers/plant), IR62266 (3.13 tillers/plant), and ULR 086 (3.00 tillers/plant) exhibited moderate absolute regrowth (Table 2). These results highlight that a high relative recovery percentage does not inherently equate to the highest absolute tiller output, as relative rates are dependent on pre-stress baseline tillering numbers. Other notable high recovering varieties included ULR 014 (32.9%), ULR 397 (31.5%), and SRN 1 (30.6%). The lowest recovery capacity was ULR 147, which completely failed to recover, demonstrating a 0.0% recovery ability with zero tiller development after re-watering. The genotypic variation recovery ranged from 0.0% to 36.9%, with an overall mean of 20.5% (Table 2).
Screening for terminal drought tolerance at the flowering stage in 23 selected upland rice varieties showed substantial reductions in soil moisture that directly affected reproductive performance and grain development (Figure 4). Terminal drought stress imposed at the flowering stage exerted a highly significant (p < 0.01) impact on the panicle production per plant across the evaluated upland rice genotypes. The overall mean panicle number per plant decreased from 7.66 under well-watered control conditions to 5.26 under severe water-deficit stress. Reproductive panicle evaluation under flowering-stage drought, absolute panicle production under stress, and proportional yield-component reductions (%) were interpreted independently (Table 3). In terms of absolute panicle number under drought, landraces ULR 075 (6.88 panicles/plant), ULR 014 (6.50 panicles/plant), and ULR 071 (6.38 panicles/plant) performed remarkably well among the evaluated accessions, approaching the levels recorded for the tolerant check SRN1 (7.63 panicles/plant). However, these high-yielding lines under stress did not exhibit the lowest percentage reductions relative to their well-watered controls, recording reductions of 27.58%, 27.78%, and 30.12%, respectively (Table 3). Conversely, the lowest proportional reductions in panicle number were achieved by accessions ULR 032 (17.76%), ULR 397 (20.06%), ULR 018 (22.62%), and ULR 263 (23.47%), performing comparably to the check cultivar IR62266 (17.07%). The capacity of upland accessions like ULR 014, ULR 071, and ULR 075 to sustain high potential in the panicles under both the control and stress, as well as low reduction percentages, underlines their potential reproductive-stage drought avoidance mechanisms.
Based on phenotypic observations under drought conditions, rice varieties exhibiting a total filled grain percentage greater than 50% could be distinctly categorized into two response patterns. The first group comprises varieties that achieved a high total filled grain percentage primarily due to a high proportion of completely filled grains (100% grain filling). This group includes ULR 032, ULR 346, ULR 014, ULR 018, ULR 026, ULR 254, ULR 397, and IR62266. Conversely, the second group consists of varieties that achieved high total filled grain percentages despite having grains that were only partially filled, specifically within the 50–75% filling range. This group includes ULR 075, ULR 008, ULR 071, ULR 331, and ULR 086. This distinct variation highlights that evaluating terminal drought tolerance based solely on the cumulative filled grain percentage may lead to the selection of genotypes whose seeds fail to achieve full development (100% seed filling). Notably, when the threshold for selection is elevated to a total filled grain percentage greater than 70%, the selected germplasm encompasses both fully filled and partially filled cohorts, represented prominently by ULR 008, ULR 014, and IR62266 (check) (Table 4).
To identify genotypes with high breeding potential for target environments, productivity under non-stress conditions, grain yield performance under drought, and minimal yield reduction are critical. In this study, terminal drought stress significantly reduced overall grain yield per plant across genotypes, decreasing from a control mean of 12.1 g/plant to 9.53 g/plant under drought stress, representing an average yield reduction of 21.46% (Table 4). However, promising accessions possessing high yield potential characterized and superior grain-filling ability under stress were successfully identified. These varieties include ULR 026 (14.8 g/plant), ULR 130 (14.3 g/plant), ULR 263 (13.9 g/plant), and ULR 129 (13.0 g/plant), which maintained high grain yields, performing comparably to the tolerant checks IR62266 (14.7 g/plant) and SRN1 (13.6 g/plant) (Table 4). Furthermore, analysis of yield reduction percentages revealed outstanding yield stability in ULR 130 (0.00% reduction), ULR 263 (0.71% reduction), ULR 026 (3.27% reduction), and ULR 129 (8.45% reduction), alongside SRN1 (2.86% reduction) and IR62266 (−6.52% reduction) (Table 4). Additional genotypes such as ULR 014, ULR 018, ULR 071, ULR 075, and ULR 008 also exhibited minimal yield losses (11.45–18.55% reduction) compared to the overall mean (21.46%) (Table 4).
At the flowering stage, we observed varieties in the 50–75% filling group (e.g., ULR 008 and ULR 075). Varieties such as ULR 014, ULR 254, and IR62266 maintained high proportions of 100% filled grains under stress (48.92%, 42.28%, and 42.22%, respectively), alongside high-yield maintainers under drought such as ULR 026 and ULR 130. Furthermore, maintaining grain yield per plant and minimizing yield reduction under stress is vital for securing final harvestable production. The high potential varieties identified (such as ULR 026, ULR 130, ULR 263, and ULR 014) will serve as possible parental donors for crossing programs for reproductive-stage drought resilience and yield stability in rice breeding.

4. Clustering and Phenotypic Profiling of Multi-Stage Resilient Genotypes

For the evaluation of drought tolerance at the seedling, tillering, and flowering stages of 23 upland rice genotypes, a cluster analysis was performed using Ward’s method based on Euclidean distances. The clusters were constructed utilizing key physiological and agronomic traits, including seedling-stage leaf rolling and leaf drying scores, the tillering stage as the tillering capacity after re-watering, and the flowering stage such as grain yield potential, 100% grain-filling percentage, and total filled grain percentage. Based on the dendrogram with a Linkage Distance cutoff threshold at 70, the 25 rice genotypes were distinctly classified into four major functional groups, G1, G2, G3, and G4, each demonstrating contrasting adaptive strategies to water-deficit stress (Figure 5 and Table 5). Group 1 (G1) contains three accessions: ULR 017, ULR 147, and ULR 243 (Figure 5). This group exhibited high yield loss under stress, with a mean yield reduction of 33.0% (ULR 017 at 45.9% and ULR 147 at 32.7%). Group 1 also showed low recovery ability of only 5.6%, and the lowest total filled grain percentages (24.3%). Nevertheless, early seedling responses in G1 showed low leaf rolling, as seen in ULR 147 and ULR 243 (LR3 = 1.3–1.5). Group 2 (G2), comprising ULR 003, ULR 130, ULR 075, ULR 026, ULR 071, and ULR 129 (Figure 5), exhibited the lowest mean yield reduction percentage (13.3%) among all four groups, demonstrating exceptional yield stability under terminal drought stress. The following accessions displayed low yield reduction: ULR 130 (0.0%), ULR 026 (3.3%), ULR 129 (8.5%), and ULR 075 (11.5%). Group 2 also achieved the highest mean yield per plant under control conditions (13.4 g/plant), with ULR 026 (15.3 g/plant), ULR 130 (14.3 g/plant), and ULR 129 (14.2 g/plant). Furthermore, G2 displayed high tillering recovery ability of 20.3% and moderate total filled grain rates (46.9%). Group 3 (G3) is the largest cluster, consisting of 11 accessions: ULR 092, ULR 102, ULR 263, ULR 267, SRN1 (check), ULR 008, ULR 018, ULR 331, ULR 086, ULR 089, and ULR 397 (Figure 5). Group 3 recorded the highest overall tillering recovery ability (mean of 24.7%), such as ULR 086 (36.9%), ULR 397 (31.5%), SRN1 (30.6%), and ULR 089 (27.3%). At the seedling stage, G3 exhibited the lowest early leaf drying scores (LD8 of 0.6 and LD10 of 2.5), with ULR 092, ULR 018, ULR 086, and ULR 397 showing minimal cell desiccation (LD8 = 0.0–0.8). In terms of yield stability, G3 recorded a mean yield reduction of 28.9%, though notable exceptions like ULR 263 (0.7%), SRN1 (2.9%), ULR 018 (12.3%), and ULR 008 (18.5%) maintained high stability. Overall, G3 preserved a high total filled grain percentage (45.2%) and control yield potential (11.7 g/plant). Group 4 (G4) represents the most outstanding multi-stage drought resilient ideotype cohort, comprising accessions ULR 032, ULR 346, ULR 014, ULR 254, and the standard tolerant check IR62266 (Figure 5). This group recorded a low mean yield reduction percentage (17.6%), anchored by IR62266 (−6.5) and ULR 014 (12.3%). G4 achieved the highest mean 100% completely filled seed percentage (36.9%) and total filled grain percentage (66.5%) under reproductive-stage stress among all groups. Accessions ULR 014, ULR 254, and IR62266 recorded exceptionally high 100% seed filling rates of 48.9%, 42.3%, and 42.2%, respectively. Additionally, G4 maintained strong yield potential under non-stress conditions (mean yield of 12.3 g/plant), delayed cell death during early stress (mean LD8 of 0.9 and LD10 of 2.4), and sustained high vegetative recovery capability after re-watering at the tillering stage (mean recovery ability of 20.0%, with ULR 014 reaching 32.9%).
In conclusion, G4 had high 100% filled grain (36.9%), high grain yield (66.5%), and low yield reduction, with a mean of 17.6%; G3 had high tillering recovery (24.7%) and a low leaf dead score (LD8 0.6); G2 had high yield/plants under the control condition (13.4 g) and a low yield reduction percentage under the drought condition (13.3%); and G1 was susceptible to low recovery and filled grain percentage compared to the other groups. This clear contrast between early-stage resilience and late-stage susceptibility underscores the stage-dependent nature of phenotypic drought responses in rice, indicating that early-stage drought screening may not directly predict reproductive-stage performance (Table 5).

5. Discussion

5.1. Phenotypic Diversity and the Physiological Significance of Early-Stage Visual Traits

Large-scale germplasm characterization under water-deficit stress needs a suitable phenotyping criterion capable of reflecting real-time plant water status with rapid recording, such as leaf rolling, leaf drying, and drought recovery scores, which some studies calculated as the drought susceptibility index or drought tolerance index, being wildly useful [31,32]. In this study, multi-seasonal evaluation of 336 Thai indigenous upland rice accessions over two years revealed substantial phenotypic diversity in leaf rolling (LR) and leaf drying/death (LD) scores. These traits serve as critical for assessing cellular turgor maintenance and desiccation tolerance in rice [1,15]. The progression of LR scores serves as an indirect physiological for stomatal regulation and internal water potential fluctuations [16]. Rapid leaf rolling under mild water deficit minimizes transpiration water loss by reducing the exposed leaf surface area to solar radiation, thereby preventing catastrophic vascular cavitation [15,33,34]. However, sustaining a lower leaf rolling score longer into a prolonged stress period, as observed in accessions ULR 014, ULR 018, and ULR 092 (in experiment 2), at 3 days after stress induction suggests potential dehydration avoidance responses, osmotic adjustment capabilities, or deeper root water extraction efficiency that may help maintain cellular turgidity [17,29,35].
Concurrently, the rate of leaf drying signifies the structural integrity of cellular membranes and the capability of the genotype to delay stress induced senescence [1,17]. Variations in LD scores between 8 and 14 days after stress revealed that accessions such as ULR 086 and ULR 397 could effectively delay leaf desiccation, performing comparably to the drought-tolerant check cultivars IR62266 and SRN1. Delays in leaf senescence are hypothesized to protect the photosynthetic apparatus from irreversible photo-oxidative degradation caused by reactive oxygen species (ROS) accumulation during severe dehydration [36,37]. The distinct separation of genotypes via multi-year screening highlights the evolutionary divergence of Thai indigenous landraces, which have developed specialized morpho-physiological adaptations to handle atmospheric and soil moisture deficits common to rainfed ecosystems [12,38,39].

5.2. Vegetative Plasticity and Post-Drought Meristematic Recovery Dynamics

The survival of a rice genotype based on its capacity to regenerate active vegetative growth upon rehydration is a key agronomic adaptation to achieve productivity [18,19]. The vegetative tillering stage establishes the basic architectural foundation for panicle development; thus, moisture stress during plant development affects the productive tiller numbers and suppresses yield potential [40]. Regarding crop management, nutrient availability during and after drought can significantly influence tiller regeneration and recovery dynamics. In experiment 2, delaying the final fertilizer split until post-re-watering (80 DAS) in the drought treatment ensured that nutrients were functionally accessible for active meristematic growth rather than causing root osmotic stress during severe soil desiccation. While the timing offset between control and stress treatments introduces a potential confounding factor regarding nutrient availability, the uniform cumulative fertilizer applied across all treatments guarantees that post-drought vegetative recovery (e.g., in ULR 086 and ULR 014) reflects genuine physiological plasticity in nutrient utilization and tiller regeneration rather than differential total nutrient supply. This finding showed that while certain checks like SRN1 maintained superior tillering potential prior to drought, their capacity to initiate new tillers after re-watering was markedly inferior to promising landraces. Following re-watering, the evaluated accessions displayed an overall mean tiller recovery capacity of 20.5%. Notably, accessions ULR 086 (36.9%), ULR 014 (32.9%), and ULR 397 (31.5%) demonstrated superior tiller regeneration rates, whereas ULR 147 completely failed to recover (0.0%). This demonstrates dramatic genotypic variation in drought recovery under different degrees of meristematic protection during extreme dehydration. High recovery is proposed to maintain better protection of physiological acclimation strategies and metabolic stress memory that preserve crown root nodes and basal auxiliary buds from irreversible desiccation [41,42,43]. Upon rehydration, potential underlying mechanisms, such as protected meristematic tissues rapidly remobilizing nitrogen and carbohydrates to trigger tiller regeneration, compensate for the loss of primary shoots. This vegetative plasticity is highly advantageous for rainfed direct-seeded upland rice systems, where early to mid-season intermittent droughts frequently disrupt crop establishment and vegetative growth [44]. Rather than reflecting controlled irrigation practices such as alternate wetting and drying (AWD), the severe water deficit imposed here closely mimics the severe intermittent dry spells characteristic of rainfed ecosystems [45]. Under such rainfed conditions, the capacity for dynamic tiller regeneration upon rehydration serves as a critical recovery mechanism, allowing for plant regrowth, promoting productive canopy structure, and mitigating yield loss following unpredicted drought events. In addition, the tiller recovery or regrowth from severe stress conditions may be associated with the main mechanism for drought tolerance variety as a recovery mechanism [1].

5.3. Reproductive Sink Strength and Source-to-Sink Translocation Under Terminal Drought

Terminal drought stress during the flowering stage represents the most destructive bottleneck in rice production, as moisture deficits at anthesis disrupt microsporogenesis, cause floret sterility, and arrest starch synthesis, even the flower opening time [46,47]. In this study, evaluating terminal drought based on cumulative filled grain percentages obscured critical physiological deficiencies. By profiling the precise degree of seed fullness (100%, 75%, and 50%), we revealed distinct operational strategies among the adaptation ability. Group 2 accessions (e.g., ULR 008, ULR 075, and ULR 071) sustained high total filled grain percentages primarily through partially filled grains (50–75%). Conversely, elite lines including ULR 014, ULR 254, ULR 397, and the check IR62266 achieved their high filled grain rates through a high proportion of completely filled grains (100% full grain). This divergence highlights the functional efficiency of source-to-sink translocations during severe terminal stress [11,20,24,48]. High-yield maintenance was the main characteristic for plant production; however, a clearer mechanism is needed. The maintained filled grain percentage or weight was the final product for farmers, which makes 100% filled grain the key factor for production compared to 50% fill seed. The fill seed reduction under flowering-stage drought, as previously reported in rice under drought stress, is hypothesized to involve sharp foliar photosynthesis drops due to stomatal closure, making grain filling highly reliant on the remobilization of pre-anthesis water-soluble carbohydrates (WSCs) temporarily stored in the stems and leaf sheaths [49,50]. Accessions maintaining a high proportion of 100% full grains (such as ULR 014) are suggested to exhibit higher stem WSC remobilization efficiency or sustained sink strength; we hypothesize that this phenotype may be supported by efficient remobilization of stored reserves, as reported in similar drought-tolerant landraces [50]. This protects the grain-filling process from water deficit, ensuring stable grain weight and minimal yield loss despite the severe depletion of soil moisture.

5.4. Stage-Specific Independence and Breeding Potential of Promising Multi-Stage Accessions

The cluster analysis categorized the 25 rice genotypes into three functional groups based on their distinct multi-stage adaptation profiles. Group 1 landraces (e.g., ULR 243, ULR 263, and ULR 092) exhibited outstanding dehydration avoidance during the early seedling stage, maintaining minimal leaf rolling and drying scores, but suffered severe spikelet sterility and yield loss under reproductive stress. This striking contrast between early vegetative survival and reproductive performance highlights the pronounced stage dependence of drought responses in upland rice germplasms. While some accessions excelled exclusively at the seedling stage, others (such as ULR 014 and ULR 254) successfully combined favorable phenotypic responses across multiple developmental phases. Recognizing this stage dependence, without inferring specific underlying genetic architecture, is critically important for crop improvement, as relying solely on single-stage evaluations risks missing lines with cross-stage resilience or incorrectly assuming that early vegetative tolerance guarantees reproductive success. Consequently, clear selection programs based exclusively on single growth stages risks omitting necessary traits for the variation of field or target environment. On the other hand, group 3, comprising ULR 014, ULR 254, and the standard check IR62266, demonstrated multi-stage drought tolerance. For these accessions, low leaf rolling or low leaf drying with high tiller regeneration, high yield potential, and 100% filled grain percentages will be evaluated using a deep tolerance mechanism in the future study. The independent genetic variations preserved within these indigenous upland landraces offer parental material for further breeding programs. By integrating promising candidate parental sources, for example, ULR 014 (maintain yield under drought at the flowering stage), ULR 397 (high tiller recovery at the tillering stage), and ULR 032 (low leaf rolling at the seedling stage), into crossing programs, we can combine complementary drought response phenotypes through crossing and subsequent selection to develop high yielding, multi-stage resilient cultivars for dynamic rainfed environments.
It is important to consider the methodological implications of the sequential selection strategy employed in this study. Because experiment 2 was restricted to the 23 accessions previously selected for seedling-stage drought tolerance, this evaluated subset is not fully representative of the original 336 indigenous accessions. Under this screening scheme, genotypes that may have exhibited low early-stage tolerance but superior reproductive-stage drought resilience were systematically excluded during the initial seedling trial. Consequently, while our findings demonstrate distinct, stage-specific physiological responses among the selected elite accessions, these observed relationships across developmental stages should be interpreted within the context of this pre-selected subset and cannot be generalized to the entire upland rice germplasm collection. Future broad-spectrum evaluations encompassing unselected panels across all stages will further validate stage-stage genetic independence.

6. Conclusions

For seedling-stage drought tolerance, promising accessions such as ULR 014, ULR 018, and ULR 092 demonstrated outstanding performance by maintaining minimal leaf rolling and low leaf drying scores. For the tillering stage, genotypes ULR 086, ULR 014, and ULR 397 exhibited the highest tiller regeneration rates (31.5–36.9%) after re-watering. For flowering-stage drought, genotypes ULR 026, ULR 130, ULR 129, and ULR 014 preserved high grain yields with low percentage reductions (0.00–12.31%), while ULR 014, ULR 254, and ULR 397 maintained a high proportion of 100% completely filled grains. Multi-stage evaluation classified the upland germplasm into four groups: G4, with comprehensive multi-stage resilience and high filled grain percentage (ULR 014 and ULR 254), G3 with high tiller recovery and delayed leaf desiccation (ULR 397 and ULR 086), G2 with high control yield potential and the lowest yield reduction percentage (ULR 026, ULR 130, and ULR 129), and G1 as the sensitive cohort. In summary, this study demonstrates the critical stage dependence of drought response in indigenous upland rice. By identifying accessions that combine favorable performance across multiple growth phases (ULR 014) alongside candidate yield stability donors (ULR 026 and ULR 130), these results highlight valuable donor materials for target environments subject to dynamic drought stress.

Supplementary Materials

The following are available online at https://www.mdpi.com/article/10.3390/agronomy16202006/s1, Table S1. The detailed F-statistics and mean squares from the combined ANOVA across years of 336 upland accession.

Author Contributions

Conceptualization, T.M. and S.C. (Sompong Chankaew); methodology, T.M.; validation, T.M. and S.C. (Sirilak Chuakudroo); formal analysis, S.C. (Sirilak Chuakudroo); investigation, S.C. (Sirilak Chuakudroo); resources, J.S.; data curation, T.M. and S.C. (Sirilak Chuakudroo); writing—original draft preparation, S.C. (Sirilak Chuakudroo); writing—review and editing, T.M. and S.C. (Sompong Chankaew); visualization, T.M.; supervision, T.M. All authors have read and agreed to the published version of the manuscript.

Funding

This research received no external funding.

Data Availability Statement

The data presented in this study is available on request from the corresponding author.

Acknowledgments

This research was supported by the Plant Breeding Research Centre for Sustainable Agriculture and Rice Germplasm Collection project of Khon Kaen University, Khon Kaen, Thailand.

Conflicts of Interest

The authors declare no conflicts of interest.

References

  1. Hassan, M.A.; Dahu, N.; Hongning, T.; Qian, Z.; Yueming, Y.; Yiru, L.; Shimei, W. Drought stress in rice: Morphophysiological and molecular responses and marker-assisted breeding. Front. Plant Sci. 2023, 14, 1215371. [Google Scholar] [CrossRef] [Scilit]
  2. Mohidem, N.A.; Hashim, N.; Shamsudin, R.; Che Man, H. Rice for food security: Revisiting its production, diversity, rice milling process and nutrient content. Agriculture 2022, 12, 741. [Google Scholar] [CrossRef] [Scilit]
  3. Mishra, A.K.; Mottaleb, K.A.; Khanal, A.R.; Mohanty, S. Abiotic stress and its impact on production efficiency: The case of rice farming in Bangladesh. Agric. Ecosyst. Environ. 2015, 199, 146–153. [Google Scholar] [CrossRef] [Scilit]
  4. Singh, T.; Pun, K.B.; Saikia, K.; Satapathy, B.S.; Bhagat, K.; Das, A.; Lal, B. Abiotic stress management in rice. In Integrated Soil and Water Resource Management for Livelihood and Environmental Security, 1st ed.; Rajkhowa, D.J., Anup, D., Ngachan, S.V., Sikka, A.K., Lyngdoh, M., Eds.; ICAR Research Complex for NEH Region: Umiam, Meghalaya, India, 2015; pp. 219–258. [Google Scholar]
  5. Wang, Y.; Zhang, L.; Nafisah, A.; Zhu, L.; Xu, J.; Li, Z. Selection efficiencies for improving drought/salt tolerances and yield using introgression breeding in rice (Oryza sativa L.). Crop J. 2013, 1, 134–142. [Google Scholar] [CrossRef] [Scilit]
  6. Yadav, H.K.; Singh, V.J.; Bisen, P.; Sonu; Ragi, S.; Nandakumar, S.; Singh, A.; Dubey, S.; Chourasiya, V.K.; Pathak, S.K.; et al. Multi-trait selection of drought tolerant rice genotypes based on seedling and root architecture responses to PEG-induced osmotic stress. Front. Sustain. Food Syst. 2026, 10, 1865363. [Google Scholar] [CrossRef] [Scilit]
  7. Tuong, T.P.; Castillo, E.G.; Cabangon, R.C.; Boling, A.; Singh, U. The drought response of lowland rice to crop establishment practices and N-fertilizer sources. Field Crops Res. 2002, 74, 243–257. [Google Scholar] [CrossRef] [Scilit]
  8. Warioba, K.G.; Macandza, C.M.; Moiana, L.D. Screening rice (Oryza sativa L.) genotypes for seedling-stage drought tolerance. Stresses 2026, 6, 13. [Google Scholar] [CrossRef] [Scilit]
  9. Jin, Y.; Yang, H.; Wei, Z.; Ma, H.; Ge, X. Rice Male Development under drought stress: Phenotypic changes and stage-dependent transcriptomic reprogramming. Mol. Plant 2013, 6, 1630–1645. [Google Scholar] [CrossRef] [Scilit]
  10. Saragih, A.A.; Puteh, A.B.; Ismail, M.R.; Mondal, M.M.A. Pollen quality traits of cultivated (Oryza sativa L. ssp. indica) and weedy (Oryza sativa var. nivara) rice to water stress at reproductive stage. Aust. J. Crop Sci. 2013, 7, 1106–1112. [Google Scholar]
  11. Panja, S.; Gupta, A.D.; Dey, N. Impact of drought stress on grains filling in rice and its management: A review. Agric. Rev. 2024, 45, 282–289. [Google Scholar] [CrossRef] [Scilit]
  12. Narenoot, K.; Monkham, T.; Chankaew, S.; Songsri, P.; Pattanagul, W.; Sanitchon, J. Evaluation of the tolerance of Thai indigenous upland rice germplasm to early drought stress using multiple selection criteria. Plant Genet. Resour. 2015, 15, 109–118. [Google Scholar] [CrossRef] [Scilit]
  13. Nilthong, S.; Chukeatirote, E.; Nilthong, R. Assessment of genetic diversity in Thai upland rice varieties using SSR markers. Aust. J. Crop Sci. 2020, 14, 597–604. [Google Scholar] [CrossRef] [Scilit]
  14. Pusadee, T.; Jamjod, S.; Prom-u-thai, C.; Jaksomsak, P.; Rerkasem, B. Population structure and functional diversity of rice landraces: A review. Nat. Life Sci. Commun. 2024, 23, e2024027. [Google Scholar] [CrossRef] [Scilit]
  15. O’Toole, J.C.; Cruz, R.T. Response of leaf water potential, stomatal resistance, and leaf rolling to water stress. Plant Physiol. 1980, 65, 428–432. [Google Scholar] [CrossRef] [Scilit]
  16. Cal, A.J.; Sanciangco, M.; Rebolledo, M.C.; Luquet, D.; Torres, R.O.; McNally, K.L.; Henry, A. Leaf morphology, rather than plant water status, underlies genetic variation of rice leaf rolling under drought. Plant Cell Environ. 2019, 42, 1532–1544. [Google Scholar] [CrossRef] [Scilit]
  17. Hsiao, T.C.; O’Toole, J.C.; Yambao, E.B.; Turner, N.C. Influence of osmotic adjustment on leaf rolling and tissue death in rice (Oryza sativa L.). Plant Physiol. 1980, 75, 338–341. [Google Scholar]
  18. Wang, S.; Yao, Y.; Wang, J.; Ruan, B.; Yu, Y. Advancing Stress-Resilient Rice: Mechanisms, Genes, and Breeding Strategies. Agriculture 2025, 15, 721. [Google Scholar] [CrossRef] [Scilit]
  19. Adzigbe, J.; Frimpong, F.; Danquah, A.; Danquah, E.Y.; Asante, I.K.; Abebrese, S.O.; Dormatey, R.; Afriyie-Debrah, C.; Ribeiro, P.F.; Danquah, E.O.; et al. The responses and adaptations of rice (Oryza sativa L.) to drought stress: A review. Clim. Smart Agric. 2025, 2, 100080. [Google Scholar] [CrossRef] [Scilit]
  20. Wang, X.; Fu, J.; Min, Z.; Zou, D.; Liu, H.; Wang, J.; Zheng, H.; Jia, Y.; Yang, L.; Xin, W.; et al. Response of rice with overlapping growth stages to water stress by assimilates accumulation and transport and starch synthesis of superior and inferior grains. Int. J. Mol. Sci. 2022, 23, 11157. [Google Scholar] [CrossRef] [Scilit]
  21. Panda, D.; Mishra, S.S.; Behera, P.K. Drought tolerance in rice: Focus on recent mechanisms and approaches. Rice Sci. 2021, 28, 119–132. [Google Scholar] [CrossRef] [Scilit]
  22. Naing, N.N.Z.N.; Wang, C.; Zhu, Q.; Yan, H.; Zhang, C.; Li, J.; Wang, X.; Li, D.; Wen, J.; Li, C.; et al. Genomic and Transcriptomic Insights into Stage-Specific Drought Resilience in Diverse Myanmar Rice Germplasm. Rice 2026, 19, 8. [Google Scholar] [CrossRef] [Scilit]
  23. Fen, L.L.; Ismail, M.R.; Zulkarami, B.; Rahman, M.S.A.; Islam, M.R. Physiological and molecular characterization of drought responses and screening of drought tolerant rice varieties. Biosci. J. 2015, 31, 709–718. [Google Scholar] [CrossRef] [Scilit]
  24. Sadhukhan, D.; Mukherjee, T.; Sarkar, A.; Devi, N.D.; Bisarya, D.; Kumar, V.; Jincy, M. A Comprehensive analysis of drought stress responses in rice (Oryza sativa L.): Insights into developmental stage variations from germination to grain filling. Int. J. Environ. Clim. Change 2024, 14, 141–158. [Google Scholar] [CrossRef] [Scilit]
  25. De Datta, S.K.; Malabuyoc, J.A.; Aragon, E.L. A field screening technique for evaluating rice germplasm for drought tolerance during the vegetative stage. Field Crop. Res. 1988, 19, 123–134. [Google Scholar] [CrossRef] [Scilit]
  26. IRRI (International Rice Research Institute). Standard Evaluation System for Rice (SES), 5th ed.; International Rice Research Institute: Los Baños, Philippines, 2013; pp. 1–52. [Google Scholar]
  27. Guan, Y.S.; Serraj, R.; Liu, S.H.; Xu, J.L.; Ali, J.; Wang, W.S.; Zheng, T.Q.; Ma, X.F.; Hegde, B.R.; Yagi, S.; et al. Analysis of QTL×environment interaction for grain yield in rice under drought stress and well-watered conditions. J. Exp. Bot. 2010, 61, 3387–3395. [Google Scholar]
  28. Pantuwan, G.; Fukai, S.; Cooper, M.; Rajatasereekul, S.; O’Toole, J.C. Yield response of rice (Oryza sativa L.) genotypes to drought under rainfed lowlands: 3. Plant factors affecting grain yield. Field Crops Res. 2002, 77, 217–232. [Google Scholar]
  29. Kamoshita, A.; Rodriguez, R.; Yamauchi, A.; Wade, L.J. Genotypic variation in response of rainfed lowland rice to prolonged drought and rewatering. Plant Prod. Sci. 2004, 7, 406–420. [Google Scholar] [CrossRef] [Scilit]
  30. Bii, L.C.; Ngugi, K.; Kimani, J.M.; Chemining’wa, G.N. Genotype by environment analysis of rice (Oryza sativa L.) populations under drought stressed and well-watered environments. Aust. J. Crop Sci. 2020, 14, 259–262. [Google Scholar] [CrossRef] [Scilit]
  31. Pachauri, A.; Gauraha, D.; Gupta, P.; Sahu, S.; Pujari, P. Screening of rice germplasm for tolerance to drought stress using morphological and physiological parameters. Environ. Ecol. 2022, 40, 1779–1785. [Google Scholar]
  32. Ha, P.T.T.; Nguyen, N.T.T.; Linh, D.T.N.; Lang, N.T.; Buu, B.C. Evaluation of rice germplasm for yield traits and amylose content under drought stress. SABRAO J. Breed. Genet. 2020, 52, 64–74. [Google Scholar]
  33. Brodribb, T.J.; Bienaimé, D.; Marmottant, P. Revealing catastrophic failure of leaf networks under stress. Proc. Natl. Acad. Sci. USA 2016, 113, 4865–4869. [Google Scholar] [CrossRef] [Scilit]
  34. Kadioglu, A.; Terzi, R. A dehydration avoidance mechanism: Leaf rolling. Bot. Rev. 2007, 73, 290–302. [Google Scholar] [CrossRef] [Scilit]
  35. Kim, S.L.; Kim, N.; Lee, H.; Lee, E.; Cheon, K.; Kim, M.; Baek, J.; Choi, I.; Ji, H.; Yoon, I.S.; et al. High-throughput phenotyping platform for analyzing drought tolerance in rice. Planta 2020, 252, 38. [Google Scholar] [CrossRef] [Scilit]
  36. Rivero, R.M.; Kojima, M.; Gepstein, A.; Sakakibara, H.; Mittler, R.; Gepstein, S.; Blumwald, E. Delayed leaf senescence induces extreme drought tolerance in a flowering plant. Proc. Natl. Acad. Sci. USA 2007, 104, 19631–19636. [Google Scholar] [CrossRef] [Scilit]
  37. Khanna-Chopra, R. Leaf senescence and abiotic stresses share reactive oxygen species-mediated chloroplast degradation. Protoplasma 2012, 249, 469–481. [Google Scholar] [CrossRef] [Scilit]
  38. Sujariya, S.; Jongdee, B.; Monkham, T.; Jongrungklang, N. Adaptation of rice genotypes to diverse rainfed lowland paddy conditions. SABRAO J. Breed. Genet. 2019, 51, 340–355. [Google Scholar]
  39. Lamichhane, N.; Dhami, U.; Bhandari, S.; Pant, G.; Thapa, L.B.; Pokhrel, C.P.; Yadav, R.K.P. Screening of drought-tolerant rice landraces using various drought indices in Nepal. Sci. Rep. 2025, 15, 45752. [Google Scholar] [CrossRef] [Scilit]
  40. Kitilu, M.J.F.; Nyomora, A.M.S.; Charles, J. Effects of moisture stresses during vegetative and reproductive growth phases on productivity of six selected rain-fed rice varieties in Ifakara, Tanzania. Afr. J. Agric. Res. 2019, 14, 54–64. [Google Scholar] [CrossRef] [Scilit]
  41. Li, J.; Zhang, B.; Song, J.; Li, D.; Chen, M.; Chen, Z.; Qin, B.; Xu, H.; Zou, J.; Weng, P.; et al. Stubble rolling primes axillary bud regeneration and increases grain yield in mechanically harvested ratoon rice in South China. Crop J. 2026, 14, 1410–1419. [Google Scholar] [CrossRef] [Scilit]
  42. Yao, F.; Hu, Q.; Yu, Y.; Yang, L.; Jiao, S.; Huang, G.; Zhang, S.; Hu, F.; Huang, L. Regeneration pattern and genome-wide transcription profile of rhizome axillary buds after perennial rice harvest. Front. Plant Sci. 2022, 13, 1071038. [Google Scholar] [CrossRef] [Scilit]
  43. Yan, Y.; Ding, C.; Zhang, G.; Hu, J.; Zhu, L.; Zeng, D.; Qian, Q.; Ren, D. Genetic and environmental control of rice tillering. Crop J. 2023, 11, 1287–1302. [Google Scholar] [CrossRef] [Scilit]
  44. Xangsayasane, P.; Jongdee, B.; Pantuwan, G.; Fukaic, S.; Mitchell, J.H.; Inthapanya, P.; Jothiyangkoon, D. Genotypic performance under intermittent and terminal drought screening in rainfed lowland rice. Field Crops Res. 2014, 156, 281–292. [Google Scholar] [CrossRef] [Scilit]
  45. Oh, S.; Cho, Y. Two-Week mid-season drainage with alternate irrigation enhances yield and water use efficiency in environmentally friendly rice cultivation. Agriculture 2025, 15, 2238. [Google Scholar] [CrossRef] [Scilit]
  46. Sinha, R.; Fritschi, F.B.; Zandalinas, S.I.; Mittler, R. The impact of stress combination on reproductive processes in crops. Plant Sci. 2021, 311, 111007. [Google Scholar] [CrossRef] [Scilit]
  47. Ishimaru, T.; Sasaki, K.; Lumanglas, P.D.; Cabral, C.L.U.; Ye, C.; Yoshimoto, M.; Kumar, A.; Henry, A. Effect of drought stress on flowering characteristics in rice (Oryza sativa L.): A study using genotypes contrasting in drought tolerance and flower opening time. Plant Prod. Sci. 2022, 25, 359–370. [Google Scholar] [CrossRef] [Scilit]
  48. Jarin, A.S.; Islam, M.M.; Rahat, A.; Ahmed, S.; Ghosh, P.; Murata, Y. Drought stress tolerance in rice: Physiological and biochemical insights. Int. J. Plant Biol. 2024, 15, 692–718. [Google Scholar] [CrossRef] [Scilit]
  49. Saeedipour, S.; Moradi, F. Effect of drought at the post-anthesis stage on remobilization of carbon reserves and some physiological changes in the flag leaf of two wheat cultivars differing in drought resistance. J. Agric. Sci. 2011, 3, 81–92. [Google Scholar] [CrossRef] [Scilit]
  50. Liu, Y.; Zhang, P.; Li, M.; Chang, L.; Cheng, H.; Chai, S.; Yang, D. Dynamic responses of accumulation and remobilization of water soluble carbohydrates in wheat stem to drought stress. Plant Physiol. Biochem. 2020, 155, 262–270. [Google Scholar] [CrossRef] [Scilit]
Figure 1. Soil moisture under drought and control conditions, amount of rainfall, relative humidity, temperature, and gravimetric soil moisture (%) in the right y-axis for the 2022 (a) and 2023 (b) evaluation experiments, the grey vertical dotted line indicated the drought start and end period. Leaf rolling scores in 2022 and 2023 of 336 upland rice germplasm with two check varieties; the green circle is the low leaf rolling score, and orange is the high leaf rolling score in both years (c). The circles black is the tested rice genotypes and circle orange were check varieties.
Agronomy 16 02006 g001
Figure 2. Rainfall, relative humidity, maximum temperature (T max), minimum temperature (T min), and gravimetric soil moisture (%) under drought and control conditions at the seedling stage. The gray dot line are the start and end of drought period.
Agronomy 16 02006 g002
Figure 3. Rainfall, relative humidity, maximum temperature (T max), minimum temperature (T min), and gravimetric soil moisture (%) under drought and control conditions at the tillering stage.
Agronomy 16 02006 g003
Figure 4. Rainfall, relative humidity, maximum temperature (T max), minimum temperature (T min), and gravimetric soil moisture (%) under drought and control conditions (a). Visual classification of rice grain development indices based on the percentage of seed filling (b) at the flowering stage.
Agronomy 16 02006 g004
Figure 5. Dendrogram of 25 rice genotypes generated by Ward’s minimum variance method using squared Euclidean distances derived from Z-score-standardized multi-stage drought tolerance and recovery traits which seperated each genotype by the blue line. A cutoff threshold at a Linkage Distance of approximately 70 (represented by the vertical phenon line) defines the four major functional clusters (G1, G2, G3, and G4).
Agronomy 16 02006 g005
Table 1. Leaf rolling scores at 3, 5, 7, and 9 and leaf dead scores at 8, 10, 12, and 14 days after imposed stress (DAIS) of 23 selected upland rice accessions and two check varieties under drought stress conditions at the seedling stage.
VarietiesLeaf Rolling ScoreLeaf Dead Score
3 DAIS5 DAIS7 DAIS9 DAIS8 DAIS10 DAIS12 DAIS14 DAIS
ULR 017 2.3 abc3.54.68.51.3 def4.0 abc7.88.8
ULR 0322.5 ab2.54.37.00.5 ef3.0 b–e6.37.5
ULR 1471.3 de4.55.38.53.5 abc4.9 abc9.09.0
ULR 3462.9 a2.84.38.01.8 c–f2.5 cde6.08.5
ULR 2431.5 cde4.33.75.70.8 ef4.0 a–d7.08.0
ULR 0031.5 cde4.36.89.03.5 abc6.0 ab8.09.0
ULR 0751.0 e4.56.08.53.0 a–d4.0 a–d6.58.0
ULR 0081.0 e3.05.07.00.5 ef3.5 a–e7.07.8
ULR 0141.0 e4.04.07.50.5 ef2.5 cde5.06.0
ULR 0181.0 e2.52.87.50.3 f2.0 cde6.07.3
ULR 0261.0 e5.34.57.52.5 b–e3.3 b–e5.57.0
ULR 0711.3 de6.07.08.54.0 ab5.6 ab7.08.5
ULR 0921.0 e4.04.57.50.0 f0.5 e5.87.5
ULR 1021.8 b–e3.85.08.00.5 ef2.0 cde4.56.5
ULR 1291.5 cde5.35.88.03.5 abc4.3 a–d6.57.5
ULR 1301.0 e5.06.89.04.8 a6.5 a7.88.5
ULR 2541.6 b–e3.04.86.51.0 def1.8 de4.56.8
ULR 2632.0 a–d3.03.56.50.5 ef2.5 cde6.07.0
ULR 2671.0 e4.04.57.51.0 def3.0 b–e6.57.5
ULR 3311.0 e3.55.88.51.3 def4.3 a–d7.08.0
ULR 0861.1 de3.54.58.00.3 f1.5 de6.87.3
ULR 0891.0 e3.56.08.01.5 c–f4.3 a–d5.88.0
ULR 3971.0 e1.03.67.00.8 ef1.8 de6.08.0
IR622661.9 b–e2.54.99.00.5 ef2.0 cde6.09.0
SRN11.5 cde2.84.08.50.5 ef2.0 cde5.57.5
Mean1.423.674.877.831.523.266.387.77
F-test**nsnsns***nsns
CV%49.6356.7350.6521.333.6167.0533.5421.68
ns, *, and ** mean not significant, significant at p < 0.05, and significant at p < 0.01, respectively. The different letters in the column mean significantly different at p < 0.05 based on the LSD method.
Table 2. Tiller number per plant under drought condition before stress imposed, after re-watering at 14, 21, 28, and 35 DAR, and recovery ability (%) among drought evaluated varieties at tillering stage.
VarietiesTiller Number/Plant Before StressTiller Number/Plant After Re-WateringRecovery Ability (%)
14 DAR21 DAR28 DAR35 DAR
ULR 0177.9 gh0.250.500.50 def0.75 ghi9.5
ULR 0329.0 d–g0.000.130.50 def1.00 e–i11.1
ULR 1477.8 gh0.000.000.00 f0.00 i0.0
ULR 3466.8 h0.000.130.63 def0.88 f–i13.0
ULR 2437.0 h0.130.130.38 ef0.50 hi7.1
ULR 00310.3 d0.881.502.00 abc2.00 b–g19.5
ULR 07512.6 b0.501.252.00 abc2.88 bc22.8
ULR 00810.8 cd0.130.501.50 b–e2.75 bcd25.6
ULR 0149.9 def0.751.132.50 abc3.25 b32.9
ULR 0186.9 h0.130.130.50 def0.75 ghi10.9
ULR 02610.4 d0.500.881.25 c–f1.50 d–h14.5
ULR 07110.8 cd0.130.251.25 c–f1.75 c–h16.3
ULR 0929.1 d–g0.000.381.25 c–f2.13 b–f23.3
ULR 10210.0 de0.000.251.63 b–e2.63 bcd26.3
ULR 1299.5 d–g0.130.751.75 bcd2.50 bcd26.3
ULR 1309.4 d–g0.000.501.38 b–e2.13 b–f22.7
ULR 2549.9 def0.000.000.63 def1.75 c–h17.7
ULR 2638.0 gh0.251.251.50 b–e1.50 d–h18.8
ULR 26712.4 bc0.380.631.50 b–e2.00 b–g16.2
ULR 3319.5 d–g0.501.502.13 abc2.38 bcd25.0
ULR 0868.1 fgh0.001.252.25 abc3.00 bc36.9
ULR 0898.3 e–h0.131.251.50 b–e2.25 b–e27.3
ULR 3979.1 d–g0.000.382.13 abc2.88 bc31.5
IR6226612.3 bc0.751.132.63 ab3.13 b25.5
SRN115.5 a0.000.503.13 a4.75 a30.6
Mean9.640.220.651.462.0420.5
F-test**nsns****
CV (%)13.3123.7725.7732.7145.46
ns and ** mean not significant and significant at p < 0.01, respectively. The different letters in the column mean significantly different at p < 0.01 based on the LSD method.
Table 3. Panicle number per plant under drought and control conditions and reduction percentage of various rice accessions under flowering drought condition.
VarietiesPanicle Number/PlantReduction (%)
ControlDrought
ULR 0176.88 d–i3.75 i45.49
ULR 0325.63 hi4.63 e–i17.76
ULR 1476.50 e–i4.25 f–i34.62
ULR 3466.25 f–i4.13 ghi33.92
ULR 2435.50 i4.25 f–i22.73
ULR 0037.63 c–g5.00 d–i34.47
ULR 0759.50 ab6.88 bc27.58
ULR 0088.50 a–d6.00 cde29.41
ULR 0149.00 abc6.50 bcd27.78
ULR 0186.63 e–i5.13 d–i22.62
ULR 0266.88 d–i4.75 e–i30.96
ULR 0719.13 abc6.38 bcd30.12
ULR 0927.38 c–h5.13 d–i30.49
ULR 1028.00 b–f5.00 d–i37.50
ULR 1298.13 b–e5.63 c–g30.75
ULR 1307.50 c–g5.63 c–g24.93
ULR 2548.88 abc5.75 c–f35.25
ULR 2635.88 ghi4.50 e–i23.47
ULR 2679.13 abc4.75 e–i47.97
ULR 3317.75 b–f4.00 hi48.39
ULR 0866.88 d–i3.88 i43.60
ULR 0896.75 d–i4.00 hi40.74
ULR 3976.88 d–i5.50 c–h20.06
IR6226610.25 a8.50 a17.07
SRN110.13 a7.63 ab24.68
Mean 7.665.2631.29
F-test ****
CV (%) 16.9320.52
** is significant at p < 0.01. The different letters in the column mean significantly different at p < 0.01 based on the LSD method.
Table 4. Grain yield potential under control condition and grain-filling dynamics of rice accessions under flowering drought stress conditions, filled grain, and unfilled grain percentage.
Acc. No.Yield/Plant (g)
Control
Yield/Plant (g)
Drought
Grain Yield Reduction (%)Fill Seed (%)Filled Grain (%)Unfilled Grain (%)
1007550
ULR 01711.1 cde6.0 qrs45.9511.315.8819.0036.2063.80
ULR 0329.9 e6.8 opq31.3124.6413.7411.8550.2449.76
ULR 14711.3 b–e7.6 m–p32.7410.426.187.7224.3275.68
ULR 34611.9 b–e8.7 j–m26.8926.3318.4818.7363.5436.46
ULR 24311.3 b–e9.0 i–l20.350.403.977.9412.3087.70
ULR 0039.9 e5.5 st44.4424.5211.119.2044.8355.17
ULR 07513.1 a–d11.6 e11.4512.2815.7927.4955.5644.44
ULR 00812.4 a–e10.1 ghi18.5514.0631.2531.2576.5623.44
ULR 01413.0 a–d11.4 efg12.3148.9217.2712.9579.1420.86
ULR 01812.2 b–e10.7 fgh12.3030.9911.979.1552.1147.89
ULR 02615.3 a14.8 a3.2722.8611.1920.2454.2945.95
ULR 07113.3 a–d11.5 ef13.5310.5321.6426.3258.4841.52
ULR 09211.8 b–e8.9 i–m24.5824.107.237.2338.5561.45
ULR 10211.7 b–e7.8 l–o33.337.344.5211.0222.8877.12
ULR 12914.2 ab13.0 cd8.4515.4812.1316.7444.3555.65
ULR 13014.3 ab14.3 ab0.0015.384.404.4024.1875.82
ULR 25412.6 a–e9.6 h–k23.8142.2817.078.9468.2931.71
ULR 26314.0 abc13.9 abc0.7114.8613.536.5234.9064.86
ULR 2679.7 e4.1 u57.738.2619.017.0234.3065.70
ULR 33110.5 de5.0 t52.3816.0422.6413.2151.8948.11
ULR 08611.1 cde6.3 pqr43.247.8719.6925.5953.1546.85
ULR 08910.5 de5.7 rs45.715.2212.1725.2242.6157.39
ULR 39710.5 de7.7 l–p26.6726.0113.9021.5261.4338.57
IR6226613.8 abc14.7 a−6.5242.2215.5613.3371.1128.89
SRN114.0 abc13.6 bcd2.8614.857.436.9329.2170.79
Mean 12.19.5321.4619.0913.5114.7847.3852.62
F-test **
CV (%) 15.2219.87
* is significant at p < 0.05. The different letters in the column mean significantly different at p < 0.05 based on the LSD method.
Table 5. Phenotypic profiles of seedling stage as leaf rolling and dead scores, tillering stage as tillering recovery ability percentage, and reproductive stage as yield per plant, yield reduction, 100 percentage filled seed, and filled grain percentage of 25 genotypes.
GVarietiesSeedling Stage Leaf Rolling and Dead ScoreTillering Ability (%)Yield (g/Plant) ControlYield Reduction (%)Filled Seed 100 (%)Filled Grain (%)
LR3LR5LR7LR9LD8LD10LD12LD14
1ULR 0172.33.54.68.51.34.07.88.89.511.145.911.336.2
1ULR 1471.34.55.38.53.54.99.09.00.011.332.710.424.3
1ULR 2431.54.33.75.70.84.07.08.07.111.320.40.412.3
Mean G11.74.14.57.61.84.37.98.65.611.233.07.424.3
2ULR 0031.54.36.89.03.56.08.09.019.59.944.424.544.8
2ULR 1301.05.06.89.04.86.57.88.522.714.30.015.424.2
2ULR 0751.04.56.08.53.04.06.58.022.813.111.512.355.6
2ULR 0261.05.34.57.52.53.35.57.014.515.33.322.954.3
2ULR 0711.36.07.08.54.05.67.08.516.313.313.510.558.5
2ULR 1291.55.35.88.03.54.36.57.526.314.28.515.544.4
Mean G21.25.06.18.43.54.96.98.120.313.413.316.846.9
3ULR 0921.04.04.57.50.00.55.87.523.311.824.624.138.6
3ULR 1021.83.85.08.00.52.04.56.526.311.733.37.322.9
3ULR 2632.03.03.56.50.52.56.07.018.814.00.714.934.9
3ULR 2671.04.04.57.51.03.06.57.516.29.757.78.334.3
3SRN11.52.84.08.50.52.05.57.530.614.02.914.929.2
3ULR 0081.03.05.07.00.53.57.07.825.612.418.514.176.6
3ULR 0181.02.52.87.50.32.06.07.310.912.212.331.052.1
3ULR 3311.03.55.88.51.34.37.08.025.010.552.416.051.9
3ULR 0861.13.54.58.00.31.56.87.336.911.143.27.953.2
3ULR 0891.03.56.08.01.54.35.88.027.310.545.75.242.6
3ULR 3971.01.03.67.00.81.86.08.031.510.526.726.061.4
Mean G31.23.14.57.60.62.56.17.524.711.728.915.445.2
4ULR 0322.52.54.37.00.53.06.37.511.19.931.324.650.2
4ULR 3462.92.84.38.01.82.56.08.513.011.926.926.363.5
4ULR 0141.04.04.07.50.52.55.06.032.913.012.348.979.1
4ULR 2541.63.04.86.51.01.84.56.817.712.623.842.368.3
4IR622661.92.54.99.00.52.06.09.025.513.8−6.542.271.1
Mean G42.03.04.47.60.92.45.67.620.012.317.636.966.5
Green shades indicate low scores/values, while red shades denote high values (desirable for leaf rolling/drying), and dark green shades indicate high values (desirable for tillering, yield, and grain filling).
Disclaimer/Publisher’s Note: The statements, opinions and data contained in all publications are solely those of the individual author(s) and contributor(s) and not of MDPI and/or the editor(s). MDPI and/or the editor(s) disclaim responsibility for any injury to people or property resulting from any ideas, methods, instructions or products referred to in the content.