Article

Experimental Insights on Carbon Sequestration and Yield Improvement in Oat Fields with 30% Organic Nitrogen Substitution in the Tibetan Plateau


Qinghai–Tibet Plateau Germplasm Resources Research and Utilization Laboratory, College of Animal Science and Veterinary Medicine, Qinghai University, Xining 810016, China
*
Author to whom correspondence should be addressed.
Agronomy 2026, 16(2), 184; https://doi.org/10.3390/agronomy16020184
Submission received: 15 December 2025 / Revised: 3 January 2026 / Accepted: 7 January 2026 / Published: 12 January 2026
(This article belongs to the Special Issue Soil Health and Properties in a Changing Environment—2nd Edition)

Abstract

To evaluate the optimal substitution ratio of organic fertilizer for chemical nitrogen fertilizer and its underlying mechanisms, a pot experiment was conducted in the rhizosphere soil of oat (Avena sativa) on the Qinghai–Tibet Plateau. Five treatments were established: CK (control), T1 (chemical fertilizer alone), T2 (100% organic fertilizer substitution for chemical nitrogen fertilizer), T3 (30% organic fertilizer substitution for chemical nitrogen fertilizer), and T4 (60% organic fertilizer substitution for chemical nitrogen fertilizer). We analyzed soil carbon fractions, microbial community structure, carbon-cycling enzyme activities, and yield responses and applied partial least squares–structural equation modeling (PLS-SEM) to identify key regulatory pathways. The results showed that 30% organic substitution (T3) was associated with optimized soil carbon pools, improved microbial community composition, and enhanced carbon-cycling enzyme activities, while reducing the abundance of potentially harmful fungi. Structural equation modeling indicated that β-glucosidase activity and the relative abundance of Proteobacteria were the primary drivers of yield, together explaining 76% of its variation. The ecosystem multifunctionality index (EMF) was significantly and positively correlated with yield. In summary, under the conditions of this experiment, 30% organic fertilizer substitution achieved a favorable balance between soil ecological functions and crop yield, providing a valuable reference for sustainable nutrient management in oat production in high-altitude cold regions.

1. Introduction

Soil fertility and carbon cycle stability are central to agricultural sustainability, not only being closely linked to crop productivity and contributing to global climate regulation [1]. Modern agriculture depends on intensive inputs of chemical nitrogen fertilizers to secure short-term yield gains. However, prolonged overuse can disrupt the soil carbon–nitrogen balance, deplete organic carbon pools, destabilize microbial communities, and elevate greenhouse gas emissions, thereby challenging the long-term sustainability of agricultural ecosystems [2,3,4]. Therefore, pursuing green fertilization strategies that integrate high yield with environmental sustainability has become a pivotal pathway toward advancing sustainable agricultural development [5].
Among various alternative measures, the substitution of chemical fertilizers with organic fertilizers has attracted considerable attention as a novel fertilization strategy, owing to its significant advantages in improving soil quality and enhancing carbon sequestration capacity [6,7]. Previous studies have demonstrated that organic fertilizers not only provide additional carbon inputs through their inherent organic carbon content [8], but also increase key soil carbon fractions, including soil organic carbon (SOC), dissolved organic carbon (DOC), particulate organic carbon (POC), microbial biomass carbon (MBC) and readily oxidizable organic carbon (ROC). Long-term field experiments have demonstrated that substituting 50% of chemical fertilizer with organic fertilizer increased SOC and DOC contents by 19.2% and 26.8%, respectively, compared with sole chemical fertilizer application, and this effect showed a linear enhancement with the extension of substitution years [9]. Moreover, the diverse carbon and nitrogen substrates supplied by organic fertilizers can stimulate functional microorganisms. For example, organic substitution has been reported to increase the relative abundance of Actinobacteria and Ascomycota by 22–37%, thereby enhancing the activities of carbon-cycle-related enzymes such as invertase and β-glucosidase, which accelerate organic carbon transformation and nutrient release, ultimately strengthening soil carbon sequestration capacity [10,11].
However, current research still has several limitations. First, most studies have been conducted in plain farmlands (e.g., wheat fields in the North American Great Plains and rice paddies in Southeast Asia), with limited attention to special ecological regions such as high-altitude plateaus ecosystems [12,13]. Second, many studies focus on single indicators and lack an integrated analysis of the complete chain linking “soil physicochemical properties → microbial communities → carbon-related enzyme activities → crop yield/carbon cycling functions” [14]. Third, the optimal substitution ratio remains unclear, as reports from plain regions have yielded contrasting results, with either 100% or 50% substitution considered effective [15]. Recent studies highlight this inconsistency. A 2024 sorghum experiment showed 50% substitution achieved the highest yield, while a 2025 spring wheat study under limited irrigation reported divergent effects of different substitution levels on soil carbon and yield. These findings indicate that the optimal ratio varies with crop type and region, emphasizing the need to test refined gradients in plateau systems [16,17,18].
The Qinghai–Tibet Plateau, a unique alpine ecological region, is characterized by soils rich in organic matter but with low nutrient availability and unstable carbon pools. Oat (Avena sativa), the dominant crop in this area, occupies about 40% of dryland farmland. Its growth is highly dependent on soil carbon and nitrogen supply and is sensitive to fertilization practices, making it an appropriate model crop for studying nutrient cycling in plateau soil–crop systems [19]. Based on this, the present study conducted a controlled pot experiment to evaluate the effects of different organic fertilizer substitution ratios (0–100%, under equal nitrogen input) on rhizosphere carbon fractions, microbial community composition, and carbon-related enzyme activities in oat. The aim was to clarify the mechanism of “organic fertilizer input → microbial optimization → enhanced enzyme activity → improved carbon cycling → synergistic promotion of yield and carbon sequestration,” thereby addressing the knowledge gap and providing a theoretical basis for establishing a green fertilization system that achieves both high yield and carbon sequestration in the Qinghai–Tibet Plateau.

2. Materials and Methods

2.1. Experimental Site

The field experiment was carried out in Shangxin Zhuang Town, Huangzhong District (101°59′ E, 36°42′ N), a typical oat cultivation area located on the northeastern Qinghai–Tibet Plateau. The site is situated on a gently sloping plain at an altitude of 2630 m, characterized by a cold and humid plateau climate without a distinct frost-free season. The mean annual temperature is 4.6 °C, and the annual precipitation, including both rainfall and snowfall, ranges between 500 and 650 mm. Before the trial, the soil contained 1.53 g/kg total nitrogen, 26.01 g/kg organic matter, pH 8.32, 0.79 g/kg total phosphorus, and 25.09 g/kg total potassium. The available nutrient levels were 88.32 mg/kg of alkali-hydrolyzable nitrogen, 18.75 mg/kg of available phosphorus, and 128 mg/kg of available potassium. Based on the WRB classification, the soil type is Calcic Kastanozem, which represents medium fertility under cold-arid plateau conditions.

2.2. Experimental Design

The pot experiment was carried out from May to October 2024 under controlled outdoor conditions. The tested crop was the oat Avena sativa L., cv. ‘Qingyan No. 3’, a locally adapted variety developed by the Academy of Animal Science and Veterinary Medicine, Qinghai University. Five fertilization treatments were designed: (i) unfertilized control (CK); (ii) conventional nitrogen application (T1, conventional N application consultation in the study by Guoling Liang et al. [20]); (iii) complete substitution of chemical nitrogen with organic fertilizer (T2); (iv) 30% substitution (T3); and (v) 60% substitution (T4). Each treatment was replicated six times (Table 1).
To ensure equal total nitrogen input (iso-nitrogen substitution) across treatments, the substitution ratios (30% and 60%) were defined as the proportion of mineral nitrogen replaced by organic nitrogen relative to the total nitrogen input. The P2O5 and K2O contributions from organic fertilizer were calculated for each treatment. Using T2 (100% substitution) as the reference (P2O5: 0.5249 g; K2O: 0.5298 g), the remaining treatments were balanced with single superphosphate (P2O5 ≥ 16%) and potassium sulfate (K2O ≥ 52%). CK received no fertilizer. The fertilizers applied included urea (46% N) and a commercial organic fertilizer (N ≥ 4.22%, P2O5 ≥ 2.14%, K2O ≥ 2.16%).
Topsoil (0–20 cm) was collected from the experimental field, air-dried, and sieved (2 mm). Fertilizers were thoroughly mixed with soil at the designed ratios before being transferred into pots (surface area: 0.15 m2, Figure 1). Each pot was planted with 20 oat seedlings and embedded in the field soil, leaving a 10 cm rim aboveground to facilitate greenhouse gas monitoring. Soil moisture was maintained at field capacity (approximately 25% volumetric water content) using the gravimetric method, calibrated daily by TDR sensors. Water was replenished every 2–3 days depending on evapotranspiration, and adjustments were applied uniformly across treatments to avoid bias.

2.3. Sample Collection and Measurement Methods

2.3.1. Sample Collection

At the oat maturity stage, plants were carefully uprooted, and rhizosphere soil (within approximately 2 mm of the root surface) was collected using the shaking-root method. The soil was then sieved through sterile meshes and divided into three subsamples: (i) 2 g of fresh soil, immediately frozen in liquid nitrogen and stored at −80 °C for DNA extraction; (ii) 100 g of soil, air-dried and passed through a 0.15 mm sieve for physicochemical and enzyme activity analyses; and (iii) 5 g of fresh soil, stored at 4 °C and analyzed for enzyme activities within 48 h. All sampling tools were sterilized with 75% ethanol to minimize cross-contamination.
Yield was measured at harvest. Panicles from each pot were oven-dried, threshed, and the grain yield recorded. Ten plants per pot were randomly selected to determine the number of spikelets per plant and grains per spike. In addition, 1000 fully developed grains were weighed in triplicate to calculate the thousand-grain weight (TGW). All yield-related parameters were expressed as the mean of six replicates.

2.3.2. Measurement Methods of Indicator

Soil carbon fractions included soil organic carbon (SOC), dissolved organic carbon (DOC), readily oxidizable carbon (ROC), and microbial biomass carbon (MBC). SOC was determined using the potassium dichromate oxidation with the external heating method [21]. DOC was extracted with water and quantified using a TOC analyzer [22]. ROC was measured by potassium permanganate oxidation. MBC was determined using the chloroform fumigation–extraction method [23].
Soil nutrient indicators were determined using standard methods. Soil pH was measured with a glass electrode method. Total nitrogen (TN) was determined by the Kjeldahl digestion method [24]. Total phosphorus (TP) and total potassium (TK) were analyzed using alkali fusion–molybdenum antimony colorimetry and flame photometry, respectively. Alkali-hydrolyzable nitrogen (AN) was measured by the alkali-hydrolysis diffusion method [25,26]. Available phosphorus (AP) was determined by sodium bicarbonate extraction followed by molybdenum antimony colorimetry. Available potassium (AK) was measured using ammonium acetate extraction and flame photometry. In addition, ammonium nitrogen (NH4+-N) and nitrate nitrogen (NO3-N) were extracted with potassium chloride and quantified using a continuous flow analyzer [27,28].
Soil enzyme activities were determined using standard methods. Invertase, cellulase, and amylase activities were measured by the 3,5-dinitrosalicylic acid (DNS) method. β-glucosidase activity was assayed using p-nitrophenyl-β-D-glucopyranoside (PNPG) as substrate. Polyphenol oxidase and peroxidase activities were determined using pyrogallol as a substrate [29,30]. All enzyme activity values were expressed on a dry soil weight basis and corrected for soil moisture content.

2.4. Statistical Analysis

All data were tested for normality and homogeneity of variance using the Shapiro–Wilk test and Levene’s test, respectively. Differences in soil physicochemical properties, carbon fractions, enzyme activities, microbial community composition, and yield components among treatments were analyzed by one-way analysis of variance (ANOVA), and significance was assessed using Tukey’s HSD multiple comparison test (p < 0.05). Pearson correlation analysis was performed to explore linear relationships among soil carbon fractions, microbial communities, enzyme activities, and yield traits. Canonical correspondence analysis (CCA) was conducted with the vegan package in R to reveal associations between dominant microbial taxa and environmental factors.
Partial least squares–structural equation modeling (PLS-SEM) was constructed using the plspm package in R. Indicators were selected based on the results of CCA and correlation analyses, and the final model quantified the direct and indirect effects of soil properties (SOC, DOC, ROC, MBC, AP, AK, NO3-N), microbial communities (dominant phyla), and enzyme activities (invertase, β-glucosidase) on oat yield. Model fit was evaluated using the goodness-of-fit (GOF) index, with GOF > 0.6 indicating satisfactory model performance. Standardized path coefficients (β) were used to assess the strength and direction of relationships among variables.

2.4.1. Microbial Community Analysis

Genomic DNA was extracted from 0.5 g of frozen rhizosphere soil using the Soil DNA Kit (Gidio Biotechnology, Guangzhou, China). DNA integrity was verified by 1% agarose gel electrophoresis and quantified with a NanoDrop 2000 spectrophotometer (Thermo Scientific, Waltham, MA, USA). The bacterial 16S rRNA V3–V4 region was amplified using primers 341F/806R, and the fungal ITS2 region with ITS3_KYO2/ITS4. PCR products were purified with AMPure XP beads and quantified using Qubit 3.0. Sequencing libraries were prepared with the Illumina DNA Prep Kit, validated on an ABI StepOnePlus™ Real-Time PCR System, and sequenced on the Illumina NovaSeq 6000 platform (PE250 mode) by Guangzhou Gidio Biotechnology Co., Ltd.

2.4.2. Ecosystem Multifunctionality (EMF) Analysis

Ecosystem multifunctionality (EMF) was calculated using the averaging approach [31,32]. A total of 38 ecosystem functions were selected, including crop yield (grain yield, spikelet number per plant, grain number per spike, thousand-grain weight), soil organic carbon fractions (SOC, DOC, ROC, MBC), soil nutrient availability (alkali-hydrolyzable nitrogen, AN; available phosphorus, AP; available potassium, AK; ammonium nitrogen, NH4+-N; nitrate nitrogen, NO3-N), and microbial activity (relative abundances of dominant bacterial and fungal phyla, as well as six carbon-cycle-related enzyme activities).
All functions were standardized using Z-score transformation to eliminate differences in measurement units and unify directionality, with higher values representing better functional performance. The EMF value for each treatment was obtained by averaging the standardized scores across all functions, as expressed by the following equation:
Z ij = X ij   X - j SD j
where Z ij   is the standardized value, X ij is the raw value, X - j is the mean of indicator j, and SD j is the standard deviation.
EMF i = 1 38 j = 1 38 Z i j
EMFi represents the ecosystem multifunctionality score of treatment i, and Zij is the Z-score of function j under treatment i.

3. Results and Analysis

3.1. Changes in Soil Physicochemical Properties and Carbon Fractions

Organic fertilizer substitution for chemical nitrogen fertilizer significantly improved the nutrient status and carbon fractions of oat rhizosphere soil, with distinct effects observed under different substitution ratios (Table S1). In the T3 treatment (30% substitution), the highest available phosphorus content was recorded (19.21 mg/kg), whereas T4 (60% substitution) yielded the highest available potassium content (294 mg/kg), clearly reflecting the specific regulatory effects of varying substitution levels on soil phosphorus and potassium supply.
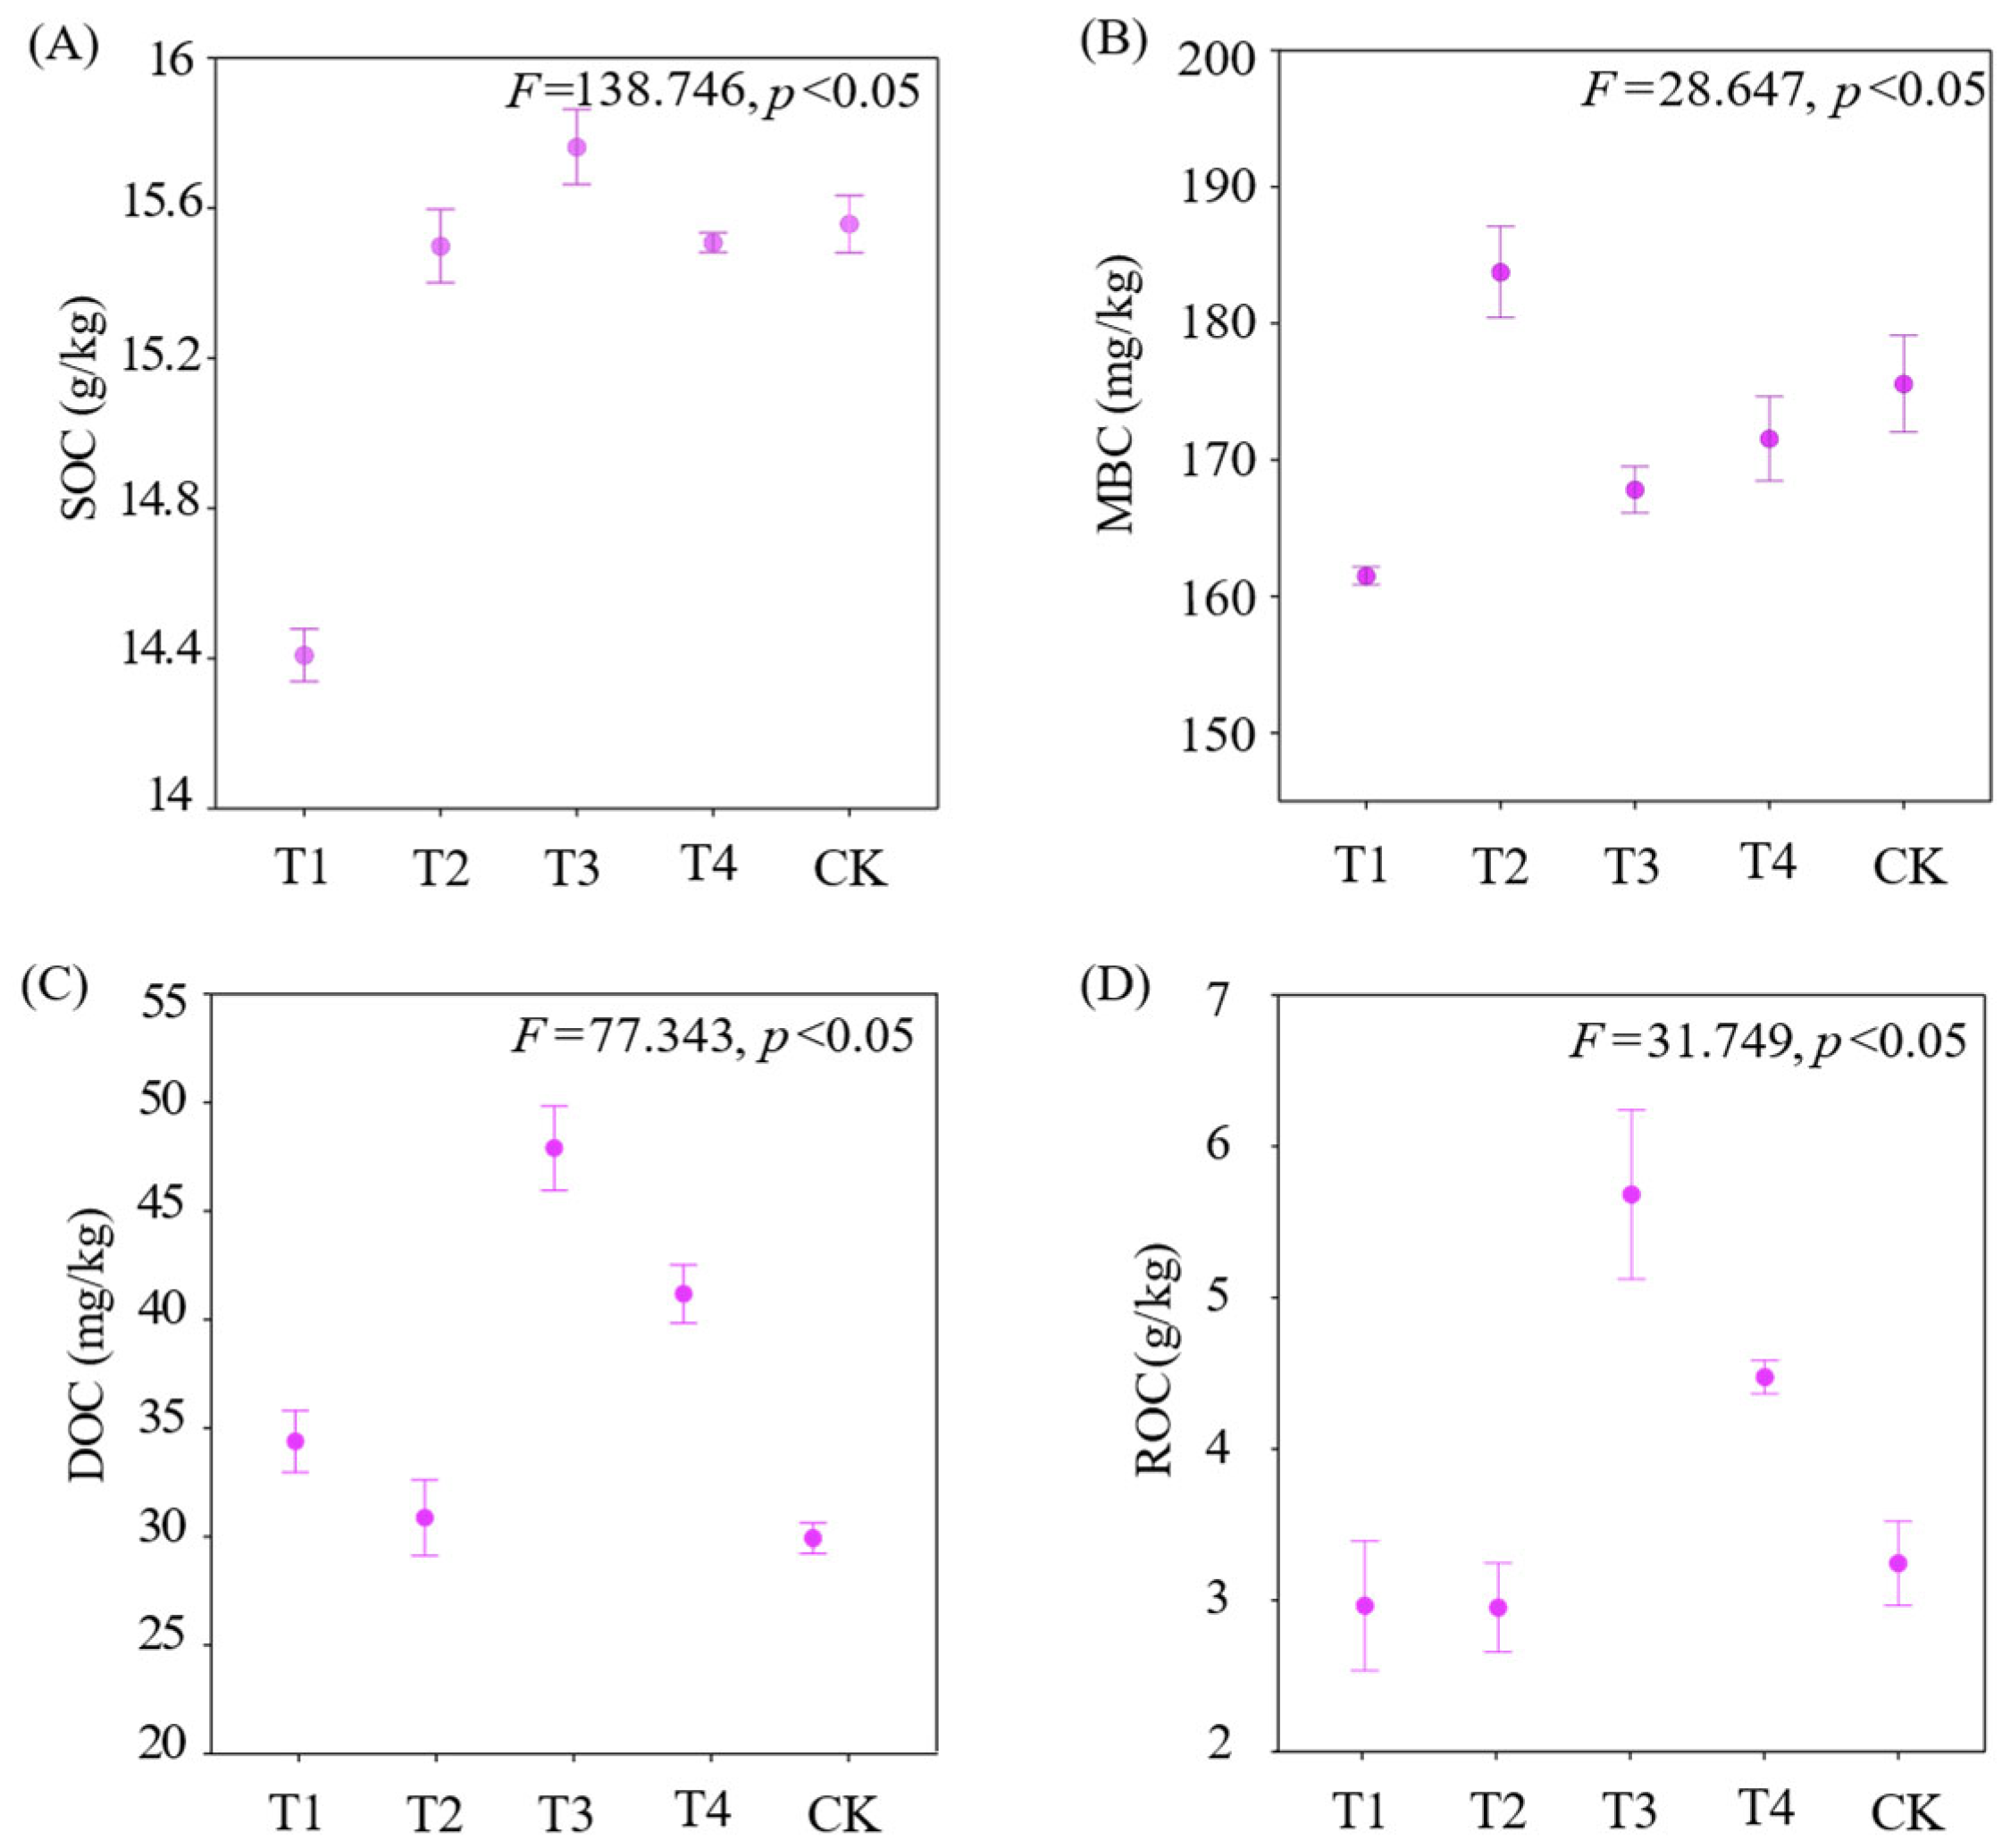
For carbon fractions (Figure 2), the sole chemical fertilizer treatment (T1) showed the lowest soil organic carbon (SOC) content, whereas all organic nitrogen substitution treatments (T2, T3, T4) significantly increased SOC, with T3 being 1.35 g/kg higher than T1. Dissolved organic carbon (DOC) and readily oxidizable carbon (ROC) exhibited similar trends, with significant increases under T3 and T4 and peak values in T3.
Microbial biomass carbon (MBC) was lowest under T1 and increased under substitution treatments, with T2 showing the largest increase.
The ROC/SOC ratio differed significantly among treatments (Table S2), with T3 recording the highest value (36.05%) and T2 the lowest (19.05%). Compared with CK, SOC oxidation rate increased under combined applications, with T3 and T4 raising it by 15.19% and 8.00%, respectively. SOC dissolution rate was slightly higher under T1 and T2 (0.05% and 0.01% above CK). The proportion of MBC to SOC decreased under T1, and although absolute MBC increased under substitution treatments, the relative proportion remained lower than CK.
With respect to soil carbon pool management (Table 2), T3 treatment exhibited the highest CPMI, reaching 142.3, which was 42.3% higher than CK, indicating that 30% organic fertilizer substitution was most effective in enhancing soil carbon pool functionality. T4 ranked second, with a CPMI of 122.3 (22.3% higher than CK), followed by T2 (118.9, 18.9% higher than CK). In contrast, T1 treatment showed only a limited improvement, with a CPMI of 114.7 (14.7% higher than CK).

3.2. Rhizosphere Soil Microbial Community Structure of Oat

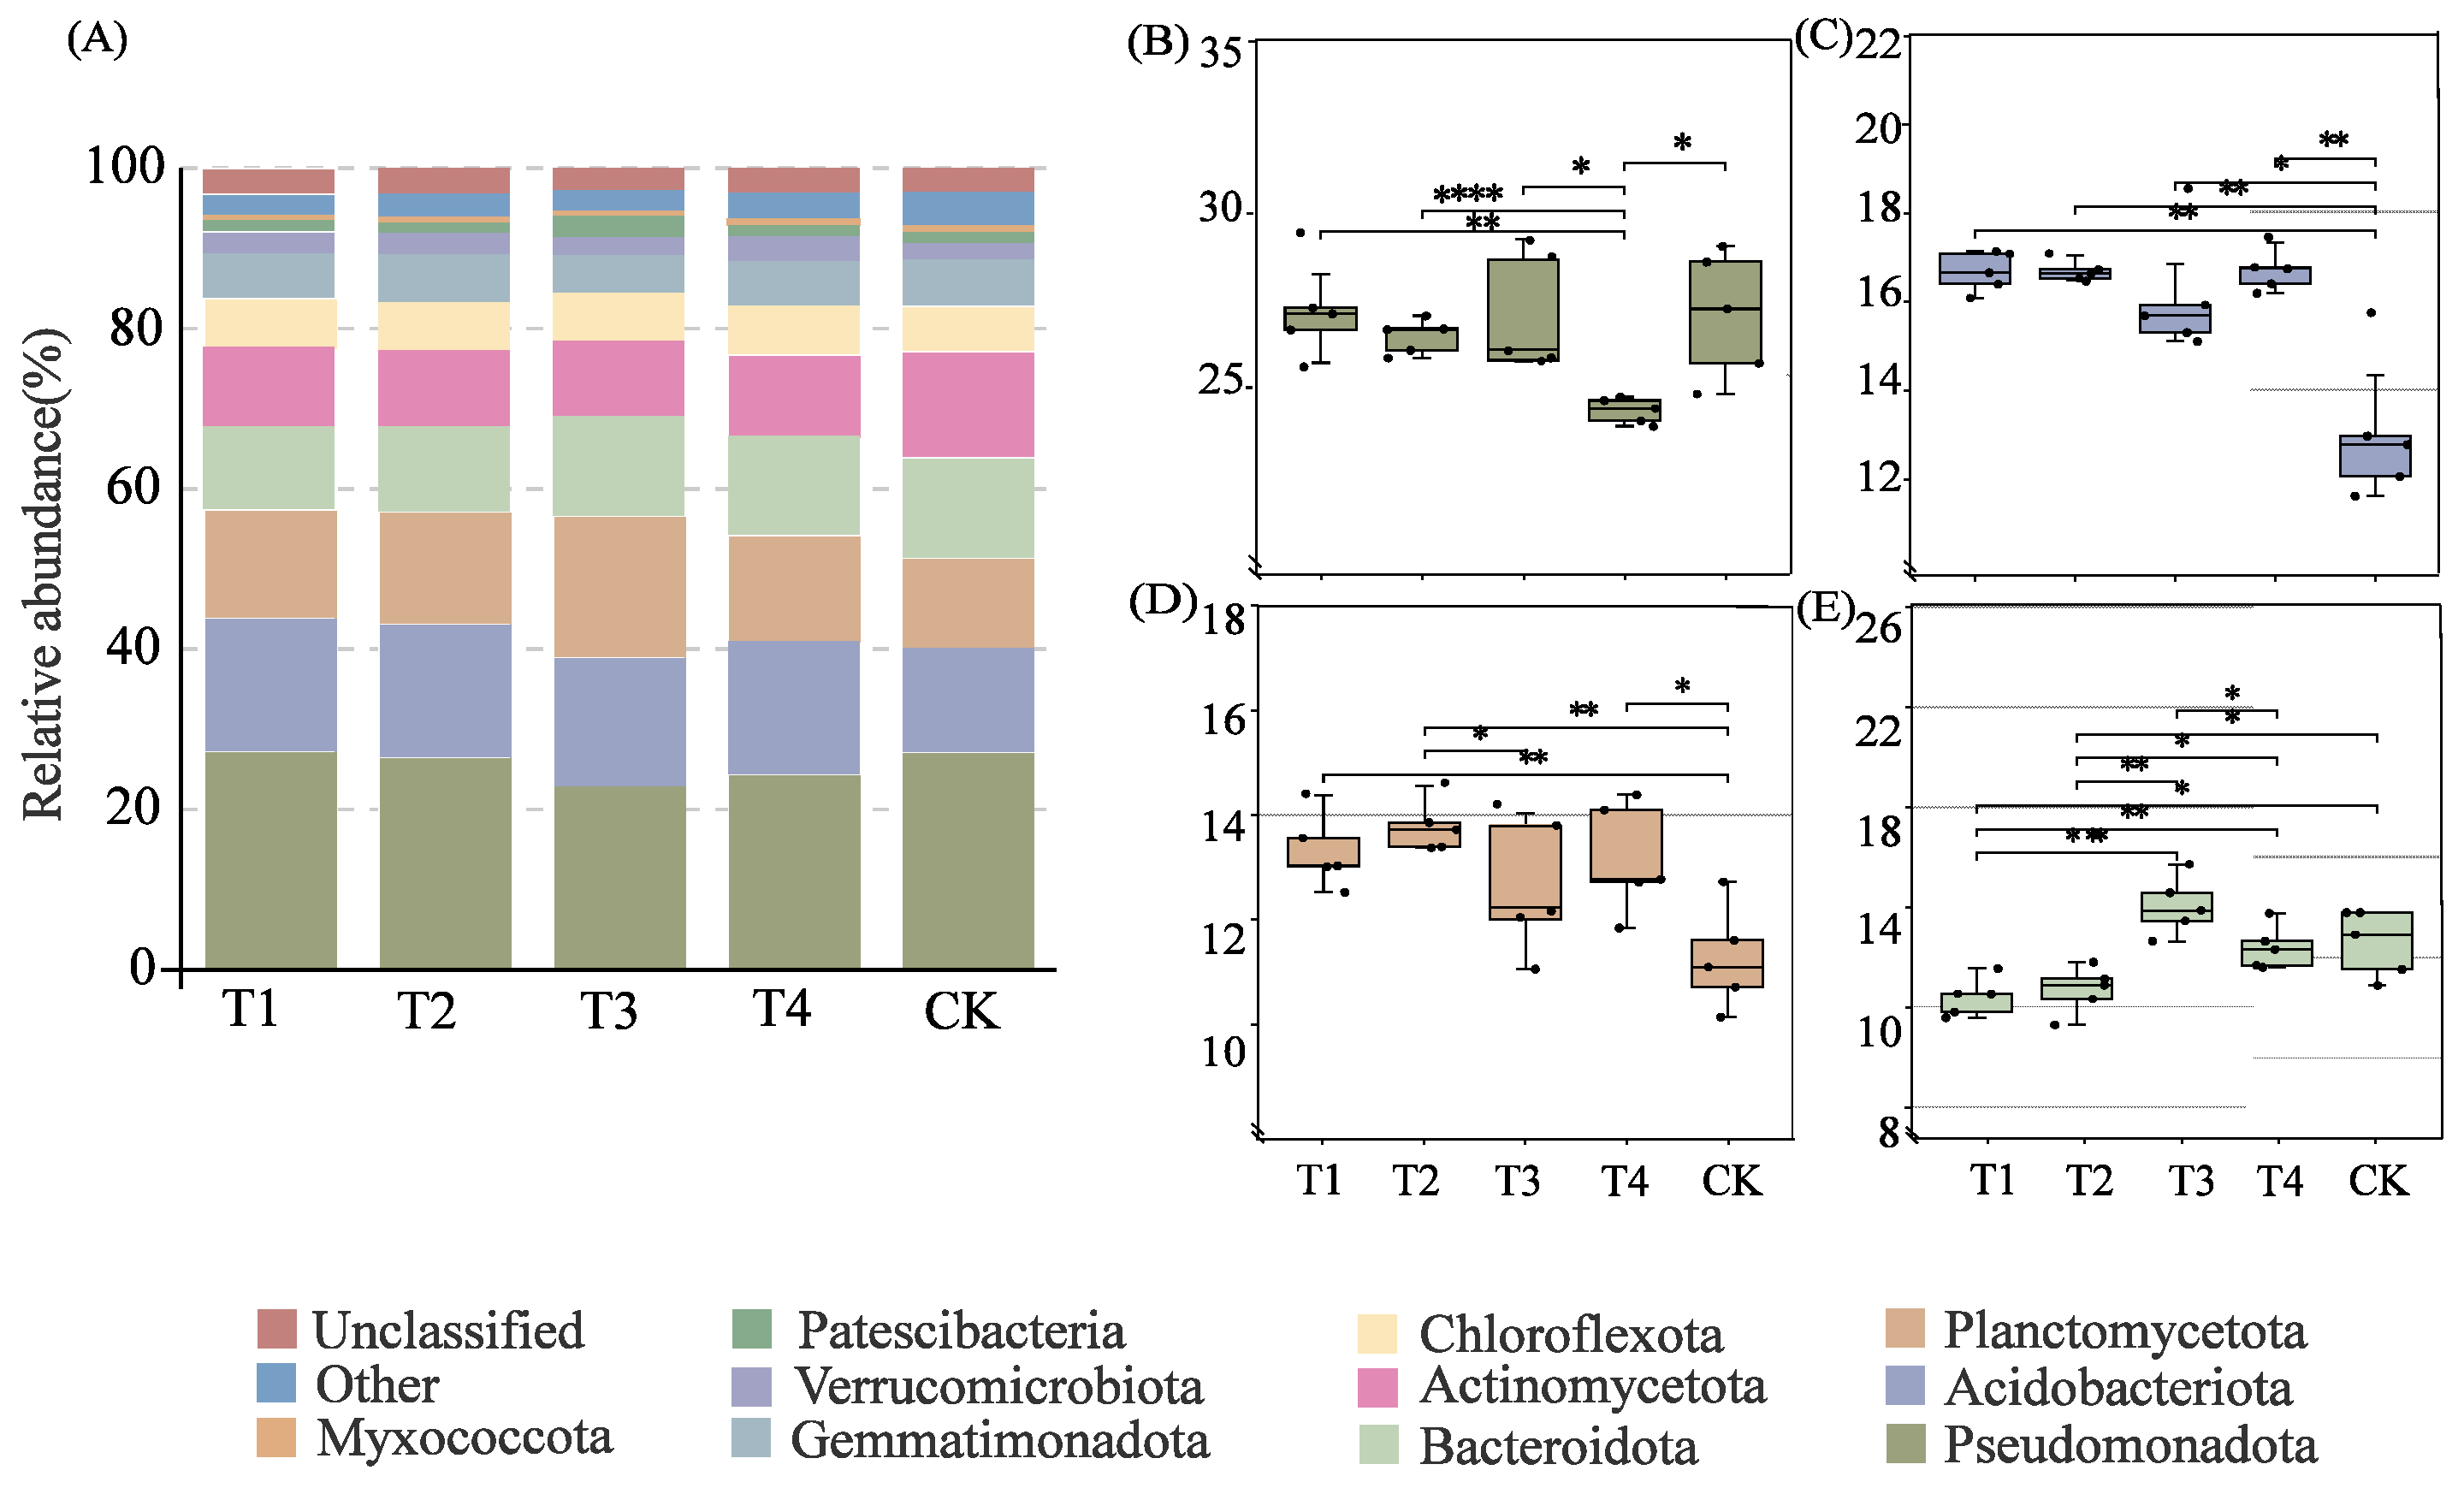
The composition of dominant bacterial phyla was highly consistent across treatments (Figure 3A). The top 10 phyla included Pseudomonadota (22.89–27.23%), Acidobacteriota (13.01–16.70%), Planctomycetota (11.25–17.61%), Bacteroidota (10.40–12.57%), Actinobacteriota (9.37–13.19%), Chloroflexota (5.71–6.17%), Gemmatimonadota (4.67–5.98%), Verrucomicrobiota (2.01–3.02%), Patescibacteria (1.33–2.60%), and Myxococcota (0.64–0.93%). Treatment T4 significantly reduced the relative abundance of Pseudomonadota (Figure 3B), while CK markedly suppressed Acidobacteriota and Planctomycota (Figure 3C,D). In contrast, T3 significantly promoted the enrichment of Bacteroidota (Figure 3E).
At the genus level, the top 10 dominant genera were Sphingomonas (5.92–7.80%), Flavisolibacter (1.23–1.54%), Gemmatimonas (0.84–1.12%), Pseudomonas (0.25–1.33%), Lysobacter (0.96–1.72%), UTBCD1 (0.72–0.96%), Nocardioides (0.62–0.95%), Blastococcus (0.55–1.41%), Chthoniobacter (0.54–0.92%), and Ferruginibacter (0.63–0.79%). The relative abundances of Sphingomonas, Gemmatimonas, and Pseudomonas under T3 and T4 were lower than those under CK (Figure S1B,D,E). No significant differences were observed in Flavisolibacter abundance among treatments (Figure S1C).
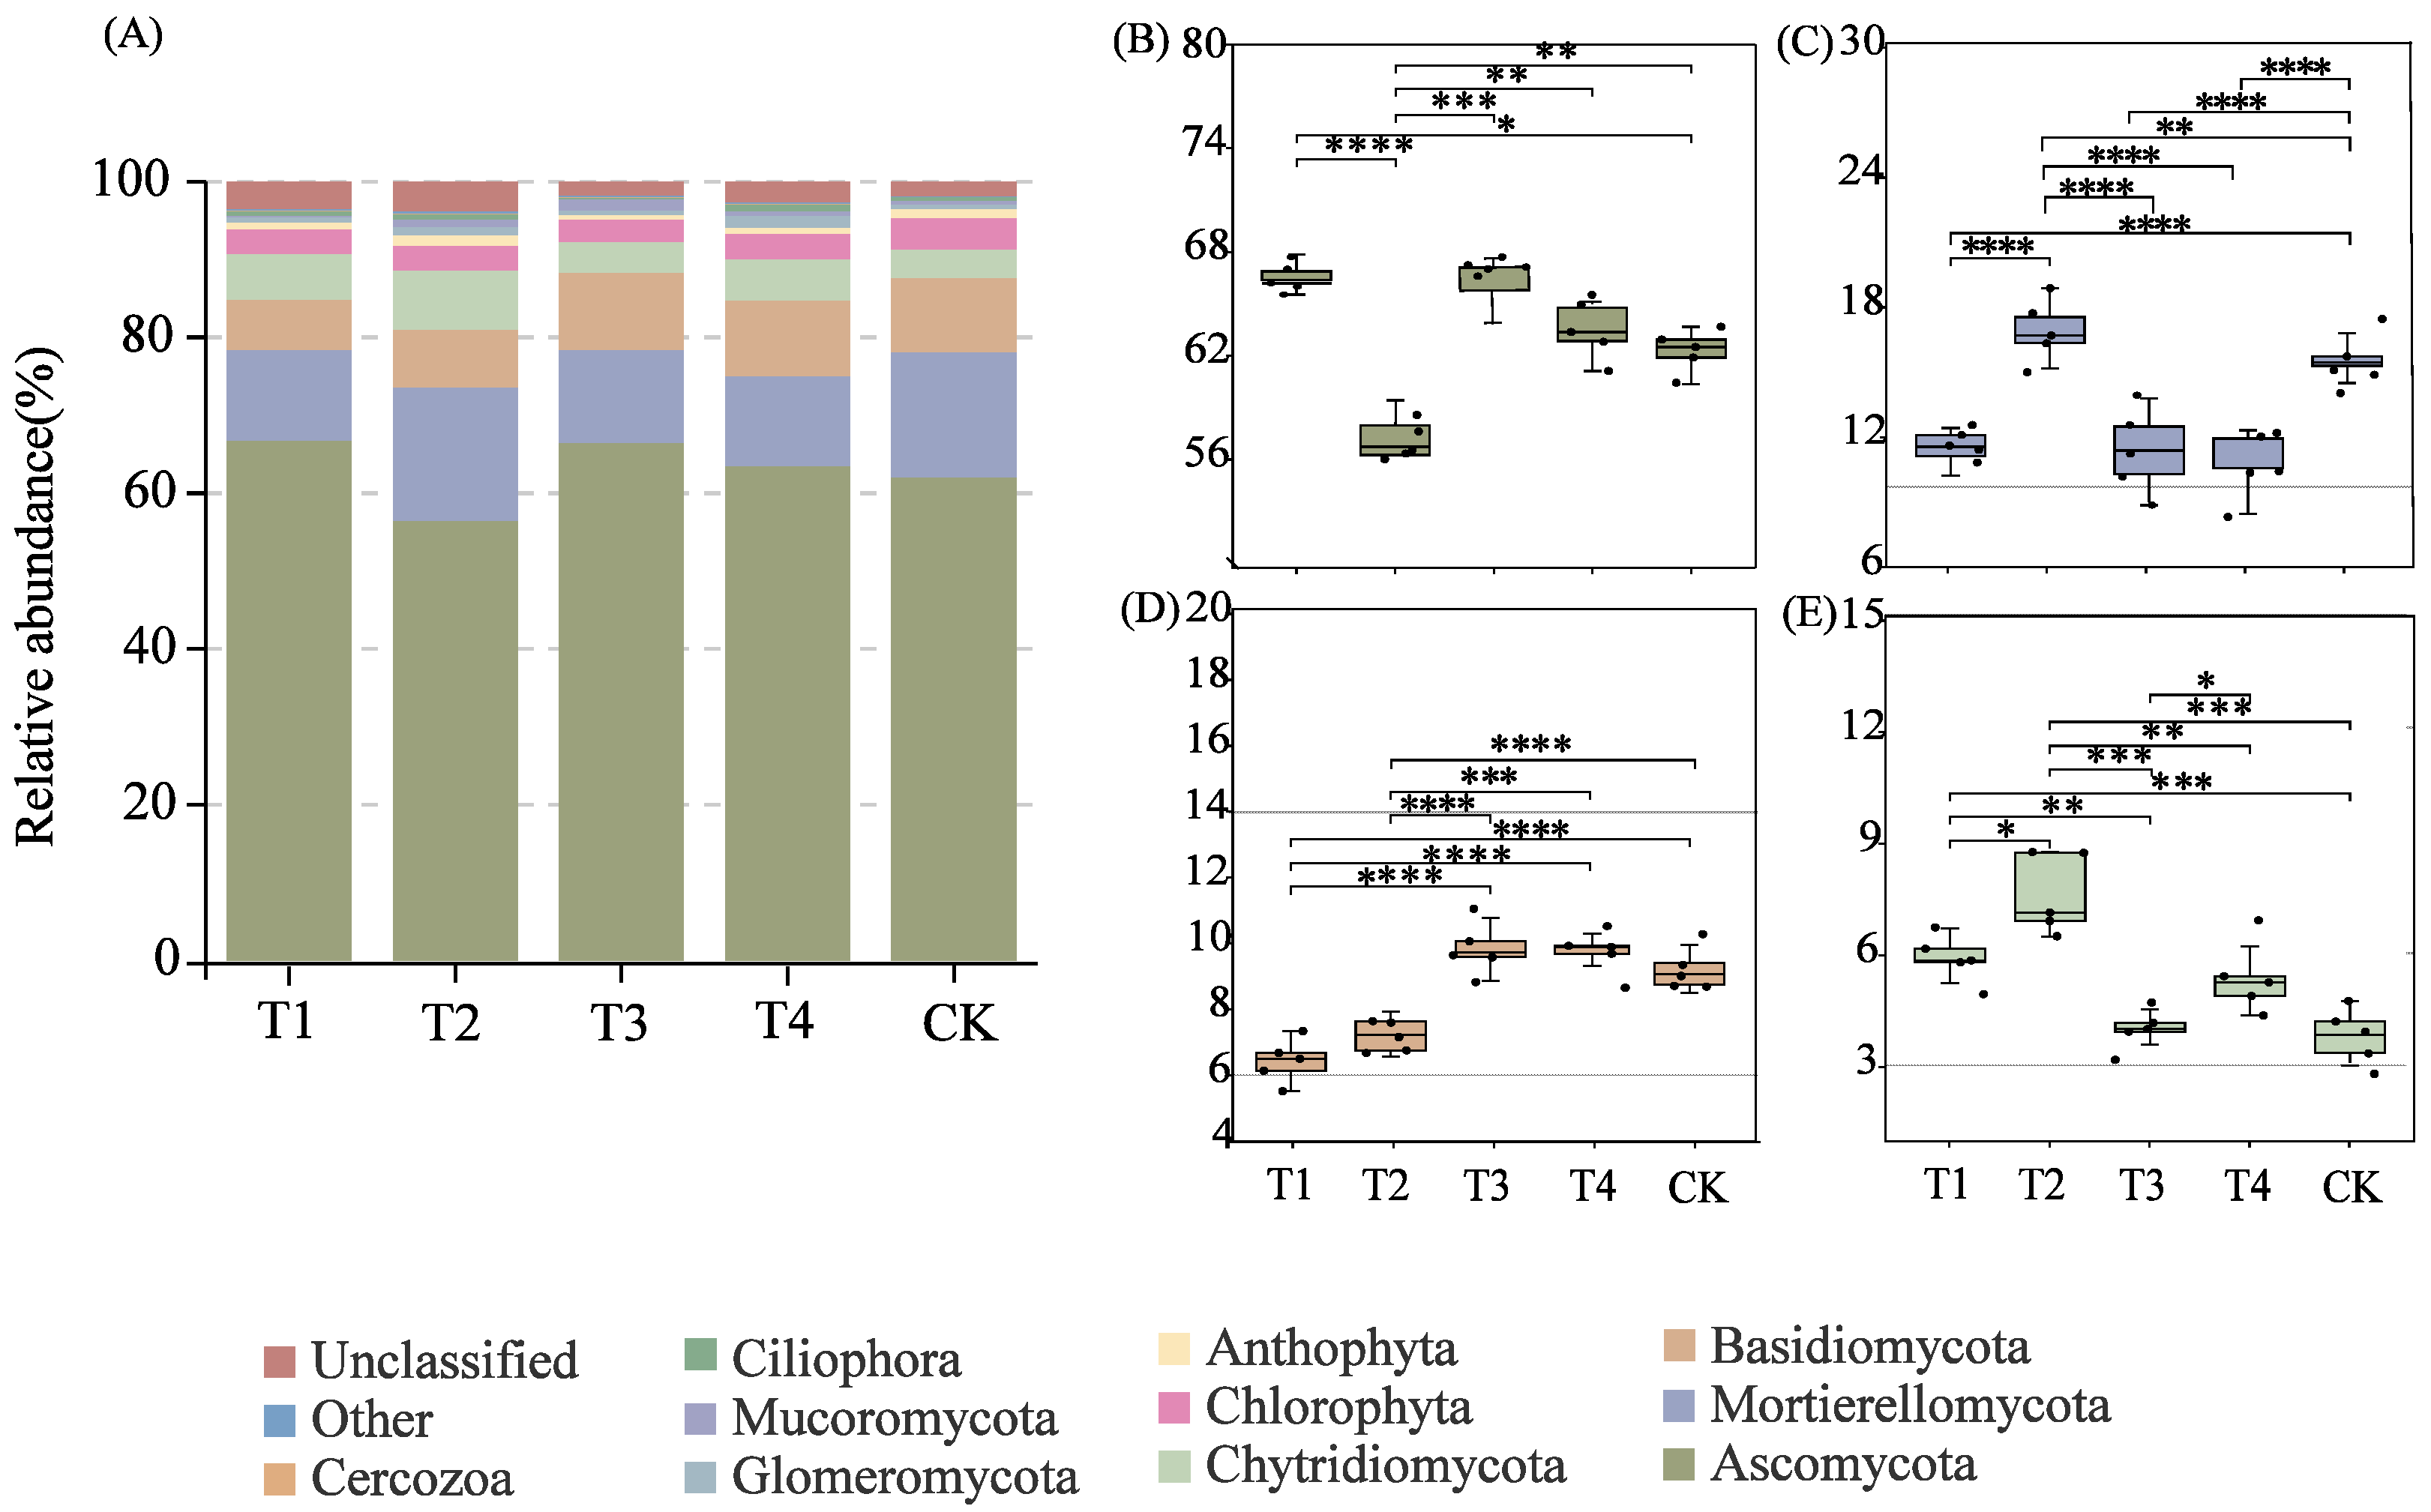
The dominant fungal phylum was Ascomycota (56.38–66.61%), followed by Mortierellomycota (11.48–17.10%), Chytridiomycota (3.66–7.55%), Basidiomycota (6.45–9.94%), and Chlorophyta (2.87–4.03%) (Figure 4A). Treatments T1, T3, and T4 significantly increased the relative abundance of Ascomycota (p < 0.05) (Figure 4B). T2 treatment markedly enhanced Mortierellomycota abundance (Figure 4C), while T3 and T4 significantly promoted Chytridiomycota (Figure 4E). In addition, T2 treatment significantly stimulated the growth of Basidiomycota (Figure 4D).
At the genus level, the top 10 dominant fungal genera were Mortierella (6.39–10.56%), Fusarium (6.28–8.42%), Alternaria (2.77–8.64%), Cladosporium (2.06–4.15%), Tetracladium (1.96–3.64%), Rhizophydiales_gen_Incertae_sedis (1.30–2.50%), Solicoccozyma (1.32–1.95%), Vishniacozyma (0.98–2.31%), Fusicolla (1.13–2.03%), and Schizothecium (0.97–1.79%) (Figure S2A). The relative abundances of Mortierella and Fusarium under T3 and T4 were significantly lower than those under other treatments (Figure S2B,C). Conversely, Alternaria and Cladosporium were significantly enriched under T3 treatment compared with other treatments (Figure S2D,E).

3.3. Variation in Carbon-Related Enzyme Activities Under Different Fertilization Treatments

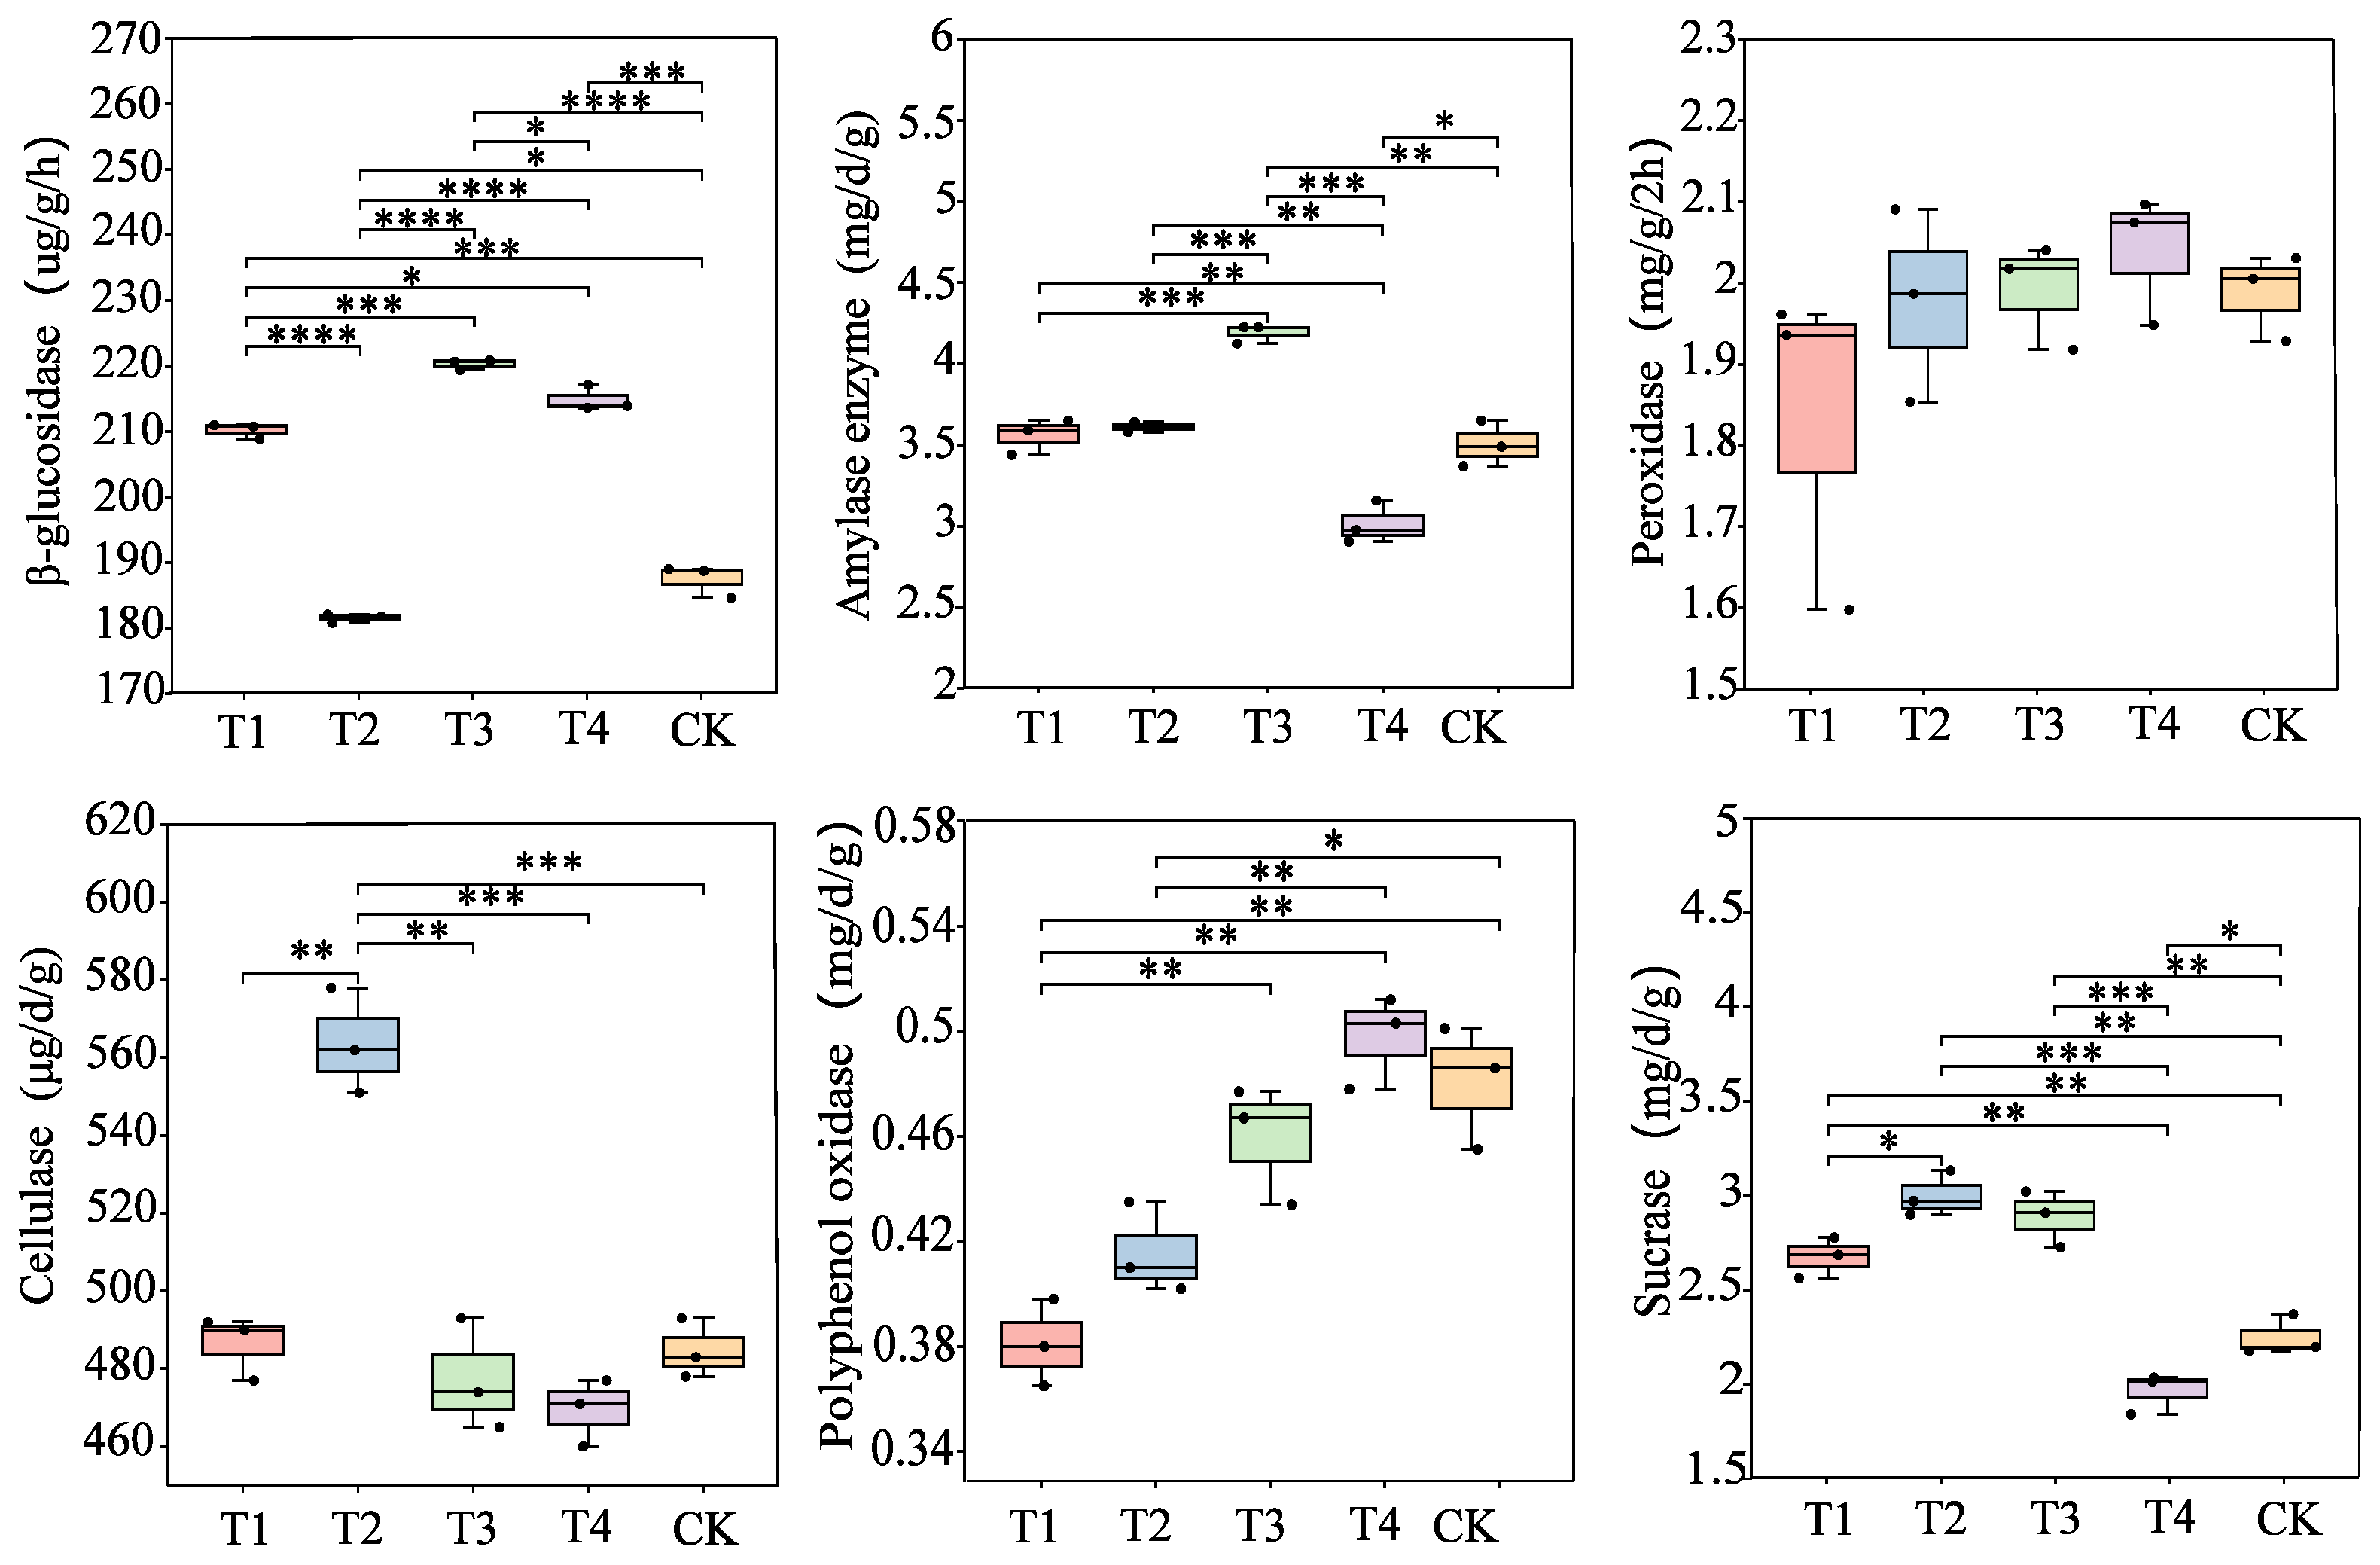
Different fertilization treatments had significant effects on carbon-cycle-related enzyme activities in the oat rhizosphere soil (Figure 5). The combined application of nitrogen and organic fertilizer (T3, T4) significantly enhanced the activities of amylase and β-glucosidase (p < 0.05), whereas peroxidase activity did not show statistical differences among treatments (p > 0.05). Regarding polyphenol oxidase, T1 exhibited the lowest activity, while T4 reached the highest level, with differences among treatments being highly significant (p < 0.01). In contrast, cellulase activity was highest under T2 but lowest under T3 and T4, with differences also highly significant (p < 0.01).

3.4. Effects of Fertilization Treatments on Oat Grain Yield and Yield Components

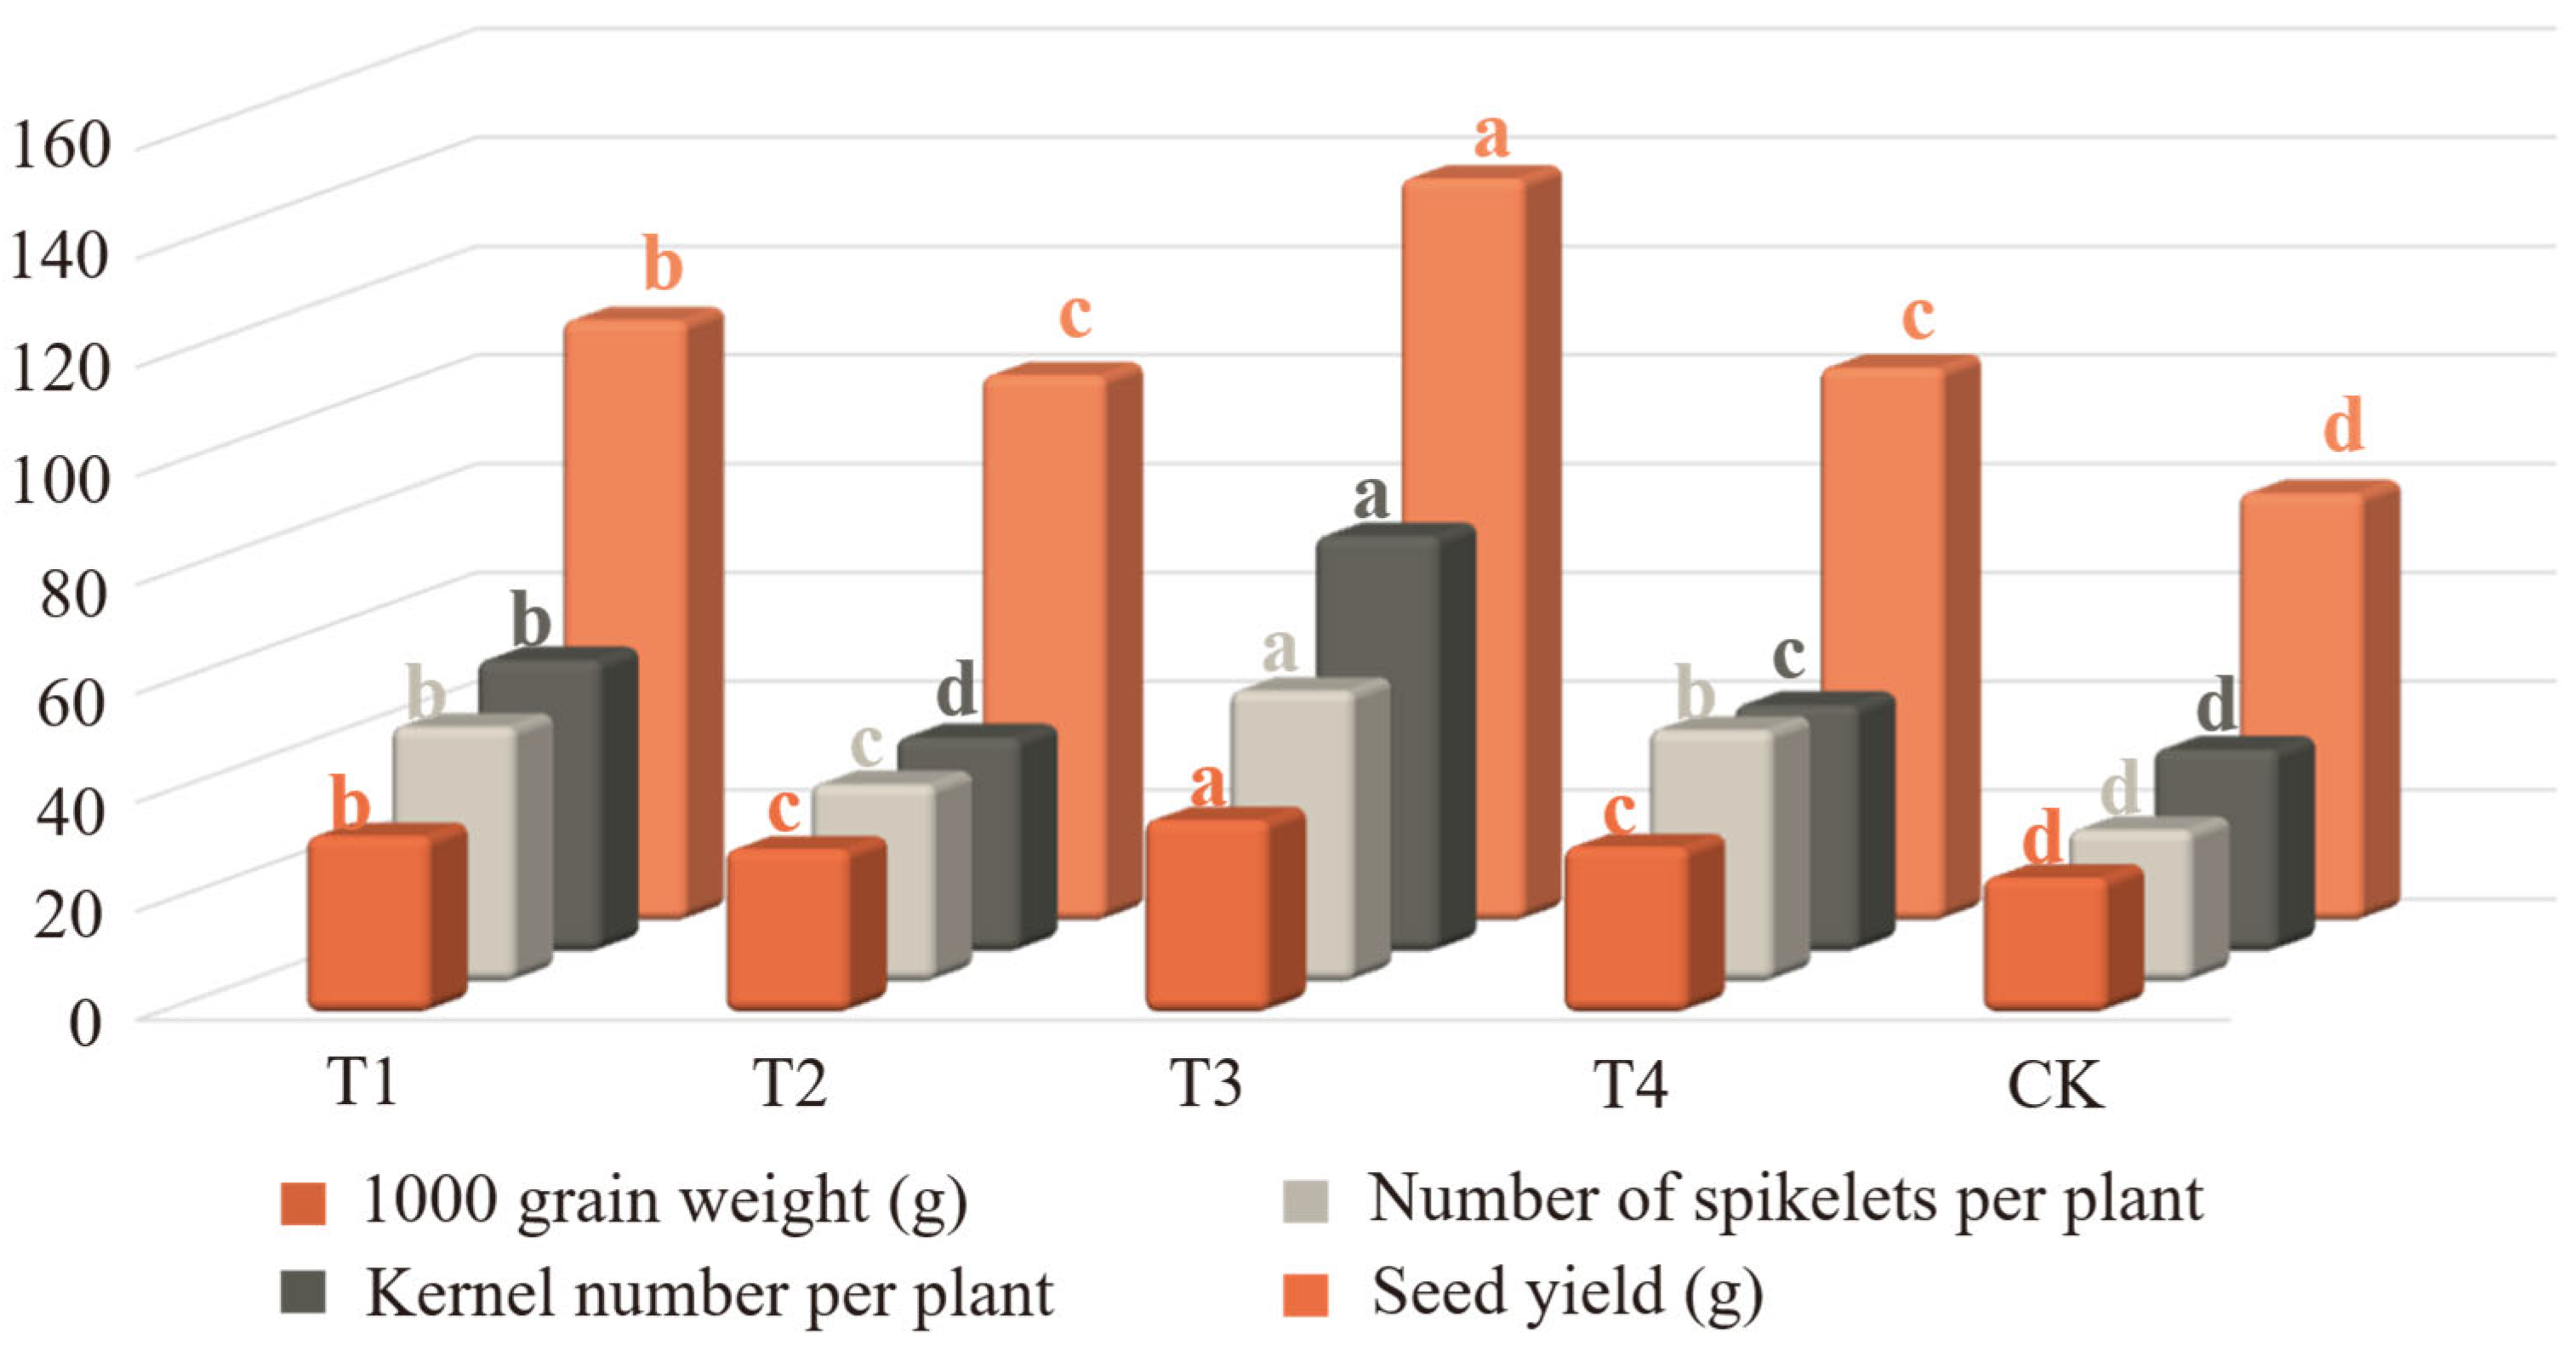
All fertilization treatments significantly enhanced oat grain yield and its components compared with the unfertilized control (CK) (Figure 6). Among them, the 30% organic substitution (T3) exhibited the best performance, with grain yield, spikelet number, grain number per spike, and thousand-grain weight increasing by 73.5%, 91.4%, 105.4%, and 42.7%, respectively, relative to CK. Furthermore, yield and thousand-grain weight under T3 were significantly higher than those under 60% substitution (T4), by 34% and 16%, respectively.

3.5. Associations Between Environmental Factors and Microbial Community Structure

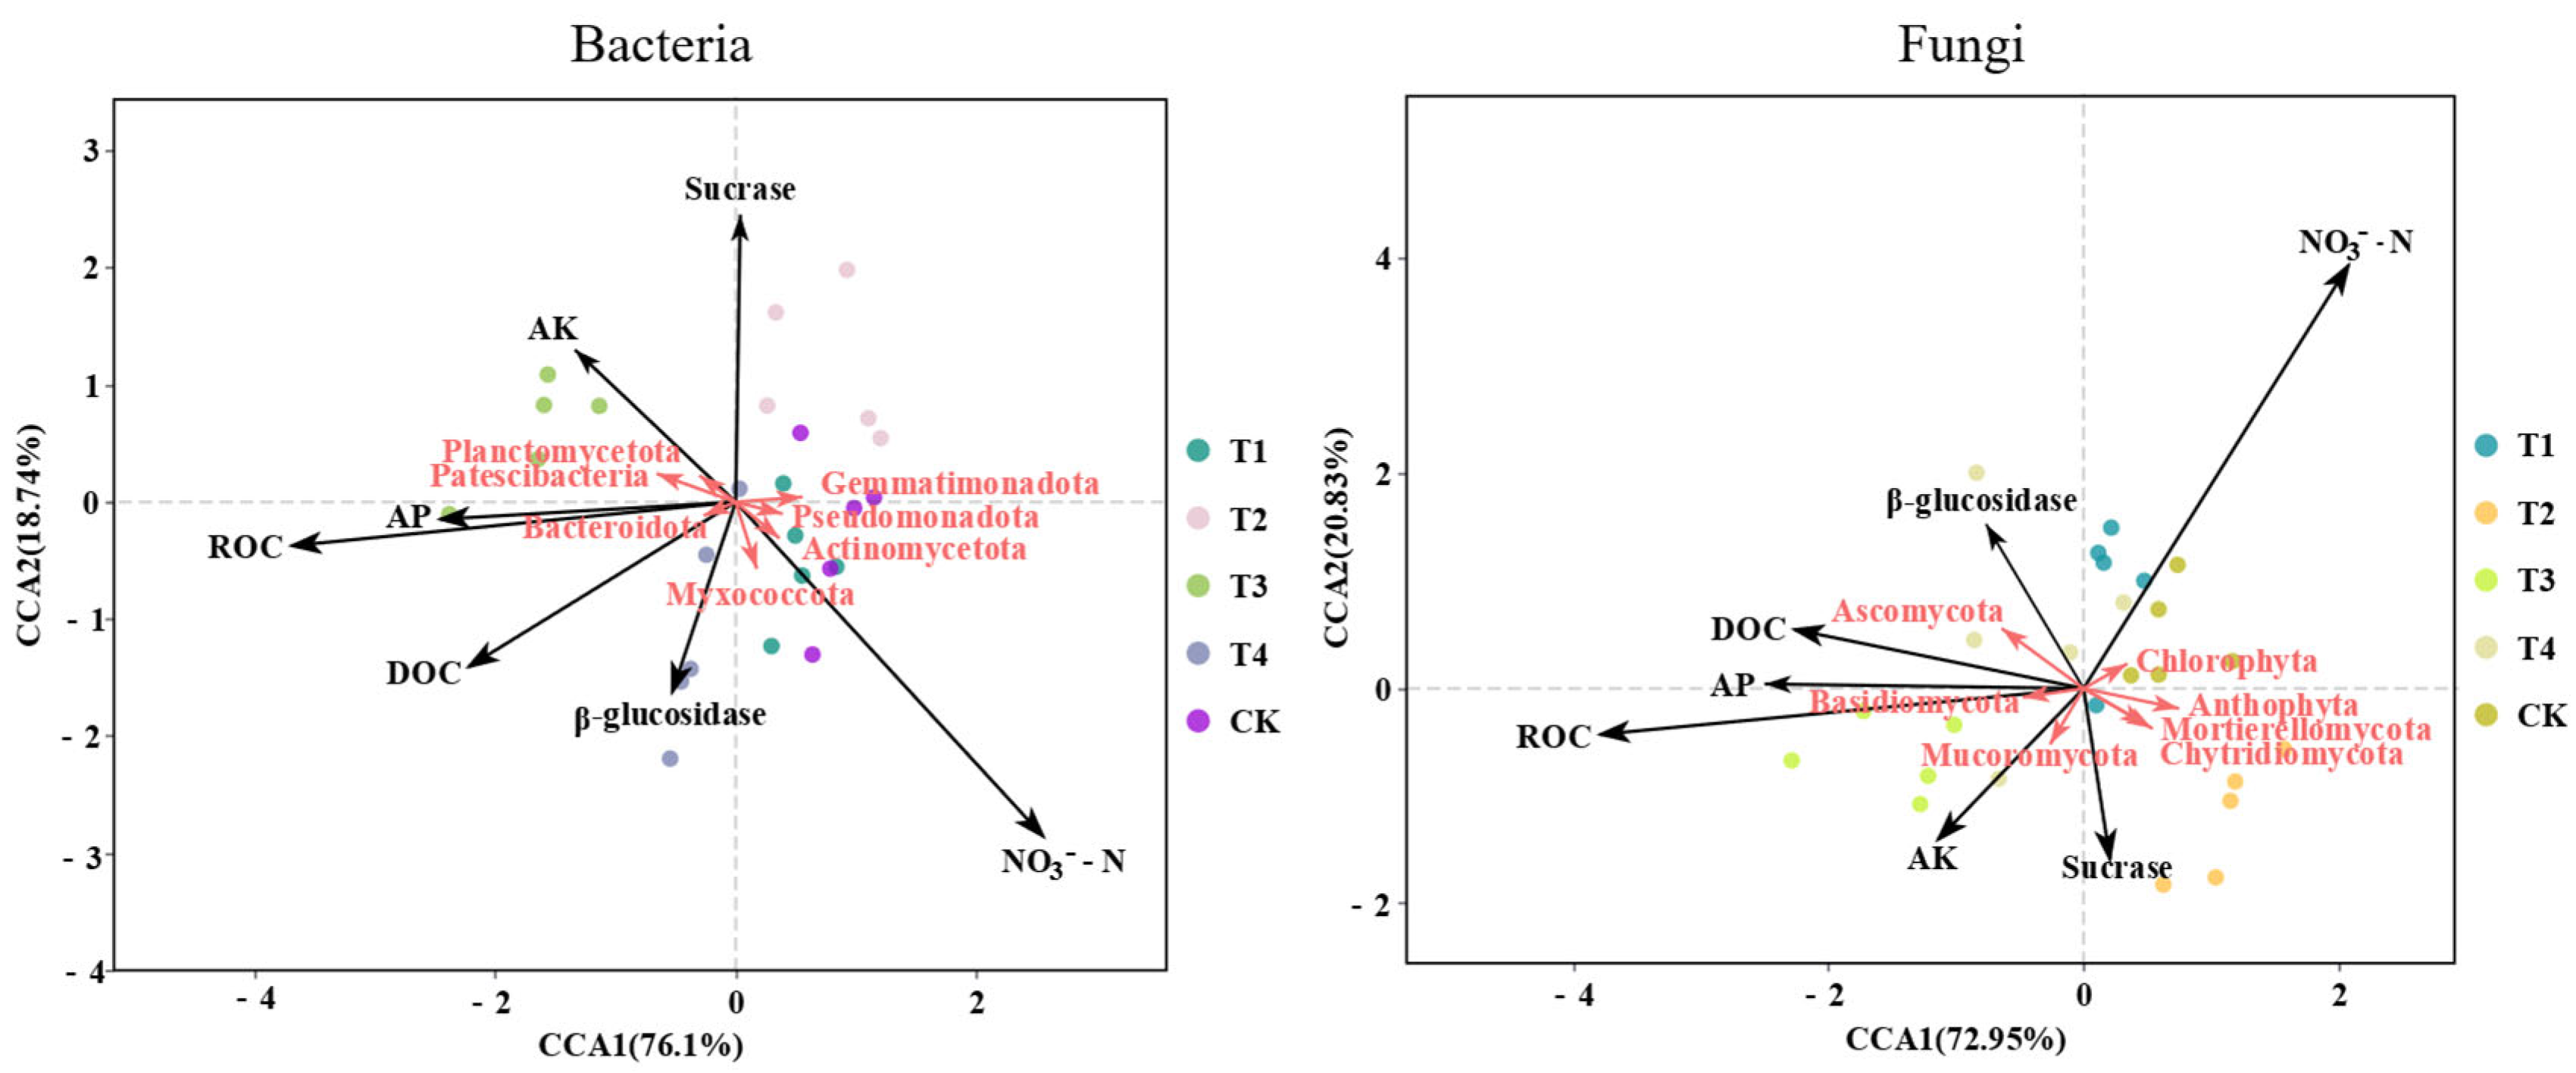
Regarding the associations between environmental factors and microbial community groups (top 7 shown, Figure 7), distinct correlation patterns were observed. In the bacterial community, sucrase exhibited strong positive correlations with Planctomycota and Patescibacteria, as well as with T2 samples. NO3-N was strongly negatively correlated with Pseudomonadota and Myxococcota, while AK showed significant positive correlations with Gemmatimonadota and T3 samples. These factors together explained 94.84% of the bacterial community variation through CCA1 (76.1%) and CCA2 (18.74%). In the fungal community, NO3-N was strongly positively correlated with Chlorophyta and Anthophyta, as well as with T4 and T2 samples. β-glucosidase was significantly positively correlated with Ascomycota and T1 samples, whereas AK was strongly negatively correlated with Mucoromycota and T3 samples. These factors explained 91.78% of the fungal community variation through CCA1 (72.95%) and CCA2 (18.83%).
At the genus level (Figure S3), Sphingomonas and Flavisolibacter were significantly positively correlated with SOC and MBC (p < 0.05), while Pseudomonas and Lysobacter were negatively correlated with pH and NO3-N (p < 0.05). Moreover, sucrase and β-glucosidase showed highly significant correlations (p < 0.01) with Gemmatimonas and Ferruginibacter. In the fungal genera, Mortierella and Alternaria were significantly positively correlated with SOC and MBC (p < 0.05), whereas Cladosporium and Tetracladium were negatively correlated with NH4+-N and NO3-N. Polyphenol oxidase exhibited highly significant correlations (p < 0.01) with Schizothecium and Fusarium, while urease showed relatively weak associations with most fungal genera.

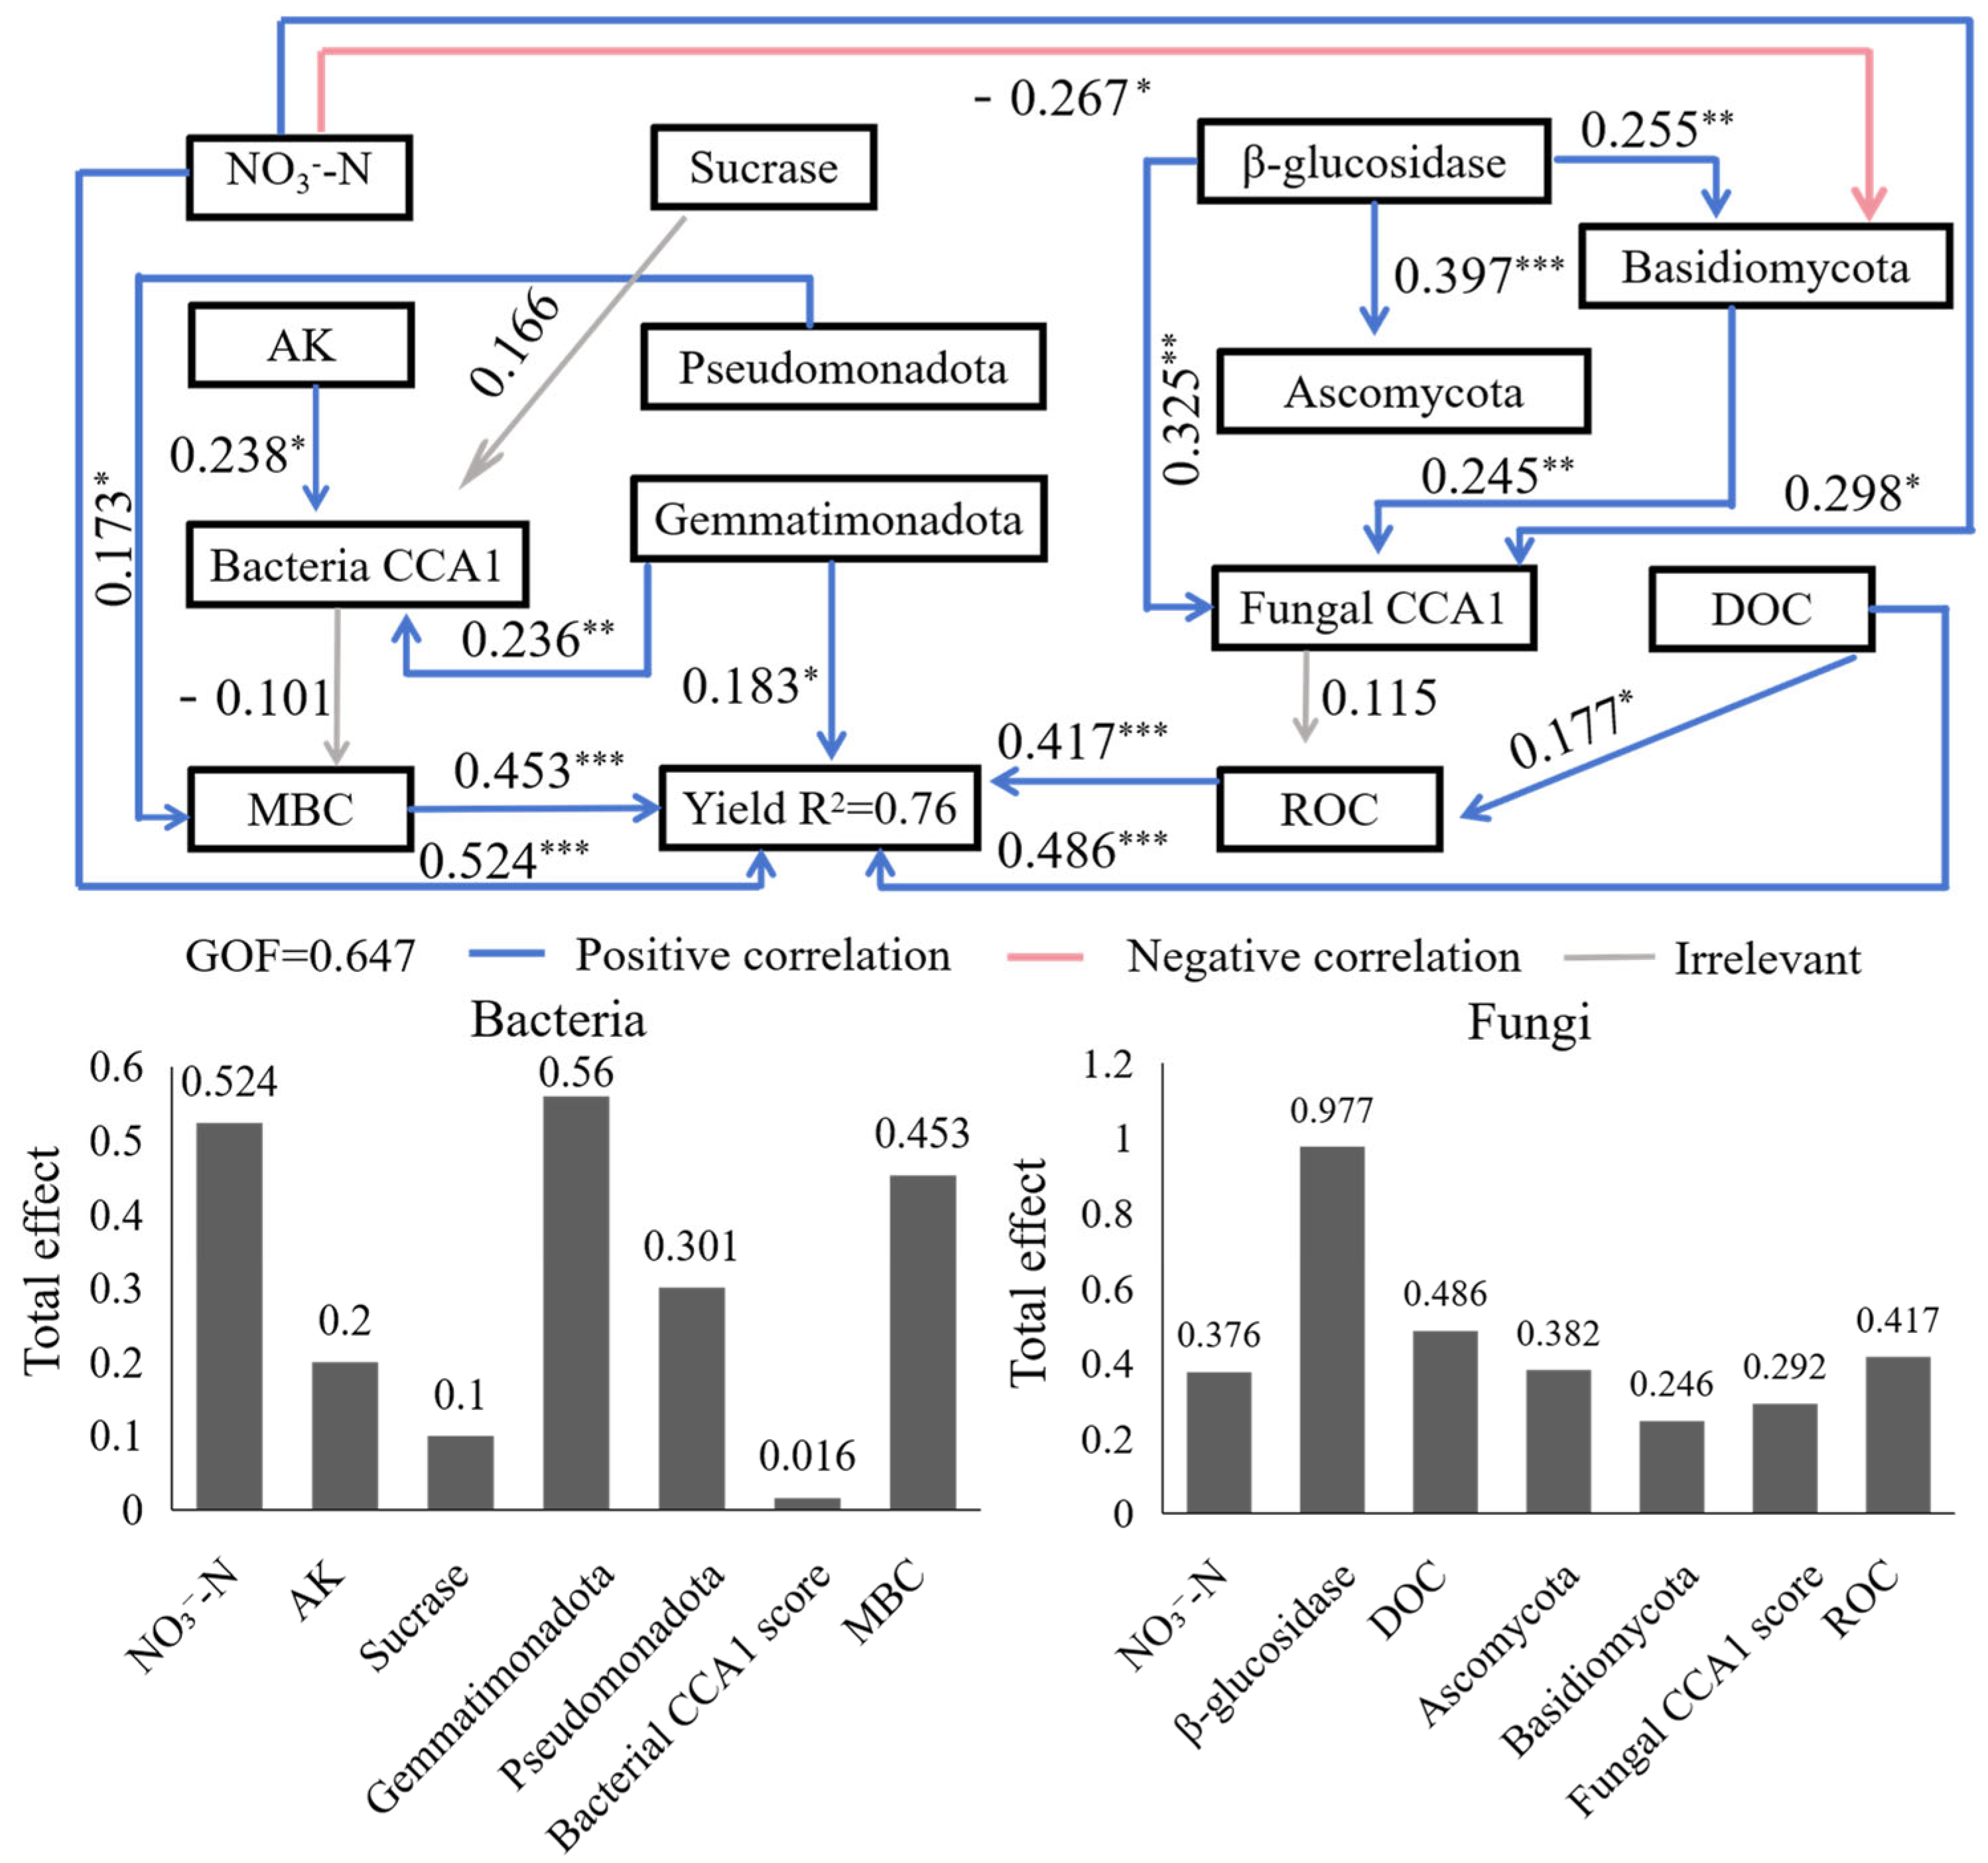
3.6. Contributions of Bacterial and Fungal Pathways to Oat Yield Revealed by PLS-SEM

For the fungal pathway (Figure 8), β-glucosidase (β = 0.977) played a dominant role, while DOC (β = 0.486), ROC (β = 0.417), Ascomycota (β = 0.382), and NO3-N (β = 0.376) also made significant contributions to yield. Basidiomycota (β = 0.246) and the fungal CCA1 score (β = 0.292) exhibited moderate effects. The integrated model explained approximately 76% of the variation in yield (R2 = 0.76) and showed a good overall fit (GOF = 0.65). The bar chart (Figure 8) further illustrates the total effects (standardized β values) of each variable on yield, facilitating comparison between the bacterial and fungal pathways. In the bacterial pathway, Gemmatimonadota, NO3-N, and MBC had the largest total effects, whereas the bacterial CCA1 score had almost no influence. In the fungal pathway, the effect of β-glucosidase far exceeded that of other factors, particularly DOC and ROC.

3.7. Effects of Fertilization Treatments on Ecological Multifunctionality (EMF) and Yield

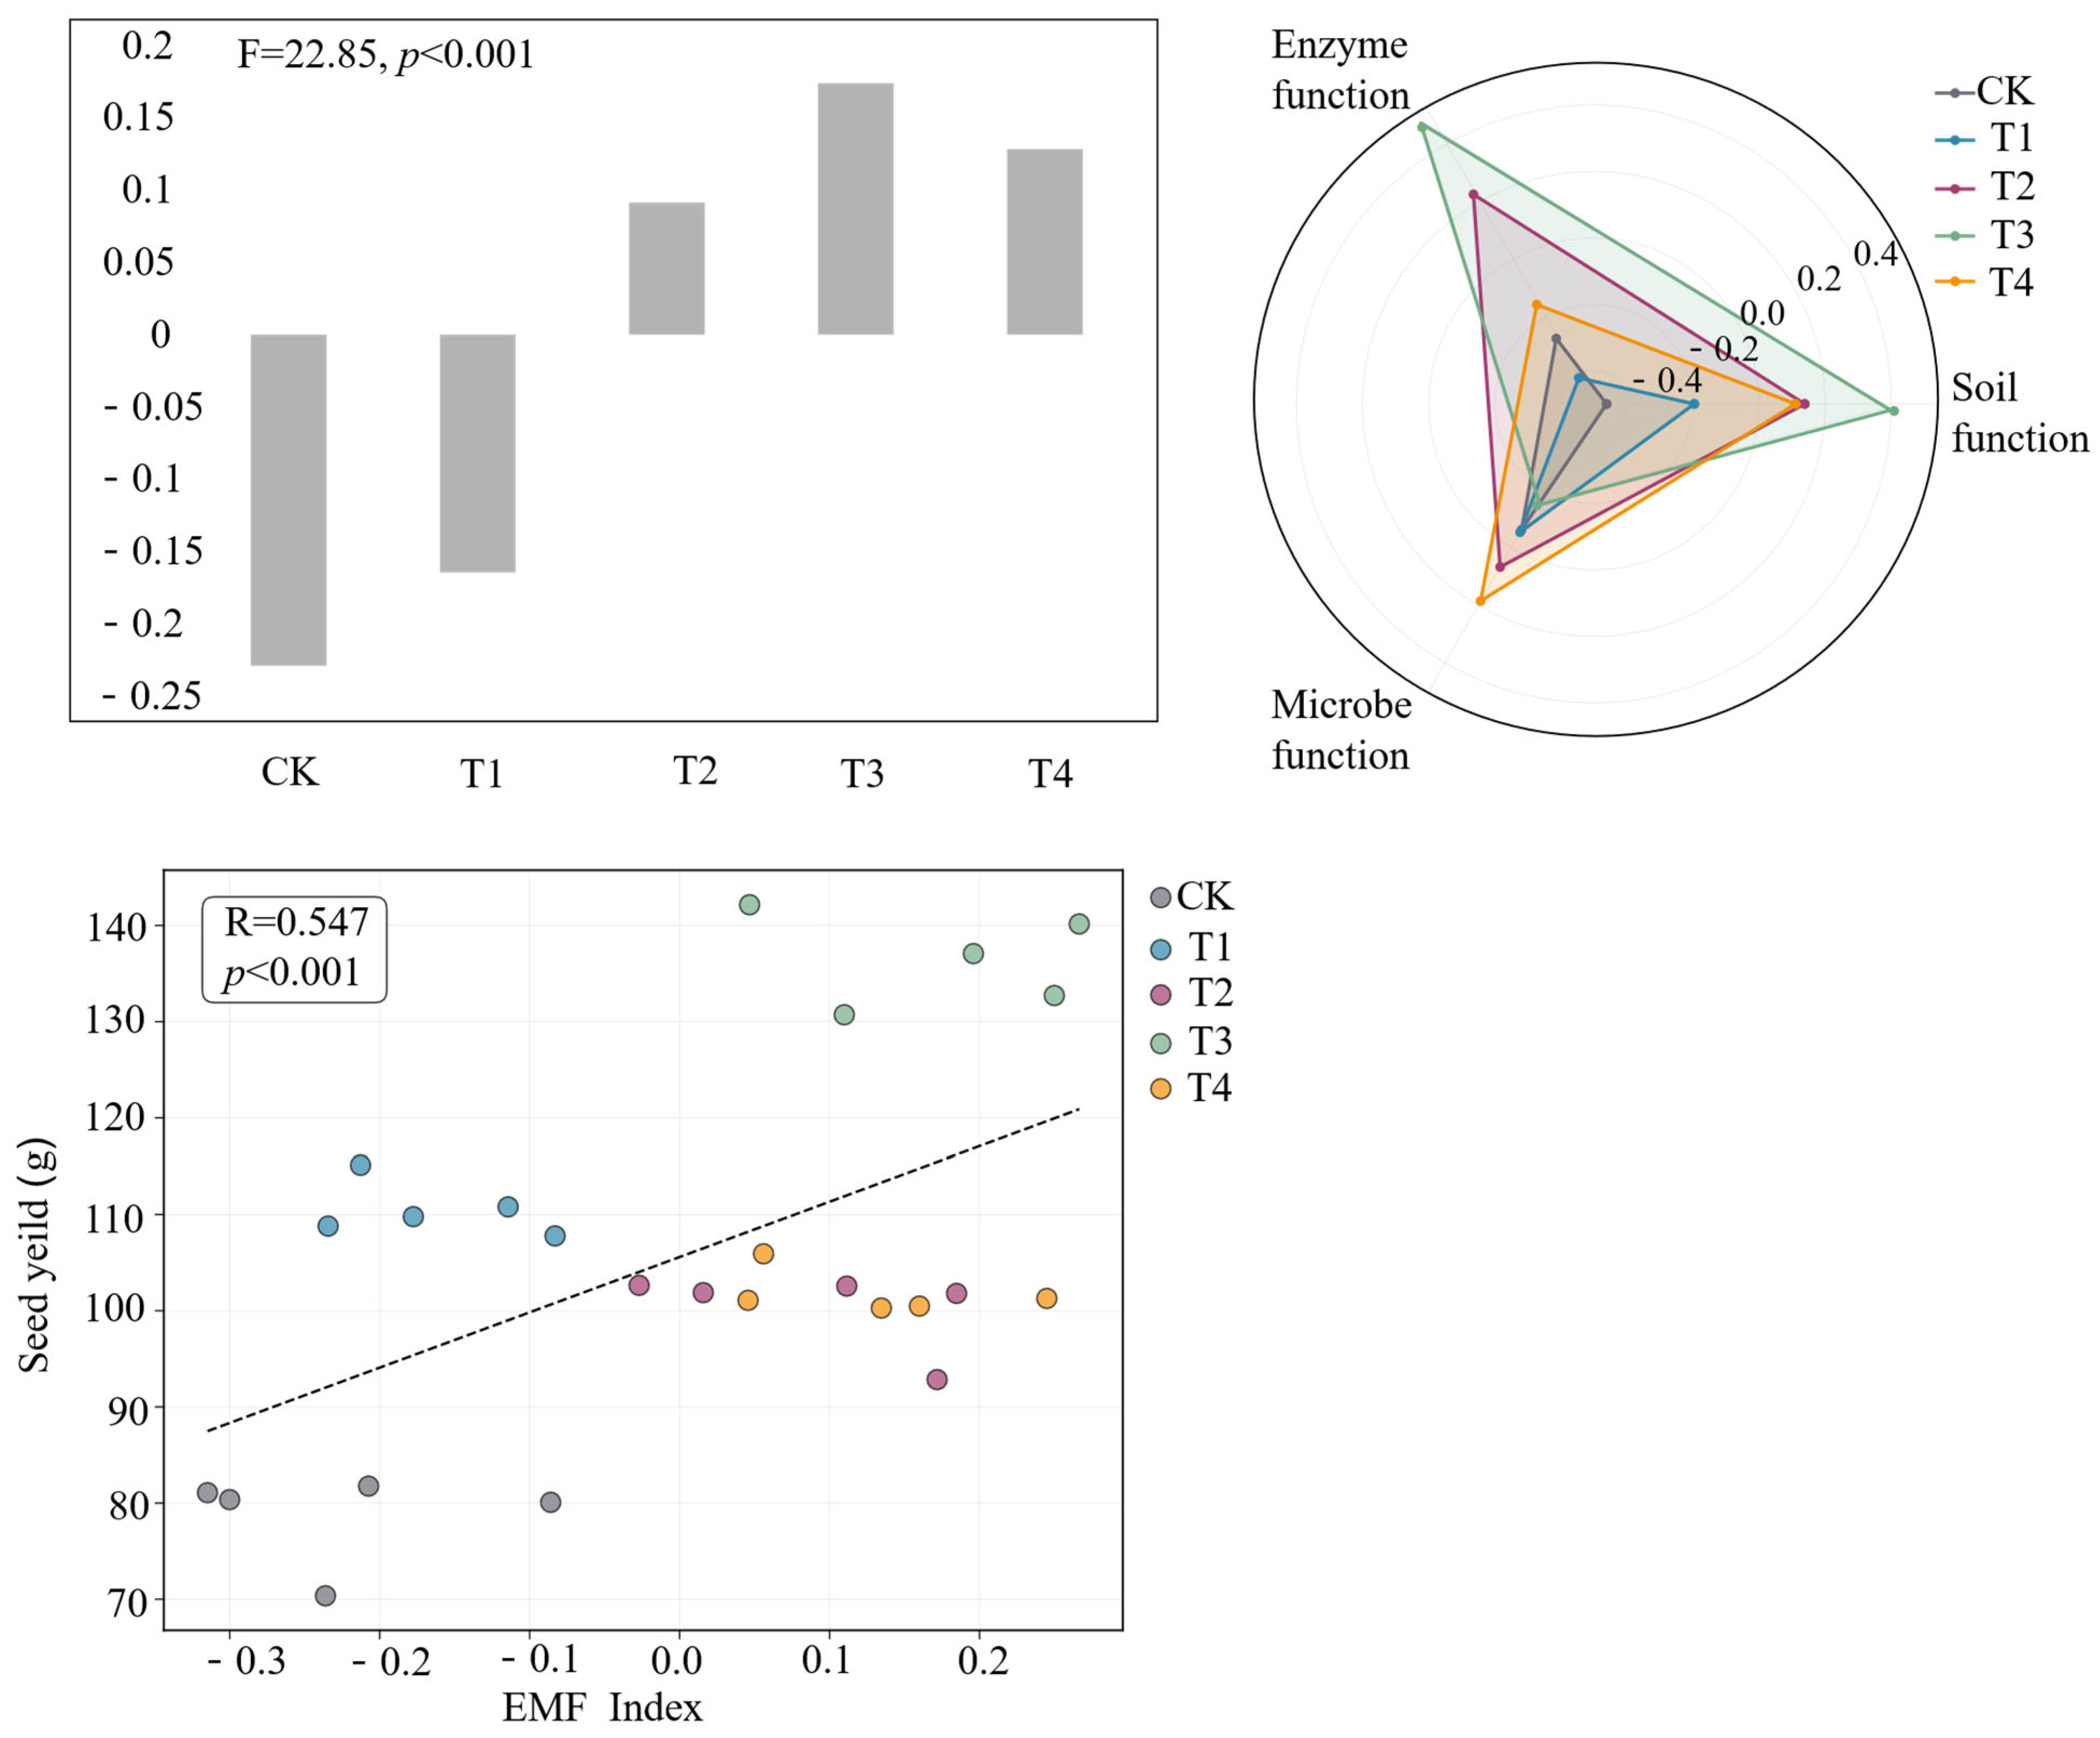
Different fertilization treatments significantly affected the EMF of oat rhizosphere soil, as shown in Figure 9. According to the data, the composite EMF scores under the T3 and T4 treatments were significantly higher than those of the other treatment groups (F = 22.85, p < 0.001), indicating that substituting chemical fertilizers with organic fertilizers can effectively enhance soil ecological functions. The radar chart further illustrates the differences among treatments in terms of enzyme function, soil function, and microbial function. Among them, T3 exhibited the best performance across all dimensions, reflecting a system-level synergistic enhancement effect. Meanwhile, the EMF index was significantly and positively correlated with grain yield (R = 0.547, p < 0.001), suggesting that improvements in ecological functions can be directly translated into increased crop productivity. Overall, an organic fertilizer substitution ratio of 30–60% (T3 and T4) not only optimized soil functions but also achieved a synergistic improvement in ecological multifunctionality and yield.

4. Discussion

4.1. Changes in Soil Carbon Pools and the Optimal Organic Substitution Ratio in Oat Rhizosphere

This study, conducted in the rhizosphere soil of oats on the Qinghai–Tibet Plateau, found that organic fertilizer substitution for chemical fertilizer significantly improved soil nutrient status and carbon components, with clear differences among substitution ratios. The 30% substitution treatment (T3) performed best, increasing the contents of available phosphorus (AP), soil organic carbon (SOC), dissolved organic carbon (DOC), readily oxidizable carbon (ROC), and microbial biomass carbon (MBC). This suggests that an appropriate level of organic substitution may provide dual benefits of nutrient supply and carbon pool optimization. In contrast, sole chemical fertilization (T1) reduced SOC and MBC contents, highlighting the negative effects of relying exclusively on nitrogen fertilizer on soil carbon pools and microbial activity in alpine regions. Similar findings were reported by Hua and Pan [33], who demonstrated that organic amendments in alpine soils of the Qinghai–Tibet Plateau significantly improved soil structure, microbial community composition, and carbon dynamics compared with sole chemical fertilization.
In terms of carbon pool characteristics, the 30% organic substitution treatment (T3) significantly increased soil organic carbon (SOC) content by 1.35 g/kg compared with sole chemical fertilization (T1), accompanied by simultaneous increases in dissolved organic carbon (DOC) and readily oxidizable organic carbon (ROC). This result indicates that organic inputs not only provide stable carbon sources to maintain SOC storage but also supplement labile carbon readily utilized by microbes, thereby jointly enhancing carbon sink capacity and carbon cycling activity. The ROC/SOC ratio under T3 reached 36.05%, the highest among all treatments, which supports the observation that “moderate organic substitution tends to be more effective.” In contrast, excessive substitution (e.g., 60% substitution in T4) increased the proportion of recalcitrant carbon components, reduced microbial decomposition efficiency, and ultimately slowed SOC accumulation [34]. This finding is consistent with the conclusions of Wei [35], who demonstrated that when the organic substitution ratio exceeded 50%, soil carbon pool activity declined significantly and SOC increments tended to plateau.
In terms of microbial activity, both T2 (sole organic fertilization) and T4 (60% organic substitution) effectively alleviated the suppression of microbial biomass carbon (MBC) caused by sole chemical fertilization (T1), with T2 showing the most pronounced increase. The underlying mechanism is that organic fertilizer, through “carbon–nitrogen coupled inputs,” provides a balanced supply of carbon and nitrogen resources for soil microbes—supplementing the organic carbon required for metabolism while avoiding the nitrogen surplus and carbon deficiency associated with sole chemical fertilization. This balance improves microbial C–N homeostasis, thereby promoting biomass accumulation and enhancing metabolic activity [36,37]. These findings are consistent with the study of Wang et al. [38].
In wheat fields of North China fluvo-aquic soils, which demonstrated that long-term sole nitrogen fertilization disrupts the soil C/N ratio, aggravates microbial carbon limitation and reduces MBC content, whereas organic amendments optimize the carbon–nitrogen supply structure, re-establish microbial balance, and restore community activity.
The results of the carbon pool management index (CPMI) further validated this pattern: the T3 treatment (30% organic substitution) yielded the highest CPMI value (142.3), representing a 42.3% increase compared with the control (CK), which underscores the optimal effect of this substitution ratio in improving soil carbon pool quality. This conclusion is widely supported by relevant studies. For instance, based on a long-term field experiment conducted on tobacco-growing soils in Yunnan, Xiong et al. [39] reported that a 40% organic substitution regime not only elevated soil carbon fractions but also improved CPMI, thereby ultimately boosting both the yield and quality of tobacco leaves. Evidence from international long-term trials also corroborates this finding. The Rothamsted Broadbalk wheat experiment in the UK demonstrated that sole nitrogen fertilization could marginally increase SOC content via microbial residues, yet its stimulatory effect on microbial activity was far less pronounced than that of combined organic and chemical fertilization [40,41].

4.2. Role of Microorganisms and Enhancement of Enzyme Activities

Microbial communities are widely recognized as key drivers of soil carbon cycling, and our results demonstrate that they respond sensitively to fertilization regimes. Organic amendments, particularly the T3 and T4 treatments, substantially enriched functional microbial groups such as Ascomycota and Bacteroidetes, which were accompanied by significant increases in sucrase and β-glucosidase activities. These findings are consistent with Wang et al. [42], who reported that organic inputs reshape microbial profiles and enhance β-glucosidase activity in rice–wheat systems. In our study, β-glucosidase activity under T3 increased by 27.3% relative to T1, indicating a strong association between organic substitution and microbial enzymatic functions, rather than a direct causal relationship.
As a critical rate-limiting enzyme in cellulose decomposition, β-glucosidase plays a central role in converting readily oxidizable carbon (ROC) into bioavailable carbon pools. The observed enhancement of β-glucosidase activity therefore directly strengthens soil carbon turnover and nutrient availability. Liu et al. [43] proposed a “microbe–enzyme–carbon cycle” coupling model, in which organic fertilizers regulate microbial community structure to establish positive feedback loops: carbon input → microbial enrichment → elevated enzyme activity → accelerated cycling. Supporting this mechanism, Zhang et al. [44] demonstrated through metagenomic analysis that organic amendments upregulate carbohydrate-degrading enzymes in fungal communities, while Li et al. [45] showed that Ascomycota-dominated communities produce superior cellulolytic enzymes, explaining the enrichment patterns observed in high-yield treatments.
The structural equation modeling (PLS-SEM) further highlighted fungal β-glucosidase as the strongest predictor of yield (path coefficient = 0.62). This statistical association should be interpreted cautiously, as it is based on limited treatments and experimental conditions. This aligns with Guo et al. [46], who found that fungal biomass and enzyme activity explained 68% of yield variation under organic fertilization, substantially exceeding bacterial contributions. Similarly, Tian et al. [47] identified cellulase-producing fungi as robust predictors of both soil carbon turnover and crop yield across diverse agroecosystems. Collectively, these findings confirm that fungal-mediated enzymatic processes are central to regulating the “carbon cycling–yield formation” pathway, providing a microbiological foundation for optimizing organic fertilizer application in alpine agroecosystems.

4.3. The Threshold Effect of Organic Nitrogen Replacement Ratios and Their Carbon–Nutrient Synergistic Mechanisms

From the perspective of carbon--nutrient coupling, this study revealed a clear “threshold” effect of substitution ratio: T3 (30% organic--N substitution) produced peak AP and oat yield, whereas T4 (60% substitution) resulted in the highest AK. Because all treatments received equal amounts of P2O5 and K2O—standardized to T2 and supplemented with superphosphate and potassium sulfate as needed—the divergence in AP and AK is more likely driven by changes in carbon inputs and nitrogen forms induced by the substitution ratio, which reshaped microbial processes and nutrient transformation efficiency, rather than by differences in P and K inputs [48]. These differential responses are consistent with existing research. Hu et al. [49] reported that lower substitution levels (20–30%) are more conducive to phosphorus mobilization, whereas higher levels (50–60%) enhance potassium supply due to the high endogenous K content in organic inputs. Meanwhile, the slight decline in the MBC/SOC ratio under 30–50% substitution should be interpreted as evidence of improved carbon use efficiency (CUE) and shifts in microbial resource allocation strategies, rather than suppression of microbial activity. Li et al. [50] similarly showed that balanced organic–inorganic nitrogen inputs encourage microorganisms to allocate more carbon to extracellular enzyme synthesis and nutrient mineralization, thereby sustaining crop nutrient supply and enhancing soil carbon stabilization through microbial residue deposition.
Taken together, this study provides three key insights: (1) Optimal substitution ratio: A 30–50% organic nitrogen substitution range was observed to perform well under the conditions of this pot experiment, but further field validation is required. (2) Mechanistic evidence: Quantification of substitution effects using ROC/SOC and SOC oxidation analyses offers mechanistic support for soil carbon pool regulation. (3) Key drivers: Fungal extracellular enzyme activity—particularly β-glucosidase—is suggested as a central link connecting carbon turnover with crop productivity. (4) The overall mechanism can be summarized as a “three—step pathway”: increased carbon inputs → microbial activation → nutrient mobilization. This coordinated process enables simultaneous improvements in soil carbon sequestration and agricultural productivity across diverse agroecosystems. These conclusions are tentative and should not be generalized beyond the scope of this controlled pot experiment.
Future research should further incorporate climate–soil–crop interactions. Jiang et al. (2023) [51] emphasized the need for climate specific substitution strategies and recommended integrating longterm field experiments with microbiome based approaches to assess the stability of carbon–nutrient cooptimization. Such efforts will support the development of robust nutrient management systems that safeguard food security while contributing to climate change mitigation.

5. Conclusions

This study demonstrates that fertilization regimes significantly influence soil enzyme activity, microbial community composition, ecological multifunctionality (EMF), and oat yield formation. Moderate organic substitution (30–60%) was associated with enhanced key carbon cycle enzymes (e.g., amylase, β-glucosidase), improved soil carbon pools and microbial functions, and showed positive correlations with EMF, while PLS-SEM revealed two microbial biochemical pathways linking soil carbon cycling with productivity, explaining 76% of yield variation. These findings suggest that fungal enzyme activity may play an important role in connecting soil carbon dynamics with crop yield, and strengthening EMF could contribute to higher agricultural output. However, as the study was conducted under pot conditions with limited substitution gradients, the emphasis on T3 as “optimal” should be interpreted as an observed trend under these specific conditions rather than a definitive conclusion. The threshold effect and field applicability therefore require cautious interpretation. These conclusions are tentative and should not be generalized beyond the scope of this controlled pot experiment. Future research should validate these results through long-term field trials across diverse crops and environments to support sustainable nutrient management and resilient plateau agroecosystems.

Supplementary Materials

The following supporting information can be downloaded at https://www.mdpi.com/article/10.3390/agronomy16020184/s1. Figure S1. Relative abundance of the top 10 bacterial genera in the rhizosphere soil of oat under different treatments (A), and relative abundance of Sphingomonas (B), Flavisolibacter (C), Gemmatimonas (D), and Pseudomonas (E); Figure S2. Relative abundance of the top 10 fungal genera in the rhizosphere soil of oat under different treatments (A), and relative abundance of Mortierella (B), Fusarium (C), Alternaria (D), and Cladosporium (E); Figure S3. Correlation analysis between microbial community structure at the genus level and environmental factors. Note: The left panel shows dominant bacterial genera, and the right panel shows dominant fungal genera. Colors indicate correlation coefficients (blue: positive; red: negative), with deeper colors indicating stronger correlations. * p < 0.05, ** p < 0.01, and *** p < 0.001. SOC: soil organic carbon; MBC: microbial biomass carbon; DOC: dissolved organic carbon; ROC: readily oxidizable organic carbon; AP: available phosphorus; AK: available potassium; TK: total potassium; NH4+-N: ammonium nitrogen; NO3-N: nitrate nitrogen; AN: alkali-hydrolyzable nitrogen. Table S1. Impact on Soil Basic Physicochemical Properties; Table S2. Percentage Content of Carbon Deposit in Activated Carbon (%). The carbon pool management index (CMPI) was calculated following the method described by Xiong et al. [39].

Author Contributions

L.D. collected and analyzed the original data, and wrote the manuscript; Z.J. (Zeliang Ju) participated in data collation and manuscript revision; X.M., J.P., W.M. provided suggestions for the manuscript and revised the chart; Z.J. (Zhifeng Jia) designed this study and provided guidance for this study. All authors have read and agreed to the published version of the manuscript.

Funding

China Agriculture Research System (CARS-07).

Data Availability Statement

The original contributions presented in this study are included in the article/Supplementary Material. Further inquiries can be directed to the corresponding author.

Acknowledgments

The authors acknowledge the assistance of artificial intelligence tools (e.g., ChatGPT 5.1) in language polishing. All scientific content, experimental work, data analysis, and conclusions were independently completed by the authors.

Conflicts of Interest

The authors declare no conflicts of interest.

References

  1. Chalchissa, F.B.; Kuris, B.K. Modelling soil organic carbon dynamics under extreme climate and land use and land cover changes in Western Oromia Regional state, Ethiopia. J. Environ. Manag. 2024, 350, 119598. [Google Scholar] [CrossRef] [Scilit]
  2. Jian, S.; Li, J.; Chen, J.; Wang, G.; Mayes, M.A.; Dzantor, K.E.; Hui, D.; Luo, Y. Soil extracellular enzyme activities, soil carbon and nitrogen storage under nitrogen fertilization: A meta-analysis. Soil Biol. Biochem. 2016, 101, 32–43. [Google Scholar] [CrossRef] [Scilit]
  3. Ju, X.T.; Kou, C.L.; Zhang, F.S.; Christie, P. Nitrogen balance and groundwater nitrate contamination: Comparison among three intensive cropping systems on the North China Plain. Environ. Pollut. 2006, 143, 117–125. [Google Scholar] [CrossRef] [Scilit]
  4. van Groenigen, J.W.; Velthof, G.L.; Oenema, O.; van Groenigen, K.J.; van Kessel, C. Nitrogen fertilization does not stimulate soil carbon sequestration. Nat. Clim. Chang. 2010, 1, 172. [Google Scholar]
  5. Lal, R. Soil carbon sequestration impacts on global climate change and food security. Science 2004, 304, 1623–1627. [Google Scholar] [CrossRef] [Scilit]
  6. Geisseler, D.; Scow, K.M. Long-term effects of mineral fertilizers on soil microorganisms—A review. Soil Biol. Biochem. 2014, 75, 54–63. [Google Scholar] [CrossRef] [Scilit]
  7. Mustafa, A.; Xu, H.; Sun, N.; Liu, K.; Huang, Q.; Nezhad, M.T.; Xu, M. Long-Term Fertilization Alters the Storage and Stability of Soil Organic Carbon in Chinese Paddy Soil. Agronomy 2023, 13, 1463. [Google Scholar] [CrossRef] [Scilit]
  8. Yang, F.; Tian, J.; Meersmans, J.; Fang, H.; Yang, H.; Lou, Y.; Kuzyakov, Y. Functional soil organic matter fractions in response to long-term fertilization in upland and paddy systems in South China. Catena 2018, 162, 270–277. [Google Scholar] [CrossRef] [Scilit]
  9. Tang, H.; Li, C.; Xiao, X.; Pan, X.; Cheng, K.; Shi, L.; Li, W.; Wen, L.; Wang, K. Effects of long-term fertiliser regime on soil organic carbon and its labile fractions under double cropping rice system of southern China. Acta Agric. Scand. Sect. B—Soil Plant Sci. 2020, 70, 409–418. [Google Scholar] [CrossRef] [Scilit]
  10. Chen, Q.; Zhao, C.; Guo, Y.; Liu, X.; Dong, Y.; Liu, W. The impact of organic fertilizer substitution on microbial community structure, greenhouse gas emissions, and enzyme activity in soils with different cultivation durations. Sustainability 2025, 17, 4541. [Google Scholar] [CrossRef] [Scilit]
  11. He, H.; Peng, M.; Lu, W.; Ru, S.; Hou, Z.; Li, J. Organic fertilizer substitution promotes soil organic carbon sequestration by regulating permanganate oxidizable carbon fractions transformation in oasis wheat fields. Catena 2023, 221, 106784. [Google Scholar] [CrossRef] [Scilit]
  12. Lu, W.; Zhou, Y.; Ma, X.; Gao, J.; Guo, J.; Fan, X.; Xing, W.; Gao, W.; Lin, M.; Wang, R. Impacts of Organic Fertilizer Substitution on Soil Ecosystem Functions: Synergistic Effects of Nutrients, Enzyme Activities, and Microbial Communities. Agronomy 2025, 15, 2798. [Google Scholar] [CrossRef] [Scilit]
  13. Zhou, J.; Deng, Y.; Luo, F.; He, Z.; Tu, Q.; Zhi, X. Functional molecular ecological networks in microbial communities. mBio 2010, 1, e00169-10. [Google Scholar] [CrossRef] [Scilit]
  14. Zhu, Z.; Chen, D. Nitrogen fertilizer use in China—Contributions to food production, impacts on the environment and best management strategies. Nutr. Cycl. Agroecosystems 2002, 63, 117–127. [Google Scholar] [CrossRef] [Scilit]
  15. Bender, S.F.; Wagg, C.; van der Heijden, M.G.A. An underground revolution: Biodiversity and soil ecological engineering for agricultural sustainability. Trends Ecol. Evol. 2016, 31, 440–452. [Google Scholar] [CrossRef] [Scilit] [PubMed]
  16. Nie, M.; Yue, G.; Wang, L.; Zhang, Y. Short-term organic fertilizer substitution increases sorghum yield by improving soil physicochemical characteristics and regulating microbial community structure. Front. Plant Sci. 2024, 15, 1492797. [Google Scholar] [CrossRef] [Scilit]
  17. Liu, Q.; Chen, Y.; Ma, Z.; Huang, L.; Zhou, W. Effects of organic fertilizer substitution under limited irrigation on soil carbon emissions and spring wheat yield. Plant Soil 2025, 490, 75–89. [Google Scholar]
  18. Chen, Q.; Xie, J.; Li, L.; Khan, K.S.; Wang, L.; Chang, L.; Du, C. Partial substitution of chemical fertilizer with organic fertilizer: A promising circular economy approach for improvement soil physical and chemical properties and sustainable crop yields. Front. Plant Sci. 2025, 16, 1565081. [Google Scholar] [CrossRef] [Scilit]
  19. Zhou, J.; Ma, H.; Ge, J.; Zamanian, K.; Wang, X.; Yang, Y.; Zeng, Z.; Zhao, B.; Hu, Y.; Zang, H. Oat/soybean intercropping reshapes the soil bacterial community for enhanced nutrient cycling. Land Degrad. Dev. 2024, 35, 5200–5290. [Google Scholar] [CrossRef] [Scilit]
  20. Liang, G.L.; Qin, Y.; Wei, X.X.; Liu, Y.C.; Liu, Y.; Liu, W.H. Evaluation on Productivity and Quality of Oat Strain ID in the Alpine Regions of the Qinghai-Tibetan Plateau. Acta Agrestia Sin. 2018, 26, 917–927. [Google Scholar]
  21. Jones, D.L.; Willett, V.B. Experimental evaluation of methods to quantify dissolved organic nitrogen (DON) and dissolved organic carbon (DOC) in soil. Soil Biol. Biochem. 2006, 38, 991–999. [Google Scholar] [CrossRef] [Scilit]
  22. Walkley, A.; Black, I.A. An examination of the Degtjareff method for determining soil organic matter, and a proposed modification of the chromic acid titration method. Soil Sci. 1934, 37, 29–38. [Google Scholar] [CrossRef] [Scilit]
  23. Vance, E.D.; Brookes, P.C.; Jenkinson, D.S. An extraction method for measuring soil microbial biomass C. Soil Biol. Biochem. 1987, 19, 703–707. [Google Scholar] [CrossRef] [Scilit]
  24. Lu, R.K. Analytical Methods of Soil and Agricultural Chemistry; China Agricultural Science and Technology Press: Beijing, China, 2000. [Google Scholar]
  25. Keeney, D.R.; Nelson, D.W. Nitrogen—Inorganic Forms. In Methods of Soil Analysis: Part 2 Chemical and Microbiological Properties; Page, A.L., Miller, R.H., Keeney, D.R., Eds.; American Society of Agronomy and Soil Science Society of America: Madison, WI, USA, 1982; pp. 643–698. [Google Scholar]
  26. Bremner, J.M.; Mulvaney, C.S. Nitrogen—Total. In Methods of Soil Analysis: Part 2 Chemical and Microbiological Properties; Page, A.L., Miller, R.H., Keeney, D.R., Eds.; American Society of Agronomy and Soil Science Society of America: Madison, WI, USA, 1982; pp. 595–624. [Google Scholar]
  27. Olsen, S.R.; Cole, C.V.; Watanabe, F.S.; Dean, L.A. Estimation of Available Phosphorus in Soils by Extraction with Sodium Bicarbonate; USDA Circular 939; U.S. Government Printing Office: Washington, DC, USA, 1954. [Google Scholar]
  28. Olsen, S.R.; Sommers, L.E. Phosphorus. In Methods of Soil Analysis: Part 2 Chemical and Microbiological Properties; Page, A.L., Miller, R.H., Keeney, D.R., Eds.; American Society of Agronomy and Soil Science Society of America: Madison, WI, USA, 1982; pp. 403–430. [Google Scholar]
  29. Miller, G.L. Use of dinitrosalicylic acid reagent for determination of reducing sugar. Anal. Chem. 1959, 31, 426–428. [Google Scholar] [CrossRef] [Scilit]
  30. Saiya-Cork, K.R.; Sinsabaugh, R.L.; Zak, D.R. The effects of long-term nitrogen deposition on extracellular enzyme activity in an Acer saccharum forest soil. Soil Biol. Biochem. 2002, 34, 1309–1315. [Google Scholar] [CrossRef] [Scilit]
  31. Eivazi, F.; Tabatabai, M.A. Glucosidases and galactosidases in soils. Soil Biol. Biochem. 1988, 20, 601–606. [Google Scholar] [CrossRef] [Scilit]
  32. Byrnes, J.E.K.; Gamfeldt, L.; Isbell, F.; Lefcheck, J.S.; Griffin, J.N.; Hector, A.; Duffy, J.E. Investigating the relationship between biodiversity and ecosystem multifunctionality: Challenges and solutions. Methods Ecol. Evol. 2014, 5, 111–124. [Google Scholar] [CrossRef] [Scilit]
  33. Hu, X.; Pan, P.Y. Effect of organic amendments on soil structure, microbial community and water transport in the Qinghai Lake watershed, North-Eastern Qinghai–Tibet Plateau. Arch. Agron. Soil Sci. 2024, 70, 1–17. [Google Scholar] [CrossRef] [Scilit]
  34. Yuan, P.; Guo, W.; Dong, J.; Liao, Y.; Wen, X.; Wang, W. Organic Substitution Increases Soil Organic Carbon Accumulation by Altering the Bacterial Carbon Metabolism in Dry Farmland. Land Degrad. Dev. 2025, 36, 5740–5752. [Google Scholar] [CrossRef] [Scilit]
  35. Wei, J.; Yang, S.; Wang, X.; Duan, J.; Mei, T.T.; Li, M.; Yang, S.; Wang, F. Effects of organic fertilizer replacing chemical fertilizer on organic carbon mineralization and active carbon fractions in yellow paddy soil of Guizhou Province. PLoS ONE 2025, 20, e0323801. [Google Scholar] [CrossRef] [Scilit]
  36. Wu, Z.; Chen, X.; Lu, X.; Zhu, Y.; Han, X.; Yan, J.; Yan, L.; Zou, W. Impact of combined organic amendments and chemical fertilizers on soil microbial limitations, soil quality, and soybean yield. Plant Soil 2025, 507, 317–334. [Google Scholar] [CrossRef] [Scilit]
  37. Teng, J.; Hou, R.; Dungait, J.A.; Zhou, G.; Kuzyakov, Y.; Zhang, J.; Tian, J.; Cui, Z.; Zhang, F.; Delgado-Baquerizo, M. Conservation agriculture improves soil health and sustains crop yields after long-term warming. Nat. Commun. 2024, 15, 8785. [Google Scholar] [CrossRef] [Scilit]
  38. Chang, X.; He, H.; Cheng, L.; Yang, X.; Li, S.; Yu, M.; Zhang, J.; Li, J. Combined Application of Chemical and Organic Fertilizers: Effects on Yield and Soil Nutrients in Spring Wheat under Drip Irrigation. Agronomy 2024, 14, 655. [Google Scholar] [CrossRef] [Scilit]
  39. Xiong, Y.B.; Yu, S.P.; Yang, Y.; Huang, L.; Yu, H.B.; Tang, L. Effects of different proportions of chemical fertilizer reduction combined with organic fertilizer supplements on organic carbon sequestration in tobacco-planting soil. Chin. J. Eco-Agric. 2024, 32, 262–272. [Google Scholar] [CrossRef]
  40. Jenkinson, D.S.; Parry, L.C. The nitrogen cycle in the Broadbalk wheat experiment: A model for the turnover of nitrogen through the soil microbial biomass. Soil Biol. Biochem. 1989, 21, 535–541. [Google Scholar] [CrossRef] [Scilit]
  41. Johnston, A.E.; Poulton, P.R.; Coleman, K. Soil organic matter: Its importance in sustainable agriculture and carbon dioxide fluxes. In Advances in Agonomy; Academic Press: Cambridge, MA, USA, 2009; Volume 101, pp. 1–57. [Google Scholar] [CrossRef] [Scilit]
  42. Song, D.; Dai, X.; Guo, T.; Cui, J.; Zhou, W.; Huang, S.; Zhang, S. Organic amendment regulates soil microbial biomass and activity in wheat–maize and wheat–soybean rotation systems. Agric. Ecosyst. Environ. 2022, 333, 107974. [Google Scholar] [CrossRef] [Scilit]
  43. Song, C.; Bottinelli, N.; Tran, T.M.; Ruiz, F.; Colombini, G.; Zi, Y.; Jouquet, P.; Rumpel, C. Land use determines the composition and stability of organic carbon in earthworm casts under tropical conditions. Soil Biol. Biochem. 2024, 190, 109291. [Google Scholar] [CrossRef] [Scilit]
  44. Xiong, M.; Jiang, W.; Zou, S.; Kang, D.; Yan, X. Microbial carbohydrate-active enzymes influence soil carbon by regulating plant- and fungal-derived biomass decomposition in plateau peat wetlands under differing water conditions. Front. Microbiol. 2023, 14, 1266016. [Google Scholar] [CrossRef] [Scilit]
  45. He, M.; Dai, S.; Zhu, Q.; Wang, W.; Chen, S.; Meng, L.; Dan, X.; Huang, X.; Cai, Z.; Zhang, J.; et al. Understanding the stimulation of microbial oxidation of organic N to nitrate in plant soil systems. Soil Biol. Biochem. 2024, 190, 109312. [Google Scholar] [CrossRef] [Scilit]
  46. Zhao, Z.; Baltar, F.; Herndl, G.J. Decoupling between the genetic potential and the metabolic regulation and expression in microbial organic matter cleavage across microbiomes. Microbiol. Spectr. 2024, 12, e03036-23. [Google Scholar] [CrossRef] [Scilit]
  47. Tian, Z.; Wang, F.; Liu, X. Cellulase-producing fungal taxa as predictors of soil carbon turnover and crop yield across agroecosystems. Environ. Microbiol. 2023, 25, 1247–1262. [Google Scholar]
  48. Hinsinger, P. Bioavailability of soil inorganic P in the rhizosphere as affected by root-induced chemical changes: A review. Plant Soil 2001, 237, 173–195. [Google Scholar] [CrossRef] [Scilit]
  49. Hu, G.Q.; Ma, X.X.; Li, X.H.; Wang, H. Evaluation of organic substitution based on vegetable yield and soil fertility. Environ. Pollut. Bioavailab. 2022, 34, 162–170. [Google Scholar] [CrossRef] [Scilit]
  50. Li, J.; Sang, C.; Yang, J.; Qu, L.; Xia, Z.; Sun, H.; Jiang, P.; Wang, X.; He, H.; Wang, C. Stoichiometric imbalance and microbial community regulate microbial elements use efficiencies under nitrogen addition. Soil Biol. Biochem. 2021, 156, 108207. [Google Scholar] [CrossRef] [Scilit]
  51. Jiang, Z.; Zhu, H.; Li, L.; Li, W.; Jiang, S.; Zhou, P.; Zhao, W.; Li, T. Intercomparison of multi-model ensemble-processing strategies within a consistent framework for climate projection in China. Sci. China Earth Sci. 2023, 66, 2125–2141. [Google Scholar]
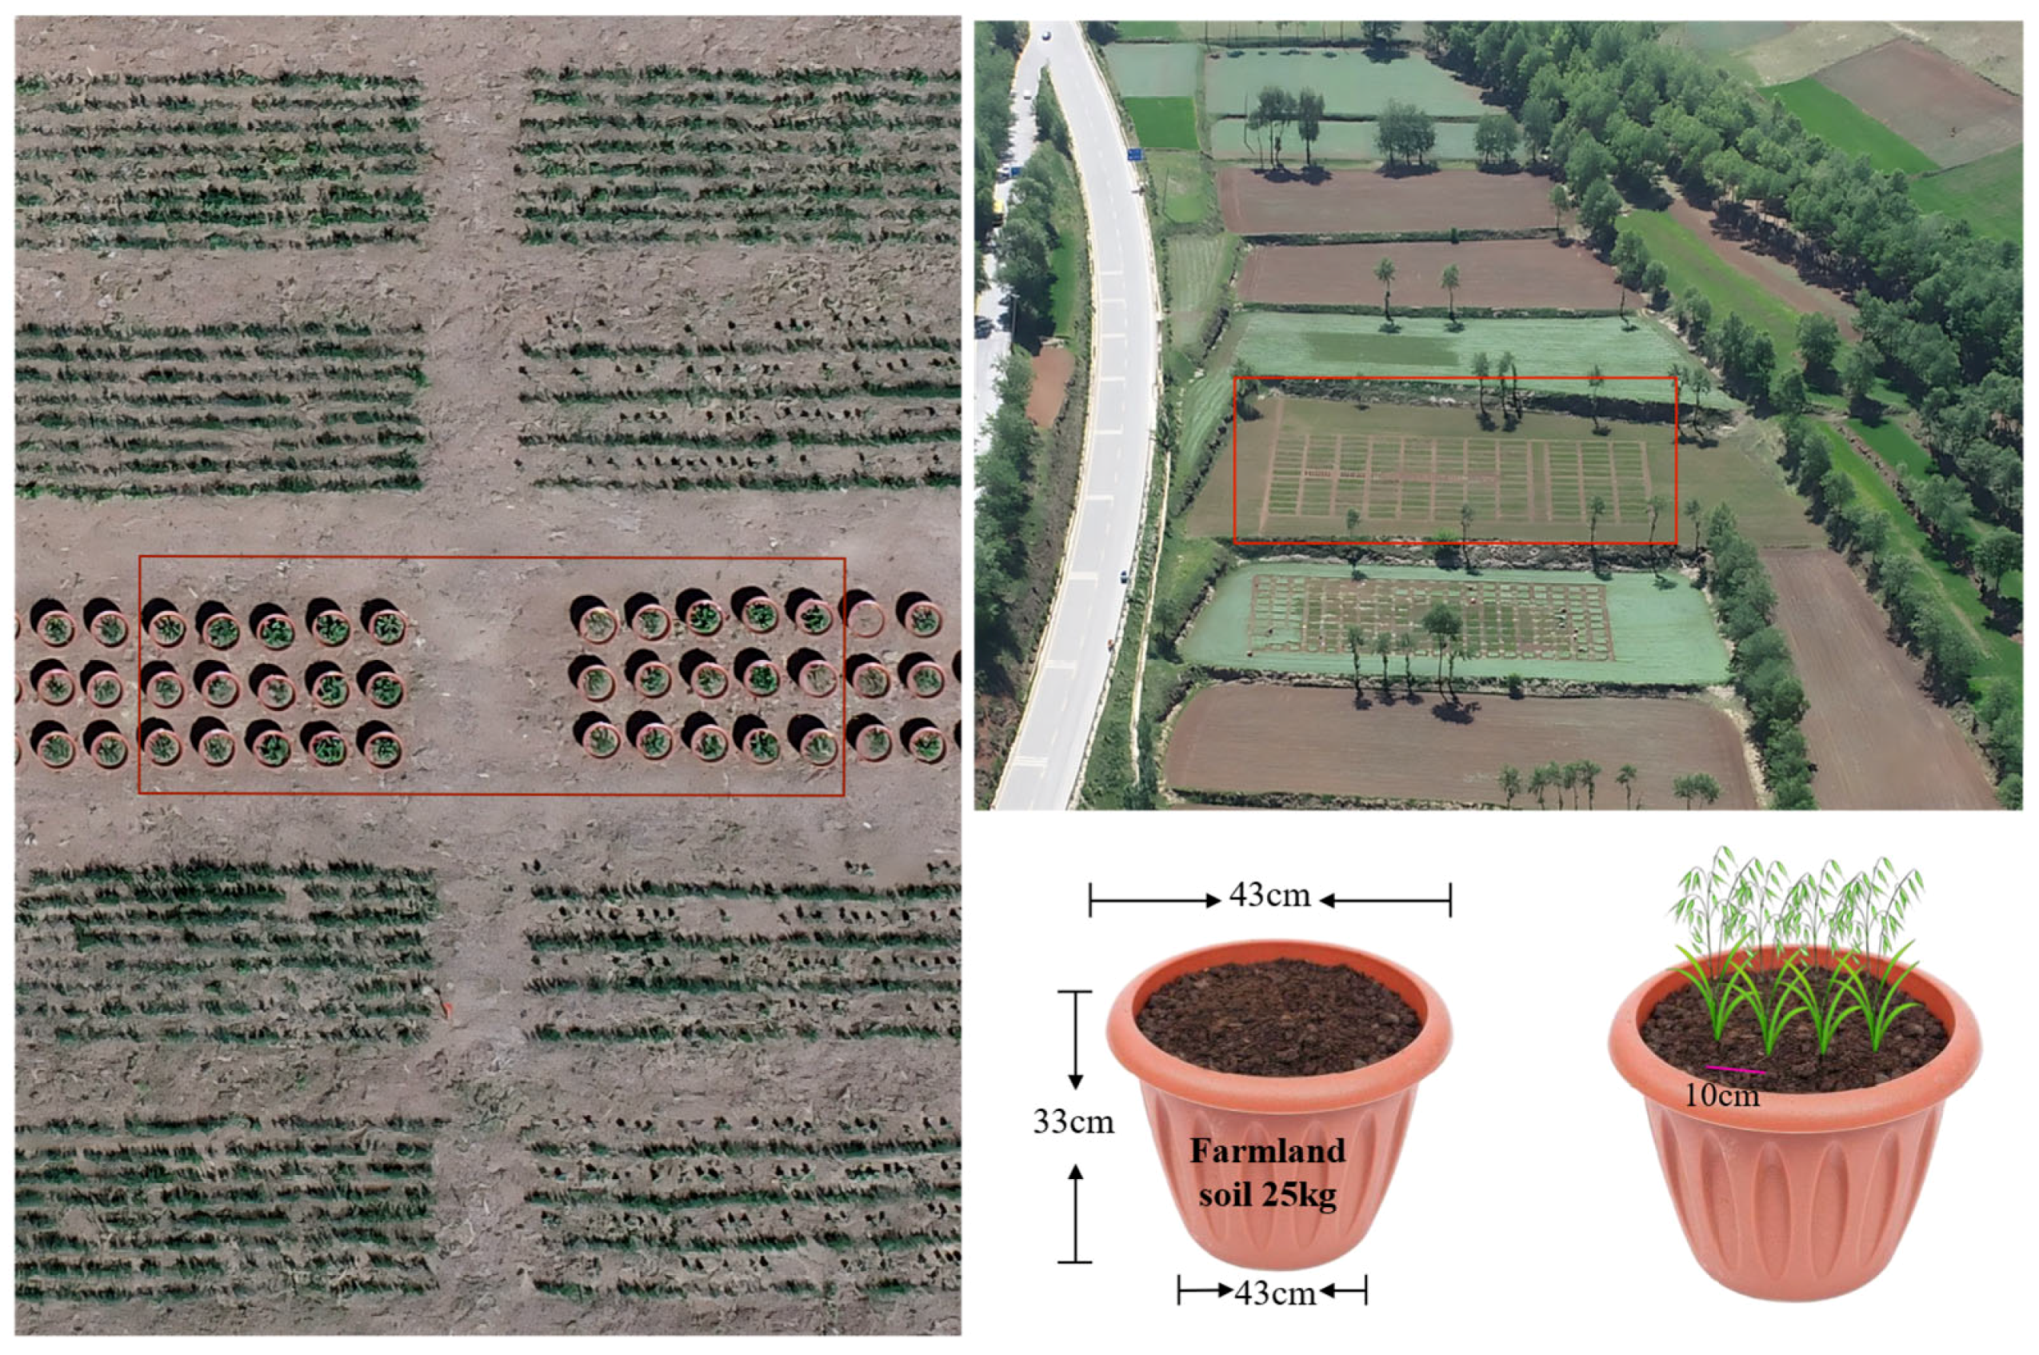
Figure 1. Schematic illustration of pot experiment layout. The red box indicates the experimental site and the potted plant sampling area.
Agronomy 16 00184 g001
Figure 2. Effects of different fertilization treatments on soil carbon components. (A) SOC: Soil Organic Carbon; (B) MBC: Microbial Biomass Carbon; (C) DOC: Dissolved Organic Carbon; (D) ROC: Readily Oxidizable Carbon.
Agronomy 16 00184 g002
Figure 3. Relative abundance of the top 10 bacterial phyla (A) and relative abundance of Pseudomonadota (B), Acidobacteriota (C), Planctomycetota (D), and Bacteroidota (E) in oat rhizosphere soil under different treatments. *, **, *** and **** indicate significant differences at p < 0.05, 0.01, 0.001 and 0.0001, respectively.
Agronomy 16 00184 g003
Figure 4. Relative abundance of the top 10 fungal phyla (A) and relative abundance of Ascomycota (B), Mortierellomycota (C), Basidiomycota (D), and Chytridiomycota (E) in oat rhizosphere soil under different treatments. *, **, *** and **** indicate significant differences at p < 0.05, 0.01, 0.001 and 0.0001, respectively.
Agronomy 16 00184 g004
Figure 5. Effects of different fertilization treatments on carbon-cycle-related enzyme activities in oat rhizosphere soil. *, **, *** and **** indicate significant differences at p < 0.05, 0.01, 0.001 and 0.0001, respectively.
Agronomy 16 00184 g005
Figure 6. Seed yield and yield components of oat under different fertilization treatments. Different lowercase letters indicate significant differences among treatments at the 0.05 probability level.
Agronomy 16 00184 g006
Figure 7. Canonical correspondence analysis (CCA) of dominant microbial phyla and environmental factors in oat rhizosphere soil under different fertilization treatments. The left panel represents the bacterial community, and the right panel represents the fungal community. Arrows indicate environmental factors or enzyme activities (AP: available phosphorus; AK: available potassium; DOC: dissolved organic carbon; ROC: readily oxidizable organic carbon; NO3-N: nitrate nitrogen; Sucrase: invertase; β-glucosidase: β-glucosidase). Different colored points represent different treatment groups. CCA1 and CCA2 are the ordination axes, with the values beside each axis indicating the percentage of community variation explained.
Agronomy 16 00184 g007
Figure 8. PLS-PM model results and total effect analysis reveal the direct and indirect pathways influencing seed yield. Values on the arrows represent standardized path coefficients (β), with significance levels indicated by symbols (* p < 0.05, ** p < 0.01, *** p < 0.001). Blue and pink lines denote significant paths, whereas grey lines indicate non-significant relationships. The overall model explained approximately 76% of the yield variation (R2 = 0.76) and exhibited good overall fit (GOF = 0.65).
Agronomy 16 00184 g008
Figure 9. Effects of fertilization treatments on EMF in oat rhizosphere soil. Combined evaluation of different treatments at the flowering stage, Combined evaluation of different treatments at the milk ripening stage.
Agronomy 16 00184 g009
Table 1. Fertilizer Application Rates for Each Treatment (g/pot).
TreatmentsUreaOrganic FertilizerSuperphosphatePotassium Sulfate
CK0000
T12.2502.501.02
T2024.5200
T31.5757.332.290.71
T40.914.721.310.41
Table 2. Effects of different treatments on carbon pool management.
TreatmentACPIAICPMI (%)
T111.610.911.26114.7
T210.461.041.14118.9
T38.430.991.08142.3
T49.320.971.19122.3
CK9.2111100
Note: CPI: carbon pool index; A: activity; AI: activity index; CMPI: carbon management index.
Disclaimer/Publisher’s Note: The statements, opinions and data contained in all publications are solely those of the individual author(s) and contributor(s) and not of MDPI and/or the editor(s). MDPI and/or the editor(s) disclaim responsibility for any injury to people or property resulting from any ideas, methods, instructions or products referred to in the content.