Article

Genome-Wide Association Analysis Identifies Agronomic Trait Loci in Quinoa

1
Department of Biology, College of Life Science, Qinghai Normal University, Xining 810008, China
2
Department of Agriculture and Forestry, College of Agriculture and Animal Husbandry, Qinghai University, Xining 810008, China
3
Key Laboratory of Adaptation and Evolution of Plateau Biota, Northwest Institute of Plateau Biology, Chinese Academy of Sciences, Xining 810008, China
4
Key Laboratory of Crop Molecular Breeding, Xining 810008, China
5
University of Chinese Academy of Sciences, Beijing 100049, China
*
Authors to whom correspondence should be addressed.
Agronomy 2026, 16(2), 175; https://doi.org/10.3390/agronomy16020175
Submission received: 8 December 2025 / Revised: 5 January 2026 / Accepted: 8 January 2026 / Published: 10 January 2026
(This article belongs to the Section Crop Breeding and Genetics)

Abstract

Understanding the genetic basis of agronomic traits in quinoa adapted to the Qinghai–Tibet Plateau is essential for developing high-yield cultivars, as conventional breeding is constrained by limited molecular tools. In this study, 300 cultivated accessions were evaluated for five quantitative traits, and whole-genome resequencing generated 3.69 million high-quality SNPs. Population structure analysis and genome-wide association study (GWAS) were conducted, with integration of seed developmental transcriptomes to refine trait-associated loci. A highly admixed genetic background (K = 7) was revealed, and 11 significant QTLs across seven chromosomes were identified, involving genes related to metabolism, transport, and cell-wall formation. Among these, CesA4 (CQ042210) showed a strong association with thousand grain weight (TGW) and a distinct expression maximum at the early seed-filling stage. These results provide a genomic framework for understanding trait variation in plateau-adapted quinoa and highlight promising targets for marker-assisted breeding.

1. Introduction

Quinoa (Chenopodium quinoa Willd.) is an annual dicotyledonous species belonging to the family Amaranthaceae [1]. Because its seeds contain high-quality proteins, balanced essential amino acids, and abundant vitamins, minerals, and dietary fiber, quinoa has been widely recognized as a “superfood” [2]. Its exceptional nutritional composition is considered highly valuable for addressing global challenges related to food security and human nutrition [3].
Quinoa was originally domesticated in the mid- to high-altitude regions of the Andes Mountains in South America [4]. During its long evolutionary history, the species developed remarkable tolerance to multiple abiotic stresses, including low temperature, drought, and salinity, and has therefore been regarded as a model crop for adaptation to harsh environments [5]. The Qinghai–Tibet Plateau in China shares strong ecological similarities with quinoa’s native Andean habitats, characterized by high altitude and cool climatic conditions [6]. Such environmental parallels have provided favorable conditions for the successful introduction and cultivation of quinoa in this region [7]. Since its initial introduction into Haixi Prefecture, Qinghai Province, in 2014, quinoa cultivation has expanded rapidly, and the total planting area in Qinghai has now exceeded 2000 hectares, establishing quinoa as an emerging characteristic crop in the region [8].
Despite the rapid expansion of quinoa cultivation, breeding efforts in Qinghai have largely relied on conventional phenotypic selection and hybridization techniques [9]. Although these approaches have contributed to early improvement, they are constrained by long breeding cycles and limited precision, mainly due to the lack of molecular tools [10]. The genetic basis underlying key agronomic traits in quinoa varieties adapted to the unique environments of the Qinghai–Tibet Plateau remains poorly understood, and the quantitative trait loci (QTLs) associated with these traits have not yet been systematically identified. This knowledge gap has become a major obstacle to the application of marker-assisted selection and precision breeding in plateau-adapted quinoa [11].
To promote the genetic improvement of quinoa cultivated on the Qinghai–Tibet Plateau, a collection of 300 accessions widely grown across the region was assembled. Five key agronomic traits, including plant height (PH), main spike length (MSL), stem diameter (SD), effective tiller number (ET), and thousand grain weight (TGW), were evaluated under field conditions, and genome-wide association studies (GWAS) based on high-quality whole-genome resequencing data were conducted to elucidate the genetic architecture underlying important agronomic traits in quinoa [12].

2. Materials and Methods

2.1. Plant Materials and Phenotypic Evaluation

A total of 300 quinoa (Chenopodium quinoa) accessions, which are the main locally adapted varieties collected from major planting ecological regions in Qinghai Province (e.g., Haixi Prefecture, Hainan Prefecture, Haibei Prefecture), covering typical growing environments at an altitude of 2800–3200 m, were used in this study. The accessions were cultivated in Gahai Town, Delingha City, Qinghai Province, China (average altitude 2870 m; mean annual temperature 3.8 °C).
Field experiments were conducted in 2024 at the experimental station using a randomized complete block design with three biological replicates. Seeds were sown in early May and harvested in October. Each accession was planted in a single row 2 m in length and 20 cm in width, with approximately 15 seeds randomly distributed per row to ensure sufficient plant density for trait measurement. Plots were spaced 1 m apart to eliminate soil heterogeneity interference, and standard field management practices were applied throughout the growing period.
Phenotypic data collection was standardized and performed in September, corresponding to the late flowering to early grain-filling stage. At this stage, 5 plants per accession were measured for each replicate. Plant height (PH) was measured as the vertical distance from the soil surface to the natural growth apex of the plant; main spike length (MSL) as the actual length from the base to the tip of the main inflorescence; stem diameter (SD) as the diameter at 10 cm above the base using a vernier caliper; and effective tiller number (ET) as the count of tillers with a seed-setting rate ≥ 50%. After harvest, seeds were naturally air-dried, and thousand grain weight (TGW) was determined by weighing three subsamples of 1000 fully matured and cleaned seeds using an electronic balance, with the average of the three subsamples (across three replicates) considered as the final phenotypic value for each trait.
All quinoa accessions used in this study are legally cultivated varieties, and the field experiments comply with relevant agricultural research ethics in China and the Convention on Biological Diversity.

2.2. DNA Extraction and High-Throughput Sequencing

Fresh young leaves were collected from each accession for genomic DNA extraction using the modified CTAB method. DNA concentration and purity were determined by NanoDrop spectrophotometry (Thermo Fisher Scientific, Wilmington, DE, USA) and 1% agarose gel electrophoresis, ensuring OD260/280 ratios between 1.8 and 2.0. Qualified DNA samples were used for library construction and sequenced at BGI-Shenzhen on the DNBSEQ-T7 platform (MGI Tech Co., Ltd., Shenzhen, China), generating paired-end reads of 150 bp in length.

2.3. Read Alignment and Variant Detection

Sequencing reads were aligned to the C. quinoa reference genome (Dryad: doi:10.5061/dryad.kwh70rz70) [13] using BWA-MEM v0.7.17 [14] with the parameters -k 25 -Y. The resulting alignments were sorted and indexed with SAMtools v1.9 [15]. Duplicate reads were marked and removed using Picard tools v2.27.5 [16]. Variant discovery, including single-nucleotide polymorphisms (SNPs) and small insertions/deletions (indels), was performed using GATK4 v4.0 [17] following the Best Practices workflow.
Raw variants were filtered with stringent thresholds (QD < 2.0, QUAL < 30.0, SOR > 3.0, FS > 60.0, MQ < 40.0, MQRankSum < −12.5, and ReadPosRankSum < −8.0), and clusters of three SNPs within a 10 bp window were identified using VariantFiltration –cluster 3 –window 10 and subsequently removed via SelectVariants.
To ensure high-confidence genotyping, VCFtools v0.1.16 [18] was used to further refine the dataset with the parameters: --minDP 3 --maxDP 2000 --minGQ 10 --minQ 30 --min-meanDP 3 --max-missing 0.5 --maf 0.05 --min-alleles 2 --max-alleles 2.
Subsequently, the filtered high-quality SNPs were utilized for downstream analyses. Linkage disequilibrium (LD) decay was calculated using PopLDdecay v3.40 [19], population genetic structure was inferred using ADMIXTURE v1.3.0 [20], and Phylo v1.2.3 [21] was employed to construct the phylogenetic tree.

2.4. Genome-Wide Association Study

Prior to association analysis, all phenotypic traits were examined for normality using the Shapiro–Wilk test implemented in the R v4.4.1 package “stats”. The genome-wide association study (GWAS) was conducted using GEMMA v0.98.3 [22], which implements a linear mixed model (LMM) to control for population structure and relatedness. The kinship matrix (Figure S1) was estimated directly from the filtered SNP dataset using GEMMA’s -gk 1 option, and the resulting relationship matrix was used as a random effect in the LMM framework. To strictly control for population stratification, the first 10 principal components (PCs) were calculated. We tested models with varying numbers of PCs (1–5) and selected the first three PCs as covariates based on the optimal genomic inflation factor (λ), ensuring that confounding effects were effectively minimized while retaining true biological signals. Genomic associations were declared significant at a threshold of −log10P ≥ 5.5, corresponding to a Bonferroni-corrected significance level of 0.1/Meff, where Meff is the effective number of independent markers estimated using the GEC v0.1.2 software [23]. SNPs located within ±100 kb (≈200 kb LD window) were considered to represent the same association region. Subsequently, genes within these identified regions were retrieved and functionally annotated using InterProScan v5.66-97.0 [24] to prioritize potential causal loci.

2.5. Transcriptome Data Processing and Expression Analysis

Seed developmental transcriptome data used in this study were obtained from publicly available RNA-seq datasets deposited in the Genome Sequence Archive (GSA) under accession CRA016779 [25]. Four seed developmental stages (S1–S4) were included. Raw sequencing reads were first subjected to quality control using fastp v0.23.2, where adaptor sequences, low-quality bases, and short reads were removed with default parameters. Clean reads were then aligned to the C. quinoa reference genome using HISAT2 v2.2.1 [26]. Aligned reads were sorted and indexed with SAMtools v1.9, and gene-level read counts were quantified using FeatureCounts v2.0.1 [27] under stranded mode according to the library protocol. Gene expression levels were normalized as fragments per kilobase per million reads (FPKM).
The rationality of integrating transcriptome data with GWAS results is as follows: (1) The transcriptome data were derived from four key stages of quinoa seed development, and thousand grain weight (TGW) is the core yield trait in this study, with the seed development process directly determining grain size and weight; (2) The QTL intervals identified by GWAS usually contain thousands of genes, and through the expression profile data of seed development stages, genes with high expression or differential expression during this period can be screened out, effectively narrowing the range of candidate genes, excluding genes unrelated to the target trait, and improving the accuracy of candidate gene identification.

3. Results

3.1. Phenotypic Evaluation

Five agronomic traits, including plant height (PH), main spike length (MSL), stem diameter (SD), effective tillers (ET), and thousand grain weight (TGW), were measured across the 300 quinoa accessions to evaluate phenotypic variation. Substantial diversity was observed among accessions for all traits. Plant height ranged from 65.40 cm to 189.10 cm, with an average of 120.96 cm and a standard deviation of 23.13 cm. Main spike length varied from 4.50 cm to 56.40 cm (mean = 28.71 cm, SD = 8.83 cm), while stem diameter ranged from 6.07 mm to 26.00 mm (mean = 13.88 mm, SD = 3.88 mm). Effective tiller number ranged from 6.00 to 34.00 (mean = 19.15, SD = 5.89), and thousand grain weight ranged from 0.62 g to 4.54 g (mean = 2.68 g, SD = 0.63) (Table 1). To further verify the accuracy of phenotypic evaluation, the best linear unbiased estimates (BLUEs) were calculated using a linear mixed model. Pearson correlation analysis revealed a high consistency between the BLUE values and the arithmetic means for all traits (r = 0.854–0.935, Figure S2), confirming the robustness of the phenotypic data used for subsequent analyses.
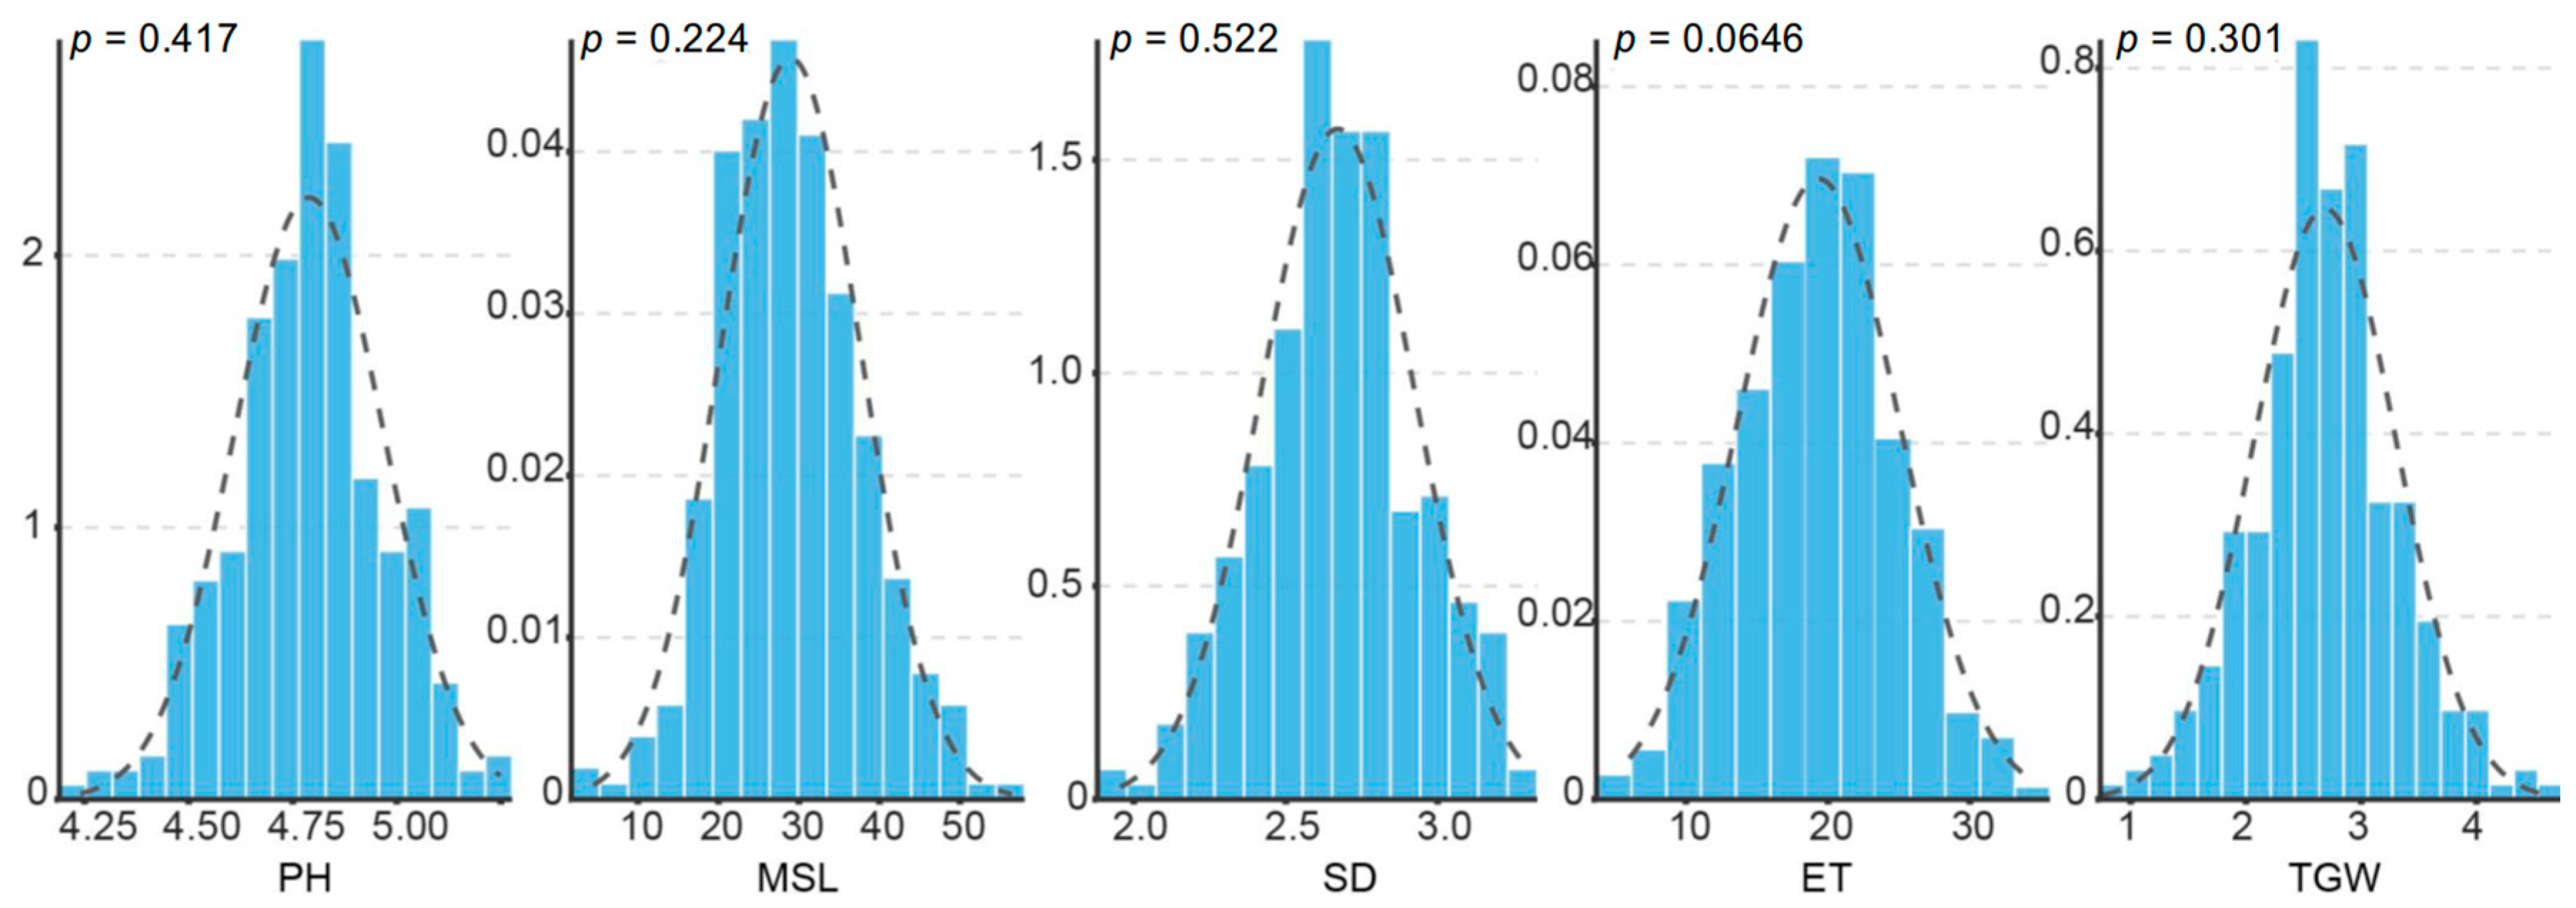
Pairwise correlations among the five traits showed significant positive associations between most morphological parameters. Notably, PH was moderately correlated with MSL (r = 0.45) and SD (r = 0.47), whereas ET exhibited weak positive correlations with PH (r = 0.30) and MSL (r = 0.44) (Table 1). Besides, all five traits approximately followed a normal distribution, with p-values ranging from 0.0646 to 0.417 (Figure 1). This distribution pattern supports the quantitative nature of these agronomic traits.

3.2. Population Sequencing and SNP Analysis

A total of 2.73 Tb of raw whole-genome resequencing data were generated from 300 cultivated quinoa accessions. After QC filtering, the amount of clean data per accession averaged 9.10 Gb (7.00× coverage), ranging from 7.12 Gb (5.48× coverage) to 17.20 Gb (13.23× coverage), based on the estimated quinoa reference genome size of 1.3 Gb. The high sequencing quality, reflected by an average Q30 value of 95.26%, provided a robust foundation for subsequent population structure analysis, SNP discovery, and genome-wide association study.
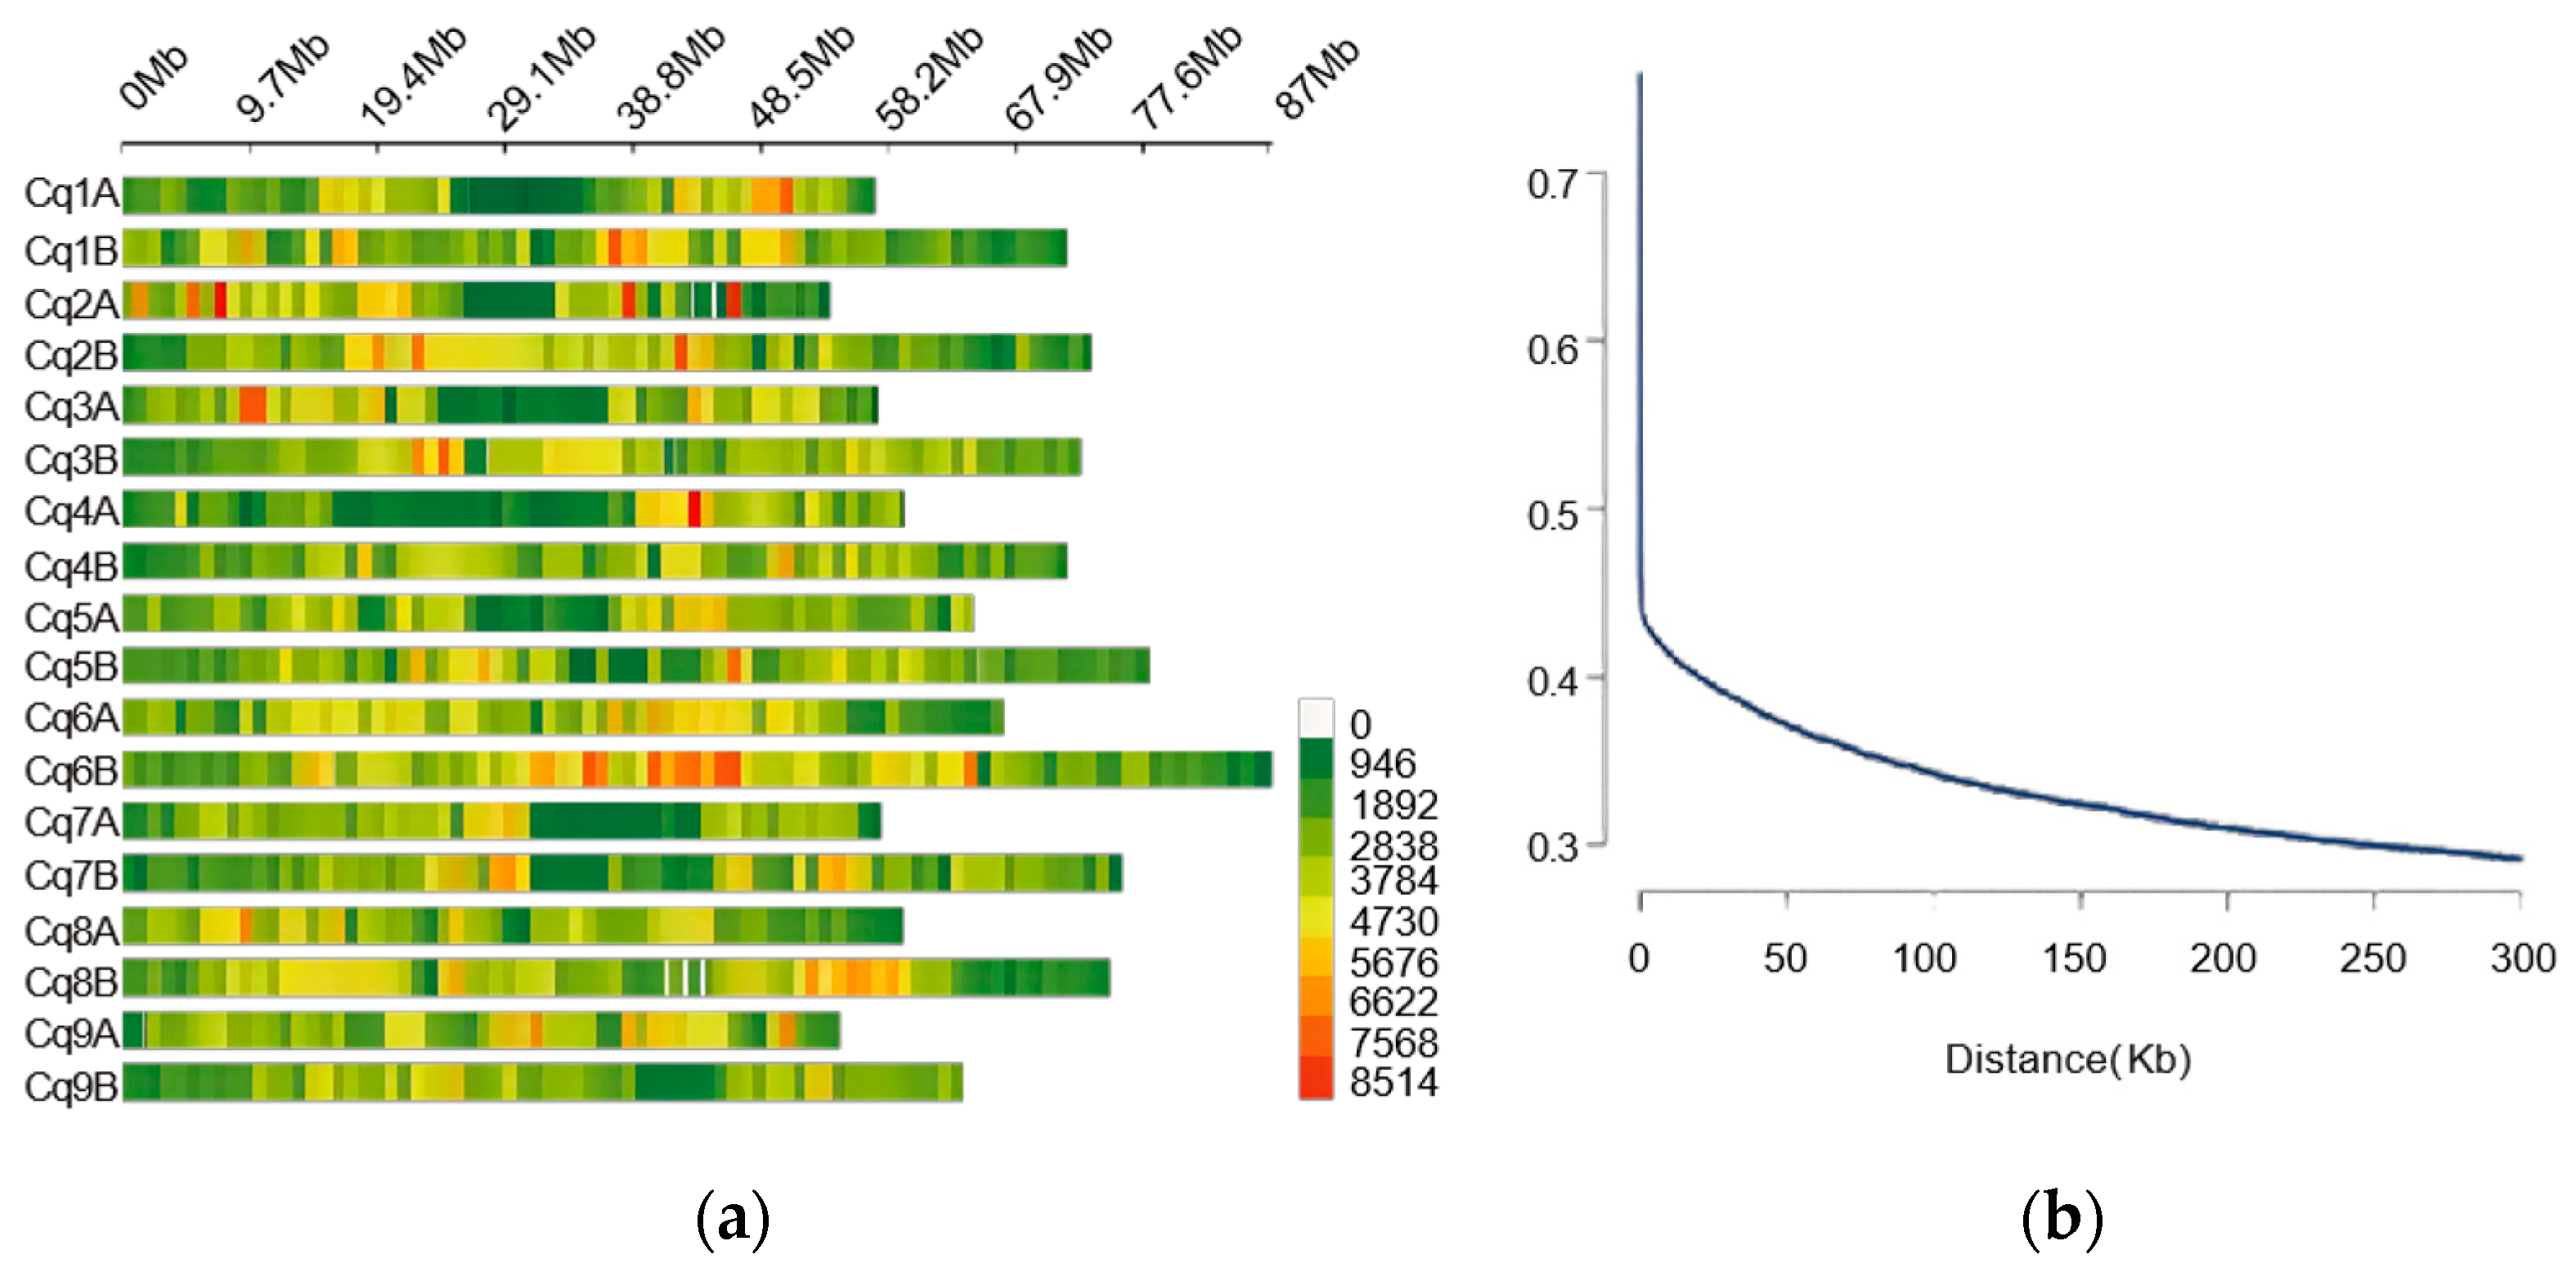
A total of 3,685,910 high-quality SNPs were identified across the quinoa genome, which has an estimated size of 1.34 Gb. This corresponds to an average SNP density of approximately 2744.5 SNPs per Mb, providing a sufficiently dense marker set for reliable genome-wide association analysis (Figure 2a). Besides, linkage disequilibrium (LD) decay analysis revealed a rapid decline of r2 with increasing physical distance between SNPs, indicating a relatively high recombination frequency within the quinoa population. The LD value decreased sharply from over 0.70 at short distances to below 0.30 within approximately 200 kb (Figure 2b).

3.3. Population Structure and Genetic Diversity

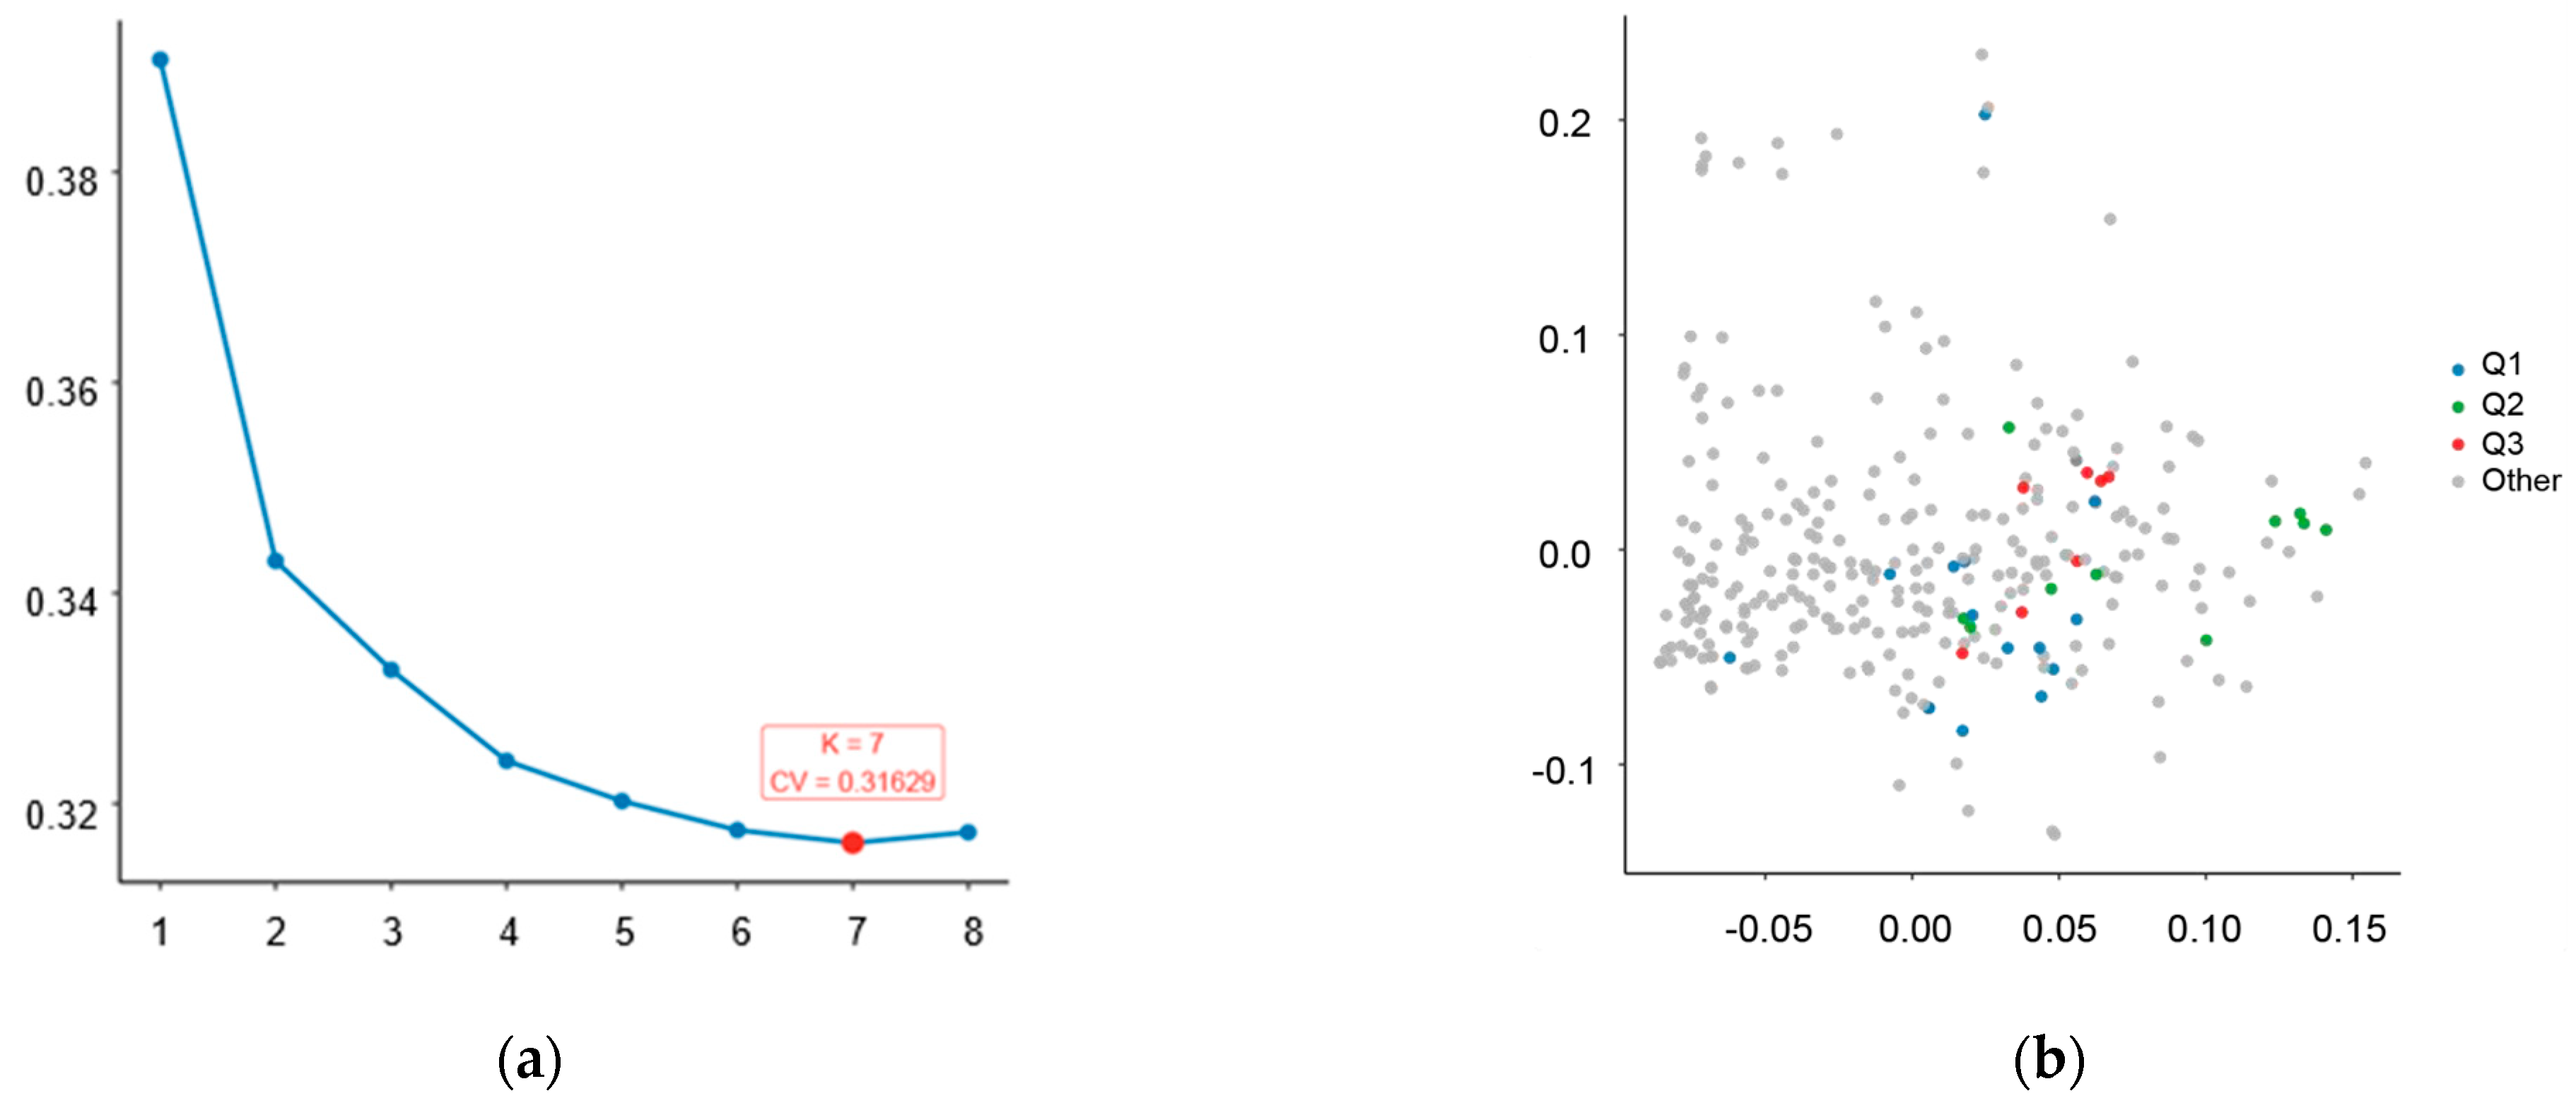
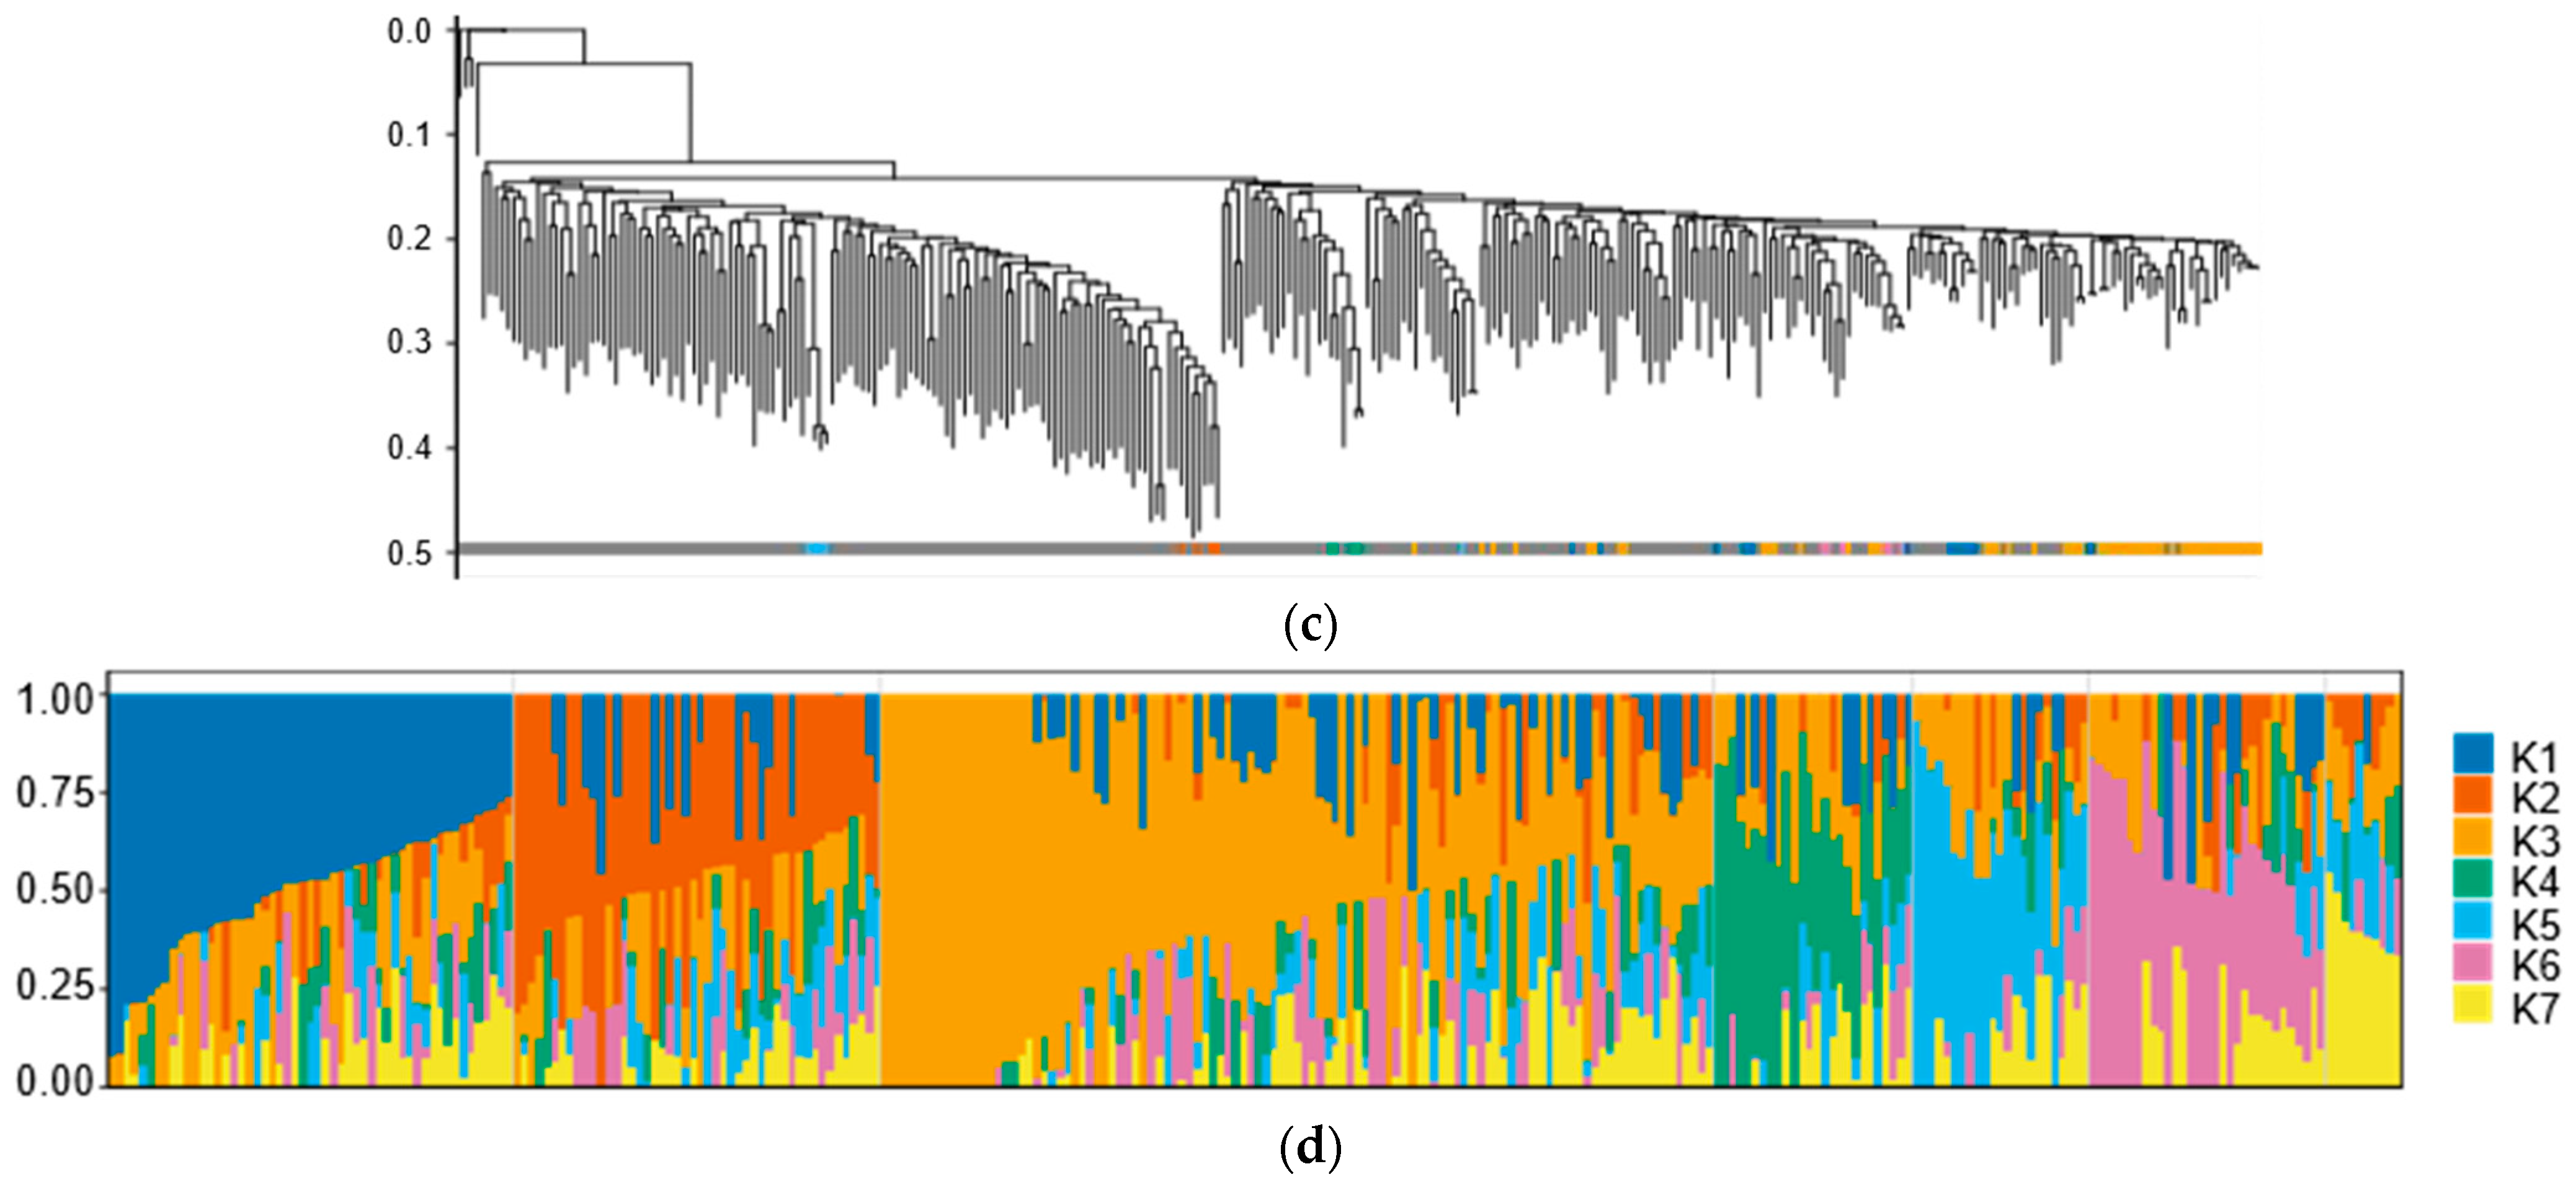
ADMIXTURE analysis indicated that the optimal number of genetic clusters was K = 7 (Figure 3a). PCA showed that the first two principal components (PC1 and PC2) explained 60.29% and 20.98% of the total genetic variance, respectively (Figure 3b). The neighbor-joining (NJ) phylogenetic tree constructed from genome-wide SNPs revealed complex genetic relationships among the 300 cultivated quinoa accessions. Most accessions did not form sharply separated clusters but were intermingled across branches, indicating a high degree of genetic admixture within the population (Figure 3c). Consistent with this, the ADMIXTURE analysis showed that most accessions contained genomic components from multiple ancestral groups. Only the orange K3 cluster exhibited a relatively distinct genetic composition, suggesting that this subgroup may share a more homogeneous genetic background compared with the other clusters (Figure 3d).

3.4. Genome-Wide Association Analyses of Agronomic Traits

The significance threshold of the Manhattan plot was set to −log10P ≥ 5.5, which was calculated based on the Bonferroni correction method (0.1/Meff, where Meff is the effective number of independent markers estimated by GEC software) to control the false positive rate at the genome-wide level.
GWAS identified 11 significant QTLs associated with the five agronomic traits under a Bonferroni-corrected threshold of −log10P ≥ 5.5. The significant loci were distributed across seven chromosomes (Figure S3), with several trait-associated peaks co-localized within the 200 kb LD window, indicating potential pleiotropic regions.
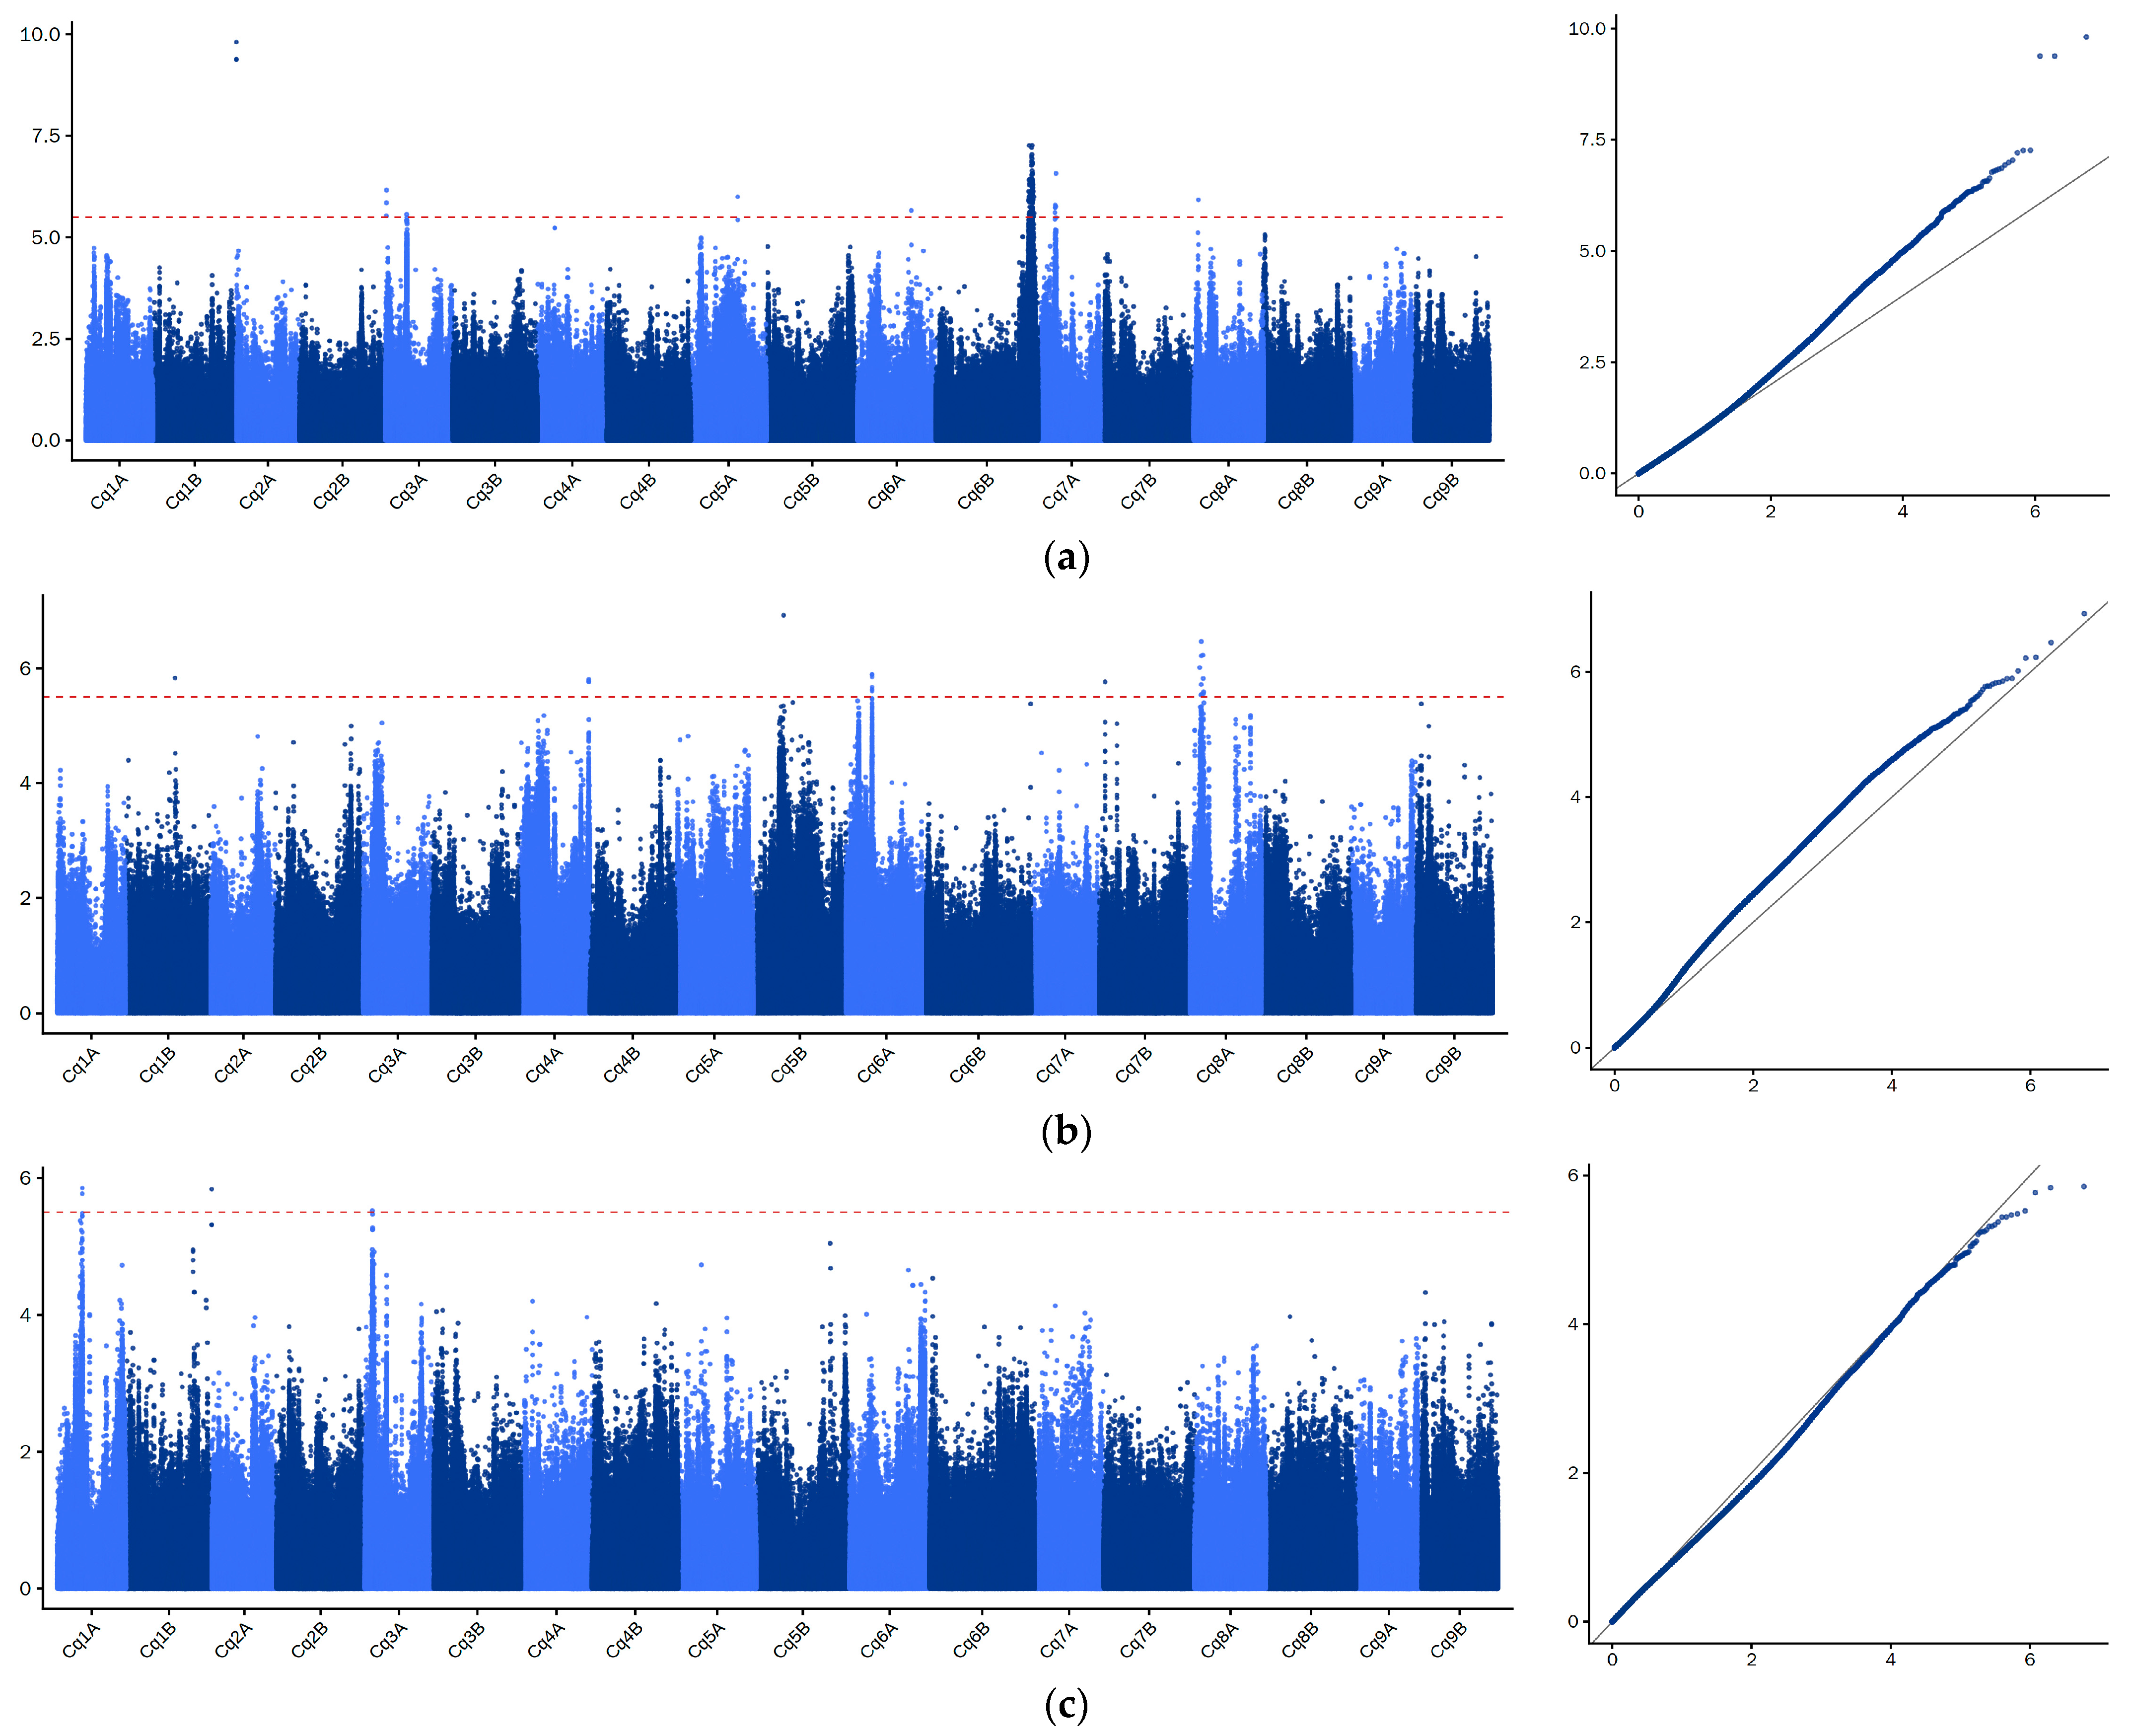
For PH, three loci were detected on Cq6B, Cq7A, and Cq8A, with the strongest signal observed on Cq6B (79.37–80.88 Mb) encompassing CQ002773 (ACLY, ATP-citrate lyase). Additional associations on Cq7A and Cq8A corresponded to CQ042304 (AP2/ERF, AP2/ERF transcription factor family protein) and CQ042196 (SBT1.2, Subtilisin-like serine protease 1.2), respectively (Figure 4a, Table 2).
MSL was linked to two loci on Cq6A (21.29–21.78 Mb) and Cq8A (8.74–9.50 Mb), containing CQ026585 (DHL, Dehydrin-like protein) and CQ038724 (ChlI-like, chlorophyll biosynthesis magnesium-chelatase subunit I-like protein) (Figure 4b, Table 2).
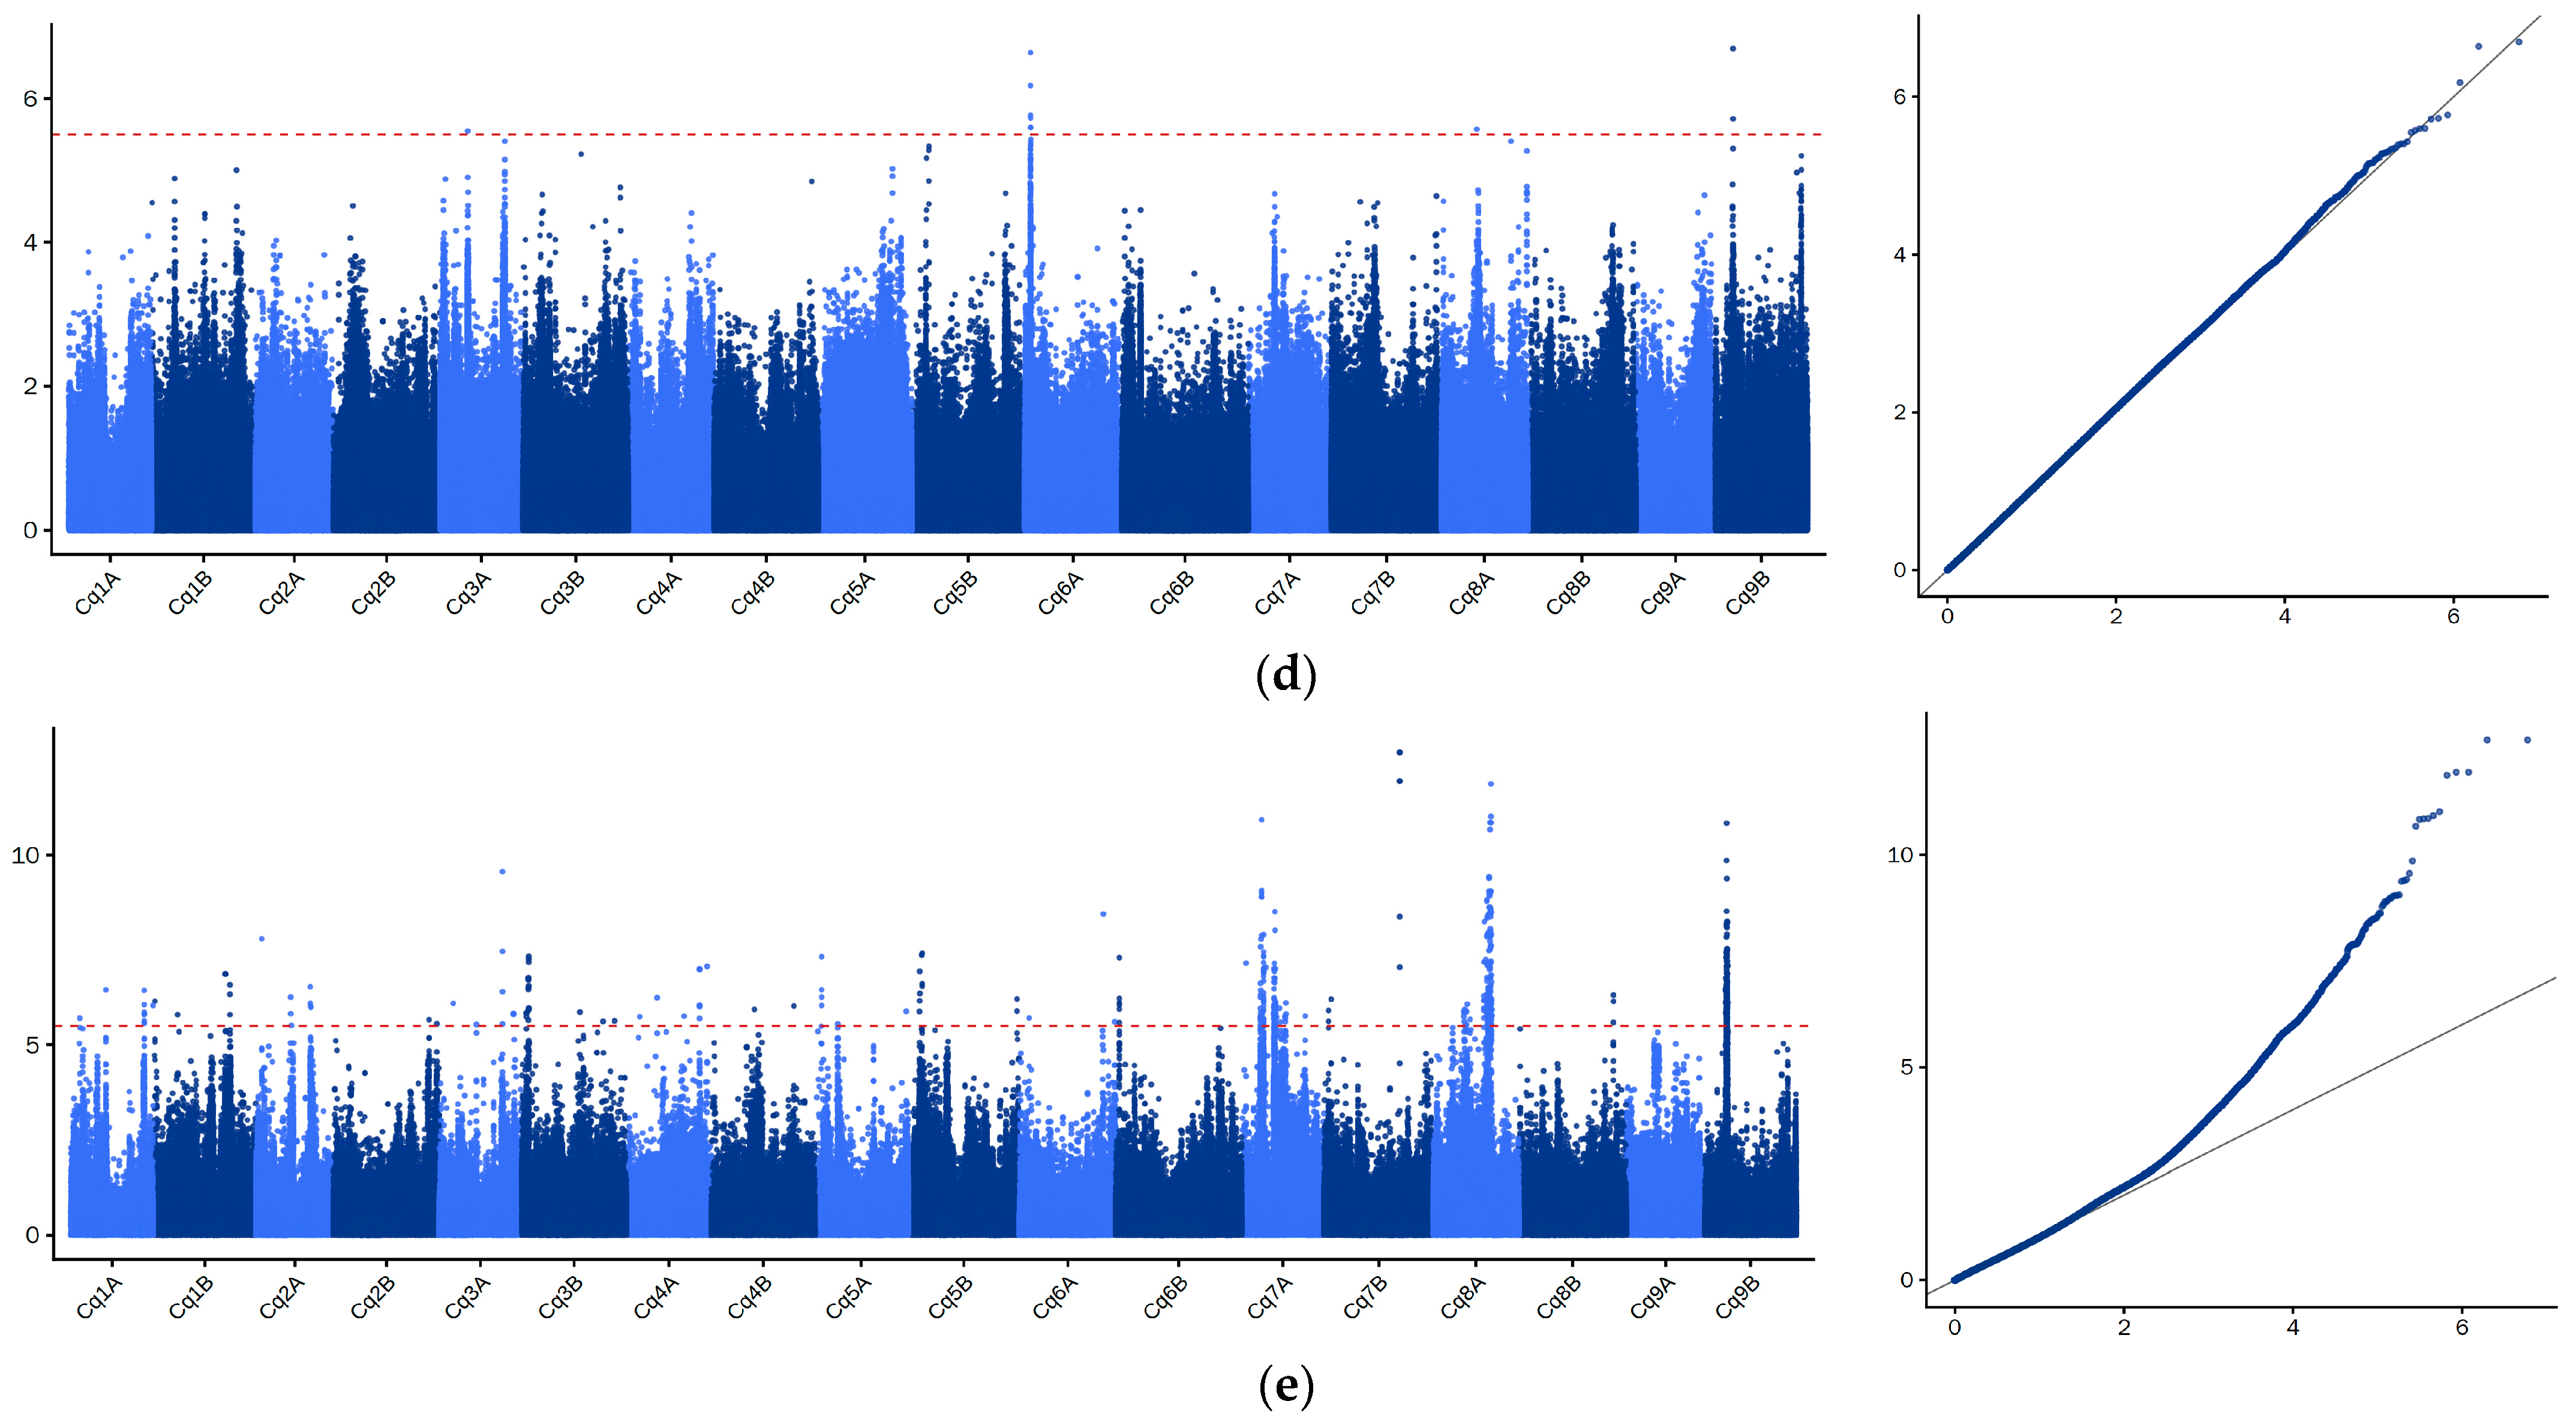
A single locus for SD was identified on Cq1A (20.53–20.98 Mb) near CQ048718 (DnaJ, DnaJ/Hsp40-like molecular chaperone protein), while ET showed one significant signal on Cq9B (12.23–12.65 Mb) associated with CQ033515 (F-box, F-box protein) (Figure 4c,d, Table 2).
Multiple signals for TGW clustered on Cq7A (13.10–14.25 Mb; 13.9–14.3 Mb, 23.05–23.60 Mb), harboring CQ042210 (CesA4, cellulose synthase A catalytic subunit 4), CQ042278 (eIF6-2, eukaryotic translation initiation factor 6-2), and CQ042692 (WAT1, Walls Are Thin 1). In addition, one TGW-associated locus was detected on Cq8A (36.97–37.84 Mb) corresponding to CQ039526 (NRT1, nitrate transporter 1). Another locus was identified on Cq9B (14.89–15.89 Mb) harboring CQ033662 (UAXS, UDP-apiose/UDP-xylose synthase) (Figure 4e, Table 2).
Collectively, these loci delineate several genomic regions underlying quinoa architecture and yield variation, notably hotspots on Cq7A, Cq8A, and Cq9B, which harbor multiple functionally annotated genes related to metabolism, transport, and transcriptional regulation.

3.5. Seed Developmental Transcriptome Analysis Within TGW-Associated QTL Regions

Although GWAS effectively identified significant genomic regions associated with these agronomic traits, the detected QTL intervals (defined by LD decay) often encompass multiple genes, making it challenging to pinpoint the specific causal loci solely based on genomic association. Among the evaluated traits, Thousand Grain Weight (TGW) is a decisive component of yield that is directly established during the grain-filling process. To overcome the resolution limitation of GWAS and further prioritize biologically relevant candidates, we adopted a multi-omics strategy by integrating the GWAS results with transcriptome profiling. Specifically, we focused on expression patterns during four critical stages of seed development to refine the candidate genes underlying TGW.
A total of 121 genes were retrieved from TGW-associated intervals, among which 49 genes passed the FPKM filter for downstream analysis (Figure S4). The RNA-seq dataset showed high sequencing quality, with an average of 23.14 million clean reads per library and an average mapping rate of 96.60%, ensuring reliable expression quantification.
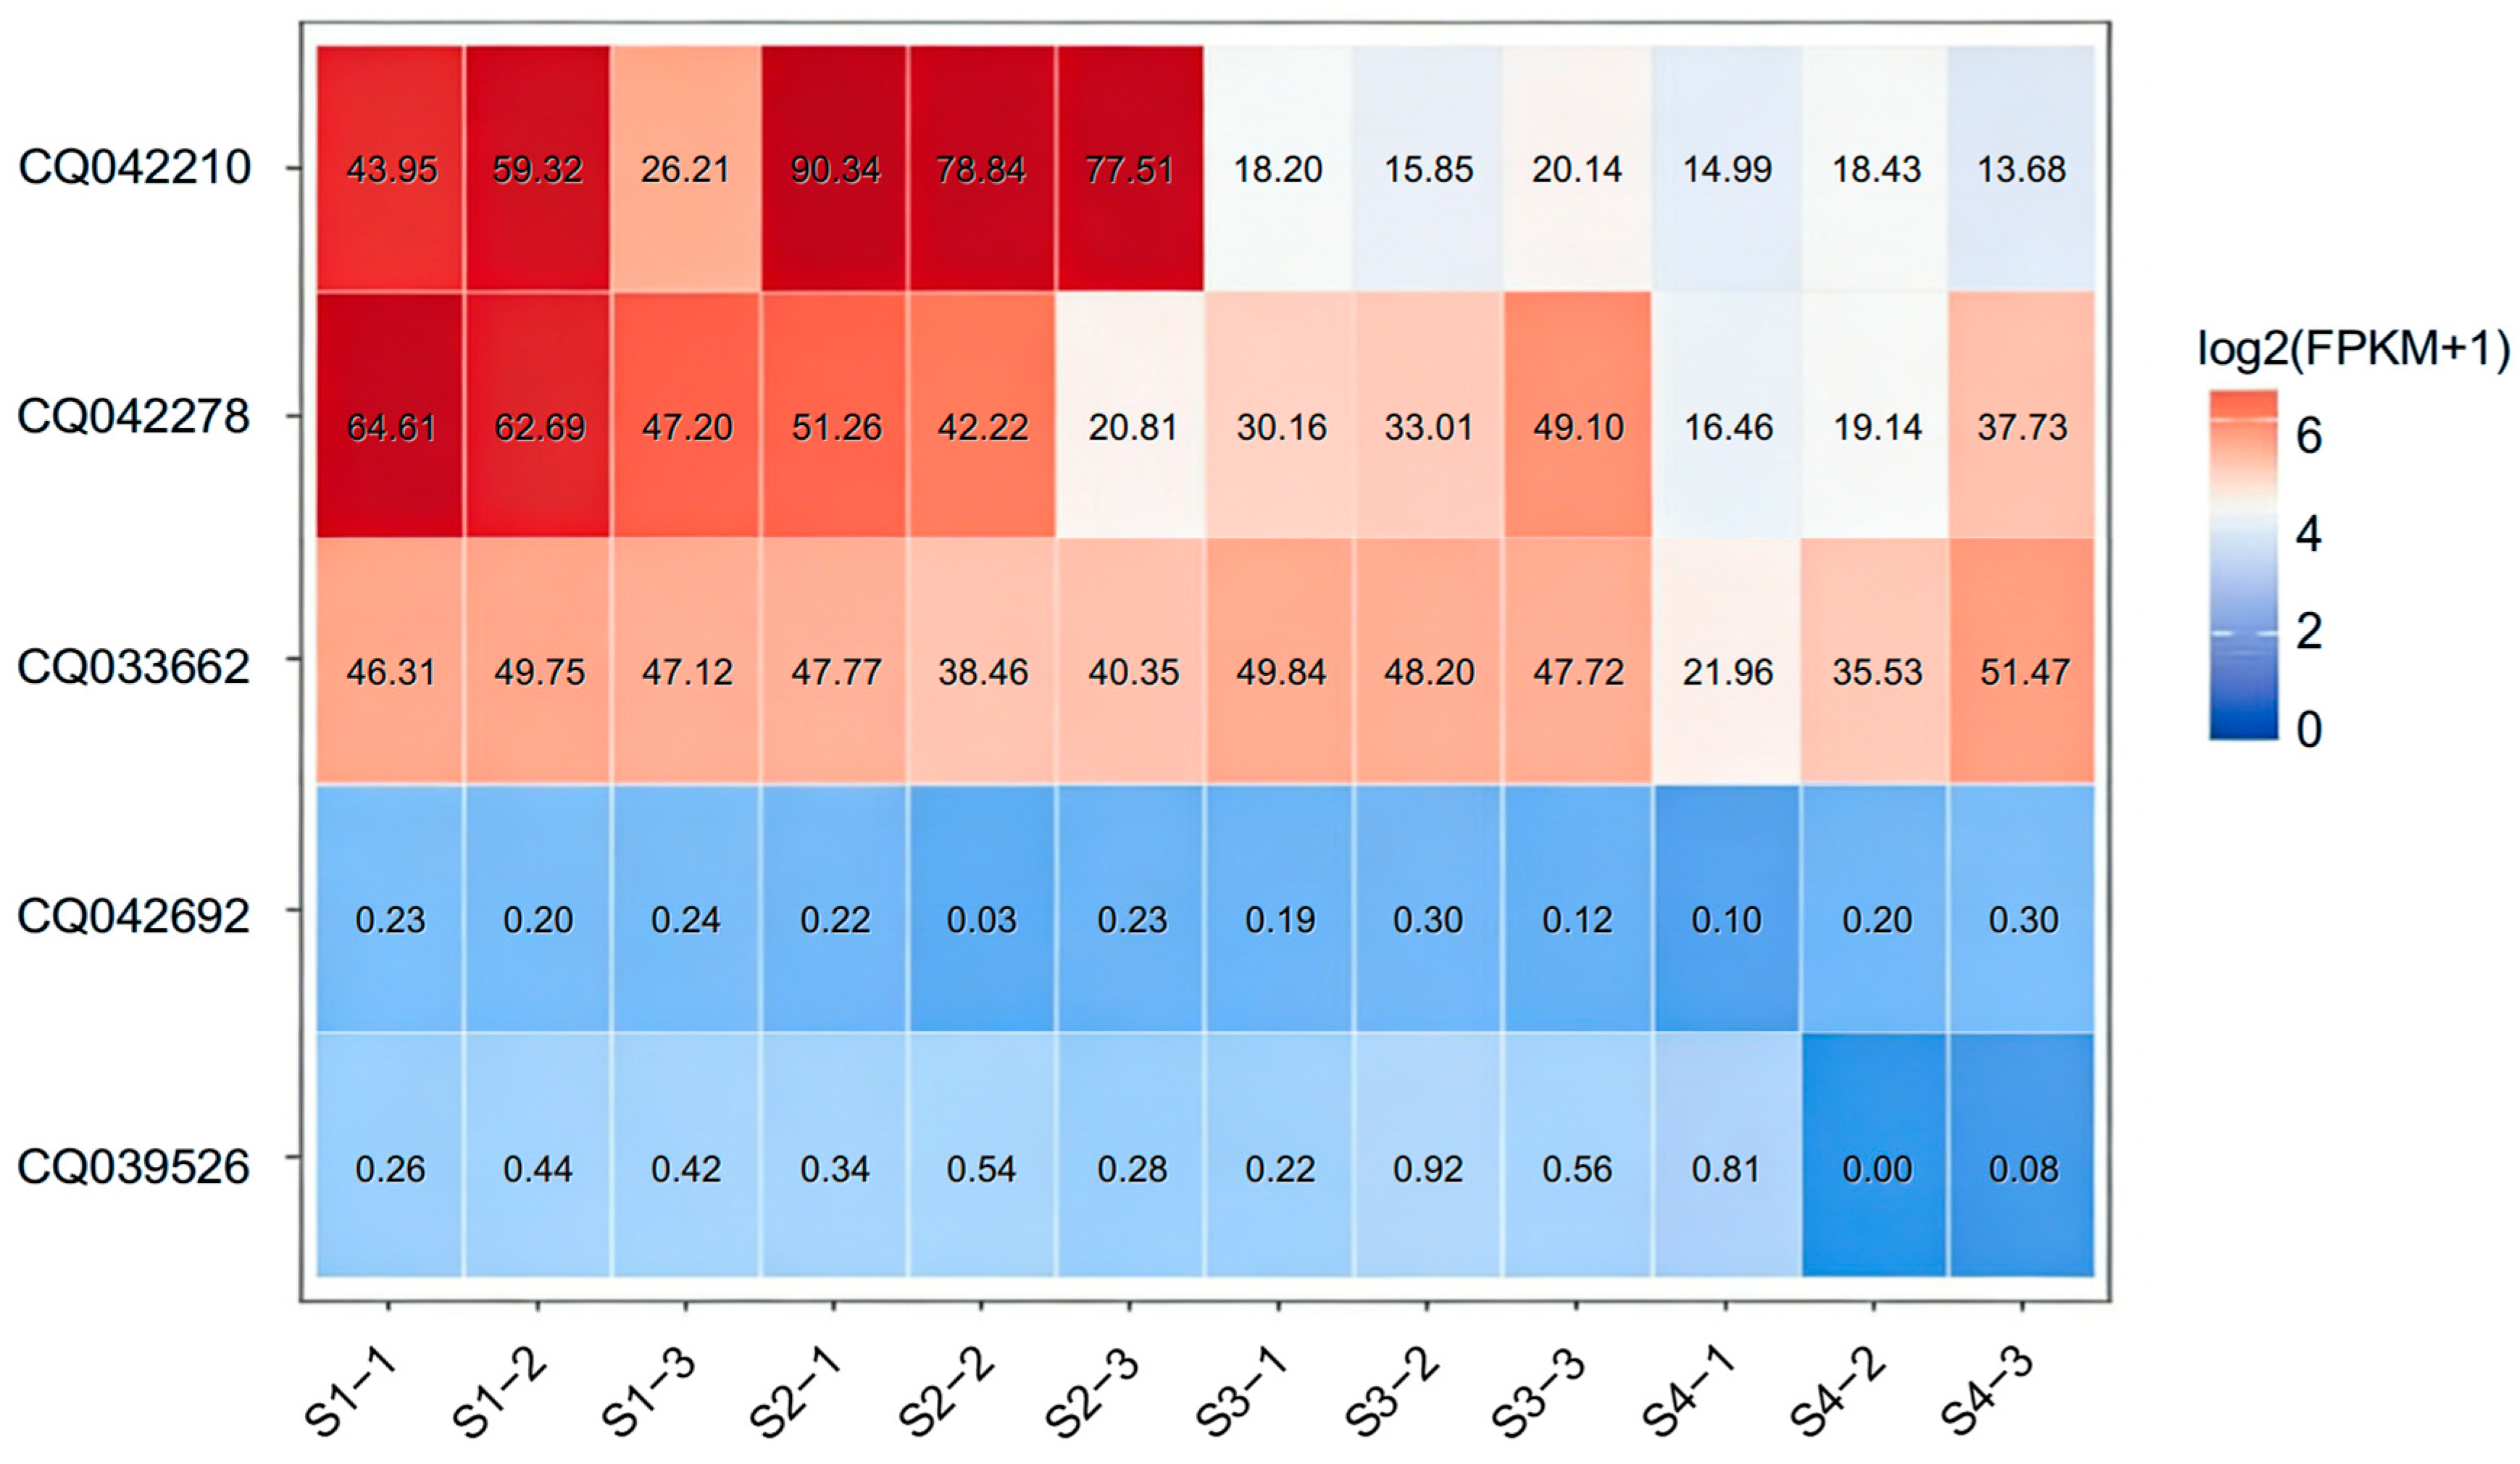
Among all candidate genes, CQ042210 (CesA4) exhibited the highest expression across developmental stages, with a pronounced peak at S2 (mean FPKM = 82.23; maximum = 90.34). This stage-specific upregulation suggests an important role of CesA4 during early to mid seed filling, likely related to cell wall biosynthesis during grain enlargement.
Two additional genes showed consistently high transcript abundance throughout development. CQ042278 (eIF6-2) maintained moderate-to-high expression from S1 to S4 (mean FPKM across stages = 39.04), consistent with its putative role in translational regulation and ribosome biogenesis during seed growth. Similarly, CQ033662 (UAXS) displayed stable and relatively high expression (smean FPKM across stages = 43.70), indicating potential involvement in sugar interconversion pathways that may influence seed biomass accumulation (Figure 5). These transcriptomic patterns highlight CesA4, eIF6-2, and UAXS as the most promising candidate genes for TGW, supported by both GWAS signals and their elevated or stage-specific expression during seed development.

4. Discussion

In this study, genetic loci associated with major agronomic traits were investigated in quinoa varieties adapted to the Qinghai–Tibet Plateau. The accessions used were long-term cultivated varieties that have been artificially selected under plateau environmental conditions. Continuous and approximately normal distributions were exhibited for all measured traits, indicating quantitative inheritance suitable for genome-wide association analysis. Compared with the diverse global collection analyzed by Rahman et al [42]. under saline desert conditions, the present panel consisted of regionally adapted cultivars grown under high-altitude, low-temperature, and high-radiation conditions. This difference suggests that the genetic loci identified here are likely related to structural adaptation and yield stability specific to plateau conditions.
A highly admixed genetic background (K = 7) was revealed by the population structure analysis, reflecting the history of artificial selection and hybridization in modern quinoa breeding. Despite this complexity, population stratification was effectively controlled by the mixed linear model (incorporating PCA and kinship). Stable QTLs were detected across multiple chromosomes, indicating that the observed associations are robust and unlikely to be false positives caused by population structure.
Candidate genes were identified within the significant QTL regions to understand the biological basis of phenotypic variation. Some gene families, such as F-box and AP2/ERF, were also reported by Rahman et al. [42] in association with flowering traits, suggesting that certain regulatory modules are conserved in quinoa. However, for architectural and yield-related traits, genes mainly involved in metabolism and transport were identified in this study. For instance, NRT1 (CQ039526) on Cq8A encodes a nitrate transporter. Since nitrogen uptake is fundamental for plant health and biomass accumulation, the identification of NRT1 suggests that nitrogen transport efficiency is a key factor for maintaining robust growth (“healthier plants”) and high yields in the nutrient-limited soils of the plateau.
For thousand grain weight (TGW), a key determinant of yield, GWAS was combined with transcriptome analysis to narrow down candidates. CesA4 (CQ042210) emerged as the strongest candidate. Cellulose synthase A (CesA) proteins are essential for secondary cell-wall formation, which physically limits or supports cell expansion. In rice, it has been reported that mutations in CESA4 can alter cell wall structure and biomass. In the present study, a distinct expression peak for CesA4 was observed at the early grain-filling stage (S2), which perfectly matches the timing of endosperm enlargement. This convergence of genomic and transcriptomic evidence strongly supports CesA4 as a regulator of grain weight.
Collectively, these findings have practical implications for molecular breeding. The markers linked to CesA4 (grain weight) and NRT1 (nutrient uptake) can be utilized for marker-assisted selection (MAS). By selecting favorable alleles at these loci, new quinoa cultivars with higher yields (via increased grain weight) and better adaptability (via improved nutrient use efficiency) can be developed for the Qinghai–Tibet Plateau.

5. Conclusions

This study provides a genome-wide characterization of key agronomic traits in quinoa adapted to the Qinghai–Tibet Plateau. High-depth resequencing and dense SNP coverage enabled reliable analyses of population structure, LD patterns, and trait-associated genomic regions. A total of 11 significant QTLs were identified, together with several biologically plausible candidate genes. Among them, CesA4 emerged as the strongest regulator of thousand grain weight, supported by both GWAS signals and stage-specific expression during seed filling. These findings enhance our understanding of the genetic basis underlying plant architecture and yield formation in plateau environments and offer valuable targets for functional validation and marker-assisted breeding of high-yield, stress-resilient quinoa cultivars.

Supplementary Materials

The following supporting information can be downloaded at: https://www.mdpi.com/article/10.3390/agronomy16020175/s1, Figure S1: Kinship Matrix of GWAS Study Population; Figure S2: Correlation analysis between arithmetic means and best linear unbiased estimates (BLUEs) for five agronomic traits; Figure S3: Physical distribution of agronomic trait QTLs on Cq chromosome A/B subgroups; Figure S4: Expression profile of TGW-associated candidate genes across growth stages S1–S4.

Author Contributions

Conceptualization: B.L., X.S., D.C. and Y.L. (Yunlong Liang); Methodology: Z.X., F.M., J.L., Y.L. (Yun Li) and Y.L. (Yunlong Liang); Software: J.L., C.L. and Y.L. (Yunlong Liang); Formal Analysis: Z.X., J.Y. and Y.L. (Yunlong Liang); Investigation: F.M., J.Y., C.L. and J.L.; Resources: B.L.; Data Curatio: F.M., J.L., J.Y. and C.L.; Writing—Original Draft Preparation: Z.X. and Y.L. (Yunlong Liang); Writing—Review and Editing: Z.X., J.L., J.Y., Y.L. (Yun Li), X.S., D.C. and Y.L. (Yunlong Liang); Visualization: F.M., J.Y., C.L., X.S. and Y.L. (Yunlong Liang); Supervision: Y.L. (Yun Li), B.L., D.C. and Y.L. (Yunlong Liang); Project Administration: X.S., D.C. and Y.L. (Yunlong Liang); Funding Acquisition: B.L. and D.C. All authors have read and agreed to the published version of the manuscript.

Funding

This research was financially supported by Qinghai Provincial Major Science and Technology Special Project (2023-NK-A3); Huzhou city key research and development plan project (2023ZD2035).

Data Availability Statement

All data relevant to this study are hosted on this website: http://plateauplants.cn/limai_database/home.php (accessed on 8 December 2025).

Conflicts of Interest

The authors declare no conflicts of interest.

Abbreviations

The following abbreviations are used in this manuscript:
PHPlant Height
MSLMain Spike Length
SDStem Diameter
ETEffective Tillers
TGWThousand Grain Weight
GWASGenome-Wide Association Study
QTLQuantitative Trait Locus
SNPSingle-Nucleotide Polymorphism
LDLinkage Disequilibrium
LMMLinear Mixed Model
PCAPrincipal Component Analysis
FPKMFragments Per Kilobase Per Million Reads
ACLYATP-Citrate Lyase
AP2/ERFAP2/ERF Transcription Factor Family Protein
DHLDehydrin-Like Protein
ChlI-likeChlorophyll Biosynthesis Magnesium-Chelatase Subunit I-Like Protein
DnaJDnaJ/Hsp40-Like Molecular Chaperone Protein
F-boxF-box Protein
CesA4Cellulose Synthase A Catalytic Subunit 4
eIF6-2Eukaryotic Translation Initiation Factor 6-2
WAT1Walls Are Thin 1
NRT1Nitrate Transporter 1
UAXSUDP-Apiose/UDP-Xylose Synthase

References

  1. Jarvis, D.E.; Ho, Y.S.; Lightfoot, D.J.; Schmöckel, S.M.; Li, B.; Borm, T.J.A.; Ohyanagi, H.; Mineta, K.; Michell, C.T.; Saber, N.; et al. The Genome of Chenopodium quinoa. Nature 2017, 542, 307–312. [Google Scholar] [CrossRef]
  2. Vega-Gálvez, A.; Miranda, M.; Vergara, J.; Uribe, E.; Puente, L.; Martínez, E.A. Nutrition Facts and Functional Potential of Quinoa (Chenopodium quinoa Willd.), an Ancient Andean Grain: A Review. J. Sci. Food Agric. 2010, 90, 2541–2547. [Google Scholar] [CrossRef]
  3. Afzal, I.; Haq, M.Z.U.; Ahmed, S.; Hirich, A.; Bazile, D. Challenges and Perspectives for Integrating Quinoa into the Agri-Food System. Plants 2023, 12, 3361. [Google Scholar] [CrossRef]
  4. Kobayashi, Y.; Hirakawa, H.; Shirasawa, K.; Nishimura, K.; Fujii, K.; Oros, R.; Almanza, G.R.; Nagatoshi, Y.; Yasui, Y.; Fujita, Y. Chromosome-Level Genome Assemblies for Two Quinoa Inbred Lines from Northern and Southern Highlands of Altiplano Where Quinoa Originated. Front. Plant Sci. 2024, 15, 1434388. [Google Scholar] [CrossRef] [PubMed]
  5. Ruiz, K.B.; Biondi, S.; Oses, R.; Acuña-Rodríguez, I.S.; Antognoni, F.; Martinez-Mosqueira, E.A.; Coulibaly, A.; Canahua-Murillo, A.; Pinto, M.; Zurita-Silva, A.; et al. Quinoa Biodiversity and Sustainability for Food Security under Climate Change. A Review. Agron. Sustain. Dev. 2014, 34, 349–359. [Google Scholar] [CrossRef]
  6. Katwal, T.B.; Bazile, D. First Adaptation of Quinoa in the Bhutanese Mountain Agriculture Systems. PLoS ONE 2020, 15, e0219804. [Google Scholar] [CrossRef]
  7. Garcia, M.; Raes, D.; Jacobsen, S.-E.; Michel, T. Agroclimatic Constraints for Rainfed Agriculture in the Bolivian Altiplano. J. Arid Environ. 2007, 71, 109–121. [Google Scholar] [CrossRef]
  8. Bazile, D.; Jacobsen, S.-E.; Verniau, A. The Global Expansion of Quinoa: Trends and Limits. Front. Plant Sci. 2016, 7, 622. [Google Scholar] [CrossRef] [PubMed]
  9. Goldman, I.L. Plant Breeding Reviews; John Wiley & Sons: Hoboken, NJ, USA, 2018. [Google Scholar]
  10. Bazile, D.; Pulvento, C.; Verniau, A.; Al-Nusairi, M.S.; Ba, D.; Breidy, J.; Hassan, L.; Mohammed, M.I.; Mambetov, O.; Otambekova, M.; et al. Worldwide Evaluations of Quinoa: Preliminary Results from Post International Year of Quinoa FAO Projects in Nine Countries. Front. Plant Sci. 2016, 7, 850. [Google Scholar] [CrossRef]
  11. Maldonado-Taipe, N.; Barbier, F.; Schmid, K.; Jung, C.; Emrani, N. High-Density Mapping of Quantitative Trait Loci Controlling Agronomically Important Traits in Quinoa (Chenopodium quinoa Willd.). Front. Plant Sci. 2022, 13, 916067. [Google Scholar] [CrossRef] [PubMed]
  12. Patiranage, D.S.; Rey, E.; Emrani, N.; Wellman, G.; Schmid, K.; Schmöckel, S.M.; Tester, M.; Jung, C. Genome-Wide Association Study in Quinoa Reveals Selection Pattern Typical for Crops with a Short Breeding History. eLife 2022, 11, e66873. [Google Scholar] [CrossRef]
  13. Rey, E.; Maughan, P.J.; Maumus, F.; Lewis, D.; Wilson, L.; Fuller, J.; Schmöckel, S.M.; Jellen, E.N.; Tester, M.; Jarvis, D.E. A Chromosome-Scale Assembly of the Quinoa Genome Provides Insights into the Structure and Dynamics of Its Subgenomes. Commun. Biol. 2023, 6, 1263. [Google Scholar] [CrossRef]
  14. Li, H.; Durbin, R. Fast and Accurate Short Read Alignment with Burrows–Wheeler Transform. Bioinformatics 2009, 25, 1754–1760. [Google Scholar] [CrossRef] [PubMed]
  15. Li, H.; Handsaker, B.; Wysoker, A.; Fennell, T.; Ruan, J.; Homer, N.; Marth, G.; Abecasis, G.; Durbin, R. 1000 Genome Project Data Processing Subgroup The Sequence Alignment/Map Format and SAMtools. Bioinformatics 2009, 25, 2078–2079. [Google Scholar] [CrossRef]
  16. Picard Tools—By Broad Institute. Available online: https://broadinstitute.github.io/picard/ (accessed on 14 November 2025).
  17. McKenna, A.; Hanna, M.; Banks, E.; Sivachenko, A.; Cibulskis, K.; Kernytsky, A.; Garimella, K.; Altshuler, D.; Gabriel, S.; Daly, M.; et al. The Genome Analysis Toolkit: A MapReduce Framework for Analyzing next-Generation DNA Sequencing Data. Genome Res. 2010, 20, 1297–1303. [Google Scholar] [CrossRef] [PubMed]
  18. Danecek, P.; Auton, A.; Abecasis, G.; Albers, C.A.; Banks, E.; DePristo, M.A.; Handsaker, R.E.; Lunter, G.; Marth, G.T.; Sherry, S.T.; et al. The Variant Call Format and VCFtools. Bioinformatics 2011, 27, 2156–2158. [Google Scholar] [CrossRef]
  19. Zhang, C.; Dong, S.-S.; Xu, J.-Y.; He, W.-M.; Yang, T.-L. PopLDdecay: A fast and effective tool for linkage disequilibrium decay analysis based on variant call format files. Bioinformatics 2019, 35, 1786–1788. [Google Scholar] [CrossRef]
  20. Alexander, D.H.; Novembre, J.; Lange, K. Fast model-based estimation of ancestry in unrelated individuals. Genome Res. 2009, 19, 1655–1664. [Google Scholar] [CrossRef]
  21. Stamatakis, A. RAxML-VI-HPC: Maximum likelihood-based phylogenetic analyses with thousands of taxa and mixed models. Bioinformatics 2006, 22, 2688–2690. [Google Scholar] [CrossRef] [PubMed]
  22. Zhou, X.; Stephens, M. Genome-Wide Efficient Mixed-Model Analysis for Association Studies. Nat. Genet. 2012, 44, 821–824. [Google Scholar] [CrossRef]
  23. Li, M.-X.; Yeung, J.M.Y.; Cherny, S.S.; Sham, P.C. Evaluating the Effective Numbers of Independent Tests and Significant P-Value Thresholds in Commercial Genotyping Arrays and Public Imputation Reference Datasets. Hum. Genet. 2012, 131, 747–756. [Google Scholar] [CrossRef]
  24. Jones, P.; Binns, D.; Chang, H.-Y.; Fraser, M.; Li, W.; McAnulla, C.; McWilliam, H.; Maslen, J.; Mitchell, A.; Nuka, G.; et al. InterProScan 5: Genome-scale protein function classification. Bioinformatics 2014, 30, 1236–1240. [Google Scholar] [CrossRef] [PubMed]
  25. Manzoor, N.; Yuan, J.; Dongcheng, W.; Liu, Z.; Lin, C.; Mao, Z. Integrated Transcriptomic and Proteomic Analyses Revealed Molecular Mechanisms Underlying Nutritional Changes during Seed Development of Chenopodium quinoa. Genomics 2025, 117, 111045. [Google Scholar] [CrossRef]
  26. Kim, D.; Paggi, J.M.; Park, C.; Bennett, C.; Salzberg, S.L. Graph-Based Genome Alignment and Genotyping with HISAT2 and HISAT-Genotype. Nat. Biotechnol. 2019, 37, 907–915. [Google Scholar] [CrossRef] [PubMed]
  27. Liao, Y.; Smyth, G.K.; Shi, W. featureCounts: An Efficient General Purpose Program for Assigning Sequence Reads to Genomic Features. Bioinformatics 2014, 30, 923–930. [Google Scholar] [CrossRef] [PubMed]
  28. Tu, X.; Wang, Q.; Luo, Y.; Zheng, Z.; Liu, A. Relationship between Phenylalanine Biosynthetic Pathway, Metabolic Pathway and the Dwarfism of Upland Cotton. Genom. Appl. Biol. 2018, 37, 3028–3034. [Google Scholar]
  29. Studart-Guimarães, C.; Fait, A.; Nunes-Nesi, A.; Carrari, F.; Usadel, B.; Fernie, A.R. Reduced Expression of Succinyl-Coenzyme A Ligase Can Be Compensated for by Up-Regulation of the γ-Aminobutyrate Shunt in Illuminated Tomato Leaves. Plant Physiol. 2007, 145, 626–639. [Google Scholar] [CrossRef]
  30. Hao, P.; Jian, C.; Hao, C.; Liu, S.; Hou, J.; Liu, H.; Liu, H.; Zhang, X.; Zhao, H.; Li, T. Coordination of miR319–TaPCF8 with TaSPL14 Orchestrates Auxin Signaling and Biosynthesis to Regulate Plant Height in Common Wheat. J. Integr. Plant Biol. 2024, 66, 2362–2378. [Google Scholar] [CrossRef]
  31. Zhang, L.; Liu, P.; Wu, J.; Qiao, L.; Zhao, G.; Jia, J.; Gao, L.; Wang, J. Identification of a Novel ERF Gene, TaERF8, Associated with Plant Height and Yield in Wheat. BMC Plant Biol. 2020, 20, 263. [Google Scholar] [CrossRef]
  32. Ma, Z.; Jin, Y.-M.; Wu, T.; Hu, L.; Zhang, Y.; Jiang, W.; Du, X. OsDREB2B, an AP2/ERF Transcription Factor, Negatively Regulates Plant Height by Conferring GA Metabolism in Rice. Front. Plant Sci. 2022, 13, 1007811. [Google Scholar] [CrossRef]
  33. Guo, B.; Jin, X.; Chen, J.; Xu, H.; Zhang, M.; Lu, X.; Wu, R.; Zhao, Y.; Guo, Y.; An, Y.; et al. ATP-Dependent DNA Helicase (TaDHL), a Novel Reduced-Height (Rht) Gene in Wheat. Genes 2022, 13, 979. [Google Scholar] [CrossRef] [PubMed]
  34. Wei, B.; Liu, Y.; Lyu, M.; Chen, R.; Ma, J.; Yin, C.; Huang, J.; Peng, L.; Fu, Z.; Song, Q.; et al. Natural Variation in CHELATASE SUBUNIT I-A Increases Grain Weight and Enhances Wheat Yield. Plant Cell 2025, 37, koaf212. [Google Scholar] [CrossRef]
  35. Luo, L.; Xie, Y.; Yu, S.; Yang, J.; Chen, S.; Yuan, X.; Guo, T.; Wang, H.; Liu, Y.; Chen, C.; et al. The DNAJ Domain-containing Heat-shock Protein NAL11 Determines Plant Architecture by Mediating Gibberellin Homeostasis in Rice (Oryza sativa). New Phytol. 2023, 237, 2163–2179. [Google Scholar] [CrossRef]
  36. Miao, R.; Wang, X.; Feng, M.; Cheng, Z.; Shao, J.; Zhou, C.; Qian, J.; Luo, Y.; Luo, W.; Luo, S.; et al. The F-box Protein RCN127 Enhances Rice Tillering and Grain Yield by Mediating the Degradation of OSTB1 and OSTCP19. Plant Biotechnol. J. 2025, 23, 3638–3649. [Google Scholar] [CrossRef]
  37. Li, F.; Liu, S.; Xu, H.; Xu, Q. A Novel FC17/CESA4 Mutation Causes Increased Biomass Saccharification and Lodging Resistance by Remodeling Cell Wall in Rice. Biotechnol. Biofuels 2018, 11, 298. [Google Scholar] [CrossRef]
  38. Guo, H.; Lv, J.; Su, X.; Chen, L.; Ren, J.; Liu, L.; Ren, M.; Liu, S.; Dai, M.; Ren, G.; et al. Rice OseIF6.1 Encodes a Eukaryotic Translation Initiation Factor and Is Essential for the Development of Grain and Anther. Front. Plant Sci. 2024, 15, 1366986. [Google Scholar] [CrossRef] [PubMed]
  39. Xu, D.; Wen, W.; Fu, L.; Li, F.; Li, J.; Xie, L.; Xia, X.; Ni, Z.; He, Z.; Cao, S. Genetic Dissection of a Major QTL for Kernel Weight Spanning the Rht-B1 Locus in Bread Wheat. Theor. Appl. Genet. 2019, 132, 3191–3200. [Google Scholar] [CrossRef]
  40. Wang, H.; Liu, Y.; Wu, L.; Xia, C.; Chen, Y.; Kong, X.; Shi, F.; Li, H.; Yang, X.; Ma, L.; et al. TaNPF6.2 Improves Agronomic Traits via Enhancing Nitrogen Uptake Efficiency in Wheat. J. Genet. Genom. 2025, 52, 120–123. [Google Scholar] [CrossRef] [PubMed]
  41. Xu, S.; Zhang, M.; Ye, J.; Hu, D.; Zhang, Y.; Li, Z.; Liu, J.; Sun, Y.; Wang, S.; Yuan, X.; et al. Brittle culm 25, which encodes an UDP-xylose synthase, affects cell wall properties in rice. Crop J. 2023, 11, 733–743. [Google Scholar] [CrossRef]
  42. Rahman, H.; Vikram, P.; Hu, Y.; Asthana, S.; Tanaji, A.; Suryanarayanan, P.; Quadros, C.; Mehta, L.; Shahid, M.; Gkanogiannis, A.; et al. Mining genomic regions associated with agronomic and biochemical traits in quinoa through GWAS. Sci. Rep. 2024, 14, 9205. [Google Scholar] [CrossRef]
Figure 1. Distribution of five agronomic traits in the quinoa population. Histograms showing the phenotypic distributions of plant height (PH), main spike length (MSL), stem diameter (SD), effective tiller number (ET), and thousand grain weight (TGW) across 300 quinoa accessions. The dashed lines represent fitted normal distribution curves. Shapiro–Wilk test p-values (top left of each panel) indicate that all traits follow approximately normal distributions.
Agronomy 16 00175 g001
Figure 2. Genome-wide SNP distribution and LD decay in the quinoa population: (a) SNP density across the quinoa genome. Genome-wide distribution of 3.69 million high-quality SNPs plotted in 100-kb windows across all chromosomes. Warmer colors indicate higher SNP density. (b) Linkage disequilibrium (LD) decay curve. LD decay estimated using pairwise r2 values shows a rapid decline with increasing physical distance. The average r2 dropped below 0.30 at ~200 kb, indicating relatively fast LD decay and supporting fine-scale association mapping in the quinoa population.
Agronomy 16 00175 g002
Figure 3. Population structure and genetic relationships of the 300 quinoa accessions: (a) Cross-validation (CV) error plot from ADMIXTURE. CV error values for K = 2–10, with the lowest CV observed at K = 7, indicating that seven ancestral components best explain the population structure. (b) Principal component analysis (PCA). Scatter plot of the first two principal components (PC1 = 60.29%, PC2 = 20.98%), showing extensive genetic admixture among accessions, with only a small subset forming relatively distinct clusters. (c) Neighbor-joining (NJ) phylogenetic tree. Phylogenetic relationships inferred from genome-wide SNPs, illustrating the mixed and interspersed clustering pattern consistent with high admixture levels across the panel. (d) ADMIXTURE ancestry fractions at K = 7. Bar plot showing the proportional genomic ancestry of each accession. Most individuals exhibit mixed ancestry components, whereas a small subgroup displays a more homogeneous genetic background.
Agronomy 16 00175 g003aAgronomy 16 00175 g003b
Figure 4. Manhattan and Q–Q plots for genome-wide association studies of five agronomic traits in quinoa: (a) plant height (PH); (b) main spike length (MSL); (c) stem diameter (SD); (d) effective tillers (ET); (e) thousand grain weight (TGW). Left panels show Manhattan plots for each trait, with the red dashed horizontal line marking the genome-wide significance threshold (−log10P = 5.5). Right panels show Q–Q plots comparing observed and expected −log10P values. The inflation patterns indicate effective control of population structure, with significant deviations at the upper tail reflecting true association signals.
Agronomy 16 00175 g004aAgronomy 16 00175 g004b
Figure 5. Expression profiles of TGW-associated candidate genes across four seed developmental stages. Heatmap showing the expression patterns (log2(FPKM + 1)) of five candidate genes—CQ042210 (CesA4), CQ042278 (eIF6-2), CQ042692 (WAT1), CQ033662 (UAXS), and CQ039526 (NRT1)—across twelve transcriptome samples representing four seed developmental stages (S1–S4). CesA4 exhibits a pronounced peak at stage S2, whereas eIF6-2 and UAXS maintain consistently high expression across stages. Other genes show low or stage-independent expression levels.
Agronomy 16 00175 g005
Table 1. Summary statistics and pairwise correlations of five agronomic traits in quinoa.
TraitMinMaxMeanSDPlant Height
(PH)
Main Spike Length
(MSL)
Stem
Diameter
(SD)
Effective Tillers
(ET)
Thousand Grain Weight
(TGW)
Plant Height (PH)65.4189.10120.9623.1310.45 **0.47 **0.30 **0.31 **
Main Spike Length (MSL)4.5056.4028.718.83 10.42 **0.44 **0.26 **
Stem Diameter (SD)6.0726.0013.883.88 10.050.15 *
Effective Tillers (ET)6.0034.0019.155.89 10.22 **
Thousand Grain Weight (TGW)0.624.542.680.63 1
*: p < 0.05, **: p < 0.01.
Table 2. Significant QTLs and candidate genes identified for five agronomic traits in quinoa.
TrailIDChr.StartEndCandidate GeneAnnotation
PHqPHcq6B.1Cq6B79,367,11480,880,705CQ002773ACLY
[28,29]
qPHcq7A.1Cq7A14,372,85915,006,944CQ042304AP2/ERF
[30,31,32]
MSLqMSLcq6A.1Cq6A2,129,00021,777,000CQ026585DHL [33]
qMSLcq8A.1Cq8A8,740,6689,507,907CQ038724ChlI-like [34]
SDqSDcq1A.1Cq1A20,532,83220,977,992CQ048718DnaJ [35]
ETqETcq9B.1Cq9B12,229,52412,649,055CQ033515F-box [36]
TGWqTGWcq7A.1Cq7A13,099,93513,724,278CQ042210CesA4 [37]
qTGWcq7A.2Cq7A13,850,22614,254,114CQ042278eIF6-2 [38]
qTGWcq7A.3Cq7A23,049,43823,602,686CQ042692WAT1 [39]
qTWGcq8A.1Cq8A36,970,17137,844,666CQ039526NRT1 [40]
qTGWcq9B.1Cq9B14,891,72915,885,569CQ033662UAXS [41]
Disclaimer/Publisher’s Note: The statements, opinions and data contained in all publications are solely those of the individual author(s) and contributor(s) and not of MDPI and/or the editor(s). MDPI and/or the editor(s) disclaim responsibility for any injury to people or property resulting from any ideas, methods, instructions or products referred to in the content.