Article

Balancing Energy and Agriculture in Japan: A Techno-Economic Assessment of Agrivoltaics Based on the Levelized Cost of Electricity


Graduate School of Energy Science, Kyoto University, Yoshida Honmachi, Sakyo-ku, Kyoto 606-8501, Japan
*
Author to whom correspondence should be addressed.
Agronomy 2026, 16(18), 1776; https://doi.org/10.3390/agronomy16181776
Submission received: 21 February 2026 / Revised: 24 May 2026 / Accepted: 27 August 2026 / Published: 10 September 2026
(This article belongs to the Special Issue New Pathways Towards Carbon Neutrality in Agricultural Systems)

Abstract

Agrivoltaic systems (AVSs) present a promising solution to land-use conflicts between solar photovoltaics and agriculture. Nevertheless, their electricity-side cost performance is strongly influenced by site-specific conditions and agricultural constraints, and a comprehensive nationwide geospatial assessment of optimal designs under agronomic light constraints remains lacking. To address this gap, we developed a GIS-based techno-economic framework for Japan to identify site-specific optimal designs by minimizing the Levelized Cost of Electricity (LCOE) while satisfying crop light requirements represented by target Daily Light Integral (DLI) values. The analysis indicates a national average LCOE of 0.1021 EUR kWh−1 for optimized AVSs, with lower electricity-side costs in central to southwestern regions characterized by high solar irradiance. The optimal design, particularly the projected ground coverage ratio (average: 30.38%), varied considerably across the country to balance power generation and crop light availability. Scenario and sensitivity analyses revealed that LCOE is highly sensitive to crop light requirements, whereas PV system efficiency and capital expenditure are the most influential cost drivers. This study provides the first high-resolution, nation-scale LCOE map for AVS in Japan derived through grid-level design optimization under explicit DLI-based constraints, offering a quantitative screening-level foundation for region-specific deployment planning.

1. Introduction

1.1. The Energy–Agriculture Nexus and Agrivoltaic Systems

Addressing the global challenge of climate change necessitates a swift and extensive transition to renewable energy sources, with solar photovoltaics (PV) emerging as a pivotal element of this transformation [1]. However, the deployment of utility-scale PV systems requires substantial land areas, and croplands are frequently considered prime candidates owing to their high solar irradiance and flat terrain [2]. This situation creates a direct conflict with another pressing global challenge: the increasing demand for food production driven by global population growth [3]. The ensuing land-use competition between solar energy generation and agriculture presents new challenges for food security, sustainable land management, and social acceptance, necessitating innovative solutions to reconcile these competing needs.
Agrivoltaic systems (AVSs), which integrate agricultural practices with solar energy production on the same land, are increasingly recognized as a viable solution to land-use conflicts. This concept was first introduced by Goetzberger and Zastrow in 1981 [4]. The dual land-use strategy inherent in AVS can significantly enhance overall land productivity, with land equivalent ratio values typically ranging between 1.2 and 1.8, indicating a 20–80% improvement in territorial efficiency compared to separate systems [5,6]. Moreover, AVS not only contributes to climate change mitigation but also aids in climate adaptation by enhancing agricultural resilience through microclimate regulation. For instance, numerous studies have documented synergistic effects, such as protecting crops from environmental stressors (e.g., excessive heat, hail, and frost) and improving water-use efficiency through reduced evapotranspiration and irrigation demand [7,8,9]. Beyond environmental benefits, AVS can significantly improve farm profitability and support the decarbonization of the agricultural sector itself through the self-consumption of electricity for machinery and irrigation [10,11]. Despite these multifaceted benefits, a fundamental trade-off exists between maximizing photovoltaic (PV) power generation and sustaining crop yields, as both processes compete for the same solar radiation [12]. In light of these complexities, the adoption of AVS is accelerating globally, supported by policy measures in countries such as Japan, the United States, and Germany [13].

1.2. Agrivoltaic Deployment in Japan and the Risk of Pseudo-Agriculture

In Japan, AVS technology has considerable strategic significance. The nation has pledged to achieve carbon neutrality by 2050; however, its mountainous landscape significantly limits the availability of land suitable for conventional ground-mounted photovoltaic (GM-PV) systems [14,15]. Simultaneously, the agricultural sector is experiencing a critical structural crisis, marked by the rapid aging of the core agricultural workforce (average age 69.2) and the continuous generation of abandoned farmland, which now threatens national food security [16]. Consequently, AVS is regarded as a crucial technology for simultaneously enhancing energy and food security while revitalizing rural economies [17]. Reflecting this potential, the number of approved AVS projects in Japan has increased annually [18].
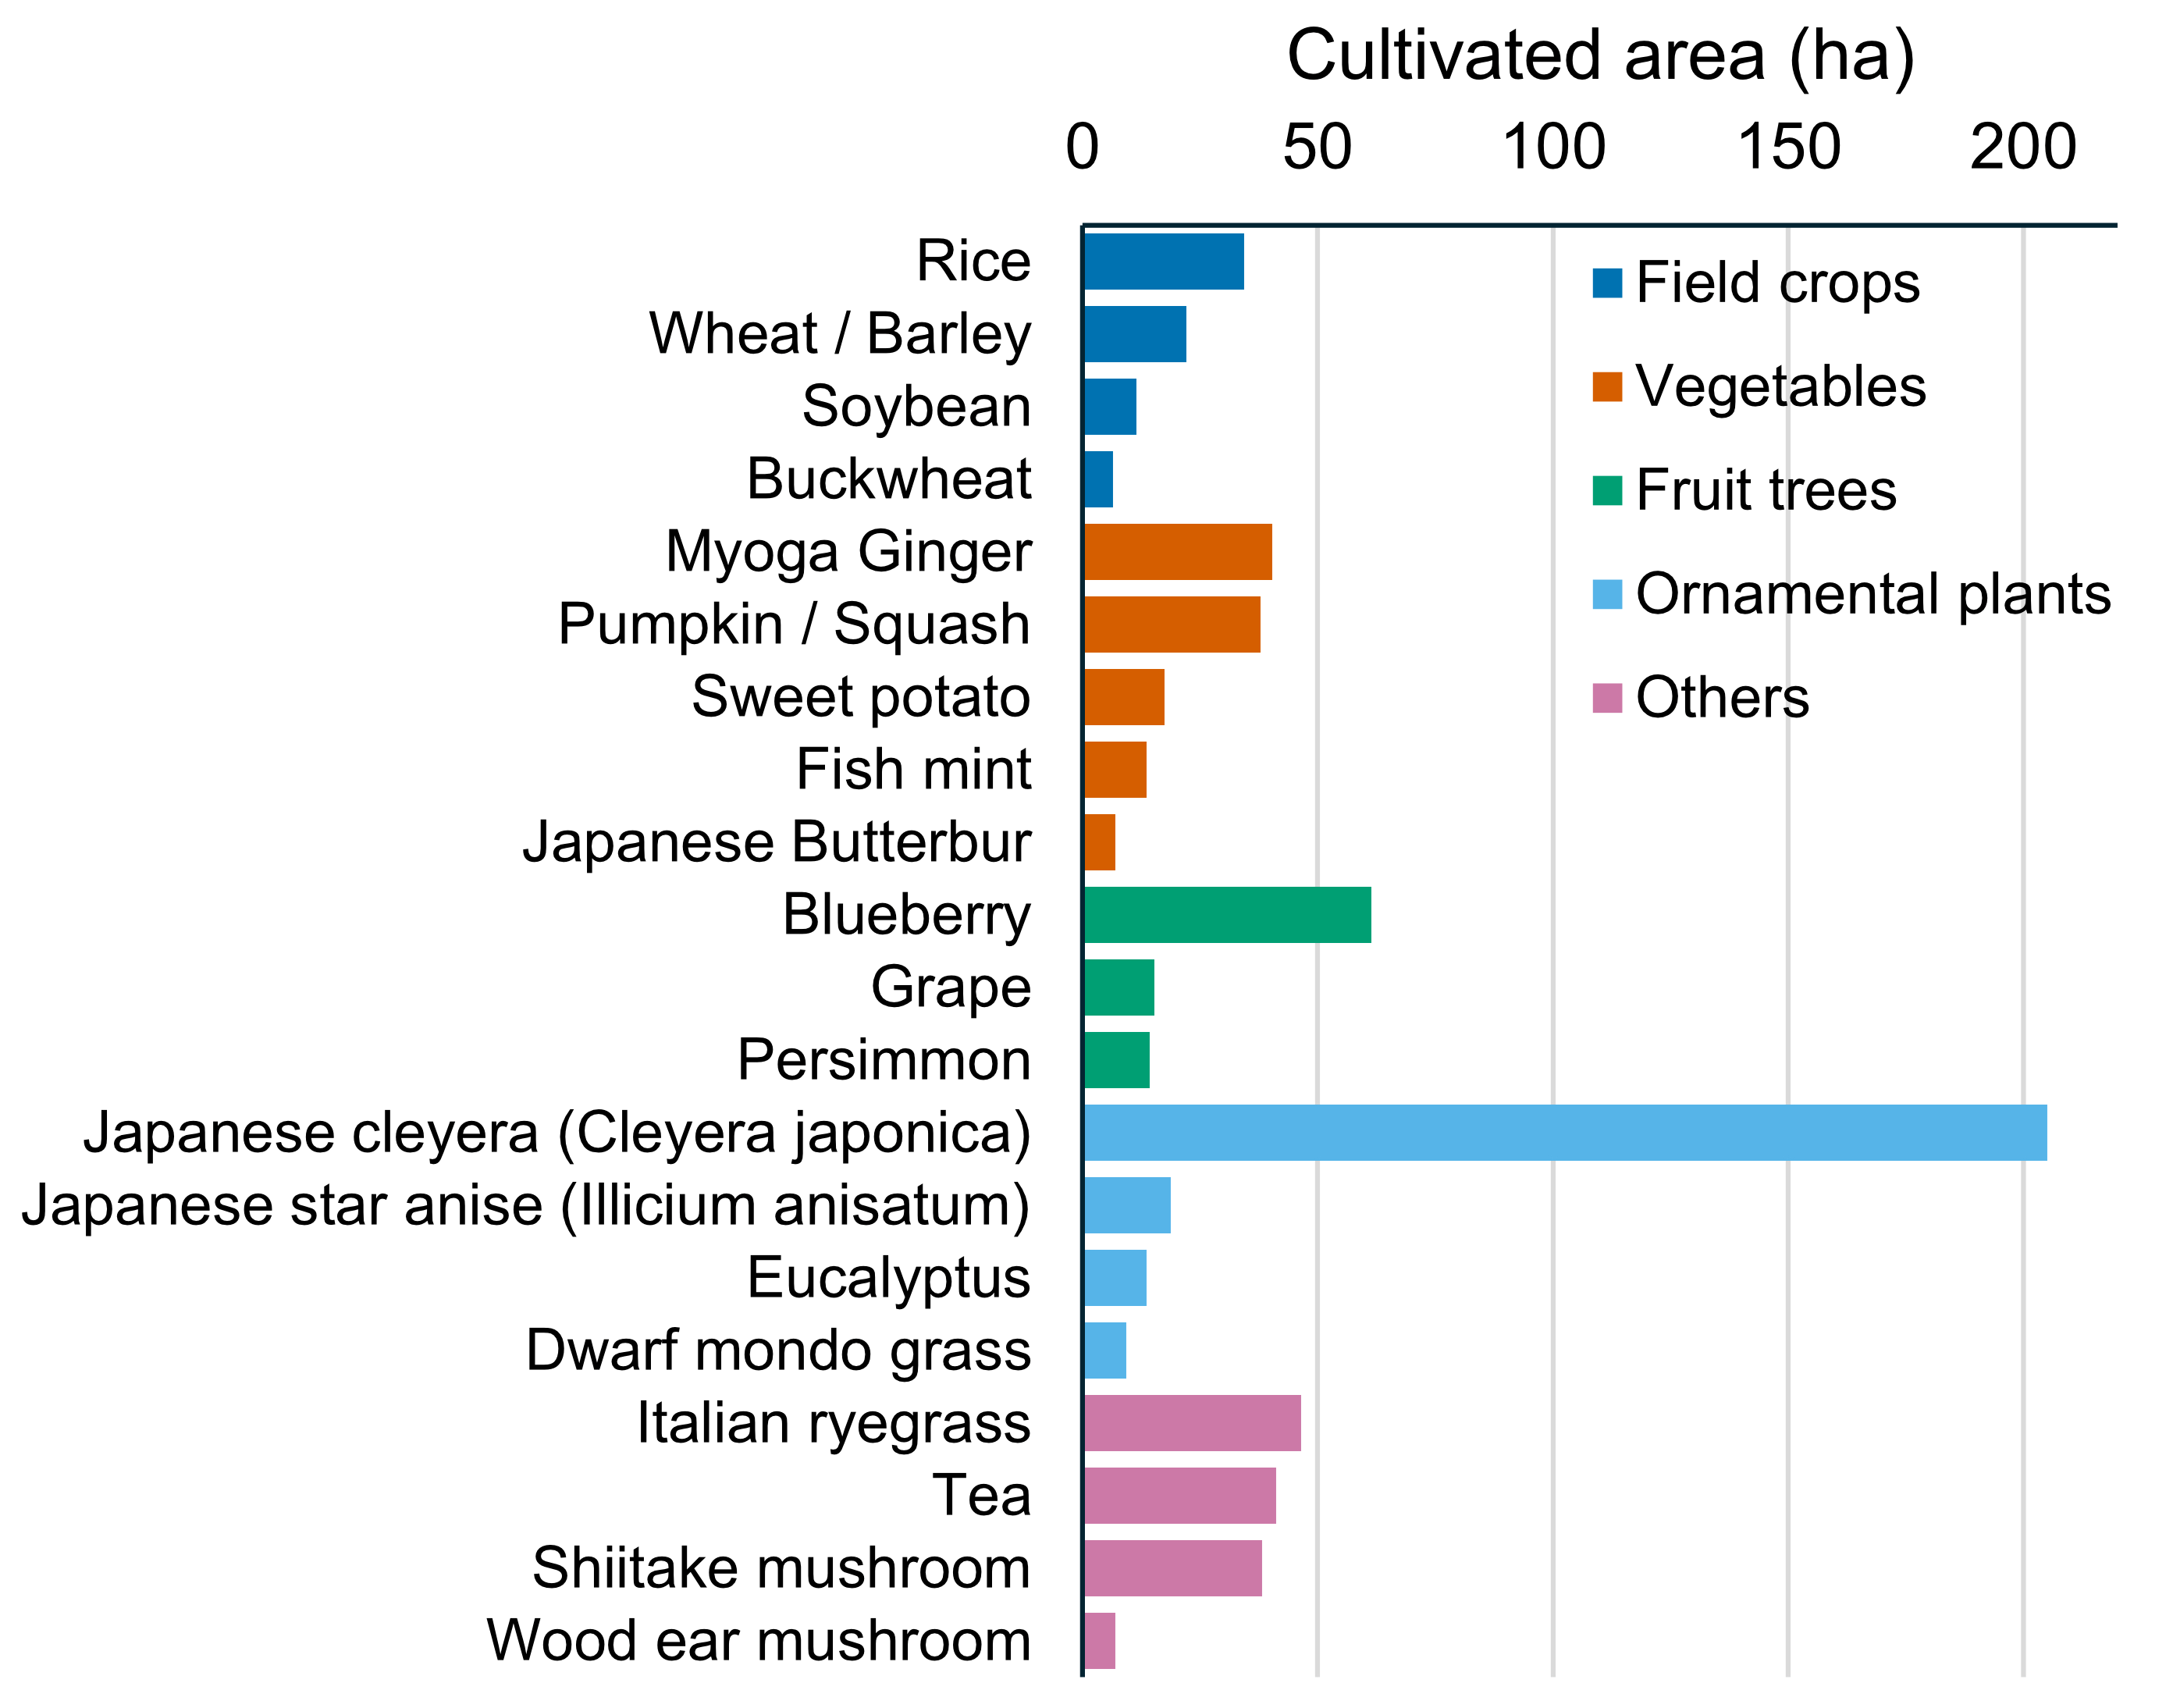
However, an analysis of the actual agricultural practices within these systems reveals a skewed crop selection (Figure 1). Recent national data indicate that the cultivated area under AVS is predominantly occupied by highly shade-tolerant ornamental plants (e.g., Japanese cleyera) and certain horticultural crops (e.g., blueberry, Myoga ginger), rather than staple food crops such as rice, wheat, or soybeans [19]. This empirical reality highlights a significant challenge: a primary concern is the risk of pseudo-agriculture, a phenomenon where energy production is prioritized as the primary objective, marginalizing or neglecting farming [20]. In Japan, amid declining Feed-in Tariff (FIT) rates, there are instances where project developers excessively focus on maximizing electricity revenues. This unilateral optimization has led to occurrences of pseudo-agricultural practices in the country, resulting in the abandonment of cultivation or significant yield reductions due to excessive shading. This prioritization of electricity generation over farming has led to diminished social trust and local opposition, thereby impeding the overall diffusion of the technology [17,21,22]. Beyond the challenges to technology diffusion, pseudo-agriculture presents a critical agronomic issue, as it threatens to compromise the agricultural productivity and food security that AVS are designed to support.

1.3. Research Gaps in Spatial Techno-Economic Assessment of Agrivoltaic Systems

To promote AVS, evaluating its economic performance is imperative. While AVS is inherently an integrated system of agriculture and energy, its comprehensive economic structure is often dominated by the financial viability of the power generation sector [13,23]. This is particularly evident in Japan, where approximately two-thirds of existing AVS projects involve separate entities operating the power generation and agricultural sectors [18]. Given these circumstances, evaluating the electricity-sector economic performance serves as a crucial and practical baseline for screening-level assessments of AVS projects. The Levelized Cost of Electricity (LCOE) is an internationally recognized metric for evaluating electricity-sector economic performance, and is generally higher for AVS than for conventional ground-mounted PV (GM-PV) [24]. This discrepancy arises because AVS requires specialized structural designs—such as higher clearances and wider row spacing—to ensure compatibility with agricultural machinery and to mitigate adverse impacts on crop growth. These modifications inevitably elevate the capital expenditure (CAPEX) per peak output of the support structure [24,25]. Moreover, the cost differentials driven by these specialized designs are heavily influenced by site-specific conditions. The shade tolerance of the cultivated crops, alongside geographical and climatic factors such as solar radiation and latitude, dictates the optimal system configuration required to maintain adequate crop-light availability [26,27]. Consequently, evaluating the LCOE of AVS on a national scale necessitates a geospatial approach that meticulously accounts for these site-specific variables.
Previous studies have employed Geographic Information Systems (GISs) for the spatial analysis of AVS. However, a spatially explicit techno-economic framework that optimizes AVS design to minimize LCOE while adhering to site-specific crop-light constraints remains a notable research gap. Much of the existing geospatial research on AVS economics has not fully addressed the system design necessary to sustain crop light availability, often assuming a uniform or limited design pattern across the entire target area for analytical simplicity [28,29]. Although pioneering studies have examined the spatial variability of AVS design, they have encountered methodological constraints, such as the omission of economic indicators like the LCOE during the optimization process [27]. Consequently, nation-scale analyses using techno-economic models that explicitly integrate crop-light constraints into the determination of site-specific optimal designs and their corresponding LCOE have not been conducted, despite their importance for effective policy formulation and screening-level project assessment.

1.4. Research Objectives and Contributions

To address this gap, this study develops a GIS-based techno-economic framework covering the entirety of Japan to evaluate the spatial distribution of LCOE for AVS. The framework determines site-specific optimal configurations, particularly the module tilt angle and projected ground coverage ratio (pGCR), that minimize the LCOE while ensuring the requisite Daily Light Integral (DLI) for crop growth as a fundamental constraint. Utilizing this approach, this study aims to address the following research questions (RQs):
RQ1. How are the optimal AVS configurations (tilt angle and pGCR) that minimize the LCOE while satisfying crop light requirements spatially distributed across Japan?
RQ2. How is the LCOE of AVS spatially distributed across Japan based on these optimal configurations?
RQ3. How sensitive is the LCOE of AVS to variations in crop light requirements and key economic parameters, such as CAPEX and Operational Expenditure (OPEX)?
This study makes several contributions. Primarily, it presents the first nation-scale LCOE map for AVS in Japan that systematically incorporates agronomic light constraints across diverse geographical and climatic conditions. Rather than applying a spatially uniform design assumption, the framework optimizes module tilt angle and pGCR on a site-specific basis to minimize LCOE while satisfying agronomic light requirements, thereby enabling a more accurate characterization of spatial cost heterogeneity across diverse geographical and climatic conditions. The findings of this study provide a quantitative foundation for policymakers to comprehend the regional cost potential of AVS implementation in each region and formulate effective support measures and zoning regulations. In addition, this framework serves as a tool for developers to conduct screening-level assessments of economic feasibility.

2. Materials and Methods

2.1. Study Area

This study encompassed the entirety of Japan, a nation distinguished by its considerable geographical and climatic diversity. Extending from the subarctic region in the north (approximately 45° N) to the subtropical zone in the south (approximately 26° N), the Japanese archipelago is characterized by rugged terrain, with mountainous areas comprising approximately three-quarters of its land area, exhibiting highly spatially heterogeneous land use [30].
This study conducted a geospatial analysis of Japan by segmenting its territory according to the nation’s basic grid square. This framework, as defined by the Statistics Bureau of Japan, encompasses the entire country with grid cells approximately 1 km in size [31]. To exclude regions where AVS installation is not feasible, the target area was refined using land use mesh data published by the Ministry of Land, Infrastructure, Transport and Tourism (MLIT) [32]. This process concentrated the analysis on 200,012 grid cells containing land classified as “paddy fields” or “other cropland.”
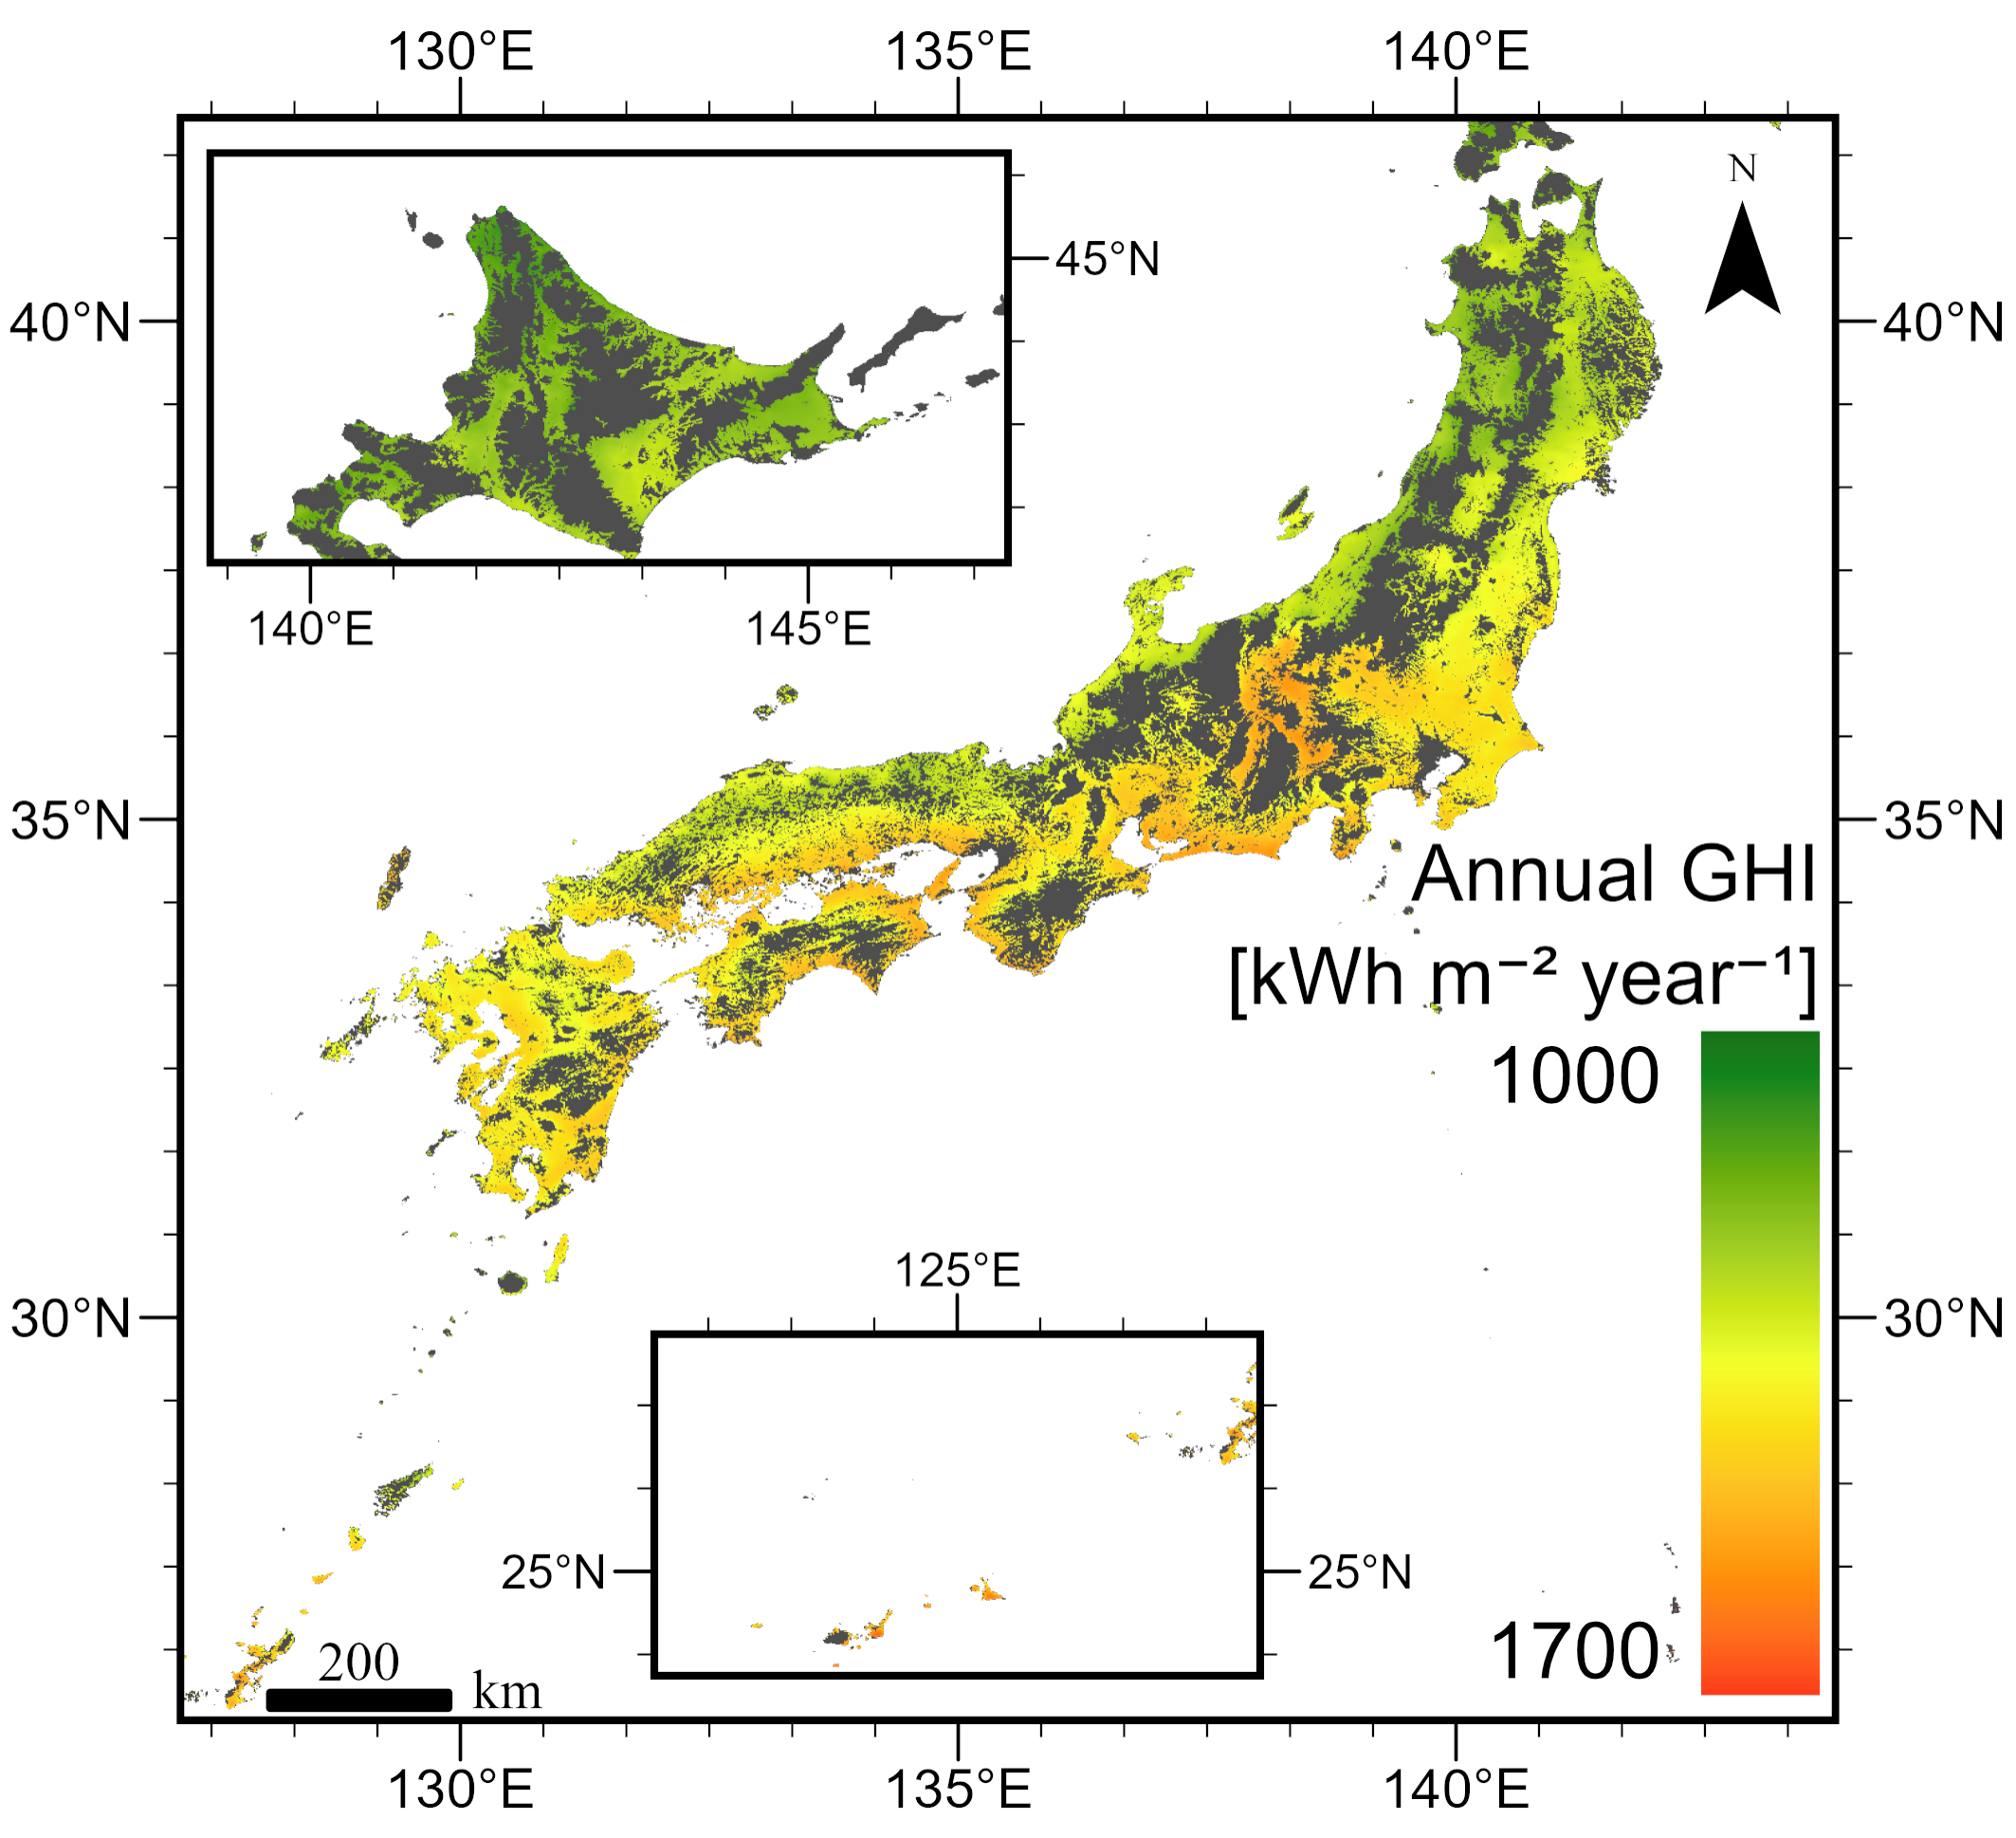
Meteorological data for the specified grid cells were sourced from the MONSOLA-20 database, which is accessible to the public via the New Energy and Industrial Technology Development Organization (NEDO). This database offers monthly typical meteorological year (TMY) data for each cell, derived from both ground and satellite observations spanning 2010 to 2018. The dataset encompasses global horizontal irradiation (GHI), diffuse horizontal irradiation (DHI), global tilted irradiation (GTI), temperature, and the annual optimal tilt angle for maximizing annual solar radiation [33]. Figure 2 illustrates the spatial distribution of GHI within the agricultural grid cells selected for this analysis.

2.2. Agrivoltaic Techno-Economic Modeling

2.2.1. Simulation of Crop Light Environment and Power Generation

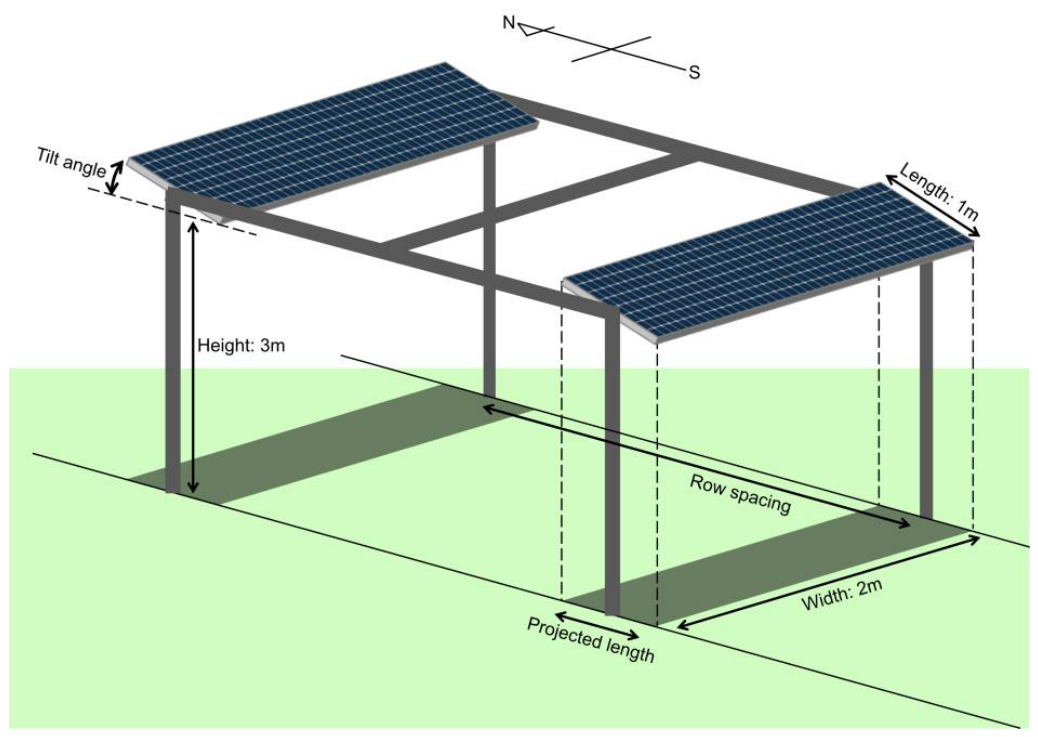
This study assessed an elevated fixed-tilt AVS configuration (Figure 3). Small-scale facilities (<50 kWp) of this type constitute the predominant form of AVS currently deployed in Japan [34]. The system was engineered to be compatible with standard agricultural machinery, featuring a clearance height of 3 m from the ground to the bottom edge of the photovoltaic (PV) modules. The study assumed the use of bifacial crystalline silicon PV modules, each with dimensions of 1 m × 2 m and a rated power output of 400 Wp, consistent with the typical specifications for utility-scale installations [35]. The modules were oriented facing south. For the module tilt angle, two distinct scenarios were evaluated for each grid cell: (1) the local optimal tilt angle, as provided by the MONSOLA-20 database, and (2) the horizontal (0°) installation. This dual-scenario approach was adopted because, while an optimal tilt angle maximizes energy capture per module, it necessitates wider row spacing to avoid inter-row shading, potentially reducing the overall energy density (annual energy yield per unit of land area). Conversely, a horizontal configuration allows for denser module placement, which can, in some cases, result in a higher energy density despite a lower capacity factor per module [36]. The pGCR is the ratio of the horizontal projected area of the PV modules to the total land area and is determined by the module width, tilt angle, and row-to-row distance.
In this study, we integrated two principal simulation components, agricultural productivity and solar power generation, and conducted a techno-economic analysis. The daily light integral (DLI), which quantifies the total amount of photosynthetically active radiation incident on a horizontal surface over a 24-h period, was employed as the primary indicator for the agricultural sector. The standard DLI at the crop canopy level (DLIcanopy) was calculated using a model from previous studies that considered the direct and diffuse components of region-specific solar radiation and pGCR [26]. Furthermore, the energy density, defined as the annual electricity generation per unit area (kWh m−2 year−1), was determined using a two-step process. Initially, the specific yield per kWp (kWh kWp−1) was estimated using the methodology outlined in Japanese Industrial Standard (JIS) C 8907, which incorporates region-specific variations in conversion efficiency through the use of GTI and temperature-dependent design coefficients K [37]. Subsequently, the energy density for each design was calculated by multiplying the PV density (kWp m−2) by the bifacial energy gain factor (BGe, unitless). The BGe was calculated based on the module height, tilt angle, bifaciality factor of 0.7, ground coverage ratio (GCR), and albedo coefficient of 0.2 [36,38].

2.2.2. LCOE Formulation for Agrivoltaic Systems

To quantitatively evaluate the economic feasibility of AVS, this study employed LCOE as the standard metric for comparing power generation projects. The LCOE was determined based on the total lifetime cost and lifetime electricity generation, using the following formula:
L C O E = I 0 + t = 1 n A t · 1 + i t t = 1 n M t , e l · 1 + i t
Here, I0 represents the CAPEX, At denotes the annual OPEX in year t, Mt,el signifies the annual electricity generation, n is the system’s useful life, and i is the discount rate. Although Mt,el does not directly represent a monetary value, its value was discounted to the base date because it directly influences the project’s electricity sales revenue [24].
A central aspect of our model involved the decomposition of cost structures to accurately represent the distinct techno-economic characteristics of AVS. We classified expenditures into capacity-based costs, such as PV modules and inverters, and land-based costs, such as mounting structures and site preparation. A reduction in the pGCR to maintain optimal crop light conditions results in decreased capacity-based costs and electricity generation, whereas land-based costs remain unchanged, thereby increasing the LCOE. This differentiation facilitated a more precise evaluation of the economic trade-offs inherent in AVS design [27,39]. The LCOE formulation above is focused on the power-generation sector and does not incorporate agricultural revenues or costs. Accordingly, the results of this analysis are directly comparable with prior AVS economic studies that similarly place the agricultural sector outside the system boundary of the LCOE calculation—reflecting both the distinct economic nature of the power-generation and farming operations and the fact that electricity revenues account for the predominant share of AVS project economics [23,24,40]. This modeling choice is also consistent with the current Japanese context, in which power-generation and farming activities are typically operated by separate entities [18].
Economic parameters were primarily established based on surveys and research conducted in Japan [14,39,41,42,43]. The detailed CAPEX and OPEX values are presented in Table 1 and Table 2. Land costs were treated as a spatially variable factor, in contrast to the other uniform cost parameters. For each grid cell, the land cost was computed as an area-weighted average of prefectural-level paddy-field and upland-field farm rents, with weights determined by the proportional composition of paddy fields and other cropland within the cell [32,43]. Because this study primarily aimed to elucidate the spatial variation in LCOE clearly attributable to meteorological conditions and the corresponding site-specific system design, cost parameters other than land rent—such as labor costs, subsidies, tax incentives, project-specific financing, and grid-connection conditions—were applied as uniform values or addressed via sensitivity analysis rather than spatial variables. This approach maintains the interpretability of cross-regional comparison [44]. The lifetime of the system was assumed to be 25 years with a discount rate of 3% [45,46]. To facilitate comparison with international studies, particularly those from Europe and the United States, all LCOE results were converted to euros (EUR) using the annual average exchange rate for 2024 as published by the European Central Bank [47].

2.3. Cost-Based Design Optimization

The primary analytical methodology employed in this study involved determining the optimal AVS design for each grid cell across Japan, with the aim of maximizing economic performance while ensuring agricultural sustainability. This methodology was formally articulated as an optimization problem, with the objective function being the minimization of the LCOE. The decision variables included the tilt angle of the PV modules, which could be either horizontal (0°) or the local annual optimal angle, and the pGCR. This optimization process adhered to two principal constraints that were required to be simultaneously satisfied. The first agronomic constraint required that the average DLIcanopy during the cultivation period (May to October), which corresponds to Japan’s major crop-growing season, be maintained at a minimum value of 25 mol m−2 day−1 [48,49,50]. This target value was selected based on previous studies of DLI thresholds for a broad range of crops, including shade-intolerant species, and represents a representative baseline applicable to most commonly cultivated crops in Japan [27,51,52]. The second technical constraint specified that pGCR must not exceed the maximum allowable value (pGCRmax) to prevent inter-row shading. This pGCRmax was determined for each grid based on the minimum row spacing required to avoid row-to-row shading at 9:00 AM and 3:00 PM on the winter solstice, a criterion aligned with the Japanese photovoltaic design guidelines [53].
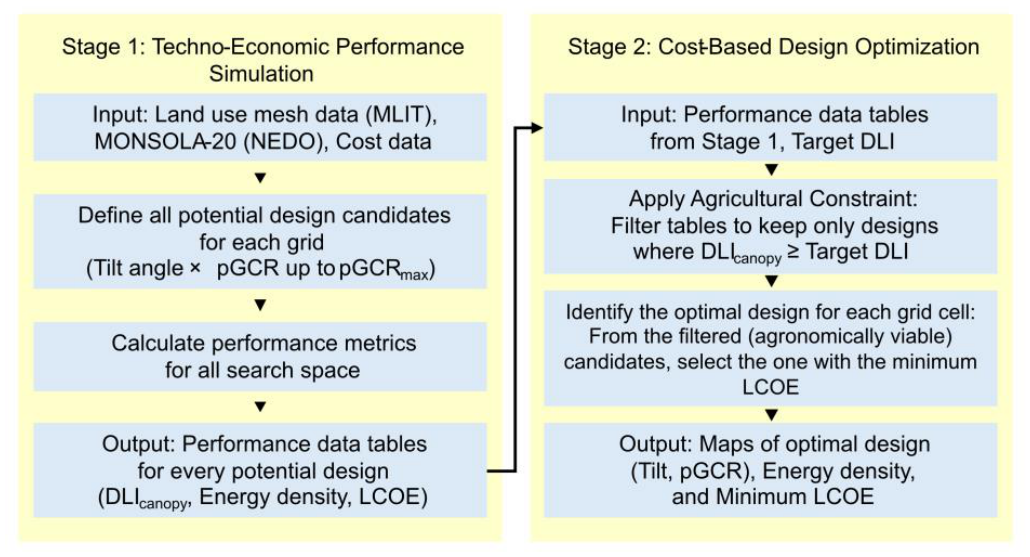
To address this optimization problem, we executed the two-stage computational process depicted in Figure 4 across all 200,012 grid cells. In the initial stage, we conducted a comprehensive simulation of the techno-economic performance of all potential design candidates. For each grid, we delineated a search space comprising all combinations of the two tilt angle options and pGCR values in 1% increments constrained by pGCRmax. Subsequently, we calculated the performance metrics of the DLIcanopy, annual energy yield, and LCOE for all candidates within this space. In the subsequent stage, we identified the optimal design from the resulting comprehensive performance data table. Initially, we applied agronomic constraints to filter the candidates, retaining only those designs that were agronomically viable when DLIcanopy met or exceeded the target. From this subset of viable options, we identified a single design with the minimum LCOE as the optimal solution for a specific grid. The optimal design parameters derived from this process, along with their corresponding minimum LCOE and energy density values, constitute the foundational data for the high-resolution maps presented in Section 3.

2.4. Sensitivity Analysis

To evaluate the robustness of our model and quantify the impact of key uncertainties on economic outcomes, we conducted two distinct analyses. Initially, a scenario analysis was conducted to assess the influence of the cultivated crop’s light requirements on the economic viability of the AVS. This involved re-executing the optimization process described in Section 2.3 for two additional scenarios and comparing them with the baseline scenario. The three scenarios were: a baseline scenario (target DLI: 25 mol m−2 day−1), a low-DLI scenario for shade-tolerant or shade-loving crops (target DLI: 16 mol m−2 day−1), and a high-DLI scenario for crops with high light demands (target DLI: 30 mol m−2 day−1) [27,54]. The resulting changes in the LCOE were then analyzed to understand the economic sensitivity to agronomic constraints.
Second, a one-at-a-time (OAT) sensitivity analysis was conducted to ascertain the techno-economic factors that most significantly affect the LCOE. In this analysis, four parameters known to substantially impact the economic feasibility of PV projects were selected: PV system efficiency, CAPEX, OPEX, and discount rate [55]. Drawing on previous studies, each parameter was varied by ±20% from its baseline value, which is a range chosen to realistically represent future uncertainties [27,56]. This methodology facilitated the systematic isolation and quantification of each parameter’s individual effect on the final LCOE results, thereby identifying the most critical drivers of the economic viability of AVS projects.
Finally, to assess the robustness of our model against potential interactions, we conducted a two-variable sensitivity analysis. In this assessment, the two most influential variables identified by the OAT sensitivity analysis were varied simultaneously to evaluate their combined effects on the LCOE.

3. Results

3.1. Spatial Distribution of Optimal Agrivoltaic System Design

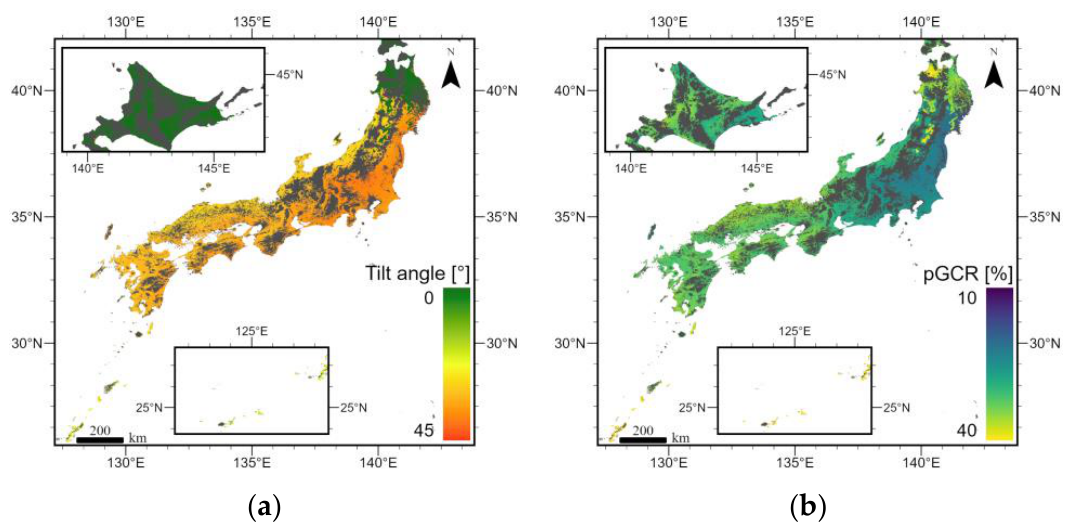
Figure 5 illustrates the distribution of the optimal designs identified through the procedure outlined in Section 2.3. For 24.74% of the grid cells centered in northern Japan, the horizontal scenario was selected as the PV module tilt angle. The nationwide average optimal pGCR was 30.38% (σ = 4.42). In northern regions characterized by low irradiance and high latitude, a smaller (horizontal) panel tilt angle effectively reduced relative land-based costs, such as mounting structures, per unit of annual power generation, thereby resulting in a lower LCOE. In the eastern to central regions with moderate irradiance and latitude, designs incorporating relatively low pGCR and larger tilt angles (annual optimum) were predominantly selected. Conversely, in the southwestern region, characterized by high irradiance and low latitude, designs with denser layouts (shorter row spacing) were able to satisfy DLI constraints, leading to a tendency for higher optimal pGCR values.

3.2. Spatial Distribution of Energy Density

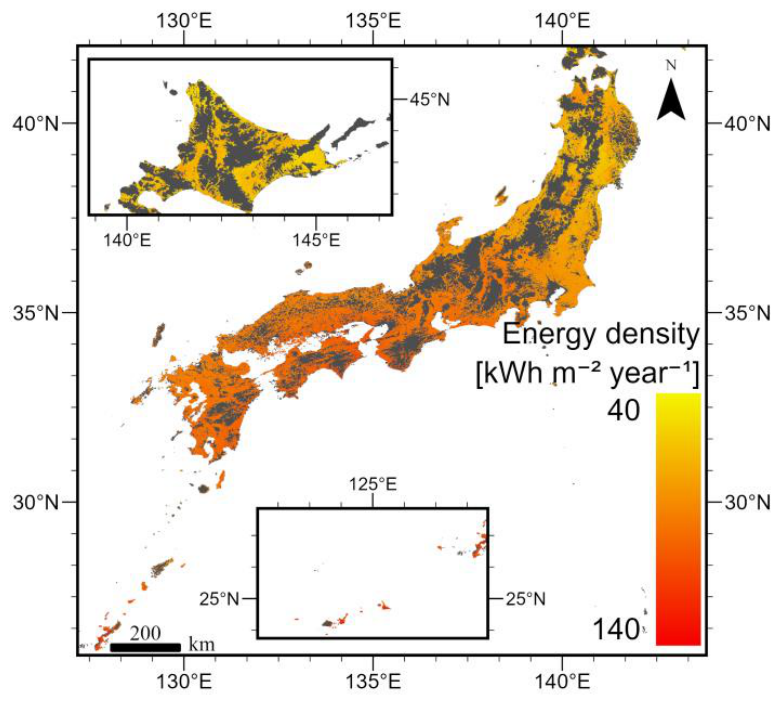
The spatial distribution of the annual power generation per unit area, as derived from the optimal AVS design for each grid cell, is depicted in Figure 6. The nationwide average energy density was calculated to be 80.15 kWh m−2 year−1 (σ = 13.38). In the Southwest region, characterized by a high capacity factor and a high pGCR, the energy density was approximately 1.5 times greater than that of the Northern region. This indicates that the land area required for an AVS farm to satisfy an equivalent level of energy demand in the south is only approximately two-thirds of that needed in the north.

3.3. Spatial Distribution of LCOE

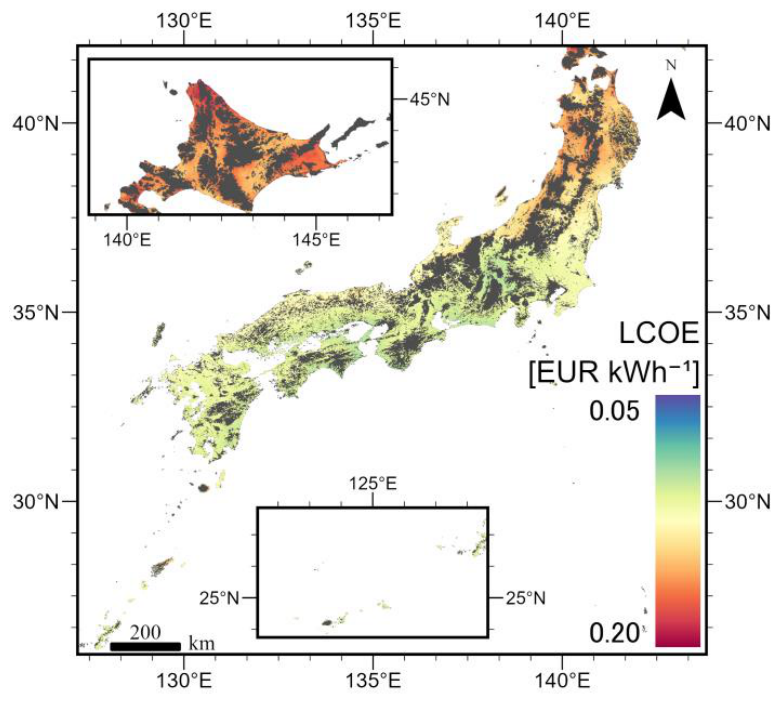
Figure 7 illustrates the spatial distribution of the LCOE across Japan for the optimized AVS design. The national average LCOE was determined to be 0.1021 EUR kWh−1 (σ = 0.0135). The map reveals a north–south gradient, with lower LCOE values (ranging from blue to green) predominantly located in the southern regions. Conversely, relatively high LCOE values were observed in northern Japan. In these areas, two factors contributed to a higher LCOE: a lower pGCR to satisfy DLI constraints and a reduced capacity factor owing to diminished irradiance.
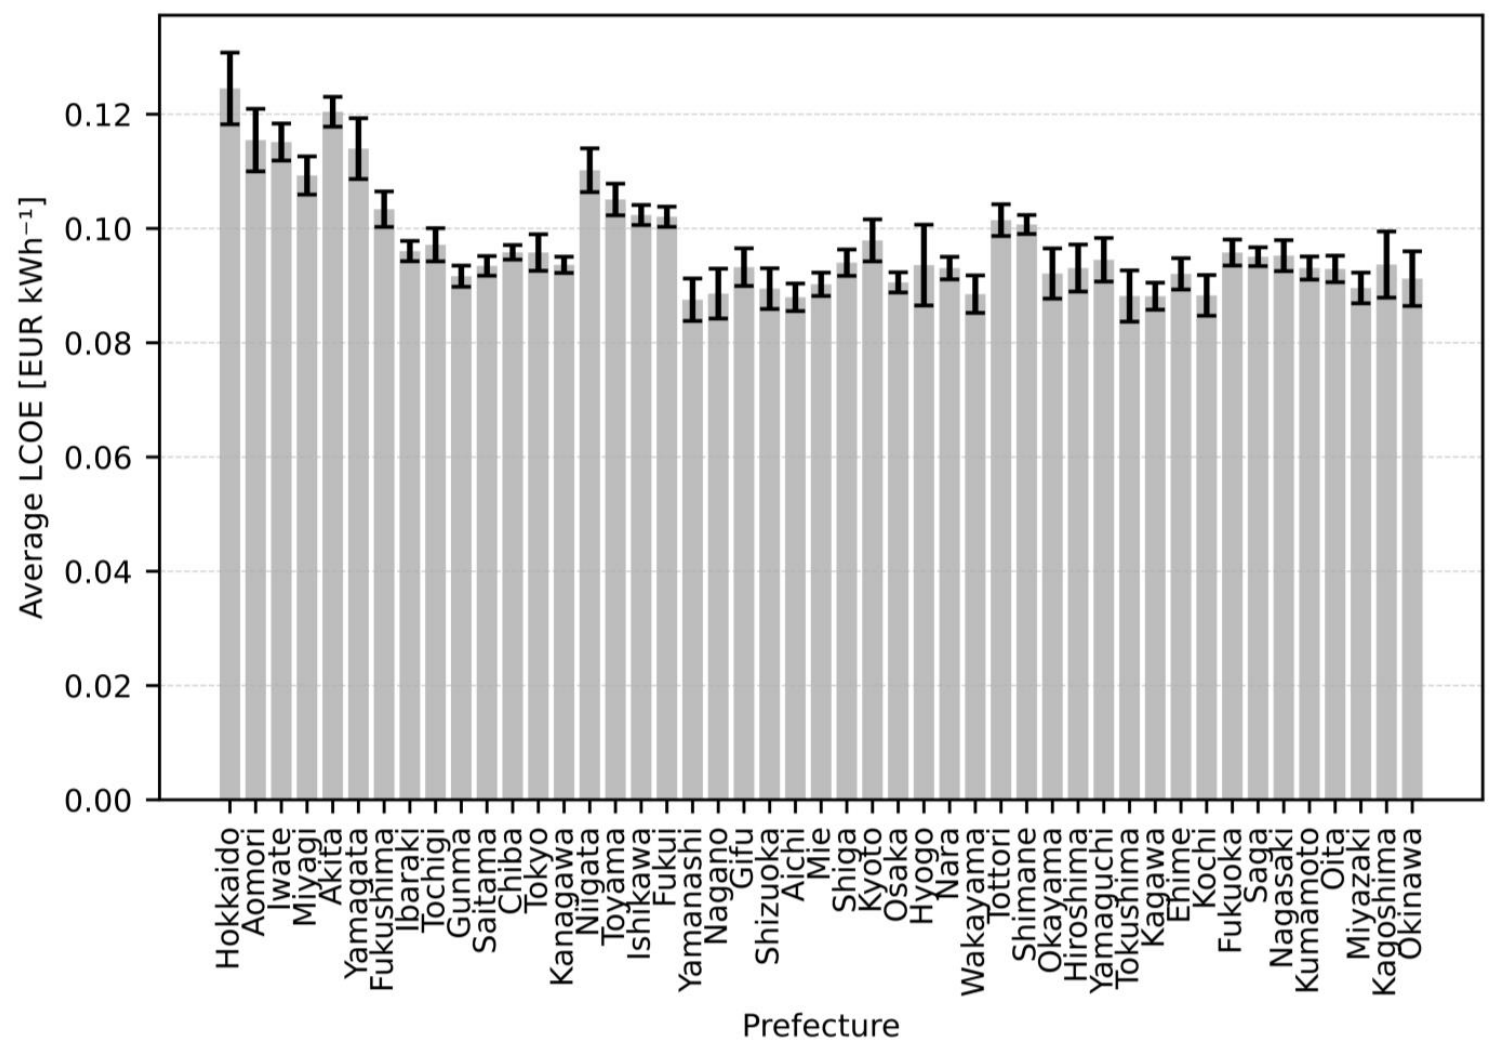
Figure 8 presents the results of classifying and aggregating the calculated LCOE values for each grid cell at the prefecture level, which serves as the fundamental administrative unit. In this aggregation process, grid cells that spanned multiple prefectures were assigned to the administrative unit with the largest overlapping area. The average LCOE by prefecture exhibited considerable variation, ranging from a minimum of 0.0869 EUR kWh−1 in Yamanashi Prefecture to a maximum of 0.1235 EUR kWh−1 in Hokkaido Prefecture, indicating a substantial cost disparity of up to 42.12% between these two extremes. Notably, Yamanashi, Aichi, and Kagawa Prefectures, situated in central to southwestern Honshu, demonstrated high economic feasibility, whereas Hokkaido, Akita, and Aomori Prefectures, located in northern Honshu and beyond, tended to display higher LCOEs.

3.4. Scenario and Sensitivity Analysis of LCOE

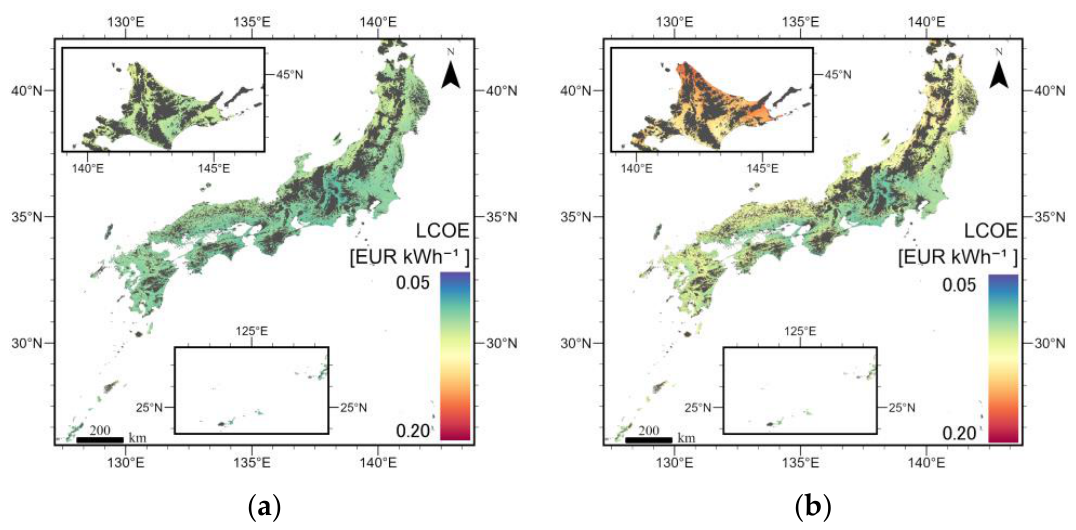
The influence of agricultural limitations on LCOE was assessed by modifying the target DLI necessary for optimal crop growth. As illustrated in Figure 9 and summarized in Table 3, adjustments to the target DLI substantially affected the optimal system configuration and its economic viability. Reducing the target DLI to 16 mol m−2 day−1 facilitated a design that prioritized power generation, thereby decreasing the national average LCOE by 8.13% to 0.0938 EUR kWh−1. In this context, the average pGCR increased to 57.43%, and the energy density improved to 118.54 kWh m−2 year−1, with the LCOE remaining below 0.15 EUR kWh−1 even in northern Japan. Conversely, elevating the DLI requirement to 30 mol m−2 day−1 imposed more stringent constraints on the photovoltaic module density, resulting in a 10.38% increase in the average LCOE to 0.1127 EUR kWh−1. Additionally, the number of grid cells achieving an LCOE below 0.10 EUR kWh−1 was reduced to approximately half of that in the baseline scenario. Furthermore, the LCOE differences among the DLI scenarios exhibited a clear spatial pattern. The national average difference in LCOE between the low-DLI and high-DLI scenarios was 0.0189 EUR kWh−1; however, this difference was not spatially uniform. It was particularly pronounced in the northeastern regions, where it reached approximately 0.02–0.06 EUR kWh−1. These results indicate that the target DLI constraint influences not only the national average LCOE but also the spatial distribution of what may be termed the crop-light-related LCOE premium—the additional electricity-side cost associated with maintaining higher light availability at the crop canopy.
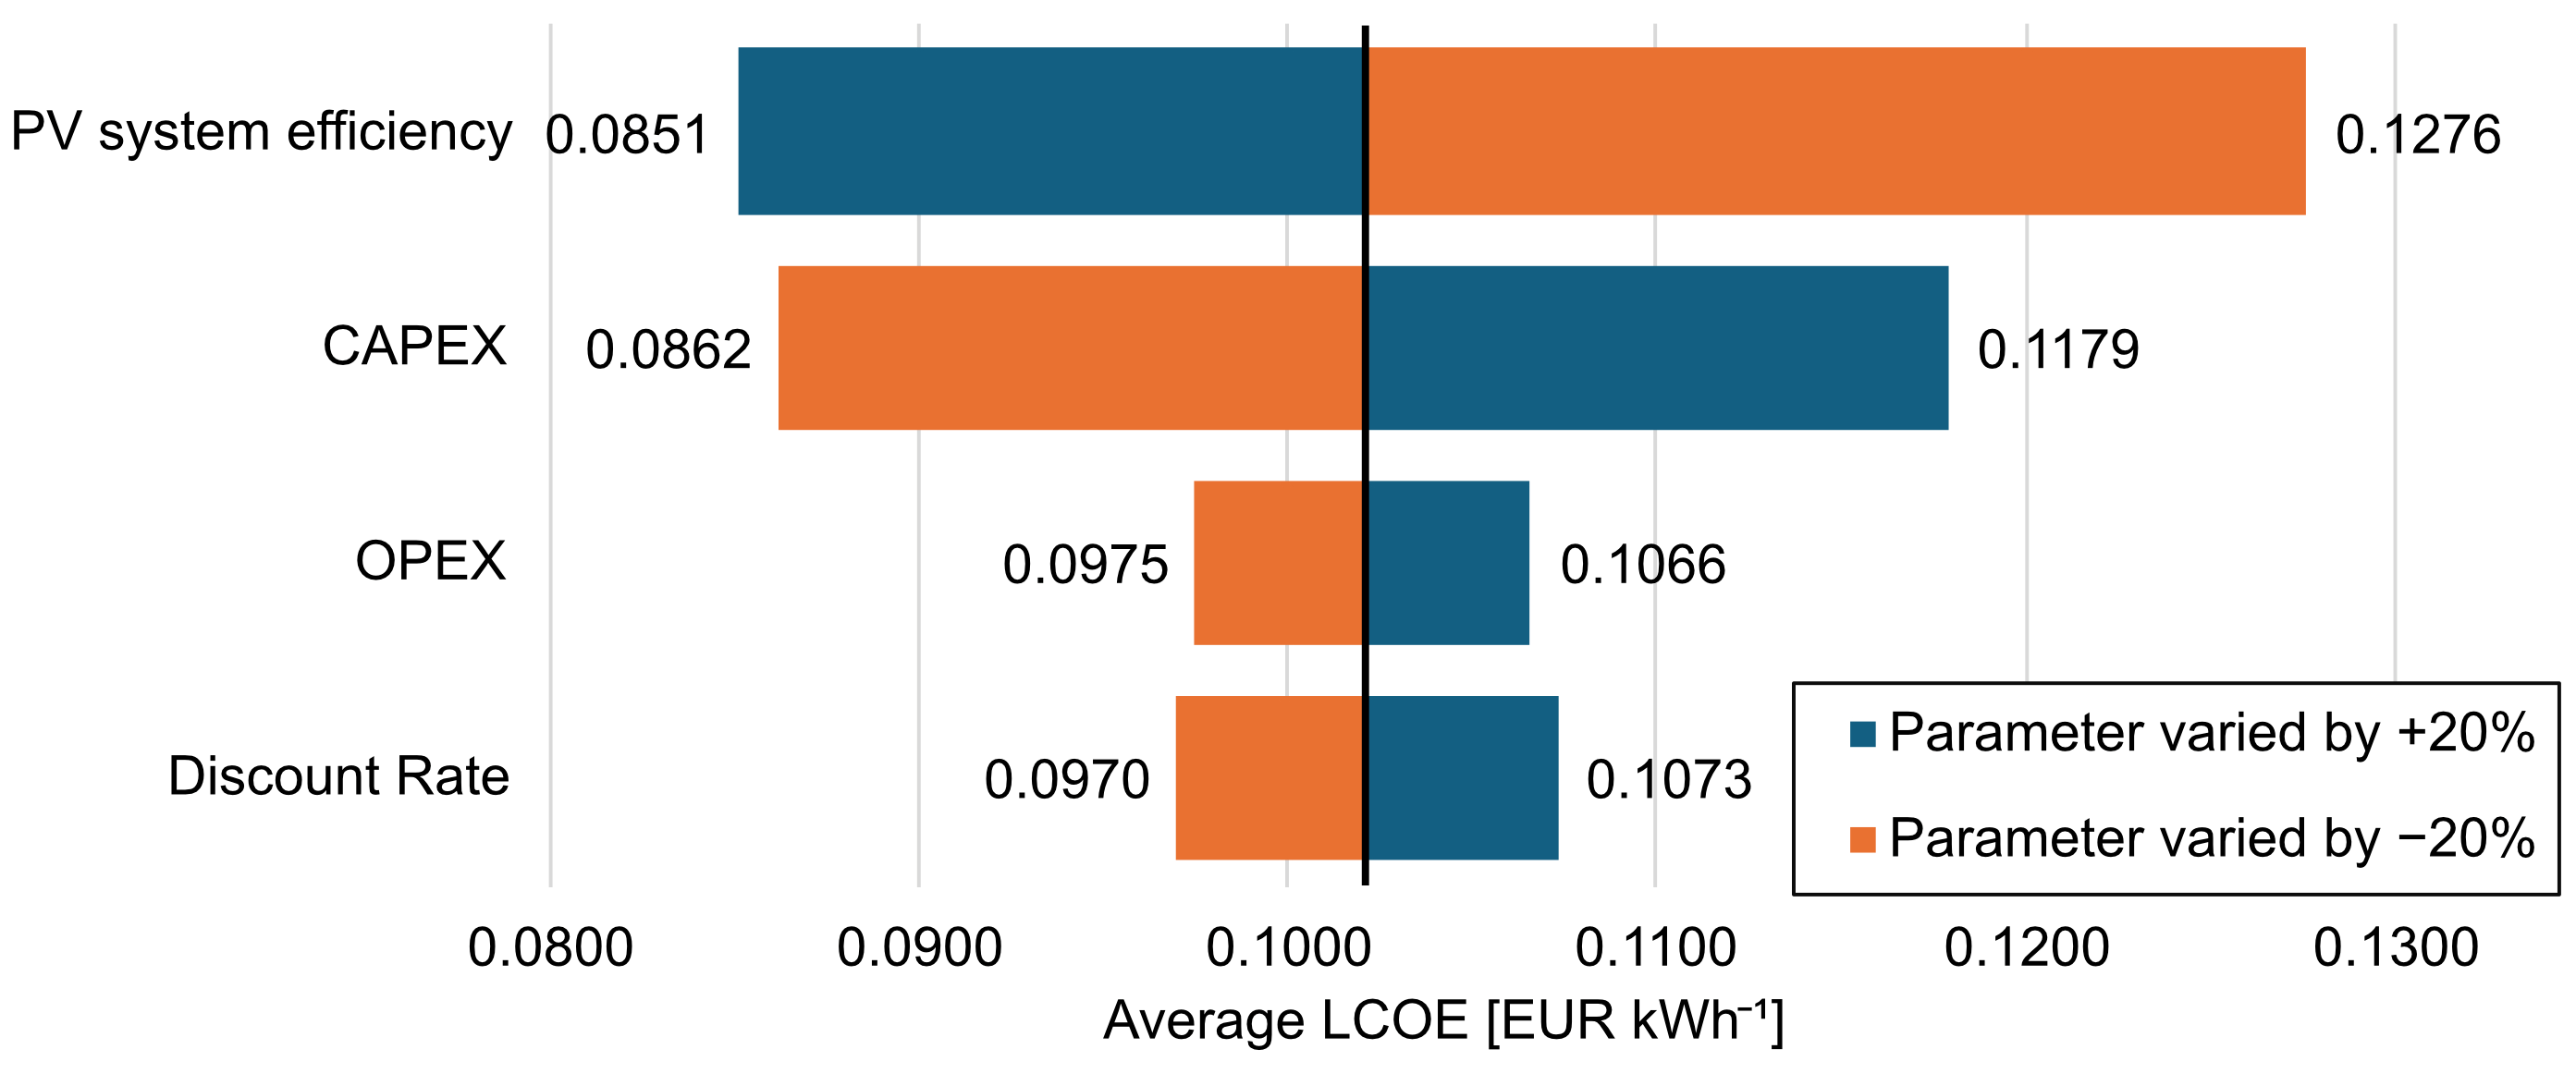
To ascertain the principal economic determinants of AVS LCOE, an OAT sensitivity analysis was performed, with the findings illustrated in a tornado chart (Figure 10). This analysis involved varying the key parameters by ±20% from their baseline values, identifying the PV system efficiency and CAPEX as the most significant factors. A ±20% alteration in the PV system efficiency resulted in LCOE fluctuations between 0.0851 and 0.1276 EUR kWh−1, indicating the greatest impact among the variables examined. CAPEX emerged as the second most critical factor, with a ±20% variation leading to an LCOE range of 0.0862–0.1179 EUR kWh−1. In contrast, the influence of OPEX and the discount rate was minimal, suggesting that the economic feasibility of AVS projects is more susceptible to initial investment costs and technical performance than to operating expenses or the discount rate.
Furthermore, a two-variable sensitivity analysis was conducted to evaluate the combined impact of the two most dominant parameters: PV system efficiency and CAPEX (Table 4). When PV system efficiency decreased by 20% and CAPEX increased by 20% simultaneously, the national average LCOE reached its maximum value of 0.1474 EUR kWh−1. Conversely, when PV system efficiency increased by 20% and CAPEX decreased by 20%, the LCOE reached its minimum value of 0.0718 EUR kWh−1. The direction of LCOE changes under simultaneous parameter variations remained consistent with the OAT sensitivity analysis. Within the tested range, no strong interaction effects or non-linear responses that would reverse the main effects were observed. These results support the finding that PV system efficiency and CAPEX are the primary drivers of AVS LCOE.

4. Discussion

This study demonstrates that the economic feasibility of nation-scale AVS is structurally determined by the interplay of spatial heterogeneity in solar resources, crop light requirements (DLI), and techno-economic parameters. Regarding RQ1, our findings indicate that the optimal AVS design is influenced by regional solar irradiation and latitude, demonstrating clear spatial variation. The grids where the horizontal module setting was optimal were concentrated in northern Japan, where a smaller tilt angle proved effective in reducing land-based costs per unit of electricity generated while avoiding inter-row shading. Conversely, the irradiation-rich southwest region supported denser layouts with higher pGCR. Addressing RQ2, these adaptive designs create a distinct north-to-south gradient in LCOE, yielding a national average LCOE of 0.1021 EUR kWh−1. Lower LCOE trends were observed in the southern areas, where higher capacity factors and higher capacity densities still achieved the target DLI. Furthermore, regarding RQ3, our analysis revealed that the economic viability of AVS was strongly influenced by the type of crop cultivated, as higher DLI constraints strictly limit module density and elevate costs. Enhancing power generation efficiency and reducing capital costs are crucial; a two-variable analysis indicated no strong interaction effects within the tested range, suggesting that the two parameters contribute largely additively to LCOE and remain the dominant drivers. By executing grid-level optimization that minimizes electricity-sector LCOE under explicit DLI constraints, this framework moves beyond traditional uniform design assumptions to capture the detailed spatial economics of AVS.
The principal methodological contribution of this study is the proposal of a techno-economic optimization framework that explicitly integrates DLI-based crop-light constraints. Previous experimental and modeling studies have provided important insights into design strategies that maximize land-use efficiency and economic feasibility of AVS across diverse system configurations [23,57,58]. In parallel, GIS-based geospatial assessments have advanced the identification of suitable sites and technical potential across multiple countries and regions [59,60]. Nevertheless, a methodological gap between these two bodies of work has left the combined influence of site characteristics, crop light requirements, and power generation economics on AVS feasibility only partially resolved [27,61,62]. This study complements these efforts by executing design optimization at the 1-km grid level under explicit DLI constraints, replacing conventional uniform design and capacity density assumptions. Regarding the LCOE estimates, the national average of 0.1021 EUR kWh−1 falls within the range reported by recent studies that have quantified AVS LCOE [10]; in particular, broadly comparable values have been reported for vertical AVS demonstrations in Belgium and South Korea [55,63], lending confidence to the economic assumptions adopted here. Collectively, this framework enables a detailed geographic interpretation of AVS economic feasibility under agricultural constraints.
The elevated fixed-tilt AVS LCOE maps (Figure 7 and Figure 9) provide evidence for stakeholders to screen suitable locations and inform deployment and support strategies. Our estimated national average LCOE of 0.1021 EUR kWh−1 remains higher than the 2025 FIT for 10–50 kWp solar PV in Japan (10.1 JPY kWh−1; 0.0671 EUR kWh−1) [14]. This disparity is expected due to the higher capital costs of elevated structures and lower capacity densities required to satisfy crop-light constraints. Accordingly, cases in which elevated fixed-tilt AVS outperforms conventional separate land use based solely on simple project-level profitability considerations are likely to be limited, and its economic value may be better understood in contexts where farmland preservation, mitigation of land-use conflicts, or microclimate co-benefits are explicitly valued. Conversely, the AVS LCOE frequently falls below the FY2024 average retail electricity prices for the residential (32.80 JPY kWh−1; 0.2002 EUR kWh−1) and industrial (26.23 JPY kWh−1; 0.1601 EUR kWh−1) sectors [64]. While this does not imply universal profitability, it highlights the relevance of AVS for self-consumption and local energy systems. Although MAFF estimates a break-even point of 16 JPY kWh−1 (0.098 EUR kWh−1) for AVS [65], our findings suggest this threshold varies significantly based on regional irradiation and crop light requirements. As illustrated by the inter- and intra-prefectural variations in Figure 8, a single national benchmark should be interpreted with caution. This intra-prefectural heterogeneity implies that approaches relying on a few representative sites risk obscuring meso-scale economic variability, and it underscores the importance of high spatial resolution analysis for accurate AVS feasibility assessment. Collectively, these findings suggest that region-specific deployment planning and differentiated support measures are more appropriate than nationally uniform benchmarks.
The differences across DLI scenarios can be interpreted as the sensitivity of AVS LCOE to crop light requirements. Specifically, this sensitivity represents the additional electricity-side cost required to sustain crops with higher light demands, i.e., a crop-light-related LCOE premium. Critically, this sensitivity is not spatially uniform (Figure 9). It is particularly pronounced in northeastern Japan, where limited solar resource more strongly constrains system design; meeting higher DLI targets imposes tighter limits on pGCR, thereby amplifying the LCOE differences between scenarios. This spatial heterogeneity implies that cultivar selection has greater economic importance where LCOE is more sensitive to crop light requirements. Previous studies have shown that responses to reduced light vary among crops and cultivars [58]. Reported shade-acclimation responses include morphological adjustments such as increased specific leaf area and physiological changes affecting photosynthetic efficiency, while their effects on crop performance can extend to yield and, in fruit crops, quality traits such as soluble sugar content and acidity [58, 66]. These findings highlight the importance of cultivar-level assessment when translating crop-light requirements into AVS design constraints. Accordingly, selecting cultivars that maintain acceptable yield and quality under reduced light availability may allow less restrictive DLI constraints. In regions with high LCOE sensitivity, the resulting increase in permissible pGCR can yield a greater reduction in electricity generation costs [3]. At the same time, the structural tendency for lower-DLI crops to allow higher pGCR and lower LCOEs provides a partial explanation for the risk of economically motivated crop selection observed in Japanese AVS practice, commonly referred to as pseudo-agriculture [27]. These crop-light-related economic dynamics interact with broader techno-economic drivers, including PV conversion efficiency and capital costs, shaping overall system performance and cost outcomes.
The analysis suggests that the LCOE of AVS is primarily influenced by the structural interplay between agricultural requirements, PV efficiency, and CAPEX. Specifically, DLI constraints govern the maximum permissible projected ground coverage ratio, which directly influences LCOE through its impact on capacity density, positioning crop-light requirements as a central economic determinant. Our OAT sensitivity analysis indicates that PV efficiency and CAPEX remain the dominant techno-economic drivers, whereas operational expenditures and discount rates exert a relatively minor influence. Furthermore, the two-variable sensitivity analysis indicated no strong interaction effects within the tested range, suggesting that the effects of PV efficiency and CAPEX on LCOE are largely additive rather than strictly independent. This pattern of PV performance and capital cost dominance is consistent with findings from previous studies employing probabilistic uncertainty analysis [12,57], reinforcing the conclusion that technological advancement and cost reduction remain the principal levers for improving AVS competitiveness. Looking beyond current conditions, emerging system configurations such as solar tracking and vertical AVS could alter both energy yield and CAPEX structures to reduce absolute LCOE values [11,57,63]. Additionally, despite affecting ambient temperature and crop water demand, climate change may lower the LCOE in mid-latitude regions like Japan through projected increases in solar radiation and PV energy output [67]. The broad spatial gradient driven by solar resource distribution and DLI constraints is nonetheless expected to retain its general structure, though the robustness of site-specific estimates should be understood within the boundaries of the modeling framework applied here.
The system boundaries and methodological choices in this study were defined to establish a transparent, national-scale screening baseline for AVS. Within this framework, the LCOE approach focuses on electricity-sector economics because, in a typical AVS project, electricity revenues constitute the dominant component of project cash flows, whereas agricultural revenues and costs represent a secondary income stream whose inclusion would have a limited effect on the primary spatial patterns identified here [13,23]; this assumption also aligns with the institutionally prevalent business structure in Japan [18]. Although incorporating cross-sector synergies could reduce the effective LCOE or improve whole-project returns [9], the present framework is intended as a complementary baseline rather than a substitute for integrated agro-economic analyses. To further isolate the influence of biophysical conditions, spatial cost variables were deliberately restricted to land rents, thereby enabling explicit delineation of cost variations driven by meteorological conditions and essential design adaptations; while localized feasibility assessments must eventually incorporate regional variations in labor costs, subsidies, and grid-connection fees, these controlled geographic parameters help prevent administrative factors from obscuring fundamental relationships. Furthermore, anchoring the evaluation to an elevated fixed-tilt architecture provides a representative standard for current domestic deployments [34], while the underlying methodology of constrained cost minimization remains adaptable to alternative systems with the potential to reduce LCOE, such as single-axis tracking or vertical arrays [57]. Finally, DLI serves as a spatially tractable indicator for crop light availability suited to national-scale screening. However, meeting a prescribed DLI does not guarantee the maintenance of crop yield or quality. Crop responses under AVS are crop- and cultivar-specific, reflecting differences in shade tolerance and acclimation, and are further shaped by spatially and temporally heterogeneous light and microclimatic conditions [58]. In particular, AVS can affect crop-specific quality traits, including compositional attributes, while the effects of AVS-induced microclimatic changes on crop nutritional value remain insufficiently characterized [66, 68]. Although microclimate-coupled crop models provide a means for more direct prediction of crop performance, their application to AVS is limited by complex interactions among light, temperature, humidity, water balance, and soil conditions. Addressing these uncertainties will require standardized and long-term field observations and stronger model validation [58]. Incorporating improved crop-response modeling and crop-specific quality assessment into the present framework would enable its extension toward fully coupled agro-economic assessment.

5. Conclusions

This study developed a GIS-based techno-economic framework to evaluate the spatial distribution of the LCOE for agronomically constrained elevated fixed-tilt AVS across Japan. Addressing RQ1, the analysis revealed that the optimal module tilt angle and pGCR vary substantially across the country, with design parameters driven by site-specific solar resource conditions and crop-imposed DLI targets. Addressing RQ2, the resulting LCOE map exhibits a pronounced spatial gradient: central to southwestern Japan, where higher solar irradiance simultaneously enables greater permissible pGCR and higher capacity factors, achieves the lowest electricity-side costs, whereas northern regions face structurally higher LCOE. The national average LCOE was 0.1021 EUR kWh−1, but this figure masks considerable spatial heterogeneity that uniform design assumptions would obscure. Addressing RQ3, LCOE is highly sensitive to the specific light requirements of the crop, with photovoltaic system efficiency and capital expenditures acting as the most influential techno-economic determinants.
By integrating DLI-based agronomic light constraints into a grid-level design optimization, the primary contribution of this study lies in visualizing the detailed spatial heterogeneity of AVS electricity-side costs, moving beyond previous assessments that assume uniform designs. The resulting high-resolution, nation-scale LCOE maps serve as a practical tool, providing policymakers and developers with objective evidence for region-specific deployment planning. The framework should be interpreted as a complementary screening tool rather than a substitute for integrated assessments: future work incorporating regional cost factors, agro-economic modeling, and alternative system configurations will be necessary to advance from this electricity-side baseline toward a fuller understanding of whole-project AVS economics.

Author Contributions

Conceptualization, H.N. and S.O.; Methodology, H.N.; Software, H.N.; Validation, H.N.; Formal Analysis, H.N.; Investigation, H.N.; Resources, S.O.; Data Curation, H.N.; Writing—Original Draft Preparation, H.N.; Writing—Review and Editing, H.N. and S.O.; Visualization, H.N.; Supervision, S.O.; Project Administration, S.O.; Funding Acquisition, S.O. All authors have read and agreed to the published version of the manuscript.

Funding

This research was funded by JSPS KAKENHI grant number JP25K03326 and SPIRIT2 2024 of Kyoto University.

Data Availability Statement

The original contributions presented in this study are included in the article. Further inquiries can be directed to the corresponding author.

Conflicts of Interest

The authors declare no conflicts of interest.

References

  1. International Energy Agency (IEA). Renewables 2024. Analysis and Forecasts to 2030. Available online: https://www.iea.org/reports/renewables-2024 (accessed on 19 February 2026).
  2. Adeh, E.H.; Good, S.P.; Calaf, M.; Higgins, C.W. Solar PV Power Potential Is Greatest Over Croplands. Sci. Rep. 2019, 9, 11442. [Google Scholar] [CrossRef] [Scilit] [PubMed]
  3. Asa’a, S.; Reher, T.; Rongé, J.; Diels, J.; Poortmans, J.; Radhakrishnan, H.S.; van der Heide, A.; Van de Poel, B.; Daenen, M. A Multidisciplinary View on Agrivoltaics: Future of Energy and Agriculture. Renew. Sustain. Energy Rev. 2024, 200, 114515. [Google Scholar] [CrossRef] [Scilit]
  4. Goetzberger, A.; Zastrow, A. Kartoffeln Unter Dem Kollektor. Sonnenenergie 1981, 6, 19–22. [Google Scholar]
  5. Dupraz, C.; Marrou, H.; Talbot, G.; Dufour, L.; Nogier, A.; Ferard, Y. Combining Solar Photovoltaic Panels and Food Crops for Optimising Land Use: Towards New Agrivoltaic Schemes. Renew. Energy 2011, 36, 2725–2732. [Google Scholar] [CrossRef] [Scilit]
  6. Martínez-Hernández, C.J.; Acosta-Banda, A.; Aguilar-Esteva, V.; Hechavarría Difur, L.; Cortina Marrero, H.J.; Patiño Ortíz, M.; Patiño Ortíz, J. Efficiency, Sustainability and Governance of Agrivoltaic Systems: A PRISMA-Based Systematic Review of Global Evidence (2010–2025). Energies 2026, 19, 1418. [Google Scholar] [CrossRef] [Scilit]
  7. Barron-Gafford, G.A.; Pavao-Zuckerman, M.A.; Minor, R.L.; Sutter, L.F.; Barnett-Moreno, I.; Blackett, D.T.; Thompson, M.; Dimond, K.; Gerlak, A.K.; Nabhan, G.P.; et al. Agrivoltaics Provide Mutual Benefits across the Food–energy–water Nexus in Drylands. Nat. Sustain. 2019, 2, 848–855. [Google Scholar] [CrossRef] [Scilit]
  8. Pandey, G.; Lyden, S.; Franklin, E.; Millar, B.; Harrison, M.T. A Systematic Review of Agrivoltaics on Productivity, Profitability, and Environmental Co-Benefits. Sustain. Prod. Consum. 2025, 56, 13–36. [Google Scholar] [CrossRef] [Scilit]
  9. Trommsdorff, M.; Hopf, M.; Hörnle, O.; Berwind, M.; Schindele, S.; Wydra, K. Can Synergies in Agriculture through an Integration of Solar Energy Reduce the Cost of Agrivoltaics? An Economic Analysis in Apple Farming. Appl. Energy 2023, 350, 121619. [Google Scholar] [CrossRef] [Scilit]
  10. Coluccia, S.; Ruocco, M.; Della Porta, D.; Langella, G. Agrivoltaic Systems: State of the Art and Potential Field Applications. Energy Rep. 2025, 14, 1606–1633. [Google Scholar] [CrossRef] [Scilit]
  11. Bellone, Y.; Santangelo, E.; Assirelli, A.; Zainali, S.; Impollonia, G.; Croci, M.; Campana, P.E.; Amaducci, S. Agricultural Mechanization in Agrivoltaic Systems: Challenges, Adaptation, and Possible Advancements. Renew. Sustain. Energy Rev. 2026, 229, 116661. [Google Scholar] [CrossRef] [Scilit]
  12. Campana, P.E.; Stridh, B.; Hörndahl, T.; Svensson, S.-E.; Zainali, S.; Lu, S.M.; Zidane, T.E.K.; De Luca, P.; Amaducci, S.; Colauzzi, M. Experimental Results, Integrated Model Validation, and Economic Aspects of Agrivoltaic Systems at Northern Latitudes. J. Clean. Prod. 2024, 437, 140235. [Google Scholar] [CrossRef] [Scilit]
  13. IEA. Dual Land Use for Agriculture and Solar Power Production: Overview and Performance of Agrivoltaic Systems. Available online: https://iea-pvps.org/key-topics/dual-land-use-agriculture-solar-power-production/ (accessed on 19 February 2026).
  14. Ministry of Economy, Trade and Industry (METI). Available online: https://www.meti.go.jp/shingikai/santeii/pdf/100_01_00.pdf (accessed on 8 January 2025).
  15. IEA. World Energy Outlook 2024. Available online: https://www.iea.org/reports/world-energy-outlook-2024 (accessed on 24 January 2025).
  16. Ministry of Agriculture, Forestry and Fisheries (MAFF). Available online: https://www.maff.go.jp/j/wpaper/w_maff/r6/index.html (accessed on 26 January 2025).
  17. Koga, H.; Bouzarovski, S.; Petrova, S. Energy Democratisation through Agrivoltaics? The Territorialisation Dynamics of Community-Based Energy Governance in Japan. Sustain. Sci. 2025, 20, 1361–1377. [Google Scholar] [CrossRef] [Scilit]
  18. MAFF. Available online: https://www.maff.go.jp/j/shokusan/renewable/energy/attach/pdf/einou-60.pdf (accessed on 26 June 2025).
  19. MAFF. Available online: https://www.maff.go.jp/j/study/attach/pdf/250609-22.pdf (accessed on 26 June 2025).
  20. Rösch, C.; Fakharizadehshirazi, E. The Spatial Socio-Technical Potential of Agrivoltaics in Germany. Renew. Sustain. Energy Rev. 2024, 202, 114706. [Google Scholar] [CrossRef] [Scilit]
  21. Doedt, C.; Tajima, M.; Iida, T. The Socio-Technical Dynamics of Agrivoltaics in Japan. AgriVoltaics Conf. Proc. 2024, 2, 1–8. [Google Scholar] [CrossRef] [Scilit]
  22. Doedt, C.; Tajima, M.; Iida, T. A Social Media Analysis of the Agrivoltaics Discourse in Japan. AgriVoltaics Conf. Proc. 2025, 3, 1–9. [Google Scholar] [CrossRef] [Scilit]
  23. Agostini, A.; Colauzzi, M.; Amaducci, S. Innovative Agrivoltaic Systems to Produce Sustainable Energy: An Economic and Environmental Assessment. Appl. Energy 2021, 281, 116102. [Google Scholar] [CrossRef] [Scilit]
  24. Schindele, S.; Trommsdorff, M.; Schlaak, A.; Obergfell, T.; Bopp, G.; Reise, C.; Braun, C.; Weselek, A.; Bauerle, A.; Högy, P.; et al. Implementation of Agrophotovoltaics: Techno-Economic Analysis of the Price-Performance Ratio and Its Policy Implications. Appl. Energy 2020, 265, 114737. [Google Scholar] [CrossRef] [Scilit]
  25. National Renewable Energy Laboratory (NREL). Available online: https://www.nlr.gov/docs/fy21osti/77811.pdf (accessed on 12 December 2024).
  26. Nakata, H.; Li, Y.; Ogata, S. Spatial Analysis of Crop Light Model for Optimizing Fixed-Tilt Agrivoltaic System Design Across Japan. Renew. Energy 2026, 265, 125573. [Google Scholar] [CrossRef] [Scilit]
  27. Willockx, B.; Lavaert, C.; Cappelle, J. Geospatial Assessment of Elevated Agrivoltaics on Arable Land in Europe to Highlight the Implications on Design, Land Use and Economic Level. Energy Rep. 2022, 8, 8736–8751. [Google Scholar] [CrossRef] [Scilit]
  28. Feuerbacher, A.; Herrmann, T.; Neuenfeldt, S.; Laub, M.; Gocht, A. Estimating the Economics and Adoption Potential of Agrivoltaics in Germany Using a Farm-Level Bottom-up Approach. Renew. Sustain. Energy Rev. 2022, 168, 112784. [Google Scholar] [CrossRef] [Scilit]
  29. Ahmed, M.S.; Khan, M.R.; Haque, A.; Khan, M.R. Agrivoltaics Analysis in a Techno-Economic Framework: Understanding Why Agrivoltaics on Rice Will Always Be Profitable. Appl. Energy 2022, 323, 119560. [Google Scholar] [CrossRef] [Scilit]
  30. Ministry of the Environment (MOE). Available online: https://www.env.go.jp/en/nature/npr/fcpn/index.html (accessed on 17 August 2025).
  31. Statistics Bureau. Available online: https://www.stat.go.jp/english/data/mesh/05.html (accessed on 24 October 2024).
  32. National Land Information Division. Available online: https://nlftp.mlit.go.jp/ksj/gml/datalist/KsjTmplt-L03-a-2021.html (accessed on 3 September 2025).
  33. New Energy and Industrial Technology Development Organization (NEDO). Available online: https://appww2.infoc.nedo.go.jp/appww/monsola_map.html (accessed on 3 July 2023).
  34. NEDO. Available online: https://www.nedo.go.jp/content/100960288.pdf (accessed on 28 April 2023).
  35. REPOS. Available online: https://repos.env.go.jp/web/ (accessed on 19 February 2026).
  36. IEA. Available online: https://iea-pvps.org/key-topics/bifacial-photovoltaic-modules-and-systems/ (accessed on 1 July 2025).
  37. JIS C 8907:2005; Japanese Industrial Standard. Japanese Standards Association: Tokyo, Japan, 2005; pp. 1–23.
  38. Tsuno, Y.; Tsuchida, S.; Yamada, N.; Oozeki, T. Analysis of variable factors of PV output power generated from rear side irradiance on bifacial photovoltaics and development of a simple model for bifacial energy gain. Proc. JSES Conf. 2022, 2022, 219–222. [Google Scholar]
  39. Saito, K.; Iwata, T. Study on the Optimal Combination of Business Model for Agrivoltaics. J. Jpn. Soc. Energy Resour. 2024, 45, 11–22. [Google Scholar]
  40. Garrod, A.; Hussain, S.N.; Ghosh, A. The Technical and Economic Potential for Crop Based Agrivoltaics in the United Kingdom. Sol. Energy 2024, 277, 112744. [Google Scholar] [CrossRef] [Scilit]
  41. MAFF. Available online: https://www.meti.go.jp/shingikai/enecho/denryoku_gas/saisei_kano/pdf/027_04_00.pdf (accessed on 24 September 2024).
  42. International Renewable Energy Agency (IRENA). Renewable Power Generation Costs in 2021. Available online: https://www.irena.org/publications/2022/Jul/Renewable-Power-Generation-Costs-in-2021 (accessed on 9 September 2024).
  43. Japan Real Estate Institute. Survey on Agricultural Land Price and Farm Rent: As of the End of Mar. 2024; Yamashita, M., Ed.; Japan Real Estate Institute: Tokyo, Japan, 2024; pp. 1–61. [Google Scholar]
  44. Benalcazar, P.; Komorowska, A.; Kamiński, J. A GIS-Based Method for Assessing the Economics of Utility-Scale Photovoltaic Systems. Appl. Energy 2024, 353, 122044. [Google Scholar] [CrossRef] [Scilit]
  45. IEA. Projected Costs of Generating Electricity 2020. Available online: https://www.iea.org/reports/projected-costs-of-generating-electricity-2020 (accessed on 15 August 2025).
  46. Agency for Natural Resources and Energy. Available online: https://www.enecho.meti.go.jp/committee/council/basic_policy_subcommittee/mitoshi/cost_wg/2024/data/06_05.pdf (accessed on 15 August 2025).
  47. European Central Bank. Japanese Yen (JPY). Available online: https://www.ecb.europa.eu/stats/policy_and_exchange_rates/euro_reference_exchange_rates/html/eurofxref-graph-jpy.en.html (accessed on 30 September 2024).
  48. MAFF. Available online: https://www.maff.go.jp/j/seisan/gijutsuhasshin/techinfo/suitou.html (accessed on 11 September 2024).
  49. MAFF. Available online: https://www.maff.go.jp/j/seisan/gijutsuhasshin/techinfo/bareisyo.html (accessed on 3 February 2025).
  50. MAFF. Available online: https://www.maff.go.jp/j/seisan/gijutsuhasshin/techinfo/daizu.html (accessed on 3 February 2025).
  51. Cossu, M.; Yano, A.; Solinas, S.; Deligios, P.A.; Tiloca, M.T.; Cossu, A.; Ledda, L. Agricultural Sustainability Estimation of the European Photovoltaic Greenhouses. Eur. J. Agron. 2020, 118, 126074. [Google Scholar] [CrossRef] [Scilit]
  52. Toledo, C.; Ramos-Escudero, A.; Serrano-Luján, L.; Urbina, A. Photovoltaic Technology as a Tool for Ecosystem Recovery: A Case Study for the Mar Menor Coastal Lagoon. Appl. Energy 2024, 356, 122350. [Google Scholar] [CrossRef] [Scilit]
  53. NEDO. Available online: https://www.nedo.go.jp/content/800015801.pdf (accessed on 26 November 2024).
  54. Kuwabara, Y.; Nasukawa, H.; Tatsumi, K. Dynamic Light Environments, rather than Shading Ratios, Determine Rice Yield and Quality in Agrivoltaic Systems. J. Clean. Prod. 2026, 554, 148082. [Google Scholar] [CrossRef] [Scilit]
  55. Hwang, K.-W.; Lee, C.-Y. Estimating the Deterministic and Stochastic Levelized Cost of the Energy of Fence-Type Agrivoltaics. Energies 2024, 17, 1932. [Google Scholar] [CrossRef] [Scilit]
  56. Bhatta, G.; Lohani, S.P.; Kc, M.; Bhandari, R.; Palit, D.; Anderson, T. Harnessing Solar PV Potential for Decarbonization in Nepal: A GIS Based Assessment of Ground-Mounted, Rooftop, and Agrivoltaic Solar Systems for Nepal. Energy Sustain. Dev. 2025, 85, 101618. [Google Scholar] [CrossRef] [Scilit]
  57. Zidane, T.E.K.; Zainali, S.; Bellone, Y.; Guezgouz, M.; Khosravi, A.; Lu, S.M.; Tekie, S.; Amaducci, S.; Campana, P.E. Economic Evaluation of One-Axis, Vertical, and Elevated Agrivoltaic Systems across Europe: A Monte Carlo Analysis. Appl. Energy 2025, 391, 125826. [Google Scholar] [CrossRef] [Scilit]
  58. Campana, P.E.; Macknick, J.; Croci, M.; Elkadeem, M.R.; Gorjian, S.; Pascaris, A.; Cuppari, R.I.; Amaducci, S.; Liu, W.; Trommsdorff, M.; et al. Scientific Frontiers of Agrivoltaic Cropping Systems. Nat. Rev. Clean Technol. 2025, 1, 801–821. [Google Scholar] [CrossRef] [Scilit]
  59. Elkadeem, M.R.; Zainali, S.; Lu, S.M.; Younes, A.; Abido, M.A.; Amaducci, S.; Croci, M.; Zhang, J.; Landelius, T.; Stridh, B.; et al. Agrivoltaic Systems Potentials in Sweden: A Geospatial-Assisted Multi-Criteria Analysis. Appl. Energy 2024, 356, 122108. [Google Scholar] [CrossRef] [Scilit]
  60. Khazael, S.M.; Abdul Maulud, K.N.; Karim, O.A. Geospatial Planning Strategies for Agrivoltaic Systems: A Review of Criteria, Decision Models and Emerging Challenges. Sustain. Energy Technol. Assess. 2025, 81, 104444. [Google Scholar] [CrossRef] [Scilit]
  61. Feuerbacher, A.; Laub, M.; Högy, P.; Lippert, C.; Pataczek, L.; Schindele, S.; Wieck, C.; Zikeli, S. An Analytical Framework to Estimate the Economics and Adoption Potential of Dual Land-Use Systems: The Case of Agrivoltaics. Agric. Syst. 2021, 192, 103903. [Google Scholar] [CrossRef] [Scilit]
  62. Zainali, S.; Lu, S.M.; Fernández-Solas, Á.; Cruz-Escabias, A.; Fernández, E.F.; Zidane, T.E.K.; Honningdalsnes, E.H.; Nygård, M.M.; Leloux, J.; Berwind, M.; et al. Modelling, Simulation, and Optimisation of Agrivoltaic Systems: A Comprehensive Review. Appl. Energy 2025, 386, 125558. [Google Scholar] [CrossRef] [Scilit]
  63. Willockx, B.; Lavaert, C.; Cappelle, J. Performance Evaluation of Vertical Bifacial and Single-Axis Tracked Agrivoltaic Systems on Arable Land. Renew. Energy 2023, 217, 119181. [Google Scholar] [CrossRef] [Scilit]
  64. Agency for Natural Resources and Energy. Available online: https://www.enecho.meti.go.jp/about/pamphlet/pdf/energy_in_japan2025.pdf (accessed on 9 April 2026).
  65. MAFF. Available online: https://www.meti.go.jp/shingikai/enecho/denryoku_gas/saisei_kano/pdf/068_02_00.pdf (accessed on 14 August 2025).
  66. Magarelli, A.; Mazzeo, A.; Ferrara, G. Fruit crop species with agrivoltaic systems: A critical review. Agronomy 2024, 14, 722. [Google Scholar] [CrossRef] [Scilit]
  67. Adigun, P.; Dairaku, K.; Ogunrinde, A.T.; Xue, X. Climate Change Influence on Solar Photovoltaic Energy Production and Its Associated Drivers in CMIP6 Ensemble Projections. J. Geophys. Res. Atmos. 2025, 130, e2024JD042971. [Google Scholar] [CrossRef] [Scilit]
  68. Merheb, C.; Macknick, J.; Davatzes, N.; Ravi, S. Synergies and trade-offs of multi-use solar landscapes. Nat. Sustain. 2025, 8, 857–870. [Google Scholar] [CrossRef] [Scilit]
Figure 1. Cultivated areas of the top 20 crops under agrivoltaic systems in Japan as of FY2023. Data represents the accumulated agricultural land area (ha) for each crop as of the end of the fiscal year 2023. Crops were grouped by category. The dataset included only single-crop fields among the top 20 crops with the largest cultivated areas; mixed-cropping sites and facilities under construction were excluded. The figure was translated and edited by the authors based on a national survey report by the Ministry of Agriculture, Forestry and Fisheries (MAFF) [19].
Agronomy 16 01776 g001
Figure 2. Spatial distribution of annual Global Horizontal Irradiance (GHI) for the grid cells in Japan considered in this study. The analysis focuses on approximately 1-km grid cells that contain areas classified as “paddy field” or “other cropland,” with all other grid cells masked in gray. The Hokkaido (top) and Okinawa (bottom) regions are shown in the inset maps. GHI data were sourced from the MONSOLA-20 database [33].
Agronomy 16 01776 g002
Figure 3. Schematic of the elevated fixed-tilt agrivoltaic systems (AVSs) configuration modeled in this study. The system utilizes south-facing bifacial PV modules and is designed with a sufficient clearance height to accommodate standard agricultural machinery. The analysis considered two scenarios for the module tilt angle: the local annual optimal angle and the horizontal (0°) orientation. The row spacing, which determines the projected ground coverage ratio (pGCR), was optimized as a key design variable.
Agronomy 16 01776 g003
Figure 4. The computational framework for identifying the optimal site-specific AVS design. The process consists of two sequential stages: (1) a techno-economic performance simulation to generate a comprehensive dataset of all potential design candidates, and (2) a cost-based optimization to identify the single design that meets the agricultural constraint while minimizing the LCOE.
Agronomy 16 01776 g004
Figure 5. Spatial distribution of the optimal AVS design parameters across Japan. These designs were identified for each grid cell by minimizing the Levelized Cost of Electricity (LCOE) under the agricultural constraint of a target Daily Light Integral (DLI) of 25 mol m−2 day−1. The maps show (a) the optimal module tilt angle, where green indicates a horizontal (0°) orientation, and (b) the corresponding optimal projected ground coverage ratio (pGCR).
Agronomy 16 01776 g005
Figure 6. Spatial distribution of annual energy density achieved with optimal AVS designs. These values correspond to the estimated annual electricity generation per unit land area for the LCOE-minimized designs presented in Figure 5.
Agronomy 16 01776 g006
Figure 7. Spatial distribution of the Levelized Cost of Electricity (LCOE) for the optimized AVS designs. These values represent the minimum LCOE achievable for each grid cell under the constraint that the average daily light integral at the crop canopy (DLIcanopy) meets or exceeds a target of 25 mol m−2 day−1 to ensure agricultural viability.
Agronomy 16 01776 g007
Figure 8. Average Levelized Cost of Electricity (LCOE) by prefecture. The error bars represent the standard deviation of the LCOE values calculated for all viable grid cells within each prefecture’s administrative boundaries.
Agronomy 16 01776 g008
Figure 9. Scenario analysis of the Levelized Cost of Electricity (LCOE) illustrates its sensitivity to the target Daily Light Integral (DLI) constraint. The maps show the LCOE distribution for scenarios where the target DLI was set to (a) 16 mol m−2 day−1 (representing more shade-tolerant crops) and (b) 30 mol m−2 day−1 (representing more light-demanding crops). These results can be compared with those of the baseline scenario (target DLI = 25 mol m−2 day−1), as presented in Figure 7.
Agronomy 16 01776 g009
Figure 10. Tornado chart from one-at-a-time (OAT) sensitivity analysis showing the impact of key techno-economic parameters on the national average LCOE. Each parameter was independently varied by ±20% from its baseline value, while the others were held constant. The central vertical line indicates a baseline LCOE of 0.1021 EUR kWh−1.
Agronomy 16 01776 g010
Table 1. Capital expenditure (CAPEX) parameters used in the AVS model. The cost parameters listed in this table and Table 2 are based on governmental reports and industry surveys for utility-scale solar projects and agricultural land in Japan [14,39,41,42,43].
Cost CategoryCost ComponentValue (JPY)Value (EUR) *1Unit
Capacity-based costsPV modules63,000384.49kWp−1
Inverter20,000122.06kWp−1
Other balance of system13,00079.34kWp−1
Grid connection13,00079.34kWp−1
Total (Capacity-based costs)109,000665.23kWp−1
Land-based costsMounting structures500030.52m−2
System design3001.83m−2
Site preparation and installation400024.41m−2
Total (Land-based costs)930056.76m−2
*1 JPY-denominated values were used in the LCOE calculations. EUR-denominated values are provided for reference only, converted at 0.006103 EUR JPY−1 [47].
Table 2. Annual Operational Expenditure (OPEX) parameters used in the AVS model, including spatially variable land costs.
Cost CategoryCost ComponentValue (JPY)Value (EUR) *1Unit
Capacity-based costsMaintenance15009.15kWp−1 year−1
Surveillance5003.05kWp−1 year−1
Insurance12007.32kWp−1 year−1
Repair and replacement7504.58kWp−1 year−1
Total (Capacity-based costs)395024.11kWp−1 year−1
Land-based costsLand costsSpatially
variable *2
(2.50–13.08)
Spatially
variable *2
(0.0153–0.0798)
m−2 year−1
*1 JPY-denominated values were used in the LCOE calculations. EUR-denominated values are provided for reference only, converted at 0.006103 EUR JPY−1 [47]. *2 Land costs were estimated as grid-level area-weighted averages of prefectural paddy-field and upland-field rents, with weights based on land-use composition within each cell [32,43]. The national average was 6.69 JPY m−2 year−1 (0.0408 EUR m−2 year−1).
Table 3. Summary of national average outcomes from the scenario analysis for the three target Daily Light Integral (DLI) constraints. The table compares the resulting optimal design parameters and performance metrics for the baseline scenario (25 mol m−2 day−1) with scenarios representing more shade-tolerant (16 mol m−2 day−1) and light-demanding (30 mol m−2 day−1) crops.
CategoryParameterUnit16 mol m−2 Day−1
(Shade-Tolerant)
25 mol m−2 Day−1
(Baseline)
30 mol m−2 Day−1
(Light-Demanding)
Optimal
Design
Average pGCR%57.4330.3822.11
Average tilt angle°1.9924.7033.52
Share of horizontal designs%94.0424.741.35
Performance MetricsEnergy densitykWh m−2 year−1118.5480.1564.39
LCOEEUR kWh−10.09380.10210.1127
Table 4. Results of the two-variable sensitivity analysis for national average LCOE. The two dominant parameters identified in the OAT analysis, PV system efficiency and CAPEX, were jointly varied by ±20% to assess their combined effects and potential interactions. All values are in EUR kWh−1. The baseline case corresponds to 0.1021 EUR kWh−1.
CAPEX ConditionPV System Efficiency −20%PV System Efficiency (Baseline)PV System Efficiency +20%
CAPEX +20%0.14740.11790.0983
CAPEX (Baseline)0.12760.10210.0851
CAPEX −20%0.10780.08620.0718
Disclaimer/Publisher’s Note: The statements, opinions and data contained in all publications are solely those of the individual author(s) and contributor(s) and not of MDPI and/or the editor(s). MDPI and/or the editor(s) disclaim responsibility for any injury to people or property resulting from any ideas, methods, instructions or products referred to in the content.