Article

Integrated Transcriptomic and Metabolomic Analyses Reveal the Auxin-Mediated Regulatory Network Governing Alfalfa Responses to Phosphorus Deficiency Stress


Key Laboratory of National Forestry and Grassland Administration on Native Grass Breeding/Key Laboratory of Grassland Germplasm Innovation and Sustainable Utilization of Grassland Resources in Inner Mongolia, College of Grassland Science, Inner Mongolia Agricultural University, Hohhot 010018, China
*
Authors to whom correspondence should be addressed.
Agronomy 2026, 16(17), 1745; https://doi.org/10.3390/agronomy16171745
Submission received: 24 July 2026 / Revised: 31 August 2026 / Accepted: 3 September 2026 / Published: 7 September 2026

Abstract

Auxin plays a positive role in plant responses to low-phosphorus stress. However, the molecular mechanisms underlying indole-3-acetic acid (IAA)-mediated responses to phosphorus deficiency in alfalfa remain poorly understood. Alfalfa (Medicago sativa L.) cultivar ‘Zhongmu No. 3’ was subjected to two treatments: normal phosphorus (NP, 1000 μM KH2PO4) and low phosphorus supplemented with 1 μM IAA (LP + IAA, 10 μM KH2PO4). Morphological traits, physiological parameters, transcriptomic profiles, and metabolite accumulation were analyzed at 48 h and 10 days following treatment. Compared with the NP group, plants in the LP + IAA group showed marked changes in growth-related traits. At 48 h, plant height increased by 34%, total root length was 1.24-fold that of the NP group, and lateral root number increased by 23.48%. After 10 days, root fresh weight increased by 28%, total root length was 1.25-fold that of the NP group, lateral root number increased by 36.58%, and root volume increased by 22.2%, whereas plant height, stem diameter, and shoot fresh weight remained comparable to those of the NP group. Root acid phosphatase activity was 114.8% higher than that of the NP group at 48 h. Transcriptome analysis identified 1274 and 2277 differentially expressed genes (DEGs) between the NP and LP + IAA groups at 48 h and 10 days, respectively. At 48 h, the up-regulated genes were amino phospholipid ATPase 9 and amino alcohol phosphotransferase 1, whereas phosphate transporter 1 and purple acid phosphatase 12 were up-regulated at 10 days. Metabolomic analysis identified 308 and 1296 differentially accumulated metabolites (DAMs) at 48 h and 10 days, respectively. Early responses were enriched in purine metabolism and involved (5′-phosphoribosyl)-5-formamido-4-imidazolecarboxamide (FAICAR), whereas prolonged treatment involved L-aspartic acid, adenine, and cAMP. Integrated analyses identified tryptophan metabolism, cysteine and methionine metabolism, glycerophospholipid metabolism, and plant hormone signal transduction as major regulatory pathways. CDP-choline accumulation and changes in lipid-remodeling genes further indicated enhanced membrane phospholipid remodeling. Overall, these results provide insight into the morphological, physiological, transcriptional, and metabolic responses of alfalfa to low phosphorus in the presence of exogenous IAA.

1. Introduction

Alfalfa (Medicago sativa L.) is a widely cultivated, high-quality leguminous forage valued for its elevated protein and rich nutritional profile. So alfalfa is commonly referred to as the “king of forages” [1] and plays a pivotal role in supporting the sustainable development of animal husbandry. Its broad ecological adaptability and robust root system also contribute to soil structural improvement and grassland ecosystem conservation [2].
Phosphorus (P) is one of the macronutrient elements for plant growth and development, accounting for approximately 0.2% of the plant’s dry weight [3]. It has a significant impact on the growth and development of plants, as well as on the formation of their yield and quality. P is a component of key molecules such as nucleic acids, phospholipids and adenosine triphosphate (ATP), and is involved in regulating enzyme reactions [4], photosynthesis and respiration in plants, including the activation, inactivation and signal transduction of enzymes and other physiological processes [5].
Approximately half of the global arable land suffers from a deficiency of available phosphorus [6]. P is a non-renewable mineral nutrient that exists in soils predominantly in organic and inorganic forms [7]. In soils, approximately 25–56% of total P exists in organic forms, which are difficult for plants to directly absorb and utilize. In addition, the low availability of soil P substantially limits P uptake by plants [8]. Appropriate P fertilizer can markedly improve crop yields [9]. However, excessive P fertilizer results in phosphate waste and environmental issues, such as water eutrophication [10,11]. The current season recovery efficiency of phosphorus fertilizers is only 10–25%, with overall utilization efficiency ranging from 15 to 30% [12,13,14]. Current global phosphate rock reserves are projected to last over 300 years [15]. Nevertheless, the depletion of phosphorus resources remains a critical global challenge [16]. Phosphorus deficiency significantly impairs alfalfa growth, development, and yield potential [6]. Plants grown under phosphorus limitation display retarded growth, dwarfing, and reduced leaf size [17,18]. Conversely, adequate phosphorus supply enhances protein content, branching capacity, and the overall adaptive ability of plants [19]. Previous studies have also demonstrated that phosphorus fertilization promotes biomass accumulation and root elongation in alfalfa [20,21].
Plant responses to phosphorus deficiency are coordinated by multiple phytohormones, including auxin, ethylene, and gibberellin, through extensive crosstalk with phosphate-starvation signaling pathways [22,23]. Among these phytohormones, auxin plays a central role in regulating root system architecture by modulating root cell division, elongation, lateral root formation, and developmental plasticity [24]. The spatial distribution of auxin within roots is tightly controlled by auxin transporters and is critical for root developmental responses to environmental cues [25]. In Arabidopsis thaliana, phosphate starvation alters local auxin distribution and sensitivity, thereby promoting lateral root development and remodeling root system architecture [23,26]. Auxin also interacts with other phytohormones to coordinate root system architecture in response to changing environmental conditions [27]. Similar auxin-mediated responses to phosphorus deficiency have been observed in other plant species. For example, in white lupin (Lupinus albus L.), exogenous IAA promotes cluster-root formation under low-phosphorus conditions, whereas inhibition of auxin transport suppresses cluster-root development. Auxin biosynthesis and transport mediated by LaYUC4 and LaPIN2 are also involved in this response [28]. In alfalfa, auxin response factor (ARF) genes are involved in auxin signaling and show tissue-specific and stress-responsive expression patterns [29]. Recent evidence further indicates that exogenous IAA can modify root development and phosphorus-starvation-responsive gene expression in alfalfa under phosphorus deficiency [30]. Nevertheless, the transcriptomic and metabolomic mechanisms through which IAA coordinates alfalfa adaptation to phosphorus deficiency remain poorly understood.
Based on previous studies, we hypothesized that alfalfa exposed to low phosphorus in the presence of exogenous IAA would exhibit distinct root growth, physiological, transcriptional, and metabolic responses compared with plants grown under normal phosphorus conditions. To test this hypothesis, morphological and physiological traits were measured at 48 h and 10 d, and transcriptomic and metabolomic analyses were performed to identify changes in genes, metabolites, and related pathways. This study aimed to characterize the morphological, physiological, transcriptional, and metabolic responses of alfalfa to low phosphorus in the presence of exogenous IAA.

2. Materials and Methods

2.1. Plant Materials and Growth Conditions

Alfalfa cultivar ‘Zhongmu No. 3’ was obtained from the Institute of Animal Sciences of CAAS. Seeds were germinated for 8 d and then grown in Hoagland nutrient solution (pH 6.0) for 10 d. Uniform seedlings were transferred to plastic hydroponic containers (25 cm × 15 cm × 10 cm), each containing 2.8 L of nutrient solution and 60 seedlings. The seedlings were supported with sponge plugs, and five independent containers were used for each treatment.
The normal-phosphorus treatment (NP) contained 1000 μM KH2PO4, whereas the low-phosphorus plus IAA group (LP + IAA) was supplied with 10 μM KH2PO4 and 1 μM IAA. For brevity, the LP + IAA treatment is hereafter referred to as the IAA-treated group. The concentration of 1 μM IAA was selected based on our previous study using the same alfalfa cultivar, in which this concentration significantly promoted root growth under phosphorus-deficient conditions [30]. The 10 μM KH2PO4 concentration was also used in our previous study and is consistent with the concentration used to establish direct phosphorus deficiency in the model legume Medicago truncatula [31]. To compensate for the decrease in K+ caused by the lower KH2PO4 concentration, 495 μM K2SO4 was added to the low-phosphorus nutrient solution. The nutrient solution was renewed every 3 d, and IAA was freshly added at each renewal to maintain a final concentration of 1 μM.
Plants were sampled at 48 h and 10 d after treatment. The 48 h time point was used to examine early morphological and molecular responses to phosphorus deficiency and IAA treatment, whereas 10 d was used to evaluate responses after prolonged treatment. Previous studies in the model legume M. truncatula have shown that physiological and molecular responses to phosphorus deficiency can occur within 12–48 h [32]. In addition, a 48 h phosphorus-deprivation period has been used to characterize short-term phosphorus-deficiency responses and to distinguish them from long-term responses in plants [33]. The nutrient solution composition is shown in Table 1. Plants were maintained in a controlled growth chamber at 25 °C under a 16 h light/8 h dark photoperiod.

2.2. Methods

2.2.1. Determination of Morphological and Physiological Traits of Alfalfa

Morphological and physiological traits of alfalfa were determined at 48 h and 10 d after treatment in the two experimental groups. Morphological indices included plant height, stem diameter, and shoot fresh weight. Root length, root surface area, lateral root number and total root volume were analyzed using the LA-S root analysis system (Wanshen, Shanghai, China). Five biological replicates were analyzed for each treatment. Leaf chlorophyll and nitrogen content were determined using a SPAD chlorophyll meter (Model YT-YA, Shandong Yuntang Intelligent Technology Co., Ltd., Weifang, China). Acid phosphatase and phytase activities in shoots and roots were quantified using an acid phosphatase activity assay kit (A060-2; Nanjing Jiancheng Bioengineering Institute, Nanjing, China) and a phytase assay kit (A045-4), respectively.

2.2.2. Transcriptome Library Construction and Analysis

Total RNA was extracted from plant samples using the RNAprep Pure Plant Kit (Tiangen, Beijing, China), and RNA quality was evaluated before library construction. Poly(A) mRNA was enriched using oligo(dT) magnetic beads, and strand-specific libraries were prepared using the Hieff NGS Ultima Dual-mode mRNA Library Prep Kit for Illumina (Yeasen Biotechnology, Shanghai, China). USER Enzyme treatment was used to maintain strand specificity, and libraries with insert sizes of approximately 200–400 bp were selected. Sequencing was performed on an Illumina NovaSeq platform (Illumina Inc., San Diego, CA, USA) using paired-end 150 bp (PE150) reads. Approximately 6.0–6.3 Gb of clean data were generated per sample, with 99.70 Gb obtained in total. Bioinformatics analyses were conducted using tools integrated in the BMKCloud platform (Beijing Biomarker Technologies Co., Ltd., Beijing, China) [34].
Raw reads were filtered using an in-house Perl script integrated into the BMKCloud platform by removing adapter-containing reads, reads with >10% ambiguous bases (N), and reads in which bases with Q ≤ 10 accounted for ≥50% of the total read length. Clean reads were aligned to the Medicago sativa V3 reference genome (Medicago sativa. V3. genome. fa) using HISAT2 v2.0.4, with the corresponding V3.0 genome annotation. Transcript assembly and gene-expression quantification were performed using StringTie v2.2.1, and expression levels were expressed as fragments per kilobase of transcript per million mapped reads (FPKM).
Differential expression analysis was performed using DESeq2 v1.30.1. p-values were adjusted using the Benjamini–Hochberg procedure to control the false discovery rate [35], and genes with an adjusted p-value < 0.01 and a fold-change threshold of 2 were defined as differentially expressed genes (DEGs). Gene Ontology (GO) and Kyoto Encyclopedia of Genes and Genomes (KEGG) enrichment analyses were performed using clusterProfiler v4.4.4, topGO v2.48.0, and the KOBAS database [36,37].

2.2.3. Metabolomic Profiling and Data Analysis

Approximately 50 mg of plant sample was mixed with 1000 μL of extraction solution containing a 20 mg/L internal standard (methanol:acetonitrile:water = 2:2:1, v/v/v). After shaking, it was ground at 45 Hz, and an ultrasonic treatment was conducted in an ice-water bath for 1 h at −20 °C. It was centrifuged at 4 °C, 12,000 rpm for 10 min and the supernatant was taken, vacuum-dried, re-dissolved with 160 μL of acetonitrile–water solution (1:1, v/v), centrifuged again, and the supernatant was taken for analysis. All the sample supernatants were mixed to prepare QC samples to ensure the stability of the instrument and data. The samples were detected using the Waters Acquity I-Class PLUS ultra-high-performance liquid chromatography tandem Xevo G2-XS QTOF (Waters Corporation, Milford, MA, USA) mass spectrometer, equipped with an HSS T3 chromatographic column (1.8 μm, 2.1 mm × 100 mm) [38]. The injection volume is 2 μL, and the flow rate is 400 μL/min. The mobile phase is a 0.1% formic acid water solution and a 0.1% formic acid acetonitrile solution, with gradient elution for 12 min. Positive and negative ion mass spectra data were collected in the MSe mode, with collision energy, ion source parameters and scan range set. The raw data were collected using the MassLynx V4.2 software.
The peak extraction, alignment and normalization of the mass spectrometry data were completed using Progenesis QI software (v2.4). Metabolite identification and determination were carried out based on the METLIN database (The Scripps Research Institute, La Jolla, CA, USA; https://metlin.scripps.edu) and the self-built database of BMKCloud. The differentially accumulated metabolites are screened by single-variable statistical tests combined with PCA and OPLS-DA multivariate models, with the screening threshold set as |FC| ≥ 1, VIP ≥ 1, and p < 0.05. All differentially accumulated metabolites were functionally annotated, and pathway enrichment analysis was performed using the KEGG database [39,40].

2.2.4. Validation of Gene Expression

Sixteen DEGs were randomly selected for expression validation. The same RNA samples used for transcriptome sequencing were used as templates for quantitative real-time PCR (qRT-PCR) analysis. The RNA was reverse-transcribed into cDNA using the EasyScript First-Strand cDNA Synthesis Kit (Beijing, China). Gene-specific primers for qRT-PCR were designed using NCBI Primer-BLAST and are listed in Supplementary Table S1. qRT-PCR was performed using the ChamQ SYBR qPCR Master Mix (Q311-02, Vazyme, Nanjing, China). Actin was used as the internal reference gene. Three technical replicates were conducted per sample, and relative gene expression levels were calculated using the 2−ΔΔCt method [41].

2.2.5. Methods for Integrated Transcriptomic and Metabolomic Analysis

After jointly processing the transcriptome and metabolome data, the two-level orthogonal partial least squares method (O2PLS) was used to evaluate the overall correlation of the two omics. The KEGG pathway enrichment analysis was performed for the differentially expressed genes and metabolites, and the two omics data were mapped onto the pathways using Pathview. All statistical analyses were completed using the R software (version 4.1.0) and related packages.

2.2.6. Statistical Analysis

Morphological and physiological data were organized using Microsoft Excel and statistically analyzed using IBM SPSS Statistics version 27.0. Graphs were generated using GraphPad Prism version 10.0. Data are presented as the mean ± standard deviation (SD) of biological replicates. Differences between the NP and IAA groups at each sampling time point were analyzed using an independent-samples Student’s t-test. Differences were considered significant at p < 0.05 and highly significant at p < 0.01.

3. Results

3.1. Effects of IAA Treatment on Morphological Traits of Alfalfa Under Low-Phosphorus Conditions

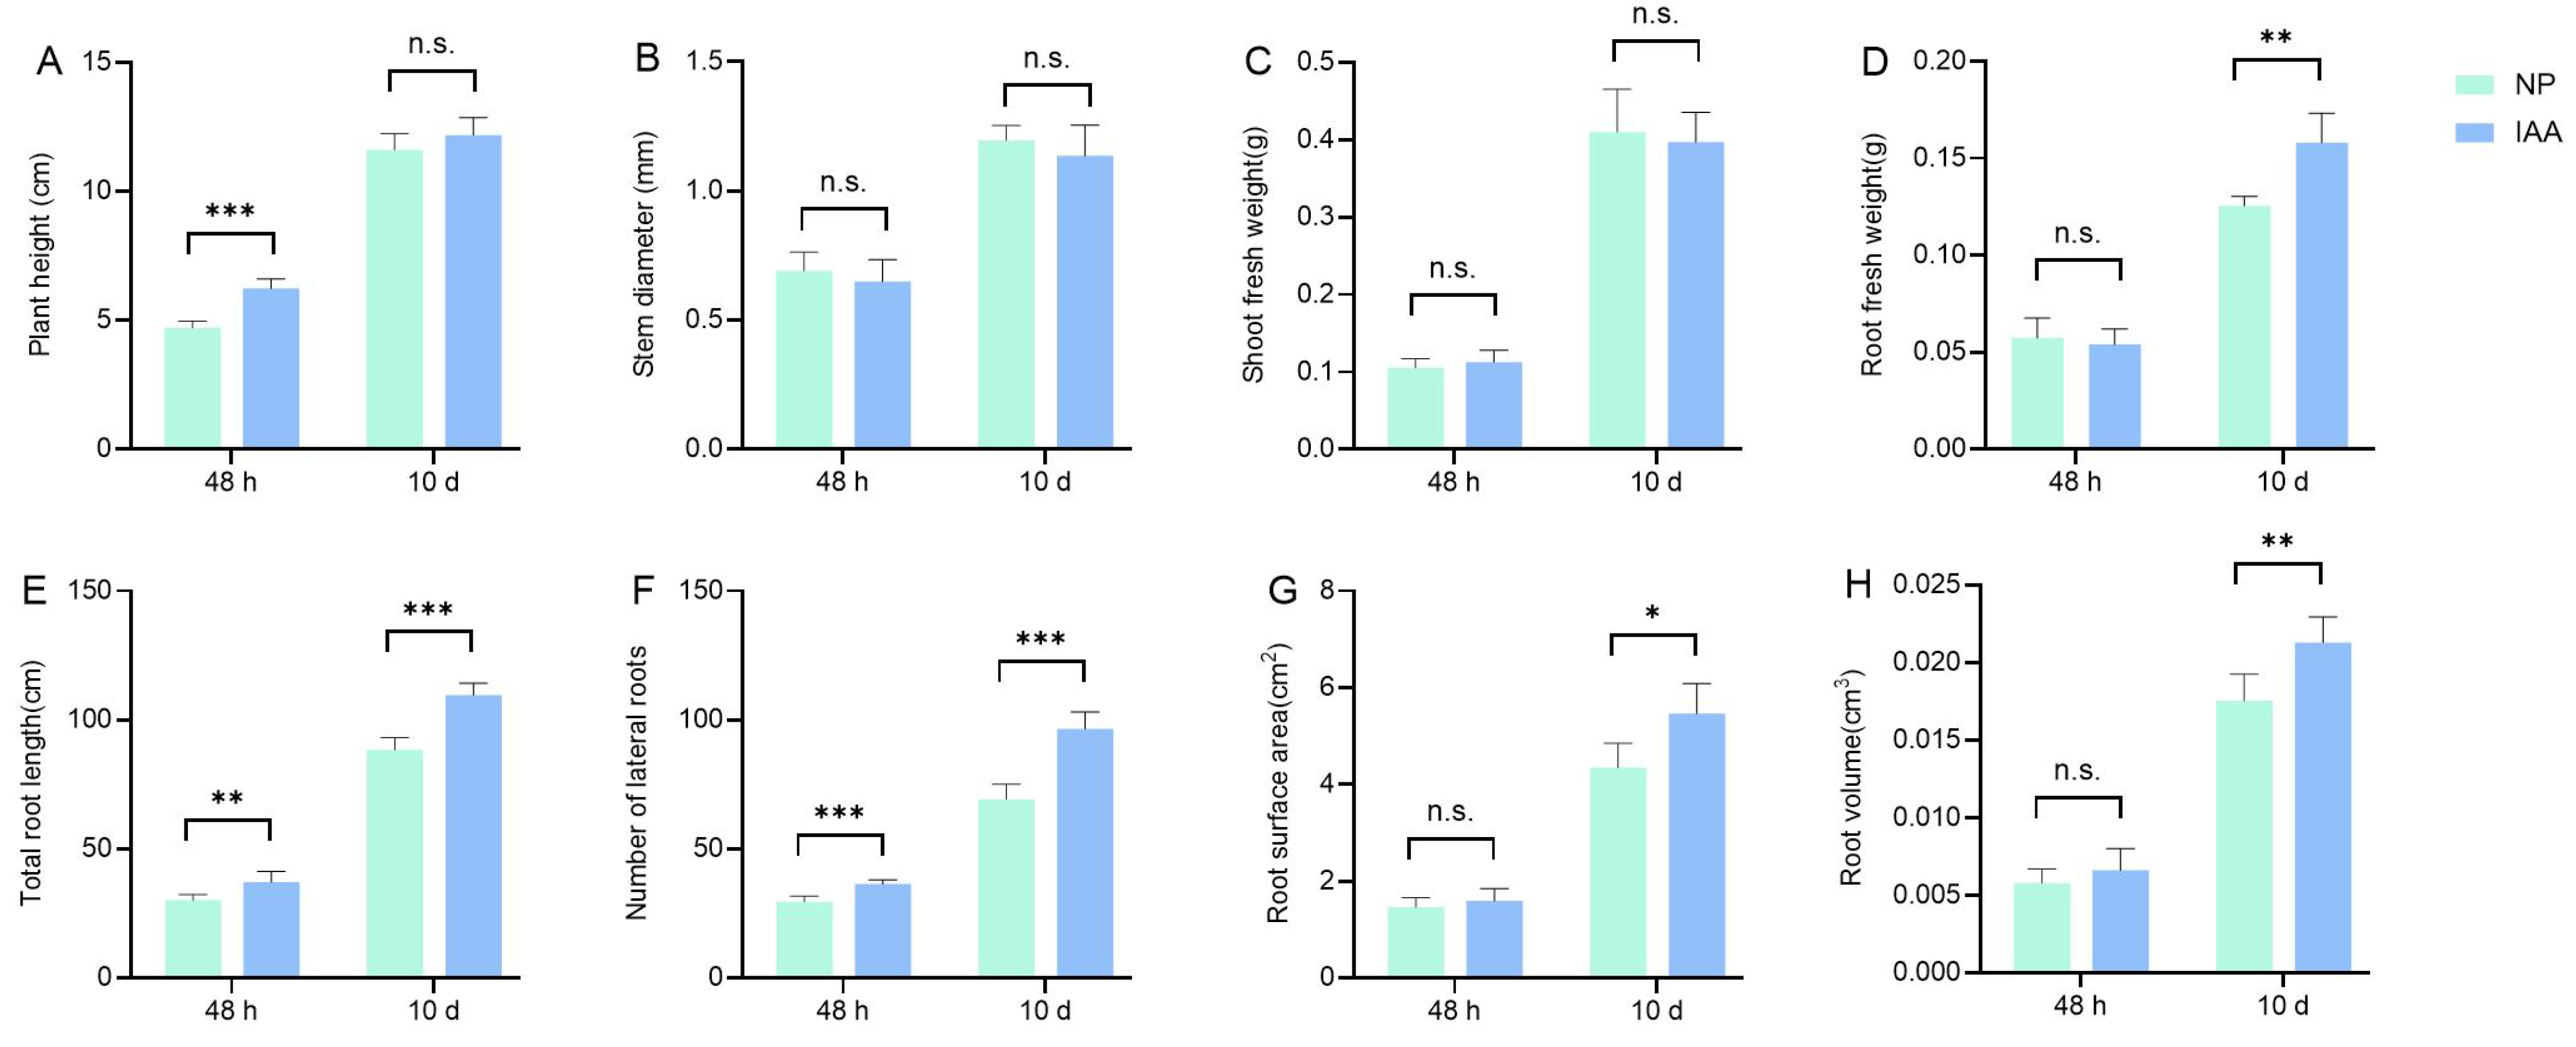
After 48 h of treatment, the average plant height of the IAA-treated seedlings reached 6.3 cm, which was 34% higher than that of the NP group (Figure 1A). However, no significant difference in plant height was observed between the IAA and NP groups after 10 d of treatment. At both 48 h and 10 d, stem diameter did not differ significantly between the IAA and NP groups (Figure 1B). At both treatment time points, shoot fresh weight showed no significant changes and remained generally comparable to that of the NP group (Figure 1C). After 10 d of treatment, the average root fresh weight of IAA-treated plants increased by 0.16 g, which was 28% higher than that of the NP group (p < 0.05; Figure 1D).
At 48 h, the total root length of the IAA group was 37.14 cm, corresponding to a 1.24-fold increase compared with the NP group (p < 0.05; Figure 1E). At 10 d, the total root length reached 109.64 cm in the IAA group, corresponding to 1.25-fold that of the NP group. At 48 h and 10 d, lateral root number increased significantly in the IAA group by 23.48% and 36.58% compared with the NP group (Figure 1F). Root surface area did not differ significantly between groups at 48 h (p > 0.05; Figure 1G). At 10 d, the average root surface area of the IAA group was 5.35 cm2, 1.23-fold higher than that of the NP group, indicating an expanded nutrient absorption area. Additionally, root volume was significantly increased by 22.2% in the IAA group after 10 d of treatment (Figure 1H).

3.2. Effects of IAA Treatment on Physiological Traits of Alfalfa Under Low-Phosphorus Conditions

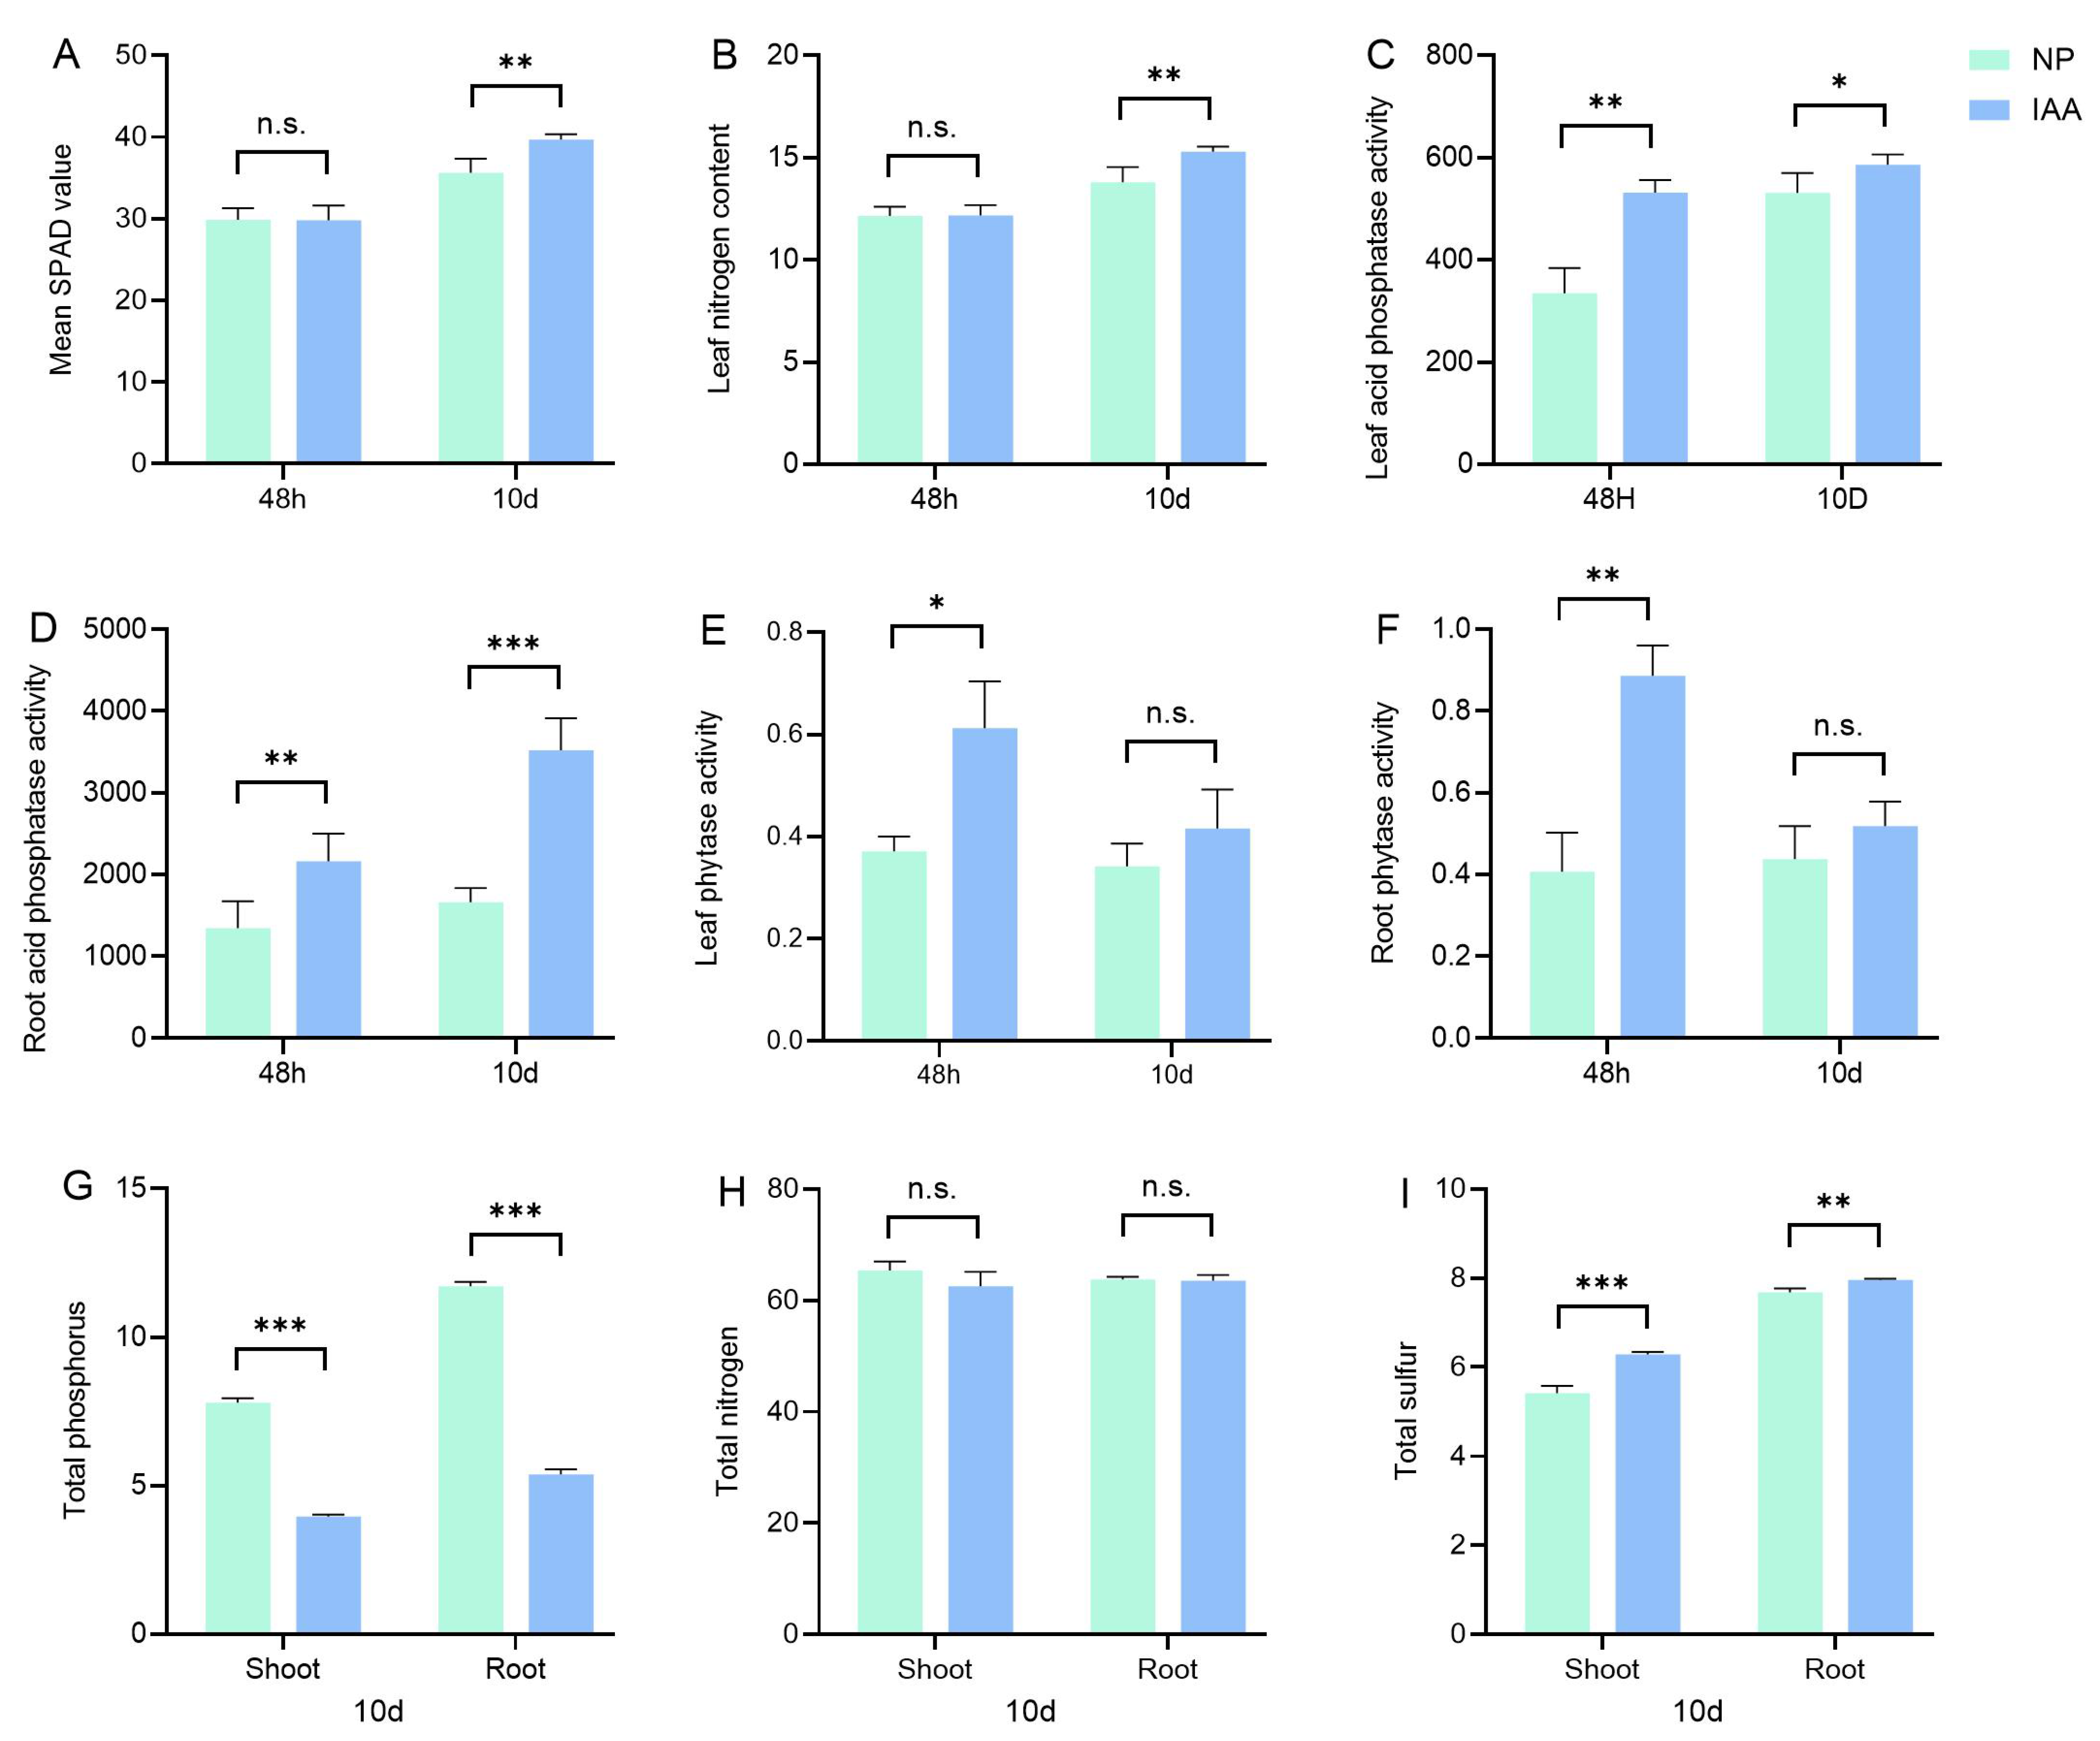
After 48 h of treatment, there were no significant differences in chlorophyll content and leaf nitrogen content between the IAA group and the NP group (p > 0.05). At 10 days, the SPAD value and nitrogen content of the leaves in the IAA group were significantly higher than those in the NP group (Figure 2A,B).
Leaf acid phosphatase activity was significantly higher in the IAA group than in the NP group at 48 h (p < 0.05; Figure 2C), and this enhancement persisted until 10 d. The activity was 1.11-fold higher than that of the control group. The activity of root acid phosphatase showed a more pronounced early response (Figure 2D). After 48 h of treatment, it increased by 114.8% compared to the NP group. Ten days later, the acid phosphatase activity in the normal phosphorus group remained basically unchanged, while that in the IAA group continued to increase. At 48 h of stress, IAA significantly activated phytase activity in both leaves and roots (Figure 2E,F), with enzyme activities reaching 0.62 and 0.90 U g−1 respectively (p < 0.05), but the phytate phosphatase activities in leaves and roots returned to the control level after 10 d of treatment.
No significant differences in total nitrogen content in shoots or roots were observed between the IAA and NP groups (p > 0.05). In contrast, total phosphorus contents in roots and leaves were significantly lower in IAA-treated plants than in the NP group. On the other hand, total sulfur contents in both roots and shoots were significantly higher in IAA-treated plants (Figure 2G–I).

3.3. Transcriptomic Analysis

3.3.1. Quality Assessment of Transcriptome Sequencing and Identification of Differentially Expressed Genes

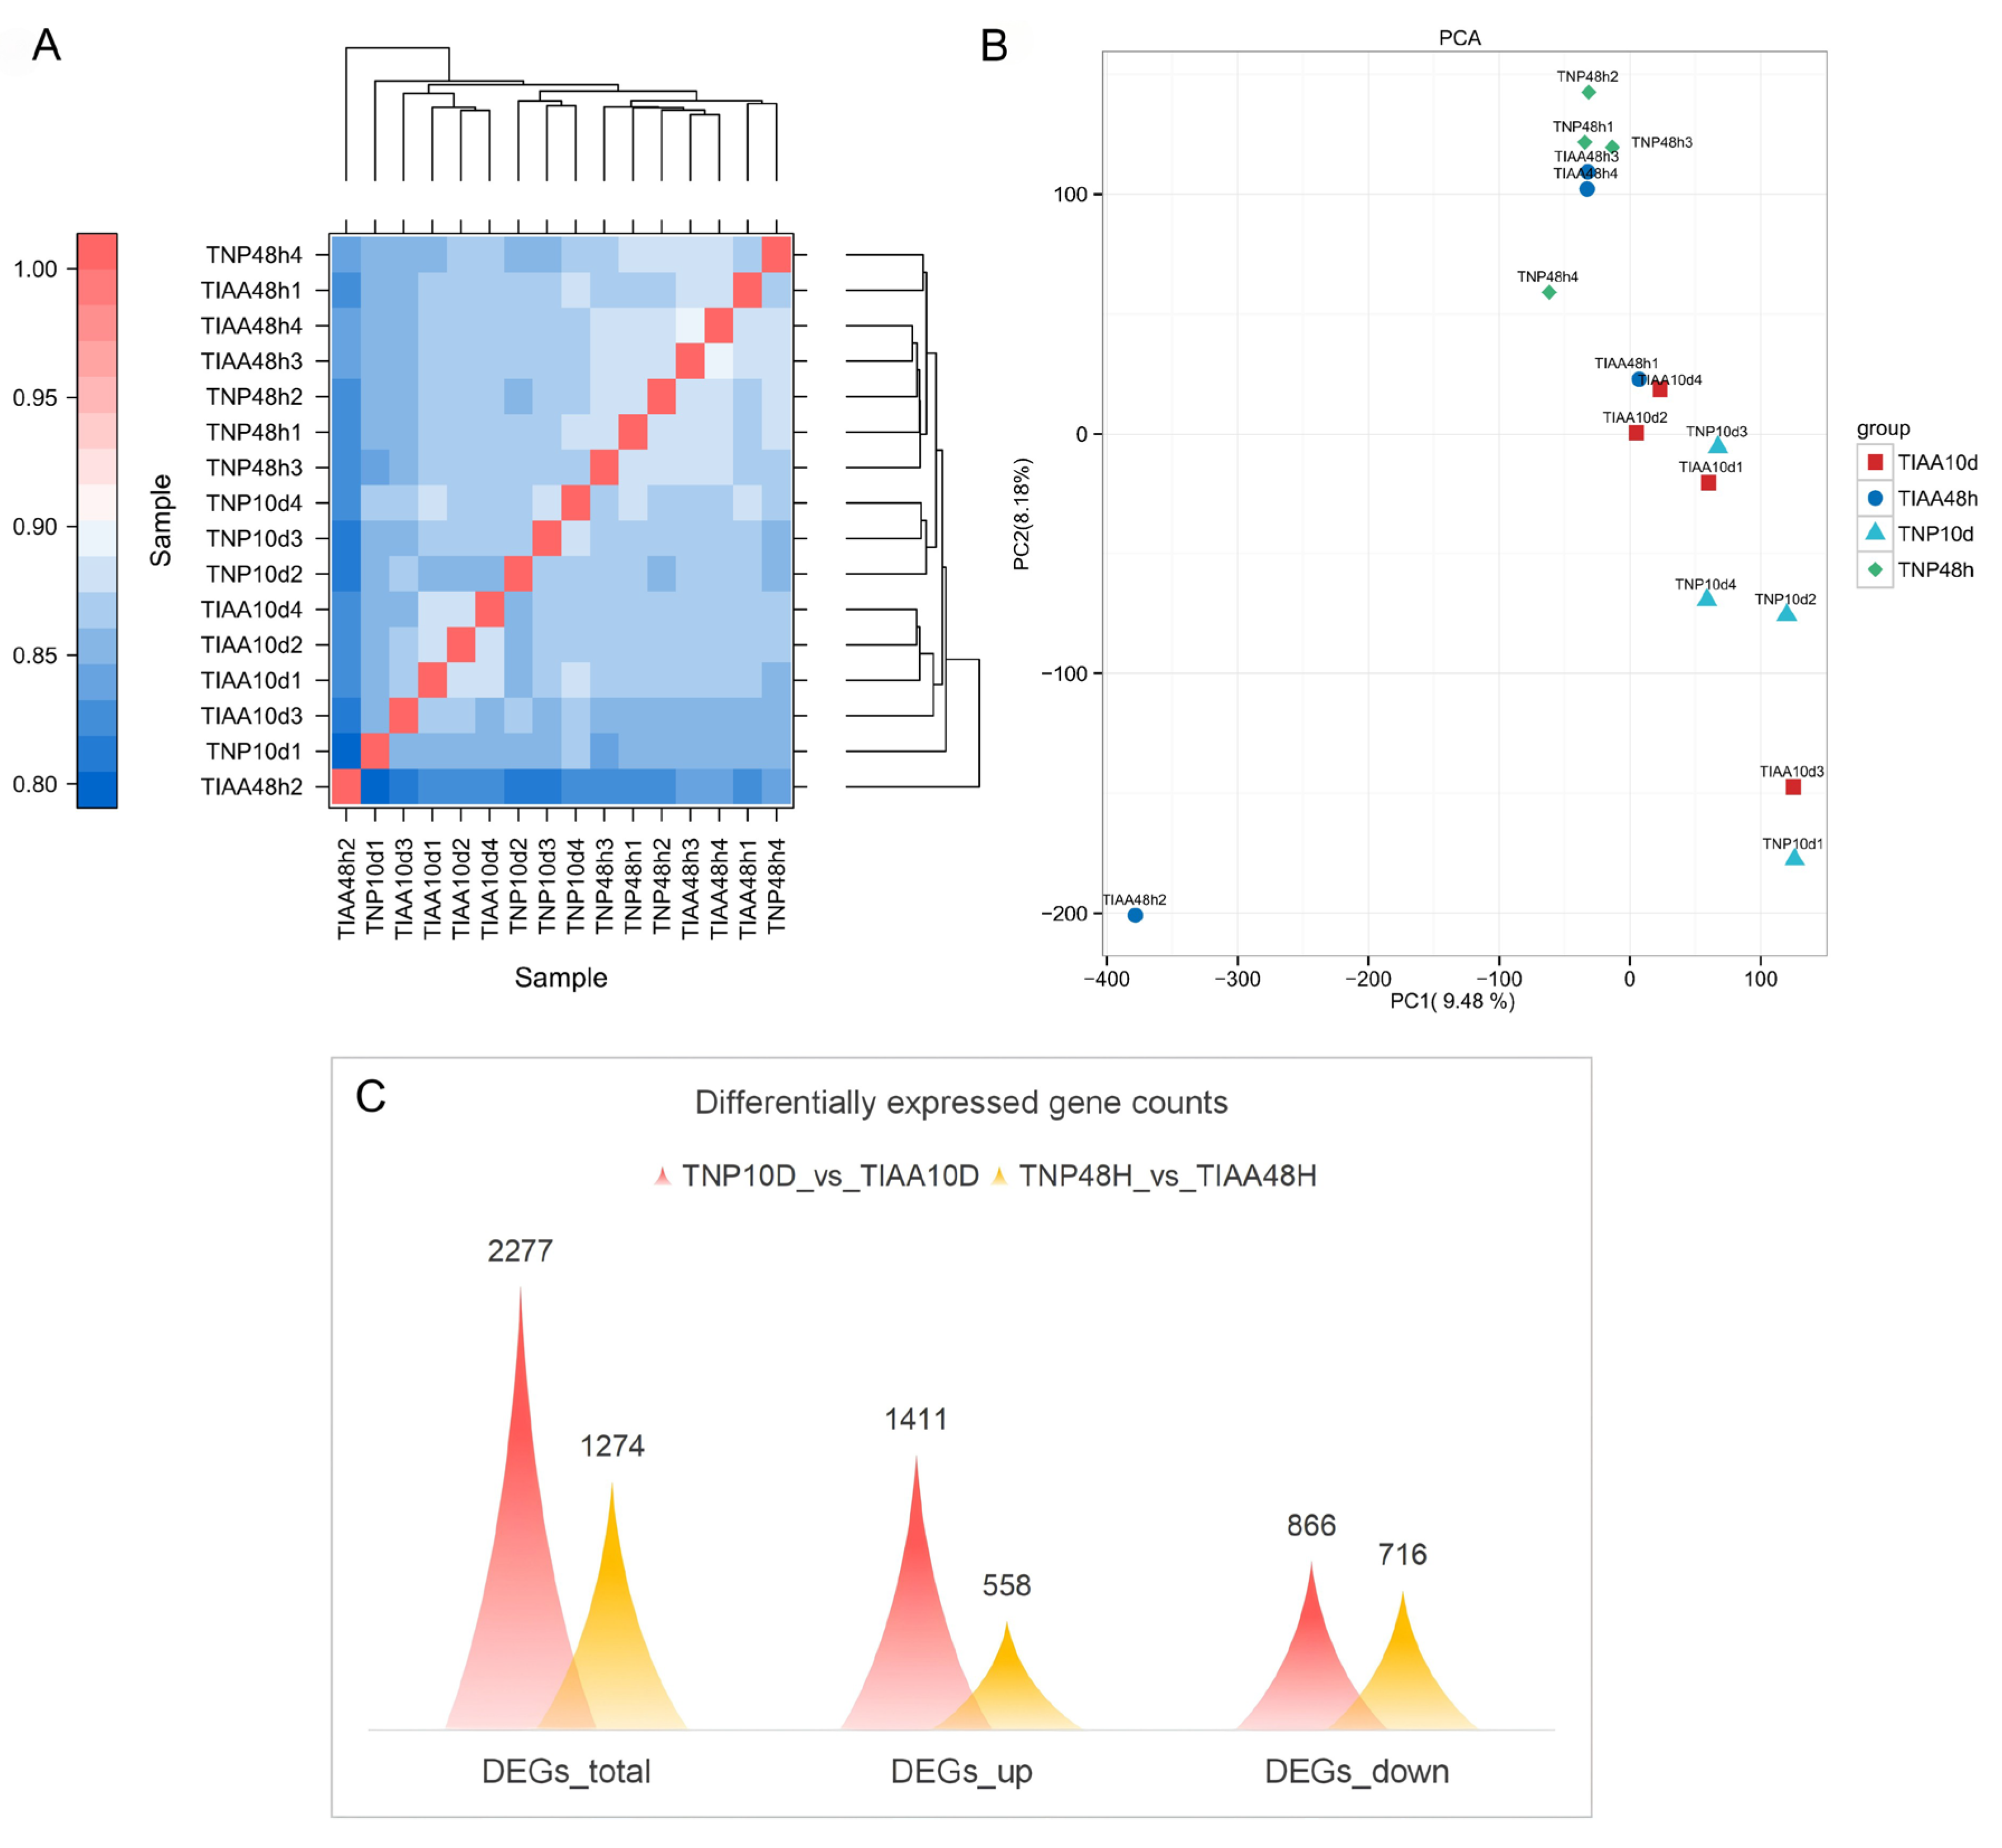
This study conducted transcriptome sequencing on two groups of alfalfa samples. A total of 16 samples underwent RNA-seq analysis (Supplementary Table S2). A clean dataset of 99.70 Gb was generated. Each sample produced at least 6.06 Gb of high-quality reads, with Q30 values exceeding 96.72%. The mapping efficiency of clean reads from each library to the reference genome ranged from 88.18% to 92.20%. Based on the mapping results, 22,199 new genes were identified, of which 12,126 were functionally annotated.
The Pearson correlation analysis revealed that the repeated samples within each treatment group exhibited a high degree of consistency (Figure 3A). However, there were significant differences between different treatment groups. Principal component analysis (PCA) further confirmed tight clustering of replicates within the same treatment (Figure 3B), indicating high data reliability.
The differentially expressed genes (DEGs) identified under each treatment are shown in Figure 3C and listed in Supplementary Table S3. After 48 h of treatment, 1274 DEGs were identified, comprising 558 up-regulated and 716 down-regulated genes. After 10 d of treatment, a total of 2277 DEGs were identified, including 1411 up-regulated and 866 down-regulated genes. As the processing time increased, the total number of DEGs induced by IAA significantly increased. At the same time, the proportion of up-regulated genes also rose significantly. At 48 h, genes such as SAC domain-containing protein 8 (SAC8), amino phospholipid ATPase 9 (ALA9), and amino alcohol phosphotransferase 1 (AAPT1) were up-regulated, whereas phosphoinositide phospholipase C 6 (PLC6), lysophosphatidylcholine acyltransferase 1 (LPCAT1), and phosphoethanolamine N-methyltransferase (PEAMT) were down-regulated. After 10 d of treatment, genes including phosphate transporter 1 (PHT1), purple acid phosphatase 12 (PAP12), Gretchen Hagen 3.1 (GH3.1), phospholipase D zeta 1 (PLDZETA1), glycerophosphodiester phosphodiesterase (GDPD), and phospholipase A1 (PLA1) were up-regulated.

3.3.2. GO Functional Enrichment and KEGG Pathway Enrichment Analyses of Differentially Expressed Genes

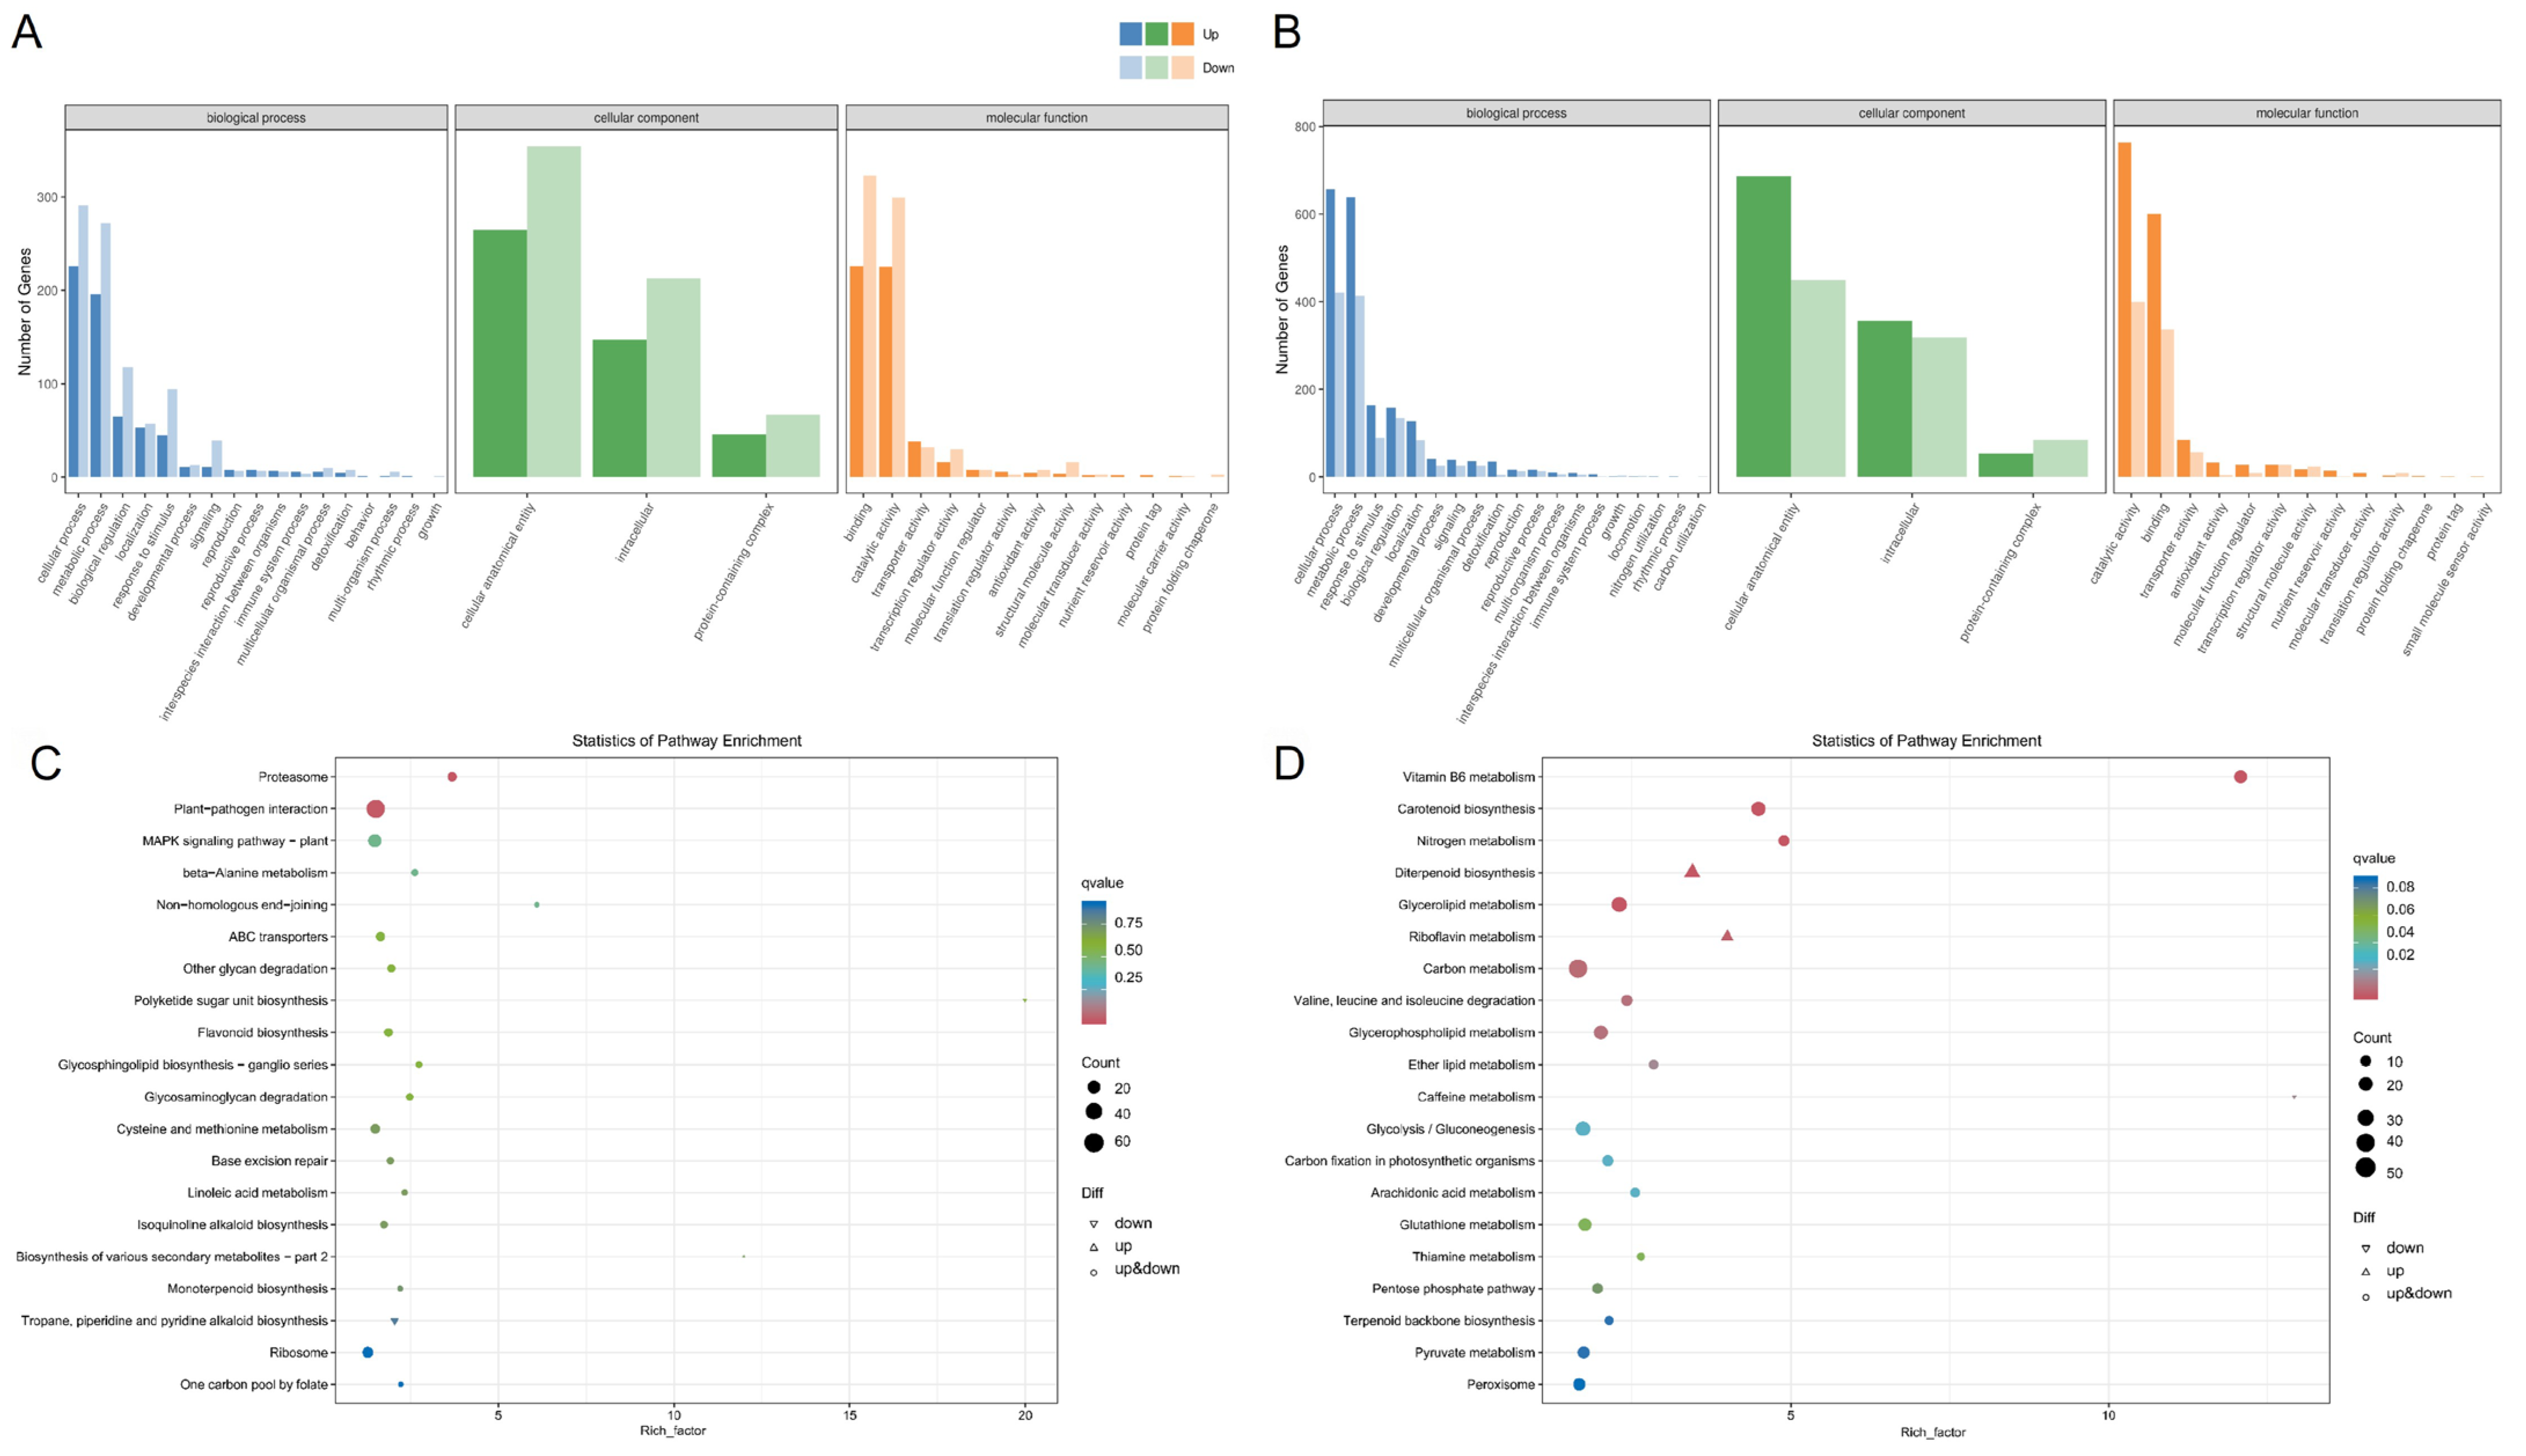
Gene Ontology (GO) classification grouped DEGs into three major categories (Figure 4A,B): biological process (BP), cellular component (CC), and molecular function (MF). In the BP category, the “metabolic process” entry initially showed a dominance of down-regulated genes during the processing stage. There were 72 more down-regulated genes than up-regulated genes. After 10 d, the number of up-regulated genes significantly exceeded that of down-regulated genes. The term “response to stimulation” reflects the perception and reaction to external or internal signals. It is closely related to the low phosphorus stress conditions in this study. Under short-term stress, the number of up-regulated genes in this category was 45, while under long-term stress, it increased to 164. The term “signaling” encompasses the stepwise transmission of extracellular signals into cells and downstream cascade responses. A total of 11 and 39 up-regulated genes were enriched in this term under short-term and long-term stress, respectively. In the CC category, all three subcategories are dominated by genes that are down-regulated at short timescales. Under long-term stress, genes that are up-regulated take the dominant position. In the MF category, the binding entry was enriched with 226 up-regulated genes under short-term and long-term stress conditions respectively. The catalytic activity entry had 764 up-regulated genes under long-term stress, which was 539 more than the short-term group.
KEGG pathway enrichment analysis of DEGs was implemented to dissect relevant biochemical metabolism and signal transduction pathways (Figure 4C,D). At 48 h, DEGs were significantly enriched in pathways related to plant MAPK signaling, plant–pathogen interaction, and beta-alanine metabolism. Ten days later, the significantly enriched pathways included plant hormone signaling, carbon metabolism, glycolysis/glycogenesis, lipid metabolism, glycerophospholipid metabolism, carotenoid biosynthesis, and nitrogen metabolism.

3.3.3. Regulation of Transcription Factors by Exogenous IAA Under Low-Phosphorus Stress

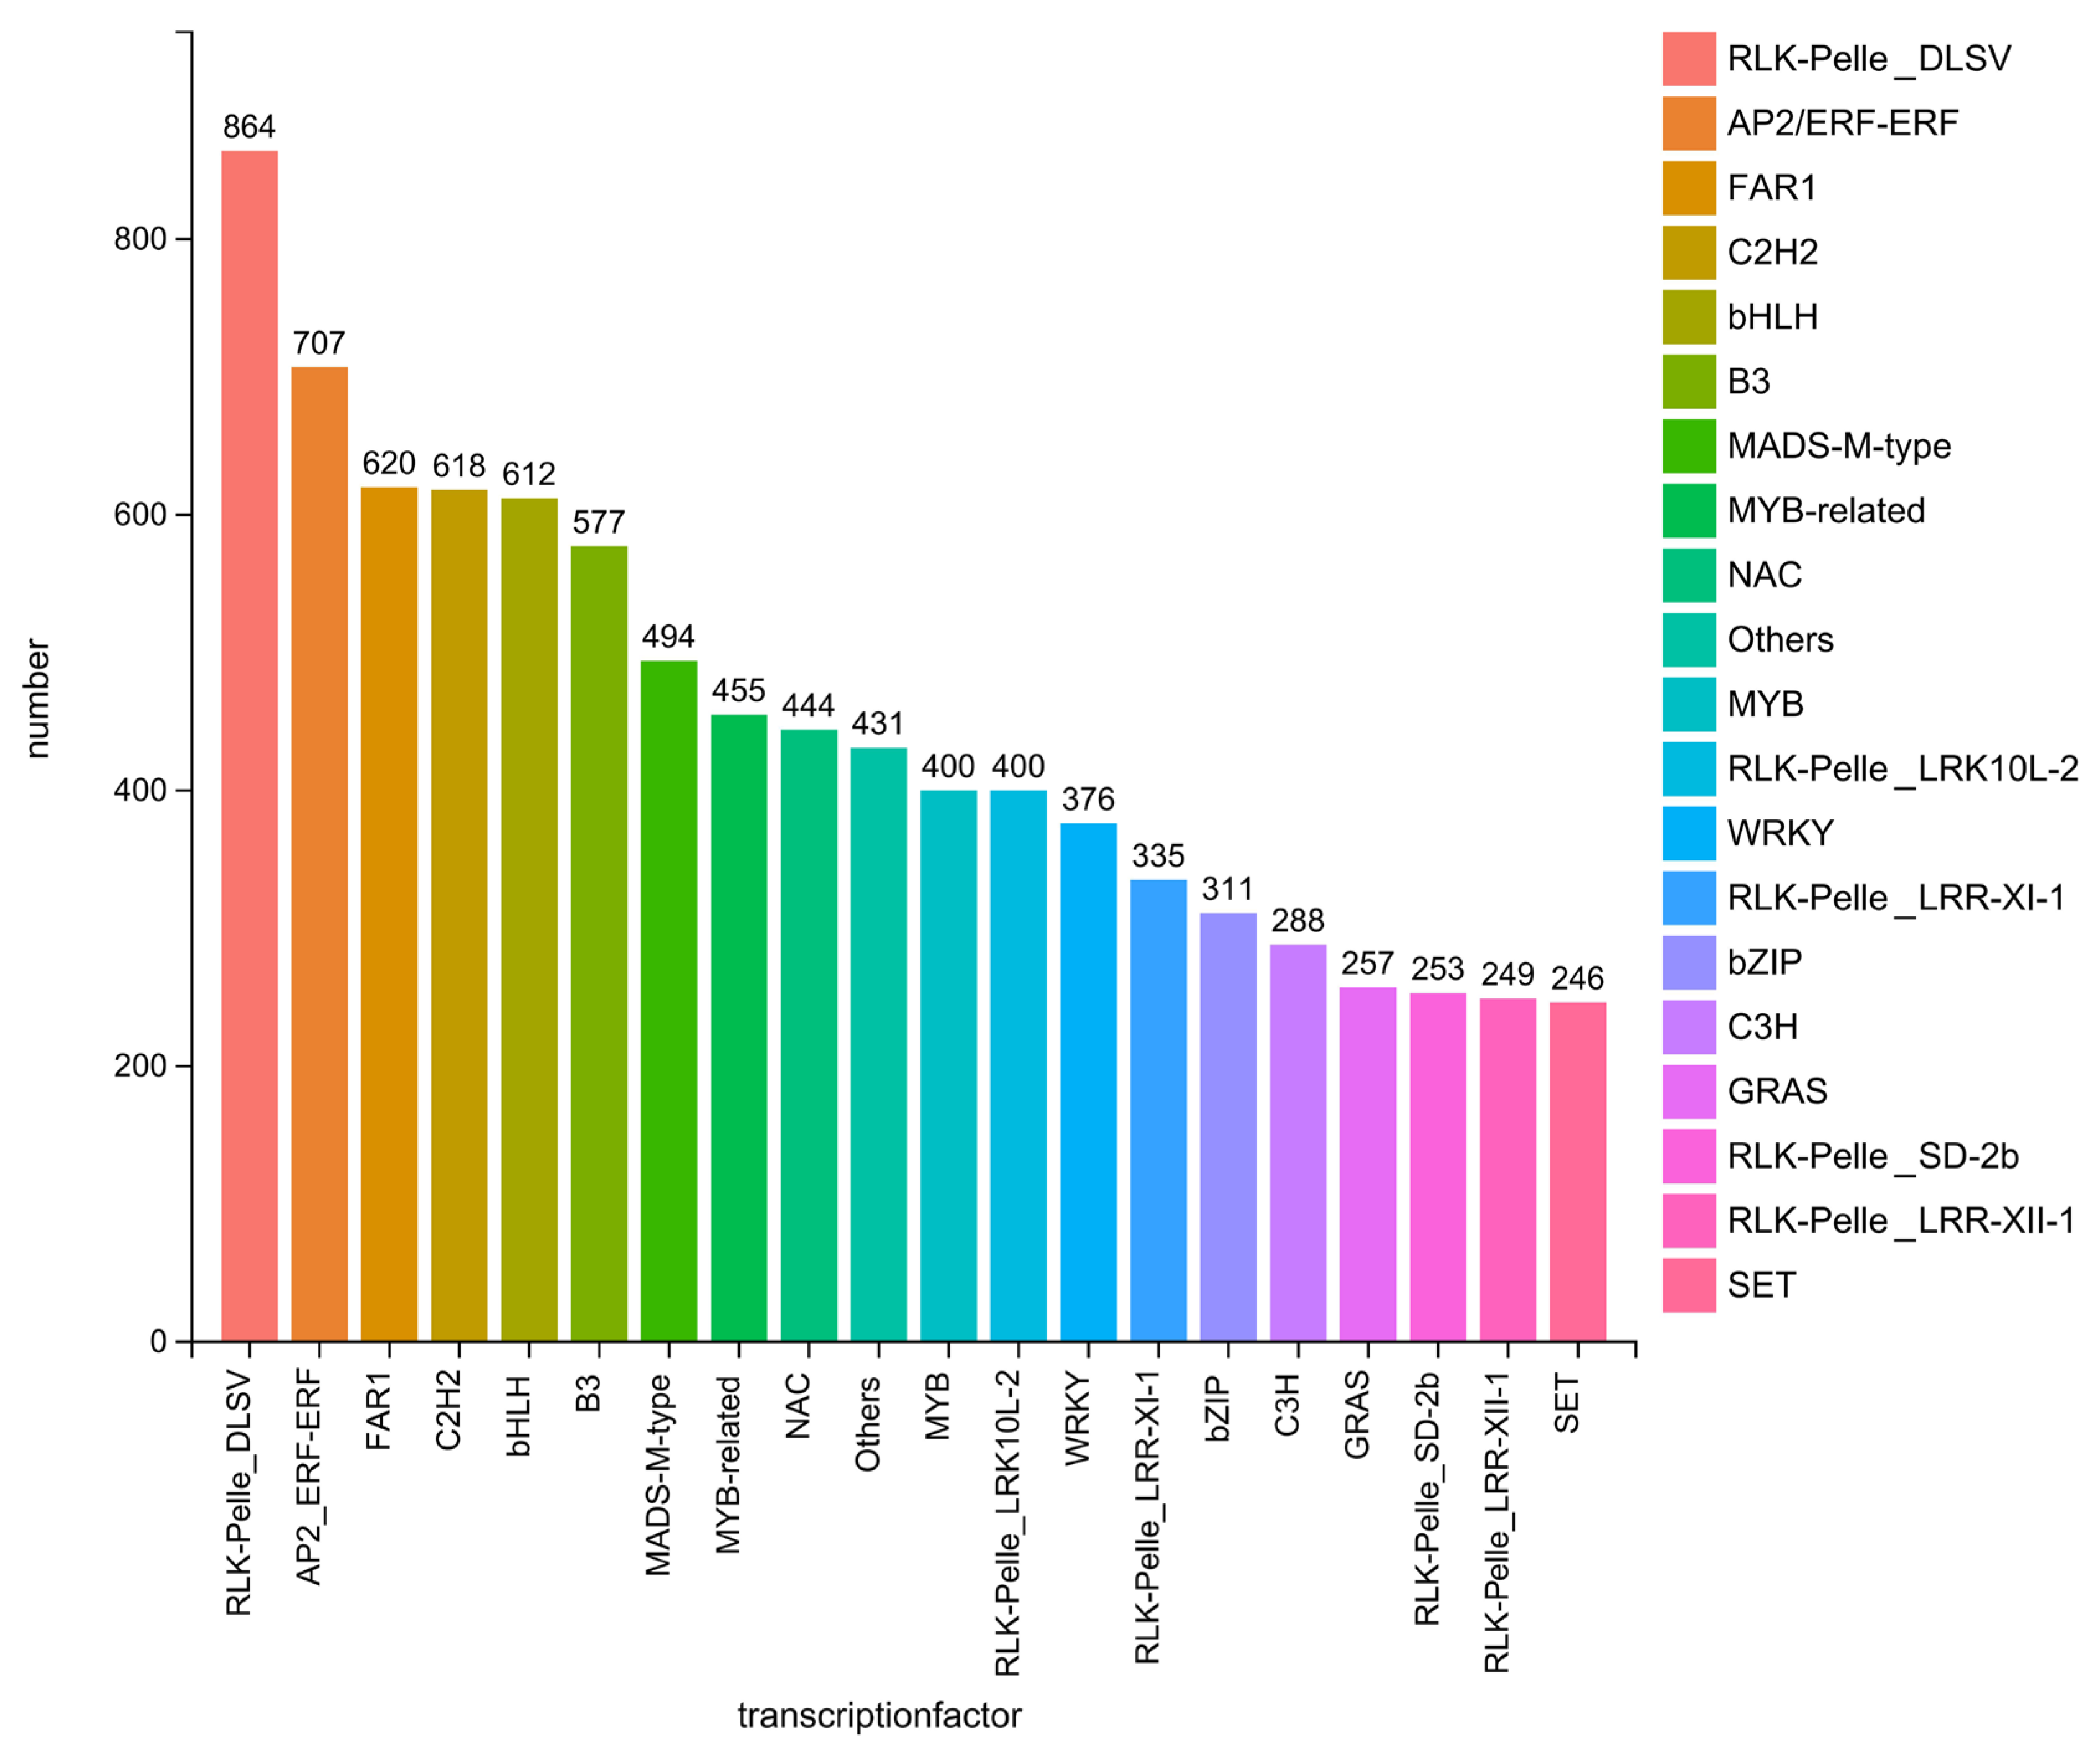
The IAA treatment on the low-phosphorus alfalfa roots formed a regulatory cluster centered on AP2/ERF-ERF, MYB, WRKY and bHLH, among which AP2/ERF-ERF (707 genes), MYB-related (455 genes) and MYB (400 genes) (Figure 5). In addition, the phosphorus response transcription factor families such as bHLH (612 genes), NAC (444 genes), WRKY (376 genes), GRAS (257 genes), and bZIP (311 genes) all have a considerable number of genes; the AP2/ERF and bZIP families integrate low-phosphorus and other abiotic stress signals, and finely regulate the phosphorus acquisition process of the plants.

3.3.4. Validation of RNA-Seq Data by Quantitative Real-Time PCR

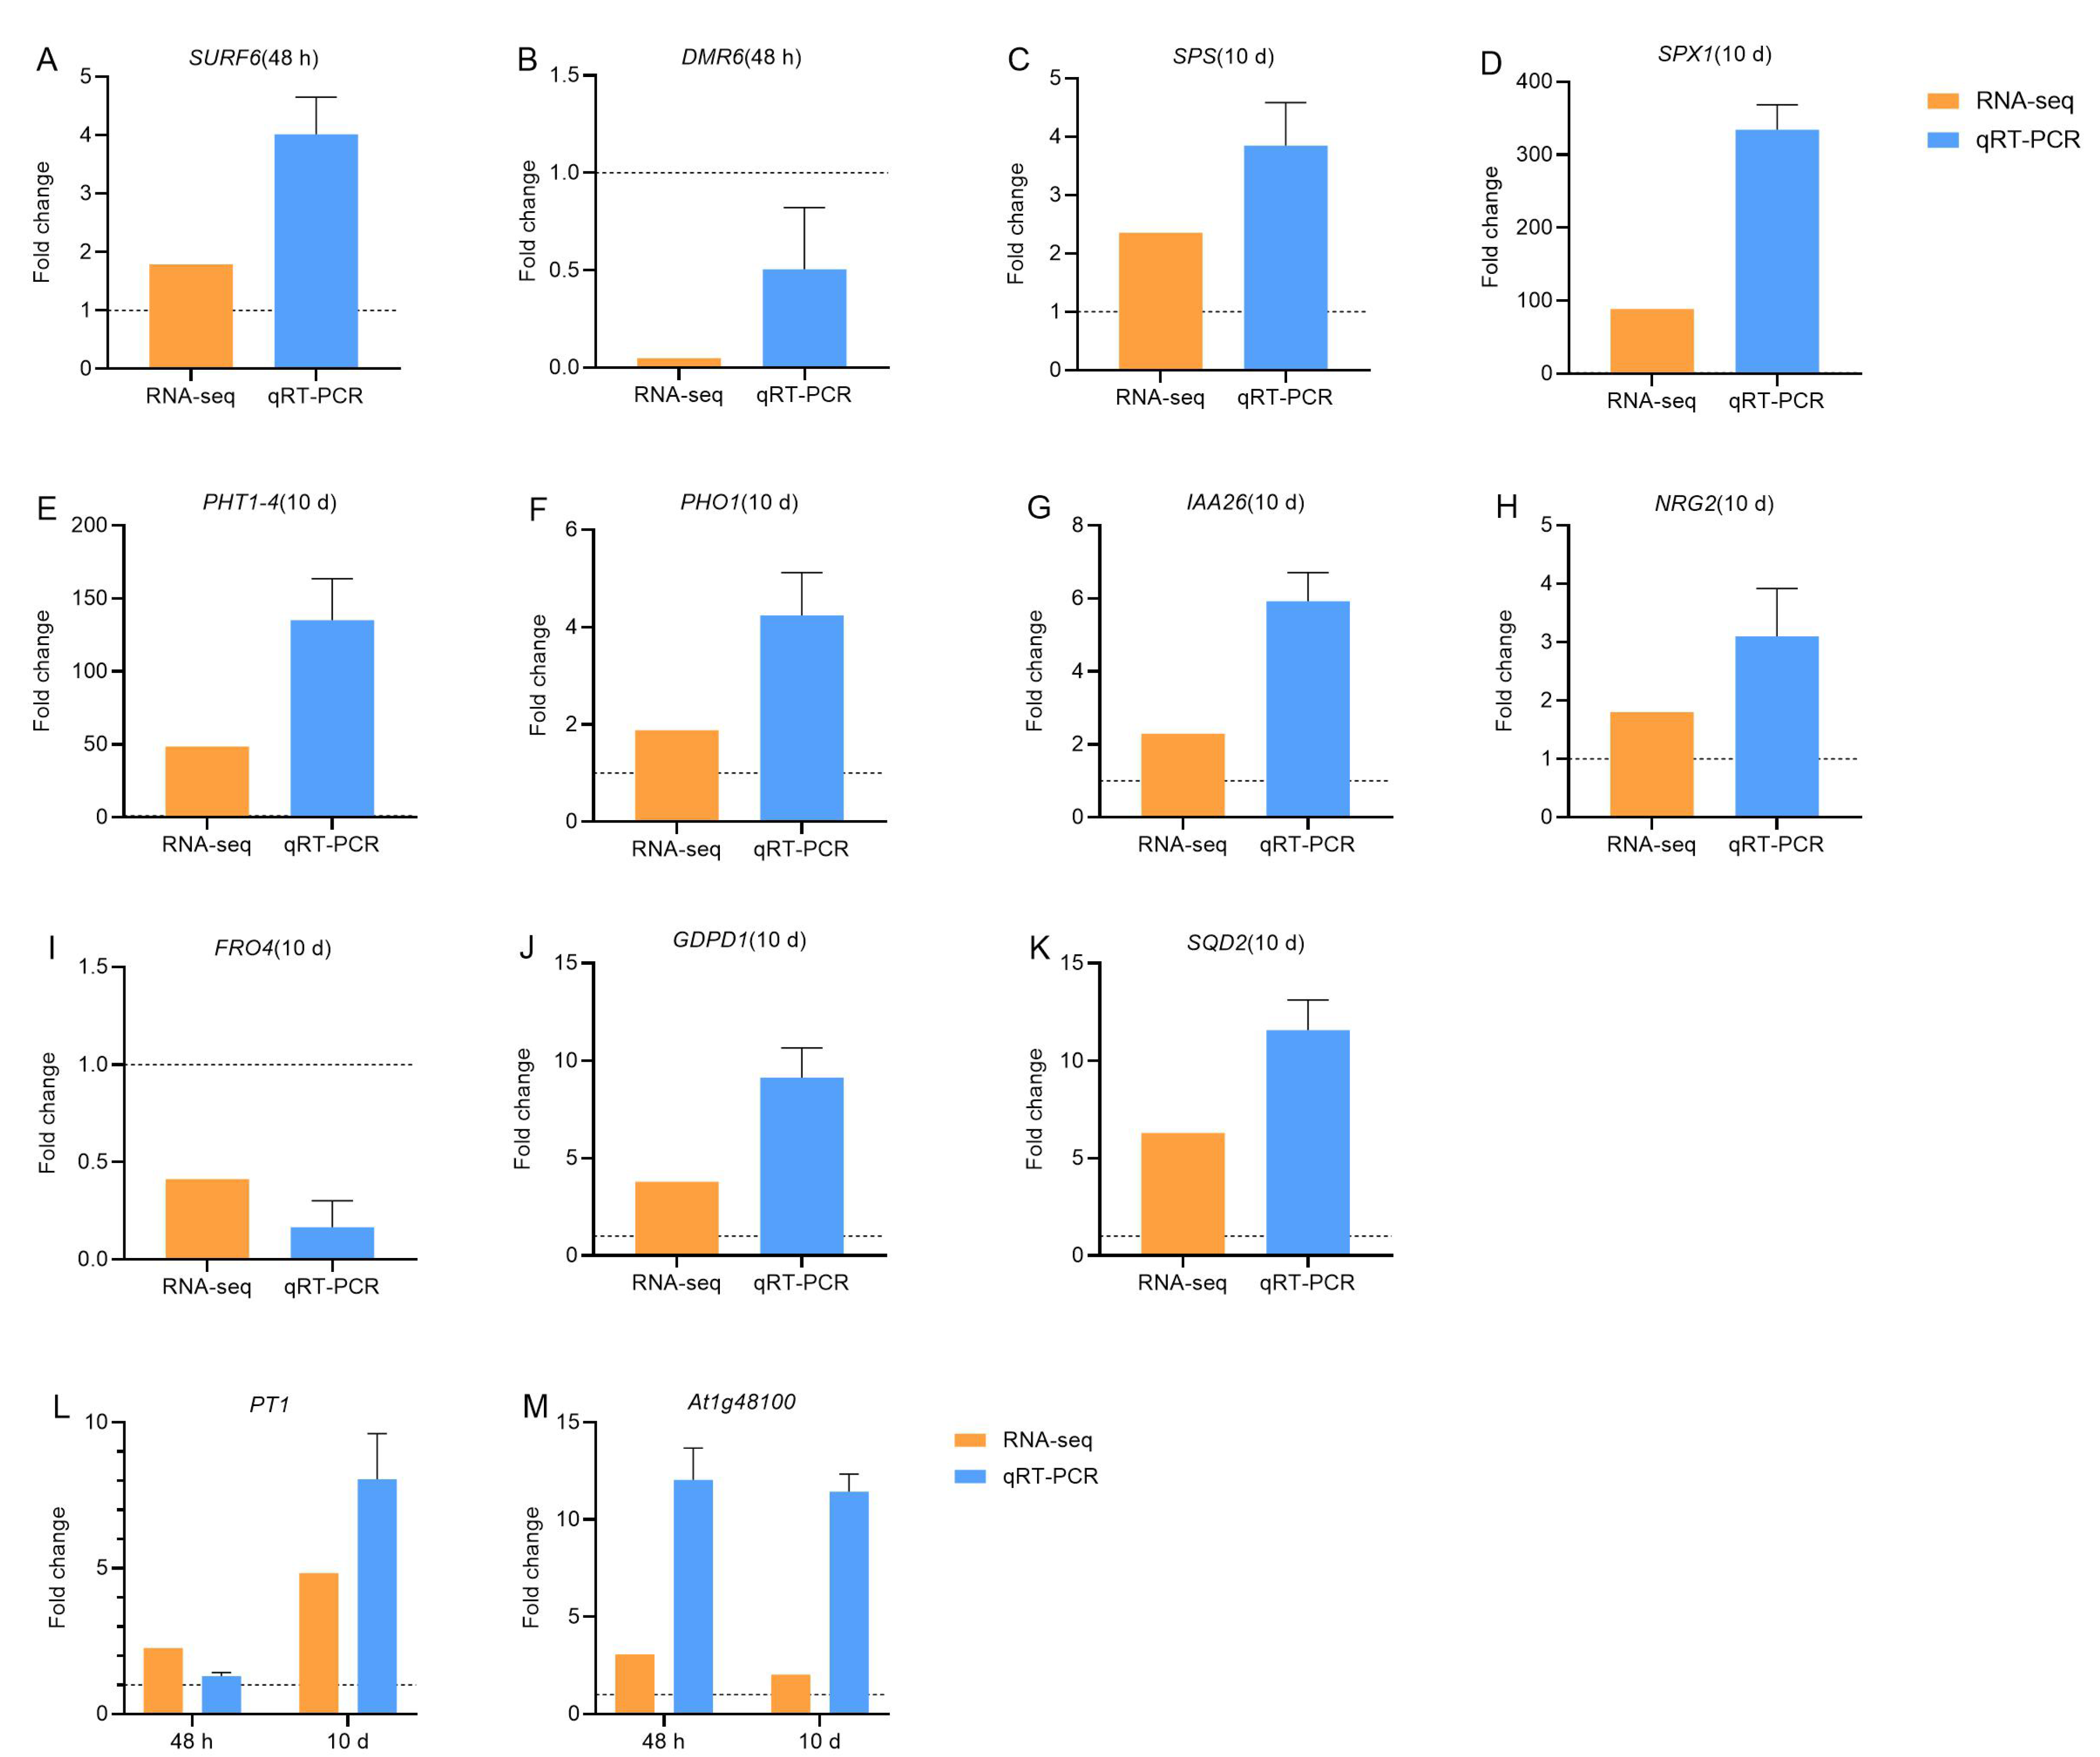
Sixteen genes were randomly selected for qRT-PCR validation. The selected genes included SURF6, SPS, PT1, SPX2, SPX1, PHT1-4, PHO1, SQD2, At1g48100, ARF, IAA8, NRT2.1, NRG2, ACO1, FRO4, and GDPD1. Their relative expression levels were calculated using the normal-phosphorus treatment as the control. qRT-PCR results showed that 81.25% of the selected genes exhibited expression trends consistent with the RNA-seq data (Figure 6). The remaining three genes with inconsistent expression trends are shown in the Supplementary Figure S1. These results confirmed the reliability and reproducibility of the transcriptomic dataset generated in this study.

3.4. Metabolomic Analysis: Statistics of Differentially Accumulated Metabolites and KEGG Enrichment Analysis

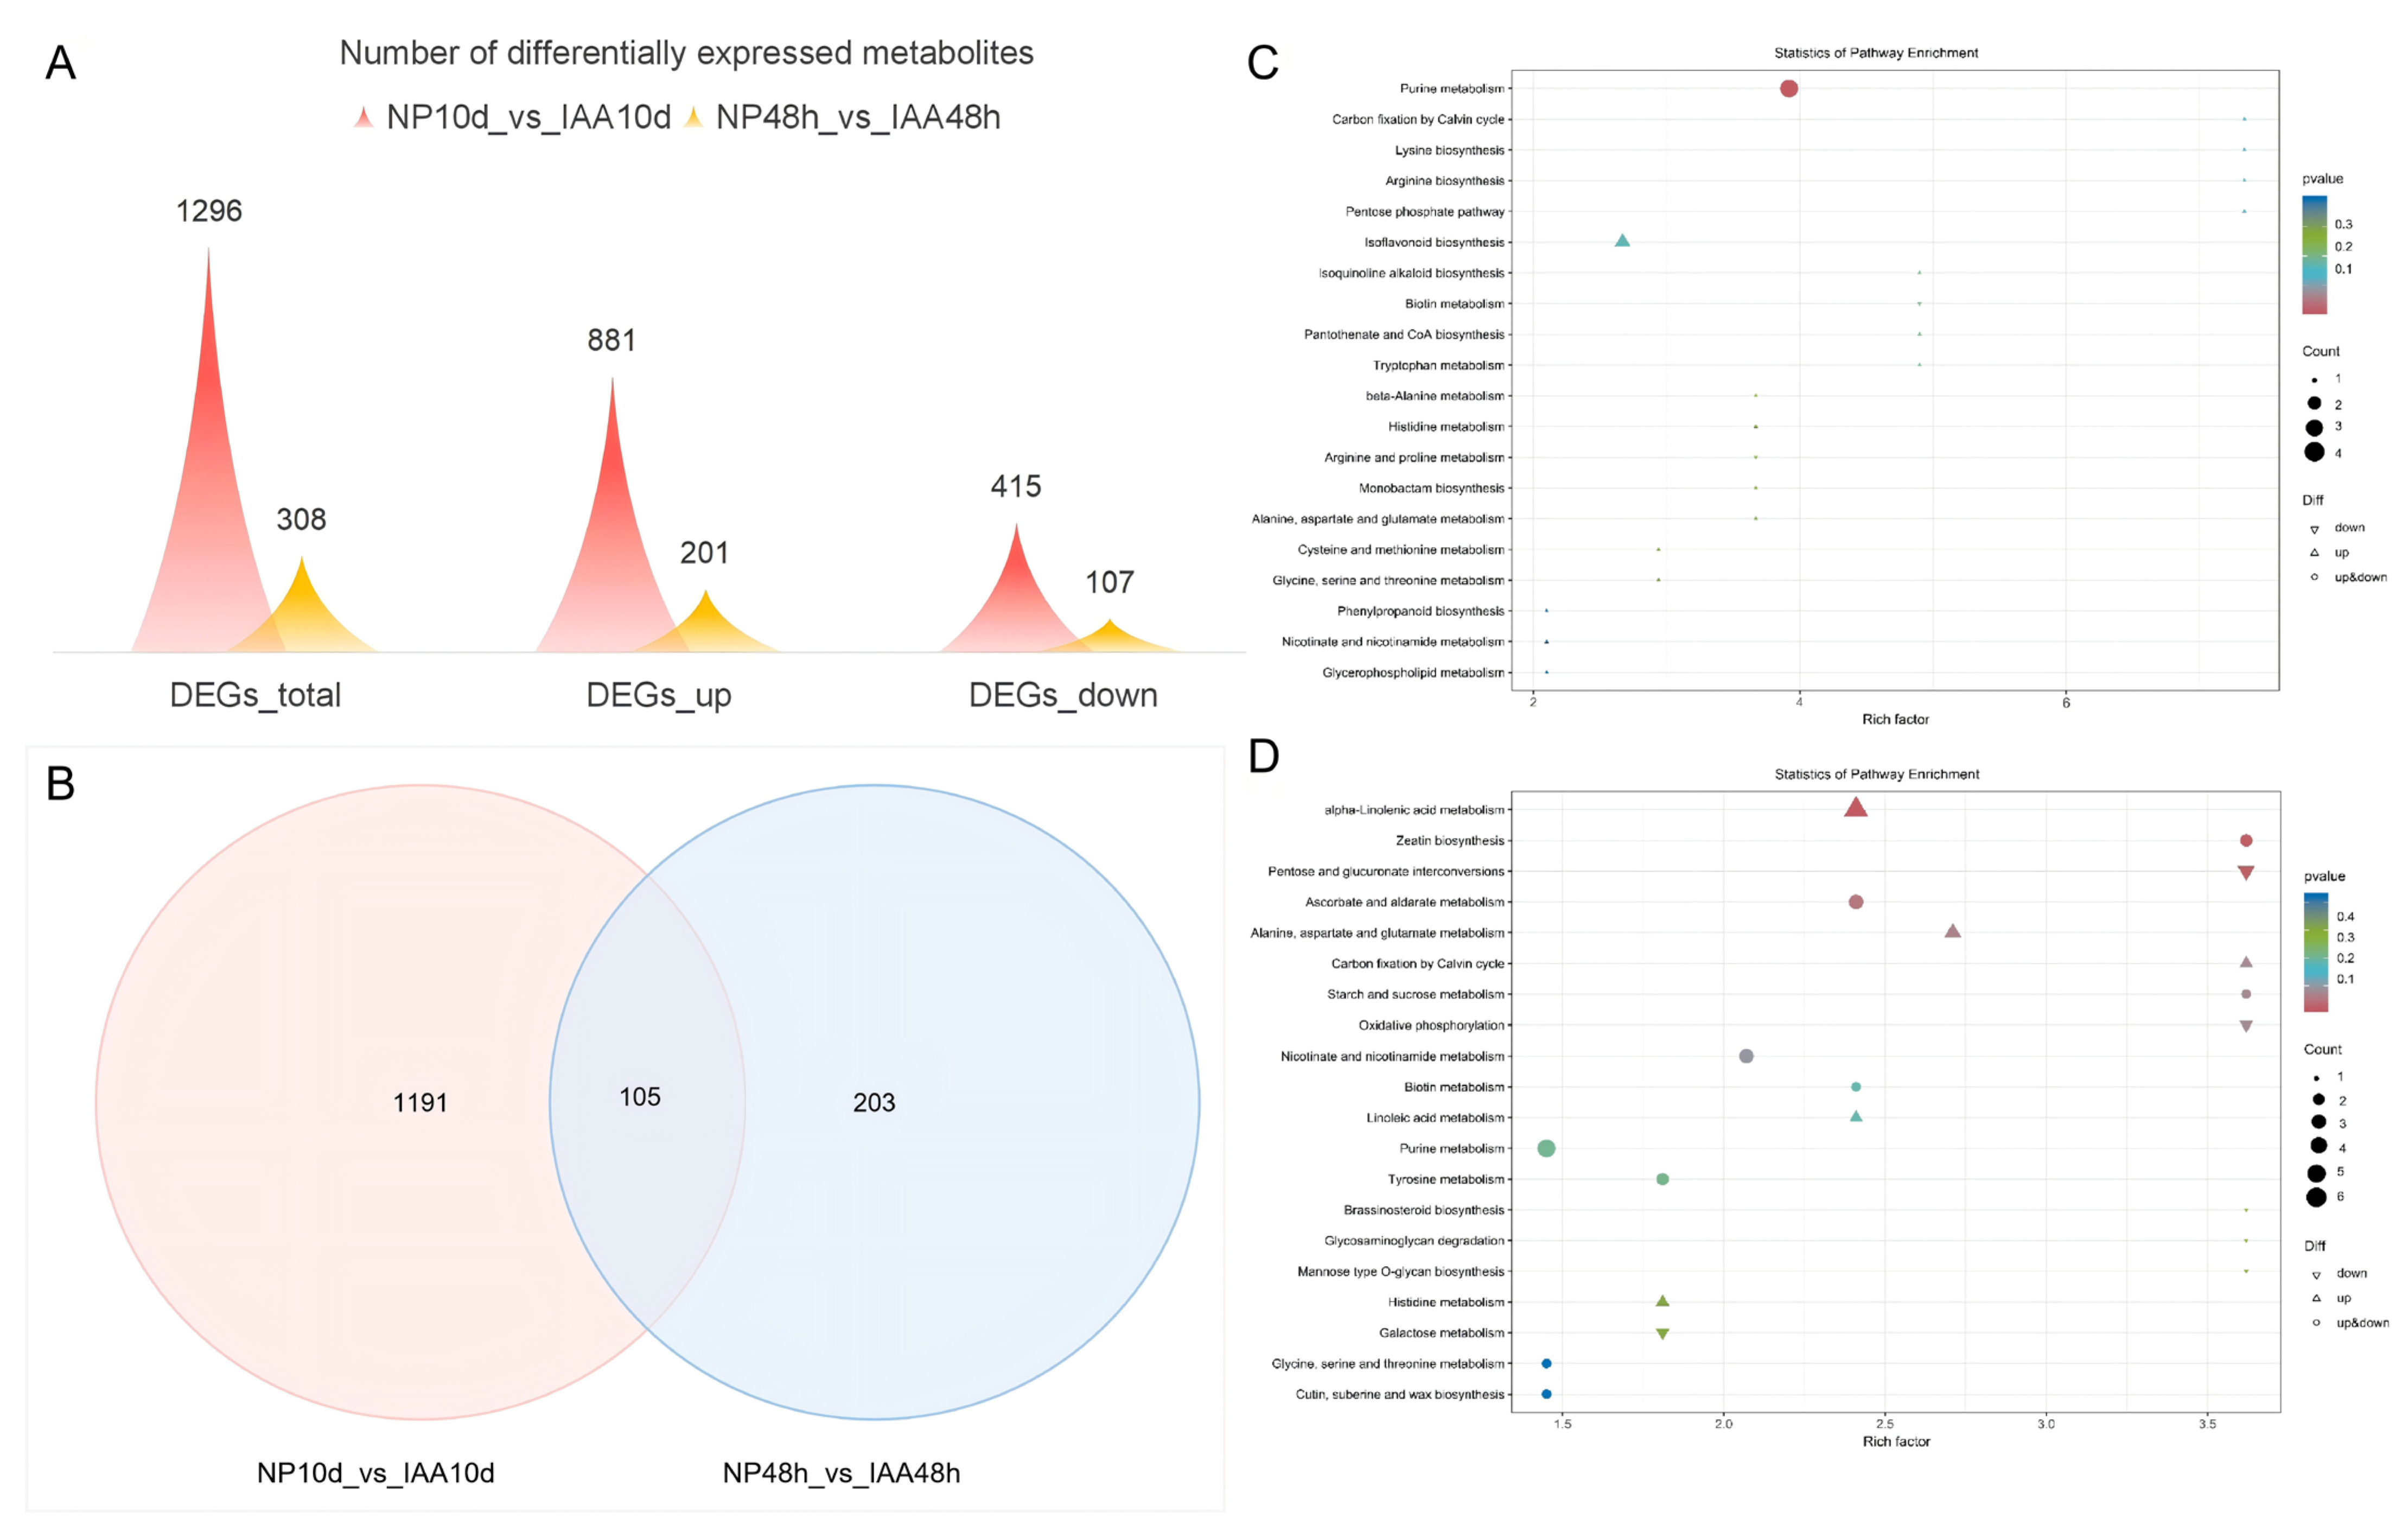
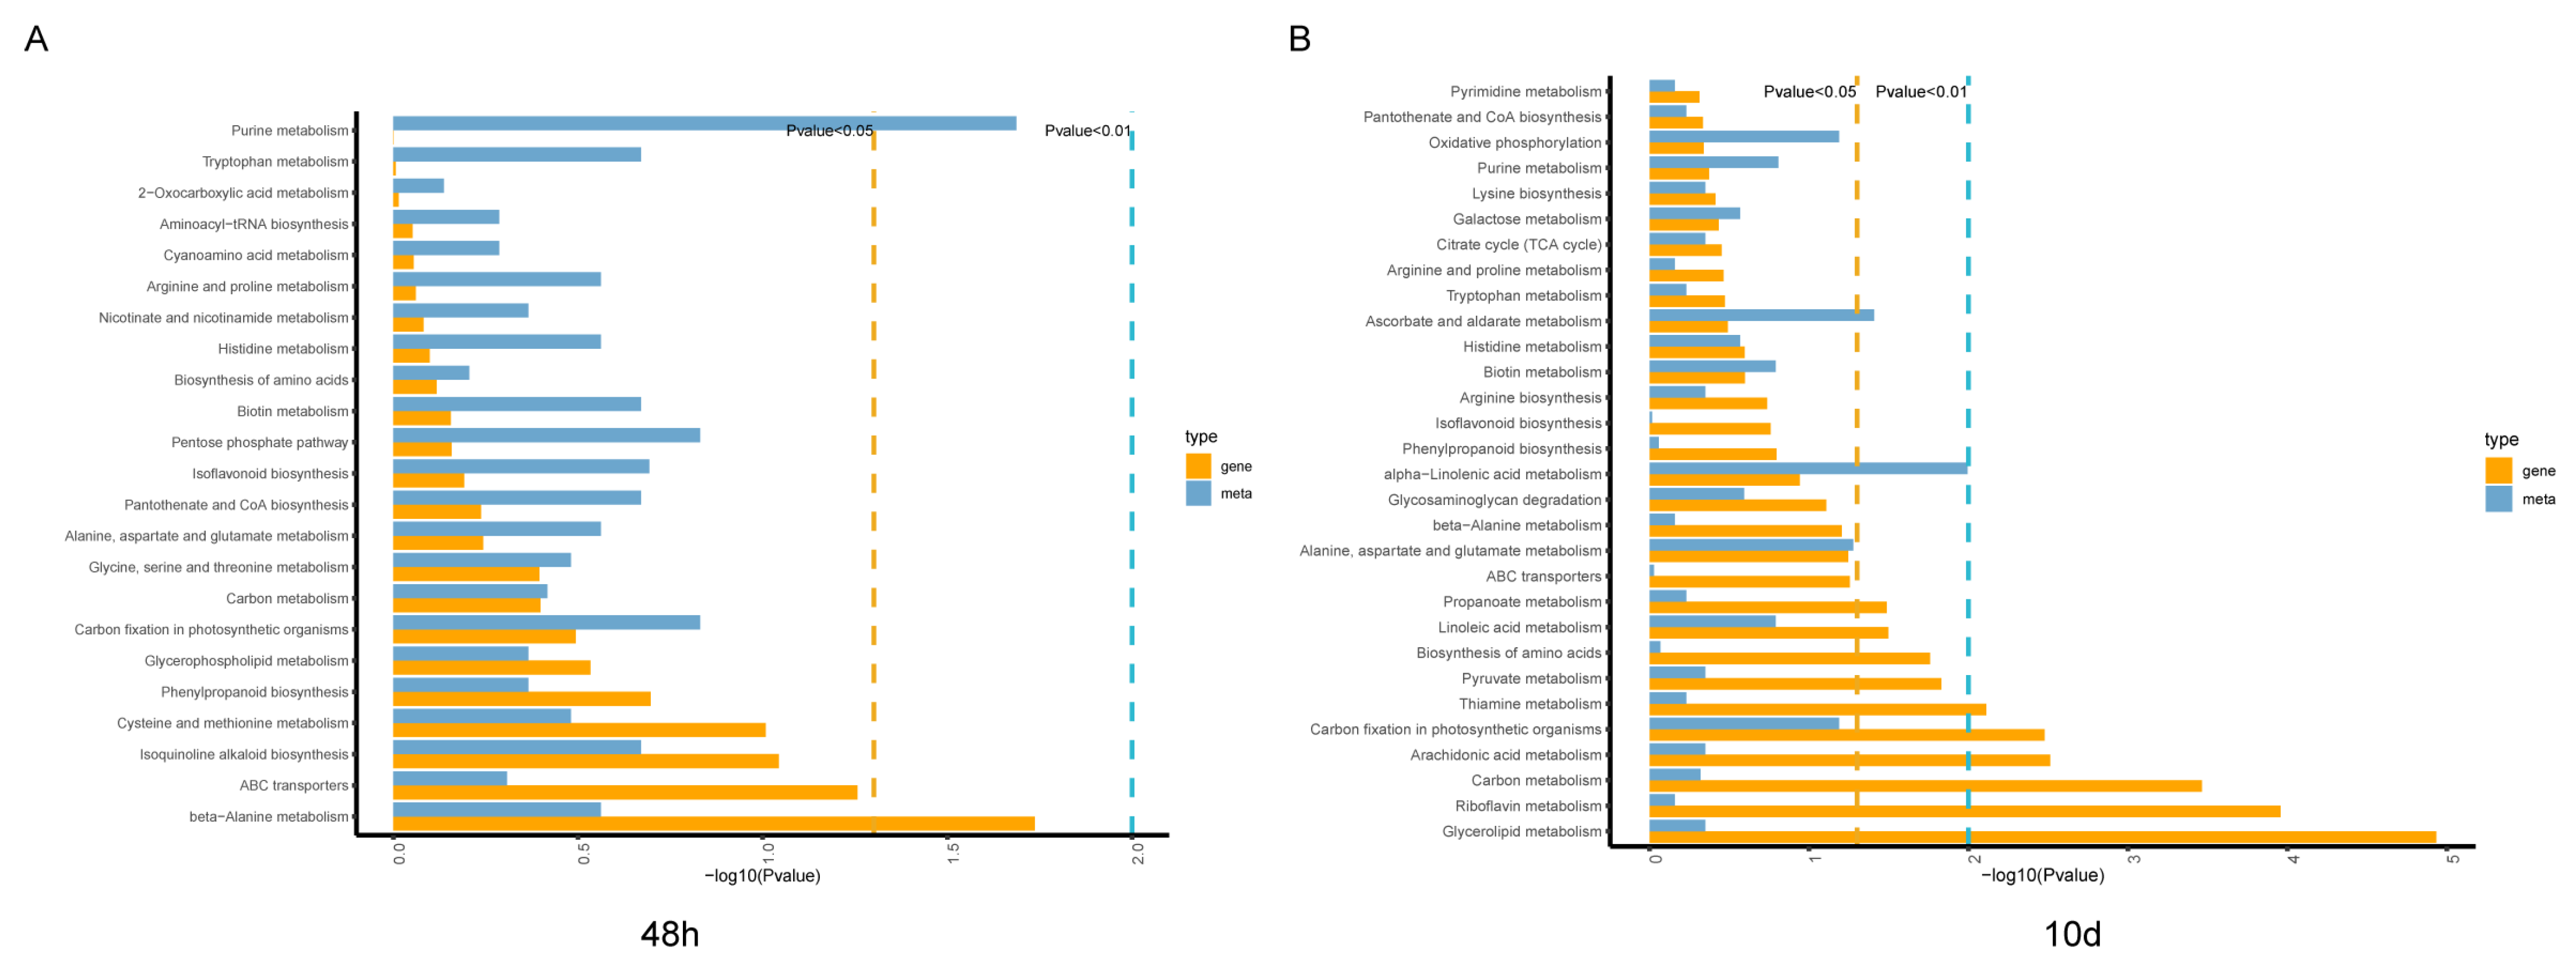
This study analyzed the differential metabolites between the IAA treatment group and the control group at two time points. As shown in Figure 7A and Table S4, 308 DAMs were identified at 48 h, including 201 up-regulated and 107 down-regulated metabolites. At 10 d, the number of DAMs increased substantially to 1296, comprising 881 up-regulated and 415 down-regulated metabolites. A total of 105 DAMs were shared between both time points (Figure 7B).
KEGG pathway enrichment analysis revealed that DAMs identified at 48 h were predominantly enriched in purine metabolism (Figure 7C). Secondary metabolite biosynthesis pathways, including zeatin biosynthesis and indole diterpenoid biosynthesis, were also significantly enriched. By contrast, DAMs at 10 d were mainly associated with primary carbon metabolism and energy metabolism pathways (Figure 7D), including alpha-linolenic acid metabolism, pentose and glucuronate interconversions, ascorbate and aldarate metabolism, and starch and sucrose metabolism.

3.5. Integrated Transcriptomic and Metabolomic Analysis

3.5.1. Gene–Metabolite Correlation Network Analysis

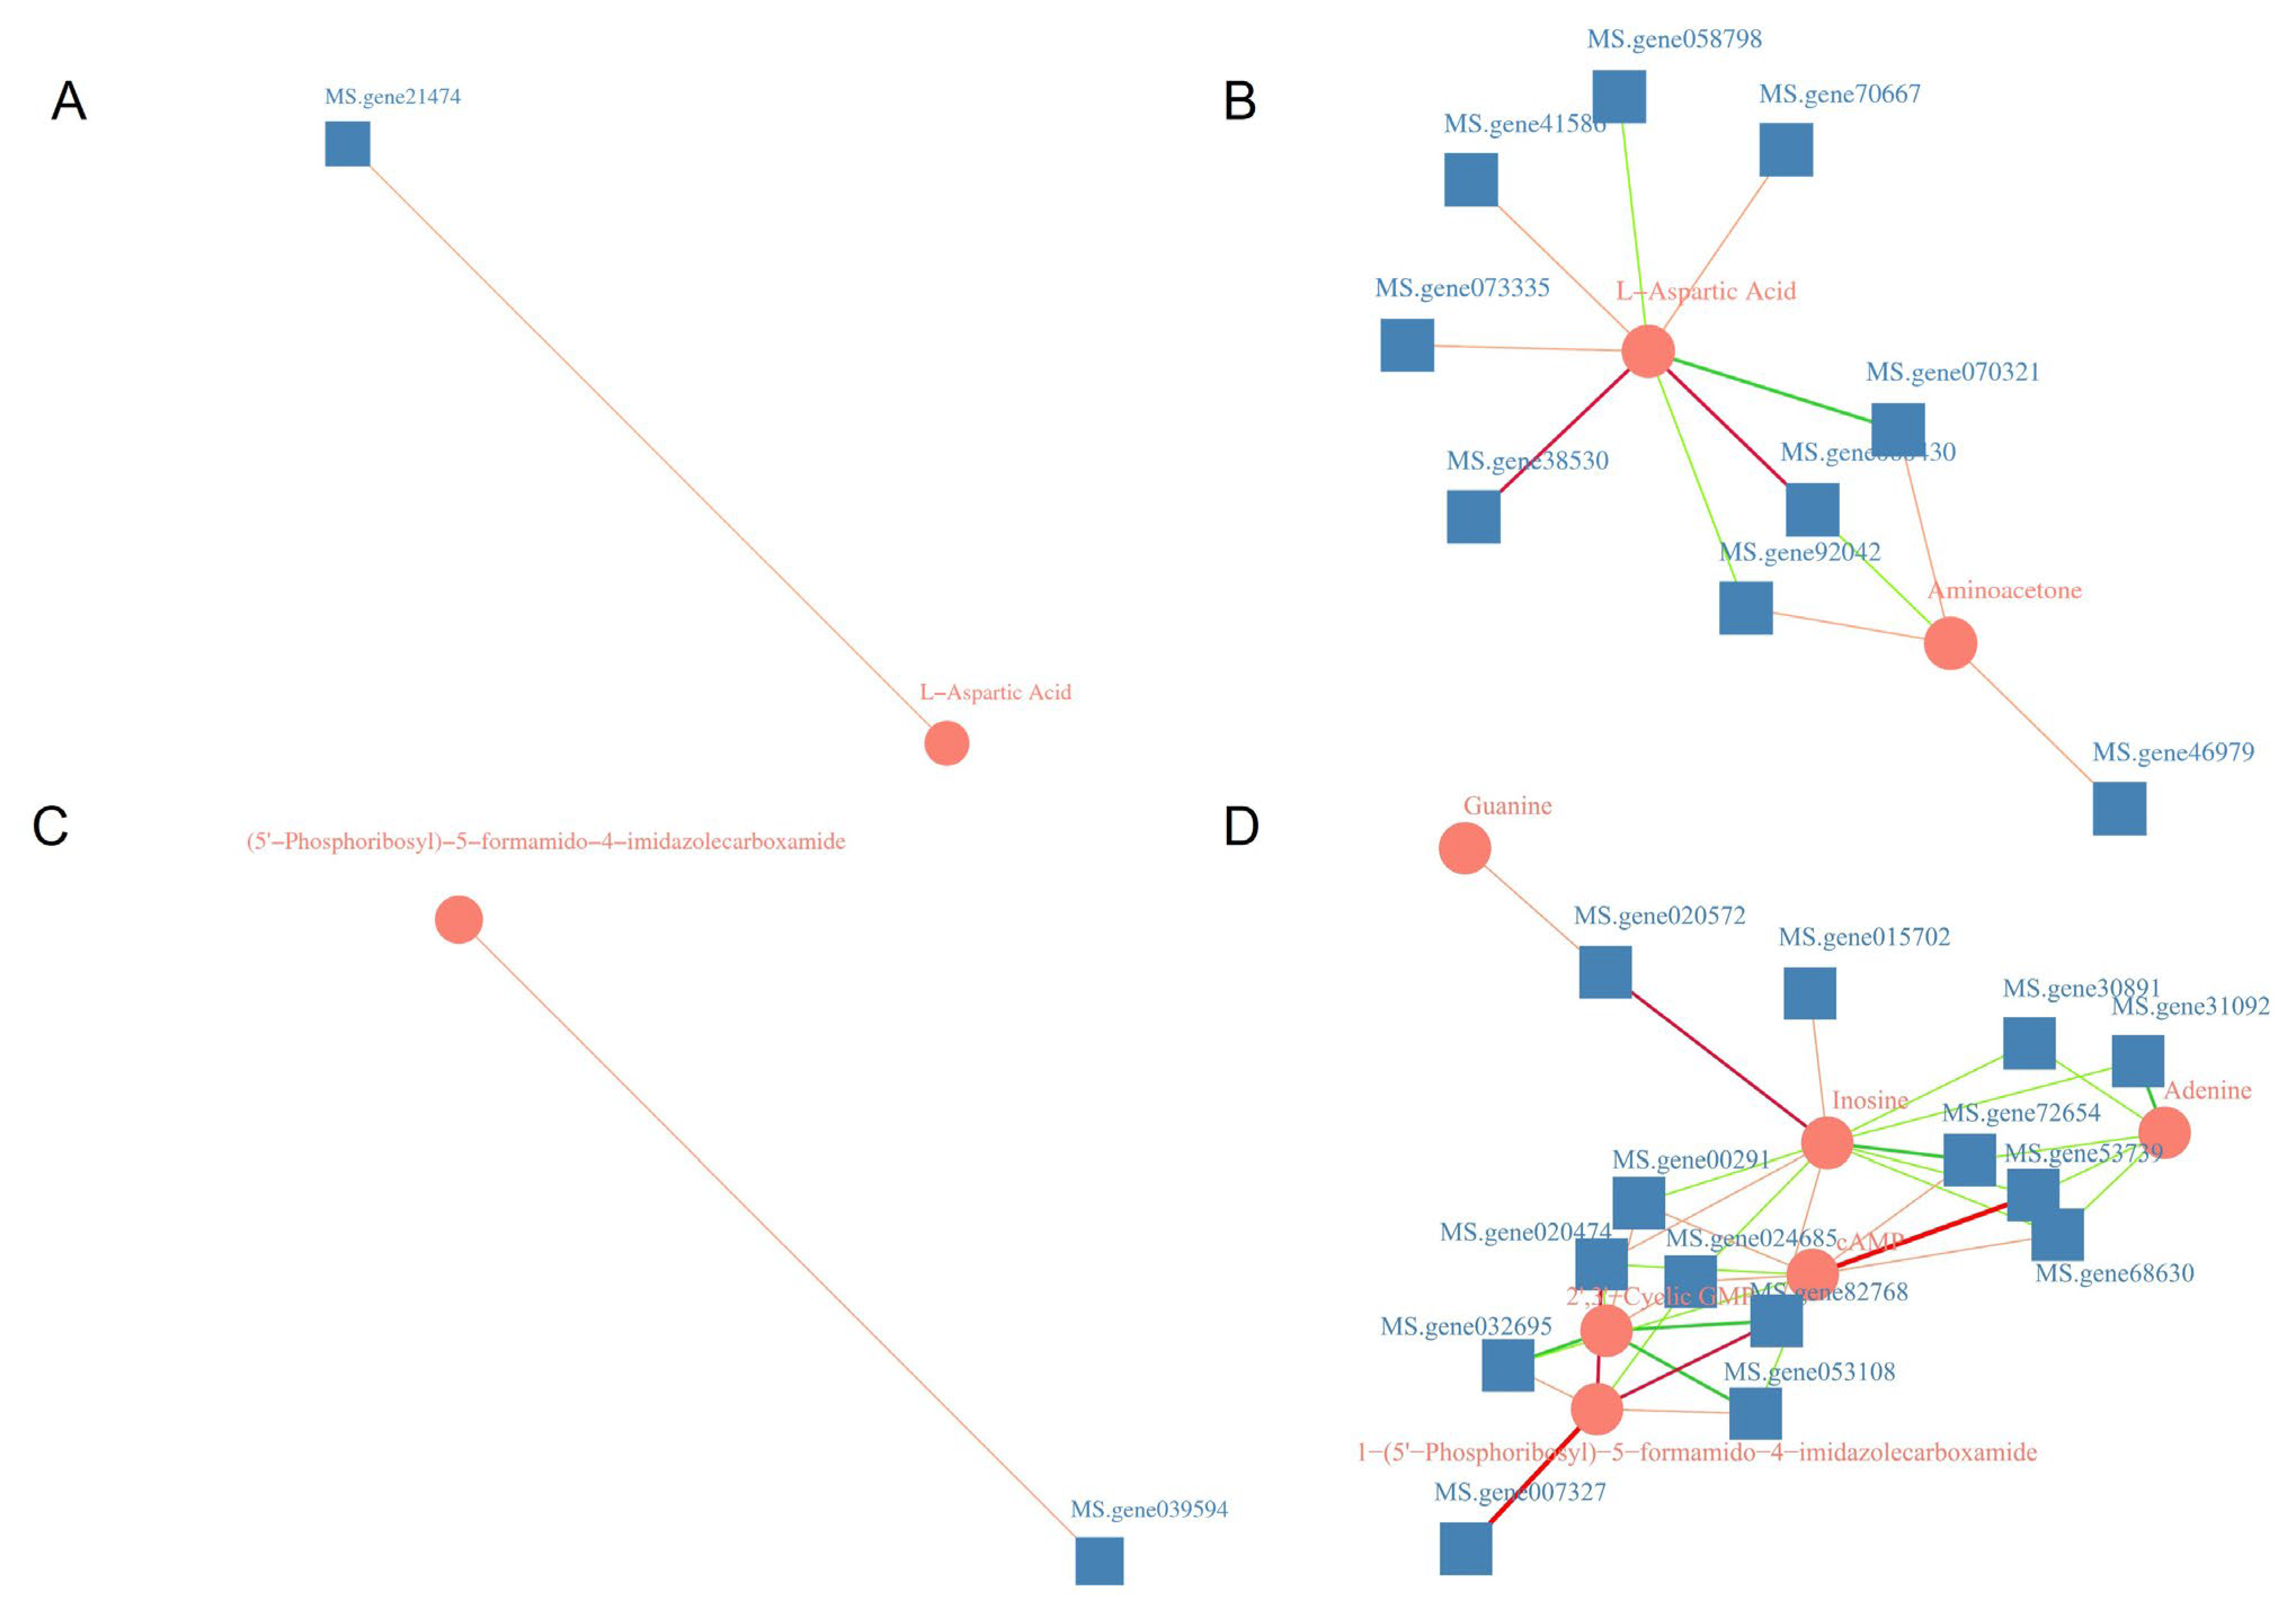
Correlation networks at 48 h and 10 d were constructed to uncover coordinated gene-metabolite regulatory patterns during IAA-mediated low-phosphorus adaptation in alfalfa (Figure 8A–D). At 48 h, the glycine, serine and threonine metabolic pathway (ko00260) only detected one association between L-aspartate and GDCS (MS.gene 21474). Similarly, in the purine metabolism pathway (ko00230), a single association was observed between (5′-phosphoribosyl)-5-formamido-4-imidazolecarboxamide (FAICAR) and ATIC (MS.gene 039594). No obvious regulatory clusters were formed in either pathway at this stage. After 10 days, the ko00260 pathway network expanded significantly. L-aspartic acid was directly linked to eight genes, showing a positive correlation with AGT2 (MS.gene 38530), while showing a negative correlation with most of the other connected genes. Additionally, acetoacetate was found to be a new metabolite in this network. It was indirectly related to the core nodes through AGT1 (MS.gene 92042) and directly connected to another AGT1 homolog gene (MS.gene 46979).
After 48 h in the purine metabolism pathway (ko00230), only the purine intermediate FAICAR exhibited a single regulatory interaction with ATIC (MS.gene 039594). Ten days later, FAICAR still maintained a conserved connection with ATIC and formed multiple new gene associations. Additionally, it was also linked to the downstream core hub metabolite guanosine through 2′,3′-cyclic GMP. Inosine bridges the upstream FAICAR-dependent purine biosynthesis pathway and several downstream metabolic branches, including adenine and cAMP, building a radial regulatory network. A series of purine derivatives, including guanine, adenine and cAMP, are newly recruited as secondary regulatory nodes. Guanine was indirectly correlated with inosine via PK (MS.gene 020572). The direct interaction between adenine and inosine constitutes an independent local subnetwork.

3.5.2. Integrated KEGG Enrichment Analysis of Transcriptomic and Metabolomic Data

At 48 h, integrated KEGG enrichment based on transcriptomic and metabolomic data revealed little overlap between pathways enriched by DEGs and DAMs (Figure 9A). Metabolite data exhibited the strongest enrichment in purine metabolism (p = 0.0206). Tryptophan metabolism, isoflavonoid biosynthesis, and phenylpropanoid biosynthesis showed certain enrichment trends but did not reach statistical significance. At the transcriptomic level, only beta-alanine metabolism was significantly enriched (p = 0.0183), whereas all other pathways did not reach the threshold of p < 0.05.
More pathways were enriched by DEGs after 10 days of treatment, suggesting that prolonged IAA application triggered extensive transcriptional reprogramming (Figure 9B). Significantly enriched gene pathways included glycerolipid metabolism, riboflavin metabolism, carbon metabolism, carbon fixation in photosynthetic organisms, thiamine metabolism, pyruvate metabolism, biosynthesis of amino acids, linoleic acid metabolism, and propanoate metabolism. Among these, glycerolipid metabolism, riboflavin metabolism, and carbon metabolism exhibited the highest enrichment levels.
Metabolomic enrichment analysis identified significant accumulation of metabolites associated with alpha-linolenic acid metabolism, pentose and glucuronate interconversions, zeatin biosynthesis, and ascorbate and aldarate metabolism. Compared with the 48 h treatment, transcriptomic enrichment at 10 d was more strongly concentrated in pathways related to lipid metabolism, carbon metabolism, and energy metabolism, whereas metabolomic enrichment mainly involved lipid signaling, sugar metabolism, hormone-related metabolism, and antioxidant metabolism.

3.5.3. Coordinated Regulation of Key Metabolic and Hormone Signaling Pathways

Based on combined transcriptomic and metabolomic results alongside Pathview mapping outputs, four pathways were identified as key regulatory nodes in IAA-mediated adaptation to low-phosphorus stress: tryptophan metabolism, cysteine and methionine metabolism, glycerophospholipid metabolism, and plant hormone signal transduction. In the tryptophan metabolism pathway, YUC and TAA1/TAR genes were up-regulated, indicating activation of the tryptophan-dependent auxin biosynthesis route. Several ACO family members displayed differential expression, which points to the involvement of ethylene metabolism in IAA-mediated responses to phosphorus deficiency. The expression of ASMT, a rate-limiting enzyme gene involved in melatonin biosynthesis, was significantly down-regulated. In downstream carbon flux redistribution, CAT was up-regulated, potentially directing metabolic flux toward cinnavalininate, whereas OADH was significantly down-regulated, possibly limiting the entry of nitrogen metabolism intermediates into central carbon metabolism. The metabolite 5-hydroxyindolepyruvate was significantly enriched, further supporting activation of the indole-related metabolic pathway (Figure S2).
For cysteine and methionine metabolism, phosphoglycerate dehydrogenase (PHGDH) displayed obvious up-regulation, whereas OAS-TL, a key downstream biosynthetic gene, remained consistently down-regulated. This trend suggests reduced conversion of O-acetyl-L-serine into cysteine. On the other hand, ethylene biosynthesis genes including SAMDC and ACO were coordinately induced, activating the methionine-dependent ethylene biosynthetic branch. Genes belonging to the BCAT family exhibited varied expression trends. L-aspartate accumulated significantly, providing a carbon skeleton precursor for interconnected metabolic pathways (Figure S3).
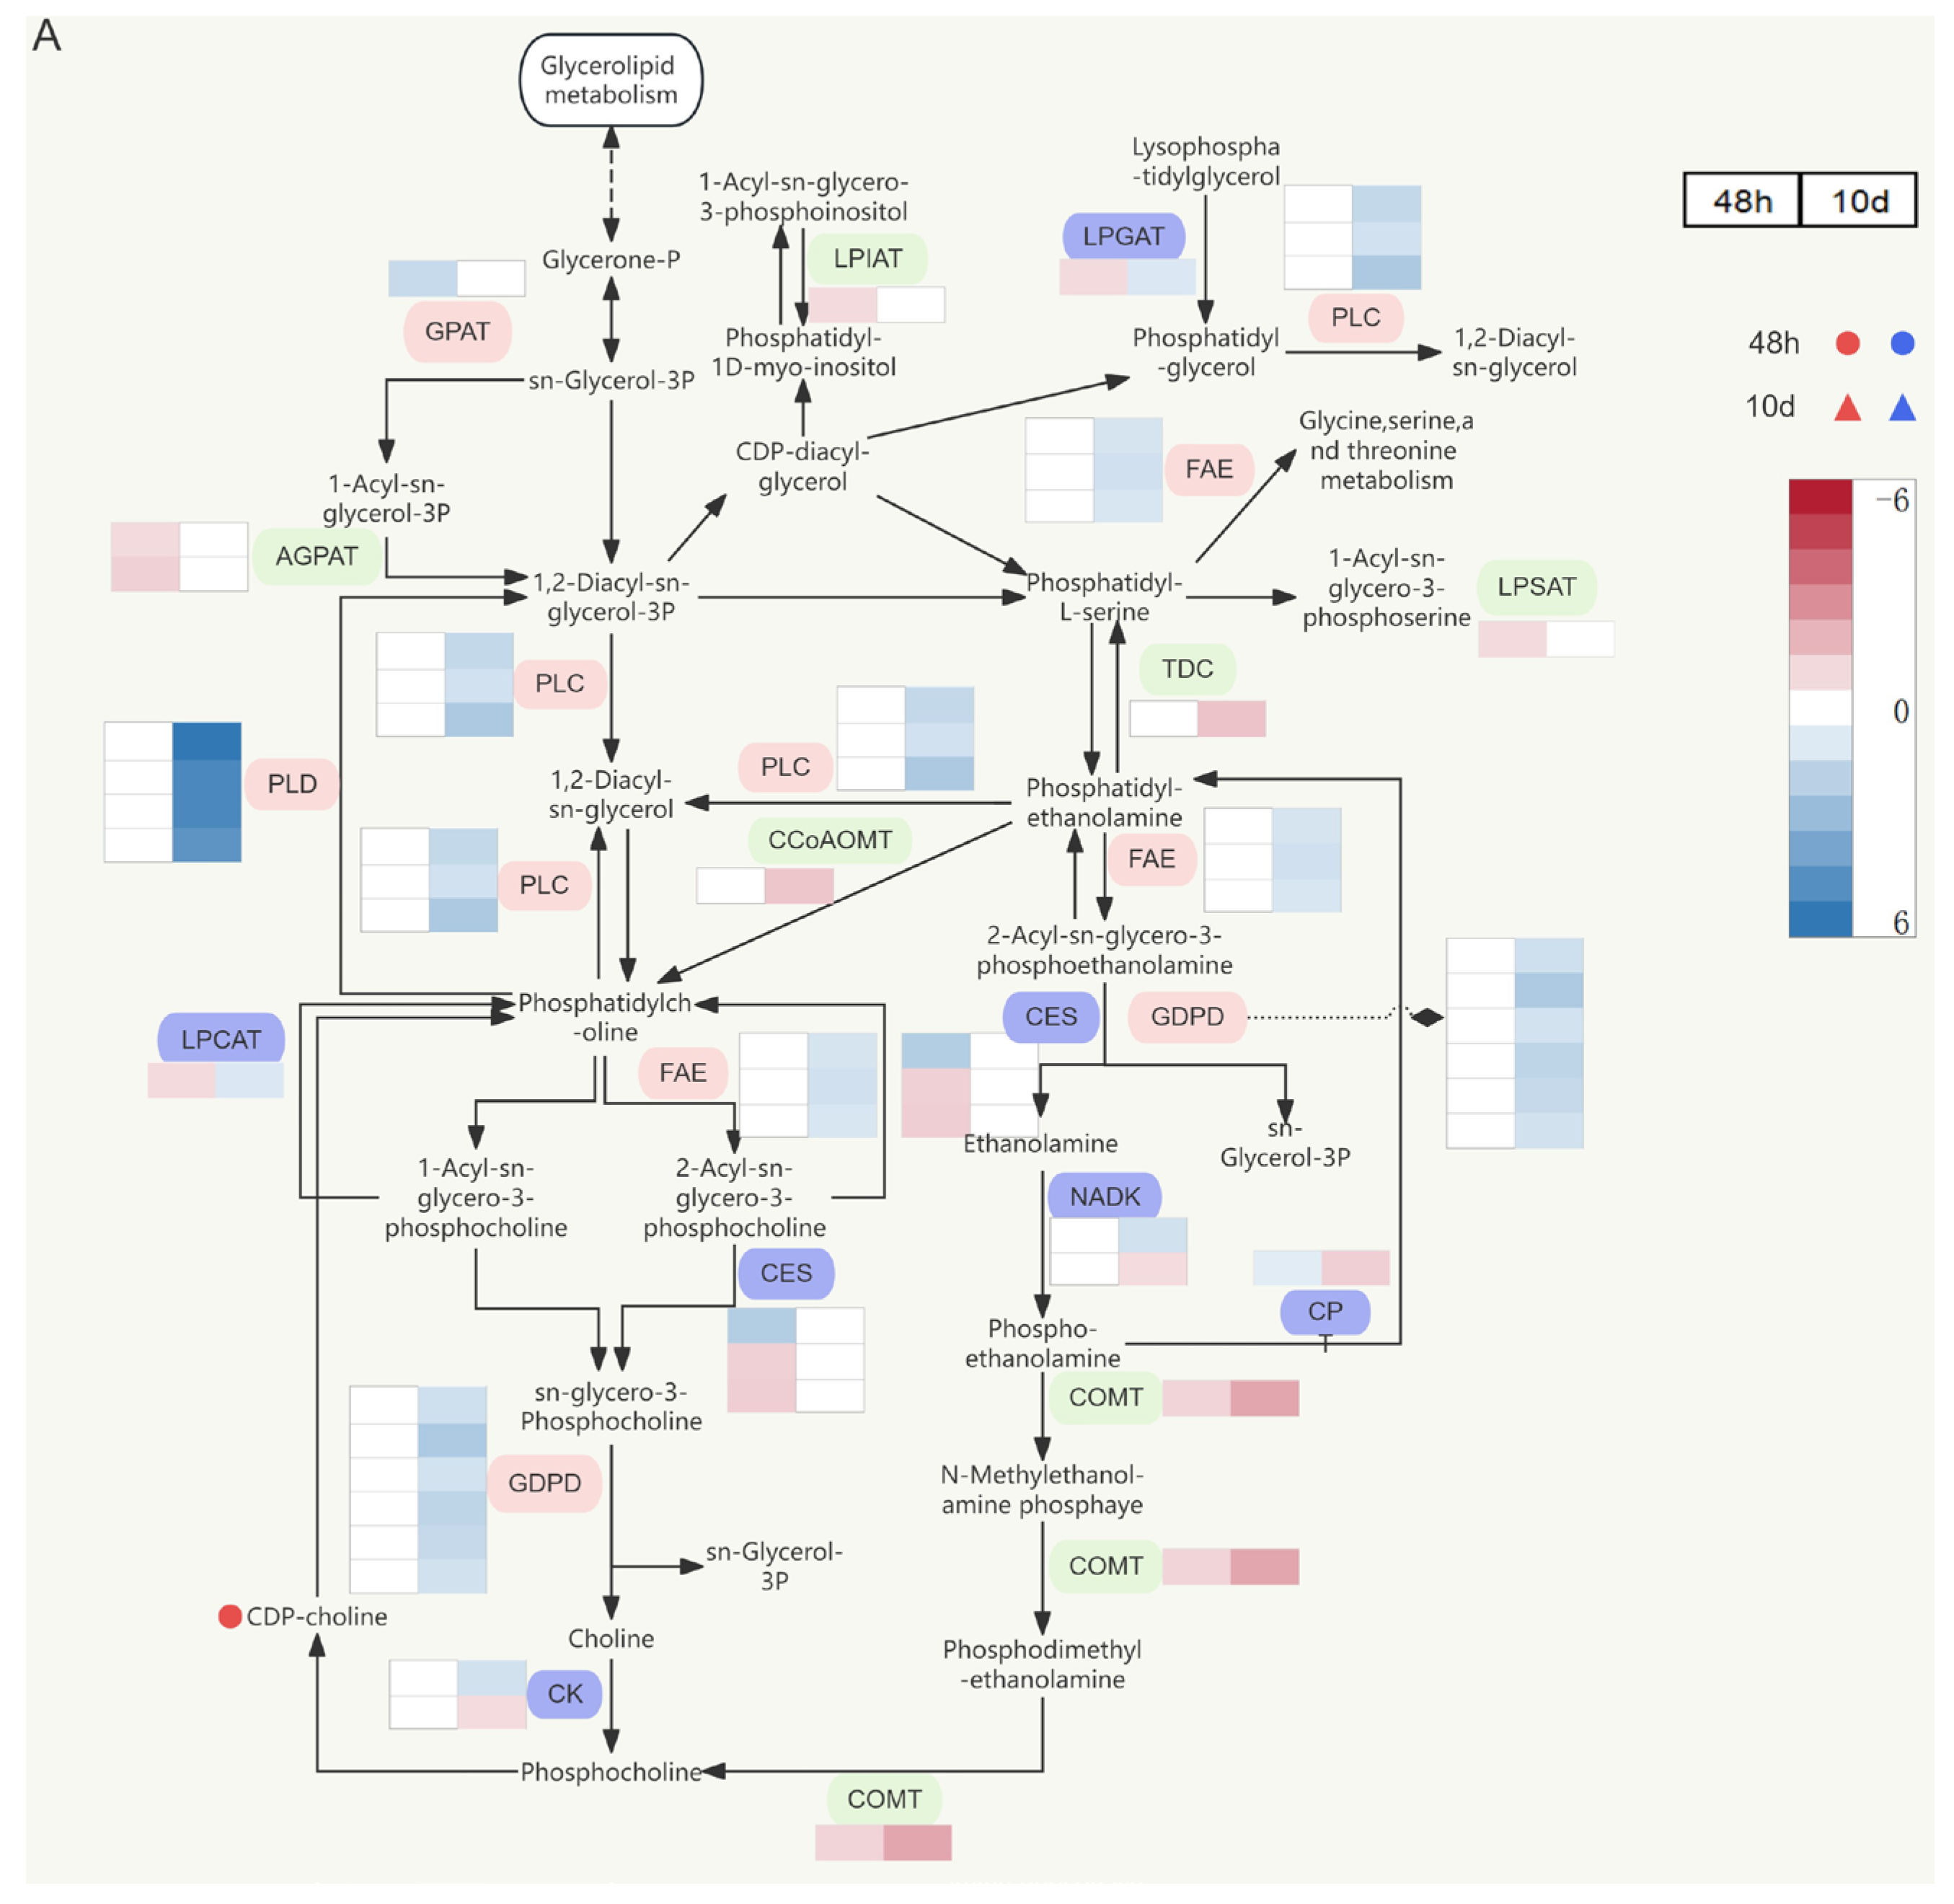
In glycerophospholipid metabolism, genes responsible for biosynthesis (AGPAT, LPCAT, LPIAT) and lipid modification and conversion (PLC, FAE, GDPD, COMT) were all up-regulated (Figure 10A). Such expression patterns imply coordinated control over membrane lipid synthesis, lipid remodeling and recycling of phospholipid breakdown products. The accumulation of CDP-choline also provided additional metabolic support for membrane phospholipid biosynthesis. These results indicate that IAA may help maintain membrane lipid homeostasis by regulating glycerophospholipid metabolism and may participate in phosphorus reutilization under low-phosphorus conditions.
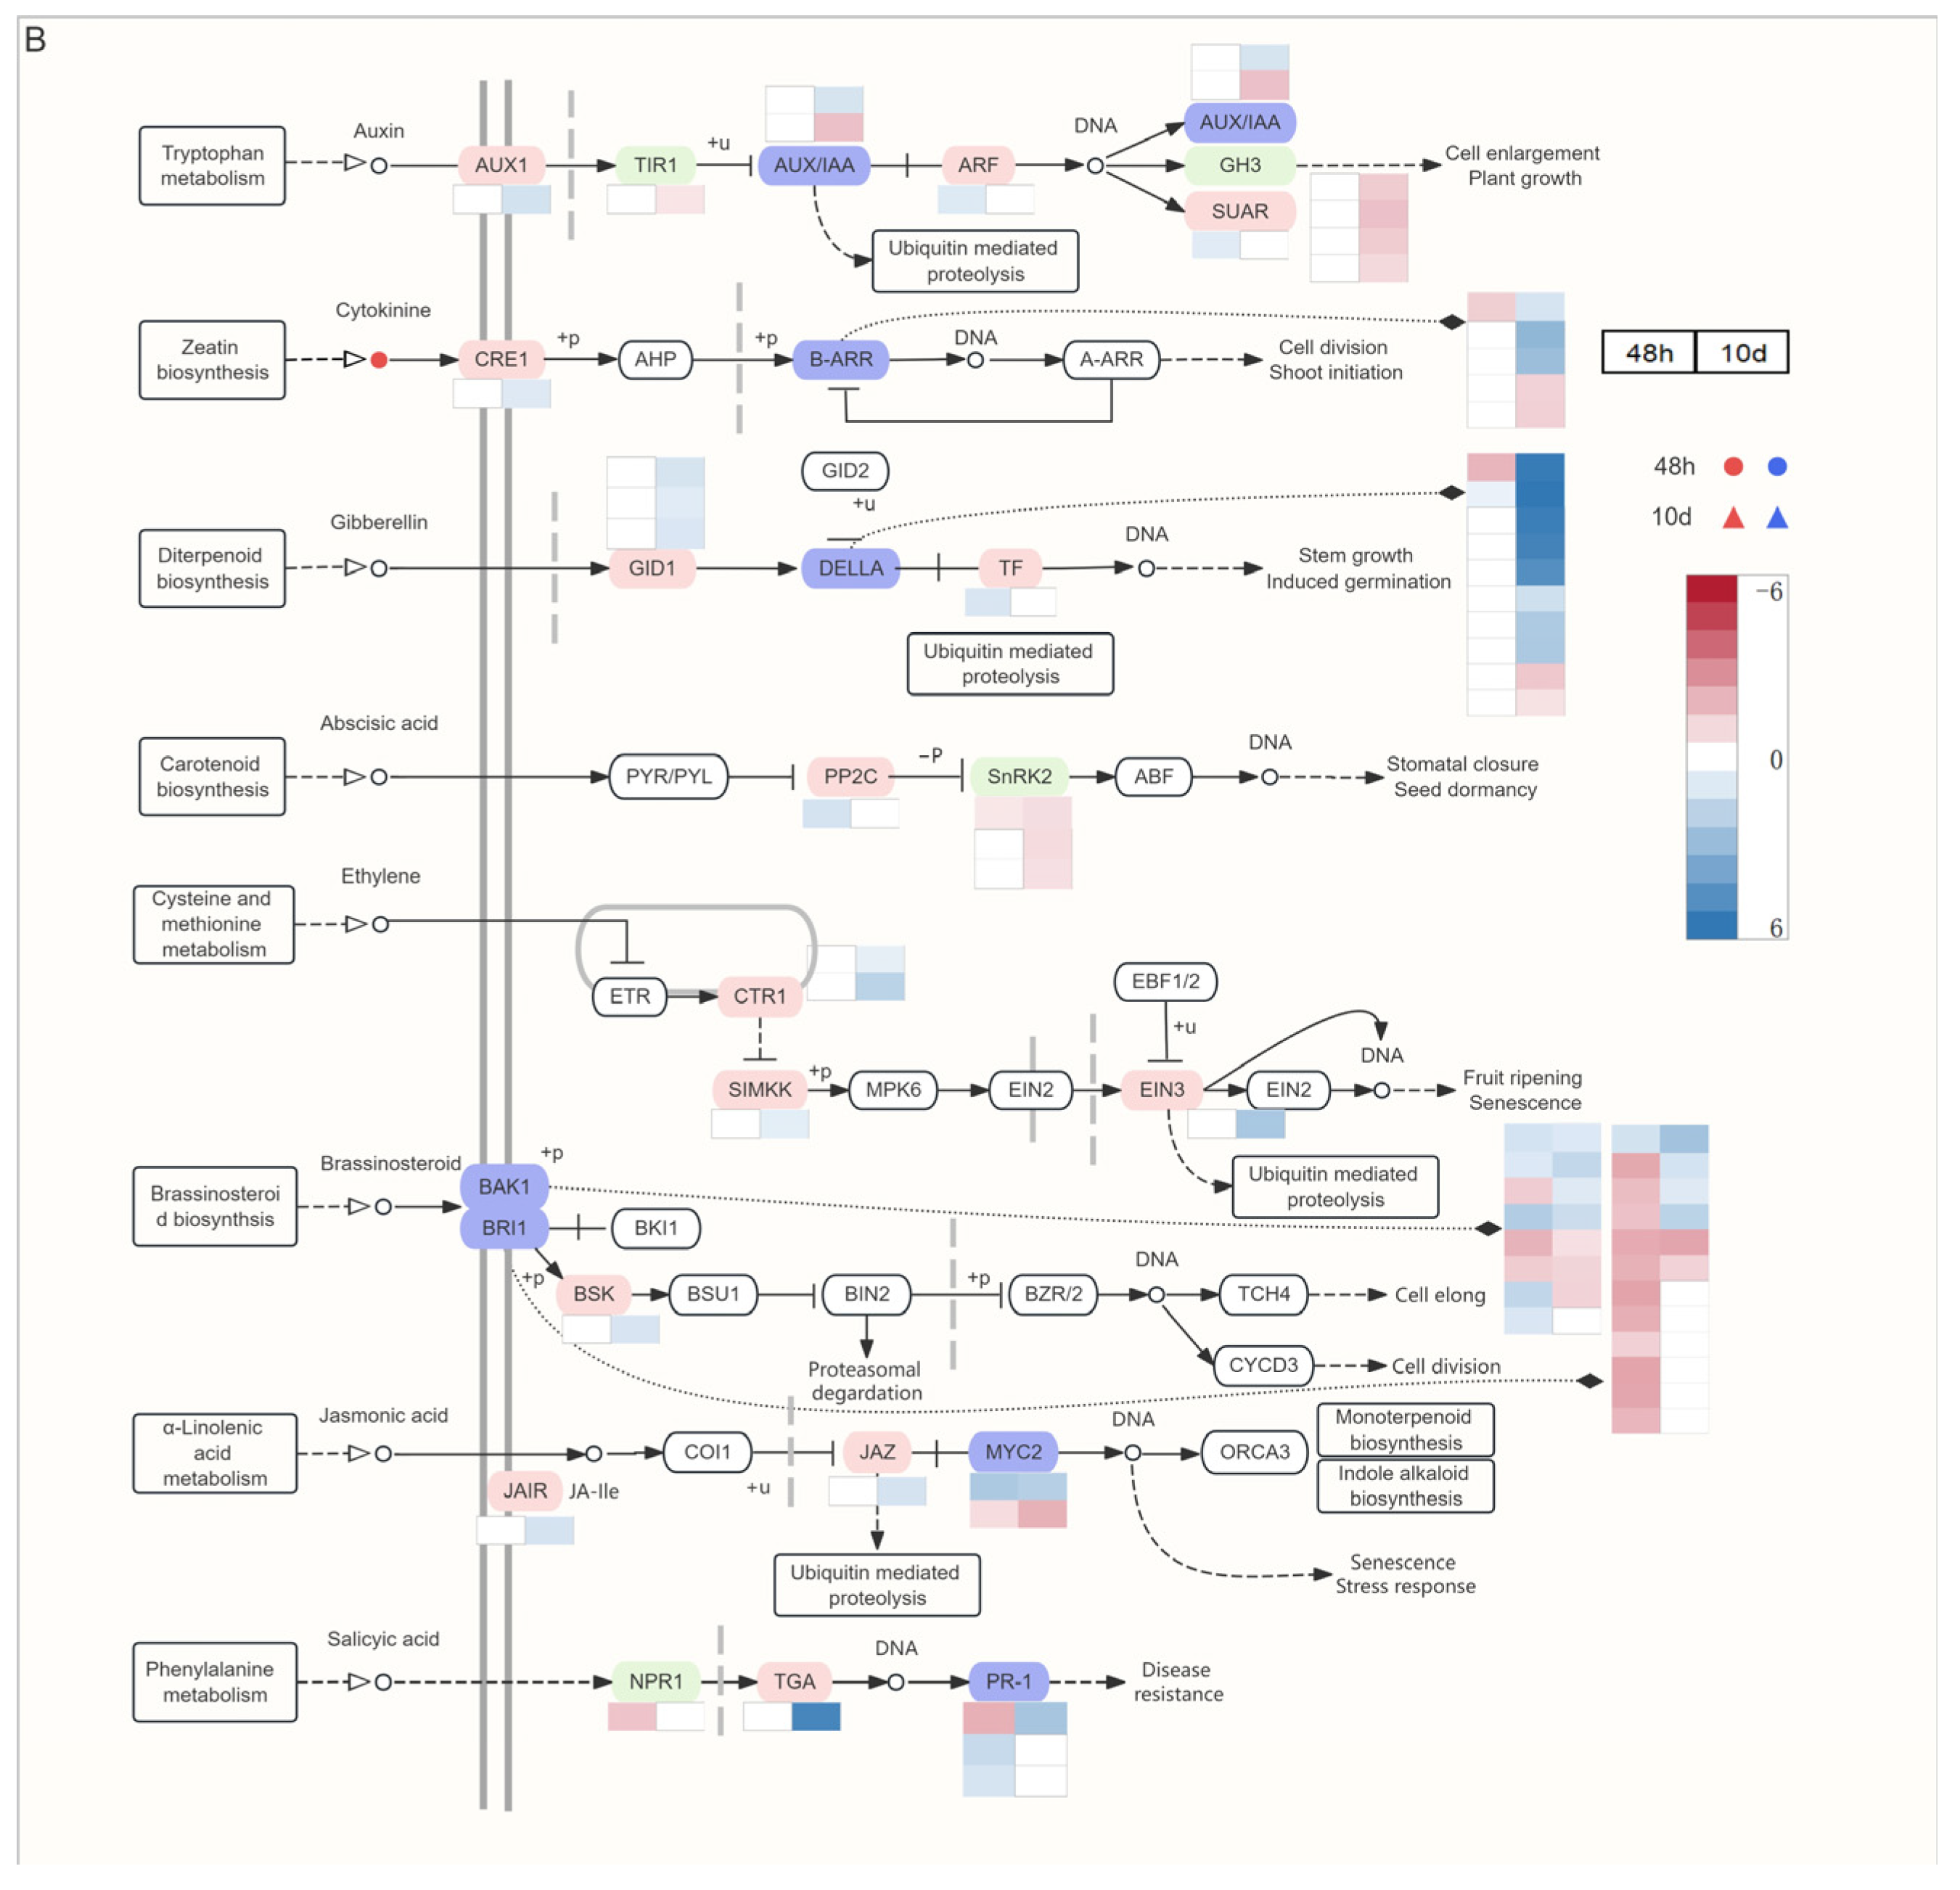
The differential gene expression of key pathways such as auxin, cytokinin, gibberellin, abscisic acid, ethylene, brassinolide, jasmonic acid, and salicylic acid was analyzed (Figure 10B). In the auxin signal transduction pathway, the auxin influx carrier AUX1 was suppressed, while the receptor gene TIR1 increased in expression. The AUX/IAA gene family exhibited both up- and down-regulated transcripts. The downstream transcription factor ARF was down-regulated, the responsive gene GH3 was strongly induced, and most SAUR genes showed reduced expression. In the cytokinin signaling pathway, the receptor gene CRE1 was down-regulated, whereas the response regulator B-ARR was up-regulated. The gibberellin receptor gene GID1 exhibited significant down-regulation, indicating weakened perception of gibberellin signals. Meanwhile, the key negative regulator DELLA was up-regulated and exhibited considerable expression variability. Together, these findings indicate that exogenous IAA coordinates multiple hormone signaling pathways to balance growth, nutrient acquisition, and stress adaptation during prolonged phosphorus limitation.

4. Discussion

P is a macronutrient sustaining plant growth and development [42]. Previous studies have shown that low-phosphorus stress significantly alters root architecture, usually by inhibiting primary root elongation while promoting lateral root and root hair development. These changes expand the absorptive surface area and enhance plant adaptation to phosphorus-limited environments [43]. Similar growth responses have been documented across many plant species. For example, phosphorus availability significantly affects both root and shoot growth in hydroponically grown Zizania latifolia [44]. Auxin is a key phytohormone regulating plant growth and root development through local changes in auxin distribution, transport, and signaling [45]. Under phosphorus-deficient conditions, changes in auxin signaling and transport are closely associated with root system remodeling, including changes in primary root growth, lateral root development, and root hair formation [46]. In the present study, plants in the IAA group showed more pronounced changes in root traits than in shoot traits. At 48 h, total root length and lateral root number increased compared with the NP group, whereas after 10 d, root fresh weight, total root length, lateral root number, root surface area, and root volume all showed clear increases. In contrast, plant height, stem diameter, and shoot fresh weight showed relatively smaller changes and remained close to those of the NP group after prolonged treatment. The stronger response of roots may be related to their direct role in sensing and acquiring inorganic phosphate (Pi). Roots are the primary interface through which plants respond to limited Pi availability, and changes in root system architecture can increase the absorptive surface area and facilitate Pi acquisition. In addition, auxin acts directly on root developmental processes, particularly lateral root initiation and elongation, which may make root traits more sensitive than shoot traits to the IAA treatment [47]. These findings are consistent with previous reports, showing that auxin facilitates adaptive root architectural remodeling under low-phosphorus conditions. The relatively stable shoot growth observed after prolonged treatment may therefore be associated with the greater adjustment of the root system, which increases the root absorptive interface under limited phosphorus availability.
Low phosphorus stress can disrupt the balance of phosphorus absorption, accumulation and distribution within plants, thereby restricting plant growth and basic metabolic processes. Previous studies have shown that under low phosphorus conditions, both phosphorus accumulation and phosphorus transport and distribution capabilities within crops will be affected to varying degrees. Plants can also adapt to low-phosphorus environments by inducing the activity of enzymes related to phosphorus metabolism, such as acid phosphatase and phytase, which can contribute to the mobilization of organic P and intracellular Pi recycling [48]. Our study showed that the chlorophyll content and total nitrogen content of leaves in the IAA group were higher than those in the NP group after prolonged treatment. This indicates that leaf nitrogen status and chlorophyll accumulation were maintained under the IAA treatment. At the early treatment stages, acid phosphatase and phytase activities in the leaves and roots were significantly higher in the IAA group, indicating an enhanced P-mobilization response. A previous study also showed that auxin can facilitate cell-wall P reutilization in P-deficient rice [49]. Therefore, the increased phosphatase activities observed here, together with previous evidence, suggest that P mobilization and reutilization-related processes may be enhanced under the IAA treatment. However, since the reutilization efficiency of phosphorus was not directly measured, it cannot be concluded that the use of IAA alone has improved the reutilization of phosphorus. However, the total phosphorus content in the roots and leaves of the IAA group was lower than that of the NP group, which is consistent with the much lower external P supply. Moreover, the total sulfur content in the roots and stems of the IAA group significantly increased. P and sulfur (S) metabolism may be linked through membrane lipid remodeling under P deficiency. Previous transcriptomic and metabolomic analyses in alfalfa showed that Pi limitation promoted phospholipid degradation and enhanced glycolipid and sulfolipid metabolism, accompanied by the induction of SQDG synthesis-related genes such as SQD1 and SQD2 [50]. Sulfur-containing SQDG can partially replace membrane phospholipids under P limitation, thereby reducing cellular P demand.
Low phosphorus stress usually induces the reorganization of lipid components in plant cell membranes. This helps to reduce the consumption of phospholipids in the cell membranes and promotes the reutilization of phosphorus. In this process, phospholipase D (PLD) and glycerophosphodiester phosphodiesterase (GDPD) are key enzymes involved in phospholipid degradation and phosphorus recycling. PLD initiates phospholipid hydrolysis. GDPD functions downstream to further process degradation products. Li et al. [51] discovered that PLDζ1 and PLDζ2 are mainly expressed in the roots of Arabidopsis thaliana and are induced under phosphorus limitation conditions. Cheng et al. [52] systematically characterized the GDPD gene family in Arabidopsis. They found that typical GDPD subfamily members AtGDPD1–6 were up-regulated under inorganic phosphate (Pi) starvation. The GDPD-like subfamily members AtGDPDL1–7 showed no obvious response to Pi starvation. Our study showed that PLDZETA1 and GDPD were significantly up-regulated after prolonged IAA treatment, consistent with previous reports. These changes suggest that membrane lipid remodeling and P-recycling-related processes were activated under the IAA treatment.
In addition to phospholipid degradation-related genes, aminophospholipid transporters may also contribute to the regulation of membrane lipid homeostasis under low phosphorus stress. It has been found that ALA10 is positively regulated by phosphorus deficiency signals in Arabidopsis [53]. ALA9 was up-regulated under short-term IAA treatment, and ALA9 and ALA10 belong to the same gene family, suggesting that ALA9 may be involved in membrane lipid transport and membrane structure regulation in the early response of alfalfa to low phosphorus. Our study found that PEAMT was down-regulated in short-term treatment. It was not completely consistent with the results of Ngo et al. [54]. They reported that Pi starvation induced the expression of PMT1 and PMT2 in Arabidopsis. This difference may be related to species differences, treatment time, tissue location, and the involvement of exogenous IAA in regulation. The difference from previous studies may be related to species, treatment duration, tissue type, and differences in experimental conditions. These results suggest that phospholipid precursor synthesis and membrane lipid-related processes were adjusted during the early IAA treatment.
Low-phosphorus stress also triggers extensive transcriptional reprogramming in plants. Previous studies have shown that transcription factors including members of the WRKY, bHLH, and MYB families, together with phosphate transporter genes such as members of the PHT1 family, coordinately regulate phosphorus uptake, transport, and reutilization [55,56]. Our study showed that multiple transcription factor families, including AP2/ERF-ERF, MYB-related, MYB, bHLH, NAC, WRKY, bZIP, and GRAS, exhibited pronounced transcriptional responses to IAA treatment. These findings suggest that exogenous IAA may induce diverse transcription factors to participate in root transcriptional regulation under low-phosphorus stress in alfalfa. AP2/ERF and bZIP family members may integrate phosphorus-deficiency signaling with other abiotic stress pathways, whereas MYB, WRKY, and bHLH family members may be closely related to phosphorus uptake, root development, and metabolic regulation.
The auxin signal is an important regulatory module of root architecture remodeling induced by low phosphorus. Previous studies have shown that the TIR1/AFB–AUX/IAA–ARF signaling module is a core pathway mediating auxin responses [57]. Under low phosphorus conditions, auxin signaling contributes to root architectural remodeling. Increased TIR1 expression promotes AUX/IAA degradation and releases ARF transcription factors, thereby activating downstream genes involved in lateral root formation and root hair development [47]. Loss of function in either TIR1 or ARF7/ARF19 would impair the adaptive development of the root system under low phosphorus conditions. This highlights the crucial role of this signaling module in the plasticity of root system development. Our research showed that the short-term auxin signaling pathway did not show significant changes. After long-term treatment, the response of this pathway significantly increased. AUX1 was down-regulated, TIR1 was up-regulated, members of the AUX/IAA family showed differential expression, and GH3 was significantly up-regulated. These results suggest that alfalfa may maintain the balance between root growth and phosphorus deficiency adaptation by regulating the transport, perception, and response processes of auxin under exogenous IAA treatment.
Auxin biosynthesis may also contribute to the adaptive response of alfalfa to phosphorus deficiency. Kang et al. [58] pointed out that OsTAR2 and OsYUC8 are key regulators of low-phosphorus-induced root architectural remodeling in rice through the modulation of auxin biosynthesis. Their up-regulation promotes IAA accumulation and contributes to adaptive changes such as lateral root and root hair development. Similarly, in the present study, YUC genes and TAA1/TAR in the tryptophan metabolism pathway were significantly up-regulated after exogenous IAA treatment under phosphorus-deficient conditions, consistent with findings in rice. Previous transcriptomic analyses in tall fescue also revealed significant enrichment of differentially expressed genes in the glycerophospholipid metabolism and glycerophospholipid metabolism pathways under phosphorus deficiency [59]. We also showed that the glycerophospholipid metabolism pathway was significantly enriched.

5. Conclusions

Compared with the NP group, plants in the IAA group showed pronounced changes in root architecture, including increases in total root length, lateral root number, root surface area, and root volume, whereas shoot growth remained relatively stable after prolonged treatment. Acid phosphatase and phytase activities were also increased during the early treatment stage, indicating enhanced P-mobilization-related responses. Transcriptomic and metabolomic analyses revealed time-dependent changes in gene expression and metabolite accumulation, including changes in PHT1, PAP12, GH3.1, PLDZETA1, GDPD, and PLA1. Tryptophan metabolism, cysteine and methionine metabolism, glycerophospholipid metabolism, and plant hormone signal transduction were identified as major responsive pathways. Overall, these findings indicate that root development, P-mobilization-related processes, membrane lipid metabolism, sulfur metabolism, and hormone-related signaling are associated with the response of alfalfa to low phosphorus in the presence of exogenous IAA.

Supplementary Materials

The following supporting information can be downloaded at: https://www.mdpi.com/article/10.3390/agronomy16171745/s1, Figure S1: Relative expression of three genes showing mismatched trends in qRT-PCR and RNA-seq data; Figure S2: Tryptophan Metabolism Pathway; Figure S3: Cysteine and methionine metabolism pathway; Table S1: Primers used for qPCR analysis of alfalfa root; Table S2: Overview of RNA sequencing data; Table S3: Differential gene set; Table S4: Differential metabolite set.

Author Contributions

Conceptualization, Y.Z. and Z.L.; methodology, Y.Z. and J.L.; investigation, J.L., N.G. and X.D.; data curation, J.L., D.A., H.Y., Y.L. and Q.W.; writing—original draft preparation, J.L.; writing—review and editing, Y.Z. and Z.L.; visualization, J.L.; supervision, Y.Z. and Z.L.; project administration, Y.Z., Z.L. and C.G.; funding acquisition, Z.L. and Y.Z. All authors have read and agreed to the published version of the manuscript.

Funding

This work was supported by the Inner Mongolia Autonomous Region Natural Science Foundation General Program (2025MS03136); the National Natural Science Foundation of China (32301484); the Hohhot Key Research and Development Project (2023-JBGS-S-1); the Scientific Research Foundation for Advanced Talents by Inner Mongolia Agricultural University (NDYB2022-51); the First-Class Discipline Scientific Research Program of Inner Mongolia (IMAUCXQJ2023015); the Scientific Re-search Funding for Universities Directly under the Inner Mongolia Autonomous Region (BR22-12-07); and the 2025 Key Laboratory of Grass Seed Innovation and Sustainable Grassland Resource Utilization, Inner Mongolia Autonomous Region (2025KYPTO033).

Data Availability Statement

The data presented in this study are openly available in [NCBI Sequence Read Archive (SRA)] at [https://www.ncbi.nlm.nih.gov/sra (accessed on 25 December 2025)], reference number [PRJNA1449760].

Acknowledgments

We express our deep gratitude for the support of the research platform of Inner Mongolia Agricultural University.

Conflicts of Interest

The authors declare no conflicts of interest.

References

  1. Ma, J.; Huangfu, W.; Yang, X.; Xu, J.; Zhang, Y.; Wang, Z.; Zhu, X.; Wang, C.; Shi, Y.; Cui, Y. “King of the forage”—Alfalfa supplementation improves growth, reproductive performance, health condition and meat quality of pigs. Front. Vet. Sci. 2022, 9, 1025942. [Google Scholar] [CrossRef] [Scilit] [PubMed]
  2. Desta, A.G. Medicago sativa for climate-smart agriculture and soil sustainability: A review. Discov. Environ. 2026, 4, 179. [Google Scholar] [CrossRef] [Scilit]
  3. Santoro, V.; Schiavon, M.; Celi, L. Role of soil abiotic processes on phosphorus availability and plant responses with a focus on strigolactones in tomato plants. Plant Soil. 2024, 494, 1–49. [Google Scholar] [CrossRef] [Scilit]
  4. Zhao, B.; Jia, X.; Yu, N.; Murray, J.D.; Yi, K.; Wang, E. Microbe-dependent and independent nitrogen and phosphate acquisition and regulation in plants. New Phytol. 2024, 242, 1507–1522. [Google Scholar] [CrossRef] [Scilit] [PubMed]
  5. Plaxton, W.C.; Tran, H.T. Metabolic adaptations of phosphate-starved plants. Plant Physiol. 2011, 156, 1006–1015. [Google Scholar] [CrossRef] [Scilit] [PubMed]
  6. He, R.; Nan, L.L.; Ren, M.Y.; Guo, J.Y.; Wang, L.Q.; Ma, X.X. Evaluation of low phosphorus tolerance in the seedling stage of 25 alfalfa germplasms. Grassl. Turf 2025, 45, 1–13. [Google Scholar]
  7. Islam, M.; Siddique, K.H.M.; Padhye, L.P.; Pang, J.; Solaiman, Z.M.; Hou, D.; Srinivasarao, C.; Zhang, T.; Chandana, P.; Venu, N.; et al. A critical review of soil phosphorus dynamics and biogeochemical processes for unlocking soil phosphorus reserves. Adv. Agron. 2024, 185, 153–249. [Google Scholar] [CrossRef] [Scilit]
  8. Zhou, L.H.; Zeng, Q.C.; Mei, T.Y.Z.; Wang, M.X.; Tan, W.F. Intensive citrus cultivation suppresses soil phosphorus cycling microbial activity. Huan Jing KE Xue 2024, 45, 2881–2890. [Google Scholar] [CrossRef] [Scilit] [PubMed]
  9. Ros, M.B.H.; Koopmans, G.F.; van Groenigen, K.J.; Abalos, D.; Oenema, O.; Vos, H.M.J.; van Groenigen, J.W. Towards optimal use of phosphorus fertiliser. Sci. Rep. 2020, 10, 17804. [Google Scholar] [CrossRef] [Scilit] [PubMed]
  10. Liu, L.; Zheng, X.; Wei, X.; Kai, Z.; Xu, Y. Excessive application of chemical fertilizer and organophosphorus pesticides induced total phosphorus loss from planting causing surface water eutrophication. Sci. Rep. 2021, 11, 23015. [Google Scholar] [CrossRef] [Scilit] [PubMed]
  11. McDowell, R.W.; Haygarth, P.M. Reducing phosphorus losses from agricultural land to surface water. Curr. Opin. Biotechnol. 2024, 89, 103181. [Google Scholar] [CrossRef] [Scilit] [PubMed]
  12. Yang, S.Y.; Lin, W.Y.; Hsiao, Y.M.; Chiou, T.J. Milestones in understanding transport, sensing, and signaling of the plant nutrient phosphorus. Plant Cell 2024, 36, 1504–1523. [Google Scholar] [CrossRef] [Scilit] [PubMed]
  13. Zheng, D.; Yuan, H.; Yang, G.; Feng, G.; Rengel, Z.; Shen, J. Quantifying phosphorus fertilizer distribution and the contribution of fertilizer and soil legacy phosphorus to phosphorus uptake by maize—A 32P-labelling study. Food Energy Secur. 2023, 12, e476. [Google Scholar] [CrossRef] [Scilit]
  14. Zhao, Q.S.; Li, F.M.; Yang, F.Q.; Xu, X.P.; Ding, W.C.; Qiu, S.J.; Zhao, S.C.; Hou, Y.P.; He, P.; Zhou, W. Effects of phosphorus fertilization frequency on maize yield and phosphorus fertilizer efficiency in Northeast China. J. Plant Nutr. Fertil. 2025, 31, 1777–1787. [Google Scholar] [CrossRef]
  15. Argus Media; International Fertilizer Association. Phosphate Rock Resources & Reserves Assessment 2023; Argus Media: London, UK, 2023. [Google Scholar]
  16. Li, B.; Bicknell, K.B.; Renwick, A. Peak phosphorus, demand trends and implications for the sustainable management of phosphorus in China. Resour. Conserv. Recycl. 2019, 146, 316–328. [Google Scholar] [CrossRef] [Scilit]
  17. El Moukhtari, A.; Lamsaadi, N.; Farssi, O.; Oubenali, A.; El Bzar, I.; Lahlimi Alami, Q.; Triqui, Z.E.A.; Lazali, M.; Farissi, M. Silicon- and phosphate-solubilizing Pseudomonas alkylphenolica PF9 alleviate low phosphorus availability stress in alfalfa (Medicago sativa L.). Front. Agron. 2022, 4, 823396. [Google Scholar] [CrossRef] [Scilit]
  18. Xia, J.; Nan, L.L.; Wang, K.; Yao, Y.H. Comprehensive dissection of metabolites in response to low phosphorus stress in different root-type alfalfa at seedling stage. Agronomy 2024, 14, 1697. [Google Scholar] [CrossRef] [Scilit]
  19. Yu, Q.S.; Ni, X.F.; Cheng, X.L.; Ma, S.; Tian, D.; Zhu, B.; Zhu, J.; Ji, C.; Tang, Z.; Fang, J. Foliar phosphorus allocation and photosynthesis reveal plants’ adaptative strategies to phosphorus limitation in tropical forests at different successional stages. Sci. Total Environ. 2022, 846, 157456. [Google Scholar] [CrossRef] [Scilit] [PubMed]
  20. Zhang, T.; Wan, W.; Sun, Z.; Li, H. Phosphorus uptake and rhizosphere properties of alfalfa in response to phosphorus fertilizer types in sandy soil and saline-alkali soil. Front. Plant Sci. 2024, 15, 1377626. [Google Scholar] [CrossRef] [Scilit] [PubMed]
  21. Richardson, A.E.; Simpson, R.J. Soil microorganisms mediating phosphorus availability: Update on microbial phosphorus. Plant Physiol. 2011, 156, 989–996. [Google Scholar] [CrossRef] [Scilit] [PubMed]
  22. Madison, I.; Gillan, L.; Peace, J.; Gabrieli, F.; Van den Broeck, L.; Jones, J.L.; Sozzani, R. Phosphate starvation: Response mechanisms and solutions. J. Exp. Bot. 2023, 74, 6417–6430. [Google Scholar] [CrossRef] [Scilit] [PubMed]
  23. Puga, M.I.; Poza-Carrión, C.; Martinez-Hevia, I.; Perez-Liens, L.; Paz-Ares, J. Recent advances in research on phosphate starvation signaling in plants. J. Plant Res. 2024, 137, 315–330. [Google Scholar] [CrossRef] [Scilit] [PubMed]
  24. Roychoudhry, S.; Kepinski, S. Auxin in root development. Cold Spring Harb. Perspect. Biol. 2022, 14, a039933. [Google Scholar] [CrossRef] [Scilit] [PubMed]
  25. Hammes, U.Z.; Pedersen, B.P. Structure and function of auxin transporters. Annu. Rev. Plant Biol. 2024, 75, 185–209. [Google Scholar] [CrossRef] [PubMed]
  26. Nacry, P.; Canivenc, G.; Muller, B.; Azmi, A.; Van Onckelen, H.; Rossignol, M.; Doumas, P. A role for auxin redistribution in the responses of the root system architecture to phosphate starvation in Arabidopsis. Plant Physiol. 2005, 138, 2061–2074. [Google Scholar] [CrossRef] [Scilit] [PubMed]
  27. Jan, M.; Muhammad, S.; Jin, W.; Zhong, W.; Zhang, S.; Lin, Y.; Zhou, Y.; Liu, J.; Liu, H.; Munir, R.; et al. Modulating root system architecture: Cross-talk between auxin and phytohormones. Front. Plant Sci. 2024, 15, 1343928. [Google Scholar] [CrossRef] [Scilit] [PubMed]
  28. Yang, J.; Li, S.; Zhou, X.; Du, C.; Fang, J.; Li, X.; Zhao, J.; Ding, F.; Wang, Y.; Zhang, Q.; et al. Bacillus amyloliquefaciens promotes cluster root formation of white lupin under low phosphorus by mediating auxin levels. Plant Physiol. 2025, 197, kiae676. [Google Scholar] [CrossRef] [Scilit] [PubMed]
  29. Chen, F.; Zhang, J.; Ha, X.; Ma, H. Genome-wide identification and expression analysis of the Auxin-Response factor (ARF) gene family in Medicago sativa under abiotic stress. BMC Genom. 2023, 24, 498. [Google Scholar] [CrossRef] [Scilit] [PubMed]
  30. Guo, N.; Li, J.; Wang, M.; Huo, X.; Bian, L.; Li, Z.; Zhang, Z. Effect of exogenous hormones on the growth of alfalfa seedlings under phosphate starvation stress. Legume Res. 2026, 49, 50–59. [Google Scholar] [CrossRef] [Scilit]
  31. M’Sehli, W.; Houmani, H.; Kallala, N.; Abid, G.; Hammami, I.; Mhadhbi, H. Insights into some key parameters involved in the variability of tolerance to phosphorus deficiency in the legume model Medicago truncatula. Biol. Plant. 2024, 68, 128–137. [Google Scholar] [CrossRef] [Scilit]
  32. Wang, T.; Zhao, M.; Zhang, X.; Liu, M.; Yang, C.; Chen, Y.; Chen, R.; Wen, J.; Mysore, K.S.; Zhang, W.H. Novel phosphate deficiency-responsive long non-coding RNAs in the legume model plant Medicago truncatula. J. Exp. Bot. 2017, 68, 5937–5948. [Google Scholar] [CrossRef] [Scilit] [PubMed]
  33. Prodhan, M.A.; Pariasca-Tanaka, J.; Ueda, Y.; Hayes, P.E.; Wissuwa, M. Comparative transcriptome analysis reveals a rapid response to phosphorus deficiency in a phosphorus-efficient rice genotype. Sci. Rep. 2022, 12, 9460. [Google Scholar] [CrossRef] [Scilit] [PubMed]
  34. BMKCloud. Transcriptome Analysis Was Performed with Analytical Tools Integrated in the BMKCloud Bioinformatics Platform. Available online: https://www.biocloud.net/ (accessed on 7 July 2026).
  35. Benjamini, Y.; Hochberg, Y. Controlling the false discovery rate: A practical and powerful approach to multiple testing. J. R. Stat. Soc. Ser. B Stat. Methodol. 1995, 57, 289–300. [Google Scholar] [CrossRef] [Scilit]
  36. Young, M.D.; Wakefield, M.J.; Smyth, G.K.; Oshlack, A. Gene ontology analysis for RNA-seq: Accounting for selection bias. Genome Biol. 2010, 11, R14. [Google Scholar] [CrossRef] [Scilit] [PubMed]
  37. Bu, D.; Luo, H.; Huo, P.; Wang, Z.; Zhang, S.; He, Z.; Wu, Y.; Zhao, L.; Liu, J.; Guo, J.; et al. KOBAS-i: Intelligent prioritization and exploratory visualization of biological functions for gene enrichment analysis. Nucleic Acids Res. 2021, 49, W317–W325. [Google Scholar] [CrossRef] [Scilit] [PubMed]
  38. Wang, J.; Zhang, T.; Shen, X.; Liu, J.; Zhao, D.; Sun, Y.; Wang, L.; Liu, Y.; Gong, X.; Liu, Y.; et al. Serum metabolomics for early diagnosis of esophageal squamous cell carcinoma by UHPLC-QTOF/MS. Metabolomics 2016, 12, 116. [Google Scholar] [CrossRef] [Scilit]
  39. Dunn, W.B.; Broadhurst, D.; Begley, P.; Zelena, E.; Francis-McIntyre, S.; Anderson, N.; Brown, M.; Knowles, J.D.; Halsall, A.; Haselden, J.N.; et al. Procedures for large-scale metabolic profiling of serum and plasma using gas chromatography and liquid chromatography coupled to mass spectrometry. Nat. Protoc. 2011, 6, 1060–1083. [Google Scholar] [CrossRef] [Scilit] [PubMed]
  40. Want, E.J.; Wilson, I.D.; Gika, H.; Theodoridis, G.; Plumb, R.S.; Shockcor, J.; Holmes, E.; Nicholson, J.K. Global metabolic profiling procedures for urine using UPLC-MS. Nat. Protoc. 2010, 5, 1005–1018. [Google Scholar] [CrossRef] [Scilit] [PubMed]
  41. Livak, K.J.; Schmittgen, T.D. Analysis of relative gene expression data using real-time quantitative PCR and the 2−ΔΔCT method. Methods 2001, 25, 402–408. [Google Scholar] [CrossRef] [Scilit] [PubMed]
  42. Al Mamun, A.; Rahman, S.T.; Khan, S. Harnessing phytate for phosphorus security: Integrating microbial and genetic innovations. Preprints 2025, 2025041638. [Google Scholar] [CrossRef] [Scilit]
  43. Wang, J.; Qin, Q.; Pan, J.; Sun, L.; Sun, Y.; Xue, Y.; Song, K. Transcriptome analysis in roots and leaves of wheat seedlings in response to low-phosphorus stress. Sci. Rep. 2019, 9, 19802. [Google Scholar] [CrossRef] [Scilit] [PubMed]
  44. Yan, N.; Zhang, Y.L.; Xue, H.M.; Zhang, X.H.; Wang, Z.D.; Shi, L.Y.; Guo, D.P. Changes in plant growth and photosynthetic performance of Zizania latifolia exposed to different phosphorus concentrations under hydroponic condition. Photosynthetica 2015, 53, 630–635. [Google Scholar] [CrossRef] [Scilit]
  45. Vanneste, S.; Pei, Y.; Friml, J. Mechanisms of auxin action in plant growth and development. Nat. Rev. Mol. Cell Biol. 2025, 26, 648–666. [Google Scholar] [CrossRef] [Scilit] [PubMed]
  46. Ren, M.; Li, Y.; Zhu, J.; Zhao, K.; Wu, Z.; Mao, C. Phenotypes and molecular mechanisms underlying the root response to phosphate deprivation in plants. Int. J. Mol. Sci. 2023, 24, 5107. [Google Scholar] [CrossRef] [Scilit] [PubMed]
  47. Lu, H.; Ren, M.; Lin, R.; Jin, K.; Mao, C. Developmental responses of roots to limited phosphate availability: Research progress and application in cereals. Plant Physiol. 2024, 196, 2162–2174. [Google Scholar] [CrossRef] [Scilit] [PubMed]
  48. Yoshitake, Y.; Yoshimoto, K. Intracellular phosphate recycling systems for survival during phosphate starvation in plants. Front. Plant Sci. 2023, 13, 1088211. [Google Scholar] [CrossRef] [Scilit] [PubMed]
  49. Huang, J.; Wu, Q.; Jing, H.K.; Shen, R.F.; Zhu, X.F. Auxin facilitates cell wall phosphorus reutilization in a nitric oxide-ethylene dependent manner in phosphorus deficient rice (Oryza Sativa L.). Plant Sci. 2022, 322, 111371. [Google Scholar] [CrossRef] [Scilit] [PubMed]
  50. Li, Z.; Hu, J.; Wu, Y.; Wang, J.; Song, H.; Chai, M.; Cong, L.; Miao, F.; Ma, L.; Tang, W.; et al. Integrative analysis of the metabolome and transcriptome reveal the phosphate deficiency response pathways of alfalfa. Plant Physiol. Biochem. 2022, 170, 49–63. [Google Scholar] [CrossRef] [Scilit] [PubMed]
  51. Cheng, Y.; Zhou, W.; El Sheery, N.I.; Peters, C.; Li, M.; Wang, X.; Huang, J. Characterization of the Arabidopsis glycerophosphodiester phosphodiesterase (GDPD) family reveals a role of the plastid-localized AtGDPD1 in maintaining cellular phosphate homeostasis under phosphate starvation. Plant J. 2011, 66, 781–795. [Google Scholar] [CrossRef] [Scilit] [PubMed]
  52. Poulsen, L.; López-Marqués, R.; Pedas, P.; McDowell, S.C.; Brown, E.; Kunze, R.; Harper, J.F.; Pomorski, T.G.; Palmgren, M. A phospholipid uptake system in the model plant Arabidopsis thaliana. Nat. Commun. 2015, 6, 7649. [Google Scholar] [CrossRef] [Scilit] [PubMed]
  53. Ngo, A.H.; Angkawijaya, A.E.; Lin, Y.C.; Liu, Y.C.; Nakamura, Y. The phospho-base N-methyltransferases PMT1 and PMT2 produce phosphocholine for leaf growth in phosphorus-starved Arabidopsis. J. Exp. Bot. 2022, 73, 2985–2994. [Google Scholar] [CrossRef] [Scilit] [PubMed]
  54. Chiou, T.J.; Lin, S.I. Signaling network in sensing phosphate availability in plants. Annu. Rev. Plant Biol. 2011, 62, 185–206. [Google Scholar] [CrossRef] [Scilit] [PubMed]
  55. Chien, P.S.; Chiang, C.B.; Wang, Z.; Chiou, T.J. MicroRNA-mediated signaling and regulation of nutrient transport and utilization. Curr. Opin. Plant Biol. 2017, 39, 73–79. [Google Scholar] [CrossRef] [Scilit] [PubMed]
  56. Wang, R.; Estelle, M. Diversity and specificity: Auxin perception and signaling through the TIR1/AFB pathway. Curr. Opin. Plant Biol. 2014, 21, 51–58. [Google Scholar] [CrossRef] [Scilit] [PubMed]
  57. Yu, Z.; Zhang, F.; Friml, J.; Ding, Z. Auxin signaling: Research advances over the past 30 years. J. Integr. Plant Biol. 2022, 64, 371–392. [Google Scholar] [CrossRef] [Scilit] [PubMed]
  58. Kang, S.; Li, Z.; Zhang, G.; Zhang, Y.; Wang, Y.; Wang, Q.; Wang, S. Auxin biosynthesis is required for phosphorus deficiency-induced root architecture remodelling in rice. Physiol. Plant 2025, 177, e70307. [Google Scholar] [CrossRef] [Scilit] [PubMed]
  59. Ma, P.; Li, Y.; Shu, J.; Wang, Z.; Luo, W.; Long, Z.; Wang, X. Transcriptomic analysis of Festuca arundinacea under low phosphorus stress. Mol. Plant Breed. 2025, 23, 1968–1977. [Google Scholar] [CrossRef]
Figure 1. Effects of IAA application on plant growth traits under low phosphorus conditions. (A) Plant height; (B) stem diameter; (C) shoot fresh weight; (D) root fresh weight; (E) total root length; (F) lateral root number; (G) root surface area; (H) root volume. NP, normal-phosphorus treatment; IAA, low-phosphorus treatment supplemented with 1 μM IAA. n.s., no significant difference; * p < 0.05; ** p < 0.01; *** p < 0.001.
Agronomy 16 01745 g001
Figure 2. Physiological indices and nutrient contents of plants under different treatments. (A) Chlorophyll content; (B) leaf nitrogen content; (C) shoot acid phosphatase activity; (D) root acid phosphatase activity; (E) shoot phytase activity; (F) root phytase activity; (G) total phosphorus content; (H) total nitrogen content; (I) total sulfur content. NP, normal-phosphorus treatment; IAA, low-phosphorus treatment supplemented with 1 μM IAA. n.s., no significant difference; * p < 0.05; ** p < 0.01; *** p < 0.001.
Agronomy 16 01745 g002
Figure 3. Quality assessment of transcriptome sequencing and identification of differentially expressed genes (DEGs). (A) Heatmap of sample-to-sample Pearson correlation coefficients; (B) principal component analysis (PCA) plot; (C) summary of the identified DEGs. TNP, normal-phosphorus control; TIAA, low-phosphorus treatment supplemented with 1 μM IAA. DEGs total, DEGs up, and DEGs down represent the total number of DEGs, up-regulated DEGs, and down-regulated DEGs, respectively.
Agronomy 16 01745 g003
Figure 4. GO and KEGG enrichment analyses of DEGs at 48 h and 10 d. (A,B) GO enrichment; (C,D) KEGG enrichment. Dark/light bars in GO analysis denote up/down-regulation.
Agronomy 16 01745 g004
Figure 5. Classification of transcription factor families among differentially expressed genes.
Agronomy 16 01745 g005
Figure 6. qRT-PCR validation of 13 differentially expressed genes (DEGs) identified by RNA-seq. Expression values are presented as fold changes in the IAA group relative to the corresponding normal-phosphorus group at the same sampling time, with the NP group set to 1. qRT-PCR fold changes were calculated using the 2−ΔΔCt method, and RNA-seq expression changes were expressed as fold changes for comparison. The horizontal dashed line at fold change = 1 represents the NP reference level. (A,B) Genes analyzed at 48 h: (A) SURF6 (Surfeit locus protein 6) and (B) DMR6 (Dioxygenase for auxin oxidation 6). (CK) Genes analyzed at 10 d: (C) SPS (Sucrose-phosphate synthase), (D) SPX1 (SPX domain-containing protein 1), (E) PHT1-4 (Phosphate transporter 1;4), (F) PHO1 (Phosphate transporter PHO1), (G) IAA26 (Indole-3-acetic acid 26), (H) NRG2 (N requirement gene 2), (I) FRO4 (Ferric reduction oxidase 4), (J) GDPD1 (Glycerophosphodiester phosphodiesterase 1), and (K) SQD2 (Sulfoquinovosyltransferase 2). (L,M) Genes analyzed at both 48 h and 10 d: (L) PT1 (Phosphate transporter 1) and (M) At1g48100 (homolog of Arabidopsis locus At1g48100). Orange bars represent RNA-seq data, and blue bars represent qRT-PCR data. Error bars indicate the standard deviation of qRT-PCR measurements.
Agronomy 16 01745 g006
Figure 7. Number, Venn analysis, and KEGG enrichment analysis of differentially accumulated metabolites (DAMs) under IAA treatment at different time points. (A) Number of DAMs; (B) Venn diagram of DAMs; (C) KEGG enrichment analysis at 48 h; (D) KEGG enrichment analysis at 10 d. Bubble plots depict the enriched KEGG pathways associated with DAMs.
Agronomy 16 01745 g007
Figure 8. Correlation network analysis between differentially expressed genes (DEGs) and differentially accumulated metabolites (DAMs) under IAA treatment at different time points during low-phosphorus stress. (A,B) Correlation networks for pathway ko00260 at 48 h and 10 d after treatment, respectively; (C,D) correlation networks for pathway ko00230 at 48 h and 10 d after treatment, respectively.
Agronomy 16 01745 g008
Figure 9. Integrated KEGG pathway enrichment analysis of transcriptomic and metabolomic datasets at different time points. (A) IAA treatment for 48 h; (B) IAA treatment for 10 d.
Agronomy 16 01745 g009
Figure 10. Integrated pathway maps illustrating coordinated changes in differentially expressed genes and differentially accumulated metabolites. (A) Glycerophospholipid metabolism pathway; (B) plant hormone signal transduction pathway. The triangular arrows and their associated solid and dashed lines, as well as the vertical light-gray dashed lines, are retained from the original pathway diagram. The dashed lines ending with diamond-shaped arrows indicate the correspondence between pathway genes and their expression heatmaps.
Agronomy 16 01745 g010aAgronomy 16 01745 g010b
Table 1. Composition of nutrient solutions (per 1 L).
ComponentNormal-Phosphorus (NP)Low-Phosphorus + 1 μM IAA (IAA)
Hoagland Modified nutrient salts (−P)0.958 g0.958 g
500× Calcium Salt Solution2 mL2 mL
1 mol·L−1 KH2PO41 mL10 μL
1 mol·L−1 K2SO40 μL495 μL
10 mmol·L−1 IAA0 μL100 μL
Disclaimer/Publisher’s Note: The statements, opinions and data contained in all publications are solely those of the individual author(s) and contributor(s) and not of MDPI and/or the editor(s). MDPI and/or the editor(s) disclaim responsibility for any injury to people or property resulting from any ideas, methods, instructions or products referred to in the content.