1. Introduction
Roses cultivated in Hotan, Xinjiang, grow on the margins of deserts, exhibit tolerance to drought and saline-alkali conditions, and are commonly referred to as desert roses. They not only function as windbreaks and sand-fixation agents, but also possess high economic value. Among them, rose flowers are mainly used for essential oil extraction, while flower buds are used for herbal tea [
1]. Because rose flowers and buds require selective harvesting, mechanized and undifferentiated blind harvesting is unsuitable for rose picking [
2]. With the development of artificial intelligence and robotics technologies, robotic selective harvesting of rose flowers and buds has become possible [
3], among which the localization of picking points and subsequent path planning are critical steps.
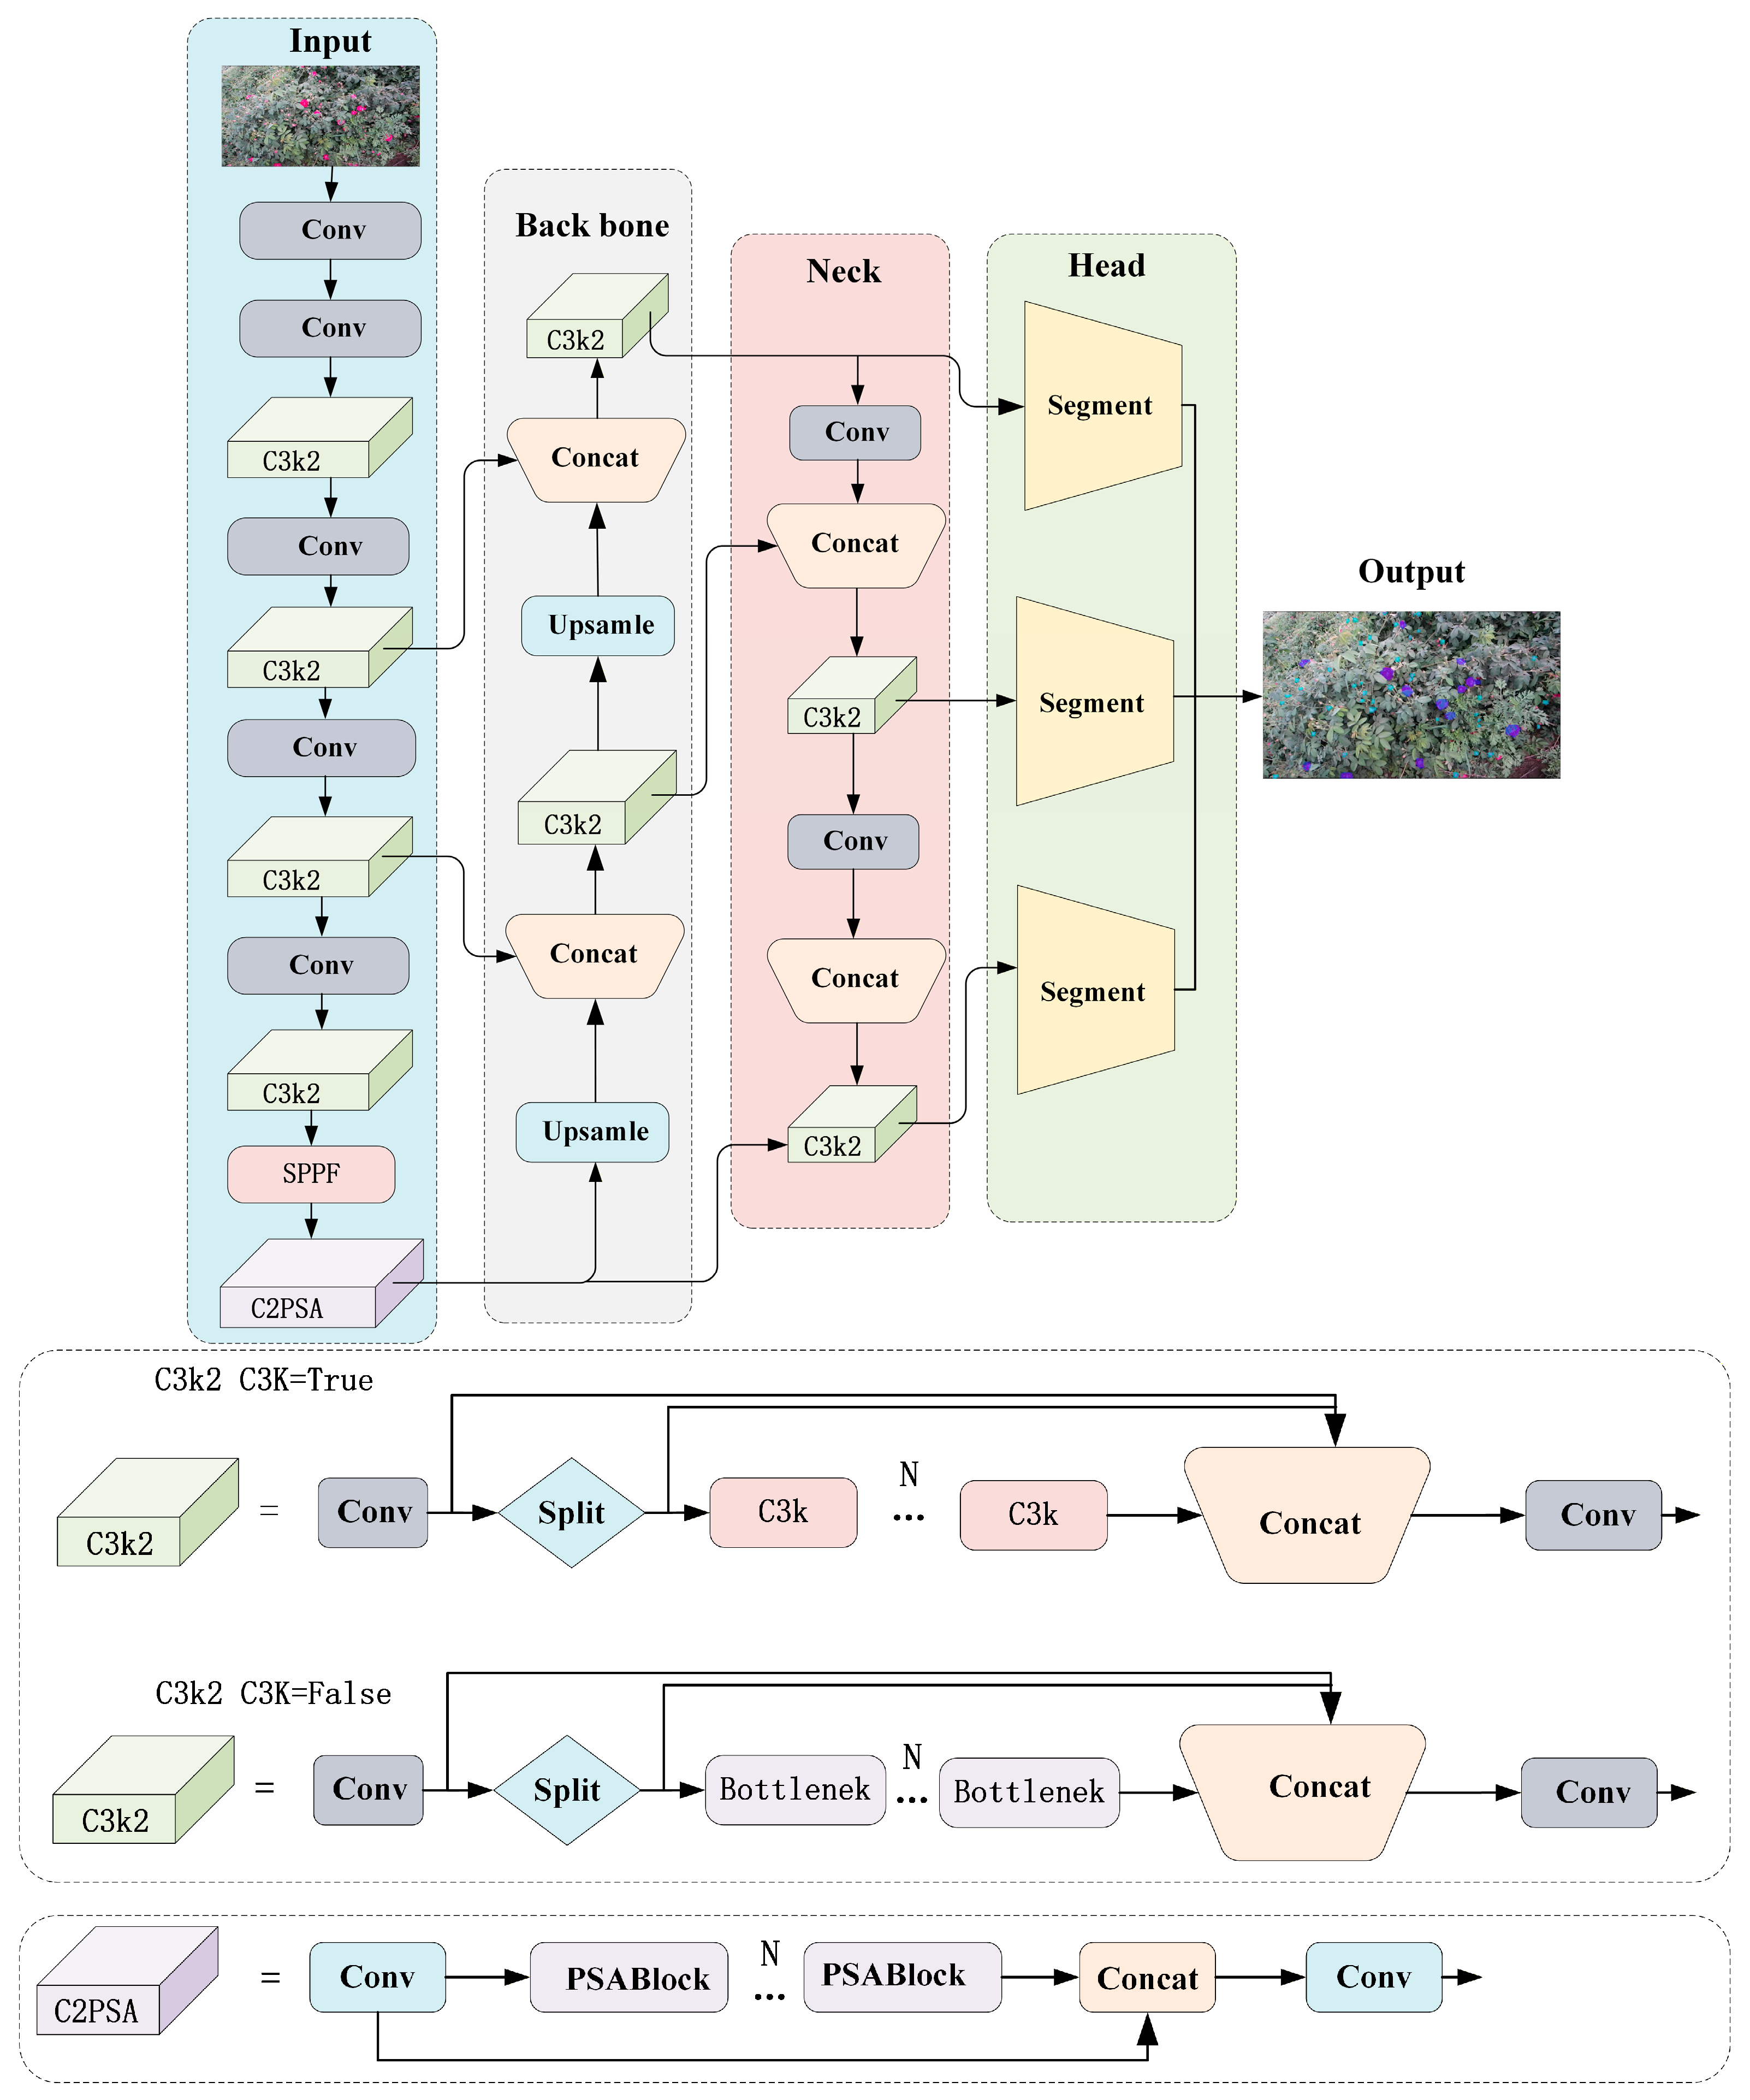
Recent advances in deep learning–based instance segmentation have provided robust technical foundations for agricultural vision applications, particularly those involving the detection and localization of fruits, flowers, and other harvestable organs. Among existing approaches, one-stage instance segmentation frameworks, especially the YOLO family, have been widely adopted in harvesting robotics because they offer an advantageous balance between inference efficiency and segmentation accuracy. From YOLOv5 to YOLOv11, architectural developments have progressively improved backbone feature extraction, multi-scale feature aggregation, and decoupled prediction heads, thereby strengthening the detection of targets with substantial variations in size and appearance. These advances, including CSPDarknet-based backbones and C2f-inspired feature-fusion modules, have enhanced the ability of YOLO-based models to cope with cluttered backgrounds, illumination changes, occlusion, and other complex field conditions. Lightweight segmentation networks are particularly important in agricultural robotics, as harvesting robots are commonly deployed on resource-constrained edge devices that impose stringent limitations on computational complexity, memory consumption, and power usage. Recent studies have investigated model pruning and knowledge distillation to compress segmentation networks while preserving their predictive performance, enabling real-time inference on embedded platforms [
4].
However, most existing lightweight models are designed for single-crop scenarios and lack integration with downstream tasks, such as picking-point localization and path planning. These observations motivated us to select YOLOv11n-seg as the baseline, which we then compressed through pruning and distillation to achieve both high accuracy and edge-deployable efficiency for rose flower and bud segmentation. The recognition of flower picking points has gradually attracted increasing attention from researchers. Methods for flower picking point recognition can be broadly divided into two categories. One category identifies the picking point from a lateral view and primarily focuses on safflower picking point recognition. Since the lateral view allows direct observation of the neck region connecting the filament and the flower ball, it facilitates accurate localization of the picking point. Currently, researchers have developed two main technical routes. The first is based on traditional image segmentation and geometric modeling. For instance, Xing et al. [
5] utilized an improved particle swarm optimization algorithm to extract the filament region, determined the neck region of interest via a rotated rectangle, and then localized the picking point by combining Zhang–Suen skeleton refinement. The second route introduces a strategy that combines semantic or instance segmentation networks with morphological analysis. For example, Xing et al. [
6] employed an improved DeepLabv3+ to segment the filament, flower ball, and stem, and then calculated the picking point based on Hough line detection of the stem and centroid projection. Zhang et al. [
7] constructed the SBP-YOLOv8s-seg network to simultaneously segment the filament and flower ball on a laterally collected dataset, and proposed different localization strategies targeting the characteristics of filaments at full bloom and decay stages. Meanwhile, Chen et al. [
8] used YOLO-SaFi-LSDH to segment the filament and flower ball, determined the two-dimensional picking point in the lateral image through the intersection of the centroid connecting line and the filament contour, and then mapped it to three-dimensional space using a depth camera. However, this approach still faces challenges, including mutual occlusion, small neck targets, cluttered leaf and branch backgrounds, and variations in illumination angle.
Although the aforementioned lateral-view methods have achieved certain effectiveness, when multiple targets are severely adhered or the pedicel is largely occluded by the corolla, branches, and leaves, the neck region is often invisible, leading to localization failure. To overcome the problems of flower morphological variation and neck invisibility in lateral views, recent studies have further integrated deep learning-based detection, segmentation, and adaptive geometric reasoning. For instance, Zhang et al. [
4] adopted channel pruning and knowledge distillation techniques to compress the model to 1.6 MB, and achieved real-time lateral-view detection on a Jetson embedded platform, with a picking point recognition accuracy of 96.7%. Aiming at the problem of dynamic neck occlusion across the full growth cycle, Chen et al. [
9] proposed SSO-YOLO with a rotated detection head, which uses rotated bounding boxes from lateral-view images to determine the connection relationship between the filament and the flower ball, and adaptively computes the picking point via the intersection of the line connecting the two centers and the flower ball box. However, existing methods still suffer from missed and false detections under challenging conditions, particularly when multiple targets overlap severely or when the pedicel is heavily occluded by the corolla, branches, or leaves.
Given the inherent limitations of lateral views in complex occlusion scenarios, researchers have increasingly adopted top-down perspectives. In recent years, research on identifying the picking point positions of terminal-flower crops from a top-down perspective has gradually become a focus. Compared with lateral-view acquisition, which is susceptible to complex environmental interference such as branch and leaf occlusion and plant interleaving, the top-down view can more clearly present the spatial structural relationships between flowers, or between flowers and stems, thereby improving the accuracy of picking point localization. Wang et al. [
10] proposed a two-stage recognition and localization method based on an improved YOLOv5 for safflower harvesting scenarios, achieving a localization success rate of 93.79%, which verified the effectiveness of dynamic view adjustment in top-down localization. For honeysuckle with an elongated morphology and dense clustering, Rui et al. [
11] employed the YOLOv8-pose keypoint detection network to identify the head and tail keypoints of flower buds from a top-down view, took the head as the picking point, and simultaneously estimated the angle between the flower bud and the horizontal plane, thereby validating the effectiveness of the joint strategy of keypoint detection and pose estimation under a top-down view. Although the above studies have achieved good results in top-down localization, the problems of large model parameters and high inference complexity have not been adequately resolved. Furthermore, Taddei Dalla Torre et al. [
12] targeted multiple edible flowers (marigold, snapdragon, and pansy), utilized SAM to generate precise corolla masks from YOLO detection boxes, then estimated the flower pose through principal component analysis, and established a linear regression relationship between the corolla diameter and the picking point height to infer the picking position. Starting from a top-down perspective, combining model lightweighting and distillation techniques with geometric or point cloud methods for picking point localization has become a current development direction for intelligent picking of flower crops. However, none of the above top-down methods have designed a dedicated picking point localization strategy for the unique morphology of rose flowers and buds. Moreover, rose harvesting requires distinguishing buds from fully bloomed flowers, which imposes higher requirements on the recognition model and localization accuracy.
After successfully identifying the spatial picking points, efficient path planning is crucial for ensuring continuous flower harvesting and improving picking efficiency. Research on path planning based on identified picking points has attracted the attention of researchers, and some studies have completed the end-to-end extraction from field images to picking point coordinates, thereby providing real inputs for path planning. For instance, in the safflower harvesting task, Wang et al. [
13] first employed an improved YOLOv5 algorithm to recognize and locate three types of targets—filaments, decayed flowers, and flower balls—outputting normalized three-dimensional coordinates, and based on these real coordinates, constructed a deep reinforcement learning model to optimize the picking sequence. Several other studies, although premised on “identified picking points” for path planning, concentrate their core contributions almost entirely on the path planning algorithm itself, while their treatment of the recognition stage remains at the level of system architecture description or directly assumes the picking point coordinates as known quantities. For example, Guo et al. [
14] only generally mentioned the acquisition of three-dimensional coordinate information in safflower picking trajectory planning, and focused their study on the ant colony genetic fusion algorithm and Bezier curve trajectory optimization. Similarly, Ge Yun et al. [
15] proposed an improved ant colony algorithm and designed a gate-shaped picking trajectory, but the picking point coordinates and inclination information still came from preset values, with visual recognition only mentioned as background, lacking a closed loop with actual picking points. Moreover, Zhang et al. [
16] proposed a path planning method for dual-arm safflower harvesting, which effectively shortened the picking path length through local search and Bezier curve trajectory smoothing, but the picking point recognition part only served as an experimental premise. Lin et al. [
17] proposed a coupled framework integrating the lightweight rose flower and bud detection model Rose_YOLO with 2D path planning algorithm. However, the aforementioned path planning studies are either confined to two-dimensional coordinate validation or rely on three-dimensional picking point coordinates as preset inputs. They lack an end-to-end framework that tightly integrates visual recognition, three-dimensional geometric reasoning, and path planning strategies. Therefore, constructing a rose selective harvesting framework that integrates lightweight recognition, three-dimensional geometric reasoning of picking points, and tightly coupled path planning remains a critical issue that urgently needs to be addressed.
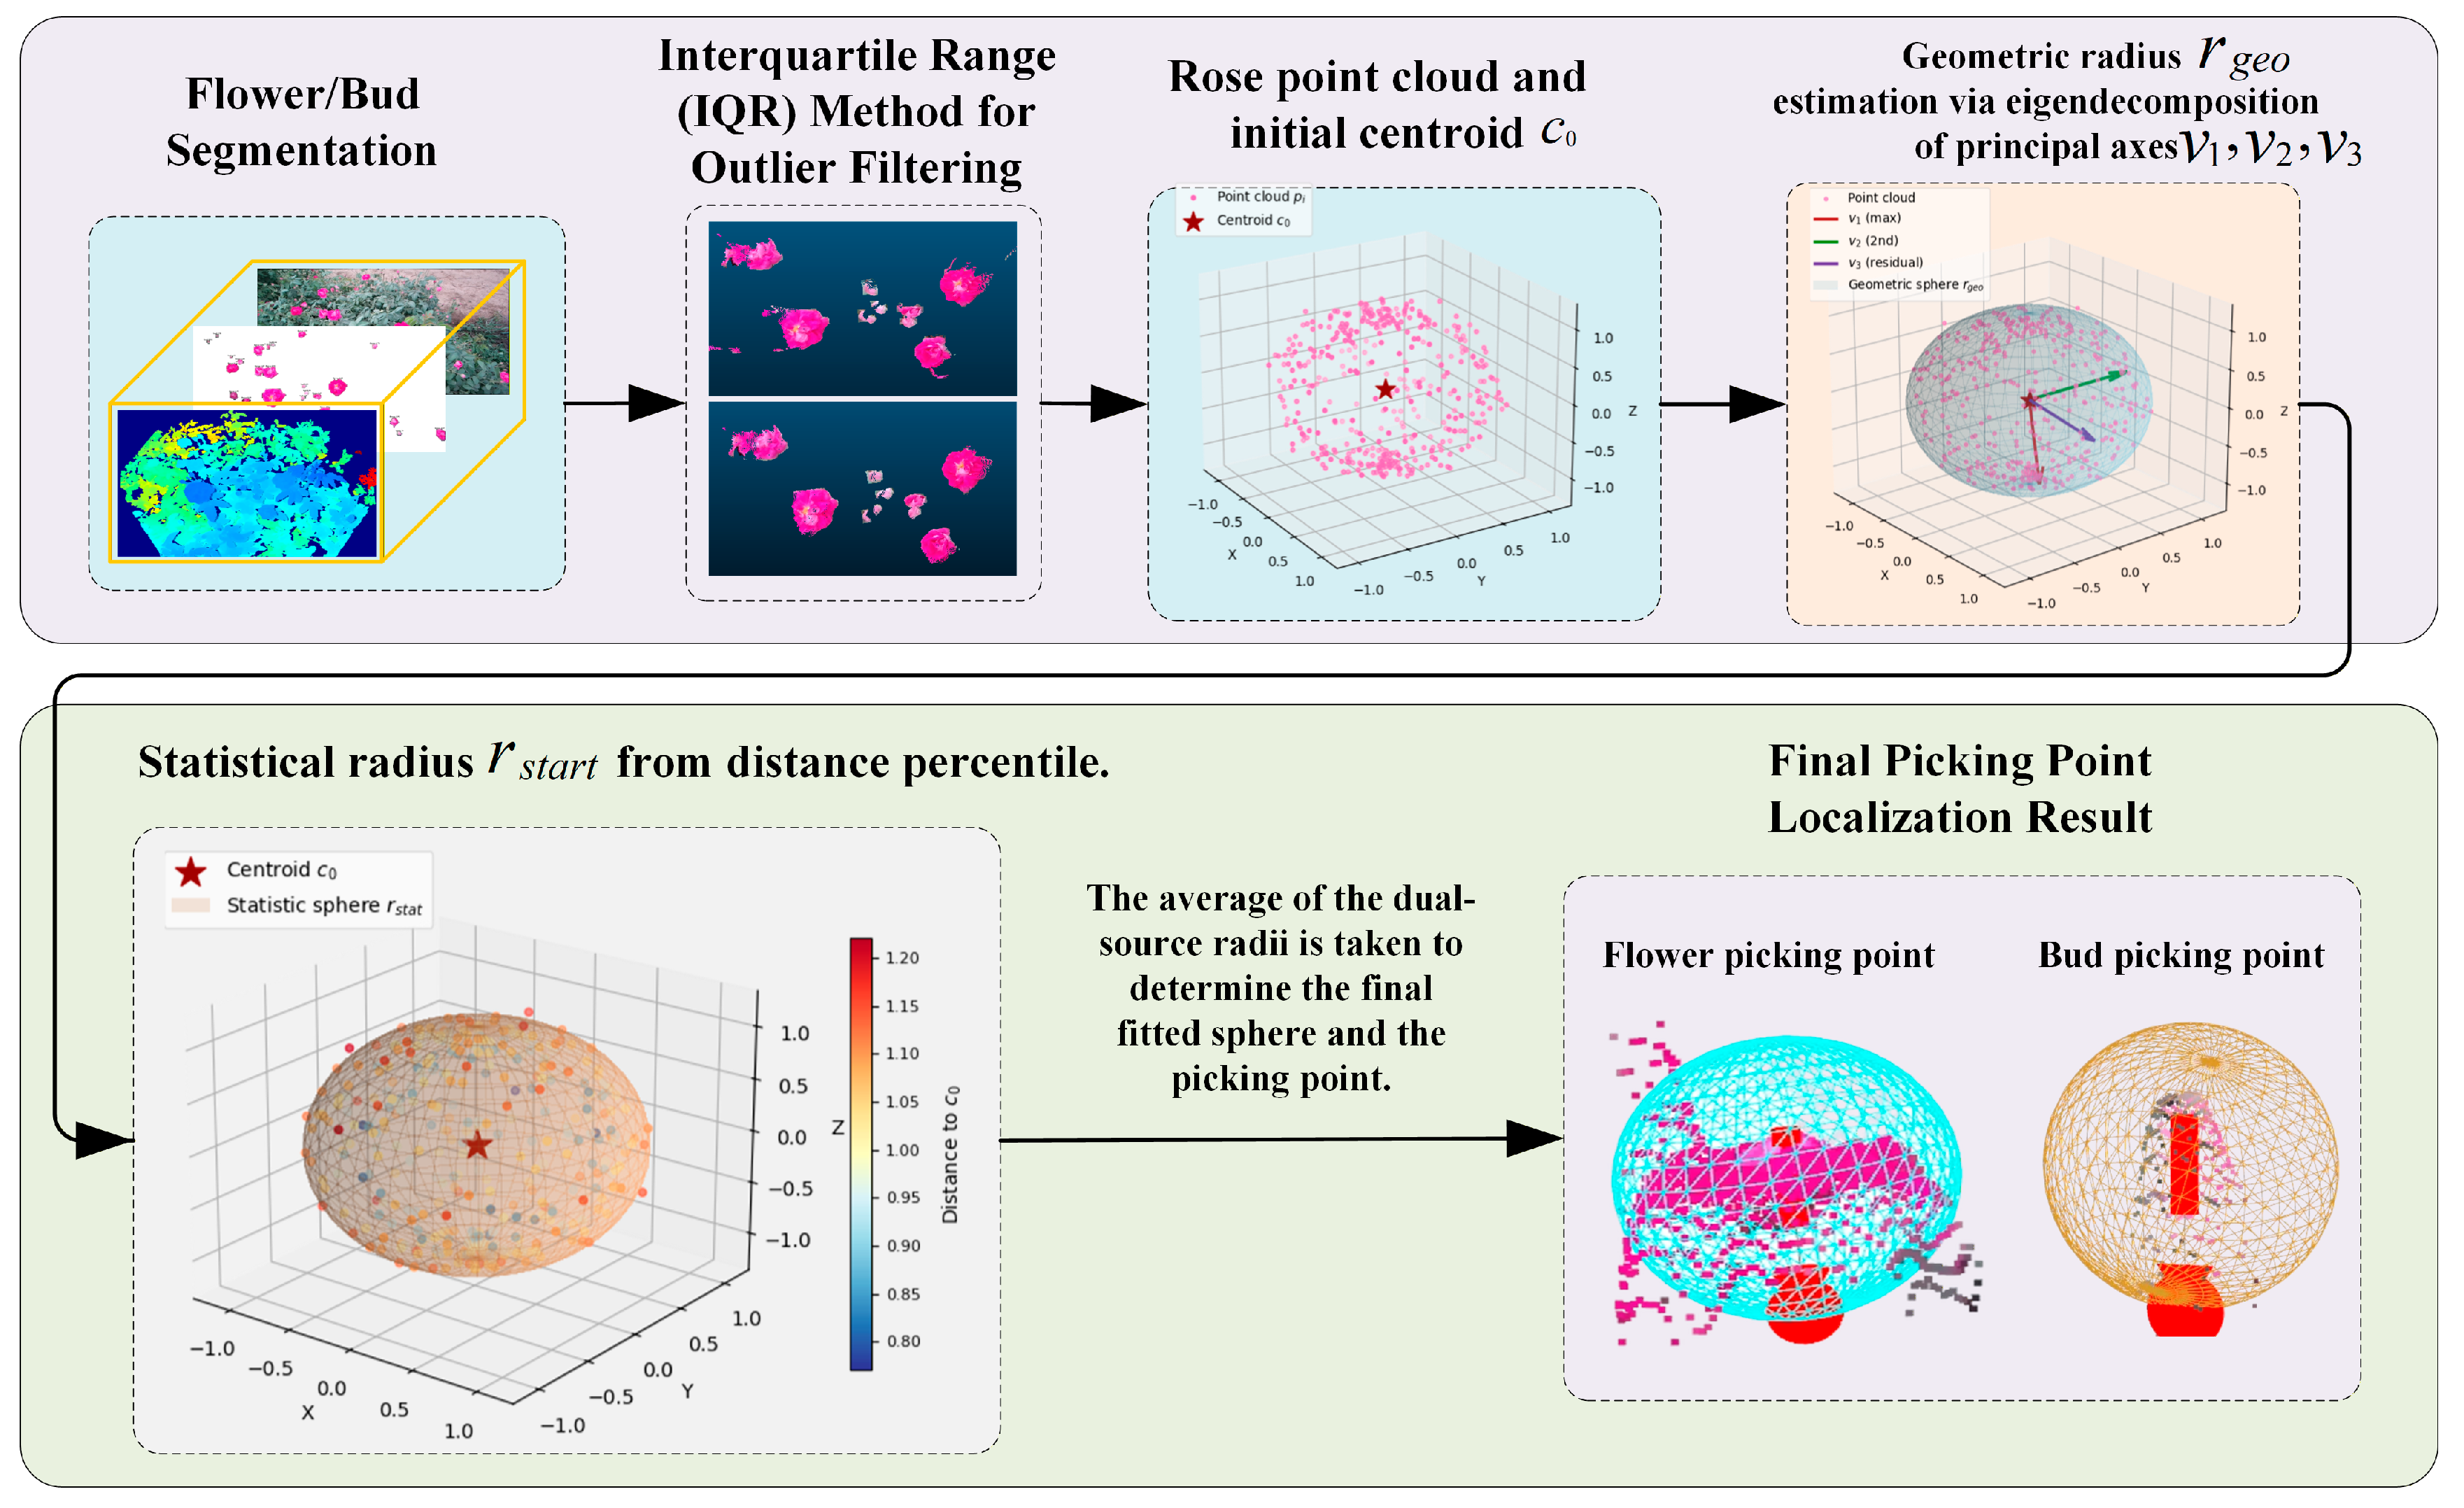
To address this issue, this paper proposes a lightweight instance segmentation model, YOLOv11n-LPD-Seg, which significantly reduces computational resource consumption while retaining multi-scale and high-precision segmentation capabilities for rose flower and bud. Furthermore, we design a rose picking-point localization algorithm, MGRO-Loc, based on point cloud geometric features, and a path planning algorithm, OG-LKH, constrained by the “oblique gate-shaped trajectory”. By introducing a multi-start strategy and gate-perception heuristic search, this algorithm effectively optimizes the traversal sequence for multi-target continuous harvesting and significantly shortens the path length, thereby achieving a tight integration of visual recognition, three-dimensional geometric reasoning of picking points, and path planning.
3. Results and Analysis
3.1. Experimental Environment
The training, pruning, and distillation of the rose segmentation model require substantial computational resources; therefore, these experiments were conducted on a desktop workstation. The workstation is equipped with an Intel(R) Core(TM) i9-13900K processor, an NVIDIA GeForce RTX 4080 GPU with 32 GB of memory, and the software environment consists of Python 3.11.11, PyTorch 2.0.0, and CUDA 11.8. The picking point localization experiment, which has lower computational requirements and involves outdoor scenes, was conducted on a laptop platform. The laptop is configured with an Intel(R) Core(TM) i5-10300H processor, an NVIDIA GeForce GTX 1650 GPU with 4 GB of memory, and the software environment includes Python 3.9.21, PyTorch 1.13, and CUDA 11.6. For edge deployment evaluation, we employed an NVIDIA Jetson Orin Nano 8GB developer kit. All RGB and depth images used in the experiments were captured by the Femto Mega depth camera, detailed in
Section 2.1.
3.2. Baseline Model Selection
Different versions of YOLO models exhibit varying performance in object detection and segmentation tasks. To select a model suitable for the Hotan rose flower and bud segmentation task, this study compared four models, YOLOv5n-seg, YOLOv8n-seg, YOLOv11n-seg, and YOLOv12n-seg, under the same hardware and software configurations and identical training parameters. The training parameters were uniformly set as follows: batch size of 16, 300 training epochs, stochastic gradient descent (SGD) optimizer, and input image size of 1024. As shown in
Table 1, for the flower category, the mAP@0.5 of all four models exceeded 92.6%, showing little difference; among them, YOLOv11n-seg achieved the highest precision, and its mAP@0.5 (94.8%) was only 0.1 percentage points lower than the highest value (94.9% from YOLOv8n-seg), while YOLOv5n-seg had the highest recall. For the bud category, a clear divergence emerged: YOLOv11n-seg attained an mAP@0.5 of 83.0%, surpassing YOLOv5n-seg and YOLOv12n-seg by 1.9 and 3.8 percentage points, respectively, and its precision and recall were also optimal. In terms of efficiency, YOLOv11n-seg had a model size of 6.1 MB and a computational complexity of 10.2 GFLOPs. Although not the smallest, its bud accuracy under the same model size far exceeded that of YOLOv12n-seg, and its computational load was 15.0% lower than that of YOLOv8n-seg. As bud is the most difficult category to recognize in this task, the significant advantage of YOLOv11n-seg in this category directly raised the overall segmentation level and preserved a more ample accuracy margin for subsequent pruning and distillation. Therefore, YOLOv11n-seg was selected as the baseline model.
3.3. Pruning and Distillation Parameter Configuration
To determine the optimal pruning configuration, we conducted four comparative experiments using the LAMP and Slim pruning methods at target speedup ratios of 1.3 and 1.5, as summarized in
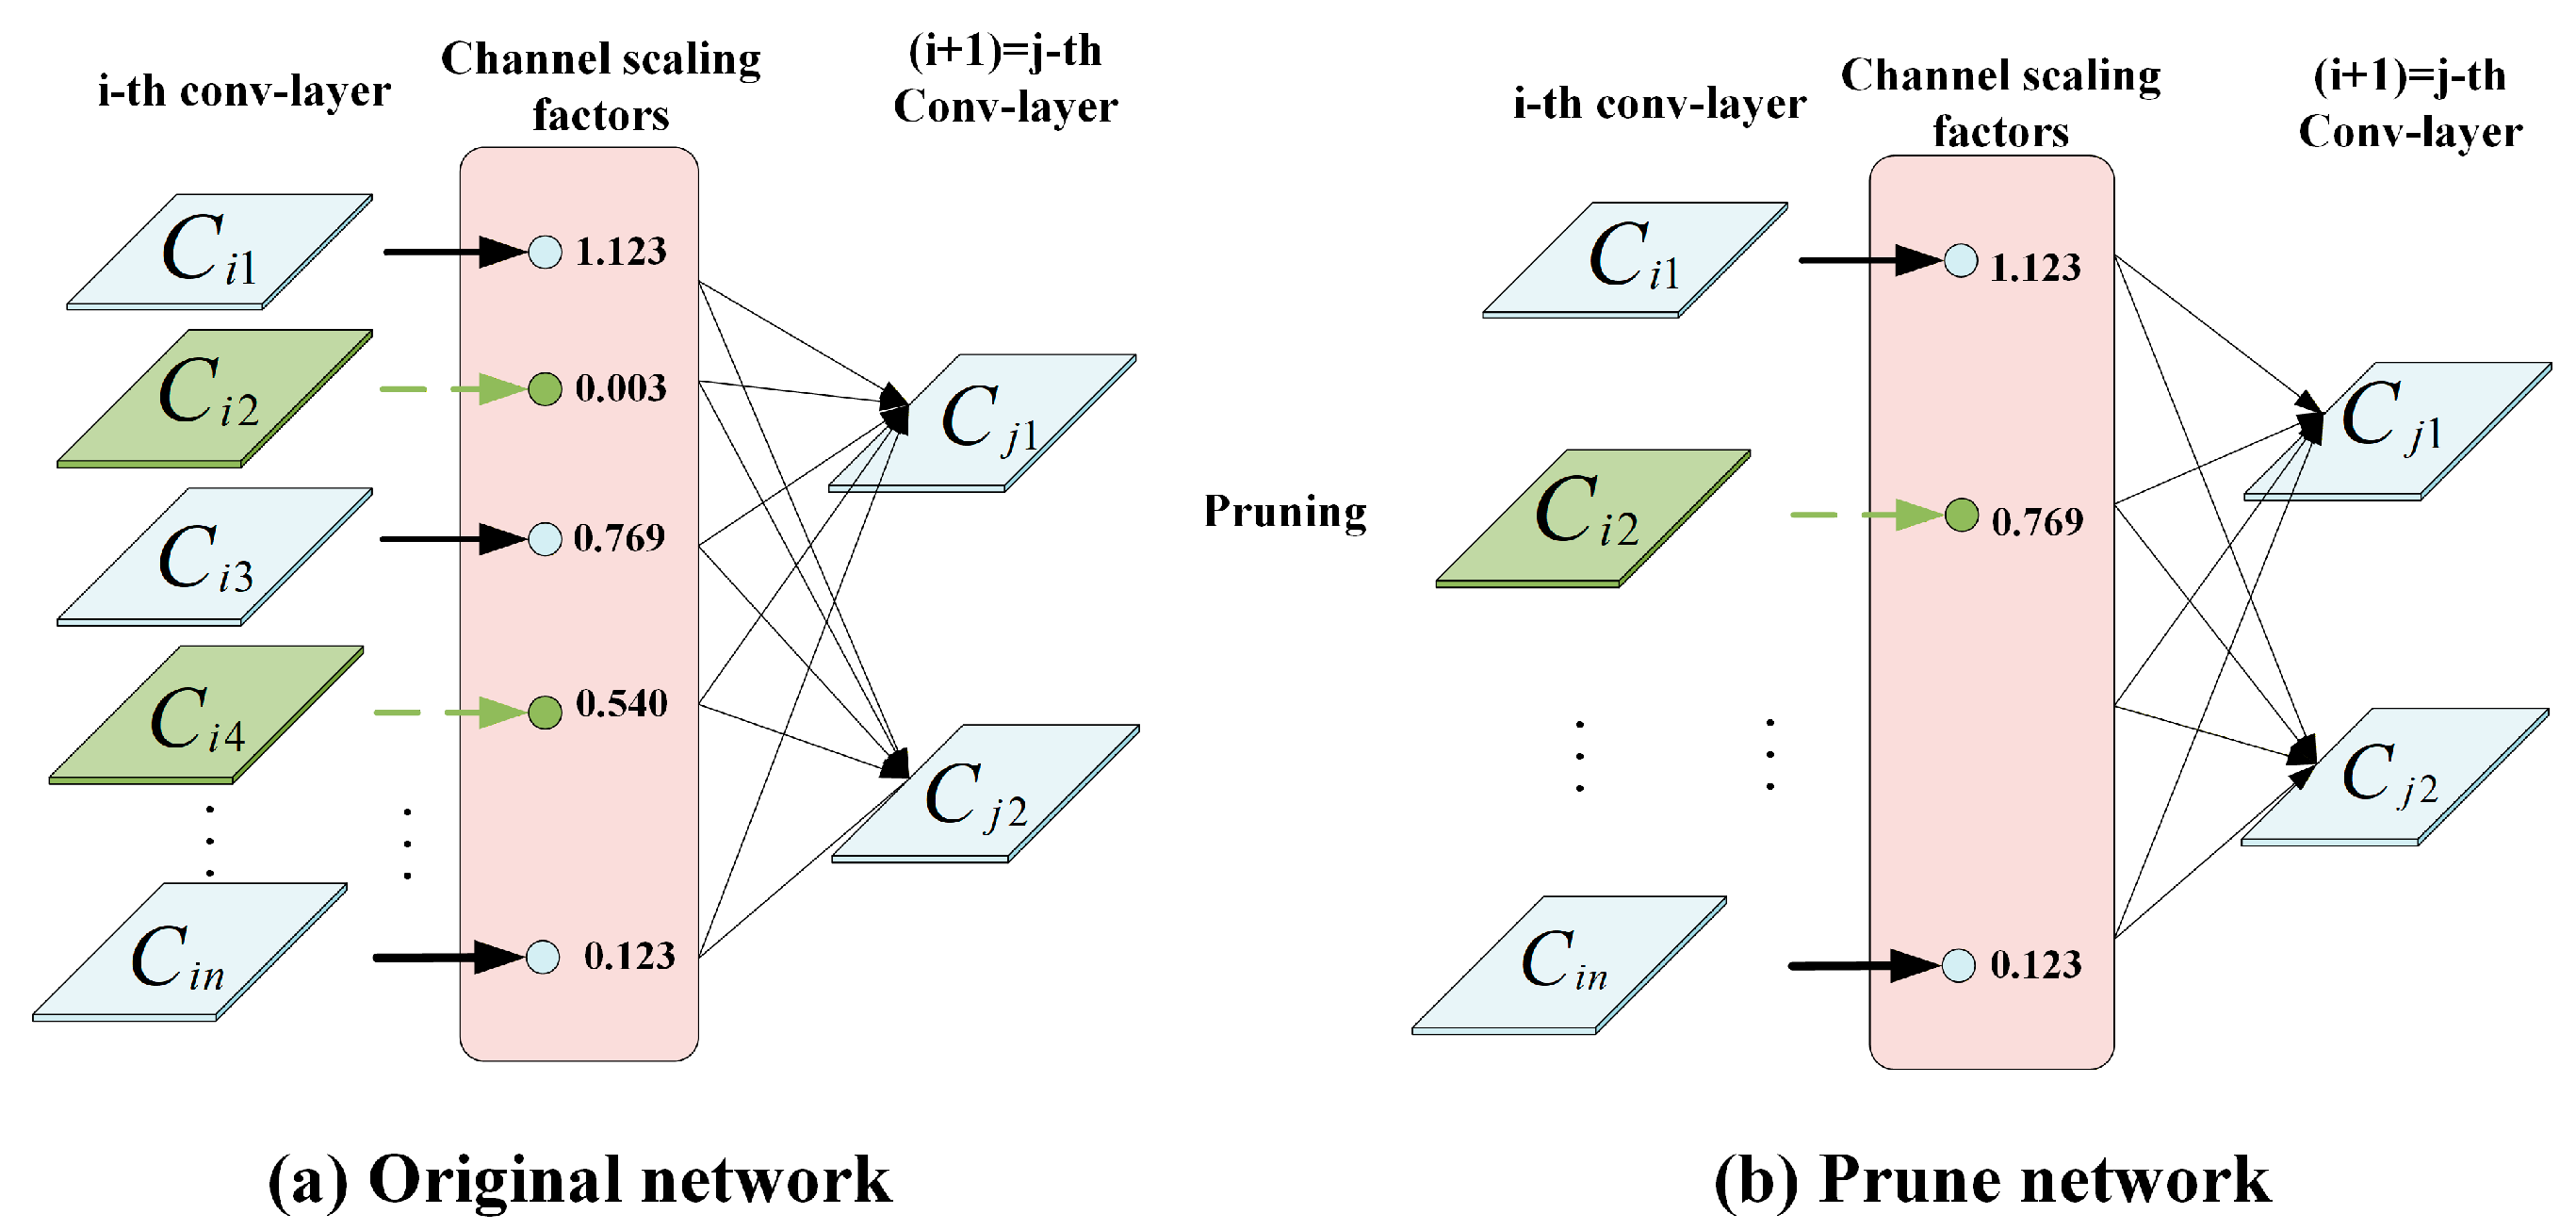
Table 2. In the LAMP framework, the target speedup ratio is used as the pruning objective to determine the sparsity of each layer’s channels; for example, a ratio of 1.5 aims to accelerate inference to 1.5 times the original speed. Under non-global pruning with LAMP at a target speedup ratio of 1.5, the model size was reduced from 6.1 MB to 4.0 MB and GFLOPs decreased from 10.2 to 7.8, but bud mAP@0.5 dropped from 83.0% to 81.9%. Using Slim instead of LAMP under the same non-global setting led to a more severe performance decline, with bud mAP@0.5 decreasing to 69.2%, indicating that LAMP is more suitable for this task. With global pruning using LAMP at a target speedup ratio of 1.3, the model was compressed to 2.9 MB and 6.8 GFLOPs, but bud mAP@0.5 was only 76.9%. By contrast, global pruning with LAMP at a target speedup ratio of 1.5 achieved the best overall trade-off: the model size was reduced to 2.4 MB and GFLOPs to 6.8, while flower mAP@0.5 remained at 94.7% and bud mAP@0.5 at 82.8%, representing only a 0.2 percentage-point drop relative to the baseline. Accordingly, we select global pruning with the LAMP method at a target speedup ratio of 1.5 as the optimal pruning configuration for the subsequent distillation stage.
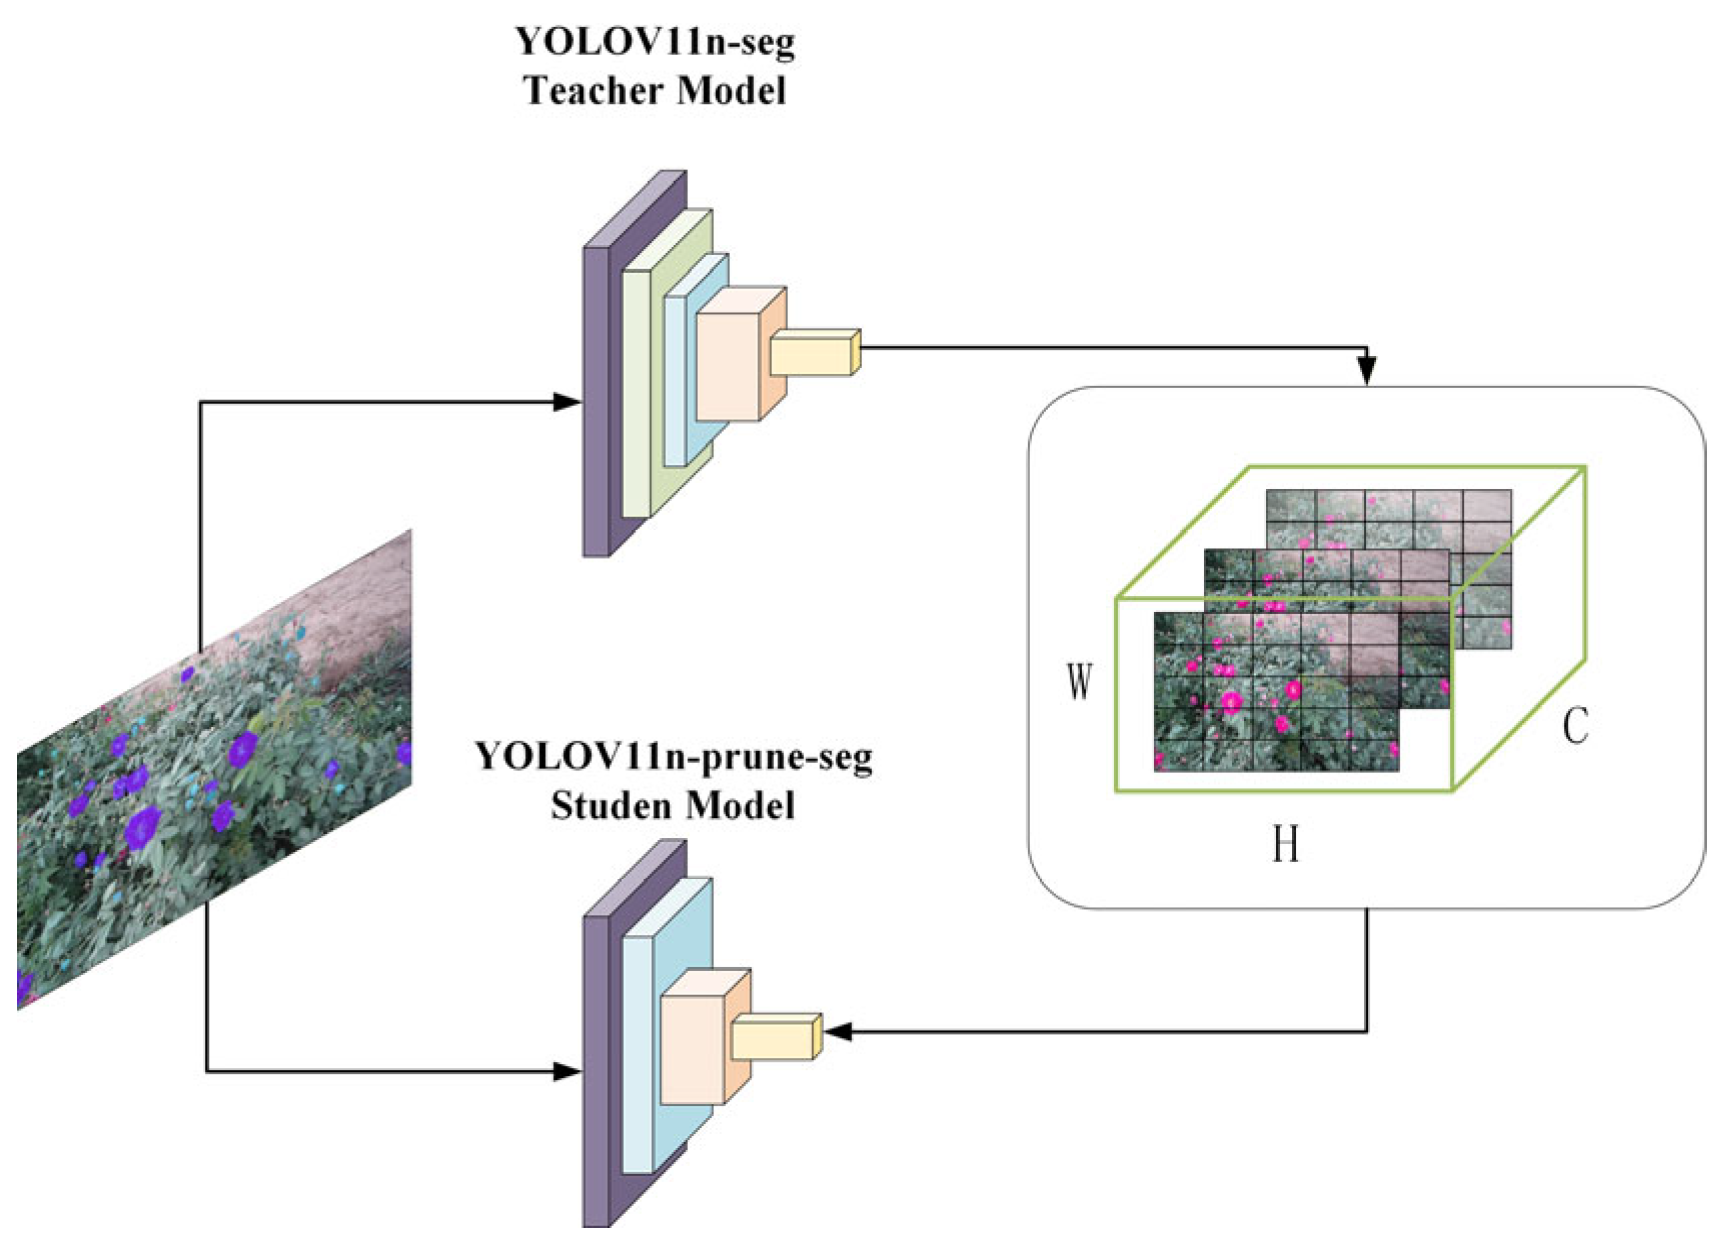
To determine the optimal distillation strategy, this study systematically compared three schemes: L1 loss distillation based on output logits, CWD loss distillation on intermediate feature maps, and their joint combination. All experiments were conducted with a feature loss weight of 0.8 and four distillation layers, namely 12, 15, 18, and 21, as summarized in
Table 3. For the “flower” category, the mAP@0.5 values of the baseline, logit distillation, feature distillation, and joint distillation were 94.7%, 94.7%, 94.8%, and 94.7%, respectively, showing negligible differences across strategies. The corresponding precision values were 86.9%, 88.0%, 89.6%, and 87.5%, while the recall values were 91.3%, 89.2%, 89.0%, and 89.8%, indicating limited room for further improvement through distillation on this category. For the “bud” category, the baseline achieved an mAP@0.5 of 82.8%, with a precision of 76.7% and a recall of 77.2%, providing a lower starting point for evaluating distillation effects. Logit distillation increased the mAP@0.5 to 83.0%, with precision and recall of 72.8% and 77.3%, representing a modest improvement of 0.2 percentage points over the baseline. Feature distillation yielded a further improvement, raising the mAP@0.5 to 83.3%, with precision of 76.3% and recall of 78.6%, corresponding to a gain of 0.5 percentage points. By contrast, joint distillation achieved an mAP@0.5 of 82.9%, with precision of 76.4% and recall of 77.3%, which was 0.4 percentage points lower than feature distillation alone. These results indicated that feature distillation provided the most substantial performance gain for small-target categories such as “bud,” whereas joint distillation offered no additional benefit. Moreover, the combined supervisory signals may have introduced optimization conflicts and thereby hindered the convergence of the student network. Accordingly, feature distillation was adopted as the optimization strategy in the subsequent experiments.
After feature distillation was established as the foundational strategy, this study further examined the effects of the feature loss weight and the number of distillation layers on performance, as summarized in
Table 4. Under the configuration with four distillation layers and a loss weight of 1.0, the flower category achieved an mAP@0.5 of 95.0%, a precision of 87.5%, and a recall of 90.9%, whereas the bud category reached 82.7%, 75.5%, and 78.2%, respectively. When the number of distillation layers increased to seven and the loss weight decreased to 0.6, the flower category yielded an mAP@0.5 of 94.9%, a precision of 87.7%, and a recall of 90.9%, while the bud category attained 83.0%, 79.0%, and 74.1%, respectively. With seven distillation layers and a loss weight of 0.8, the flower category still achieved an mAP@0.5 of 94.9%, while precision increased to 88.8% and recall remained unchanged at 90.9%. Meanwhile, the bud category reached its best mAP@0.5 of 83.7%, with precision unchanged at 79.0% compared to the 0.6 setting, and recall improved to 75.3%. Compared with the 0.6 weight setting, the 0.8 weight increased flower precision by 1.1 percentage points while maintaining the same recall, and simultaneously improved bud recall by 1.2 percentage points without affecting precision. These results indicated that an excessively low loss weight weakened the guiding effect of the distillation signal, whereas an overly high weight imposed excessive constraints on the student network; therefore, a weight of 0.8 achieved the best balance. Moreover, compared with the initial configuration of four distillation layers and a weight of 1.0, the optimal setting of seven distillation layers and a weight of 0.8 increased the bud mAP@0.5 from 82.7% to 83.7%, showing that shallow high-resolution features played an important supplementary role in small-target segmentation.
The experimental results for pruning and distillation revealed the intrinsic mechanism underlying the synergistic enhancement between LAMP and CWD-based feature distillation. During pruning, LAMP global pruning at a target speedup ratio of 1.5 achieved 60.7% model compression, whereas bud mAP@0.5 decreased by only 0.2 percentage points. This nearly lossless compression was attributed to the layer-adaptive pruning strategy of LAMP, which calculated the relative importance of channels from layer-specific weight-magnitude distributions. Instead of applying a uniform pruning threshold across layers, LAMP introduced intra-layer competition while decoupling pruning decisions among different layers. This design ensured that the channels retained in each layer remained the principal contributors to layer-specific feature responses, thereby effectively preserving the overall representational capacity of the network. Therefore, the pruning stage maintained the core network structure with minimal degradation and provided a recoverable initialization for subsequent knowledge distillation.
In the distillation stage, the advantage of feature distillation over logit distillation arose from the different granularity of information provided by the two supervisory signals. Feature distillation, implemented with CWD, aligned the spatial attention distributions of intermediate layers between the teacher and student networks, thereby transferring the teacher network’s spatial focusing ability directly to the student network. This mechanism was particularly important for small targets, such as buds, because they occupied only a small proportion of pixels and usually showed indistinct boundaries. Accurate bud segmentation therefore depended strongly on fine-grained spatial cues, including edges and textures embedded in shallow-layer features. CWD preserved these high-resolution spatial details in shallow layers more effectively, thereby compensating for the slight perturbations in small-target representations introduced by pruning. By contrast, logit distillation used only output-layer class probabilities as supervisory signals, which represented coarse semantic summaries after high-level abstraction by the network. Such signals had already discarded much of the information needed to reconstruct local spatial details, and therefore provided only limited improvement in bud segmentation accuracy. The performance degradation observed under joint distillation could be attributed to inconsistent optimization directions imposed by the two loss functions. Specifically, the output-layer L1 loss encouraged the student network to match the global class distribution, whereas the feature-layer CWD loss forced it to imitate spatial attention patterns. These two objectives produced mutually interfering gradient signals in the compact 2.4 MB model, which restricted convergence and ultimately weakened segmentation performance.
After the distillation layers were expanded from four deep layers to seven layers, including shallow layers, bud segmentation accuracy increased further from 83.3% to 83.7%. This improvement directly confirmed the indispensable complementary contribution of shallow-layer spatial details to small-target segmentation. Taken together, the three sets of comparative experiments indicated that, for pruned compact models, feature distillation incorporating shallow layers with a moderate loss weight effectively compensated for pruning-induced information loss. This strategy ultimately recovered segmentation accuracy and even surpassed the baseline performance in a self-consistent and efficient manner.
3.4. Ablation Study
To evaluate the overall effectiveness of the proposed pruning and distillation pipeline, we compared the baseline, pruned, and final distilled models. As shown in
Table 5, structured pruning reduced the model size from 6.1 MB to 2.4 MB, corresponding to a compression rate of 60.7%, and decreased the computational cost from 10.2 to 6.8 GFLOPs, representing a 33.3% reduction in complexity. In terms of segmentation accuracy, flower mAP@0.5 remained essentially unchanged, decreasing only from 94.8% to 94.7%, whereas bud mAP@0.5 showed a slight decline from 83.0% to 82.8%. After CWD-based feature distillation was applied, the distilled model recovered the minor loss in bud segmentation accuracy and further improved bud mAP@0.5 to 83.7%, exceeding the baseline by 0.7 percentage points. Meanwhile, flower mAP@0.5 increased to 94.9%, also slightly surpassing the baseline. These results indicated that the proposed pruning-then-distillation pipeline achieved substantial model compression while preserving, and even modestly improving, segmentation accuracy.
3.5. YOLOv11n-LPD-Seg Performance Verification Experiment
To further evaluate the inference performance of the baseline model and the lightweight YOLOv11n-LPD-Seg on edge computing devices, we conducted experiments on the NVIDIA Jetson Orin Nano platform (detailed in
Section 3.1) using FPS as the primary evaluation metric. As shown in
Table 6, the baseline YOLOv11n-seg achieved an inference speed of 11.7 FPS with a latency of 85.1 ms, while our YOLOv11n-LPD-Seg achieved 14.1 FPS with a latency of 71.0 ms, representing a 20.5% improvement in FPS and a 16.6% reduction in latency. These results demonstrated that the pruning and distillation pipeline effectively accelerated inference on resource-constrained edge devices while preserving high segmentation accuracy. This finding confirmed the practical deployability of YOLOv11n-LPD-Seg in real-world harvesting applications.
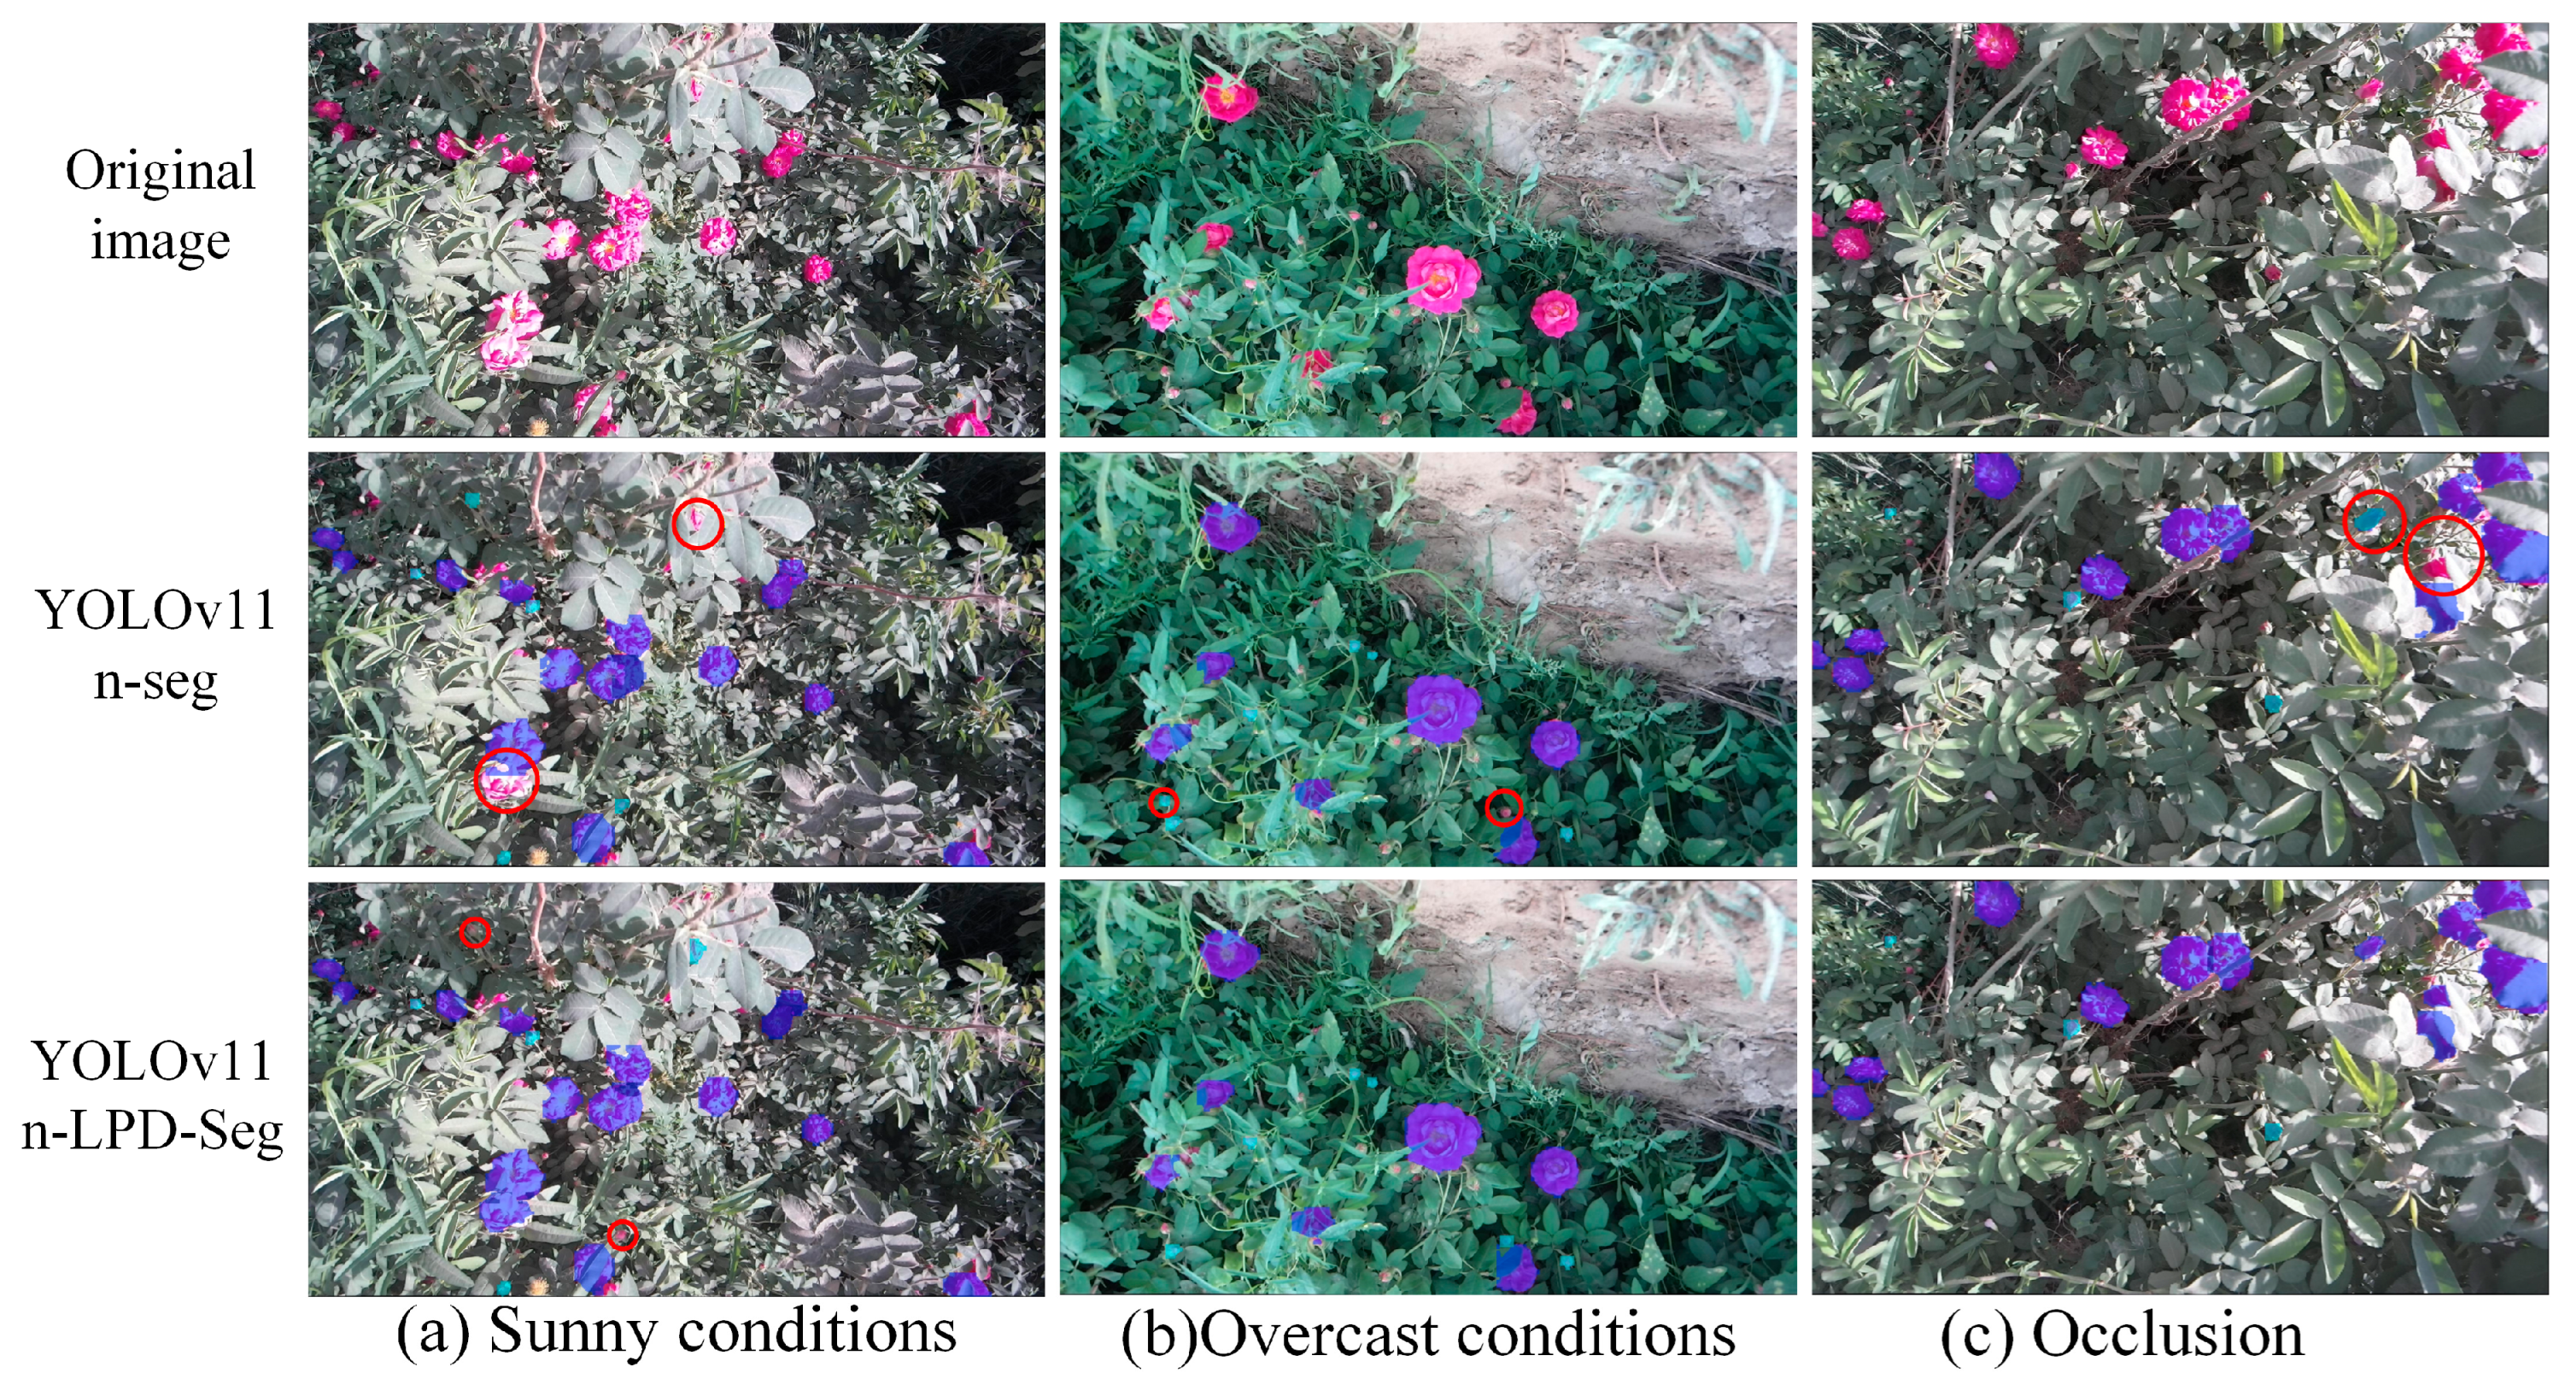
To further evaluate the segmentation performance of the baseline model and the lightweight YOLOv11n-LPD-Seg in different scenarios, comparative experiments were conducted under typical scenarios such as sunny, overcast, and occluded conditions. The results are shown in
Figure 8. Under sunny conditions, the baseline model exhibited missed detections and incomplete segmentation for overlapping flower clusters, whereas the lightweight model was able to compensate for these deficiencies relatively accurately, though a certain decrease in bud segmentation accuracy was observed. Under overcast conditions, the lightweight model showed significantly enhanced segmentation capability for small bud targets, and depicted the boundaries of immature buds more precisely, while the baseline model exhibited mis-segmentation in similar regions (see red circles). Under occluded conditions, the lightweight model improved the segmentation of the rose canopy and increased the identification accuracy for small-sized buds. The baseline model tended to misidentify flowers that had not yet fully bloomed as buds, and missed most flowers occluded by leaves; the lightweight model effectively corrected these deficiencies. In summary, the lightweight model outperforms the baseline model in overall segmentation performance in most complex scenarios, with particularly improvements in the robustness of corolla segmentation, providing a reliable foundation for subsequent picking-point localization and path planning.
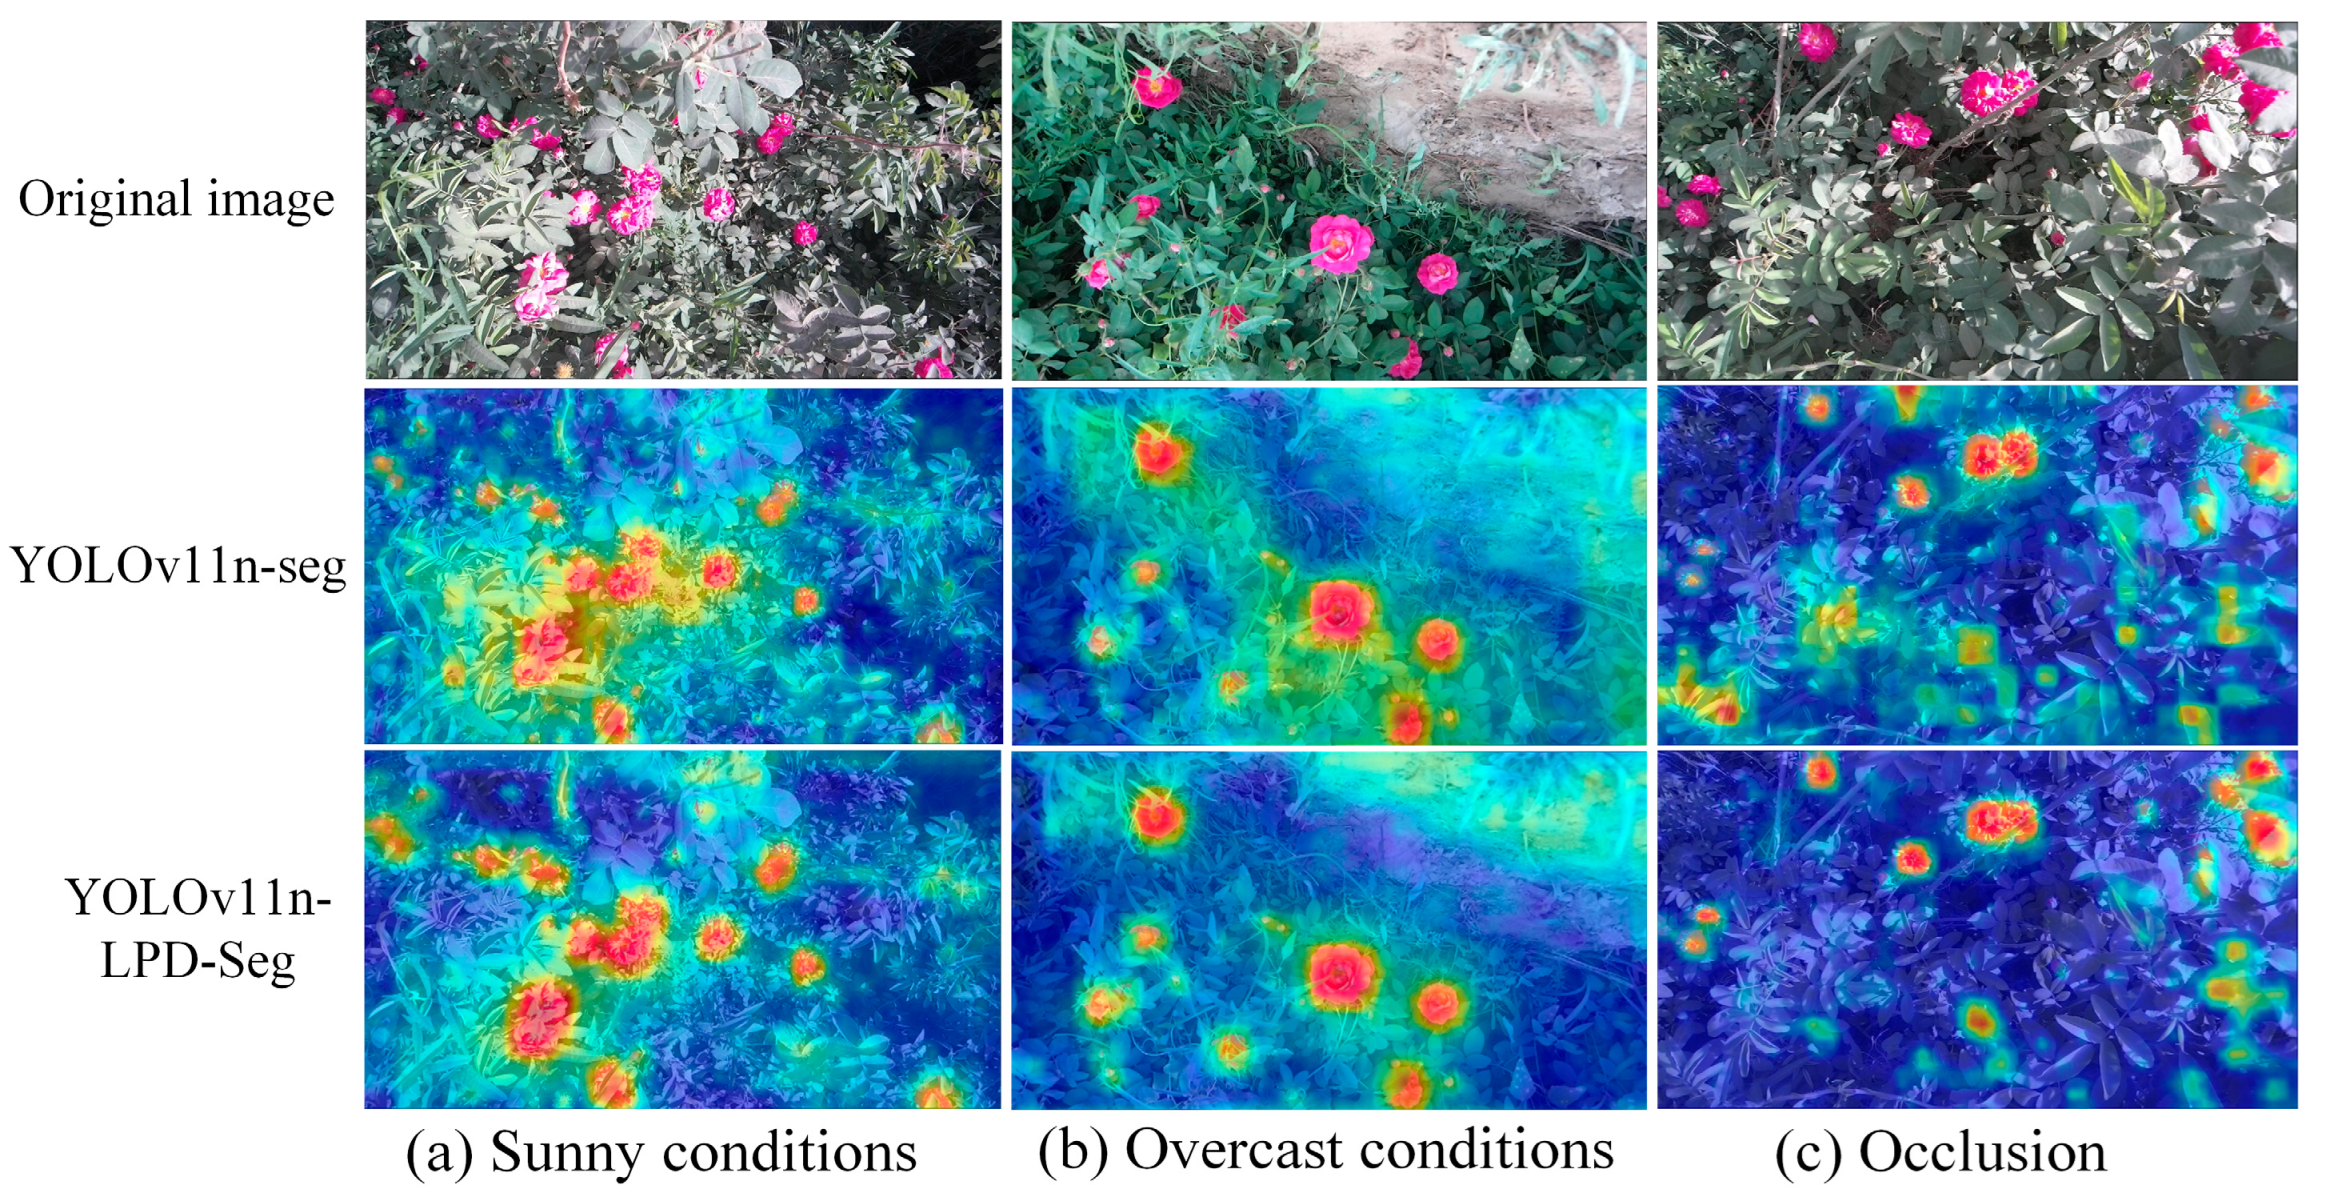
To more intuitively compare the differences in feature extraction capability between YOLOv11n-LPD-Seg and the baseline model, this paper employs Grad-CAM++ heatmaps for visual analysis under typical conditions including sunny, cloudy, and heavily occluded scenarios. The results are presented in
Figure 9. Under sunny conditions, the lightweight model exhibits a small number of false detections for buds, yet its activation on the corolla region is more precise. In cloudy scenarios, the heatmap response of the baseline model is relatively scattered, with partial response regions diffusing into irrelevant areas such as leaves, whereas the lightweight model focuses its heatmap response more on the flowers and buds. Under occluded conditions, the baseline model shows anomalous activation on non-target regions such as leaves and responds weakly to occluded flowers, while the lightweight model effectively suppresses erroneous activation on leaves and simultaneously enhances the response intensity to occluded flowers. Overall, the lightweight model demonstrates stronger feature focusing capability in most scenarios, with the heatmap response more concentrated on the target regions, verifying that the pruning and feature distillation strategy preserves the discriminative feature extraction capability of the model well while compressing the model.
3.6. Localization of Picking Points for Rose Flowers and Buds
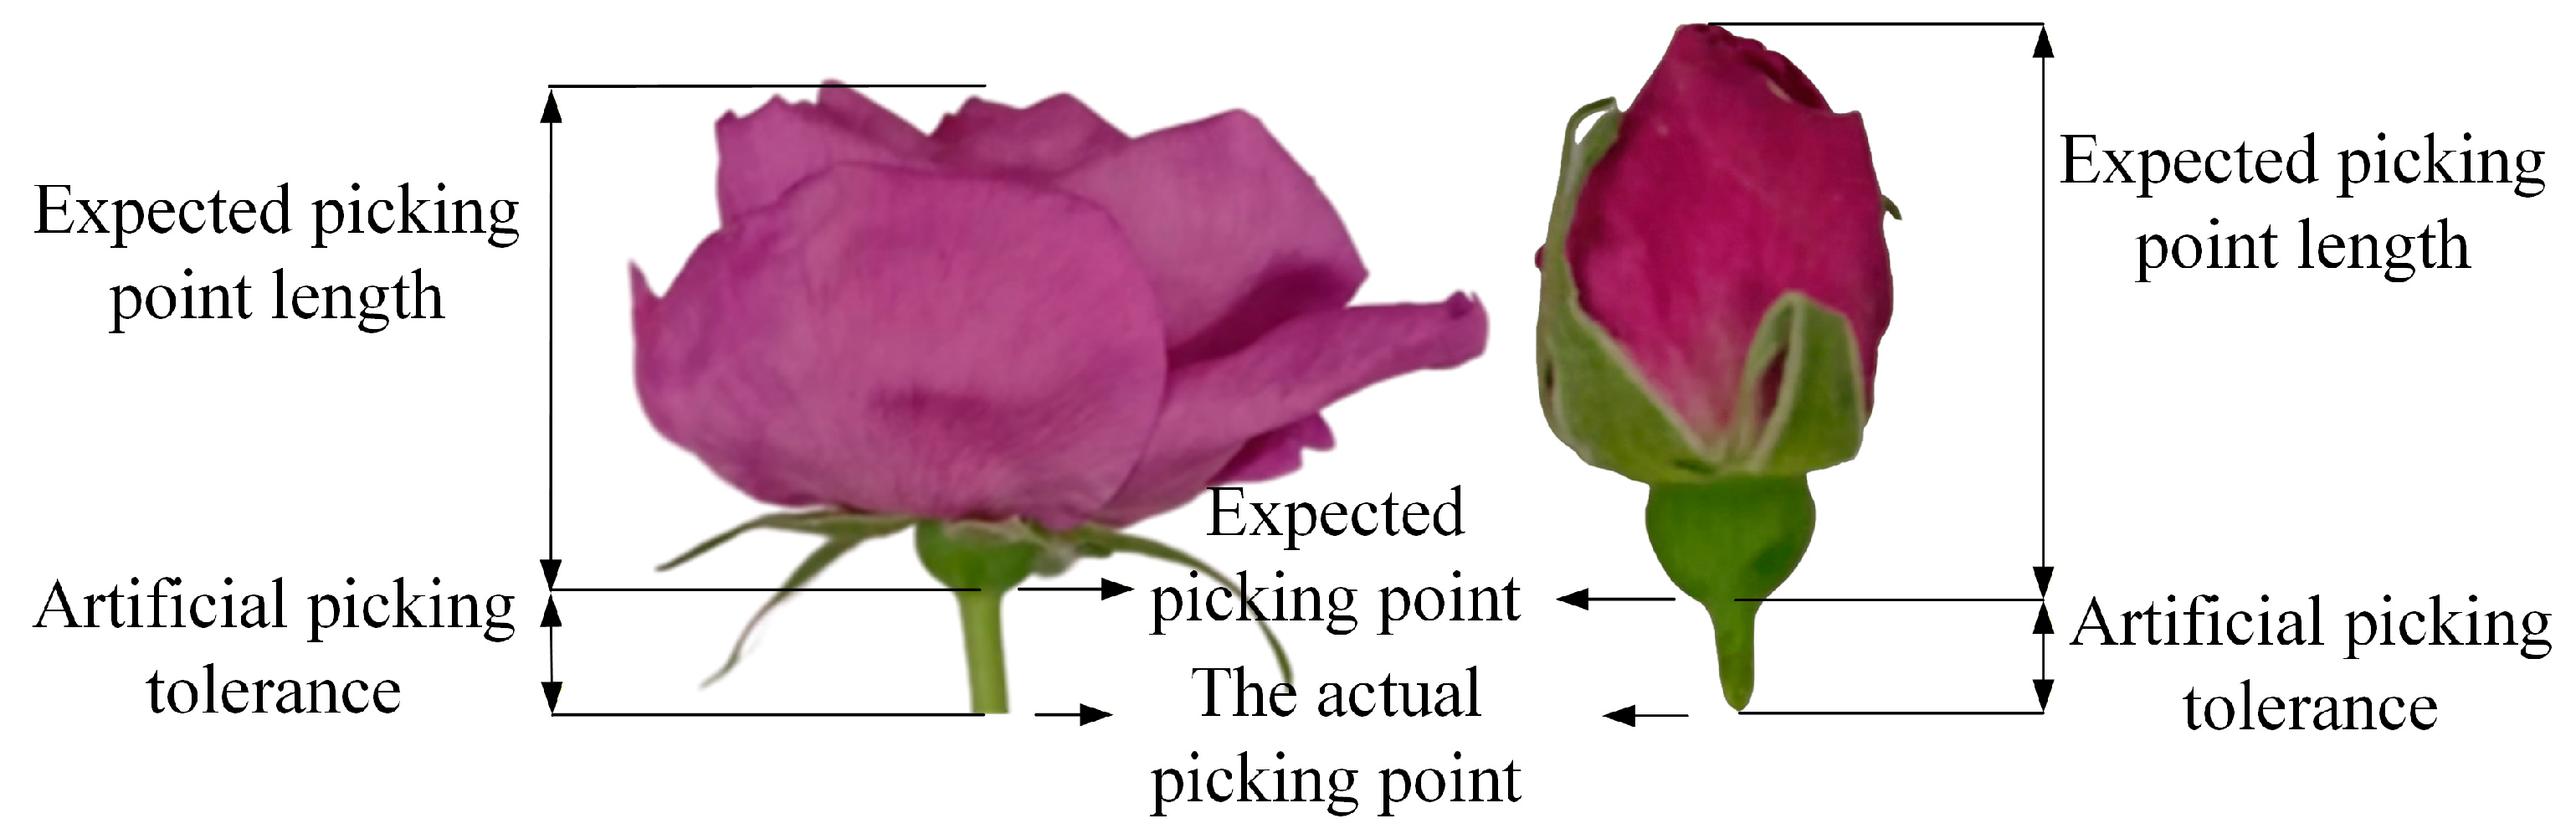
To evaluate the practical performance and effectiveness of the proposed MGRO-Loc algorithm for picking-point localization, a series of experiments were carried out in both indoor and outdoor scenarios. A depth camera was used to acquire top-down RGB and depth images of flowers and buds. A total of 20 experimental sample groups were collected and subsequently processed by the MGRO-Loc algorithm. To eliminate potential bias introduced by subjective manual measurements, a “measure-before-compare” protocol was strictly followed: for each sample, the distance from the corolla surface to the calyx—defined as the target picking-point length—was first measured manually (as shown in
Figure 10), with each measurement repeated three times and averaged to obtain a reliable reference.
First, the proposed lightweight YOLOv11n-LPD-Seg segmentation model was used to segment the flower and bud targets in RGB images captured under outdoor and indoor environments, respectively. Subsequently, the segmentation results were mapped to the corresponding depth maps to generate a three-dimensional point cloud for each sample. On this basis, picking point localization and end-effector pose estimation were accomplished using the MGRO-Loc algorithm.
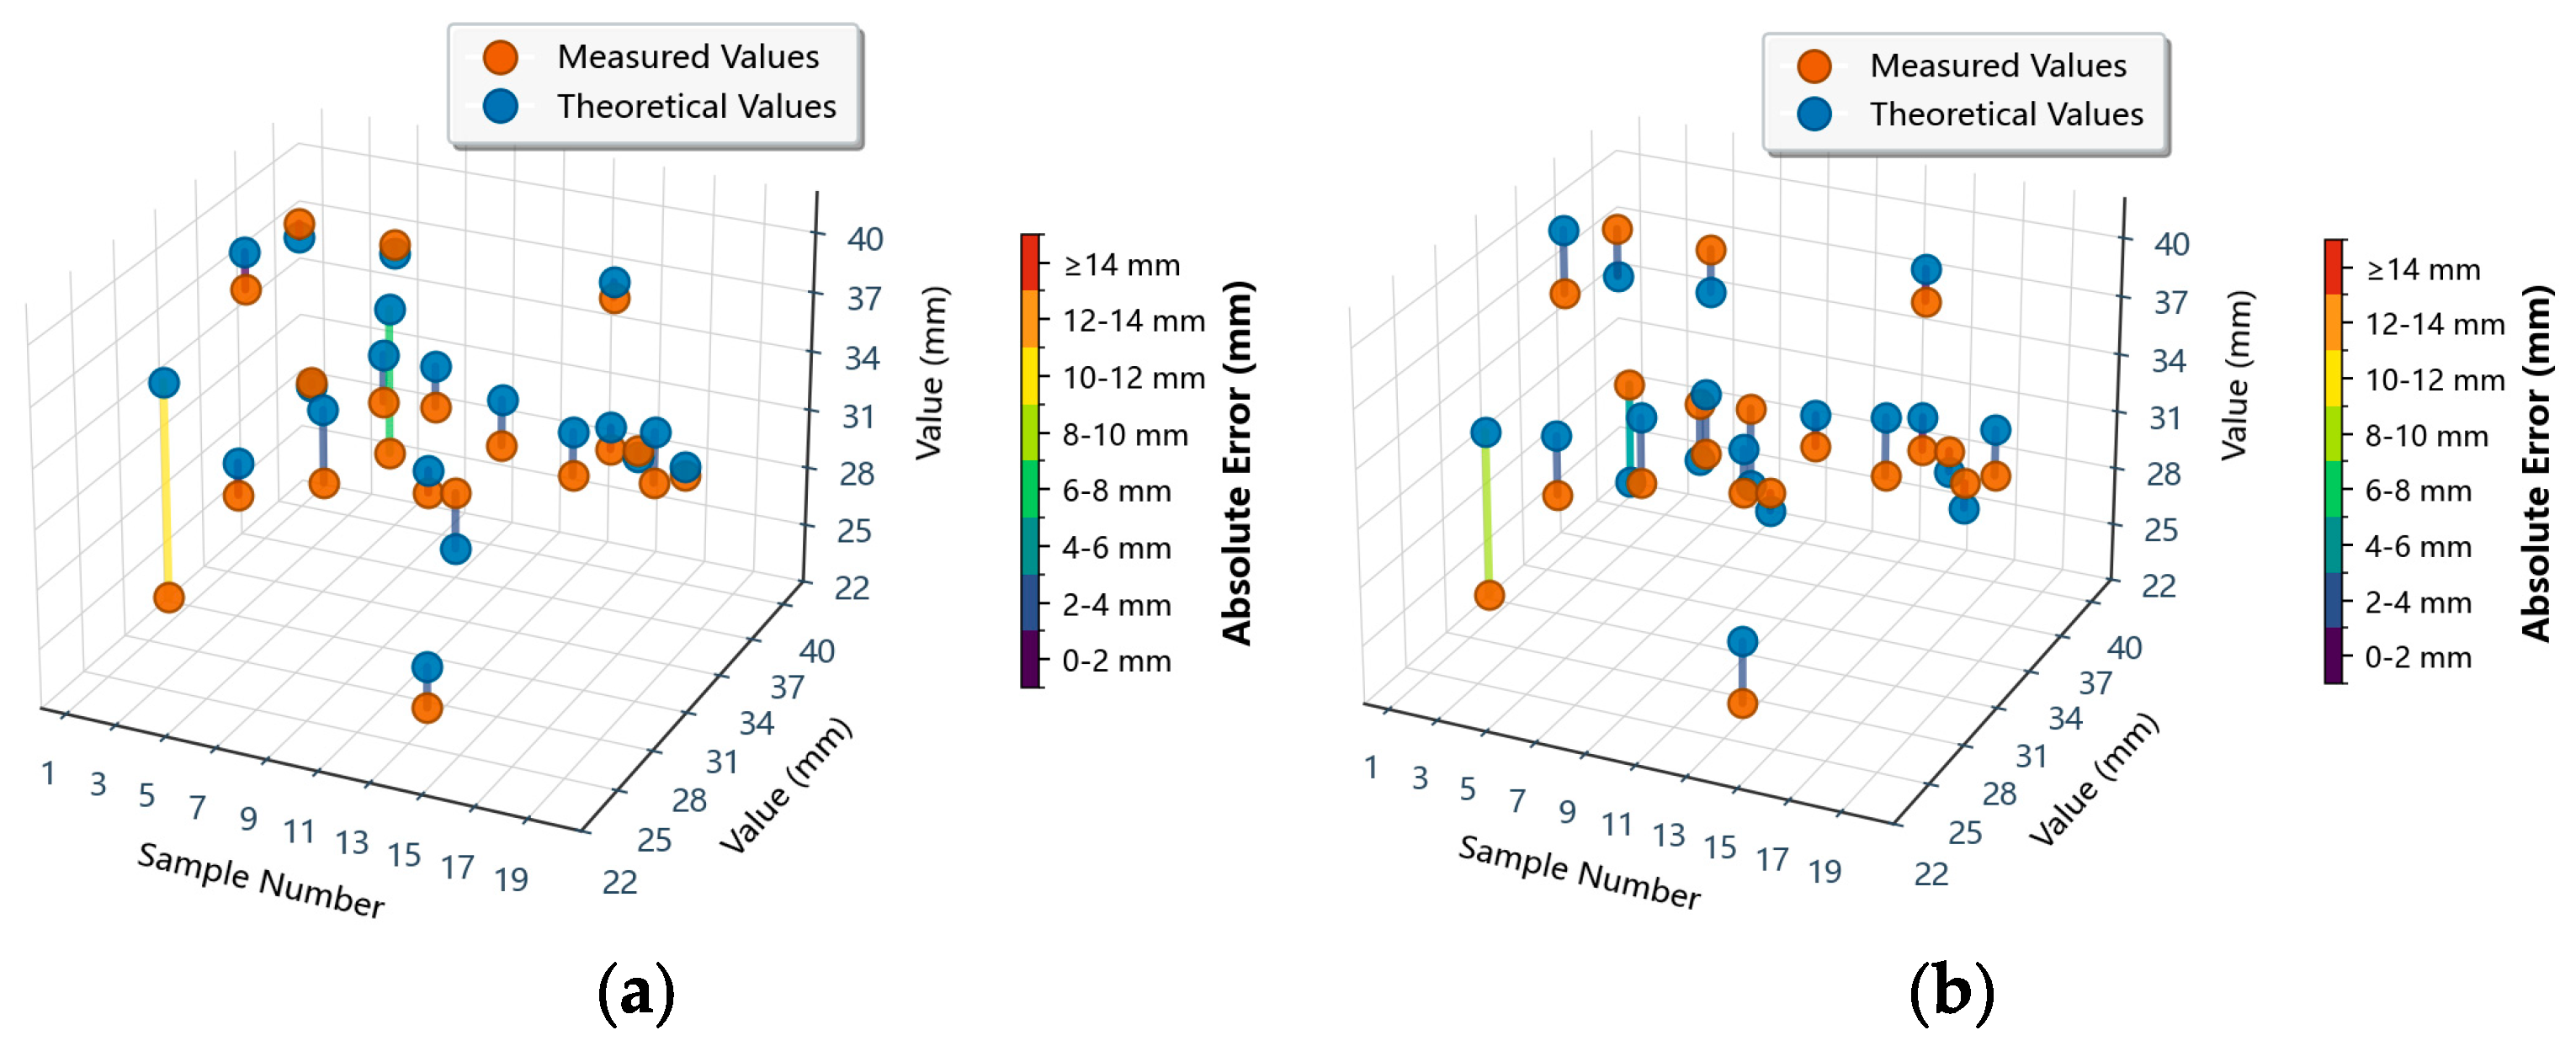
Figure 11a,b present the picking point localization results for a total of 40 samples collected indoors and outdoors. The experimental results show that the proposed method achieves millimeter-level accuracy in the picking point localization task for the flowers and buds. For the 20 indoor samples, the mean absolute error was 2.33 mm, the root mean square error was 3.39 mm, the maximum error was 10.79 mm, and the minimum error was 0.20 mm, as shown in
Figure 11a. For the 20 outdoor samples, the mean absolute error was 2.84 mm, the root mean square error was 3.27 mm, the maximum error was 8.39 mm, and the minimum error was 0.92 mm, as shown in
Figure 11b. The localization error in the indoor scenes was slightly lower than that in the outdoor scenes. The fundamental reason is that the outdoor lighting variations and background interference are more complex, leading to greater fluctuations in segmentation accuracy. The decline in segmentation accuracy further affects the completeness of the three-dimensionally reconstructed point cloud, and the sphere fitting method on which picking point localization relies is sensitive to point cloud completeness, thereby amplifying the localization error. Overall, the localization accuracy in both types of scenes remains at the millimeter level. However, in real harvesting environments, extreme postures where the corolla is nearly perpendicular to the ground occasionally occur due to the weight of the corolla itself, and the algorithm still has certain limitations for such cases. For common rose harvesting postures, the algorithm has already achieved satisfactory accuracy.
3.7. OG-LKH Oblique Gate-Shaped Trajectory Path Planning Algorithm
To determine a suitable path planning algorithm for the continuous harvesting of rose flowers and buds, this paper adopts the traditional orthogonal gate-shaped distance as the unified metric and conducts comparative experiments on four methods, namely the standard LKH algorithm, standard ant colony optimization (ACO), genetic algorithm (GA), and simulated annealing (SA), across five scenarios with different densities of rose flower and bud picking points. Each experiment was repeated 20 times, and the final average values were taken as the results. The optimal path length and average computation time were used as evaluation metrics.
As shown in
Table 7, standard ACO and SA exhibited close performance in terms of optimal path length, achieving the best values in experiments 1–3 and 4–5, respectively, with comparable overall solution accuracy. The GA failed to obtain the optimal path in all five experiments, and its deviation from the optimal value gradually increased with the number of picking points, indicating insufficient convergence accuracy. The standard LKH algorithm achieved an average deviation of 1.22% from the global optimal path length across the five experiments, demonstrating stable solution quality. In terms of computational efficiency, the average computation time of standard LKH was merely 0.0295 s, which is 8.0% of that of standard ACO (0.3678 s) and 10.1% of that of SA (0.2918 s), showing an order-of-magnitude advantage in computation speed. Furthermore, as the number of picking points increased from 24 to 36, the computation time of standard LKH increased by only 0.0406 s, with the increment corresponding to 14.2% of that of ACO (0.285 s) and 29.0% of that of SA (0.140 s), demonstrating good scalability. Notably, GA exhibited the smallest time increment (0.042 s) among all algorithms, but its poor solution accuracy limits its practical applicability. Considering the trade-off between solution accuracy and computational efficiency, LKH offers a path length very close to the optimum while achieving a decisive speed advantage, making it better suited for real-time harvesting tasks. Therefore, this paper selects standard LKH as the foundational optimization algorithm.
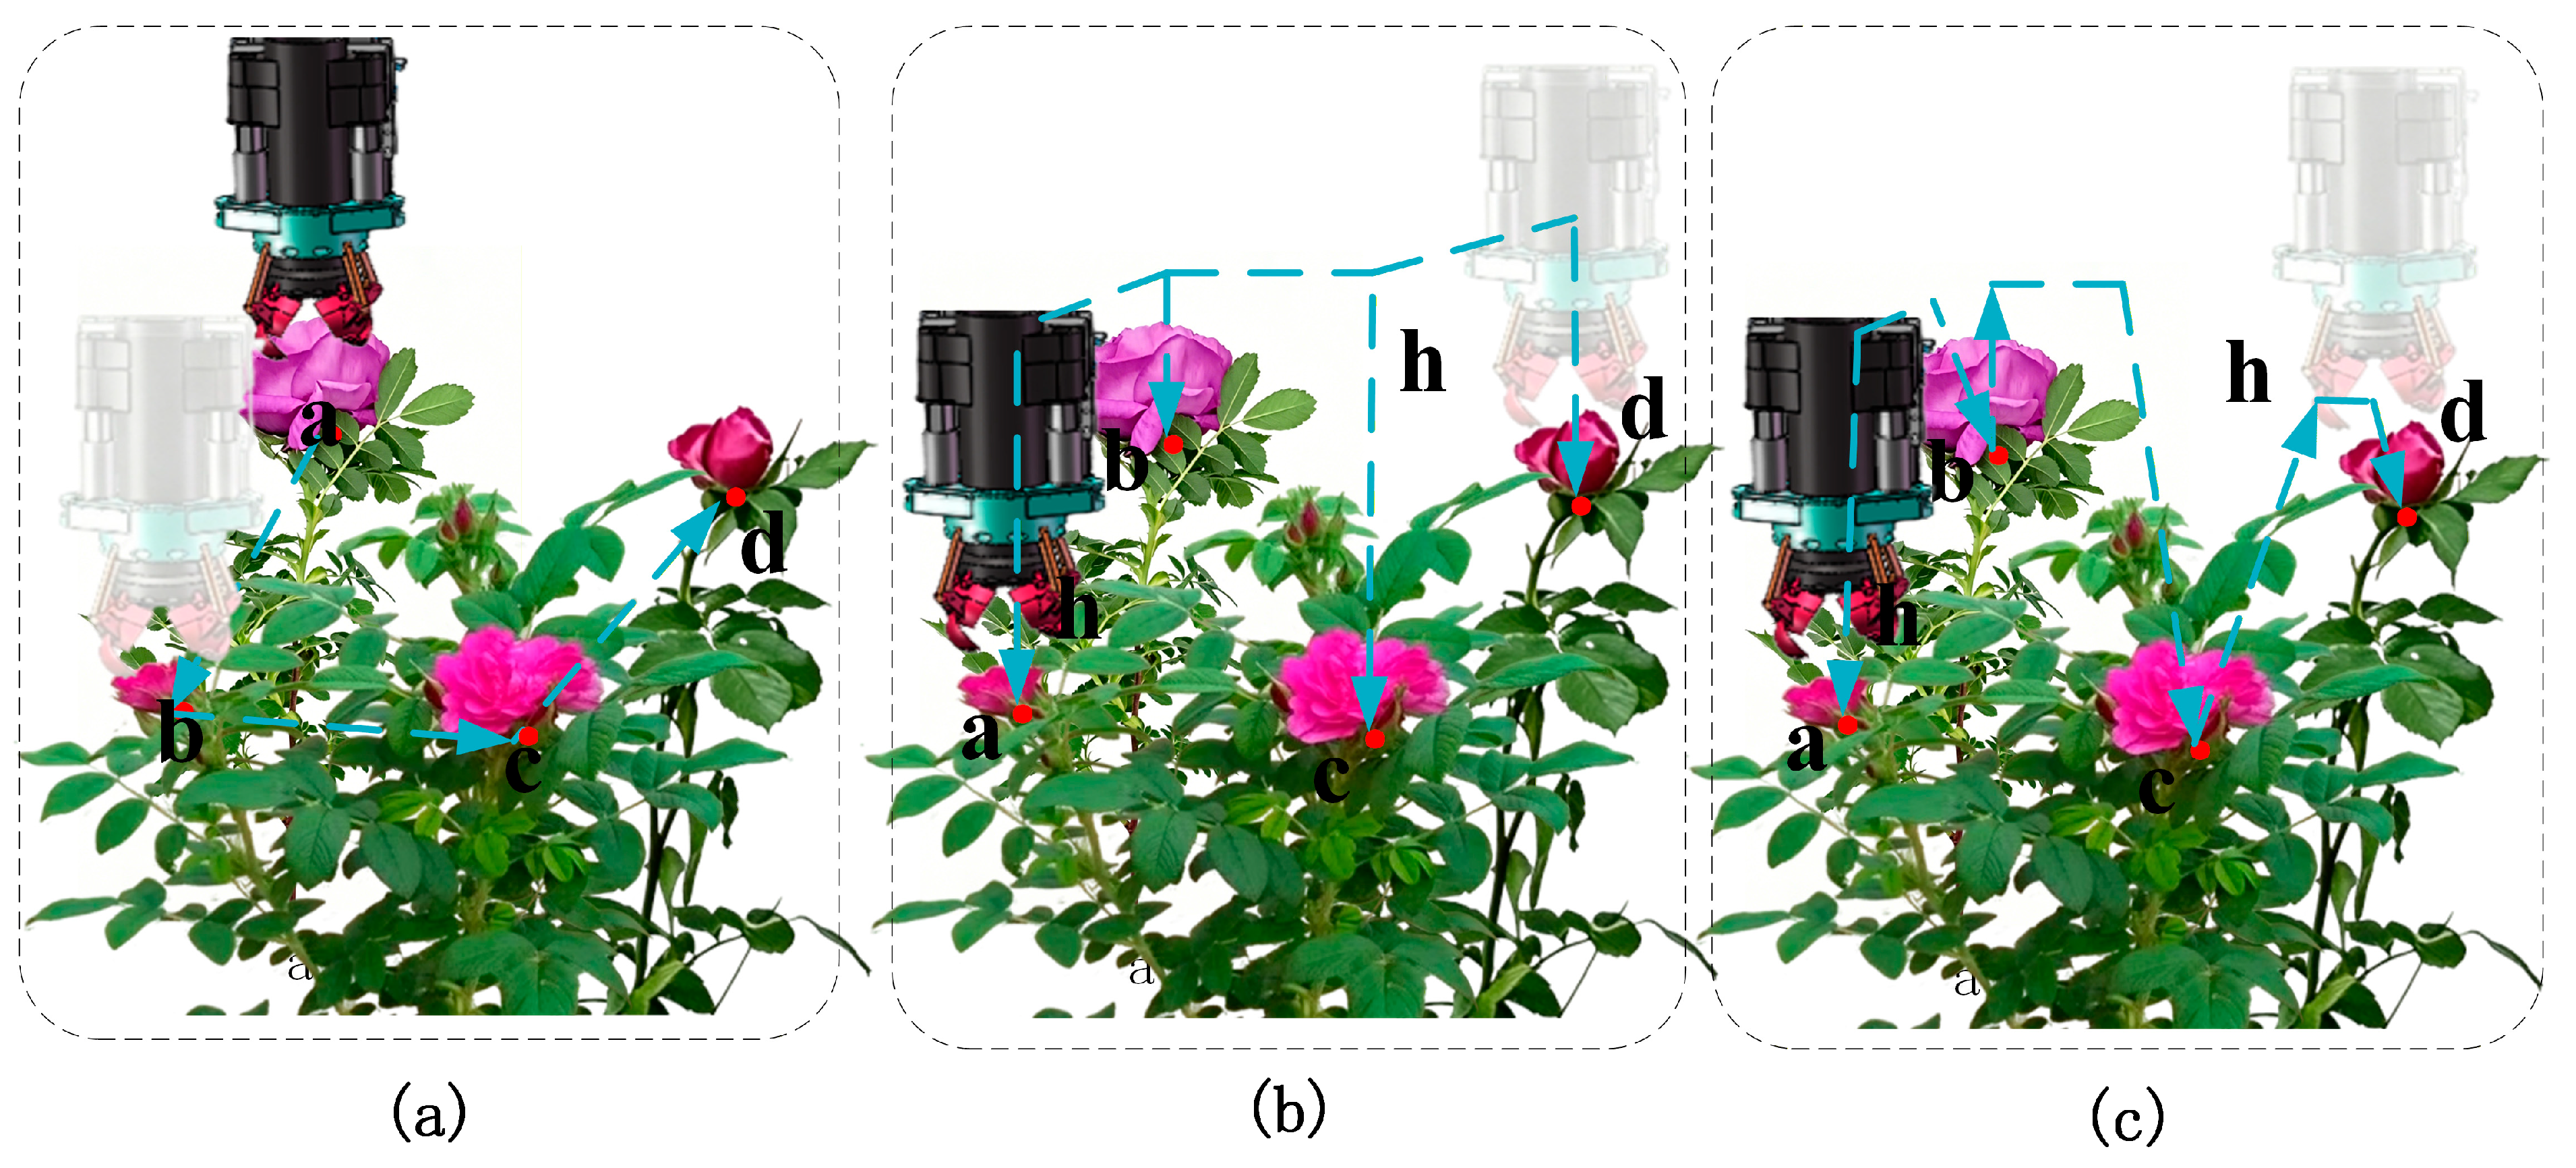
This paper builds upon the standard LKH algorithm by incorporating a multi-start greedy initial solution construction strategy, a gate-aware heuristic 2-OPT optimization, an elevation-anomaly insertion optimization, and an oblique gate-shaped distance metric, thereby constructing an improved LKH algorithm. To validate the effectiveness of the improvements, the improved LKH, the standard LKH, and the standard LKH incorporating only the oblique gate-shaped distance metric were compared in terms of optimal path length and average computation time as evaluation metrics. The results are presented in
Table 8. Across five experimental groups, the improved LKH achieved the optimal path length in all cases, with values of 7434 mm, 8418 mm, 9373 mm, 9486 mm, and 9165 mm, respectively. Compared with the standard LKH, the path lengths of the five groups were reduced by 22.6%, 25.9%, 24.0%, 24.6%, and 20.6%, with an average reduction of 23.5%. This improvement stems from the synergistic effect of two aspects: the oblique gate-shaped distance metric and the algorithmic enhancements. To disentangle their independent contributions,
Table 8 also presents the results of the standard LKH incorporating only the oblique gate-shaped distance metric without the algorithmic improvements, where the optimal path lengths were 7442 mm, 8511 mm, 9373 mm, 9490 mm, and 9212 mm, respectively, representing an average reduction of 23.25% relative to the standard LKH. This indicates that the oblique gate-shaped distance metric replaces orthogonal polylines with spatial oblique lines, thereby substantially compressing the path length from a geometric structure perspective. The improved LKH further shortens the path on this basis, reducing the path lengths by 8 mm, 93 mm, 0 mm, 4 mm, and 47 mm, respectively, compared with the standard LKH incorporating only the oblique gate-shaped distance metric, thereby validating the incremental contributions of the three algorithmic improvements: the multi-start strategy, the gate-aware heuristic optimization, and the elevation-anomaly insertion optimization.
In terms of computation time, the average time of the improved LKH was 0.0117 s, which is lower than 0.0295 s for the standard LKH and 0.0317 s for the standard LKH incorporating only the oblique gate-shaped distance metric. The reduced computation time of the improved LKH is attributed to the gate-aware heuristic 2-OPT, which employs a priority queue to focus the search on high-cost edges, thereby reducing the number of evaluations of futile exchange attempts and accelerating convergence. The standard LKH incorporating only the oblique gate-shaped distance metric exhibited a slightly higher average computation time than the standard LKH in most cases, because the computation of the oblique gate-shaped distance involves squaring and square root operations, resulting in a marginally higher per-evaluation cost compared with the linear operations of the orthogonal gate-shaped distance. Considering both path length and computation time, the improved LKH achieved optimal performance in both comparisons, validating the synergistic effect of the algorithmic and metric improvements.
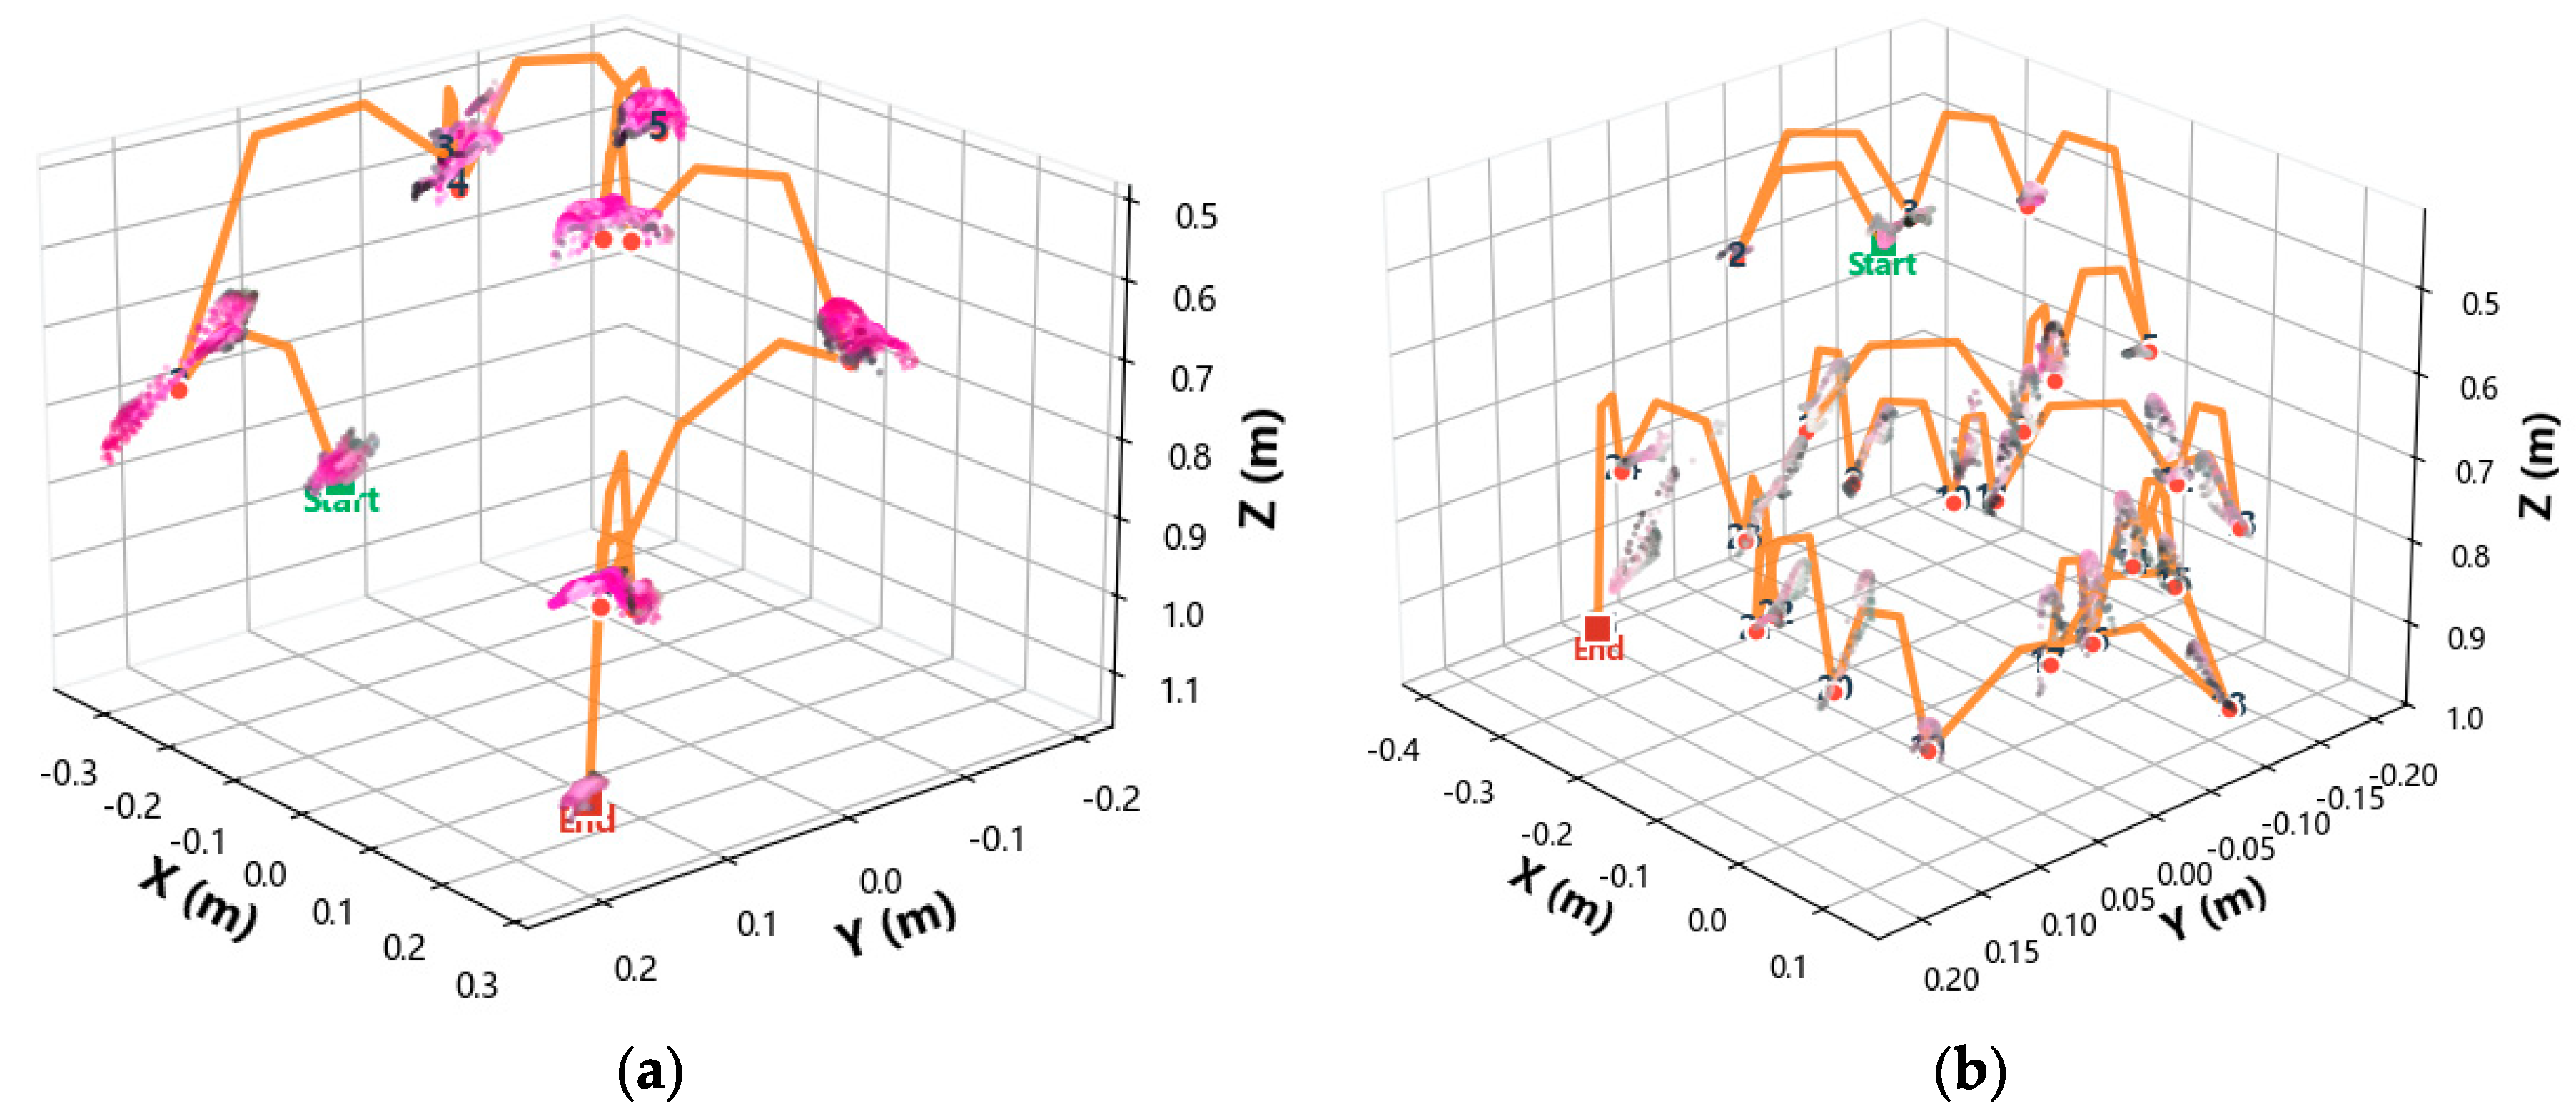
Figure 12 illustrates the path planning performance for representative flower-only and bud-only scenarios. Specifically,
Figure 12a shows the optimized path for a flower-only scenario with 11 picking points, and
Figure 12b shows the optimized path for a bud-only scenario with 25 picking points, where the end-effector follows the oblique gate-shaped trajectories between consecutive targets.
To further quantify the independent contributions of each improvement module, ablation experiments were conducted on the five picking-point density scenarios from Experiment 3, incrementally introducing the multi-start strategy, the gate-aware heuristic 2-OPT, and the elevation-anomaly insertion optimization. The results are presented in
Table 9. The baseline configuration yielded path lengths of 7442 mm, 8506 mm, 9375 mm, 9490 mm, and 9211 mm across the five experimental groups, with an average computation time of 0.0317 s. The fully improved LKH achieved path lengths of 7434 mm, 8414 mm, 9375 mm, 9486 mm, and 9164 mm in the corresponding scenarios. Except for the 29-point scenario, where the result was identical to the baseline, the other four groups exhibited reductions of 8 mm, 92 mm, 4 mm, and 47 mm, respectively, and the average computation time decreased to 0.0117 s. When the multi-start strategy was introduced alone, the path lengths in all five groups deteriorated relative to the baseline, with the degree of degradation intensifying as the number of picking points increased. This indicates that merely increasing the diversity of initial solutions without effective local search guidance fails to improve solution quality and instead introduces low-quality candidate solutions. When the gate-aware heuristic 2-OPT was further superimposed, no consistent improvement in path quality was observed. In four of the five experimental groups, the path length deteriorated further, with only the 36-point scenario showing a slight improvement of 26.31 mm. This phenomenon suggests that although the gate-aware heuristic 2-OPT concentrates the search on high-cost edges via a priority queue and achieves rapid convergence, in the absence of a global constraint in the elevation dimension, such a high concentration of search resources makes the algorithm more prone to becoming trapped in local optima. Only after the elevation-anomaly insertion optimization was introduced did the path lengths of the fully improved LKH reach or surpass the baseline level across all experimental groups. The elevation-anomaly insertion specifically rectifies the residual node elevation mismatches after 2-OPT optimization, providing the necessary global geometric constraint for the preceding two modules. This enables the search breadth of the multi-start strategy and the search efficiency of the gate-aware heuristic 2-OPT to synergistically contribute in the correct direction, revealing a strong coupling and complementary relationship among the three modules.
In terms of computation time, the multi-start strategy and the gate-aware heuristic 2-OPT had already substantially compressed the time from 0.0317 s in the baseline configuration, validating the efficiency advantage of greedy initial solution construction and priority-queue-directed search. The elevation-anomaly insertion caused a slight rebound in computation time, with the average time rising from approximately 0.005 s in the intermediate configuration to 0.0117 s in the full configuration, but it remained considerably lower than that of the baseline, indicating that its computational overhead is manageable. Considering both path length and computation time, the three modules achieve an optimal balance only when they work in concert; neither individual nor partial combinations can substitute for the comprehensive performance of the full configuration.
To intuitively evaluate the performance of the proposed OG-LKH algorithm on edge computing devices, we deployed it on the NVIDIA Jetson Orin and compared its performance with that on a standard PC platform. The results of the five groups of picking sequence optimization experiments are shown in
Table 10. In terms of path quality, the optimal path lengths obtained on both platforms were essentially identical, with a maximum difference of only 13 mm, indicating that the limited computational resources of the embedded platform did not significantly affect the optimization quality of OG-LKH, and that the multi-start strategy and gate-perception heuristic search can still converge effectively under resource-constrained conditions. In terms of computation time, the average time on the Jetson Orin was 0.0330 s, which is approximately 2.8 times that on the PC platform (0.0117 s). Even at the largest scale (36 picking points), the time on the Jetson Orin was only 0.0387 s, fully meeting the real-time requirements of path planning for harvesting operations. Although the computation time on both platforms generally increased with the number of picking points, slight fluctuations were observed at the largest scale, which may be attributed to variations in the convergence speed of the heuristic search under different spatial distributions of picking points. The experimental results demonstrate that the OG-LKH algorithm possesses good adaptability to embedded computing platforms, as it can complete picking sequence planning with low inference latency while ensuring path quality, thus providing feasibility support for its practical deployment on field harvesting robots.
4. Discussion
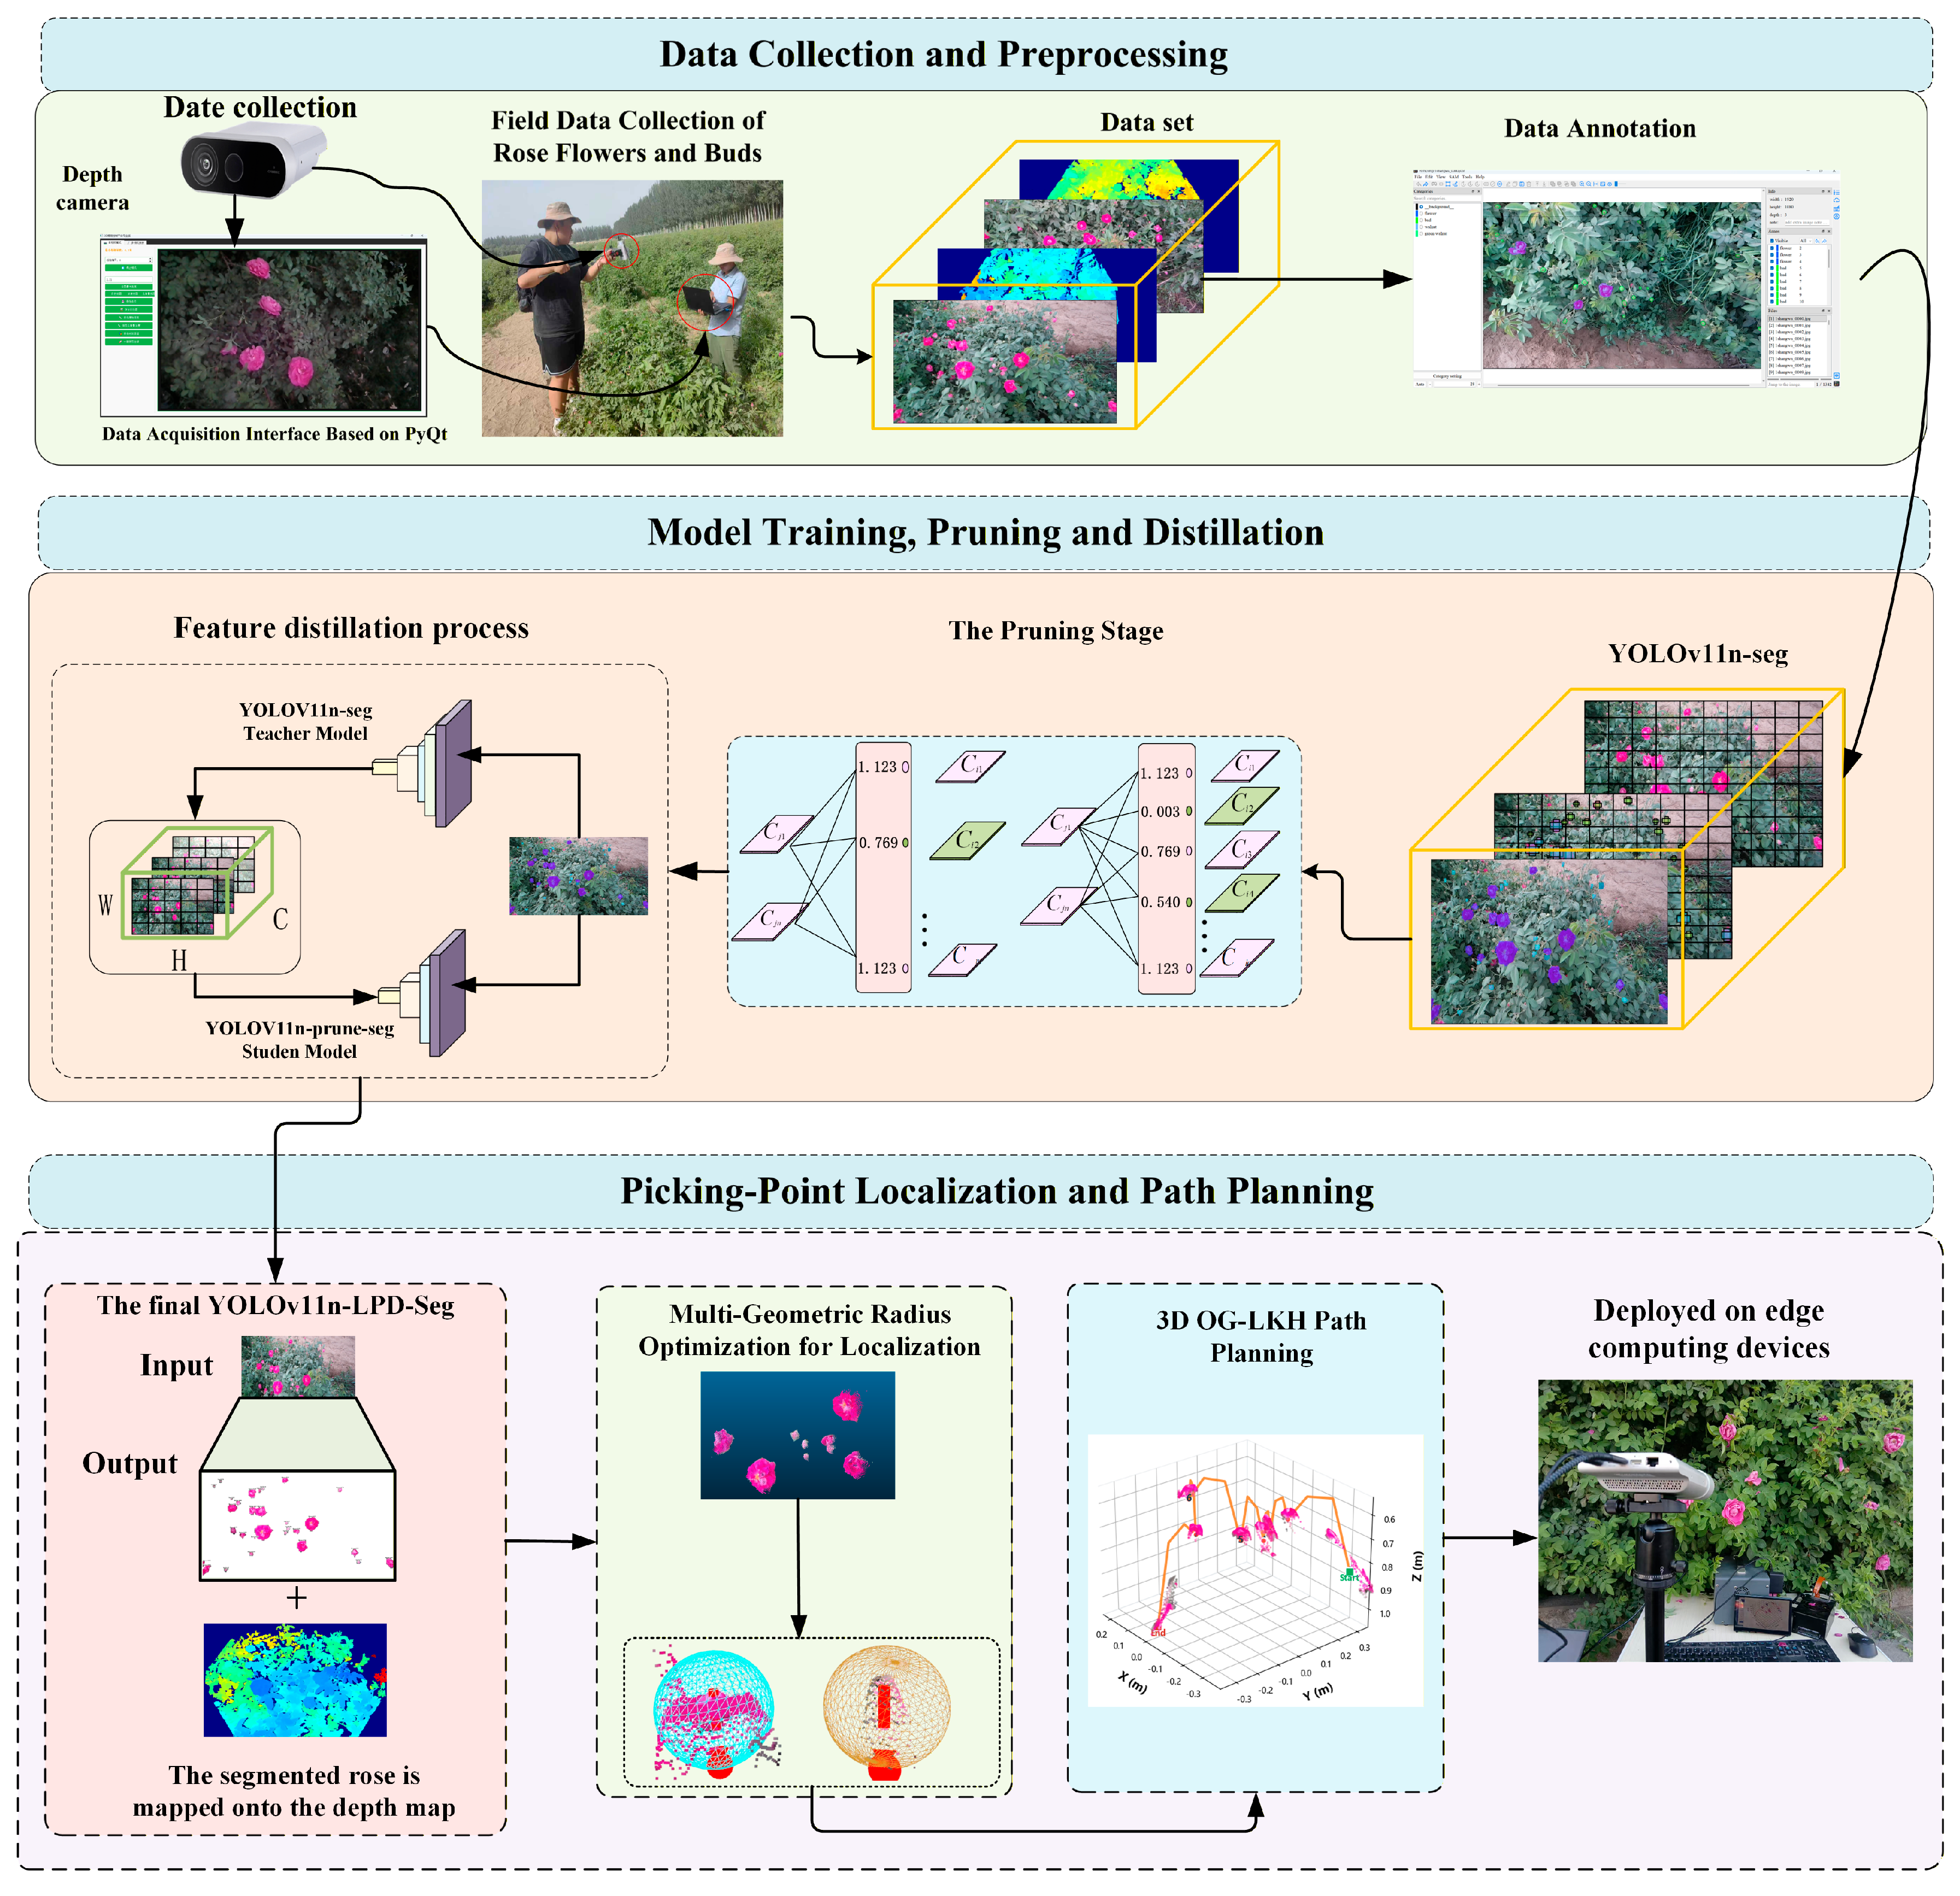
The main innovation of this paper is a continuous harvesting method for rose flowers and buds, termed L-SOP. This method integrates the lightweight YOLOv11n-LPD-Seg rose segmentation model, the MGRO-Loc picking-point localization and pose estimation algorithm based on multi-geometric constraint fusion, and the OG-LKH oblique gate-shaped trajectory path planning algorithm. We systematically evaluated the feasibility of the segmentation model, picking-point localization, and path planning algorithm. In terms of model lightweighting, pruning and distillation substantially reduced the model complexity, achieving substantial model compression and computational reduction. Compared with Rose_YOLO [
17], our YOLOv11n-LPD-Seg offers three main advantages: data acquisition, model lightweighting, and path planning. In terms of data acquisition, we used a depth camera rather than a smartphone, as in [
17], providing depth information that better simulates real harvesting conditions. In terms of model lightweighting, we first compress the model via pruning and then restore accuracy through feature distillation, achieving minimal accuracy loss. Meanwhile, our model size (2.4 MB) is smaller than that of Rose_YOLO (3.19 MB), and our compression ratio (60.7%) exceeds theirs (46%). In terms of path planning, unlike the two-dimensional path planning method in [
17], our OG-LKH incorporates a three-dimensional oblique gate-shaped trajectory, which is more practical for real-world harvesting tasks. The above results indicate that the L-SOP method achieves a favorable balance among the three core components: model lightweighting, precise picking-point localization, and real-time path planning. This method significantly reduces the computational burden of the model while maintaining high-precision spatial perception capability, and completes planning with millisecond-level latency on edge computing devices, verifying its feasibility for precise, efficient, and continuous harvesting in field with limited computational resources.
We further compared our method with MWG-YOLO [
22], a lightweight rose detection model deployed on the NVIDIA Jetson platform. Peng et al. [
22] reported an mAP50 of 92.3% and a detection speed of 44.2 FPS after TensorRT acceleration on the Jetson Orin NX platform, with a model size of 17.3 MB. By contrast, YOLOv11n-LPD-Seg achieved an inference speed of 14.1 FPS and a latency of 71.0 ms on the Jetson Orin Nano platform under native PyTorch inference, without TensorRT acceleration. Although its FPS is lower than that of MWG-YOLO, this difference can be reasonably explained by three factors. First, our model performs instance segmentation rather than object detection, producing pixel-level masks for flowers and buds, which introduces substantially greater computational overhead per inference. Second, our evaluation was conducted using native PyTorch inference, whereas MWG-YOLO used TensorRT engine acceleration. Third, the Jetson Orin NX platform adopted in [
22] provides higher computational capacity than the Jetson Orin Nano used in our experiments. Notably, despite the lower FPS, YOLOv11n-LPD-Seg has a much smaller model size than MWG-YOLO (2.4 MB vs. 17.3 MB) and requires fewer computations (6.8 GFLOPs vs. 13.3 GFLOPs), while addressing the more challenging task of instance segmentation. Compared with the baseline YOLOv11n-seg, the proposed pruned and distilled model reduces the model size by 60.7% (from 6.1 MB to 2.4 MB), decreases the computational cost by 33.3% (from 10.2 to 6.8 GFLOPs), increases the inference speed from 11.7 FPS to 14.1 FPS, and reduces the latency from 85.1 ms to 71.0 ms. These results demonstrate that the proposed pruning-and-distillation pipeline achieves a favorable balance between model compactness and segmentation performance. Further improvements in inference speed are expected through TensorRT deployment in future work.
Although the proposed method achieves promising performance in model lightweighting, picking-point localization, and path planning, several limitations should be acknowledged. First, the method was developed and evaluated exclusively on the Hotan rose variety cultivated in the Xinjiang region. The morphological characteristics of Hotan roses—such as terminal-flowering habit, circular corolla contour from the top-down view, and the distinction between fully bloomed flowers and buds—may differ from those of other rose varieties or other flower crops. Therefore, the generalization of the model to other varieties, cultivation conditions, or geographical environments remains untested, and the pruning strategy and picking-point localization algorithm may not directly transfer to species with substantially different morphologies. Second, the overall algorithm has not yet been experimentally validated on an actual harvesting robotic arm. The current work primarily involves the separate design and evaluation of each module at the algorithmic level. When integrated and deployed in real field operating environments, it will still face challenges from complex real-world field conditions such as plant disturbance and occlusion interference from branches and leaves. Furthermore, transitioning from path planning results to the completion of physical harvesting actions also involves engineering issues such as hand-eye calibration accuracy, end-effector control latency, and real-time response of safety obstacle avoidance strategies. In the future, we plan to collect data from multiple rose varieties and regions to enhance the robustness and generalization of the L-SOP framework. We also plan to deploy the entire framework onto an actual harvesting robotic arm, examine its feasibility and robustness under real operating conditions through field experiments, and iteratively optimize each component based on practical testing feedback, thereby advancing the method from algorithmic research toward practical application.
5. Conclusions
This paper addresses the insufficient deep integration among lightweight rose recognition, picking point localization, and path planning by proposing L-SOP, a continuous harvesting method for rose flowers and buds. For segmentation, we develop a lightweight YOLOv11n-LPD-Seg model using a combined strategy of global pruning and feature distillation. Compared with the baseline, this reduces the model size from 6.1 MB to 2.4 MB (a 60.7% decrease) and lowers the computational cost from 10.2 GFLOPs to 6.8 GFLOPs (a 33.3% decrease), while notably, the mAP@0.5 for flowers and buds is not only preserved but slightly improved, achieving a favorable trade-off between accuracy and efficiency. For picking point localization, we propose the MGRO-Loc algorithm, which achieves a mean absolute error of 2.33 mm, a root mean square error of 3.39 mm, and a maximum error of 10.79 mm in indoor environments; the corresponding outdoor values are 2.84 mm, 3.27 mm, and 8.39 mm, respectively. For path planning, we introduce the OG-LKH algorithm, which incorporates an oblique gate-shaped distance metric and algorithmic enhancements. In five experiments, it reduces the average path length by 23.5% compared with standard LKH, while reducing the computation time to 0.0117 s, demonstrating marked improvements in planning efficiency. When deployed on the Jetson Orin, the optimization quality of OG-LKH remains essentially on par with that on a PC platform. Although the average computation time on the edge device increases to 0.0330 s, it reaches only 0.0387 s even when handling the maximum of 36 picking points, confirming that the algorithm can effectively balance optimization quality and real-time performance under resource-constrained conditions. Overall, this study provides a solid technical foundation and practical guidance for the autonomous harvesting of Hotan rose flower and bud.