Article

Foliar Magnesium Application Modulates Growth and Physiological Responses of Soursop and Custard Apple Under Salt Stress


by
Rita de Cássia do Nascimento Medeiros-Sá
1,
Paulo Cássio Alves Linhares
1,
Gabriel Sidharta dos Santos Rego
1,
Luan Cordeiro de Souza Barbosa
1,
Diogo Santos Cavalcante
1,
Viviane Silva Martins
1,
Ana Paula de Souza Ferreira
1,
Edivan da Silva Nunes Júnior
1,
Alex Álvares da Silva
1,
Agda Malany Forte de Oliveira
1,
Tayd Dayvison Custódio Peixoto
2,
Kleane Targino de Oliveira Pereira
3,
Miguel Ferreira Neto
3,
Salvador Barros Torres
3 and
Francisco Vanies da Silva Sá
1,*
1
Department of Agrarian and Exact, Universidade Estadual da Paraíba, Catolé do Rocha 58884-000, PB, Brazil
2
Center of Agrarian and Biological Sciences, Universidade Estadual Vale do Acaraú, São Benedito 62370-000, CE, Brazil
3
Department of Agronomic and Forest Sciences, Universidade Federal Rural do Semi-Árido, Mossoró 59625-900, RN, Brazil
*
Author to whom correspondence should be addressed.
Agronomy 2026, 16(17), 1734; https://doi.org/10.3390/agronomy16171734 (registering DOI)
Submission received: 15 May 2026 / Revised: 26 August 2026 / Accepted: 28 August 2026 / Published: 5 September 2026

Abstract

Salt stress significantly limits the growth of Annonaceae species in tropical regions. This research aimed to test foliar Mg applications to alleviate the effects of salt stress on the growth and physiology of Annonaceae species. Two simultaneous experiments were conducted in a randomized block design in a 2 × 3 factorial scheme (n = 4). The factors were: two levels of control water salinity (0.5 and 2.5 dS m−1), three doses of foliar Mg (0, 1, and 2 mL L−1), and four replicates. A salinity of 2.5 dS m−1 reduced growth in both species. However, Mg supplementation effectively mitigated these deleterious effects. In Soursop (Annona muricata L.), 1 mL L−1 of Mg increased salt tolerance, enhancing carboxylation efficiency and total dry mass by approximately 33% and 44%, respectively, compared with 0 Mg under saline conditions. For custard apple (Annona squamosa L.), a dose of 2 mL L−1 yielded the best results, maintaining higher water use efficiency (17.67%), intrinsic water use efficiency (18.51%), and total chlorophyll content (32.27%) compared with plants receiving 0 Mg under saline conditions. Foliar supplementation with Mg is a viable strategy to alleviate saline stress in Annonaceae, with A. muricata requiring 1 mL L−1 and A. squamosa 2 mL L−1 to optimize physiological performance and biomass production at 2.5 dS m−1.

1. Introduction

The Soursop (Annona muricata L.) and the custard apple (Annona squamosa L.), both from the Annonaceae family, are tropical fruit species of increasing agronomic and socioeconomic importance, particularly in regions where fruit production represents an important source of income for small and medium-sized growers [1,2]. In Brazil, these Annonaceae plants have attracted the interest of fruit growers for cultivation because, in addition to their organoleptic characteristics, they have medicinal value, pharmaceutical properties and potential as insecticides [3,4,5].
Soursop is an evergreen tropical fruit tree characterized by a branched canopy, relatively large and shiny leaves, and large fruits containing white, aromatic, sweet-acid pulp that is consumed fresh or processed into pulp, juices, nectars, and other products [3,4]. In northeastern Brazil, warm temperatures and high solar radiation favor soursop cultivation, although plant establishment and growth depend on the adequate management of water and mineral nutrients [6,7]. Because rainfall is irregular and atmospheric evaporative demand is high in the semi-arid region, soursop production frequently depends on irrigation, making both water availability and irrigation-water quality important determinants of gas exchange, nutrient uptake, and biomass accumulation [7,8,9].
Custard apple is a small and highly branched tropical fruit tree that produces segmented fruits with sweet, aromatic pulp predominantly intended for fresh consumption [4,5,6]. The species is cultivated in northeastern Brazil because the regional warm temperatures and high solar radiation are favorable for its growth [6]. Nevertheless, successful seedling establishment requires adequate water and mineral nutrition because limitations in these resources can restrict leaf formation, photosynthetic activity, and biomass production [6,8]. Under semi-arid conditions, irrigation-water quality is particularly important because excessive salt concentrations can reduce water and nutrient uptake during the early stages of plant development [6,8,9].
However, water resources in arid and semi-arid environments contain elevated levels of salts that can increase the electrical conductivity of the soil solution [10,11]. Therefore, producers in this region are restricted from using this saline water. High salt concentrations can restrict nutrient absorption, interfere with plant development, and reduce yields to uneconomical levels due to the increased osmotic potential [2,9]. When soluble salts accumulate in the soil solution, especially Na+ and Cl, plant growth is impaired. This occurs due to osmotic stress from lowered osmotic potential, nutrient imbalance caused by excessive ion concentrations, competition from sodium that restricts the uptake of other cations, and the toxic effects of sodium and chloride [6,7,12].
In this context, soursop and custard apple plants are directly affected by soil-solution salinity [6,7,13]. Irrigation with saline water can compromise plant metabolic and biochemical activities, inhibiting growth and productivity by reducing stomatal conductance, photosynthesis, protein synthesis, enzymatic activities, and causing chlorophyll degradation [2,6,14].
One alternative to improve plant productivity under abiotic stress is the use of agricultural practices, such as applying mineral nutrients. Among mineral nutrients, magnesium (Mg) is one of the most important, as it directly affects plant physiology and CO2 assimilation, being a constituent of the chlorophyll molecule [15,16,17]. Mg is fundamental to the activation of several photosynthetic enzymes, as it is a cofactor in the formation of Mg-ATP, which is involved in sugar production and translocation, which is important in the plant’s source–sink relationship [16,18,19]. Therefore, this element plays a crucial role in plant metabolism, with potential to mitigate abiotic stress by maintaining vital plant functions such as enzyme activation, carbohydrate metabolism, gas exchange, pigment production, and, consequently, biomass partitioning [20,21,22].
However, despite the economic importance of soursop and custard apple in Brazilian semi-arid region, information on how magnesium modulates the physiological responses of these species under saline stress remains scarce, making it difficult to recommend doses that optimize salt tolerance. Thus, the hypothesis is that foliar magnesium application can mitigate the deleterious effects of salinity in Annonaceae plants by regulating sugar production and translocation, thereby maintaining the source–sink relationship. Accordingly, we sought to evaluate how varying foliar magnesium doses affect soursop and custard apple plants under salt stress, focusing on morphological and physiological indicators of salinity tolerance.

2. Materials and Methods

2.1. Characterization of the Experimental Area

Two independent experiments were carried out between July and October 2024 under semi-field greenhouse conditions at Campus IV of the State University of Paraíba (UEPB), Catolé do Rocha, Paraíba, Brazil (6°20′38″ S, 37°44′48″ W; 275 m a.s.l.). The local climate is classified as BSh under the Köppen classification, corresponding to an arid climate with rainfall concentrated from late summer to early autumn [23].
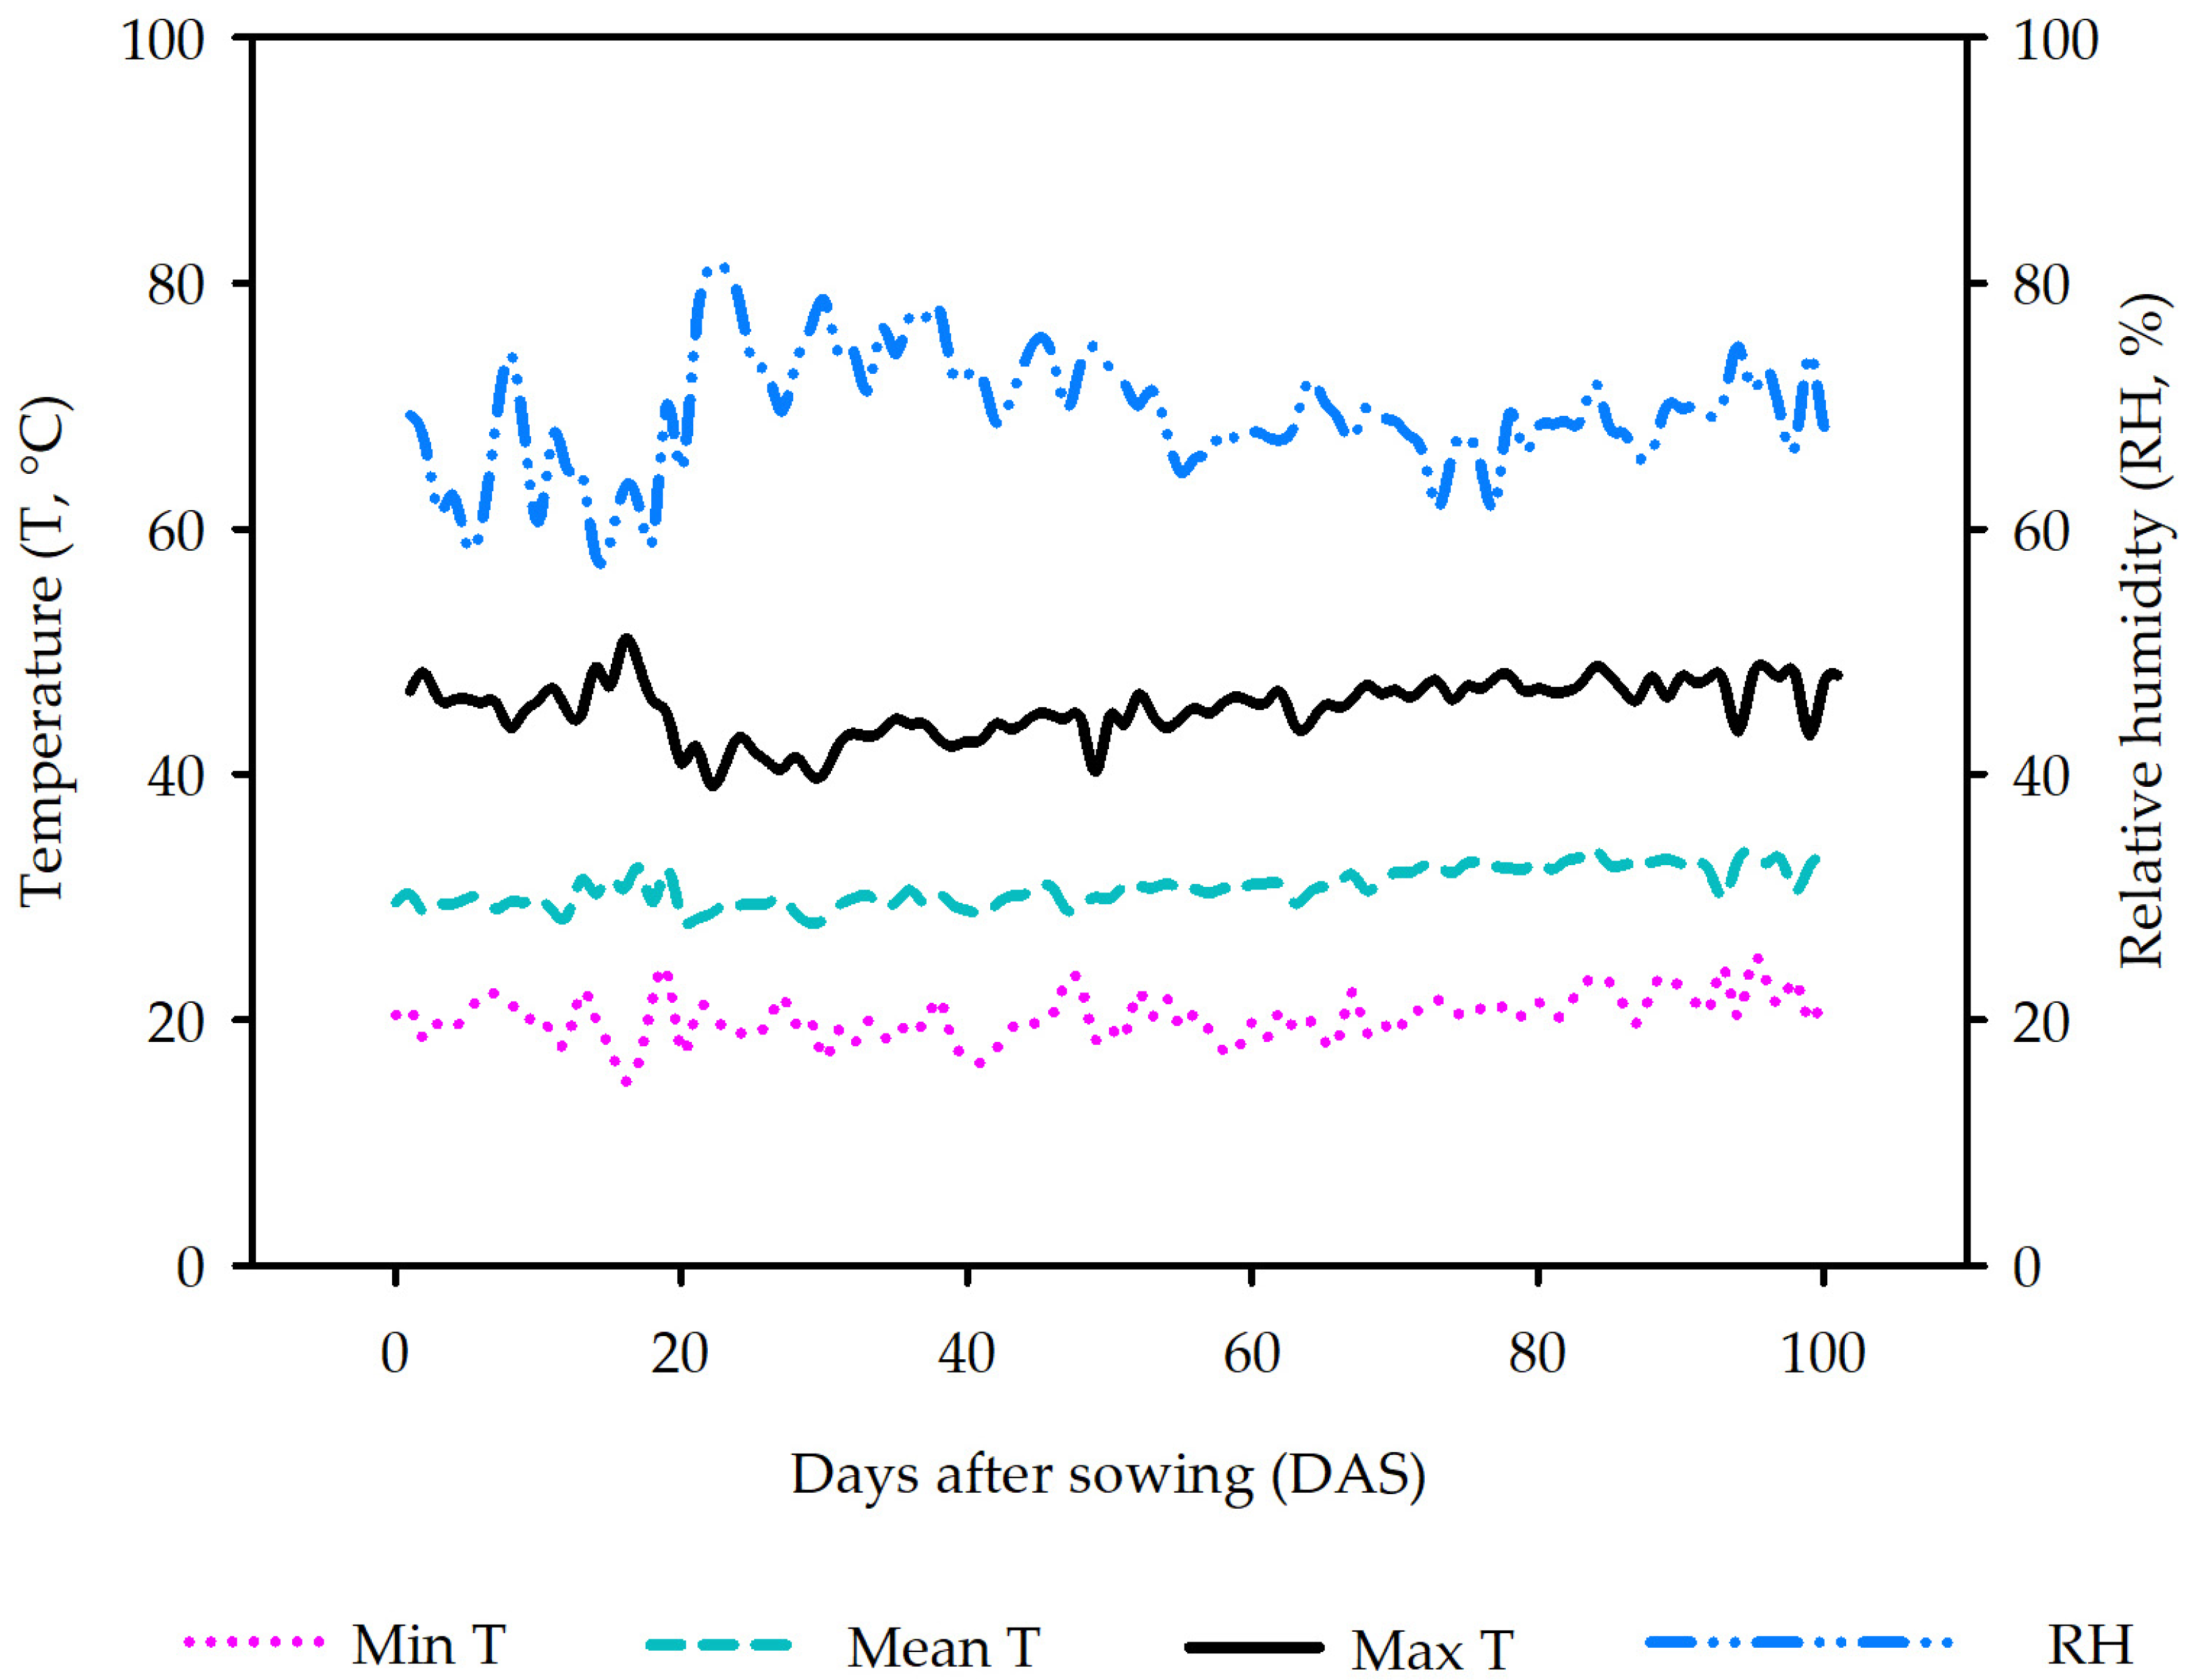
Greenhouse temperature and relative humidity were continuously monitored throughout the experimental period using an RC-51H digital thermohygrometer equipped with a datalogger (Elitech®, Canoas, Brazil). Air temperature ranged from 20.79 to 45.34 °C, with a mean of 30.78 °C, whereas the mean relative humidity was 69.43% (Figure 1).

2.2. Experimental Design and Treatments

Separate experiments were conducted concurrently for soursop (Annona muricata L.) and custard apple (Annona squamosa L.). The two experiments were set up using a randomized block layout in a 2 × 3 factorial arrangement, with four replicates, each comprising two plants (experimental unit). The first factor corresponded to two levels of salinity in the irrigation water (0.5 and 2.5 dS m−1): 2.5 dS m−1 was selected as an intermediate salinity treatment within the range previously evaluated for A. muricata and A. squamosa, representing a moderate restriction on irrigation-water use for both crops [6,7,9,10,11,13,14]. In contrast, the second factor corresponded to three foliar-spray doses of magnesium (0 mL L−1, 1 mL L−1, and 2 mL L−1).

2.3. Experimental Conduct

Seeds of both Annonaceae species were obtained from local commercial sources and sown in polyethylene containers filled with 2 dm3 of soil. Four seeds were placed in each container. At 32 days after sowing (DAS), after germination, the seedlings were thinned to retain a single plant per container.
The substrate consisted of a Fluvisol obtained from an anthropized site within the experimental farm of UEPB Campus IV. Soil was sampled at a depth of 0–0.30 m, air-disaggregated, passed through a 4 mm mesh, and characterized according to EMBRAPA analytical procedures [24]. Its chemical properties were pH(H2O) = 6.50, pH(CaCl2) = 5.30, organic matter = 9.70%, p = 156.80 mg dm−3, K+ = 243.60 mg dm−3, Na+ = 25.30 mg dm−3, Ca2+ = 5.78 cmolc dm−3, Mg2+ = 0.95 cmolc dm−3, Al3+ = 0.00 cmolc dm−3, and H + Al = 1.20 cmolc dm−3. Cation-exchange capacity and base saturation were 7.44 cmolc dm−3 and 86%, respectively, whereas exchangeable sodium percentage was 1.30%. The saturation-extract electrical conductivity was 0.35 dS m−1, and bulk density was 1.53 kg dm−3. Particle-size distribution consisted of 691.82, 192.57, and 115.60 g kg−1 of sand, silt, and clay, respectively.
Based on the soil analysis results, macronutrient fertilization was carried out in four applications, corresponding to 25% of the total dose, applied in conjunction with irrigation at 35, 55, 75, and 95 days after sowing. The following amounts were applied: 50 mg of N, 127 mg of P2O5, 75 mg of K2O, 29 mg of Ca, 18 mg of Mg, and 30 mg of SO4− per dm−3 of soil, considering a soil layer of 0–0.20 m; these amounts correspond to nutrient application rates of 100 kg N ha−1, 254 kg P2O5 ha−1, 150 kg K2O ha−1, 58 kg Ca ha−1, 36 kg Mg ha−1, and 60 kg SO42− ha−1, respectively, as recommended by the research laboratory [25]. The nutrient sources were: monoammonium phosphate (MAP), calcium nitrate (Ca(NO3)2), magnesium sulfate (MgSO4), potassium sulfate (K2SO4), and potassium chloride (KCl). Micronutrient fertilization was carried out via foliar application using Liqui-Plex Fruit® (Micronutrients were applied at 90 and 105 DAS by spraying 3 mL L−1 of Liqui-Plex Fruit® (Alltech, Maringá, Brazil), following the manufacturer’s recommendations. The formulation contained, in g L−1, 73.50 N, 14.70 Ca, 77.91 S, 14.70 B, 0.74 Cu, 73.50 Mn, 1.47 Mo, and 73.50 Zn, in addition to 2.35% organic carbon.
Foliar Mg was supplied as FORPLANT® (Jaboticabal, Brazil), a commercial formulation containing 8% Mg as MgSO4 and having a density of 1.30 g mL−1. Each seedling received 25 mL of the respective treatment solution [26], divided equally between applications at 50 and 80 DAS (12.5 mL plant−1 per application). Spraying was performed with a manual fine-mist sprayer. During treatment application, plants were temporarily separated by Mg concentration and kept apart from the remaining experimental units until the leaf surfaces had dried, thereby minimizing spray drift and cross-contamination.
The baseline irrigation treatment used low-salinity water with an ECw = 0.5 dS m−1, pumped from a shallow well. To formulate brackish water treatment (ECw = 2.5 dS m−1), a 90 L stock solution was prepared by adding NaCl and CaCl2 to the control water. 2H2O, and MgCl2.6H2O mixed in a 7:2:1 equivalent proportion. This chemical ratio reflects the predominant ionic composition found in the natural aquifers exploited for irrigation across northeastern Brazil [27]. The preparation followed the empirical rule correlating electrical conductivity (EC) with total ionic concentration (mmolc L−1 = EC × 10), in accordance with [28]. Routine monitoring of the water’s electrical conductivity was performed utilizing a portable digital conductivity meter (Akso Ak51, Akso Produtos Eletrônicos, São Leopoldo, Brazil).
Water with an electrical conductivity (ECw) of 0.5 dS m−1, obtained from a shal-low well, was used for the low-salinity treatment. The 2.5 dS m−1 solution was prepared in 90 L batches by dissolving NaCl, CaCl2·2H2O, and MgCl2·6H2O in the low-salinity water at a 7:2:1 equivalent ratio. This ionic ratio is representative of the composition commonly reported for irrigation water sources in northeastern Brazil [27]. Salt quan-tities were established from the relationship between EC and ionic concentration (mmolc L−1 = EC × 10) [28]. ECw was checked with an Akso Ak51 portable conductivity meter (Akso Produtos Eletrônicos, Brazil).
Before treatment establishment, the substrate was irrigated until the moisture approached its maximum water-retention capacity. Subsequent irrigation was performed at 2-day intervals according to water losses estimated by drainage lysimetry. A 15% leaching fraction (LF) was incorporated at 30-day intervals to limit salt accumulation. Irrigation volume per plant (Va) was estimated as the difference between the previously supplied volume (La) and the mean drainage volume (D), based on measurements from four representative plants. It was corrected for the adopted LF according to Equation (1).
V a = L a D   n 1 L F
The total volume of water applied per plant was 4.52 L, corresponding to the application of 1.45 g of salts for plants irrigated with supply water (0.5 dS m−1) and 10.13 g of salts for plants irrigated with salinized water (2.5 dS m−1). At 80 DAS, an additional leaching fraction (15%) was applied, and the drained volume was collected to determine the electrical conductivity of the drainage water (ECd) using a benchtop conductivity meter. Values were expressed in dS m−1 and adjusted to a temperature of 25 °C. The electrical conductivity of the saturation extract (ECse) (Table 1) was determined using Equation (2), proposed by [29] for medium-textured soils.
E C e s = E C d 2

2.4. Variables Analyzed

All morphological, physiological, and biomass measurements were performed on four plants per treatment, with one plant selected from each of the four experimental replicates (n = 4). Gas exchange measurements were performed at 92 DAS between 06:30 and 10:30 h, following, with adaptations, an early-morning protocol previously used for soursop under semi-arid conditions [2]. One healthy and fully expanded leaf from the upper canopy of each selected plant was evaluated with a CIRAS-3 open-flow infrared gas analyzer (PP Systems, Amesbury, MA, USA). During measurements, the chamber was maintained at 25 °C, photosynthetic photon flux density at 1200 μmol m−2 s−1, and airflow at 400 mL min−1, while CO2 was maintained at ambient concentration. The instrument provided net CO2 assimilation rate (A, μmol m−2 s−1), stomatal conductance (gs, mol m−2 s−1), transpiration rate (E, mmol m−2 s−1), and internal CO2 concentration (Ci, μmol mol−1). From these measurements, water use efficiency (WUE = A/E), intrinsic water use efficiency (WUEi = A/gs), and instantaneous carboxylation efficiency (A/Ci) were derived [12,30].
Immediately after gas-exchange measurements, chlorophyll indices were determined on the same leaf using a Chlorofilog CFL 1030 portable meter (Falker, Brazil). The sensor operates at 635 and 660 nm in the red region and at 880 nm in the near-infrared region. Chlorophyll a (Chl a), chlorophyll b (Chl b), and total chlorophyll (Chl t) were expressed as Falker Chlorophyll Index (FCI) values [31].
Growth was assessed at 96 DAS. Plant height (PH, cm) was recorded from the plant collar to the apical meristem with a graduated ruler. Stem diameter (SD, mm) was measured 1 cm above the substrate with a digital caliper. Number of leaves (NL) was determined by counting fully expanded green leaves.
At harvest, each evaluated seedling was separated into shoots and roots. Plant fractions were placed separately in Kraft paper bags and dried at 65 °C in a forced-air oven until mass stabilization. Samples were then weighed to 0.0001 g precision to determine shoot dry mass (SDM) and root dry mass (RDM). Total dry mass was obtained as TDM = SDM + RDM, and biomass partitioning was expressed as the root-to-shoot ratio (RSR = RDM/SDM). SDM, RDM, and TDM were subsequently used to calculate the salinity tolerance index (STI) according to Equation (3).
S T I   % = D M   p r o d u c t i o n   u n d e r   s a l i n i t y D M   p r o d u c t i o n   i n   c o n t r o l × 100

2.5. Statistical Analysis

The assumptions underlying parametric analysis were assessed before ANOVA. Homogeneity of variance was examined using Levene’s and Bartlett’s tests, while residual normality was evaluated with the Shapiro–Wilk test, with p ≥ 0.05 adopted as the acceptance criterion. These diagnostic procedures were implemented in R using the car package [32].
Square-root transformation (√x) was initially applied to variables departing from normality, specifically NL for A. muricata and SD for A. squamosa. After transformation, NL and TDM in A. muricata, and NL, Chl a, RDM, SDM, and TDM in A. squamosa still failed to satisfy the normality criterion. These variables were therefore analyzed using the Kruskal–Wallis test, followed by Dunn’s multiple-comparison procedure with Bonferroni adjustment, implemented through the PMCMRplus [33] and FSA [34] packages.
Variables that met the assumptions for parametric analysis were analyzed using analysis of variance, with the significance of experimental factors evaluated by the F-test at p ≤ 0.05. Significant treatment effects were subsequently separated using Tukey’s test (p ≤ 0.05) in SISVAR® version 5.8 [35].
Associations among measured traits were examined by correlation analysis and visualized using the corrplot package [36]. Multivariate response patterns were additionally explored through a heatmap based on Euclidean distances, generated with the FactoMineR, factoextra, cluster, ggpubr, and pheatmap packages [37,38,39] in RStudio version 2025.09.1. Graphical representations of growth, gas exchange, chlorophyll, and biomass responses were generated using LabPlot® version 2.11.1 [40].

3. Results

3.1. Annona muricata L. Seedlings Under Salinity and Supplementation with Foliar Magnesium

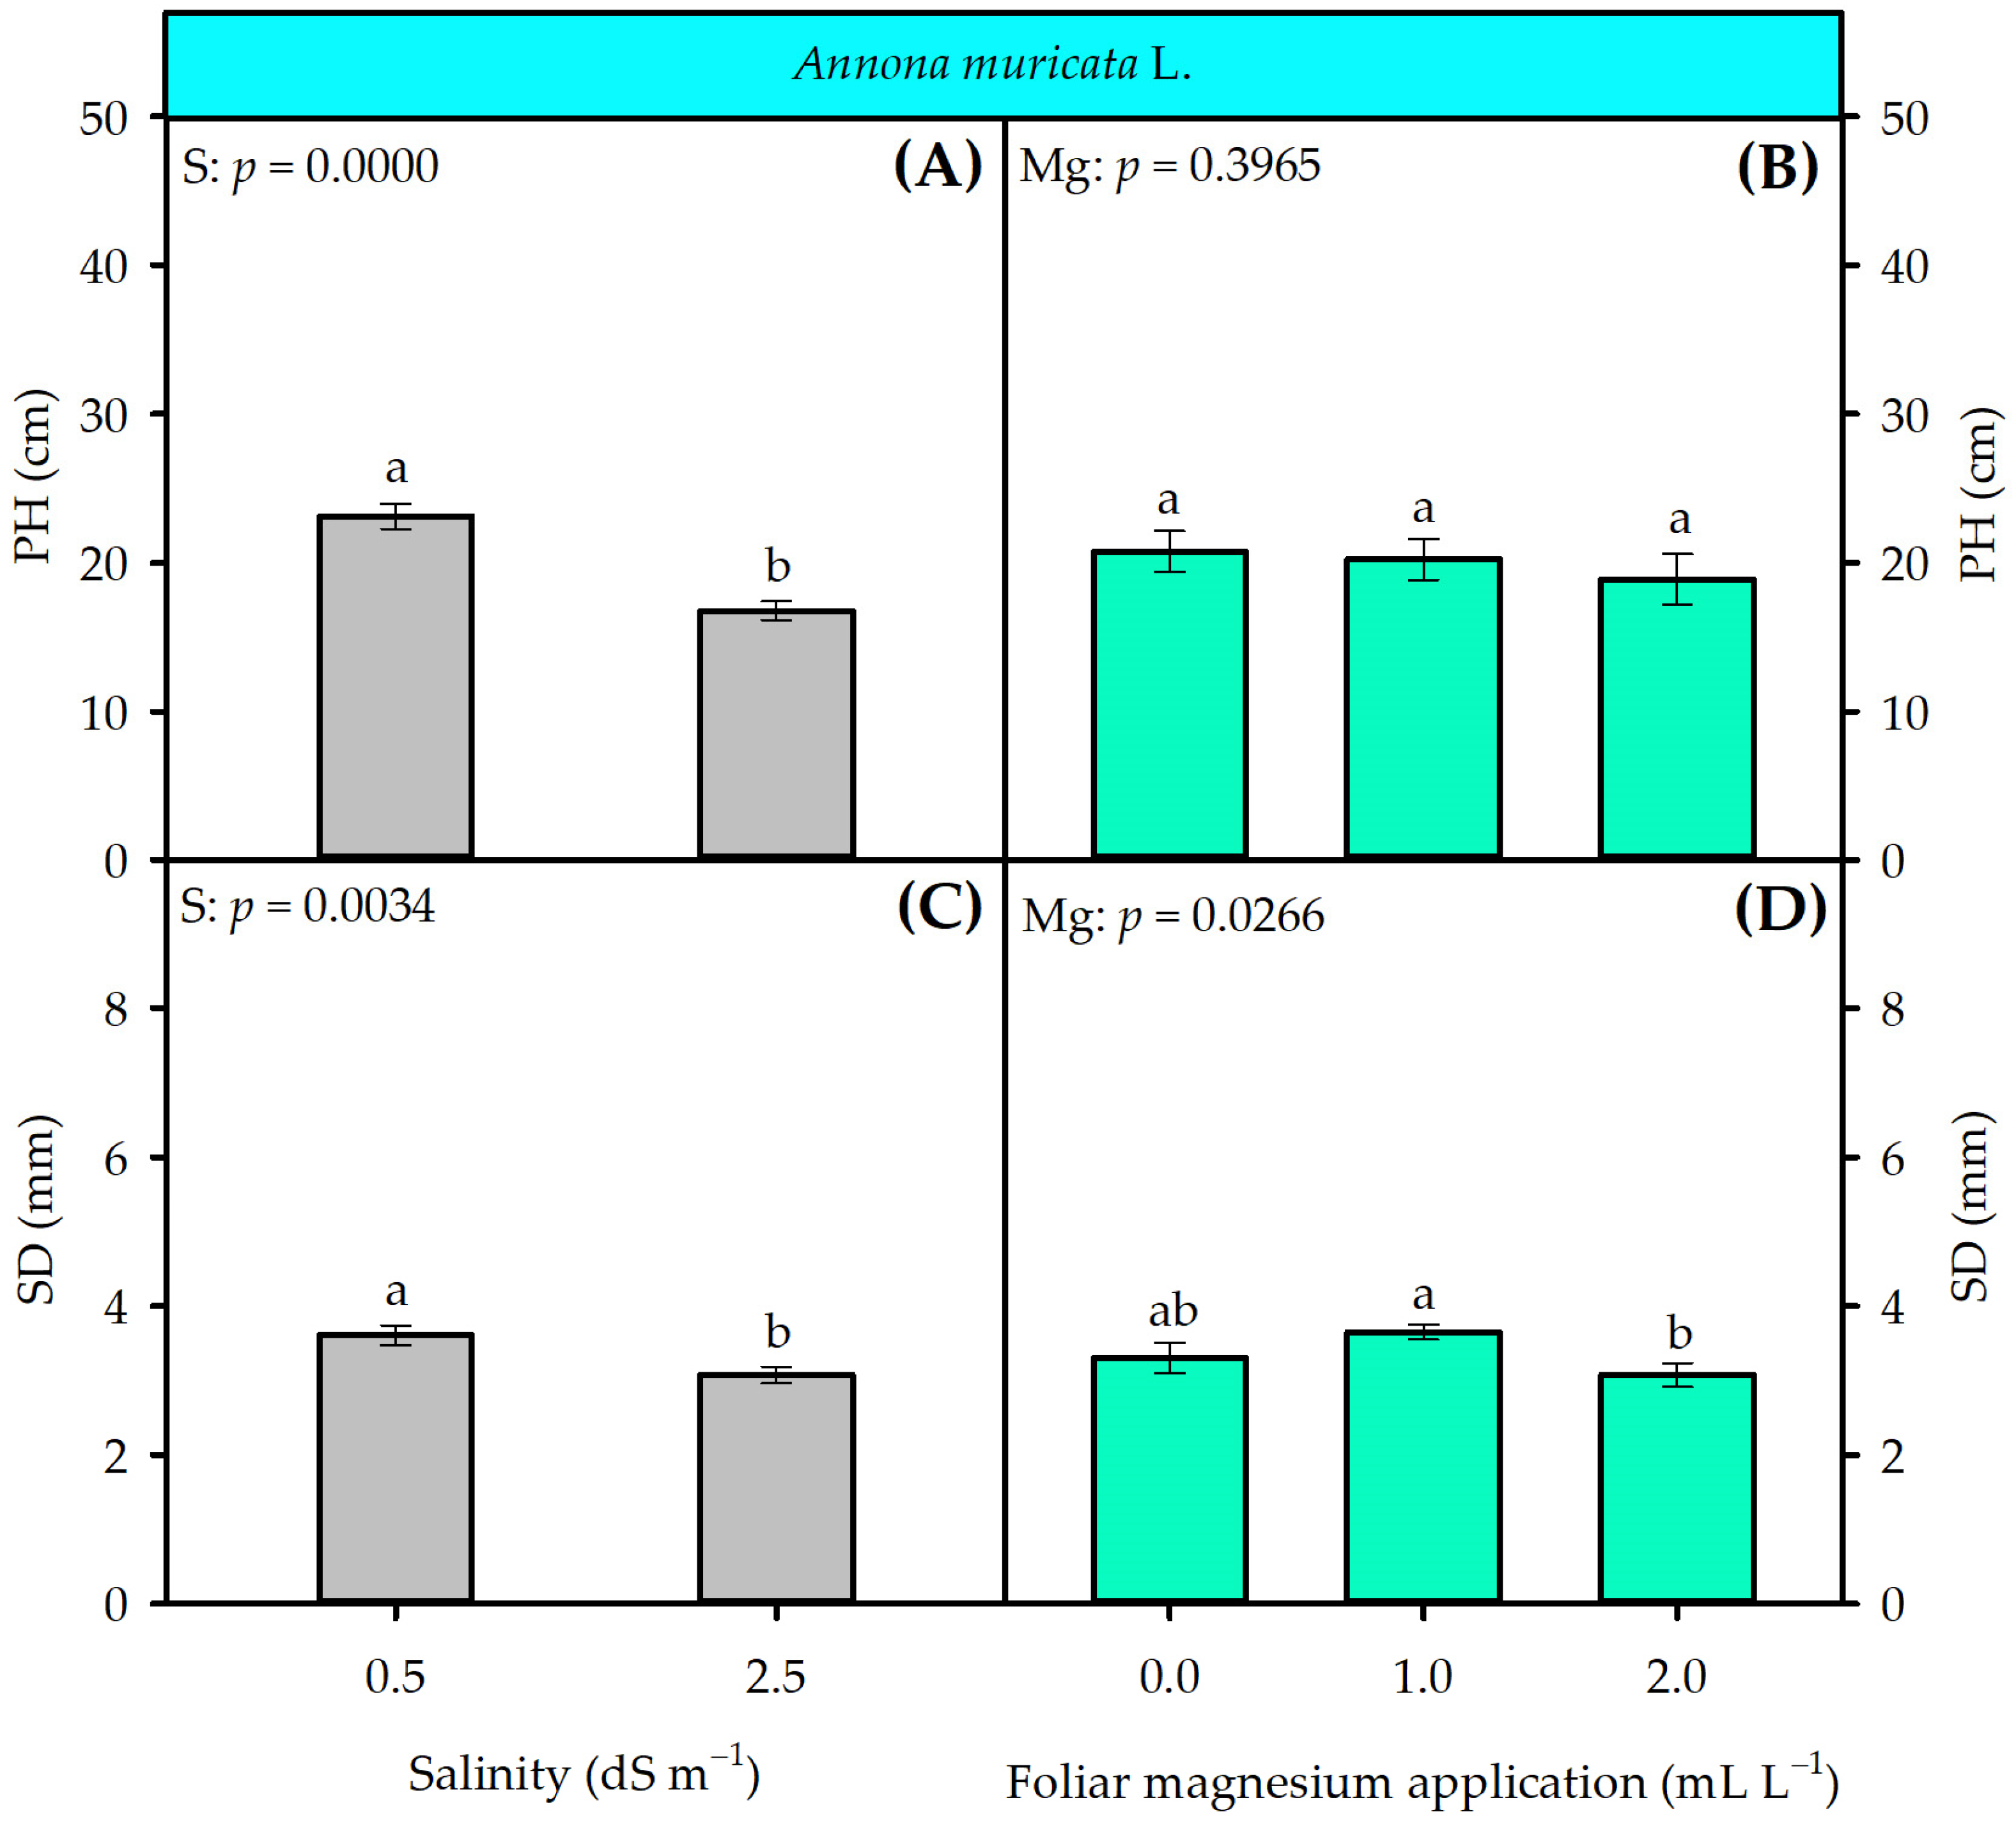
The F-test (p ≤ 0.05) indicated that the interaction between salinity (S) and foliar magnesium (Mg) application was not significant for plant height (PH) and stem diameter (SD) (Figure 2). In the analysis of isolated effects, a salinity level of 2.5 dS m−1 resulted in reductions in PH and SD of 27.49% and 14.96%, respectively, compared to plants grown under 0.5 dS m−1 (Figure 2A,C). The application of Mg doses did not result in significant changes in PH, with a mean value of 19.95 cm (Figure 2B). However, for SD, the dose of 2 mL L−1 exceeded that of 1 mL L−1, registering the highest observed value (3.64 mm) (Figure 2D).
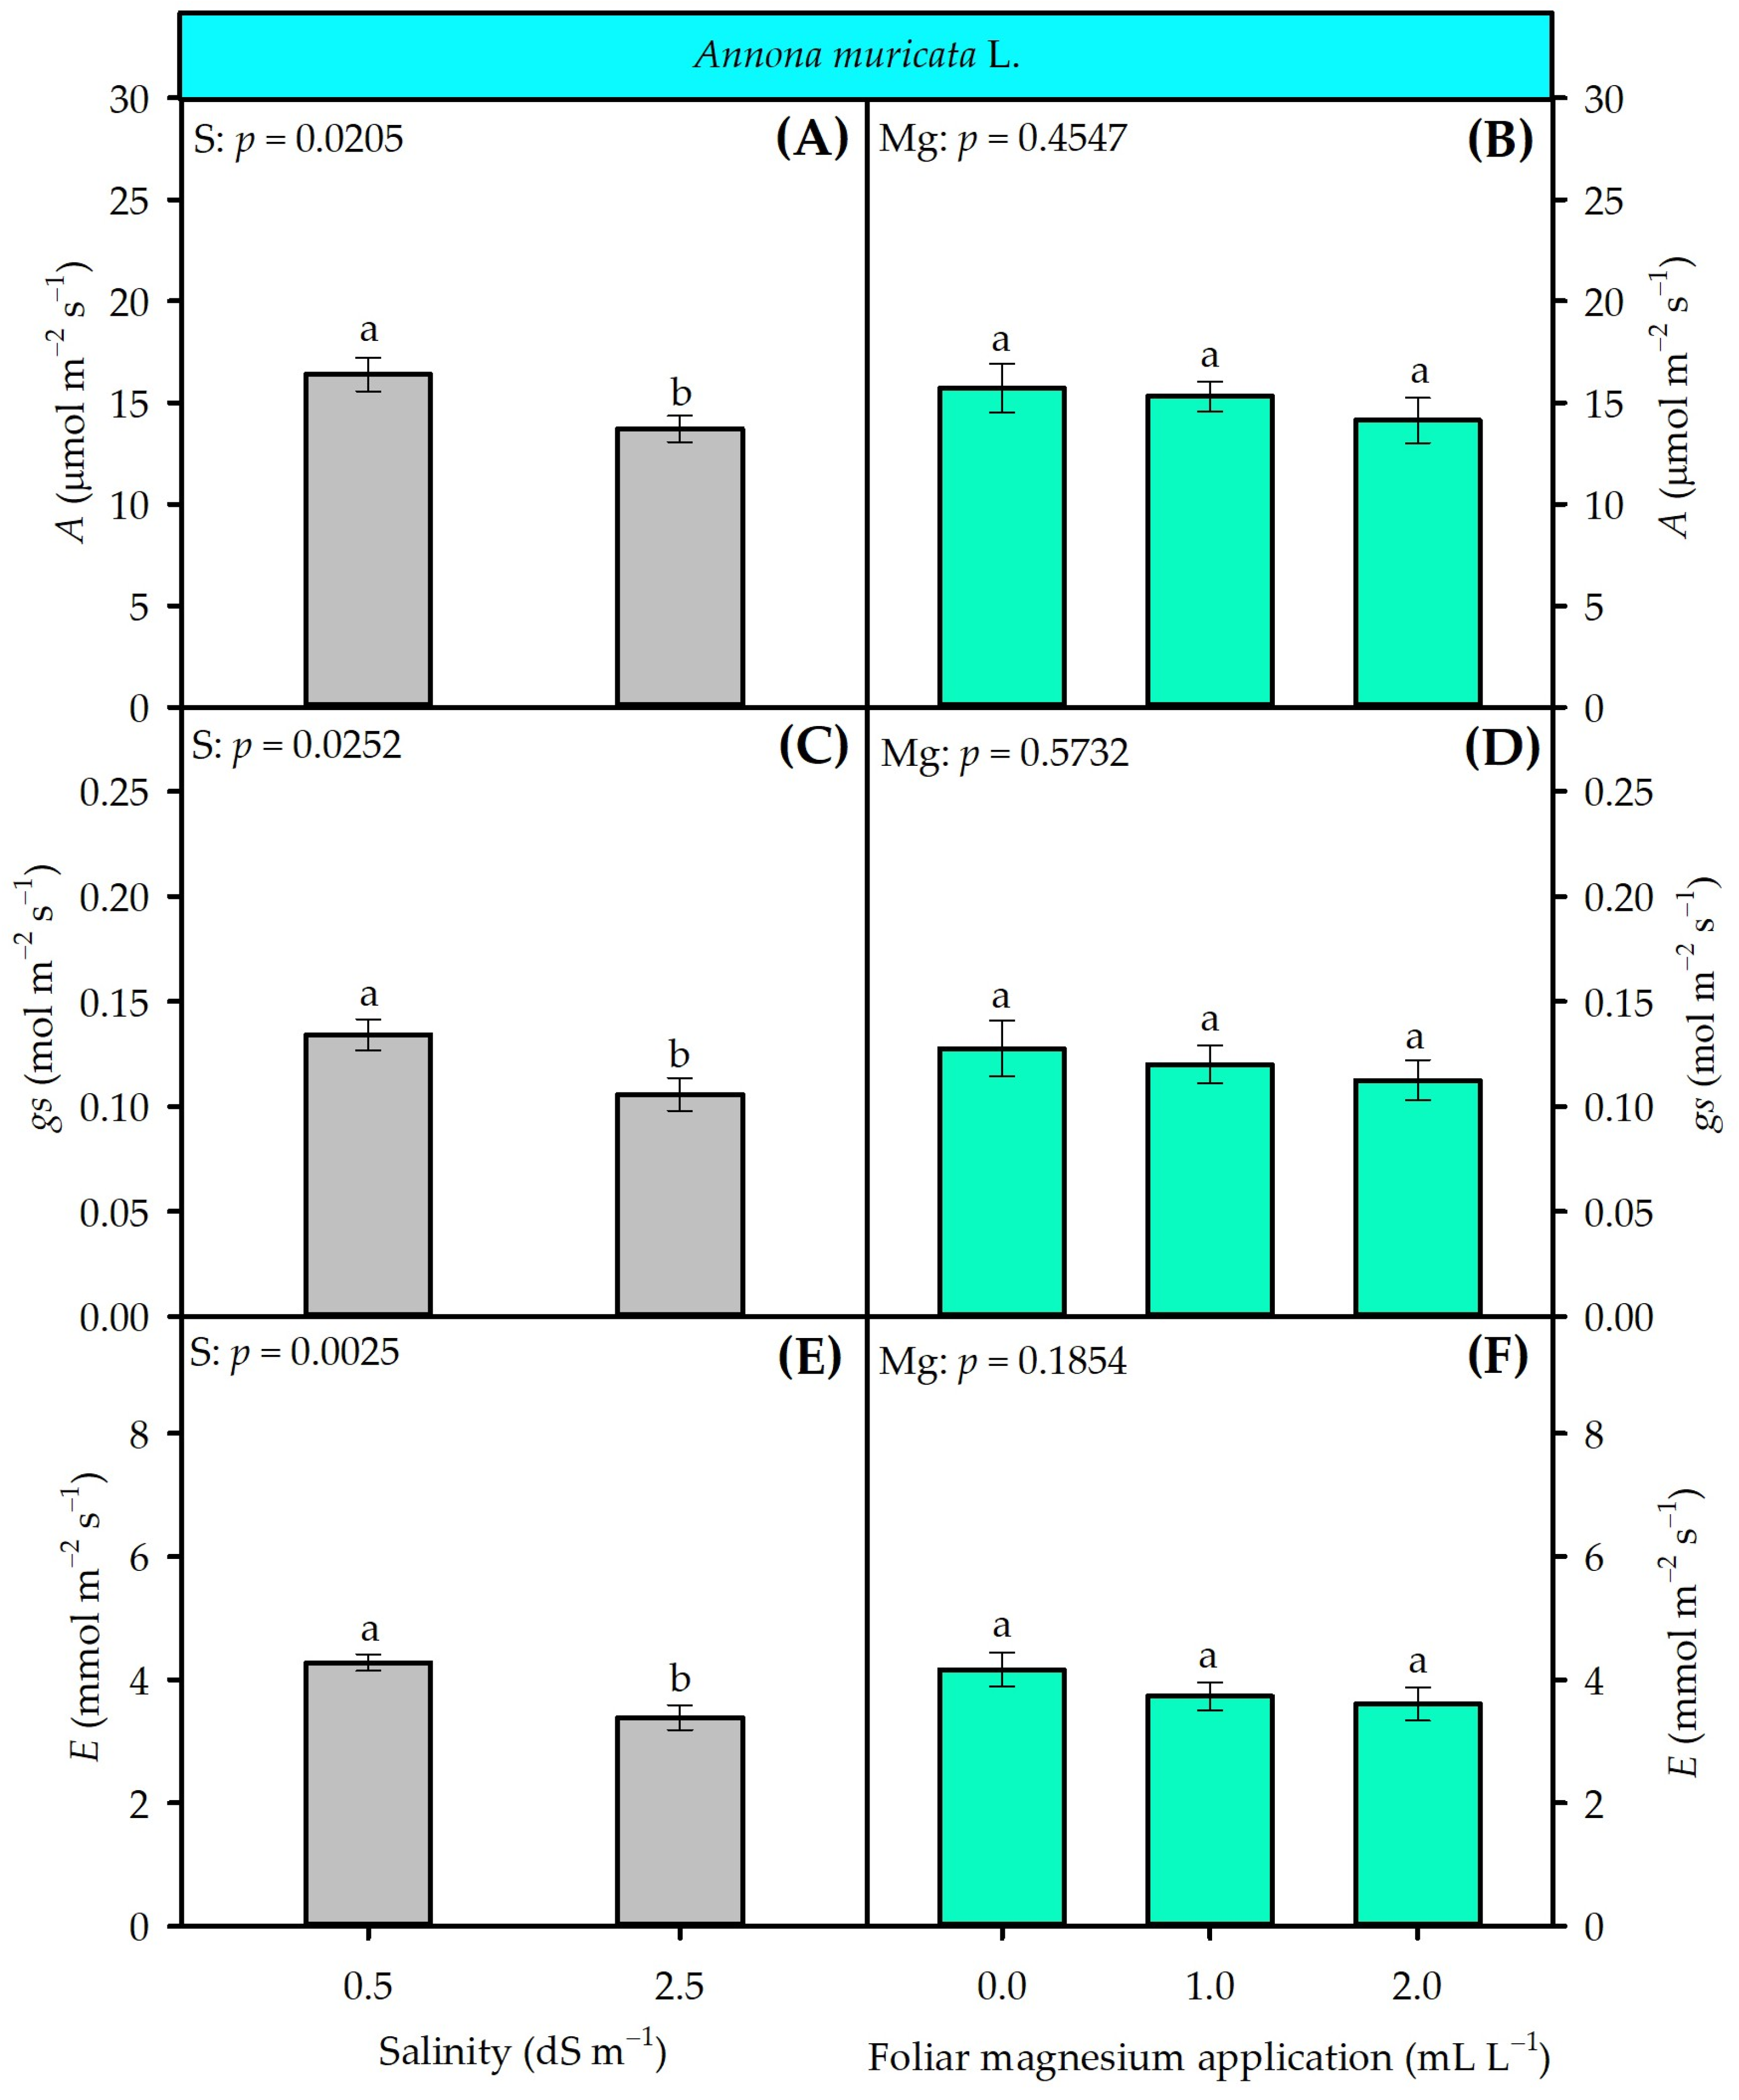
The interaction (S × Mg) did not change gas exchange (Figure 3). When exposed to 2.5 dS m−1, A. muricata plants suffered reductions of 16.41%, 23.07%, and 20.84% in net CO2 assimilation rate (A), stomatal conductance (gs), and transpiration (E), respectively, compared to the level of 0.5 dS m−1 treatment (Figure 3A,C,E). In contrast, Mg doses did not affect these variables, which maintained average values of 15.04 µmol m−2 s−1 (A), 0.12 mol m−2 s−1 (gs), and 3.83 mmol m−2 s−1 (E) (Figure 3B,D,F).
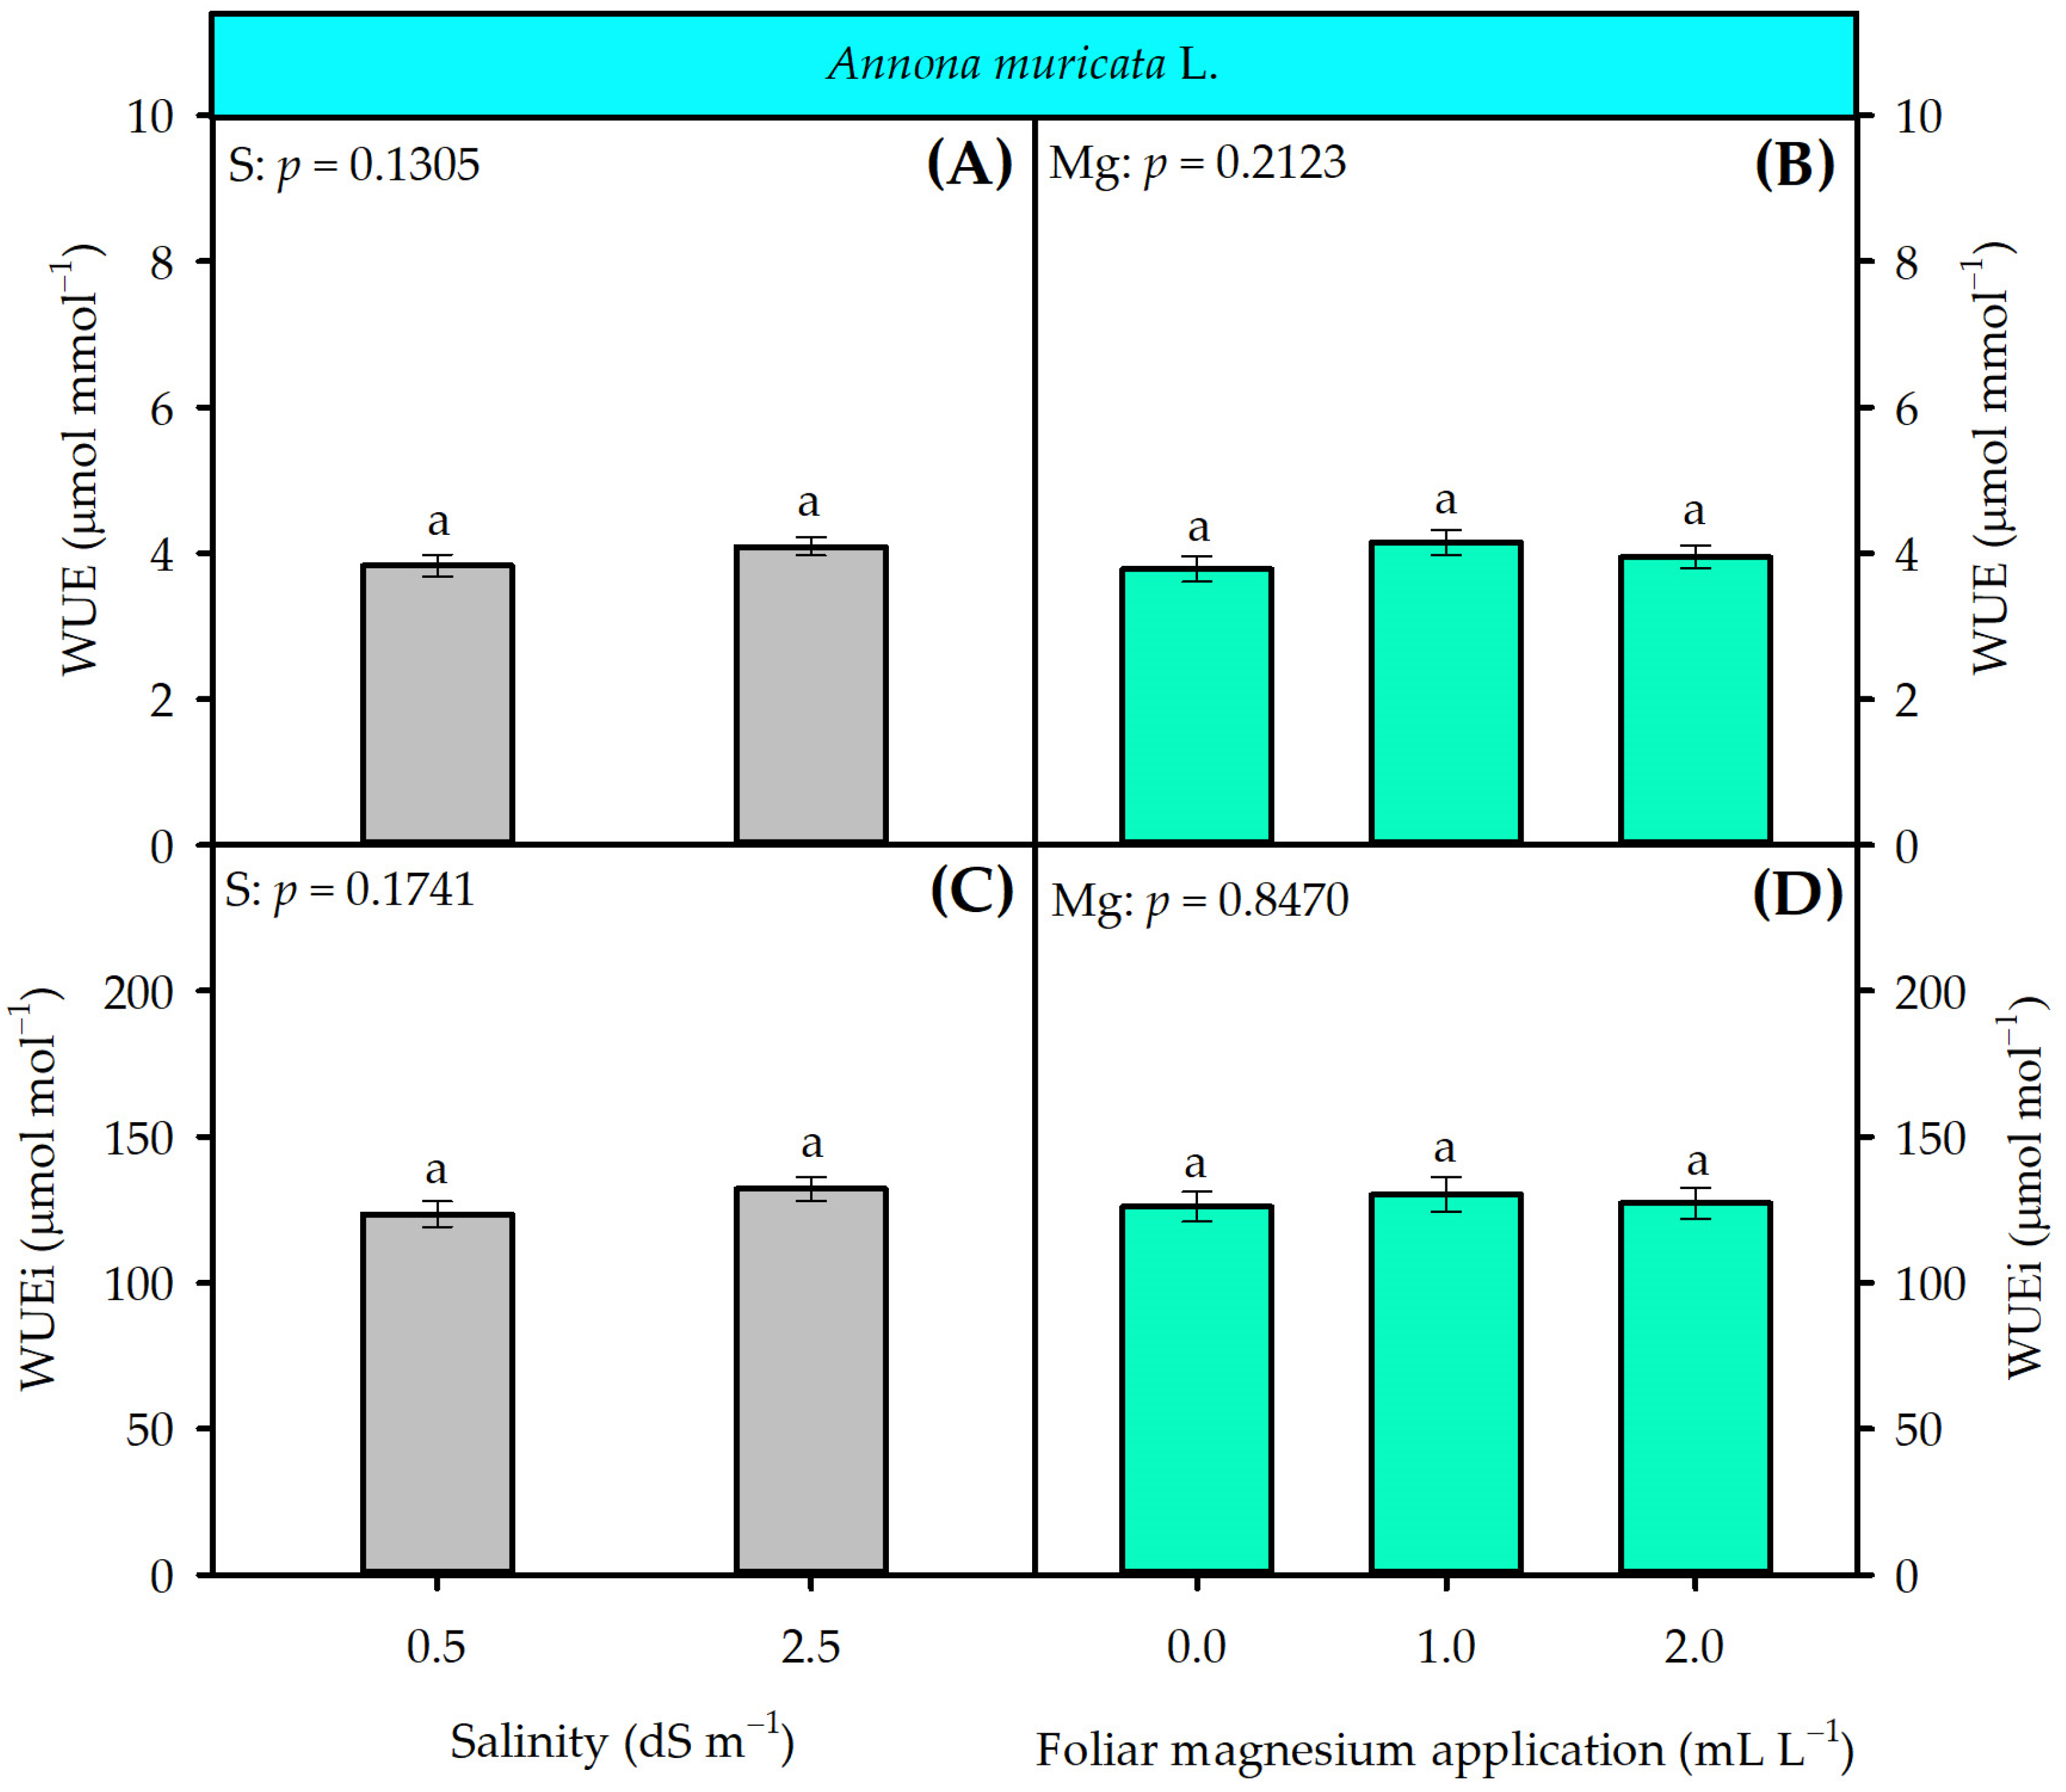
The water use efficiency (WUE) and intrinsic water use efficiency (WUEi) of A. muricata plants also did not respond to the interaction between the factors, showing only isolated effects (Figure 4). However, salinity did not significantly alter these variables, which presented average values of 3.96 µmol mmol−1 (WUE) and 127.88 µmol mol−1 (WUEi) (Figure 4A,C). Similarly, foliar Mg doses did not influence WUE or WUEi, resulting in average values of 3.95 µmol mmol−1 and 127.88 µmol mol−1, respectively (Figure 4B,D).
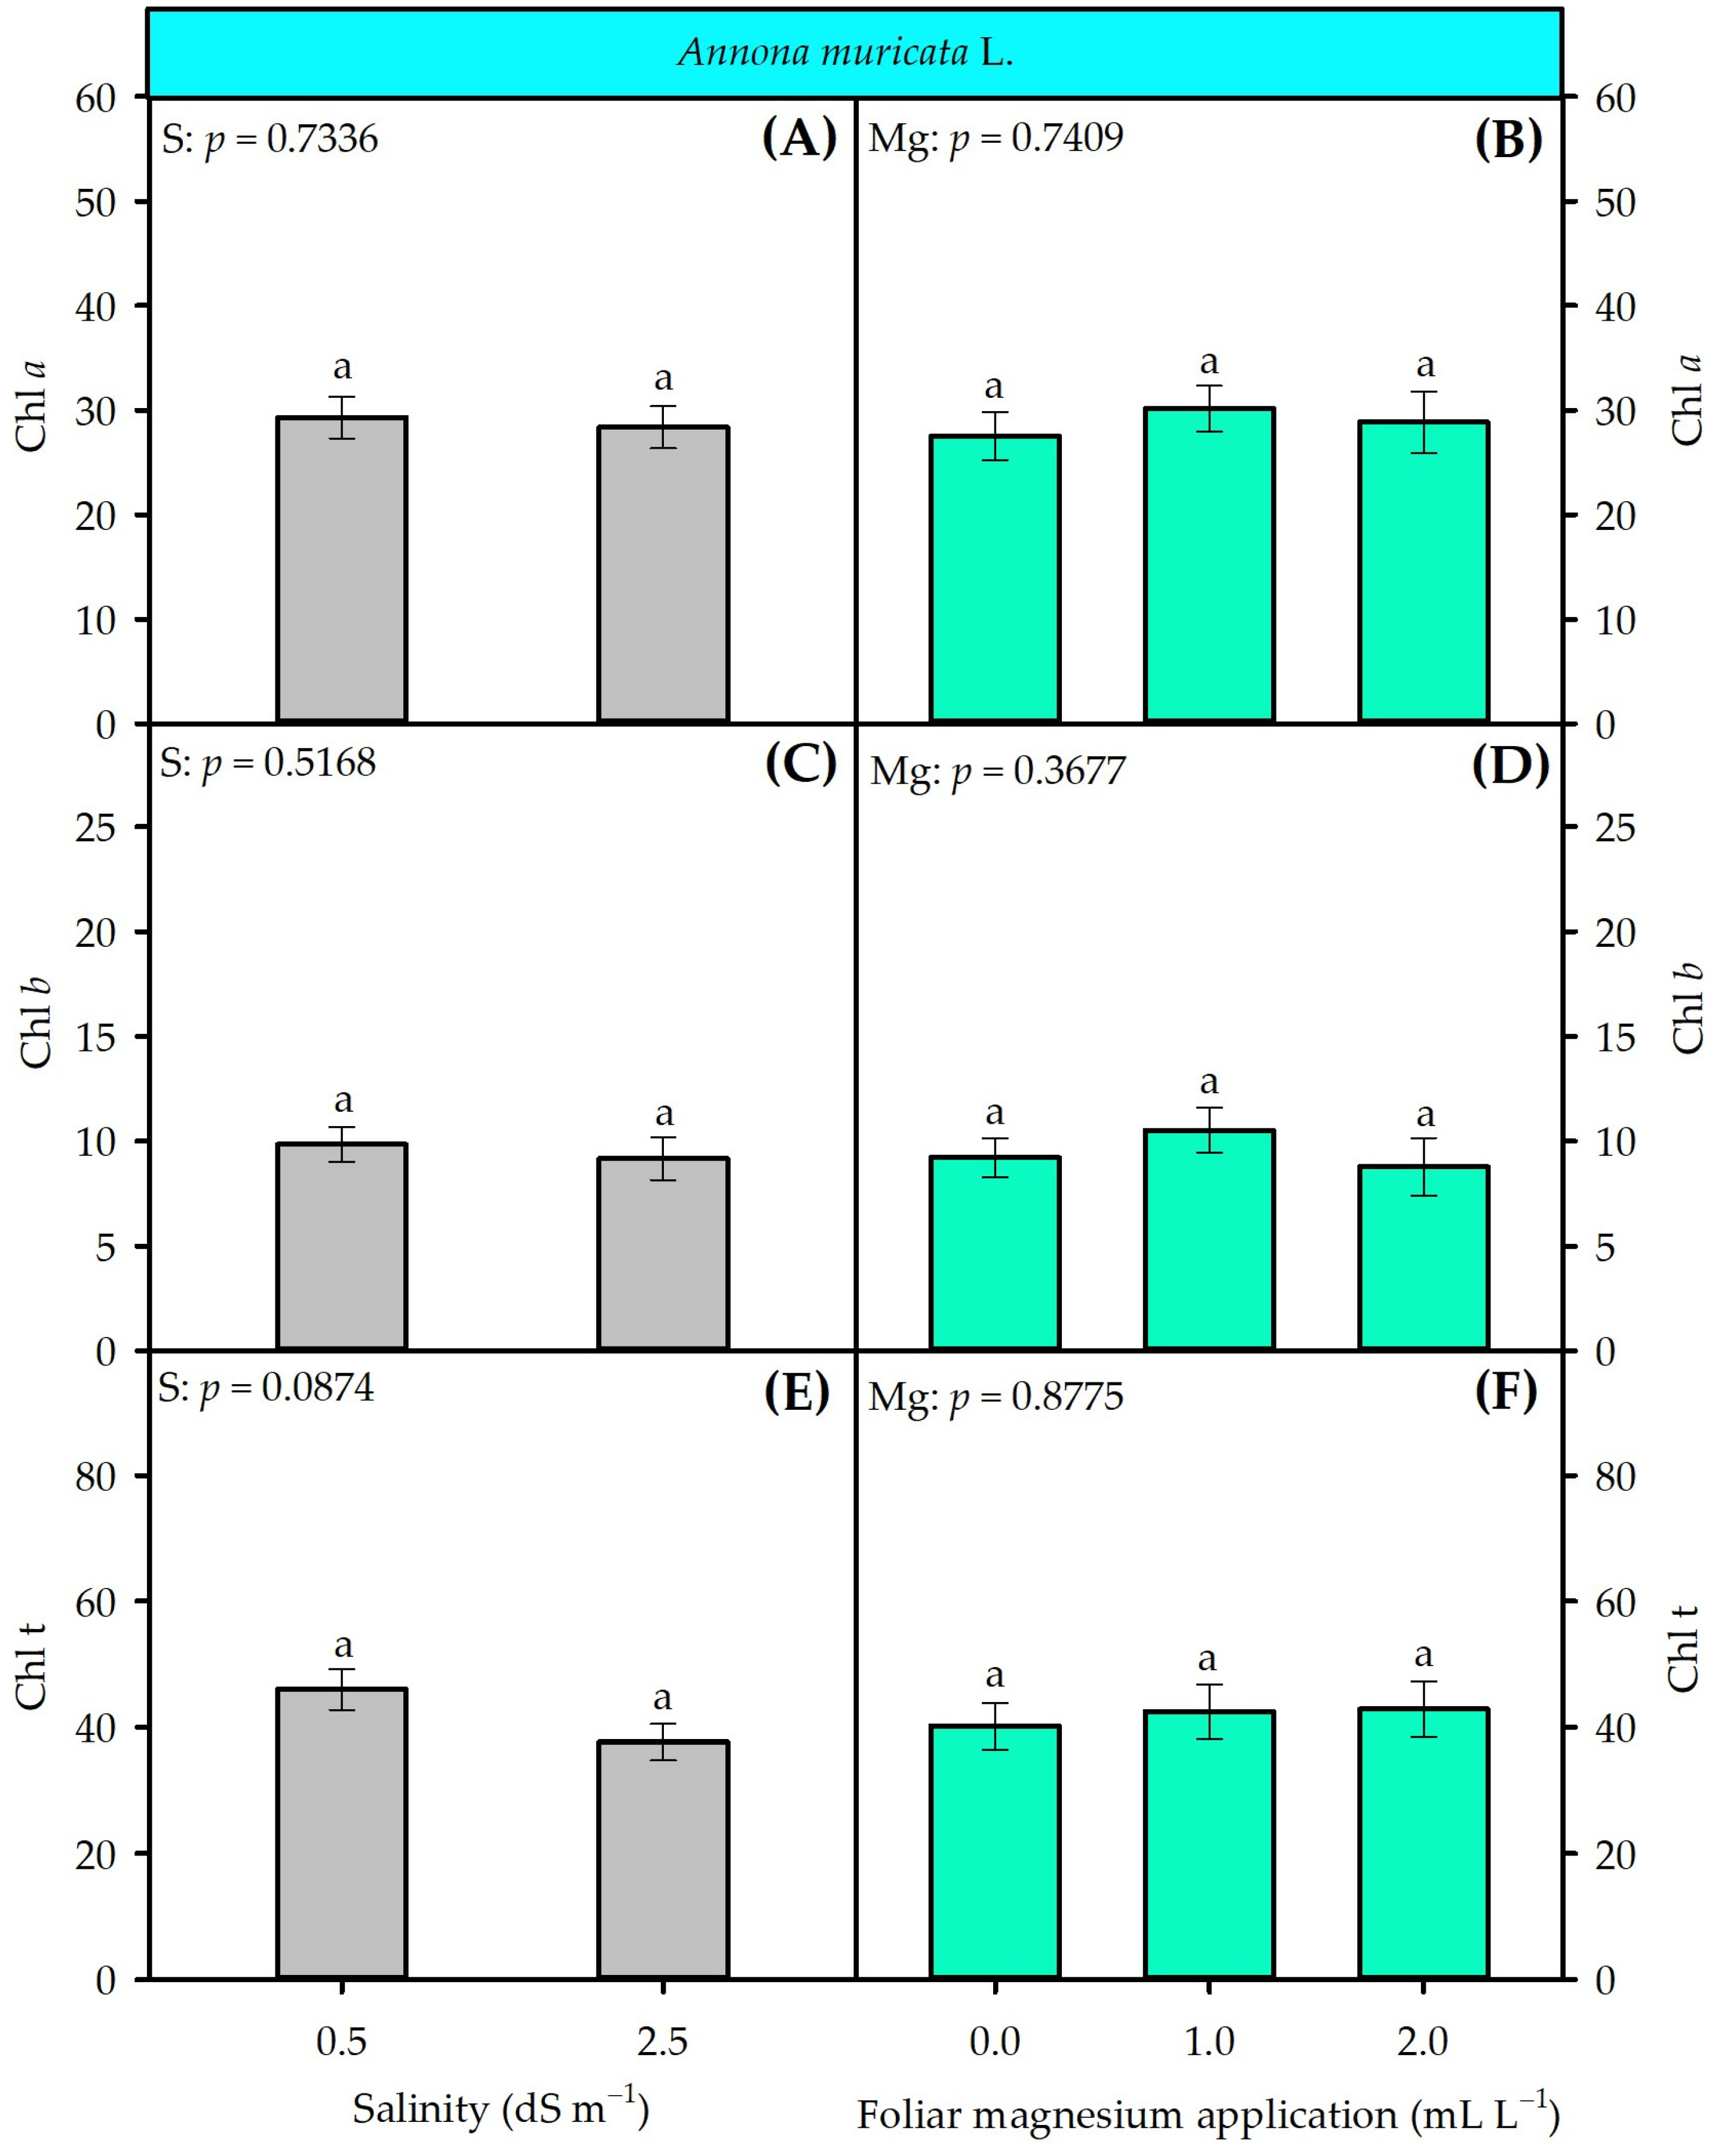
Chlorophyll content was not significantly affected by the interaction (S × Mg) in A. muricata plants (Figure 5). Under the isolated effect of salinity, the average levels of chlorophyll a (Chl a), chlorophyll b (Chl b), and total chlorophyll (Chl t) were 28.82, 9.16, and 41.81, respectively (Figure 5A,C,E). Similarly, Mg doses did not affect photosynthetic pigments, yielding average values of 28.83 (Chl a), 9.50 (Chl b), and 41.82 (Chl t) (Figure 5B,D,F).
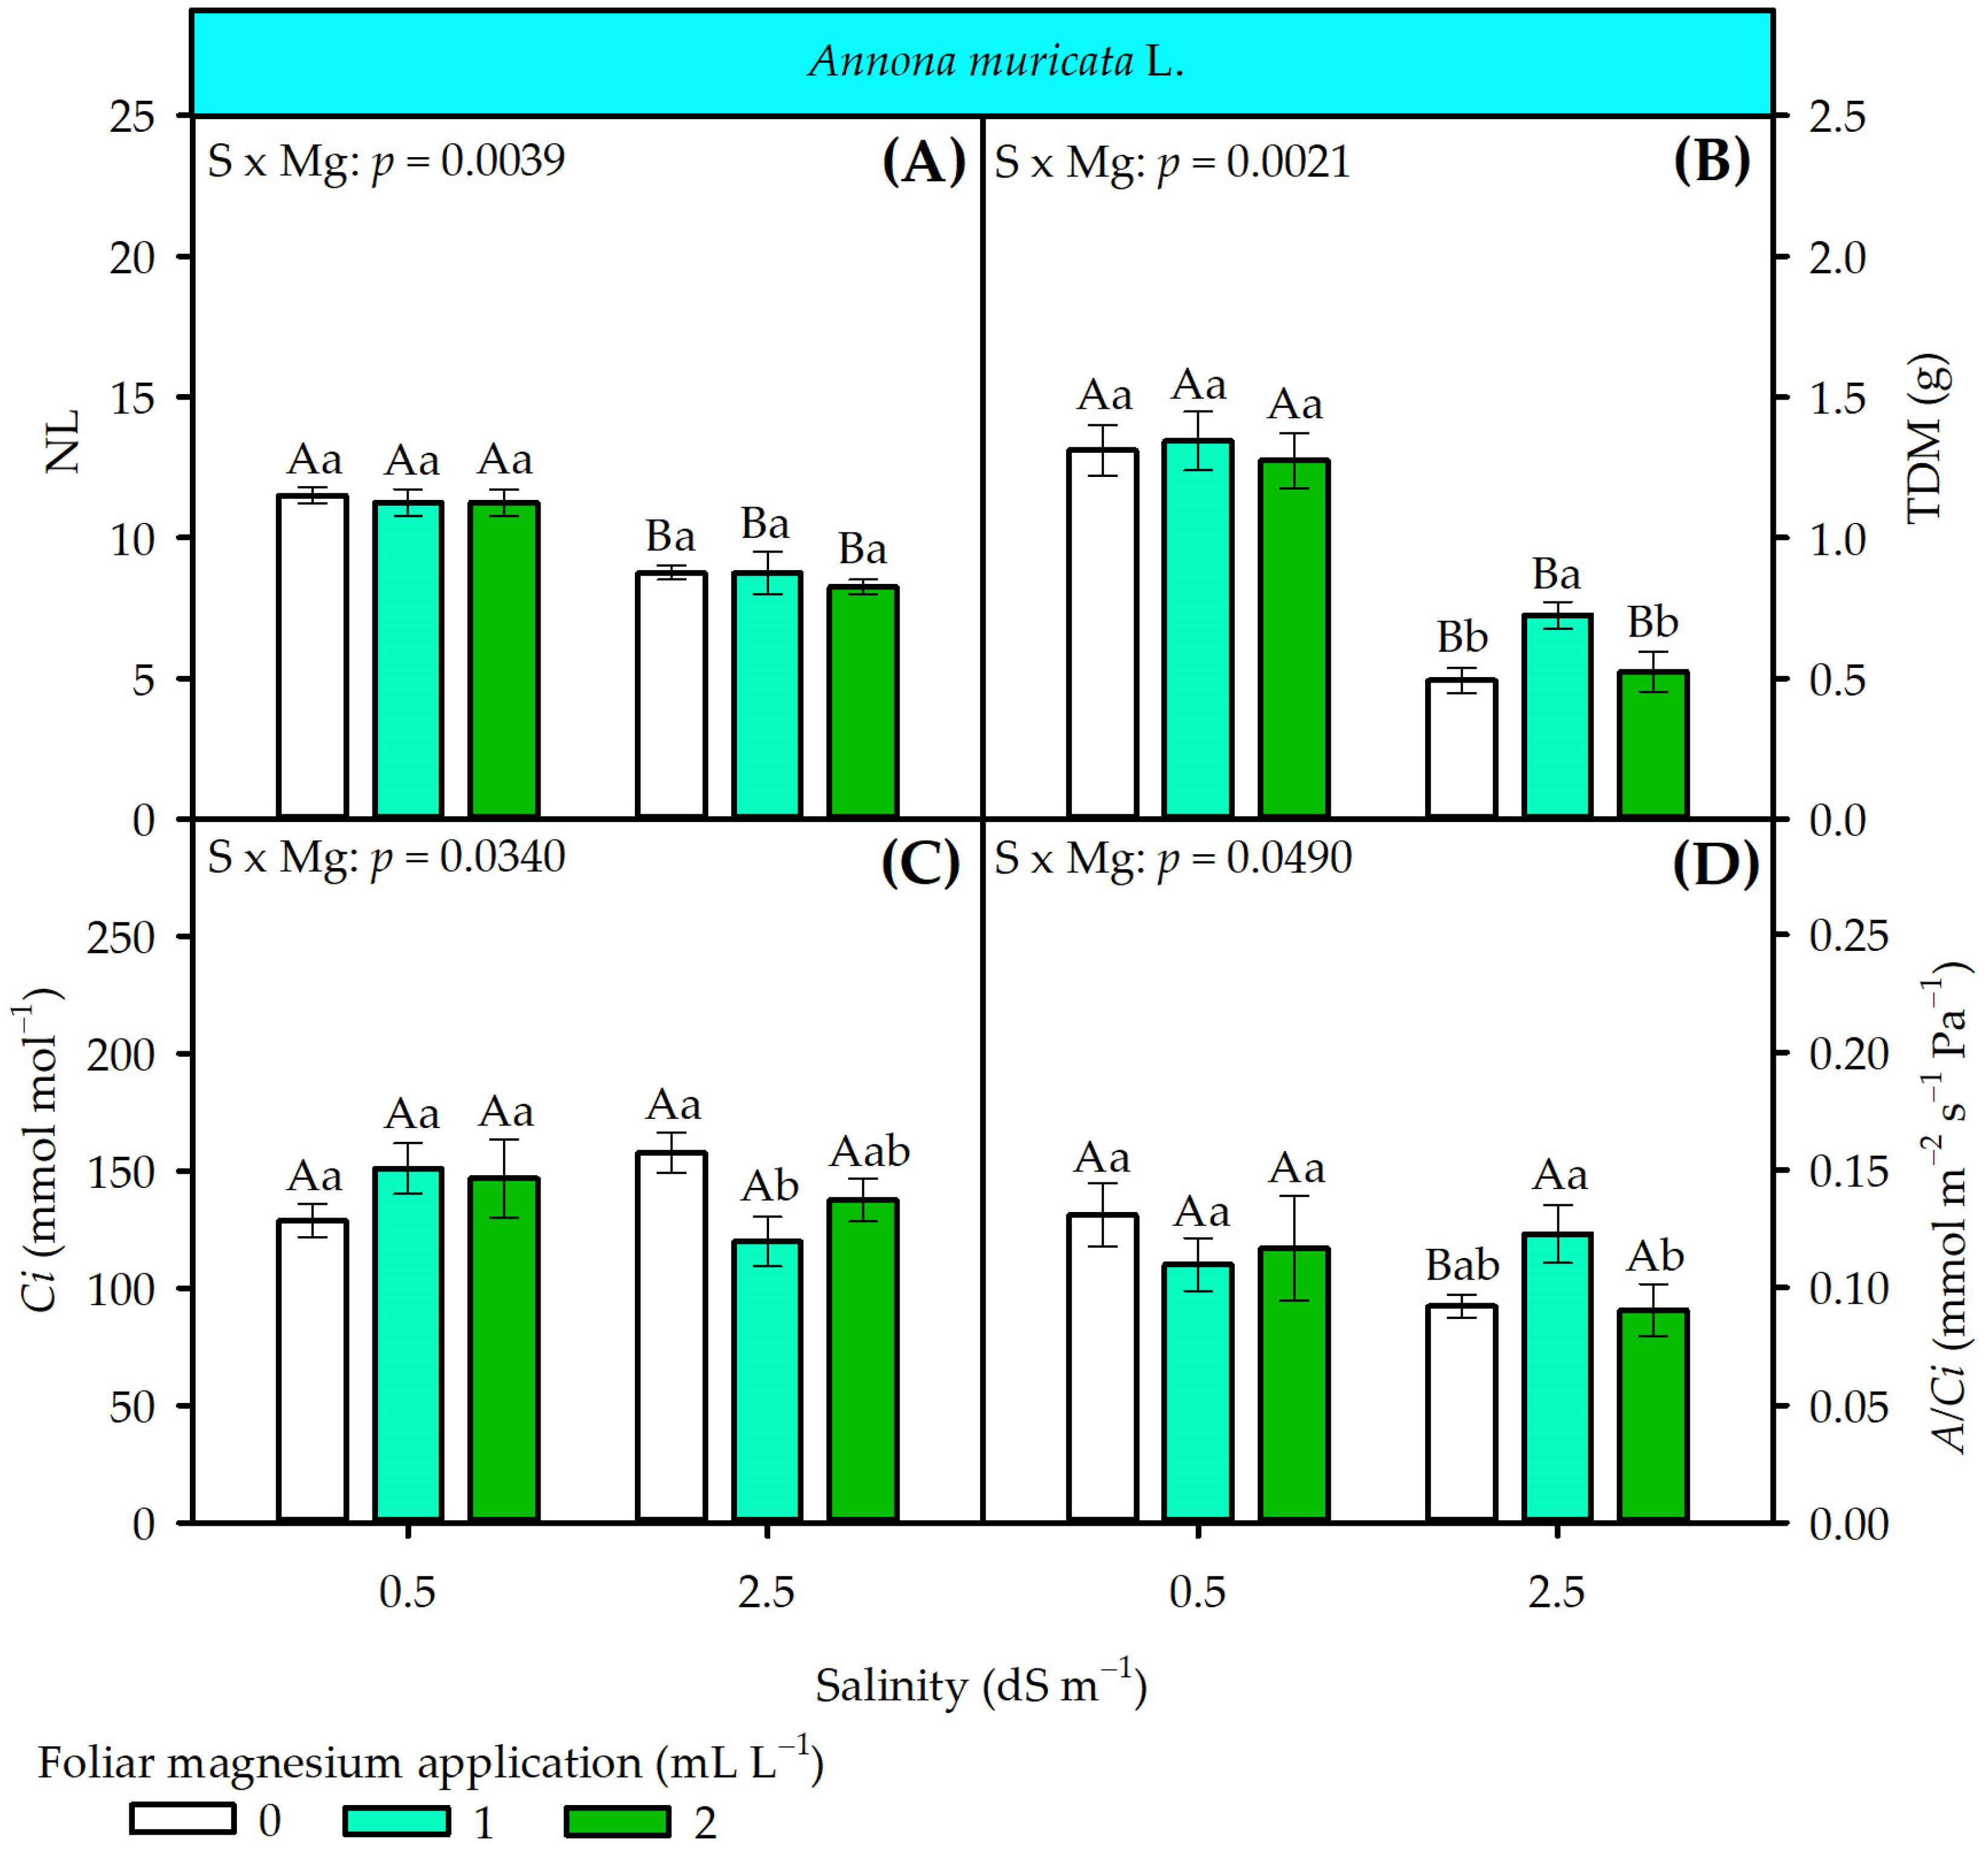
The interaction between salinity and Mg doses (S × Mg) significantly influenced the variables number of leaves (NL, p = 0.0039), total dry mass (TDM, p = 0.0021), internal CO2 concentration (Ci, p = 0.0340), and instantaneous carboxylation efficiency (A/Ci, p = 0.0490) (Figure 6). The salinity level of 2.5 dS m−1 led to a reduction in NL by 23.91%, 22.22%, and 26.66% compared to the 0.5 dS m−1 treatment at all Mg doses evaluated (Figure 6A). However, the analysis of the interaction revealed that Mg doses did not affect NL across salinity levels, with averages of 11 leaves at 0.5 dS m−1 and 8 leaves at 2.5 dS m−1.
At a salinity level of 2.5 dS m−1, TDM was significantly reduced across all Mg doses, with decreases of 62.59%, 46.26%, and 59.05% compared to a salinity of 0.5 dS m−1 (Figure 6B). Under the salinity level of 0.5 dS m−1, magnesium doses had no significant effect on TDM, which averaged 1.31 g. However, under salt stress (2.5 dS m−1), the application of 1 mL L−1 Mg produced the greatest biomass accumulation (0.72 g), surpassing the other Mg doses.
The unfolding of the interaction (S × Mg) for Ci (p = 0.0340) revealed that salinity levels did not significantly alter this variable at each Mg dose (Figure 6C). However, when evaluating Mg doses under each saline condition, it was observed that at 0.5 dS m−1 the treatments did not differ significantly, with a mean of 142.17 µmol mol−1. In contrast, at 2.5 dS m−1, the application of 1 mL L−1 of Mg promoted the lowest Ci value (119.81 µmol mol−1), differing significantly from the absence of fertilization (0 mL L−1).
For carboxylation efficiency (A/Ci), according to the interaction analysis, salinity at 2.5 dS m−1 caused a significant decrease in this variable by 29.23% only with no application of Mg (0 mL L−1) (Figure 6D). At other Mg doses, salinity did not affect A/Ci. Within each salinity condition, Mg doses exhibited no significant differences at low salinity (0.5 dS m−1). However, under a stress of 2.5 dS m−1, the 1 mL L−1 dose promoted the highest A/Ci (0.12 µmol m−2 s−1 Pa−1), significantly exceeding the 2 mL L−1 dose.
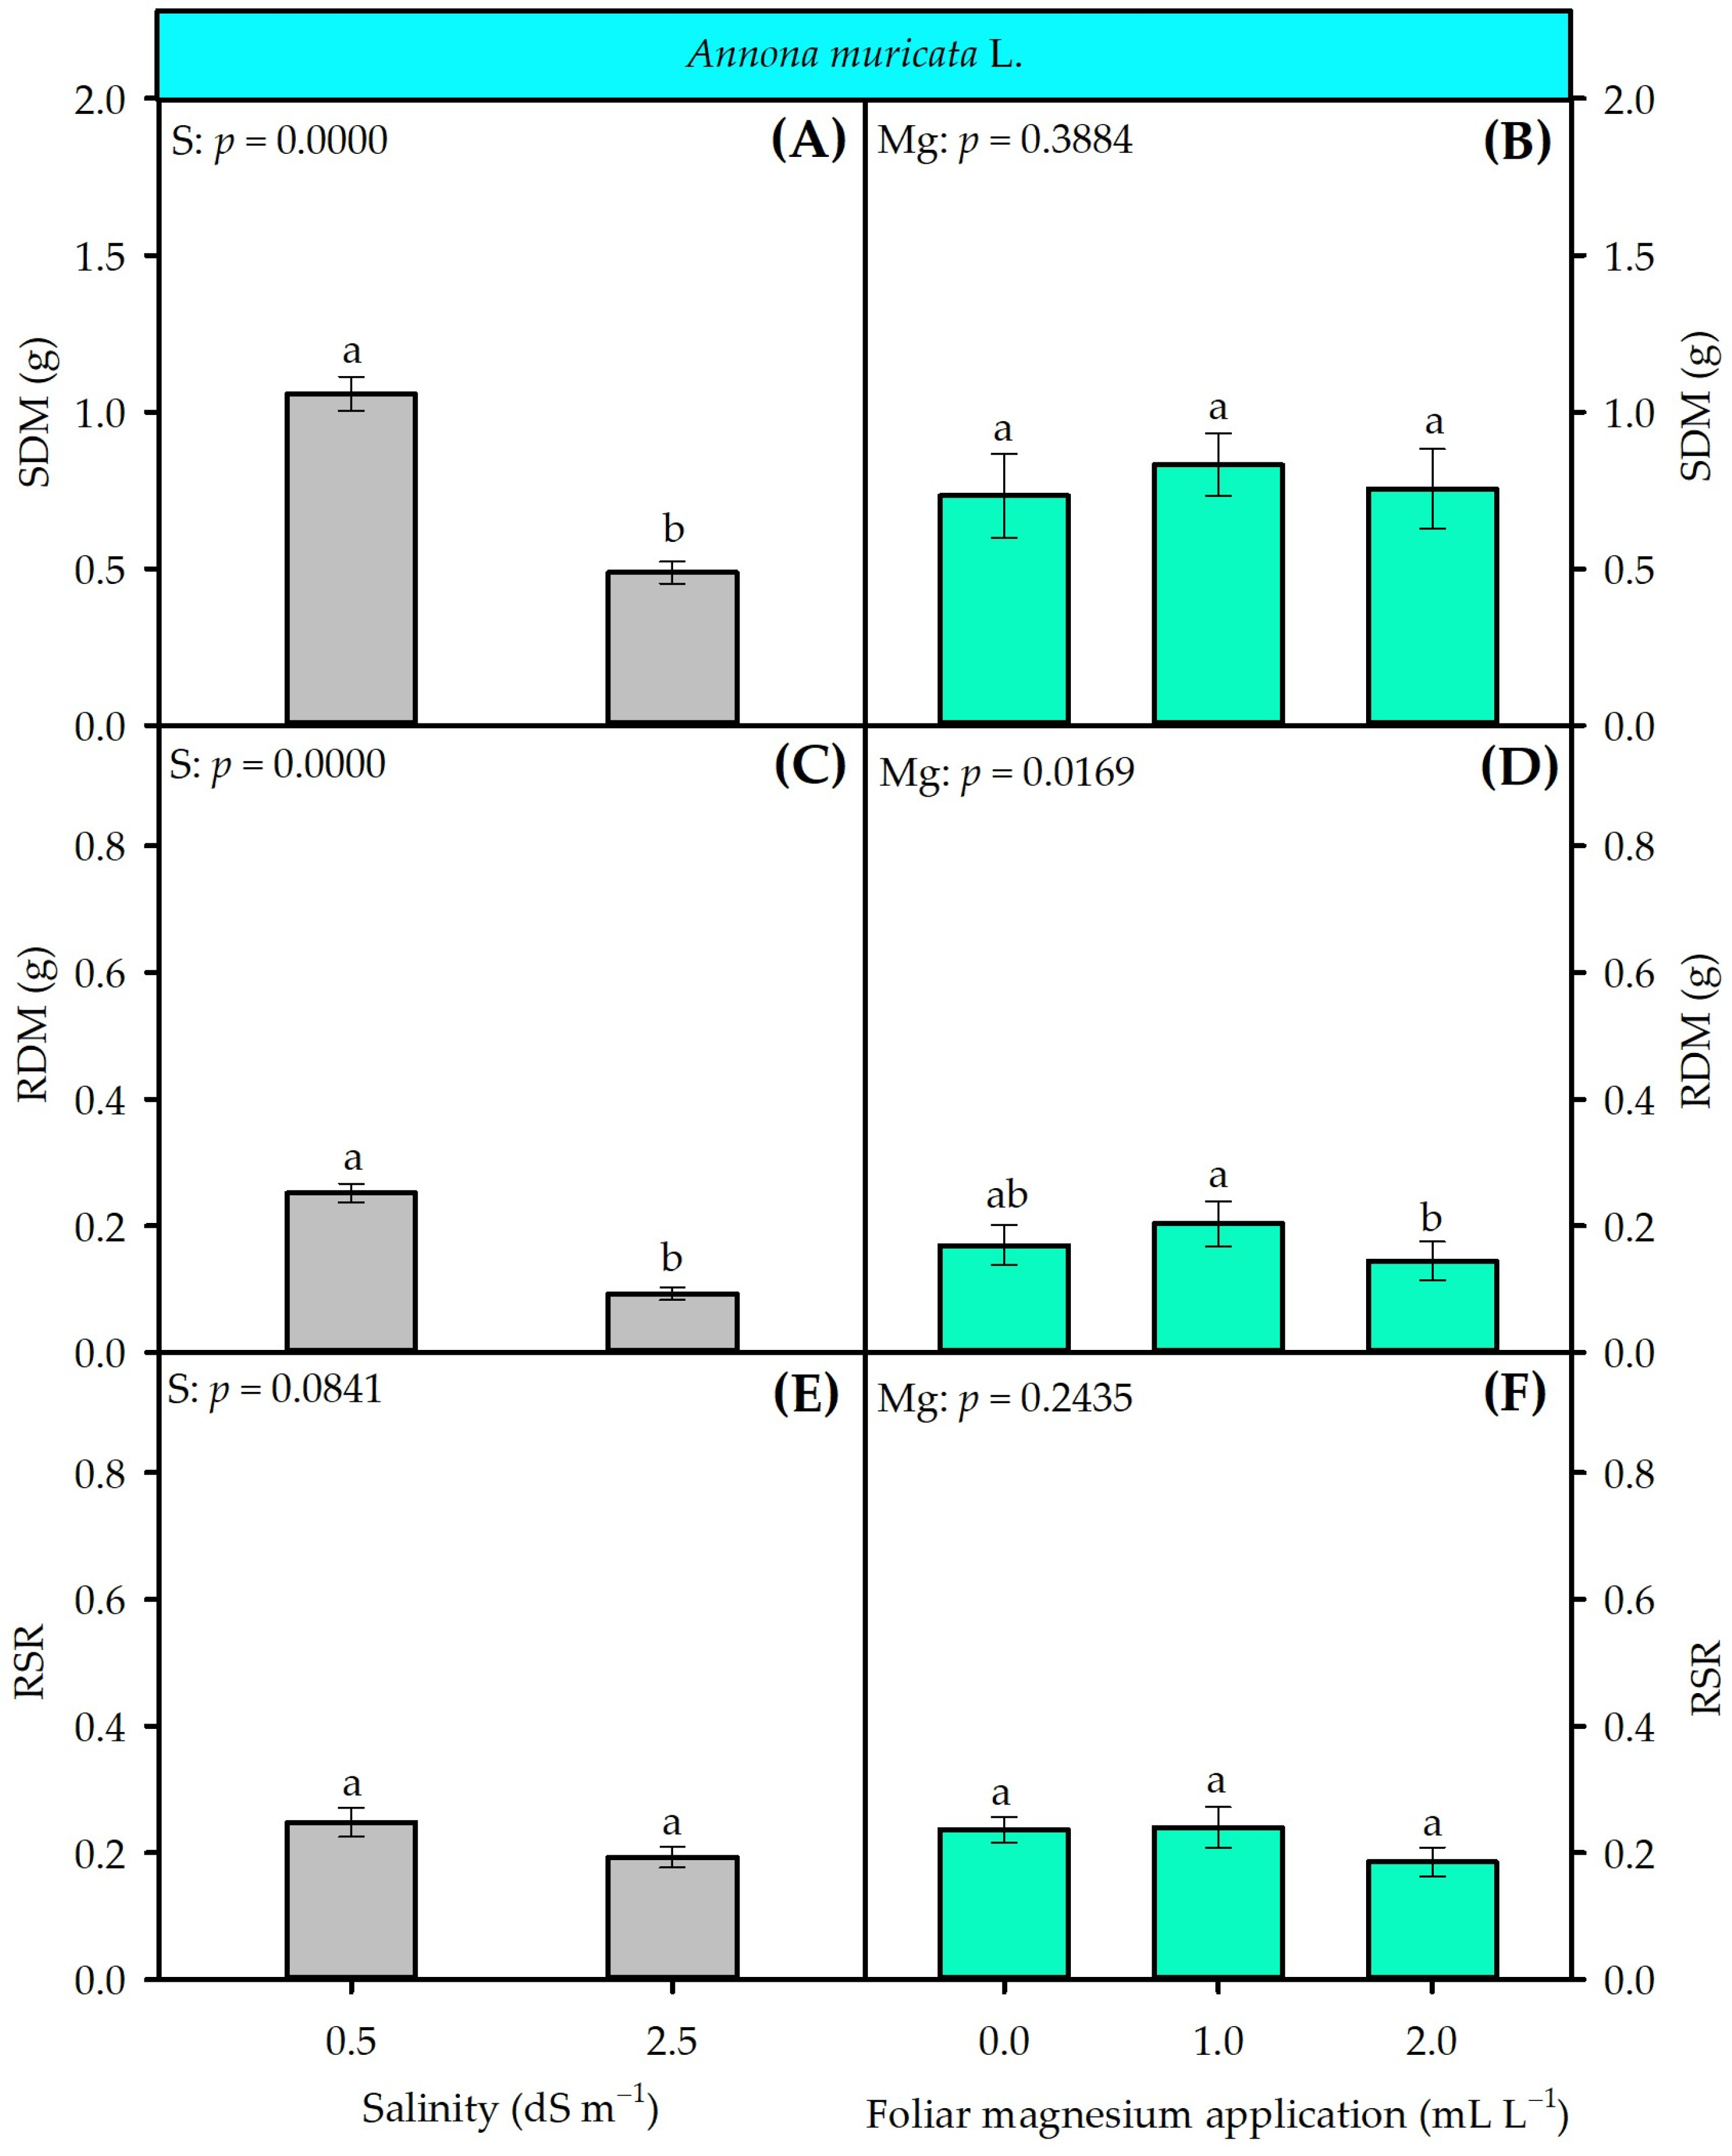
The treatments exerted isolated effects on the variables shoot dry mass (SDM), root dry mass (RDM), and root-to-shoot ratio (RSR) in A. muricata plants (Figure 7). Exposure to 2.5 dS m−1 salinity resulted in a significant reduction in SDM by 53.77% compared to 0.5 dS m−1 (Figure 7A). Conversely, magnesium doses had no significant effect on this variable, which averaged 0.77 g (Figure 7B). RDM also suffered a significant reduction (63.06%) under a salinity level of 2.5 dS m−1 (Figure 7C). Regarding the magnesium factor, the dose of 1 mL L−1 promoted the greatest accumulation of root biomass (0.20 g), significantly exceeding the dose of 2 mL L−1 (Figure 7D). Salinity and Mg doses did not significantly change the RSR, which averaged 0.22 g for both factors (Figure 7E,F).

3.2. Annona squamosa L. Seedlings Under Salinity and Supplementation with Foliar Magnesium

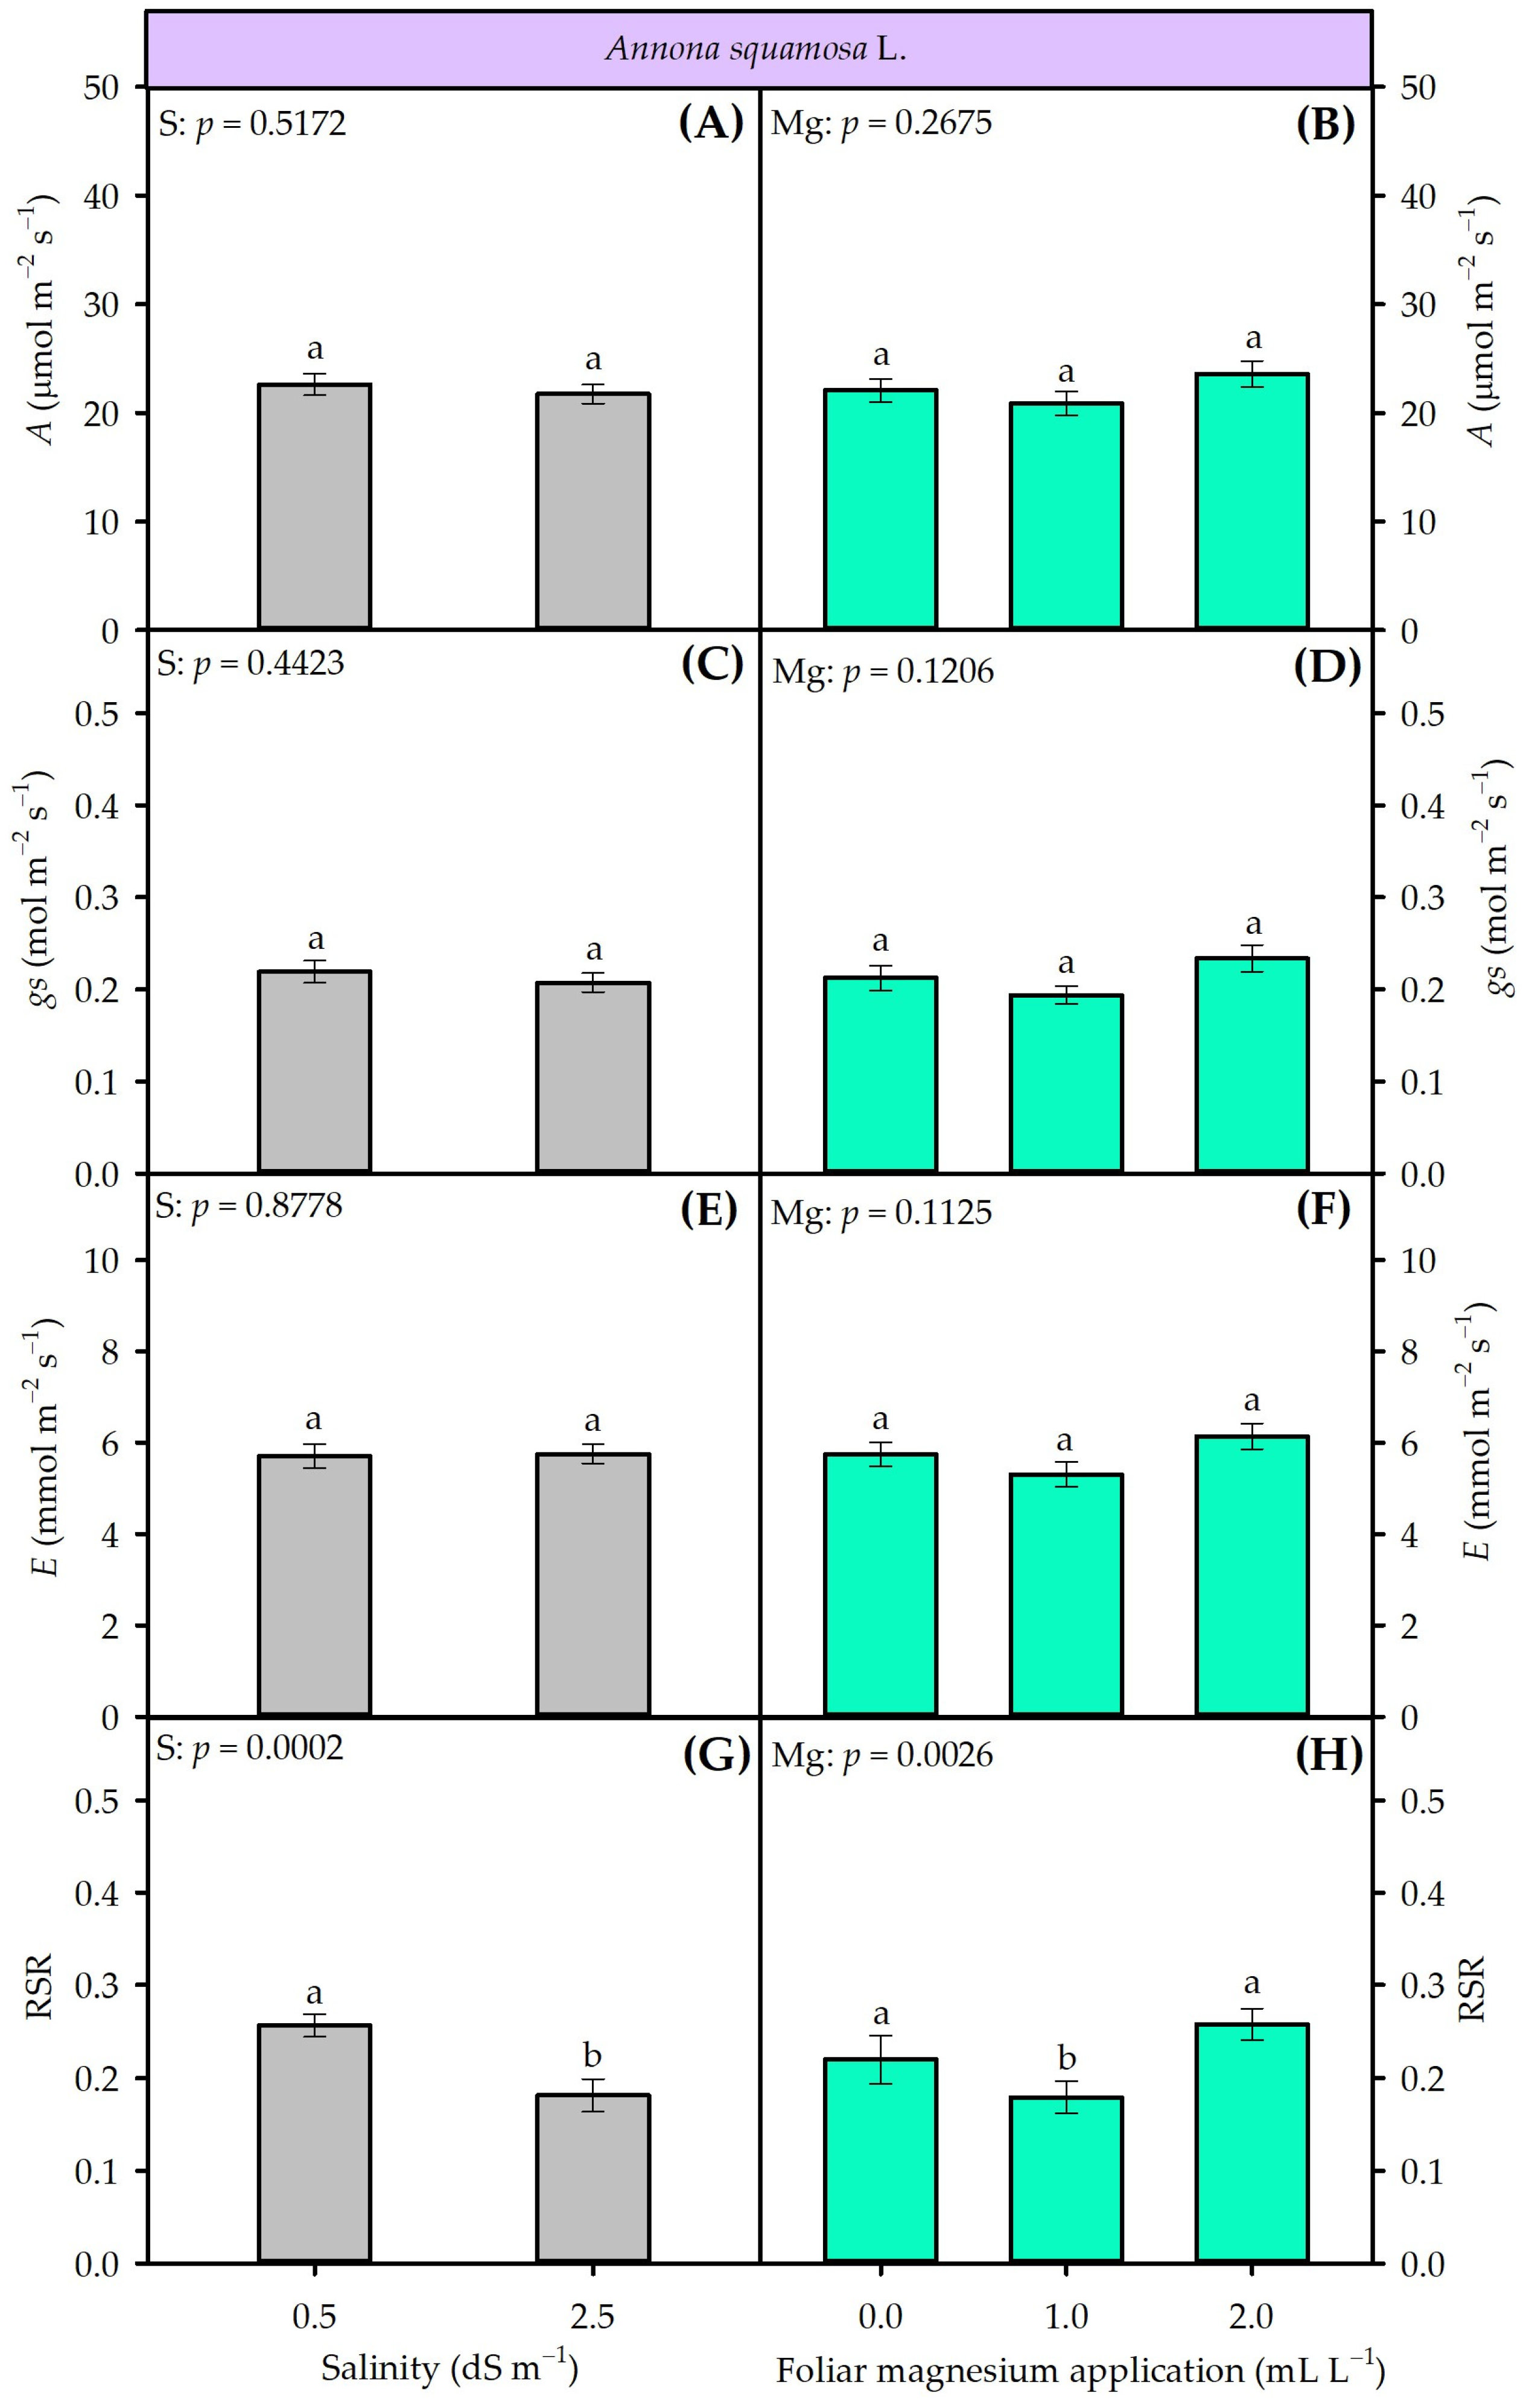
The S × Mg interaction showed no significant effect on the gas exchange parameters of A. squamosa (Figure 8). Salinity did not significantly influence the variables A, gs, and E in isolation, which maintained averages of 22.18 µmol m−2 s−1, 0.21 mol m−2 s−1, and 5.73 mmol m−2 s−1, respectively (Figure 8A,C,E). The magnesium factor showed similar behavior, without significantly influencing these characteristics (Figure 8B,D,F). In contrast, a salinity of 2.5 dS m−1 significantly reduced the RSR by 30.77% compared to a salinity of 0.5 dS m−1 (Figure 8G). Mg doses also affected RSR (p = 0.0026), with the 1 mL L−1 dose reducing this variable by 18.18% and 28.00% compared with the 0 and 2 mL L−1 doses, respectively (Figure 8H).
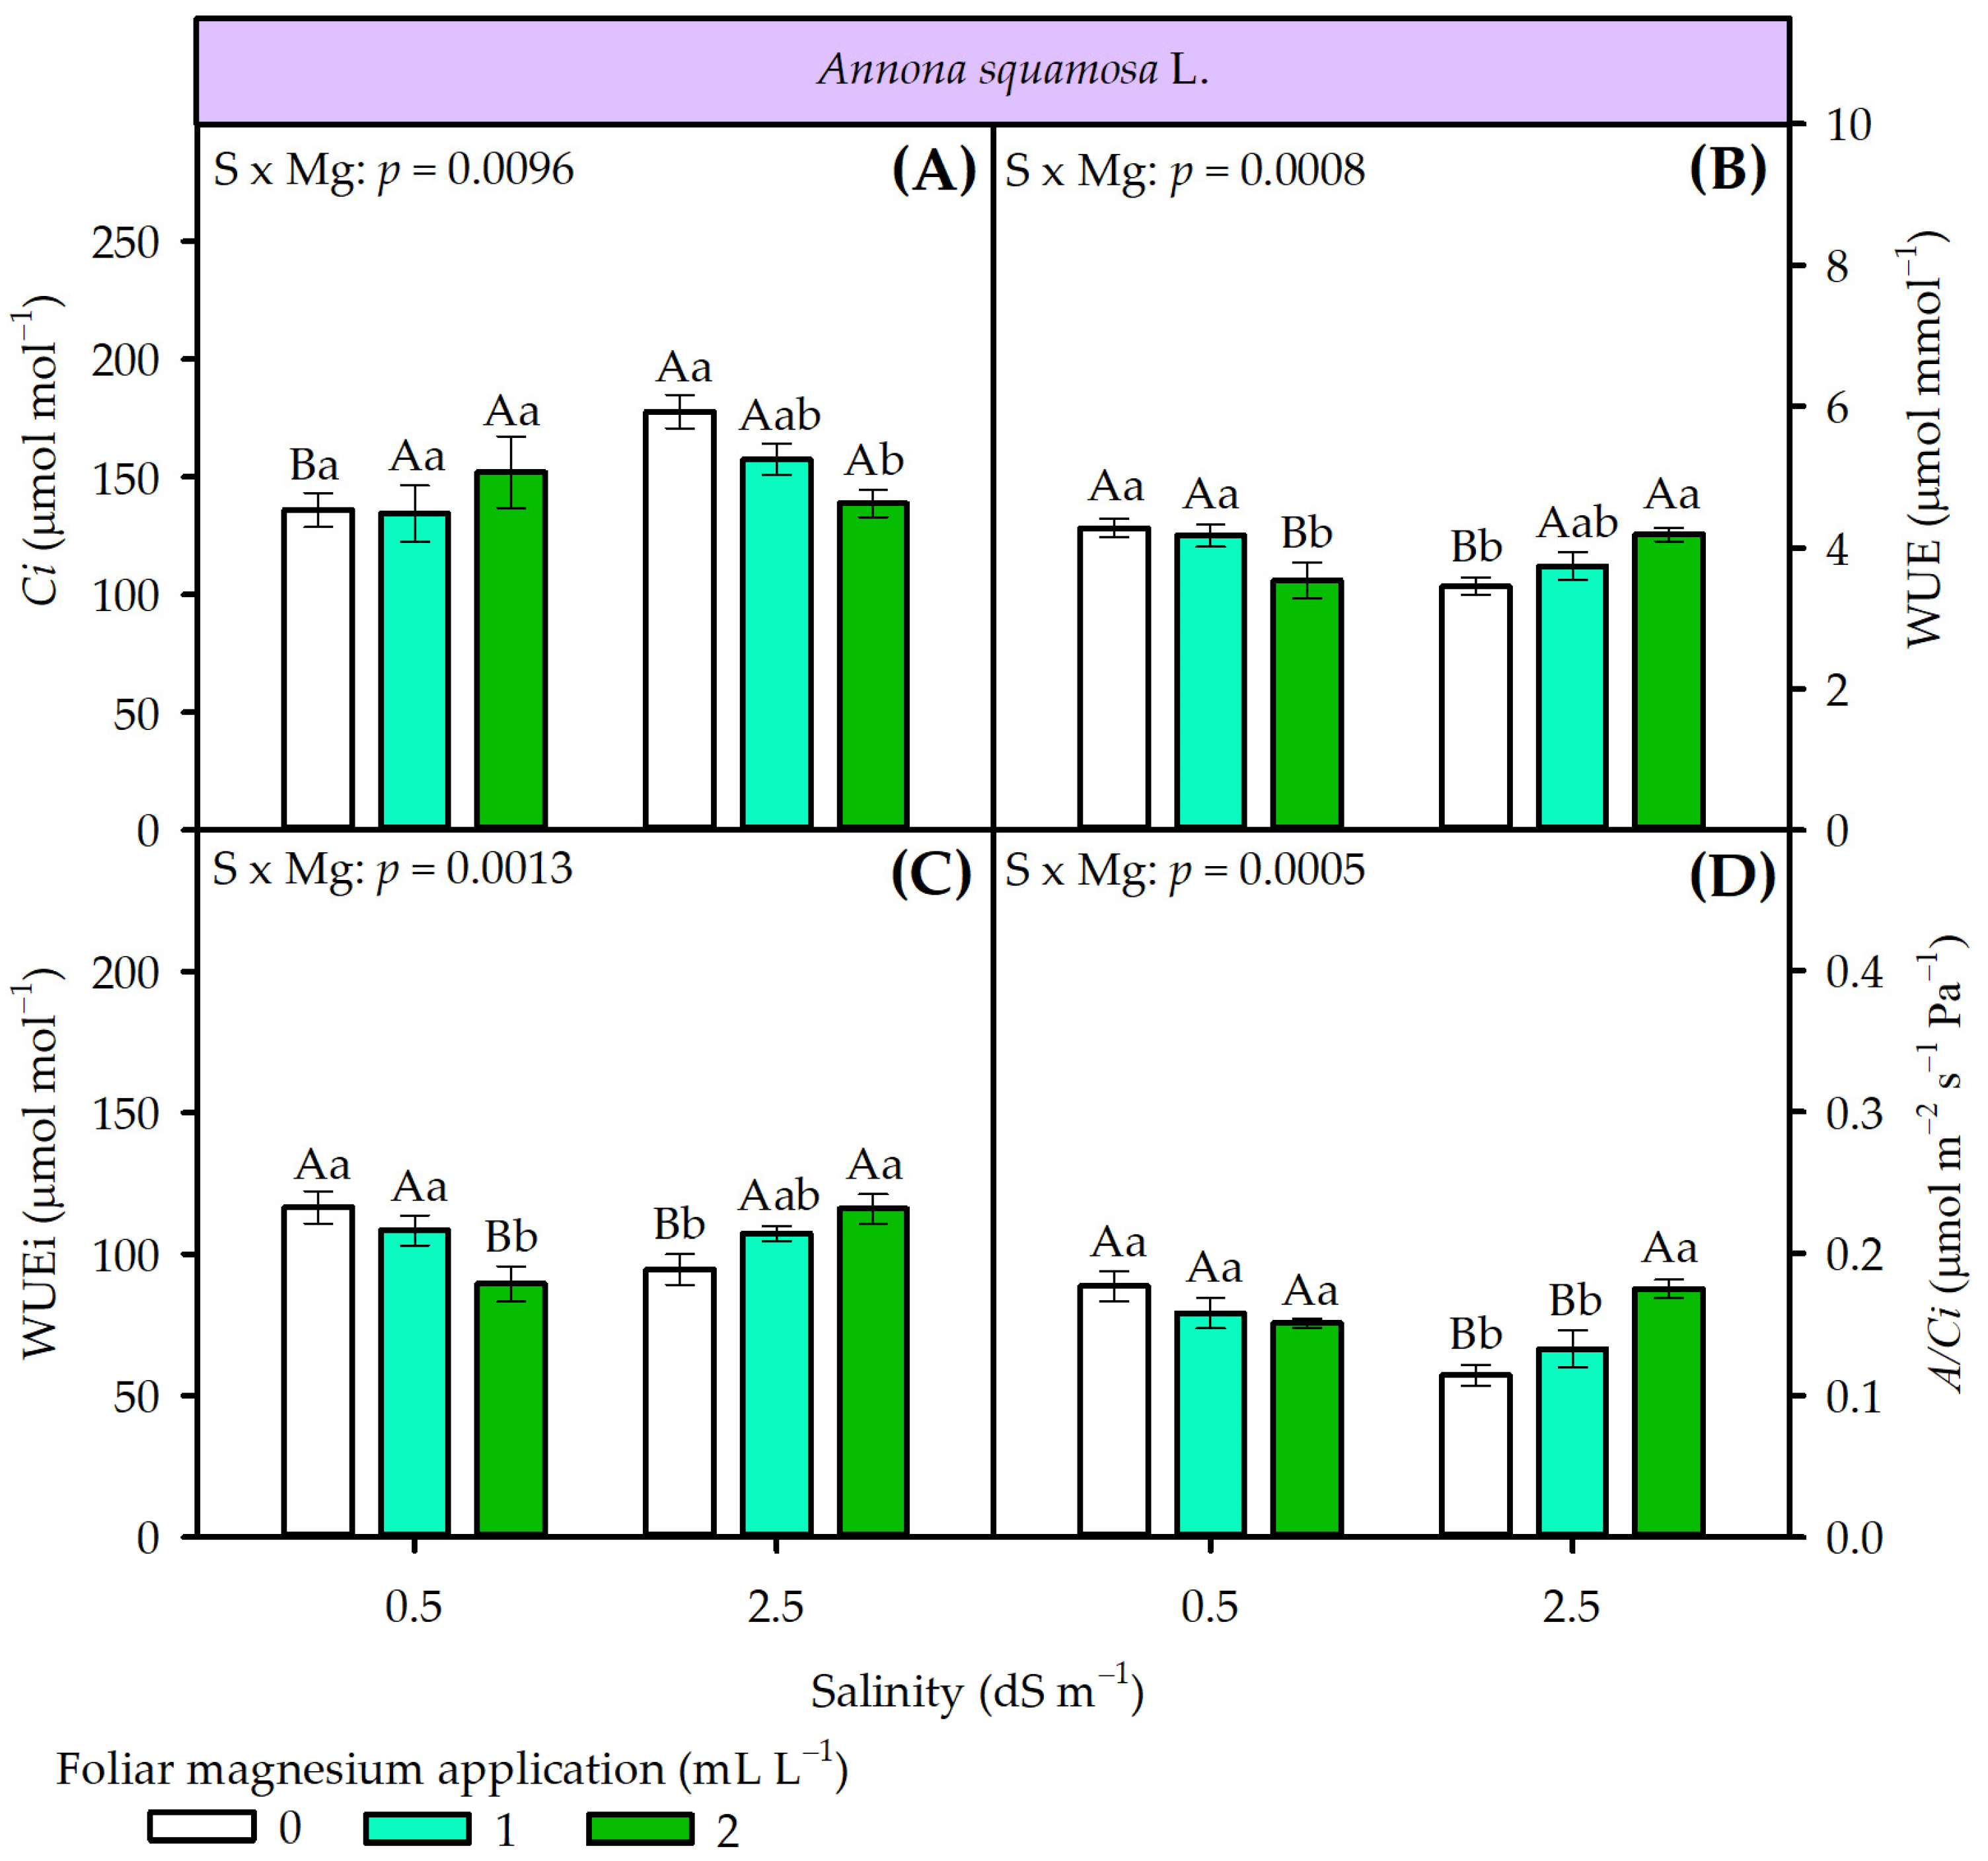
The interaction (S × Mg) significantly influenced (p ≤ 0.05) the Ci (p = 0.0096), the WUE (p = 0.0008), the WUEi (p = 0.0013), and the A/Ci (p = 0.0005) of A. squamosa plants (Figure 9). Regarding Ci, salinity levels differed significantly only at the 0 mL L−1 Mg dosage, where 2.5 dS m−1 led to the highest value (177.75 µmol mol−1), 23.48% higher than the 0.5 dS m−1 salinity (Figure 9A). When comparing Mg doses between salinity levels, the 0.5 dS m−1 condition showed no significant difference, maintaining an average Ci of 140.83 µmol mol−1. Under 2.5 dS m−1, the 0 mL L−1 Mg dose resulted in the highest Ci (177.75 µmol mol−1), which showed a significant difference from the 2 mL L−1 dose.
A. squamosa plants showed significant reductions of 19.39% in WUE and 18.93% in WUEi under a salinity of 2.5 dS m−1, compared to 0.5 dS m−1, only in the absence of foliar Mg (0 mL L−1) (Figure 9B,C). In contrast, the 2 mL L−1 dose of Mg, a salinity of 2.5 dS m−1, significantly increased WUE and WUEi by 15.51% and 22.83%, respectively, compared to 0.5 dS m−1. Under 0.5 dS m−1, the 2 mL L−1 dose of Mg decreased WUE and WUEi by 17.29% and 23.23%, respectively, compared to the 0 mL L−1 dose, and by 15.11% and 17.45%, respectively, compared to the 1 mL L−1 dose. On the other hand, when plants were exposed to 2.5 dS m−1, the dose of 2 mL L−1 of Mg exhibited a significantly higher performance compared to the 0 mL L−1 dose, increasing WUE by 17.67% and WUEi by 18.51% (Figure 9B,C).
At 2.5 dS m−1, there was a marked decrease in A/Ci of 38.89% and 18.75% at doses of 0 and 1 mL L−1, respectively, in relation to 0.5 dS m−1 (Figure 9D). However, at a Mg dose of 2 mL L−1, the salinity of 2.5 dS m−1 did not differ significantly in A/Ci compared to that of 0.5 dS m−1, obtaining an average value of 0.16 µmol m−2 s−1 Pa−1. The Mg doses did not differ significantly among themselves at a salinity of 0.5 dS m−1, yielding an average A/Ci of 0.16 µmol m−2 s−1 Pa−1. However, at 2.5 dS m−1, the dose of 2 mL L−1 differed significantly from the other doses, presenting the highest A/Ci (0.17 µmol m−2 s−1 Pa−1).
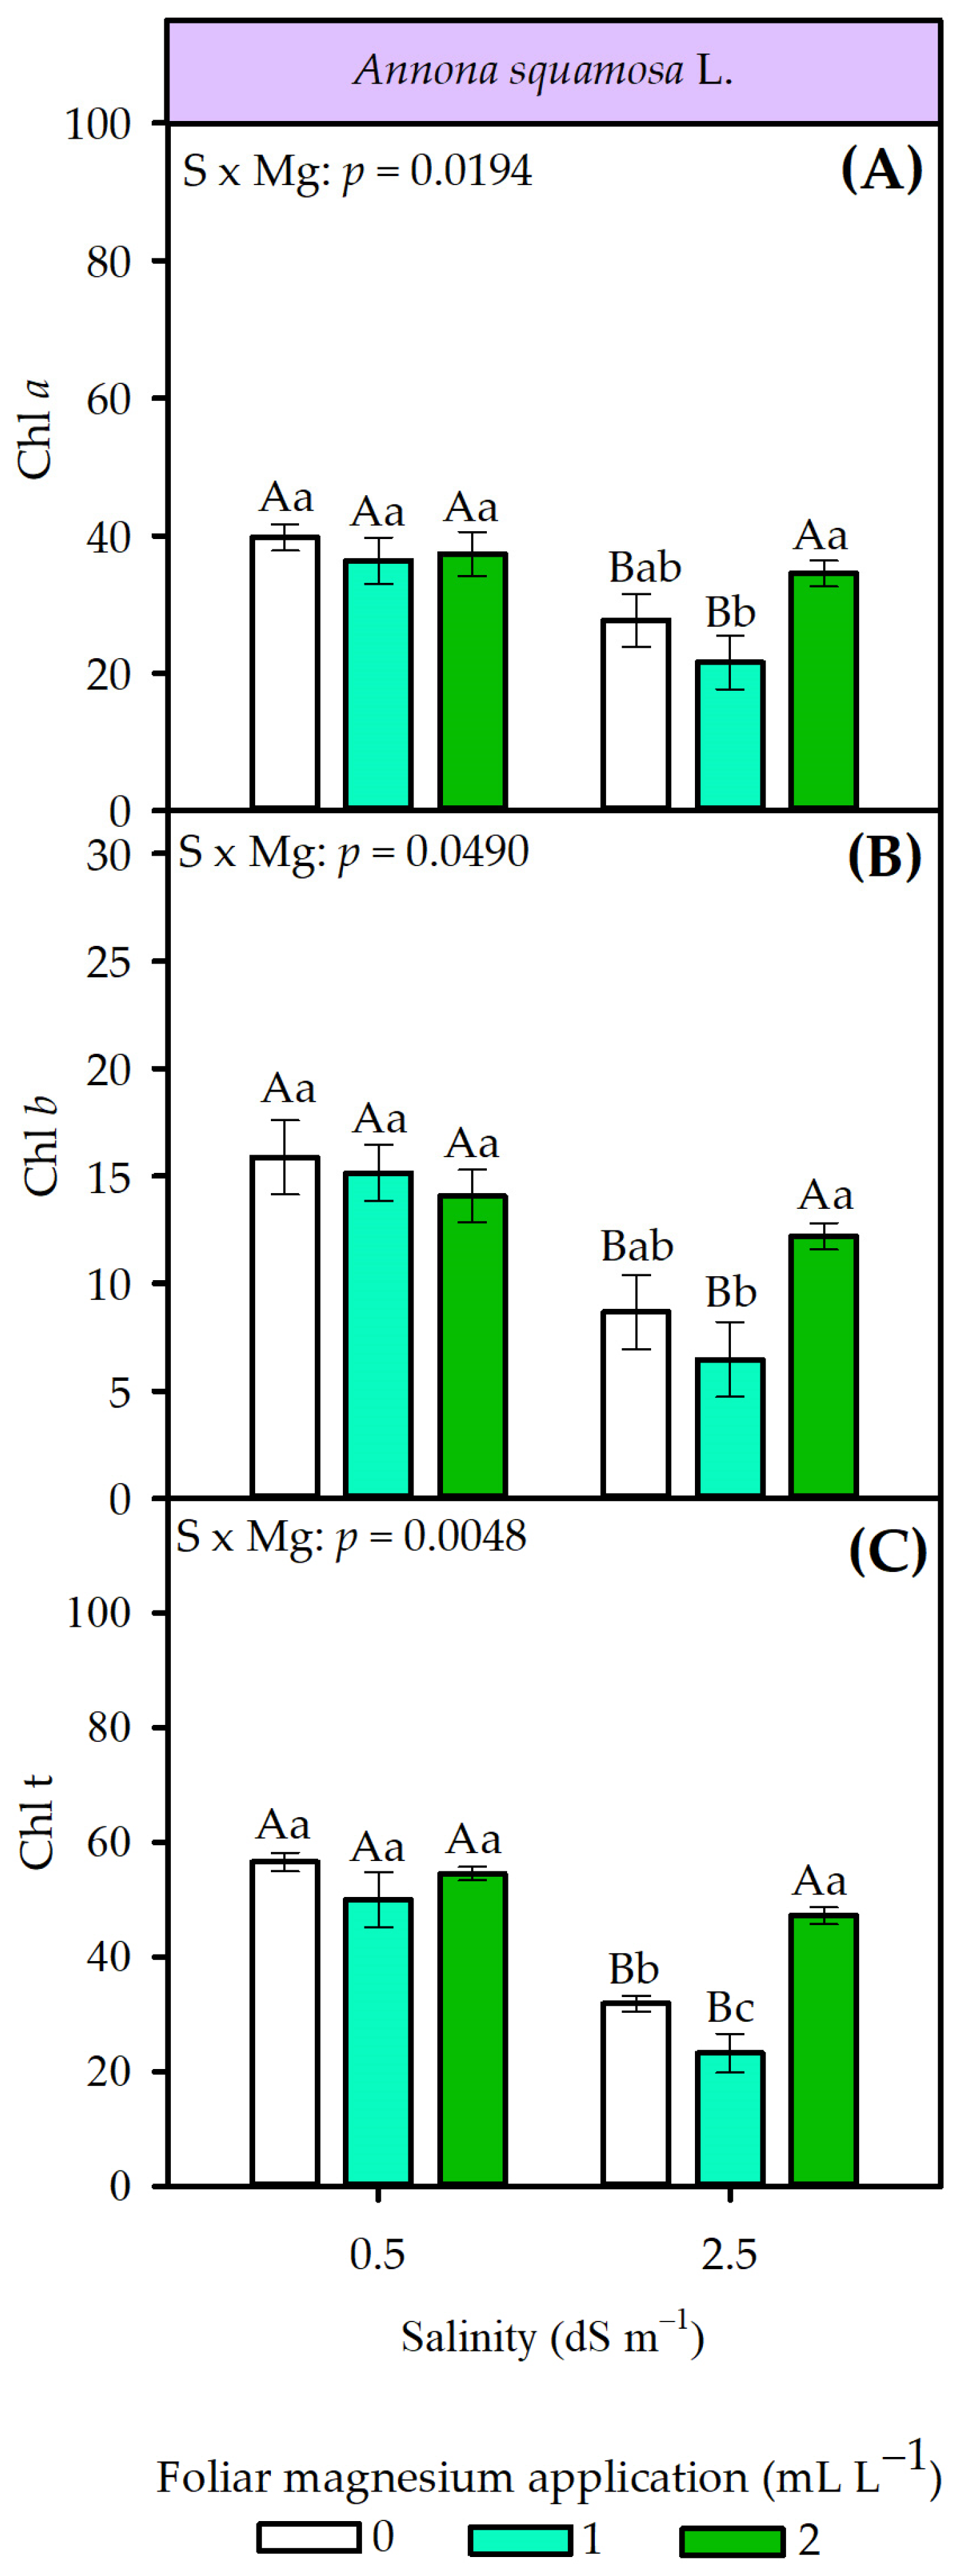
The interaction between the factors (S × Mg) significantly affected chlorophyll a (p = 0.0194), chlorophyll b (p = 0.0490), and total chlorophyll (Chl t) (p = 0.0048) in A. squamosa plants (Figure 10). Foliar application of 2 mL L−1 of Mg maintained chlorophyll levels under a salinity of 2.5 dS m−1, with no statistical differences compared to the 0.5 dS m−1 condition (Figure 10A–C). On the other hand, at dosages of 0 and 1 mL L−1 of Mg, a salinity of 2.5 dS m−1 significantly reduced chlorophyll a, chlorophyll b, and total chlorophyll in relation to 0.5 dS m−1. Specifically, the reductions reached 30.26%, 45.37%, and 43.59% at the 0 mL L−1 Mg dose and 40.74%, 57.29%, and 53.50% at the 1 mL L−1 dose, respectively (Figure 10A–C).
At a salinity level of 0.5 dS m−1, the Mg doses did not differ significantly for Chl a, Chl b, or total chlorophyll (Chl t), with average values of 37.84%, 15.04%, and 53.52%, respectively (Figure 10A–C). However, at 2.5 dS m−1, the Mg dose at 2 mL L−1 differed significantly from the dose at 1 mL L−1 for Chl a and Chl b, being 37.47% and 46.97% higher, respectively. For Chl t, at 2.5 dS m−1, the Mg dose at 2 mL L−1 differed significantly from the 0 mL L−1 dose, being 32.27% higher, and from the 1 mL L−1 dose, showing a superiority of 50.76% (Figure 10C).
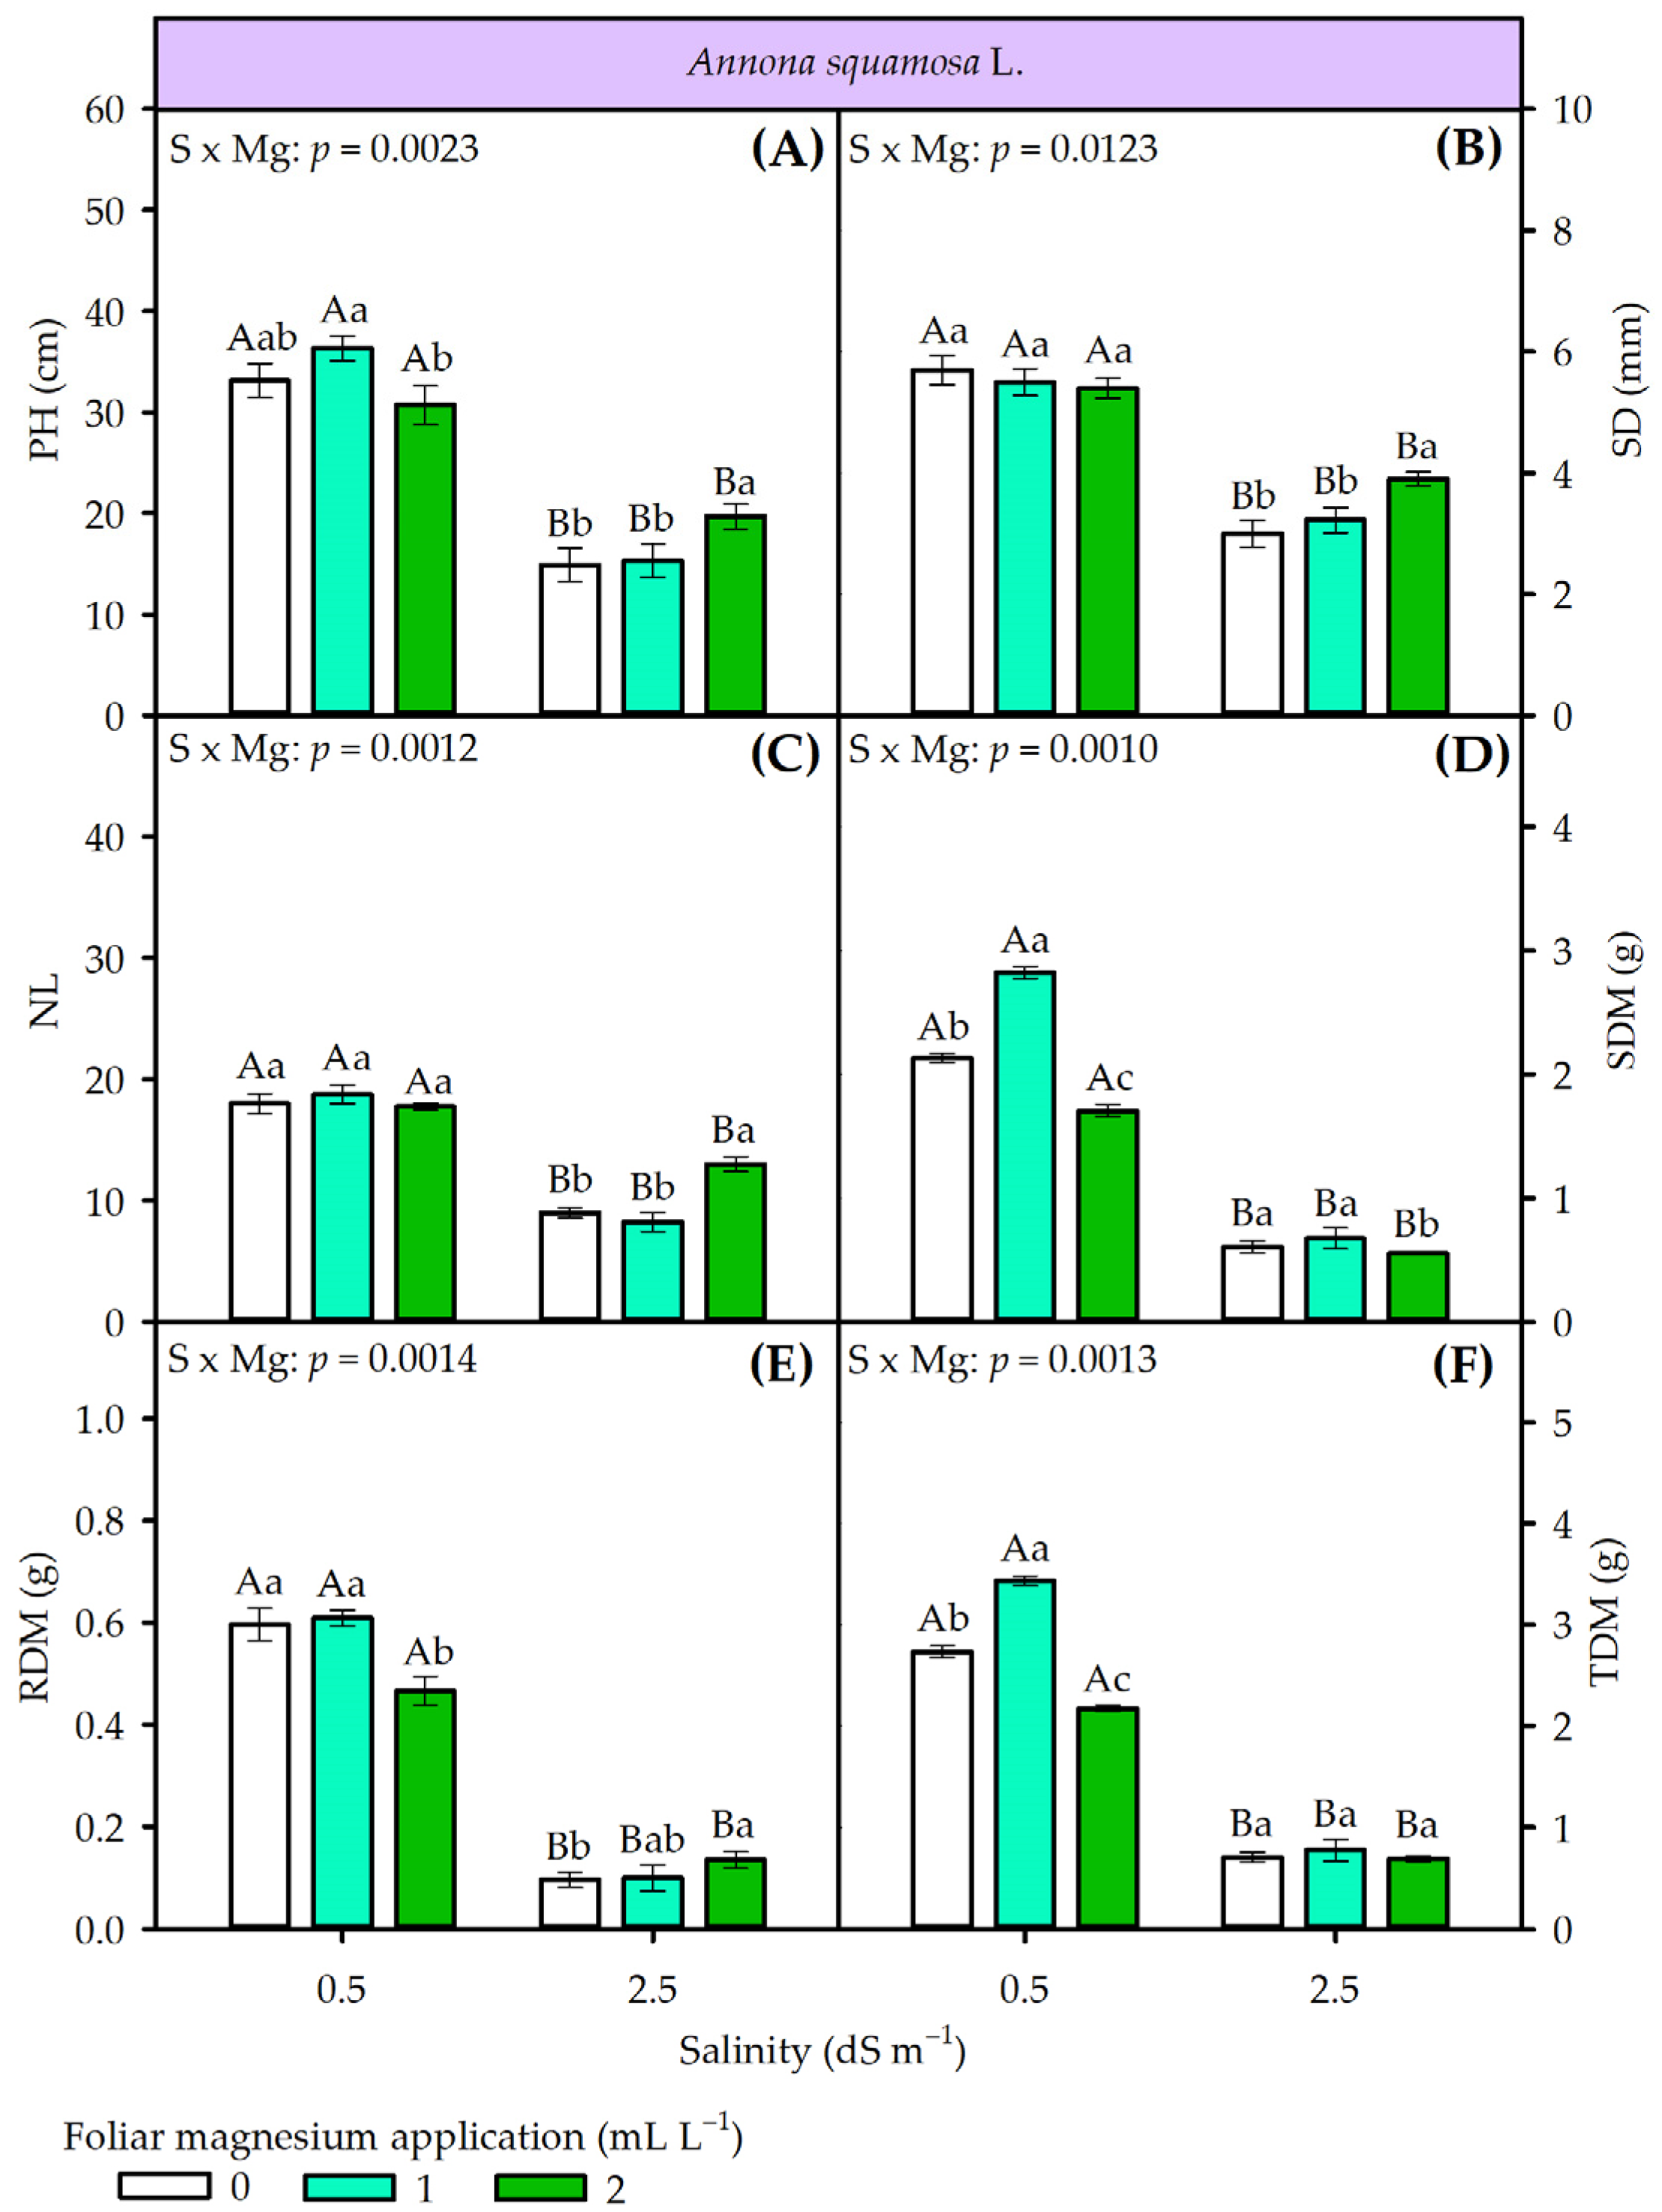
The interaction (S × Mg) significantly influenced the growth and biomass variables of A. squamosa, specifically plant height (PH, p = 0.0023), stem diameter (SD, p = 0.0123), number of leaves (NL, p = 0.0012), and shoot dry mass (SDM, p = 0.0010), root dry mass (RDM, p = 0.0014), and total dry mass (TDM, p = 0.0013) (Figure 11). High salinity (2.5 dS m−1) led to a significant reduction in all growth variables at all Mg dosages in relation to the low salinity condition (0.5 dS m−1). At magnesium doses of 0, 1, and 2 mL L−1, respectively, the salinity-induced reductions were: 55.05%, 57.82%, and 35.89% for PH (Figure 11A); 47.37%, 40.91%, and 22.78% for SD (Figure 11B); 50.00%, 56.00%, and 25.71% for NL (Figure 11C). For biomass, the reductions reached 71.36%, 76.24%, and 67.83% for SDM (Figure 11D); 83.89%, 83.72%, and 71.24% for RDM (Figure 11E); and 74.00%, 77.55%, and 68.20% for TDM (Figure 11E).
Regarding Mg dosages at 0.5 dS m−1, SD and NL did not show significant differences, maintaining average values of 5.53 mm and 18 leaves, respectively (Figure 11B,C). On the other hand, the 2 mL L−1 Mg dose resulted in lower PH (30.73 cm) and RDM (0.47 g) values, which differed significantly from those of the other treatments (Figure 11A,E). For SDM and TDM, the 1 mL L−1 Mg dose stimulated the greatest growth, differing significantly from the 0 mL L−1 dose; the latter, in turn, showed significantly superior performance to the 2 mL L−1 dose, which presented the lowest values of 1.71 and 2.17 g, respectively (Figure 11D,F).
At 2.5 dS m−1, the Mg dose at 2 mL L−1 differed significantly from the others, promoting the highest values of PH (19.70 cm), SD (3.90 mm), and NL (13) (Figure 11A–C). However, for SDM, the Mg dose of 2 mL L−1, which yielded the lowest result (0.55 g), differed significantly from the remaining treatments (Figure 11D). For RDM, the Mg dose of 2 mL L−1 showed the highest average (0.13 g), which differed significantly from the Mg dose of 0 mL L−1 (Figure 11E). However, the Mg doses did not differ significantly from each other for TDM, with an average of 0.72 g (Figure 11F).

3.3. Biomass-Based Salt Tolerance Index of Annona muricata L. and Annona squamosa L. Seedlings Supplemented with Foliar Mg

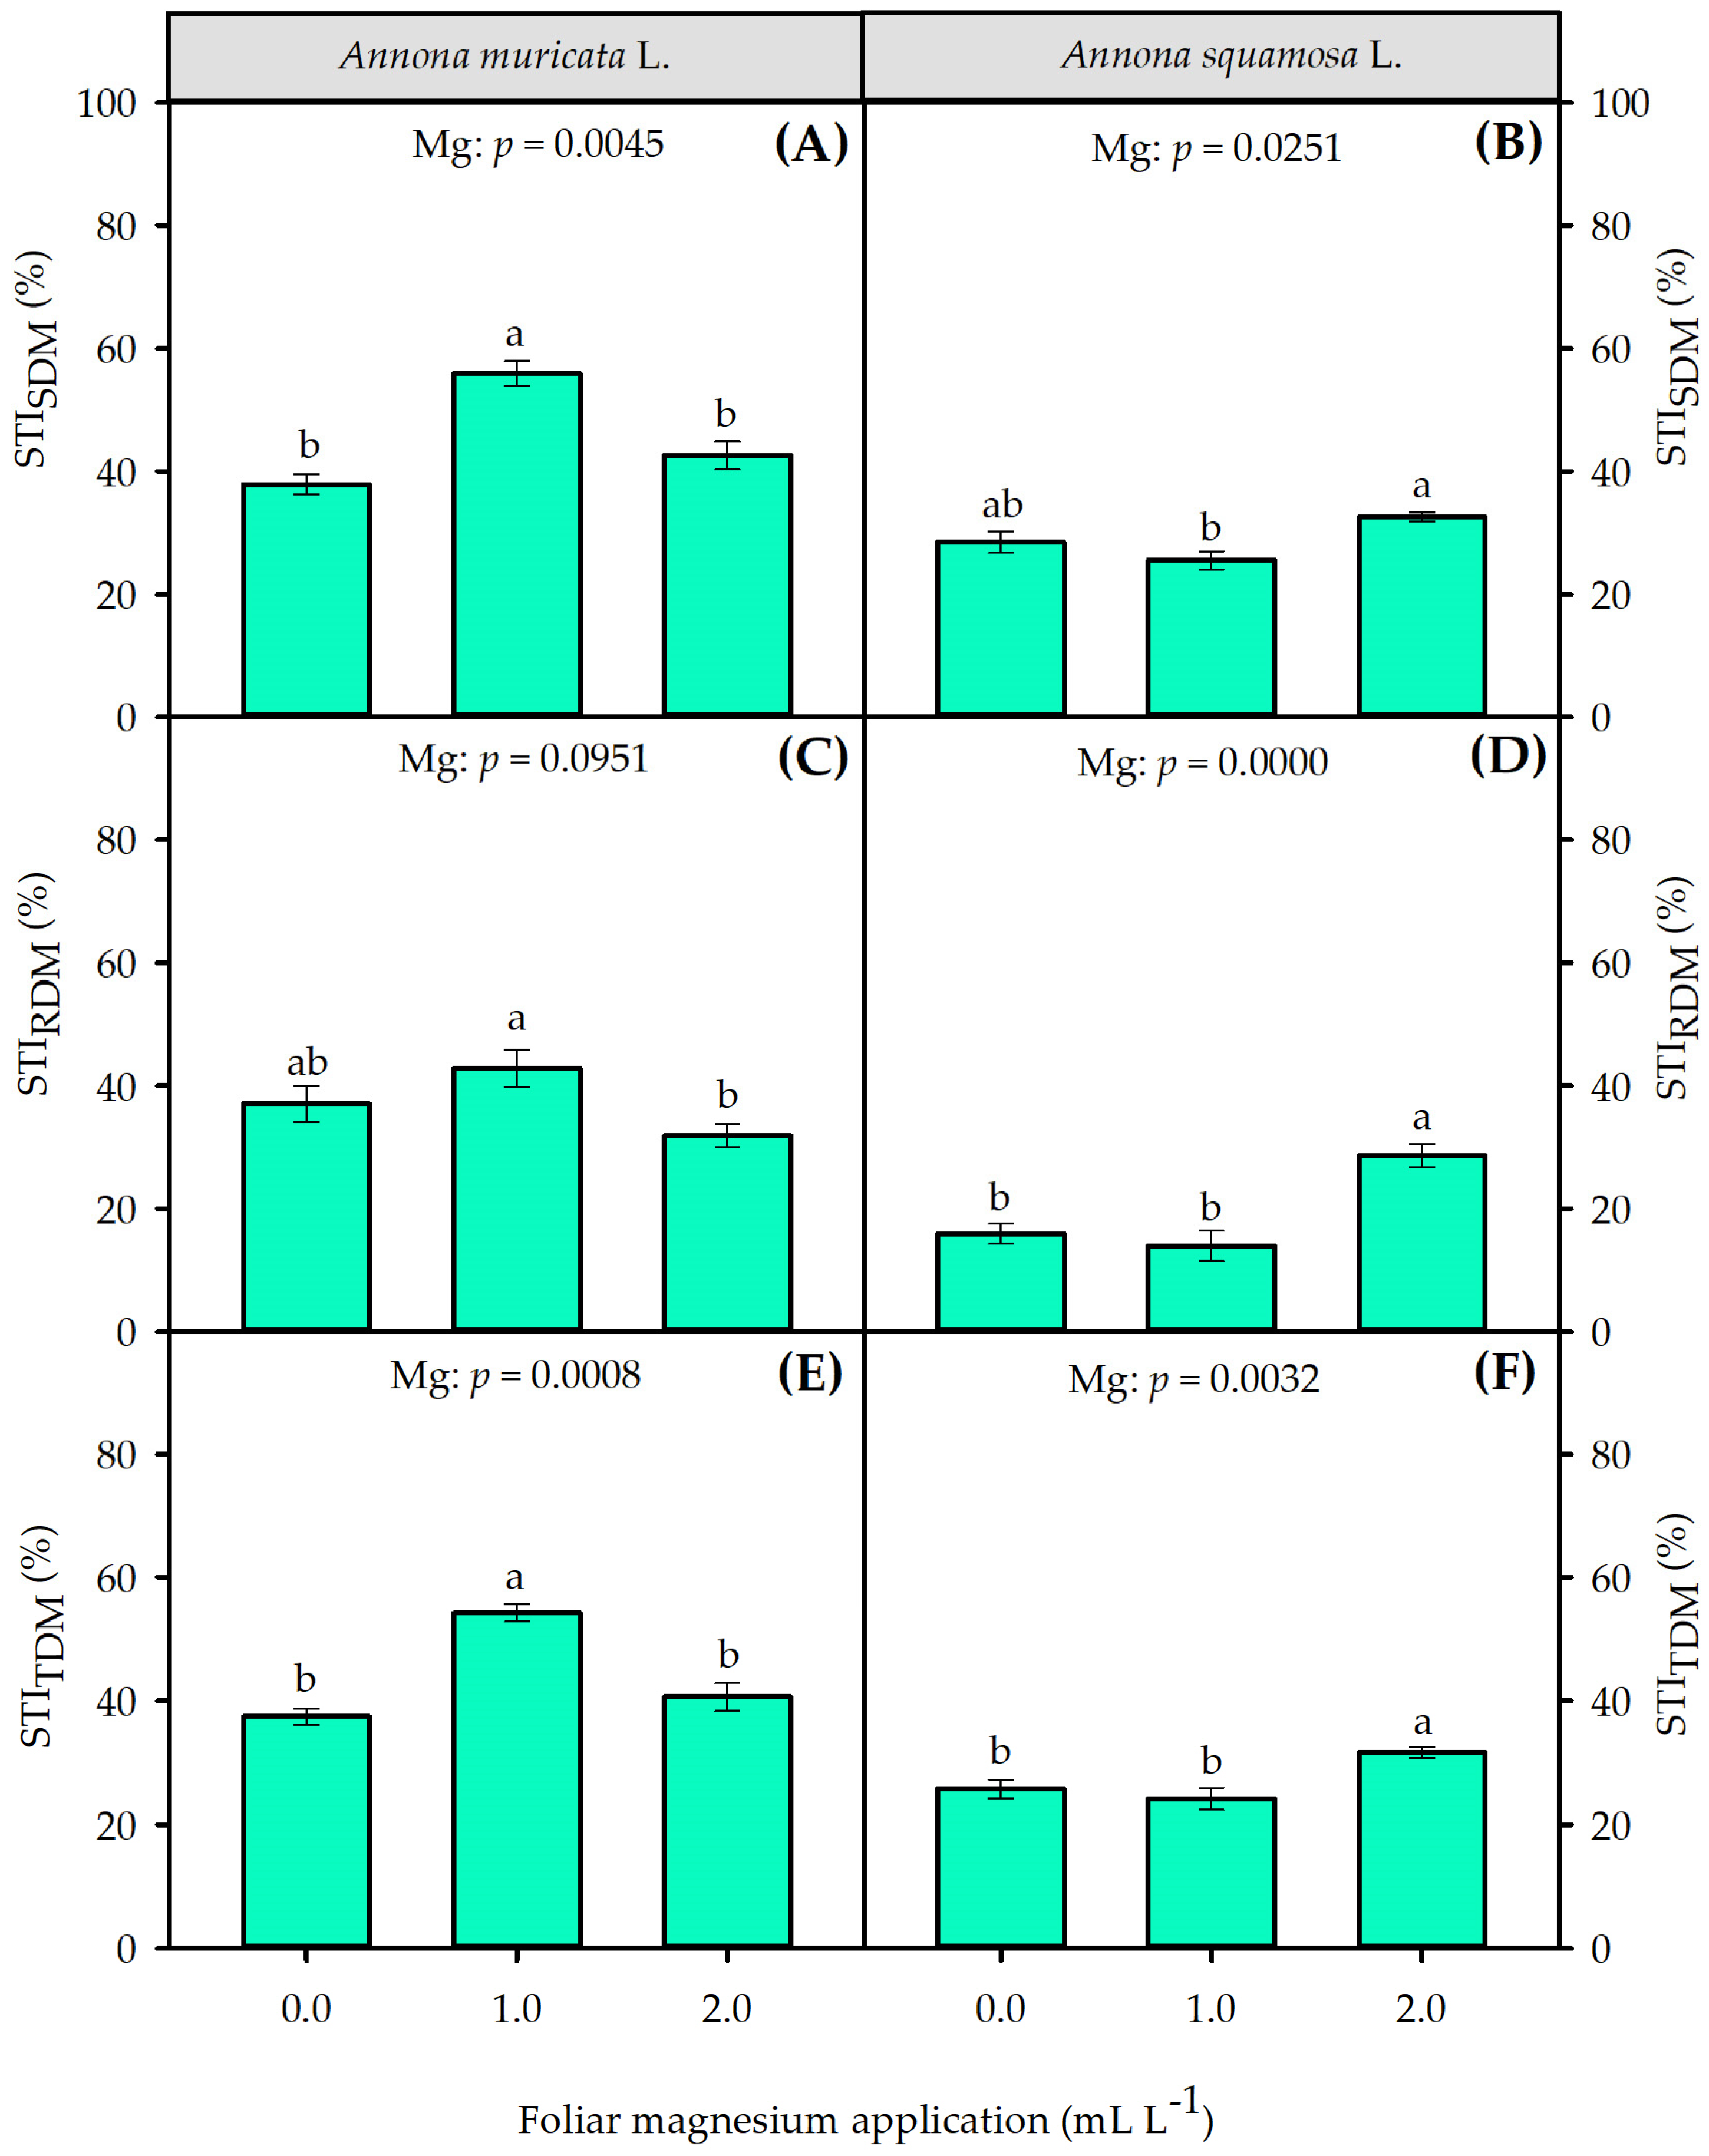
Regarding the Salt Tolerance Index (STI), the 1 mL L−1 Mg dose exhibited significantly higher performance compared to the remaining treatments in A. muricata plants, resulting in higher values for STISDM (59.93%), STIRDM (42.83%), and STITDM (40.62%) (Figure 12A,C,E). In contrast, for A. squamosa plants, the 2 mL L−1 Mg dose differed significantly from the others, reaching the highest values for STISDM (32.60%), STIRDM (28.61%), and STITDM (31.73%) (Figure 12B,D,F).
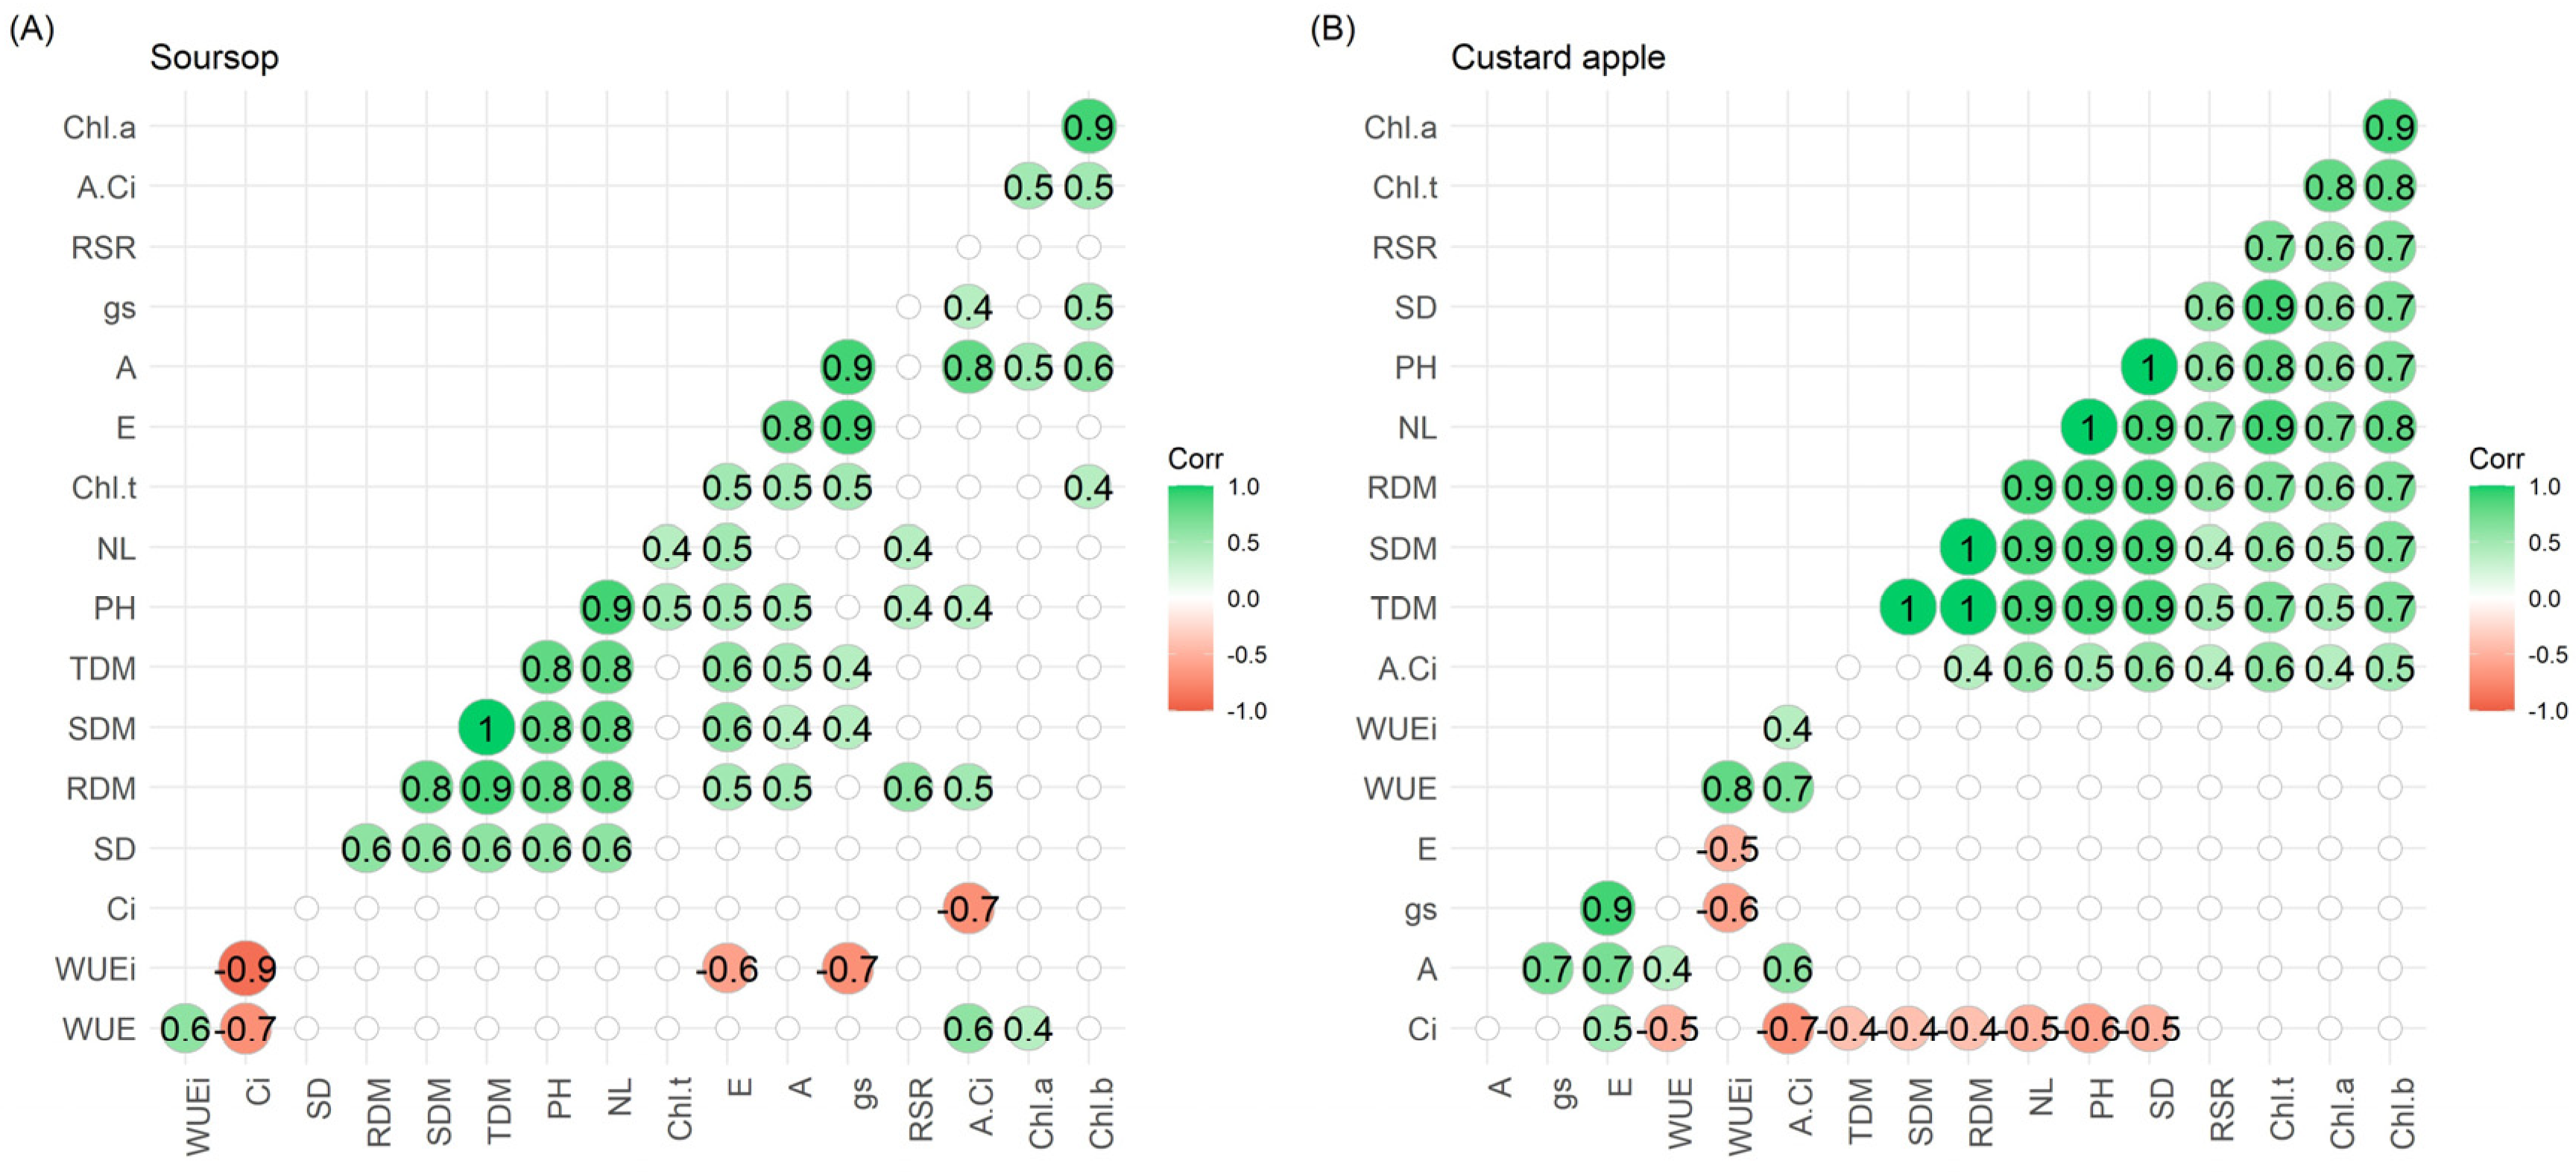
Correlation coefficients based on Pearson’s approach for soursop plants (A. muricata L.) (Figure 13A) revealed strong positive correlations (p ≤ 0.05; r ≥ 0.70) between gas exchange and growth parameters. Specifically, CO2 assimilation (A) showed a strong correlation with gs (r = 0.90), E (r = 0.80), and A/Ci (r = 0.80). Regarding growth, the NL and PH showed high positive correlations (r = 0.80–0.90) with all biomass components (RDM, SDM, and TDM), while chlorophyll a and chlorophyll b also showed strong positive correlations (r = 0.90). On the other hand, the analysis revealed significant negative correlations (p ≤ 0.05; r ≤ −0.70) between the internal CO2 concentration (Ci) and water use efficiency parameters, including WUE (r = −0.70), WUEi (r = −0.90), and A/Ci (r = −0.70), as well as between gs and WUEi (r = −0.70).
In A. squamosa L. (Figure 13B), strong positive correlations were identified (p ≤ 0.05; r ≥ 0.70) between physiological and morphological characteristics. Total dry mass (TDM) showed almost perfect correlations with all growth and biomass parameters of SDM (r = 1.00), RDM (r = 1.00), NL (r = 0.90), PH (r = 0.90), and SD (r = 0.90). Furthermore, TDM and NL correlated strongly with chlorophyll content (chlorophyll b and total chlorophyll), with values ranging from 0.70 to 0.90. Regarding gas exchange, A showed significant positive associations with gs (r = 0.70) and E (r = 0.70), while gs and E showed a very strong correlation (r = 0.90). In contrast to the multiple negative correlations observed in soursop, custard apple plants showed only one negative correlation (p ≤ 0.05; r ≤ −0.70), between Ci and A/Ci (r = −0.70).
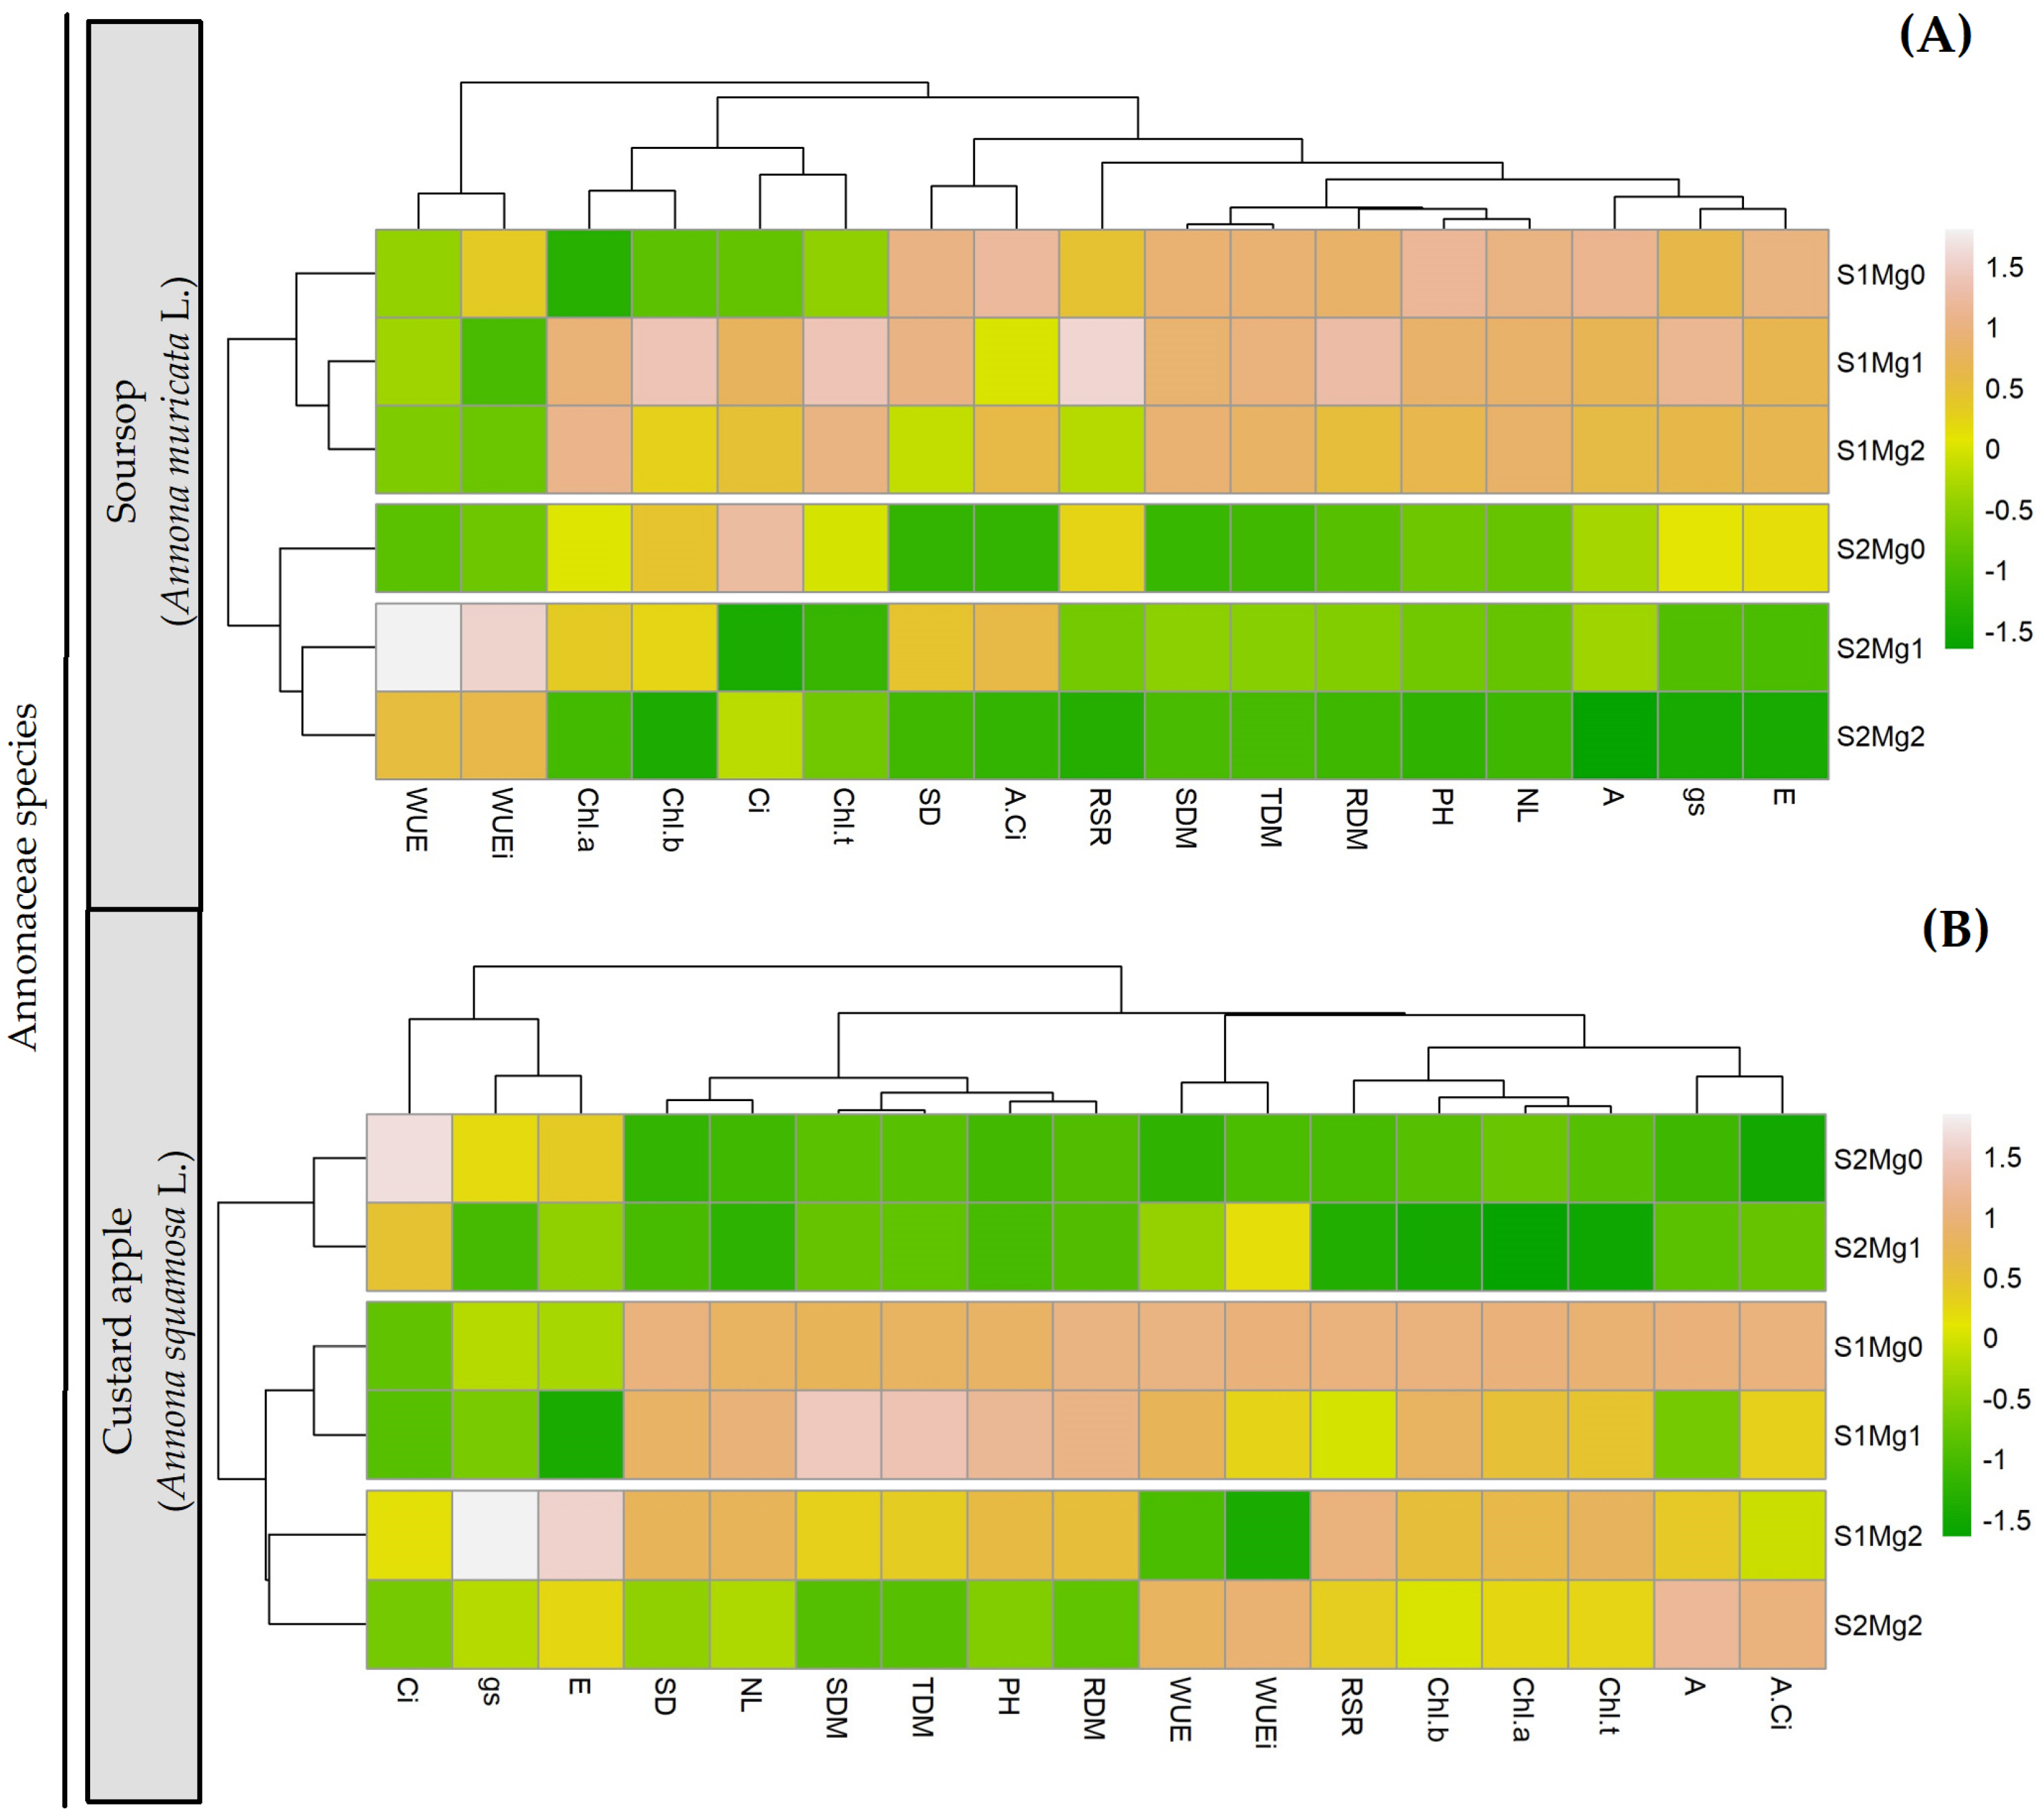
A heatmap based on clustering with Euclidean distance identified three distinct treatment groups, each characterized by the influence of its members on the analyzed characteristics. For soursop (A. muricata L.), the largest cluster comprised all treatments at 0.5 dS m−1, regardless of the Mg dosage (0, 1, and 2 mL L−1) (Figure 14A). The main characteristics that contributed to this clustering were A, gs, E, NL, PH, SD, RDM, SDM, and TDM. Furthermore, when foliar Mg was applied at 1 and 2 mL L−1 under low salinity (0.5 dS m−1), chlorophyll pigments (Chl a, Chl b, and Chl t) also proved to be significant contributors to the formation of the cluster.
The combination of 2.5 dS m−1 salinity and the absence of Mg (0 mL L−1) formed an isolated group, driven mainly by Ci, Chl b, and RSR (Figure 14A). The final cluster was composed of a salinity of 2.5 dS m−1 and 1–2 mL L−1 of Mg. In the treatment with a salinity of 2.5 dS m−1 and 2 mL L−1 of Mg, WUE and WUEi emerged as the most influential characteristics. In addition to these efficiency parameters, the combination of a salinity of 2.5 dS m−1 and a dosage of 1 mL L−1 of Mg also significantly contributed to the formation of the cluster, as did Chl a, Chl b, SD, and A/Ci.
In the clustering heatmap for first-growth plants (A. squamosa L.) (Figure 14B), the group with the greatest positive contribution of the analyzed characteristics comprised plants at 0.5 dS m−1 and dosages of 0 and 1 mL L−1 Mg. At the 0 mL L−1 Mg dose, almost all characteristics, except E, gs, and Ci, made the greatest contribution to cluster formation. In the treatment with 1 mL L−1 Mg, the most prominent characteristics included SD, NL, SDM, TDM, PH, RDM, WUE, and Chl b. The second main cluster included treatments under salinity of 0.5 dS m−1 and 2.5 dS m−1, specifically at a dosage of 2 mL L−1 Mg. For the combination of salinity of 0.5 dS m−1 and Mg of 2 mL L−1, the most significant characteristics were gs, E, SD, NL, PH, RDM, RSR, Chl b, Chl a, and Chl t. Notably, at 2.5 dS m−1 and Mg of 2 mL L−1, the clustering was characterized by A, A/Ci, E, WUE, WUEi, RSR, Chl a, and Chl t.
The last grouping in the A. squamosa L. heatmap, which showed the smallest contribution among the analyzed characteristics, comprised plants with a salinity of 2.5 dS m−1 and 0 or 1 mL L−1 of foliar Mg (Figure 14B). At 2.5 dS m−1 and 0 mL L−1 of foliar Mg, the most prominent characteristics were Ci, gs, and E. On the other hand, the combination of a salinity level of 2.5 dS m−1 and 1 mL L−1 of foliar Mg was characterized mainly by Ci and WUEi.
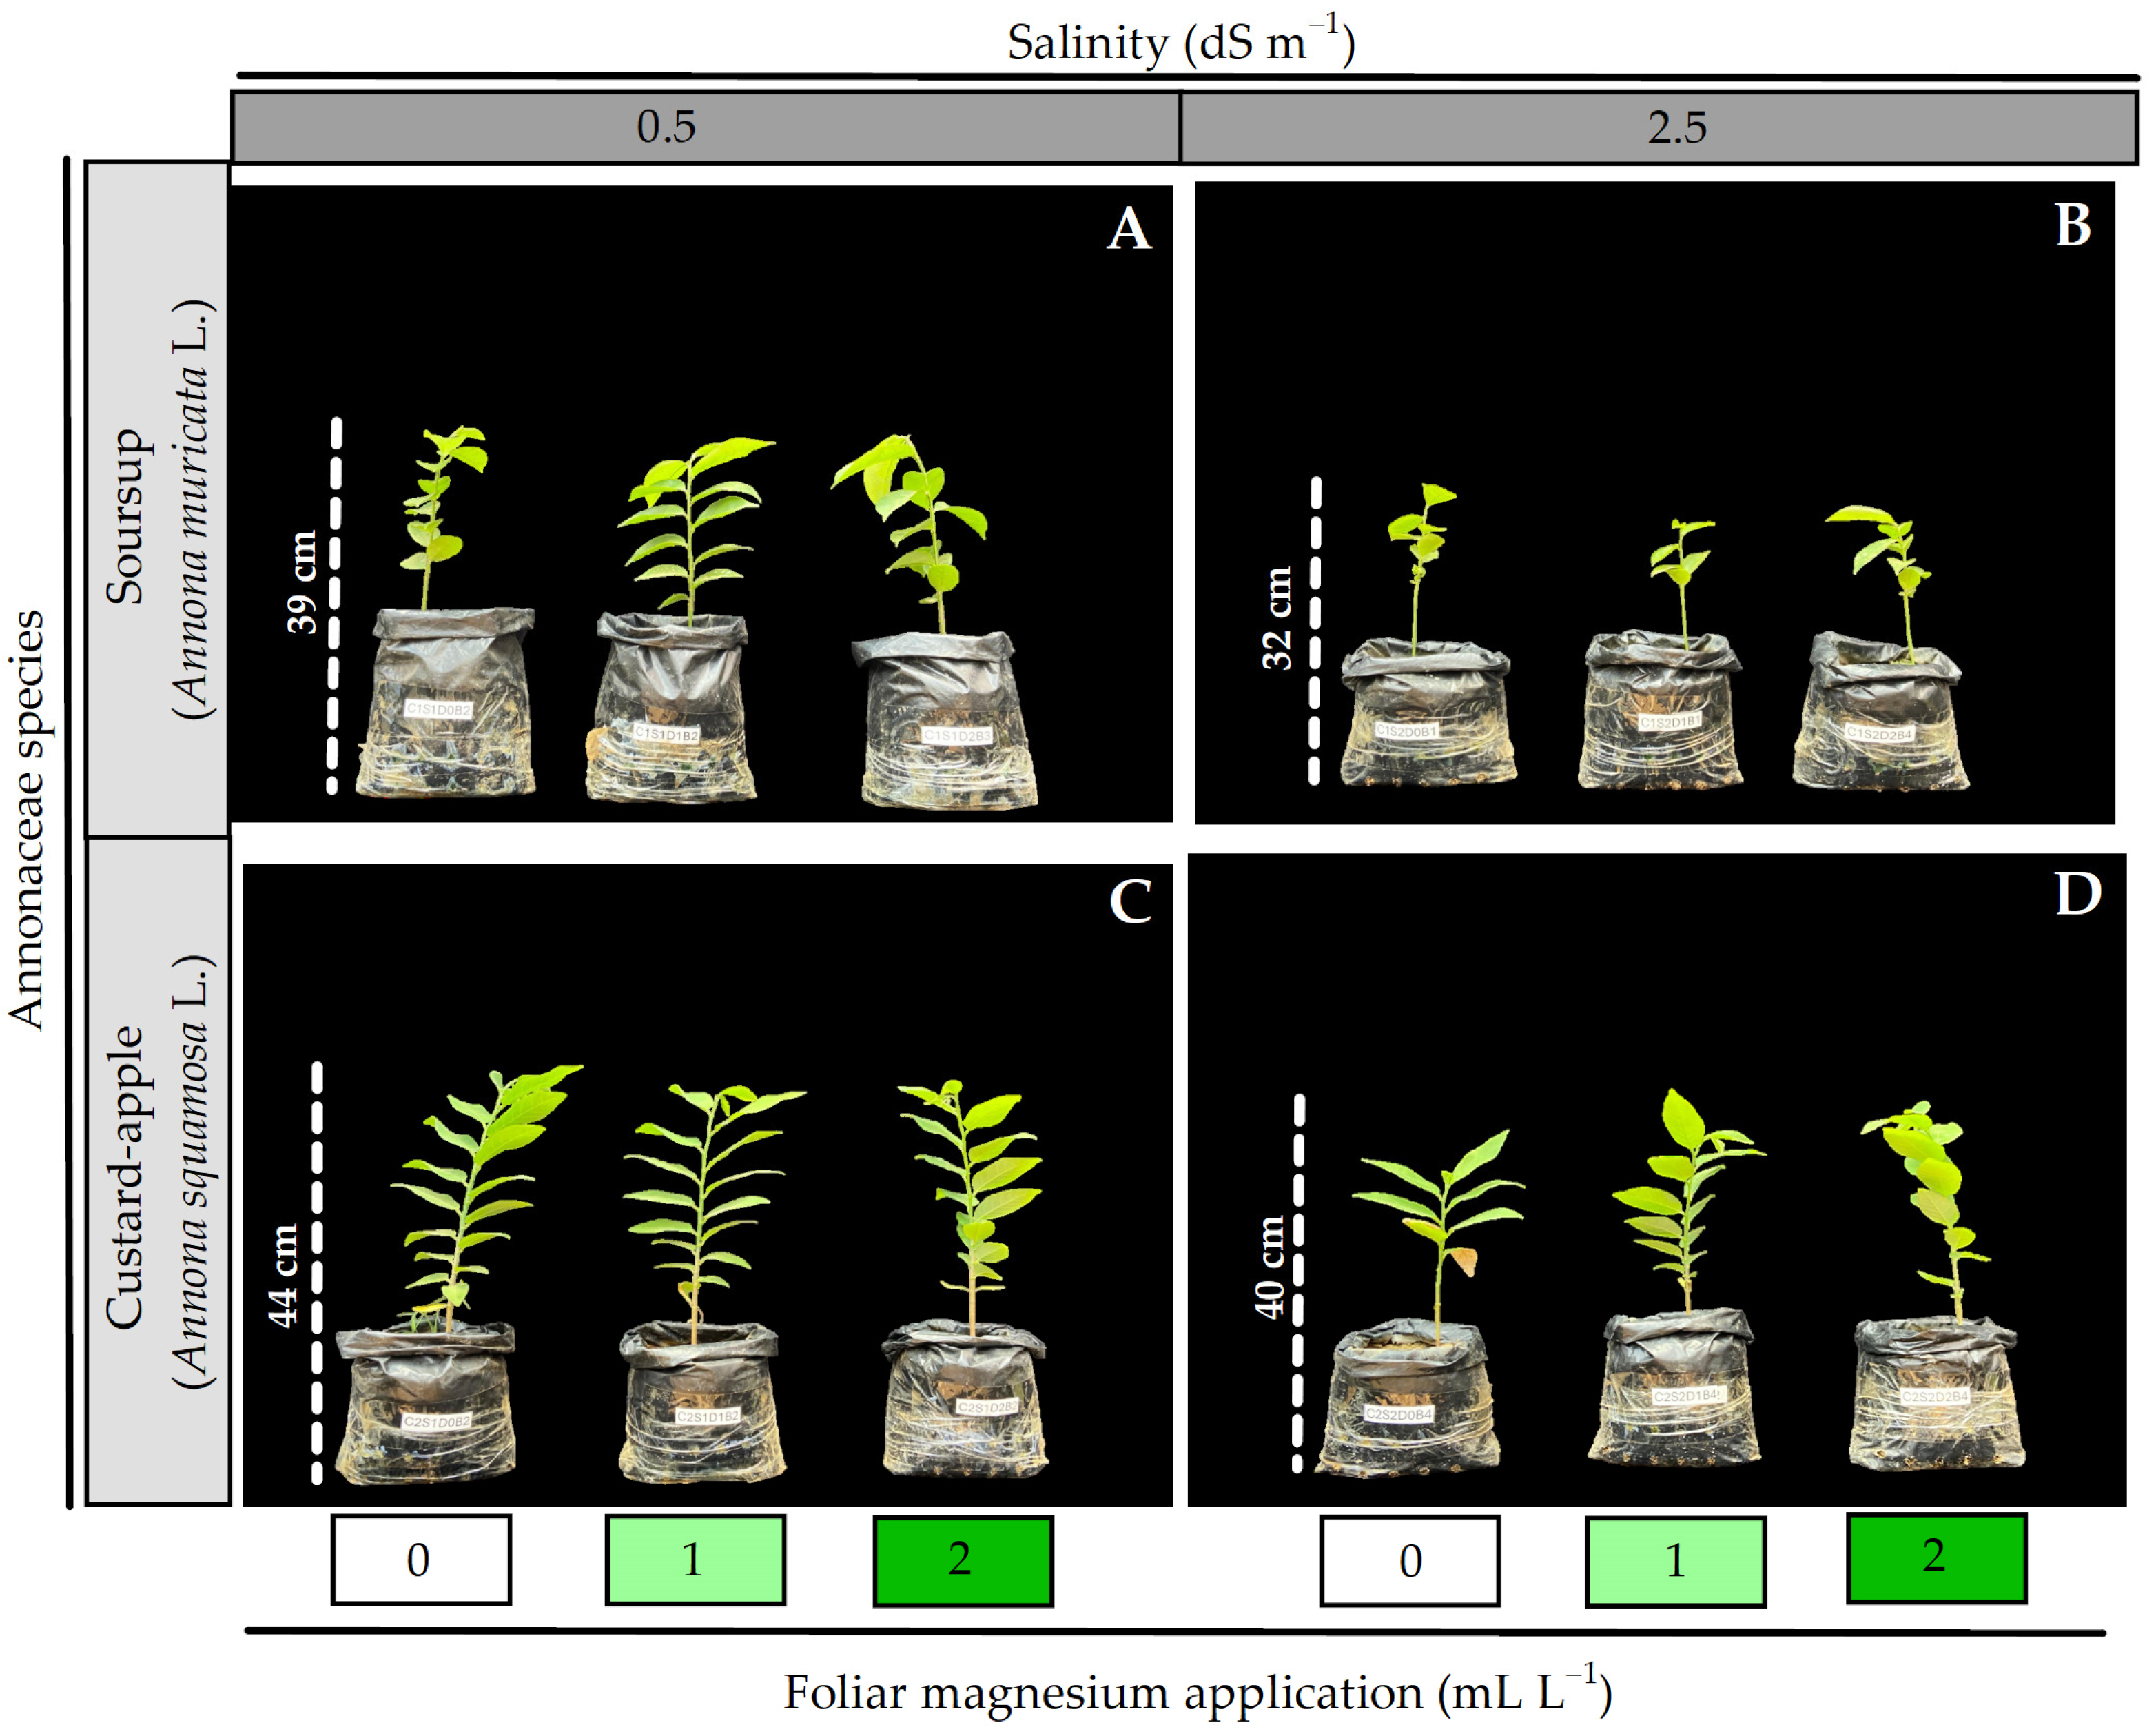
Seedlings of A. squamosa L. exhibit greater heights than those of A. muricata L. under a salinity of 0.5 dS m−1 (Figure 15). Under the salinity condition of 0.5 dS m−1, Mg doses did not express a phenotypic effect in A. squamosa L. and A. muricata L. plants (Figure 15A,C). However, at 2.5 dS m−1, in A. squamosa L. plants, when Mg was provided at a dose of 2 mL L−1, both leaf number and growth remained stable (Figure 15B).
Regarding A. muricata plants at 2.5 dS m−1, the application of 1 and 2 mL L−1 of Mg significantly maintained plant growth under salt stress. These treatments resulted in better maintenance of leaf number and delayed leaf senescence, thereby improving plant performance under salt stress (Figure 15D).

4. Discussion

The findings of this study reinforce the hypothesis that exogenous magnesium Mg supply serves as a strategic intervention to enhance salt tolerance in fruit crops of the Annonaceae family. In the semi-arid environments of northeastern Brazil, where the cultivation of soursop (A. muricata L.) and sugar apple (A. squamosa L.) carries substantial socioeconomic relevance, agricultural sustainability is constantly challenged by the poor quality of irrigation water. The high salt concentrations typical of these regional aquifers severely hinder the morphophysiological performance of commercial orchards. In this context, the development of mitigating technologies is essential, and our results demonstrate that targeted foliar Mg applications effectively trigger physiological adjustment mechanisms, enabling both species to better withstand the deleterious effects of salinity.
The results confirm that irrigation water salinity of 2.5 dSm−1 affects the growth of Annonaceae plants. Salinity affects the growth and development of these plants due to salt concentrations in the soil solution, and Annonaceae species may exhibit different salinity-tolerance mechanisms due to phenotypic differences [6,7,9,11,41,42], as evidenced by our results.
A. muricata plants, under salinity conditions of 2.5 dS m−1, showed a diminution in growth characteristics such as PH, SD, NL, SDM, RDM, and RSR, without the effect of foliar Mg application. These results are consistent with a simultaneous decrease in CO2 assimilation, stomatal conductance, and transpiration, indicating that photosynthetic inhibition was predominantly associated with stomatal limitation. Reduced stomatal conductance (gs) restricts CO2 diffusion into the leaf and, consequently, limits carbon assimilation and photoassimilate production, aligning with the reductions in growth and biomass accumulation observed in this species [2,8,14].
However, under salinity conditions of 2.5 dS m−1, A. muricata plants maintained the characteristics of WUE, WUEi, Chl a, Chl b, and Chl t, indicating adaptation to saline stress [7,13,43]. Maintaining water use efficiency and chlorophyll content is a plant response to salinity tolerance, which is fundamental for maintaining photosynthetic activity under limiting conditions [2,9,12].
Supplementing A. muricata plants with Mg at 1 mL L−1 stimulated a higher SD and RDM. This is probably due to Mg’s role in the production and translocation of sugars, promoting adequate biomass partitioning in the plant [15,16,44]. Under a salinity of 2.5 dS m−1, Mg at 1 mL L−1 stimulated a higher A/Ci ratio, resulting in a higher TDM and consequently a higher STI. The increase in A/Ci indicates greater apparent carboxylation efficiency, suggesting that Mg mitigation involved a non-stomatal component related to carbon fixation efficiency rather than a direct effect on stomatal opening. This interpretation is consistent with the biochemical role of Mg in Mg–ATP formation and the activation of enzymes involved in the Calvin–Benson cycle and carbohydrate metabolism [18,19,22]. However, direct stimulation of RuBisCO activity cannot be confirmed because enzyme activity and complete A–Ci response curves were not evaluated.
A. squamosa plants, under a salinity of 2.5 dS m−1, showed a reduction in their growth characteristics, such as PH, SD, NL, and TDM, despite maintaining A, gs, and E. This uncoupling between instantaneous leaf gas exchange and biomass accumulation indicates that growth inhibition was not primarily caused by stomatal limitation at the time of measurement. Instead, the reduction in growth may reflect cumulative ionic effects on whole-plant carbon economy, including increased metabolic costs of ion homeostasis and osmotic adjustment, altered photoassimilate allocation, or non-stomatal constraints on photosynthetic metabolism [16]. Foliar application of Mg at 2 mL L−1 attenuated these growth reductions and increased apparent carboxylation efficiency (A/Ci) without a concomitant increase in gs. Therefore, the beneficial effect of Mg is more consistent with improved biochemical use of internal CO2 than with increased stomatal opening [16,21,22]. With Mg supplementation, these plants may exhibit greater photosynthetic activity by activating enzymes involved in CO2 assimilation, thereby improving biomass partitioning [17,18,19].
However, the results of gas exchange in A. squamosa plants demonstrate that these plants are more tolerant to saline stress, as evidenced by the maintenance of A, gs, and E under salinity conditions of 2.5 dS m−1. This response is due to the greater tolerance of these plants to saline stress. As a tolerance mechanism, maintaining active stomata increases the production of photoassimilates [1,8,45].
Exogenous supply of Mg stimulated WUE, A/Ci, and WUEi in A. squamosa under a salinity of 2.5 dS m−1, which is related to these plants showing better growth under these abiotic stress conditions. These results indicate that Mg modulates a higher acclimation capacity of this Annonaceae species to salt stress by better controlling stomatal opening and closing, thereby sustaining CO2 fixation and transpiration and favoring the maintenance of water use efficiency, a limiting factor for plant growth [1,12,46]. Thus, through its role in plant photosynthesis, Mg regulates plant growth and development [15,16,44].
A. squamosa plants maintained higher green NL, with higher chlorophyll content, as evidenced by Chl a, Chl b, and Chl t, under salinity conditions of 2.5 dS m−1 and supplemented with Mg at 2 mL L−1. This allowed them to maintain the growth pattern, as demonstrated by the PH, SD, and RDM characteristics. Thus, it is noted that Mg stimulates chlorophyll synthesis, being the central element of the molecule, acting as an enzymatic cofactor in plant photosynthesis, and being part of the formation of the Mg-ATP compound [15,16,20]. Plants that retain more green leaves may promote greater photosynthetic activity, allowing them to produce more carbohydrates and exhibit greater tolerance to abiotic stress [8,12,46].
In A. squamosa plants, supplementation with Mg at 2 mL L−1 promoted greater photosynthetic activity under salinity conditions of 2.5 dS m−1. This highlights the role of Mg in plant photosynthesis, generating greater production of triose phosphates and energy in the form of adenosine triphosphate (ATP), which are fundamental for energy metabolism. It also promotes greater proton (H+) pumping and sucrose translocation to the sink [16,44]. Therefore, Mg contributes to better growth and development of these plants under stress conditions [8,20,47].
Foliar supplementation with Mg at 2 mL L−1 promoted tolerance to saline stress in A. squamosa plants, as demonstrated by STI. This is due to the maintenance of biomass accumulation in these plants, boosted by foliar Mg supplementation, which is efficient in stimulating photosynthetic activity in these plants, as it is directly related to the activity of Ribulose-1,5-Bisphosphate Carboxylase/Oxygenase (RuBisCO), which is the key enzyme in CO2 assimilation for carbohydrate production in plants [47,48].
Although foliar Mg improved several growth and physiological variables under saline conditions, the present results do not identify the specific mechanisms responsible for osmotic tolerance, ion exclusion, or tissue tolerance. These mechanisms were not directly evaluated because plant water-potential components, compatible osmolytes, Na+, K+, and Cl concentrations in roots and leaves, ion-transport selectivity, and tissue-level ion compartmentation were not determined. Therefore, the observed responses should be interpreted as evidence of morphophysiological mitigation of salt-induced damage rather than direct demonstration of enhanced salinity tolerance. Future studies should integrate physiological, biochemical, and ionomic measurements to determine whether foliar Mg improves osmotic adjustment, restricts Na+ and Cl transport to photosynthetically active tissues, or increases tissue tolerance through ion compartmentation and cellular protection. In Capsicum annuum L. plants subjected to salt stress, Mg application enhanced growth, total biomass, chlorophyll content, and antioxidant enzyme activity, while reducing malondialdehyde accumulation—indicating lower oxidative damage under saline conditions [49]. In saline soil, foliar application of Mg nanoparticles increased the levels of photosynthetic pigments, PSII photochemical efficiency, leaf area, and productivity in Vitis vinifera L. cv. ‘Superior Seedless’, and reduced electrolyte leakage, lipid peroxidation, and leaf accumulation of Na+ and Cl [18].
Overall, foliar Mg produced species-specific morphophysiological responses under saline irrigation. In A. muricata, the application of 1 mL L−1 Mg improved apparent carboxylation efficiency and favored biomass accumulation under a salinity of 2.5 dS m−1. In A. squamosa, 2 mL L−1 Mg promoted better maintenance of photosynthetic and water use efficiencies, chlorophyll contents, growth, and biomass accumulation. These responses resulted in higher biomass-based Salt Tolerance Index values but should be interpreted as evidence of salt-stress mitigation rather than confirmation of specific osmotic, ionic, or tissue-tolerance mechanisms.

5. Conclusions

Foliar supplementation with Mg at 1 mL L−1 promoted tolerance to saline stress of 2.5 dS m−1 in A. muricata plants through the maintenance of carboxylation efficiency, stem diameter, root and total dry mass accumulation, and salinity tolerance index.
A. squamosa plants showed greater tolerance to irrigation water salinity of 2.5 dS m−1 when supplemented with foliar Mg at 2 mL L−1 by maintaining greater photosynthetic efficiency and water use, chlorophyll content, growth, dry mass accumulation, and salinity tolerance index.
Foliar Mg proved to be a mineral element capable of mitigating the deleterious effects of salinity in Annonaceae species.
Future studies should include a larger number of independent experimental units per treatment and field validation to confirm the consistency and broader applicability of these findings.

Author Contributions

Conceptualization, software, validation, F.V.d.S.S. and P.C.A.L.; methodology, formal analysis, investigation, resources, data curation, writing—original draft preparation, R.d.C.d.N.M.-S., P.C.A.L., G.S.d.S.R., L.C.d.S.B., D.S.C., V.S.M., A.P.d.S.F., A.Á.d.S., K.T.d.O.P. and F.V.d.S.S.; writing—review and editing, visualization, supervision, project administration, funding acquisition, A.M.F.d.O., E.d.S.N.J., T.D.C.P., M.F.N., S.B.T., and F.V.d.S.S. All authors have read and agreed to the published version of the manuscript.

Funding

This study was financed in part by Paraiba State University, grant #01/2026. The Coordenação de Aperfeiçoamento de Pessoal de Nível Superior (CAPES, grant number 001). The Instituto Nacional de Ciência e Tecnologia em Agricultura Sustentável no Semiárido Tropical—INCT AgriS, Finance Code 406570/2022-1. This study was financed in part by the Conselho Nacional de Desenvolvimento Científico e Tecnológico—CNPq, under Finance Codes 303233/2022-2 and 173348/2023-8.

Institutional Review Board Statement

Not applicable.

Data Availability Statement

The original contributions presented in this study are included in the article.

Acknowledgments

The authors would like to extend their sincere appreciation to the Coordenação de Aperfeiçoamento de Pessoal de Nível Superior (CAPES, grant number 001), Grupo de Inovação e Pesquisa em Agricultura Irrigada (GIPAI), the Conselho Nacional de Desenvolvimento Científico e Tecnológico (CNPq), and Instituto Nacional de Ciência e Tecnologia em Agricultura Sustentável no Semiárido Tropical—INCT AgriS.

Conflicts of Interest

The authors declare no conflicts of interest.

References

  1. Fatima, R.T.; Nóbrega, J.S.; Ferreira, J.T.A.; Celedônio, W.F.; Figueiredo, F.R.A.; Ribeiro, J.E.S.; Pereira, M.B.; Pereira, W.E. Physiological responses in sugar apple seedlings under irrigation with saline water and foliar nitrogen. Rev. Bras. Ciênc. Agrár. 2022, 17, e473. [Google Scholar] [CrossRef] [Scilit]
  2. Capitulino, J.D.; Lima, G.S.; Azevedo, C.A.V.; Silva, A.A.R.; Arruda, T.F.L.; Souza, A.R.; Soares, L.A.A.; Nascimento, R. Hydrogen peroxide in attenuating salt stress in soursop. Rev. Caatinga 2024, 37, e11876. [Google Scholar] [CrossRef] [Scilit]
  3. Monarres-Cuevas, O.; Alia-Tejacal, I.; Perez-Arias, G.A.; Lopez-Martínez, V.; Juarez-Lopez, P.; Valle-Guadarrama, S.; Rodríguez-Verastegui, L.L. Physical, chemical, and physiological characterization of chilling injury in soursop fruit (Annona muricata L.). Postharvest Biol. Technol. 2022, 193, 112052. [Google Scholar] [CrossRef] [Scilit]
  4. Leal, F.; Paull, R.E. The genus Annona: Botanical characteristics, horticultural requirements and uses. Crop Sci. 2023, 63, 1030–1049. [Google Scholar] [CrossRef] [Scilit]
  5. Prasad, S.H.; Bignell, G.; Copeland, R.G.R.; Garg, V.; Chitikineni, A.; Henry, R.J.; Dillon, N.; Mir, R.R.; Varshney, R.K. Integrating multiomics and modern breeding tools for accelerating genetic improvement in Annonas. Funct. Integr. Genom. 2025, 25, 155. [Google Scholar] [CrossRef] [Scilit]
  6. Fatima, R.T.; Nóbrega, J.S.; Ribeiro, J.E.S.; Celedônio, W.F.; Ferreira, J.T.A.; Pereira, W.E.; Souto, A.G.L.; Lima, G.S. Morphophysiology and quality of custard apple seedlings irrigated with saline water and foliar nitrogen. J. Plant Nutr. 2023, 46, 2496–2507. [Google Scholar] [CrossRef] [Scilit]
  7. Silva, A.A.R.; Capitulino, J.D.; Lima, G.S.; Azevedo, C.A.V.; Arruda, T.F.L.; Souza, A.R.; Gheyi, H.R.; Soares, L.A.A. Hydrogen peroxide in attenuation of salt stress effects on physiological indicators and growth of soursop. Braz. J. Biol. 2024, 84, e261211. [Google Scholar] [CrossRef] [Scilit]
  8. Andrade, L.I.F.; Linhares, P.C.A.; Fonseca, T.M.; Silva, A.A.; Santos, J.P.; Pereira, M.P.; Silva, V.A.; Marchiori, P.E.R. Photosynthetic efficiency and root plasticity promote drought tolerance in coffee genotypes. Acta Physiol. Plant. 2022, 44, 109. [Google Scholar] [CrossRef] [Scilit]
  9. Sá, F.V.S.; Torres, S.B.; Oliveira, F.C.; Santos, A.S.; Souza, A.A.T.; Pereira, K.T.O.; Peixoto, T.D.C.; Silva, L.A.; Moreira, R.C.L.; Paiva, E.P.; et al. Ecophysiology of soursop seedlings irrigated with fish farming effluent under NPK doses. Sustainability 2024, 16, 4674. [Google Scholar] [CrossRef] [Scilit]
  10. Sá, F.V.S.; Gheyi, H.R.; Lima, G.S.; Pinheiro, F.W.A.; Paiva, E.P.; Moreira, R.C.L.; Silva, L.A.; Fernandes, P.D. The right combination of N-P-K fertilization may mitigate salt stress in custard apple (Annona squamosa L.). Acta Physiol. Plant. 2021, 43, 59. [Google Scholar] [CrossRef] [Scilit]
  11. Souza, A.A.T.; Mendonça, V.; Paiva, E.P.; Melo, B.E.F.; Souza Neta, M.L.; Santos, A.S.; Oliveira, F.C.; Peixoto, T.D.C.; Neto, M.F.; Sá, F.V.S. Growth and ionic homeostasis of custard apple seedlings irrigated with saline wastewater. Rev. Bras. Eng. Agric. Ambient. 2024, 28, e278185. [Google Scholar] [CrossRef] [Scilit]
  12. Silva, A.A.; Rubio, Z.C.C.; Linhares, P.C.A.; Rocha e Silva, K.; Pimentel, G.V.; Marchiori, P.E.R. Genotypic variation of sugarcane for salinity tolerance: Morphological and physiological responses. Ciênc. Agrotec. 2022, 46, e000122. [Google Scholar] [CrossRef] [Scilit]
  13. Veloso, L.L.S.A.; Silva, A.A.R.; Lima, G.S.; Azevedo, C.A.V.; Gheyi, H.R.; Moreira, R.C.L. Growth and gas exchange of soursop under salt stress and hydrogen peroxide application. Rev. Bras. Eng. Agric. Ambient. 2022, 26, 119–125. [Google Scholar] [CrossRef] [Scilit]
  14. Capitulino, J.D.; Lima, G.S.; Azevedo, C.A.V.; Silva, A.A.R.; Soares, L.A.A.; Arruda, T.F.L.; Sousa, V.D.; Gheyi, H.R. Morphophysiology of soursop under salt stress and H2O2 application in the pre-flowering phase. Rev. Bras. Eng. Agric. Ambient. 2023, 27, 948–957. [Google Scholar] [CrossRef] [Scilit]
  15. Cakmak, I.; Hengeler, C.; Marschner, H. Partitioning of shoot and root dry matter and carbohydrates in bean plants suffering from phosphorus, potassium and magnesium deficiency. J. Exp. Bot. 1994, 45, 1245–1250. [Google Scholar] [CrossRef] [Scilit]
  16. Hermans, C.; Johnson, G.N.; Strasser, R.J.; Verbruggen, N. Physiological characterization of magnesium deficiency in sugar beet: Acclimation to low magnesium differentially affects photosystems I and II. Planta 2004, 220, 344–355. [Google Scholar] [CrossRef] [Scilit]
  17. Prado, M.R. Magnesium. In Mineral Nutrition of Tropical Plants; Springer: Cham, Switzerland, 2021; pp. 165–174. [Google Scholar] [CrossRef] [Scilit]
  18. El-Ezz, S.F.A.; Lo’ay, A.A.; Al-Harbi, N.A.; Al-Qahtani, S.M.; Allam, H.M.; Abdein, M.A.; Abdelgawad, Z.A. A comparison of the effects of several foliar forms of magnesium fertilization on ‘Superior Seedless’ (Vitis vinifera L.) in saline soils. Coatings 2022, 12, 201. [Google Scholar] [CrossRef] [Scilit]
  19. Ahmed, N.; Zhang, B.; Bozdar, B.; Chachar, S.; Rai, M.; Li, J.; Li, Y.; Hayat, F.; Chachar, Z.; Tu, P. The power of magnesium: Unlocking the potential for increased yield, quality, and stress tolerance of horticultural crops. Front. Plant Sci. 2023, 14, 1285512. [Google Scholar] [CrossRef] [Scilit]
  20. Xie, K.; Cakmak, I.; Wang, S.; Zhang, F.; Guo, S. Synergistic and antagonistic interactions between potassium and magnesium in higher plants. Crop J. 2021, 9, 249–256. [Google Scholar] [CrossRef] [Scilit]
  21. Hussain, K.; Qadri, R.; Khan, R.I.; Ahmed, A.H.; Azam, M.; Akram, M.T.; Khan, M.I.; Arshad, A.; Shrestha, S. Evaluating the impact of triacontanol on physiological, enzymatic, and biochemical responses of Psidium guajava L. under salinity stress. Appl. Fruit Sci. 2025, 67, 323. [Google Scholar] [CrossRef] [Scilit]
  22. Barbosa, L.C.S.; Linhares, P.C.A.; Cavalcante, M.M.X.; Maia, D.X.; Rego, G.S.S.; Medeiros-Sá, R.C.N.; Oliveira, A.X.; Cavalcante, D.S.; Silva, A.A.; Pereira, K.T.O.; et al. Foliar magnesium supplementation as a strategy to mitigate salt stress in guava (Psidium guajava L.) cultivars: Physiological and growth responses. Agriculture 2026, 16, 905. [Google Scholar] [CrossRef] [Scilit]
  23. Figueredo, G.M.; Silva Sousa, C.; Mesquita, E.F.; Oliveira Mesquita, F.; Diniz, J.P.C.; Brito Neto, J.F.; Melo, A.S.; Rocha, J.L.A. Variability of temperature, rainfall and reference evaporation of Catolé do Rocha-PB municipality, semi-arid region of Brazil. Rev. JRG Est. Acad. 2024, 7, e14578. [Google Scholar] [CrossRef] [Scilit]
  24. EMBRAPA (Empresa Brasileira de Pesquisa Agropecuária); Teixeira, P.C.; Donagemma, G.K.; Fontana, A.; Teixeira, W.G. (Eds.) Manual de Métodos de Análise de Solo, 3rd ed.; Revista e Atualizada; Embrapa: Brasília, Brasil, 2017. [Google Scholar]
  25. Oliveira, A.X.; Linhares, P.C.A.; Rego, G.S.S.; Medeiros-Sá, R.C.N.; Barbosa, L.C.S.; Silva Júnior, J.P.; Cavalcante, D.S.; Silva, A.A.; Nunes Júnior, E.S.; Pereira, K.T.O.; et al. Exogenous magnesium application as a salinity mitigator in cashew genotypes. Plants 2026, 15, 37. [Google Scholar] [CrossRef] [Scilit]
  26. Sá, F.V.S.; Araujo, J.L.; Oliveira, F.S.; Silva, L.A.; Moreira, R.C.L.; Silva Neto, A.N. Influence of silicon in papaya plant growth. Científica 2015, 43, 77–83. [Google Scholar] [CrossRef] [Scilit]
  27. Medeiros, J.F.; Lisboa, R.A.; Oliveira, M.; Silva Júnior, M.J.; Alves, L.P. Caracterização das águas subterrâneas usadas para irrigação na área produtora de melão da Chapada do Apodi. Rev. Bras. Eng. Agric. Ambient. 2003, 7, 469–472. [Google Scholar] [CrossRef] [Scilit]
  28. Rhoades, J.P.; Kandiah, A.; Mashali, A.M. The Use of Saline Waters for Crop Production; Irrigation and Drainage Paper, 48; FAO: Rome, Italy, 1992; p. 133. [Google Scholar]
  29. Ayers, R.S.; Westcot, D.W. A Qualidade da Água na Agricultura, 2nd ed.; UFPB: Campina Grande, Brazil, 1999; p. 153. [Google Scholar]
  30. Fernandes, C.S.; Ferreira-Neto, M.; Dias, N.S.; Reges, L.B.L.; Silva, L.A.; Moreira, R.C.L.; Silva, A.Á.; Paiva, E.P.; Fernandes, P.D.; Sá, F.V.S. The appropriate nitrogen source for zucchini under saline stress conditions. J. Soil Sci. Plant Nutr. 2022, 22, 560–570. [Google Scholar] [CrossRef] [Scilit]
  31. Falker Automação Agrícola Ltd. Manual do Medidor Eletrônico de Teor Clorofila: ClorofiLOG/CFL 1030; Falker: Porto Alegre, Brazil, 2008. [Google Scholar]
  32. Fox, J.; Weisberg, S. An R Companion to Applied Regression, 3rd ed.; Sage: Thousand Oaks, CA, USA, 2019. [Google Scholar]
  33. Pohlert, T. PMCMRplus: Calculate Pairwise Multiple Comparisons of Mean Rank Sums Extended; R Package Version 1.7.1. 2020. Available online: https://CRAN.R-project.org/package=PMCMRplus (accessed on 5 April 2026).
  34. Ogle, D.H.; Wheeler, P.; Dinno, A. FSA: Fisheries Stock Analysis; R Package Version 0.8.31. 2020. Available online: https://github.com/droglenc/FSA (accessed on 5 April 2026).
  35. Ferreira, D.F. Sisvar: A computer analysis system to fixed effects split plot type designs. Braz. J. Biom. 2019, 37, 529–535. [Google Scholar] [CrossRef] [Scilit]
  36. Wei, T.; Simko, V.R. Package “Corrplot”: Visualization of a Correlation Matrix; Version 0.84. 2017. Available online: https://github.com/taiyun/corrplot (accessed on 10 January 2026).
  37. Lê, S.; Josse, J.; Husson, F. FactoMineR: An R package for multivariate analysis. J. Stat. Softw. 2008, 25, 1–18. [Google Scholar] [CrossRef] [Scilit]
  38. Maechler, M.; Rousseeuw, P.; Struyf, A.; Hubert, M.; Hornik, K. Cluster: Cluster Analysis Basics and Extensions; R Package Version 2.1.0. 2019. Available online: https://cran.r-project.org/web/packages/cluster/index.html (accessed on 22 April 2026).
  39. Kassambara, A.; Mundt, F. Factoextra: Extract and Visualize the Results of Multivariate Data Analyses; R Package Version 1.0.7. 2020. Available online: https://CRAN.R-project.org/package=factoextra (accessed on 22 April 2026).
  40. LabPlot Team. LabPlot: A FREE, Open Source, Cross-Platform Data Visualization and Analysis Software; Version 2.11.1. 2025. Available online: https://labplot.org (accessed on 24 April 2026).
  41. Freitas, R.S.; Santos-Júnior, J.L.; Luz, A.F.S.; Silva, E.C. Hydration and dehydration cycles for enhanced soursop (Annona muricata) seedling quality and seedling drought stress resistance. New For. 2024, 55, 1843–1861. [Google Scholar] [CrossRef] [Scilit]
  42. Kome, G.K.; Enang, R.K.; Silatsa, F.B.T.; Yerima, B.P.K.; Ranst, E.V. Baseline edaphic requirements of soursop (Annona muricata L.). Trop. Plants 2024, 3, e022. [Google Scholar] [CrossRef] [Scilit]
  43. Praxedes, S.S.C.; Ferreira Neto, M.; Loiola, A.T.; Santos, F.J.Q.; Umbelino, B.F.; Silva, L.A.; Moreira, R.C.L.; Melo, A.S.; Lacerda, C.F.; Fernandes, P.D.; et al. Photosynthetic responses, growth, production, and tolerance of traditional varieties of cowpea under salt stress. Plants 2022, 11, 1863. [Google Scholar] [CrossRef] [Scilit]
  44. Geiger, D. Plant sucrose transporters from a biophysical point of view. Mol. Plant 2011, 4, 395–406. [Google Scholar] [CrossRef] [Scilit]
  45. Ferreira, F.N.; Lima, G.S.; Gheyi, H.R.; Sá, F.V.S.; Dias, A.S.; Pinheiro, F.W.A. Photosynthetic efficiency and production of Annona squamosa L. under salt stress and fertilization with NPK. Rev. Bras. Eng. Agríc. Ambient. 2021, 25, 446–452. [Google Scholar] [CrossRef] [Scilit]
  46. Fernandes, E.A.; Soares, L.A.A.; Lima, G.S.; Gheyi, H.R.; Nobre, R.G.; Fernandes, P.D. Photosynthetic pigments, photochemical efficiency and growth of custard-apple under salt stress and potassium fertilization. Rev. Bras. Eng. Agríc. Ambient. 2022, 26, 365–373. [Google Scholar] [CrossRef] [Scilit]
  47. Parry, M.A.J.; Keys, A.J.; Madgwick, P.J.; Carmo-Silva, A.E.; Andralojc, P.J. Rubisco regulation: A role for inhibitors. J. Exp. Bot. 2008, 59, 1569–1580. [Google Scholar] [CrossRef] [Scilit]
  48. Robinson, S.P.; Portis, A.R., Jr. Release of the nocturnal inhibitor, carboxyarabinitol-1-phosphate from ribulose bisphosphate carboxylase/oxygenase by Rubisco activase. FEBS Lett. 1988, 233, 413–416. [Google Scholar] [CrossRef] [Scilit]
  49. Zirek, N.S.; Uzal, O. The developmental and metabolic effects of different magnesium dozes in pepper plants under salt stress. Not. Bot. Horti Agrobot. Cluj-Napoca 2020, 48, 967–977. [Google Scholar] [CrossRef] [Scilit]
Figure 1. Temporal variation in minimum (Min T), mean (Mean T), and maximum (Max T) air temperatures and relative humidity (RH) inside the greenhouse during the experimental period.
Agronomy 16 01734 g001
Figure 2. Plant height—PH (A,B) and stem diameter—SD (C,D) of Annona muricata L. seedlings. Different letters indicate significant differences among treatment means according to Tukey’s test (p ≤ 0.05). Interaction significance was determined by the F-test (p ≤ 0.05). The bars represent the standard error of the mean (n = 4).
Agronomy 16 01734 g002
Figure 3. Net CO2 assimilation—A (A,B), stomatal conductance—gs (C,D) and transpiration—E (E,F) of Annona muricata L. seedlings. Different letters indicate significant differences among treatment means according to Tukey’s test (p ≤ 0.05). Interaction significance was determined by the F-test (p ≤ 0.05). The bars represent the standard error of the mean (n = 4).
Agronomy 16 01734 g003
Figure 4. Water use efficiency—WUE (A,B) and intrinsic water use efficiency—WUEi (C,D) of Annona muricata L. seedlings. Different letters indicate significant differences among treatment means according to Tukey’s test (p ≤ 0.05). Interaction significance was determined by the F-test (p ≤ 0.05). The bars represent the standard error of the mean (n = 4).
Agronomy 16 01734 g004
Figure 5. Chlorophyll a—Chl a (A,B), chlorophyll b—Chl b (C,D), and chlorophyll total—Chl t (E,F) of Annona muricata L. seedlings. Different letters indicate significant differences among treatment means according to Tukey’s test (p ≤ 0.05). Interaction significance was determined by the F-test (p ≤ 0.05). The bars represent the standard error of the mean (n = 4).
Agronomy 16 01734 g005
Figure 6. Number of leaves—NL (A), total dry mass—TDM (B), internal CO2 concentration—Ci (C), and carboxylation efficiency—A/Ci (D) of Annona muricata L. seedlings. Uppercase letters denote differences between salinity levels within each Mg concentration, whereas lowercase letters denote differences among Mg concentrations within each salinity level (Tukey test, p ≤ 0.05). The p-value of the interaction (S × Mg) was statistically significant (F-test, p ≤ 0.05). Bars represent the standard error of the mean (n = 4).
Agronomy 16 01734 g006
Figure 7. Shoot dry mass—SDM (A,B), root dry mass—RDM (C,D), and root/shoot ratio—RSR (E,F) of Annona muricata L. seedlings. Different letters indicate significant differences among treatment means according to Tukey’s test (p ≤ 0.05). Interaction significance was determined by the F-test (p ≤ 0.05). The bars represent the standard error of the mean (n = 4).
Agronomy 16 01734 g007
Figure 8. Net CO2 assimilation—A (A,B), stomatal conductance—gs (C,D), transpiration—E (E,F), and root/shoot ratio—RSR (G,H) of Annona squamosa L. seedlings. Different letters indicate significant differences among treatment means according to Tukey’s test (p ≤ 0.05). Interaction significance was determined by the F-test (p ≤ 0.05). The bars represent the standard error of the mean (n = 4).
Agronomy 16 01734 g008
Figure 9. Internal CO2 concentration—Ci (A), water use efficiency—WUE (B), intrinsic water use efficiency—WUEi (C), and carboxylation efficiency—A/Ci (D) of Annona squamosa L. seedlings. Uppercase letters denote differences between salinity levels within each Mg concentration, whereas lowercase letters denote differences among Mg concentrations within each salinity level (Tukey test, p ≤ 0.05). The p-value of the interaction (S × Mg) was statistically significant (F-test, p ≤ 0.05). Bars represent the standard error of the mean (n = 4).
Agronomy 16 01734 g009
Figure 10. Chlorophyll a—Chl a (A), chlorophyll b—Chl b (B) and chlorophyll total—Chl t (C) of Annona squamosa L. seedlings. Uppercase letters denote differences between salinity levels within each Mg concentration, whereas lowercase letters denote differences among Mg concentrations within each salinity level (Tukey test; p ≤ 0.05). The p-value of the interaction (S × Mg) was statistically significant (F-test, p ≤ 0.05). Bars represent the standard error of the mean (n = 4).
Agronomy 16 01734 g010
Figure 11. Plant height—PH (A,B), stem diameter—SD (C,D), and number of leaves—NL (E,F) of Annona squamosa L. seedlings. Uppercase letters denote differences between salinity levels within each Mg concentration, whereas lowercase letters denote differences between Mg concentrations within each salinity level (Tukey test, p ≤ 0.05). The p-value of the interaction (S × Mg) was statistically significant (F-test, p ≤ 0.05). Bars represent the standard error of the mean (n = 4).
Agronomy 16 01734 g011
Figure 12. Salinity tolerance index (STI), based on shoot dry mass—STISDM (A,B), on root dry mass—STIRDM (C,D), and on total dry mass– STITDM (E,F) of Annona muricata L. and Annona squamosa L. seedlings. Different letters indicate significant differences among treatment means according to Tukey’s test (p ≤ 0.05). Interaction significance was determined by the F-test (p ≤ 0.05). The bars represent the standard error of the mean (n = 4).
Agronomy 16 01734 g012
Figure 13. Pearson correlation (p ≤ 0.05) of the analyzed characteristics in seedlings of Annonaceae species [A. muricata L. (A) and A. squamosa L. (B)] under saline stress and foliar magnesium application.
Agronomy 16 01734 g013
Figure 14. Heatmap of clustering (p ≤ 0.05) of the analyzed characteristics in seedlings of Annonaceae species [A. muricata L. (A) and A. squamosa L. (B)] under saline stress and foliar magnesium application.
Agronomy 16 01734 g014
Figure 15. Seedlings of Annonaceae species under salinity (S) and foliar magnesium (Mg) application. Soursop (Annona muricata L.) under salinity levels of 0.5 dS m−1 (A) and 2.5 dS m−1 (B), and sugar apple (Annona squamosa L.) under salinity levels of 0.5 dS m−1 (C) and 2.5 dS m−1 (D). All treatments were subjected to foliar Mg doses of 0, 1, and 2 mL L−1, respectively.
Agronomy 16 01734 g015
Table 1. Substrate saturation extract electrical conductivity (ECe) in Annona muricata L. and Annona squamosa L. seedlings subjected to brackish water irrigation and exogenous magnesium supply.
Annonaceae SpeciesSalinity (dS m−1)Magnesium (mL L−1)ECe (dS m−1)
Annona muricata L. 00.98
0.510.86
21.06
03.08
2.512.48
23.04
Annona squamosa L. 01.37
0.510.98
20.95
03.09
2.512.13
23.19
Disclaimer/Publisher’s Note: The statements, opinions and data contained in all publications are solely those of the individual author(s) and contributor(s) and not of MDPI and/or the editor(s). MDPI and/or the editor(s) disclaim responsibility for any injury to people or property resulting from any ideas, methods, instructions or products referred to in the content.