Article

Protective Effect of Exogenous Quercetin Against Salt Stress in Triticum aestivum and Triticum durum

by
Neonila V. Kononenko
1,
Elena M. Lazareva
1,2 and
Larisa I. Fedoreyeva
1,*
1
All-Russia Research Institute of Agricultural Biotechnology, Timiryazevskaya 42, 127550 Moscow, Russia
2
Biological Department, M.V. Lomonosov Moscow State University, Leninskie Gory 1, 119991 Moscow, Russia
*
Author to whom correspondence should be addressed.
Agronomy 2026, 16(17), 1727; https://doi.org/10.3390/agronomy16171727 (registering DOI)
Submission received: 3 August 2026 / Revised: 24 August 2026 / Accepted: 27 August 2026 / Published: 4 September 2026
(This article belongs to the Section Plant-Crop Biology and Biochemistry)

Abstract

Various stress factors lead to increased reactive oxygen species (ROS) formation and increased damage to various plant tissues. Data obtained using fluorescence microscopy show that under abiotic stress, the most intense ROS staining is observed in the epidermal and cortical cells of the root cap and division zones. Increased ROS formation under abiotic stress activates the antioxidant system in wheat. The expression level of the MnSOD and Cu/ZnSOD genes in the Orenburgskaya 22 wheat variety (Triticum aestivum) is more than twice that in the Zolotaya variety (Triticum durum). An amount of 150 mM NaCl activates MnSOD and Cu/ZnSOD gene expression in the Orenburgskaya 22 wheat variety, increases glutathione (GSH) content, and activates GSH-associated enzymes. Therefore, different wheat genotypes have different mechanisms for neutralizing ROS. The antioxidant quercetin reduces ROS formation and also promotes antioxidant system activation in the Orenburgskaya 22 variety and has virtually no effect on the Zolotaya variety. However, it does reduce ROS before and after NaCl treatment in both wheat genotypes. Salt stress causes an increase in the number of small and large autophagosomes in root cells of Triticum durum wheat, while, in Triticum aestivum, large vacuoles not marked by ATG8 and small autophagosomes near the nucleus form in root cortex cells. Treatment of control plants with quercetin does not increase the number of autophagosomes. Treatment with quercetin after salt stress does not increase the number of ATG8-marked autophagosomes in cells of either genotype. Treatment with quercetin before salt exposure leads to an increase in the number of autophagosomes in durum wheat cells. PCR analysis of autophagy genes revealed features of the initiation of autophagosome formation. Thus, quercetin exerts a protective effect against salt stress. However, its use is limited to plants with high flavonoid content. Quercetin may have promising applications in agriculture.

1. Introduction

Wheat is the most widely grown agricultural crop in the world. During the growing season, wheat is exposed to biotic and abiotic stressors. These factors damage plants, slowing their growth and reducing grain yield [1,2]. Soil salinization, caused primarily by agricultural practices (irrigation, fertilizer application) [3,4], poses a serious threat to sustainable agriculture. It leads to reduced plant productivity by disrupting their physiological, biochemical, and molecular functions. Increase in salt content in the soil disrupt the osmotic and ionic balance in plant cells. Furthermore, oxidative and toxic stress also occur in the cells. Salt stress leads to disruption of physiological and metabolic functions in plants. These include a reduced capacity for water and nutrient absorption, altered membrane permeability, which leads to disruption of vital processes such as photosynthesis, respiration and protein synthesis [5]. Elevated salt concentrations impair plant growth and, if severe and prolonged, can lead to plant death. Plants within the same family can employ different survival strategies. Some effectively combat osmotic stress by neutralizing toxic ions. Others rely on strong antioxidant defenses to combat excess reactive oxygen species (ROS), the main cause of oxidative stress [5,6]. The primary mechanisms of salt tolerance include the removal of Na+ and Cl ions from vacuoles, blocking Na+ ion transport into the cell, and excluding Na+ from the transpiration flux [7]. Roots preferentially absorb K+ from the soil, and most plants exhibit a high degree of K+/Na+ discrimination. The coordinated action of many stress-responsive genes determines susceptibility or tolerance to stress in plants [8].
When exposed to abiotic stress, plants generate two types of ROS: metabolic and signaling. Metabolic ROS alters the redox status of enzymes, which alters metabolic reactions that help counteract the negative effects of stress [9]. Other ROS, signaling ROS, are produced as a result of exposure to abiotic stress and participate in ROS signaling. Although metabolic ROS are generated in the chloroplast and signaling ROS in the apoplast, when exposed to abiotic stress, metabolic and signaling ROS interact and form a common cellular ROS signature that can control the plant’s adaptive response to the stress factor through a series of redox reactions that regulate the transcription and translation of proteins and enzymes responsible for plant adaptation to stress.
Redox metabolism in plant cells is inevitably accompanied by the formation and accumulation of highly toxic ROS, the levels of which are strictly controlled by antioxidants [10,11,12]. The most common and toxic ROS include superoxide anion (O2•−), hydrogen peroxide (H2O2), and the hydroxyl radical (OH·). Plants have protective mechanisms against oxidative stress that are aimed at reducing the formation of ROS and their absorption [13]. To do this, plants have developed a complex antioxidant system consisting of enzymes such as superoxide dismutase (SOD), catalase (CAT), ascorbate peroxidase (APX), glutathione reductase (GR), monodehydroascorbate reductase (MDHAR), dehydroascorbate reductase (DHAR), glutathione peroxidase (GPX), guaicol peroxidase (GOPX) and glutathione-S-transferase (GST), ASH acids; glutathione (GSH); phenolic compounds, alkaloids, non-protein amino acids and α-tocopherols, which inhibit the accumulation of ROS. These antioxidant defense systems work together to regulate uncontrolled oxidative cascades and protect plant cells from oxidative damage by scavenging ROS [14,15]. Increased stress resistance in plants is often due to a more powerful antioxidant enzymatic system [16]. SOD plays a key role among these enzymes. It effectively neutralizes ROS by catalyzing the conversion of O2•− to H2O2, which then breaks down into harmless water and oxygen. SOD is the key enzyme of the antioxidant system, involved in most physiological and biochemical processes aimed at protecting the body from various environmental stressors [17,18]. In addition to enzymes, plant cells produce low-molecular-weight non-enzymatic antioxidants to neutralize ROS. Among these are phenolic compounds, which play an important role in maintaining redox balance and increasing stress resistance. Phenolic compounds, including flavonoids, act as antioxidants, neutralizing free radicals in plants under stress [19,20]. They are essential secondary metabolites synthesized in virtually all parts of the plant during its interaction with the environment.
Flavonoids are small-molecule antioxidants that activated under severe stress conditions when antioxidant enzyme activity decreases [21,22]. They play a key role in protecting plants from stress, enabling their adaptation to changing environmental conditions [23]. Flavonoids act as ROS scavengers, localizing and neutralizing free radicals before they cause cell damage. This makes them vital compounds for plants exposed to adverse factors [21]. Quercetin (3,3′,4′,5,7-pentahydroxyflavone) is one of the most abundant flavonoids in plants. As a highly active small-molecule antioxidant, quercetin helps maintain redox balance [24]. Quercetin’s mechanisms of oxidative balance regulation include both its ability to neutralize ROS and free radicals and the activation of enzymatic and non-enzymatic antioxidants. Neutralization of ROS and free radicals occurs through the transfer of an electron or hydrogen atom from quercetin and its glycosylated analog [25,26,27].
Quercetin suppresses oxidative stress resulting from an imbalance between the amount of newly formed ROS and antioxidants. By participating in signal transduction, quercetin can modulate the activity of enzymes or low-molecular-weight antioxidants and enhance their antioxidant properties. One of the studied mechanisms for activating antioxidant activity is the effect of quercetin on it. However, quercetin’s antioxidant properties manifested in small doses, and its excess can lead to the opposite effect [28]. Recently, quercetin has been found to modulate hormonal signaling pathways, which may also enhance plant defense against abiotic and biotic stresses [29].
Due to the fact that quercetin is localized in the outer membrane of chloroplasts, it is involved in the regulation of light intensity in plants [30]. Quercetin has also been shown to play an important role in protecting plants from stress, such as ultraviolet radiation and osmotic stress, which has been confirmed by numerous studies [31,32,33].
The effects of salt stress on various wheat genotypes were previously studied. Based on the data obtained, two wheat varieties were selected: the resistant Orenburgskaya 22 and the sensitive Zolotaya. Zolotaya was found to significantly accumulate Na+, especially in shoots, compared to Orenburgskaya 22 [34]. The lower Na+ content in Orenburgskaya 22 is most likely due to higher expression of HKT gene families [34]. The accumulation of toxic ions was accompanied by an increase in ROS content in Zolotaya. It was shown that different wheat genotypes utilize different components of the antioxidant system to neutralize and release ROS. For example, in Orenburgskaya 22, the most active enzyme systems include MnSOD and Cu/ZnSOD, while in Zolotaya GSH and GSH-dependent enzymes are most active [35]. The aim of this study was to continue the investigation of various aspects of the action of oxidative stress induced by high concentration of NaCl on Triticum aestivum and Triticum durum, as well as to determine the effectiveness of the antioxidant quercetin in neutralizing ROS under salt stress conditions.

2. Materials and Methods

2.1. Plant Material

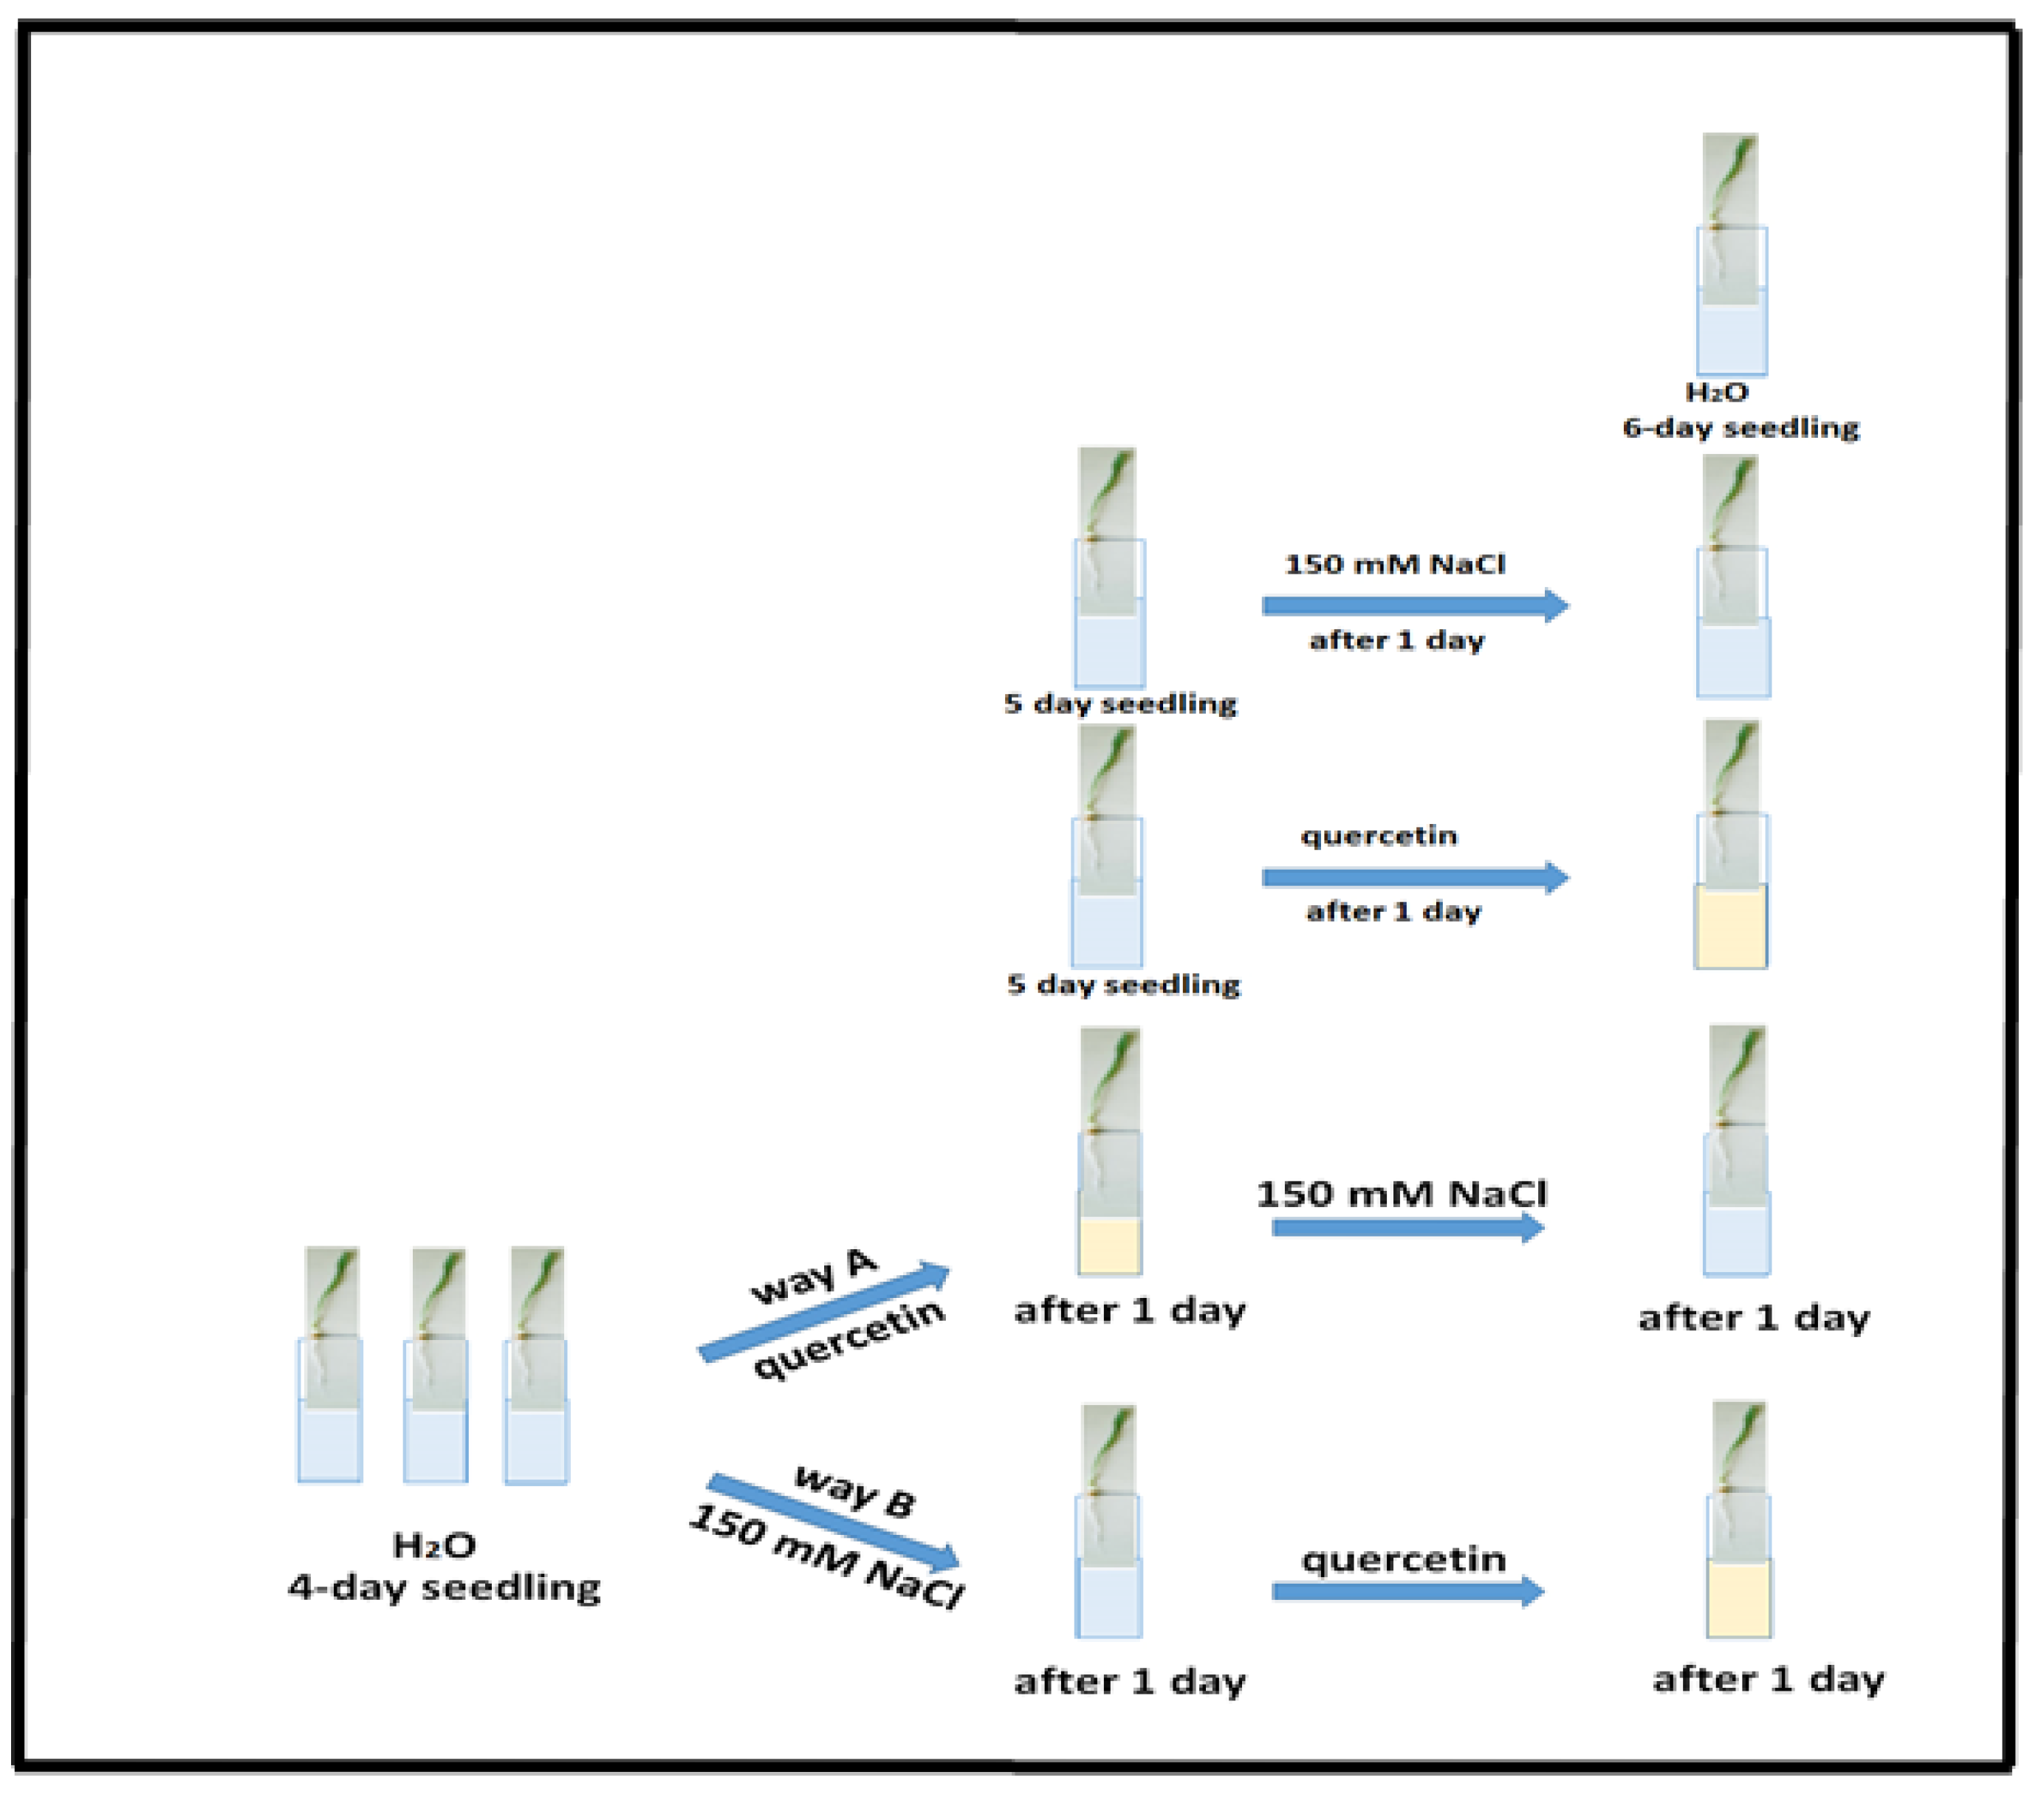
Seeds of two spring wheat varieties Triticum durum Desf. Zolotaya (2n = 28) and Triticum aestivum L. Orenburgskaya 22 (2n = 42) were obtained from the Orenburg Research Institute of Agriculture of the steppe ecological group (FGBNU Federal Scientific Center of the Russian Academy of Sciences, Orenburg, Russia). Seeds sterilized with a 2% sodium hypochlorite solution for 10 min and thoroughly washed with distilled water. Seeds were grown in roll culture in water at 24 °C under a 10 h light/14 h dark regime using fluorescent lamps (5000 lux) at a relative humidity of 60% (climate chamber Bidenr KBW 400) [34]. Control plants were grown for 6 days in water. Five-day-old seedlings were incubated in solutions of 150 mM NaCl or 0.03% quercetin for 24 h. Four-day-old seedlings were exposed sequentially to 150 mM NaCl, then 0.03% quercetin, and then 0.03% quercetin, then 150 mM NaCl, for 24 h each. The experimental design is shown in Figure 1.
After 6 days of the experiment, wheat seedlings were collected for further measurements. The experiment was repeated 3 times.

2.2. Preparation of Macerated Cells of Root Tips

Wheat root tips (5 mm each) were fixed in 4% paraformaldehyde (Sigma Aldrich, USA) in phosphate-buffered saline (PBS), pH 7.2, then placed in 4% cellulase (Sigma Aldrich, USA) in a solution of 0.4 M mannitol with the addition of 5 mM EGTA pH 5 and incubated for 7 min to destroy the cell wall. Then root tips were washed 3 times for 5 min in PBS, and groups of 4–6 cells were transferred to a cover slip in a drop of buffer and broken into individual cells. The preparations were dried for 24 h at 4 °C.

2.3. Fluorescence Microscopy

Root tips (4–5 Mm) were incubated in a Carboxy-H2DCFDA solution (Thermo Fisher Scientific, USA) at a concentration of 25–50 Nm for 30 min.
For Atg8 immunodetection, cell preparations were placed in Pbs for 5 min, then transferred to 0.5% Triton X-100 in Pbs for 30 min, and incubated for 30 min in 3% Goat Serum in Pbs. Preparations were the applied with drops of Mouse Monoclonal Antibodies to Lc3bab-Af4650 (Diluted 1:100) (Affinity Biosciences, USA) with the addition of 0.1% Bsa for 16–18 Hours at 4 °C. They were then incubated with Rabbit Antibodies and applied to Mouse Ig Conjugated with Texas Red Fluorochrome (Sigma-Aldrich, USA) for 45 min at 37 °C in the dark, and then washed, stained with Dapi (Sigma), and embedded in Mowiol U-88 (Hoechst, Germany). Samples were analyzed using an Olympus Bx51 (Japan) [35].

2.4. Total RNA Isolation and Gene Expression Analysis

Total RNA was isolated from shoots and roots using Syntol RNA-extran reagent kits (Russia) according to the manufacturer’s instructions. cDNA was synthesized using reverse transcription (Syntol, Russia). The concentration of the resulting cDNA was determined spectrophotometrically using an IMPLEN nanophotometer. Gene expression analysis was performed using RT-PCR with SYBR Green I (Syntol) on a CFX 96 Real-Time System thermal cycler (BioRad, USA). RT-PCR using SYBR Green I (Syntol) was performed on a CFX 96 Real-Time System thermal cycler (BioRad, USA). Gene structure information for Triticum aestivum was obtained from the National Center for Biotechnology Information (NCBI). The PCR-RT reaction was carried out under identical conditions for all samples: 95 °C for 5 min, then 45 cycles of 94 °C for 30 s, 58 °C for 30 s, and 72 °C for 30 s. Each RT-PCR was performed in triplicate. The relative level of gene expression was calculated using a calibration curve constructed with PCR products obtained with primers for the GaPDh gene. The effectiveness of PCR-RT with primers for the studied genes reached 95–96%.

2.5. Biochemical Analysis

Antioxidant activity (AOA) was determined by the decrease in the coloration of the 5 × 10⁻⁵ M alcohol solution of 2,2-diphenyl-1-picrylhydrazyl (DPPH). An amount of 0.1 mL of DPPH was added to 0.8 mL of the test solution in ethanol. Incubation was carried out for 30 min in the dark at 20 °C. The absorbance was measured at λ = 517 nm [36]. A titration method was used to determine the H2O2 content in wheat samples. An amount of 0.25 mL of 16% H2SO4 was added to 0.5 mL of the aqueous solution being analyzed, followed by a 0.02 M KMnO4 solution until a pink color appeared. A 3% H2O2 solution was used to construct the calibration curve. Absorbance was measured at λ = 480 nm [37]. The glutathione (GSH} content was determined by the appearance of color at λ = 412 nm according to the Ellman method [38]. Chlorophyll measured at 665 nm and 649 nm, and the content of chlorophyll a and b were determined using the formulas [39]:
Chl a = [(11.63 × A665) − (2.39 × A649)] × Vml/1000 × Wmg
Chl b = [(20.11 × A649) − (5.18 × A665)] × Vml/1000 × Wmg
where Vml is the total volume of the extract, Wmg is the sample of the plant.
Data were expressed as mean ± standard deviation (SD; n = 30), and significant differences were determined p < 0.05.

2.6. Statistical Methods

We used one-way analysis of variance (ANOVA) and Student’s t-test for statistical analysis of the data. Calculations were performed in R (version 4.3.1). Differences were considered significant at p < 0.05. The least significant difference method was used to test significance between groups. All values are shown as mean ± standard deviation for three biological replicates.

3. Results

3.1. Plant Morphometry

Morphometric indices of plant growth are among the most important for characterizing abiotic and biotic influences on plant development. These indices determine the plant’s tolerance or sensitivity to a stress factor. Morphometric parameters depend on the plant developmental stage at which the stress factor is applied, as well as on the intensity and duration of the stress. Plants are most sensitive at the seed germination stage; during seedling development, stress slows both shoot growth and root system development [40]. To study the effects of salt stress and the protective effect of quercetin, 6-day-old wheat seedlings of two genotypes used. Table 1 presents the morphometric indices of the effect of 150 mM NaCl and quercetin on two wheat varieties: Zolotaya (Triticum durum) and Orenburgskaya 22 (Triticum aestivum).
Analysis of 6-day-old seedlings showed that the root length of Zolotaya variety was 1.42 times greater than that of Orenburgskaya 22 variety. Under salt stress, the root length of the Orenburgskaya 22 variety decreased by 1.01 times compared to the control group and by 1.07 times compared to the Zolotaya variety. The shoot height of the Zolotaya variety was also 1.07 times longer than that of the Orenburgskaya 22 variety (Table 1). Salt stress did not lead to a decrease in shoot height in the Orenburgskaya 22 variety, but decreased it by 1.1 times in the Zolotaya variety. The effect of quercetin led to an increase in root length and shoot height in the Orenburgskaya 22 variety (by 1.1 and 1.06 times, respectively), but led to a decrease in all morphological parameters in the Zolotaya variety (1.1 and 1.25 times, respectively). Incubation of Zolotaya plants with quercetin before and after exposure to 150 mM NaCl produced similar changes in plant morphological parameters. Unlike Zolotaya, quercetin treatment before salt exposure resulted in a 1.09-fold increase in root length in the Orenburgskaya 22 variety compared to the control.
It is worth noting that the fresh weight of Zolotaya wheat sprouts is 1.23 times higher than that of the Orenburgskaya 22 variety. Treatment with 150 mM NaCl leads to a 1.18-fold decrease in the fresh weight of Orenburgskaya 22 sprouts and has virtually no effect on the weight of Zolotaya sprouts. Treatment with quercetin leads to a 1.12-fold decrease in Zolotaya sprout weight, and an even greater weight reduction observed with subsequent NaCl treatment—a 1.19-fold decrease.
Based on morphometric parameters, it can be concluded that quercetin stimulates root and shoot growth only in the Orenburgskaya 22 variety, and pretreatment with quercetin neutralizes the negative effects of sodium chloride. However, quercetin slows the development of the Zolotaya variety and does not neutralize the toxic effects of sodium chloride.

3.2. Chlorophyll Content

Green plants have two main types of chlorophyll, Chl a and Chl b, which are non-covalently bound to membrane proteins. Chl a is the most important pigment in photosynthesis, serving as the primary electron donor in the electron transport chain of photosynthesis. Chl b complements Chl a; it increases the absorption spectrum by increasing the wavelength range and expanding the spectrum of absorbed light. Table 2 shows data on the content of Chl a and Chl b in the leaves of wheat varieties Orenburgskaya 22 and Zolotaya grown under different conditions.
The Chl a content in the Orenburgskaya 22 wheat variety is 1.67 times higher than that of the Zolotaya variety, while the Chl b content is 1.96 times higher. Chl a content decreases by 2.09 and 1.86 times, while Chl b decreases by 2.37 and 1.81 times, respectively. The use of a 0.03% quercetin solution stimulates the accumulation of Chl a and Chl b in the Orenburgskaya 22 variety (by 1.23 and 1.05 times), while the preparation has virtually no effect on the Zolotaya variety. When exposed to 150 mM NaCl, quercetin treatment increases Chl a content in the Orenburgskaya 22 variety by 1.24 times, but this value still remains 1.69 times lower than the control level. In the Zolotaya variety, quercetin does not provide even partial recovery: after salt stress, only a slight decrease in Chl a content— by 1.01 times—is observed. Pre-treatment with a 0.03% quercetin solution before salt stress produces the most pronounced effect for the Orenburgskaya 22 variety: Chl a content increases by 2.39 times relative to the salt-stressed group, exceeding even the control sample. In the Zolotaya variety, pre-treatment only slightly increases Chl a levels (by 1.16 times), but it still remains 1.61 times lower than the control.

3.3. ROS Under Salt Stress

3.3.1. Distribution of ROS+ and ROS in Root Cells

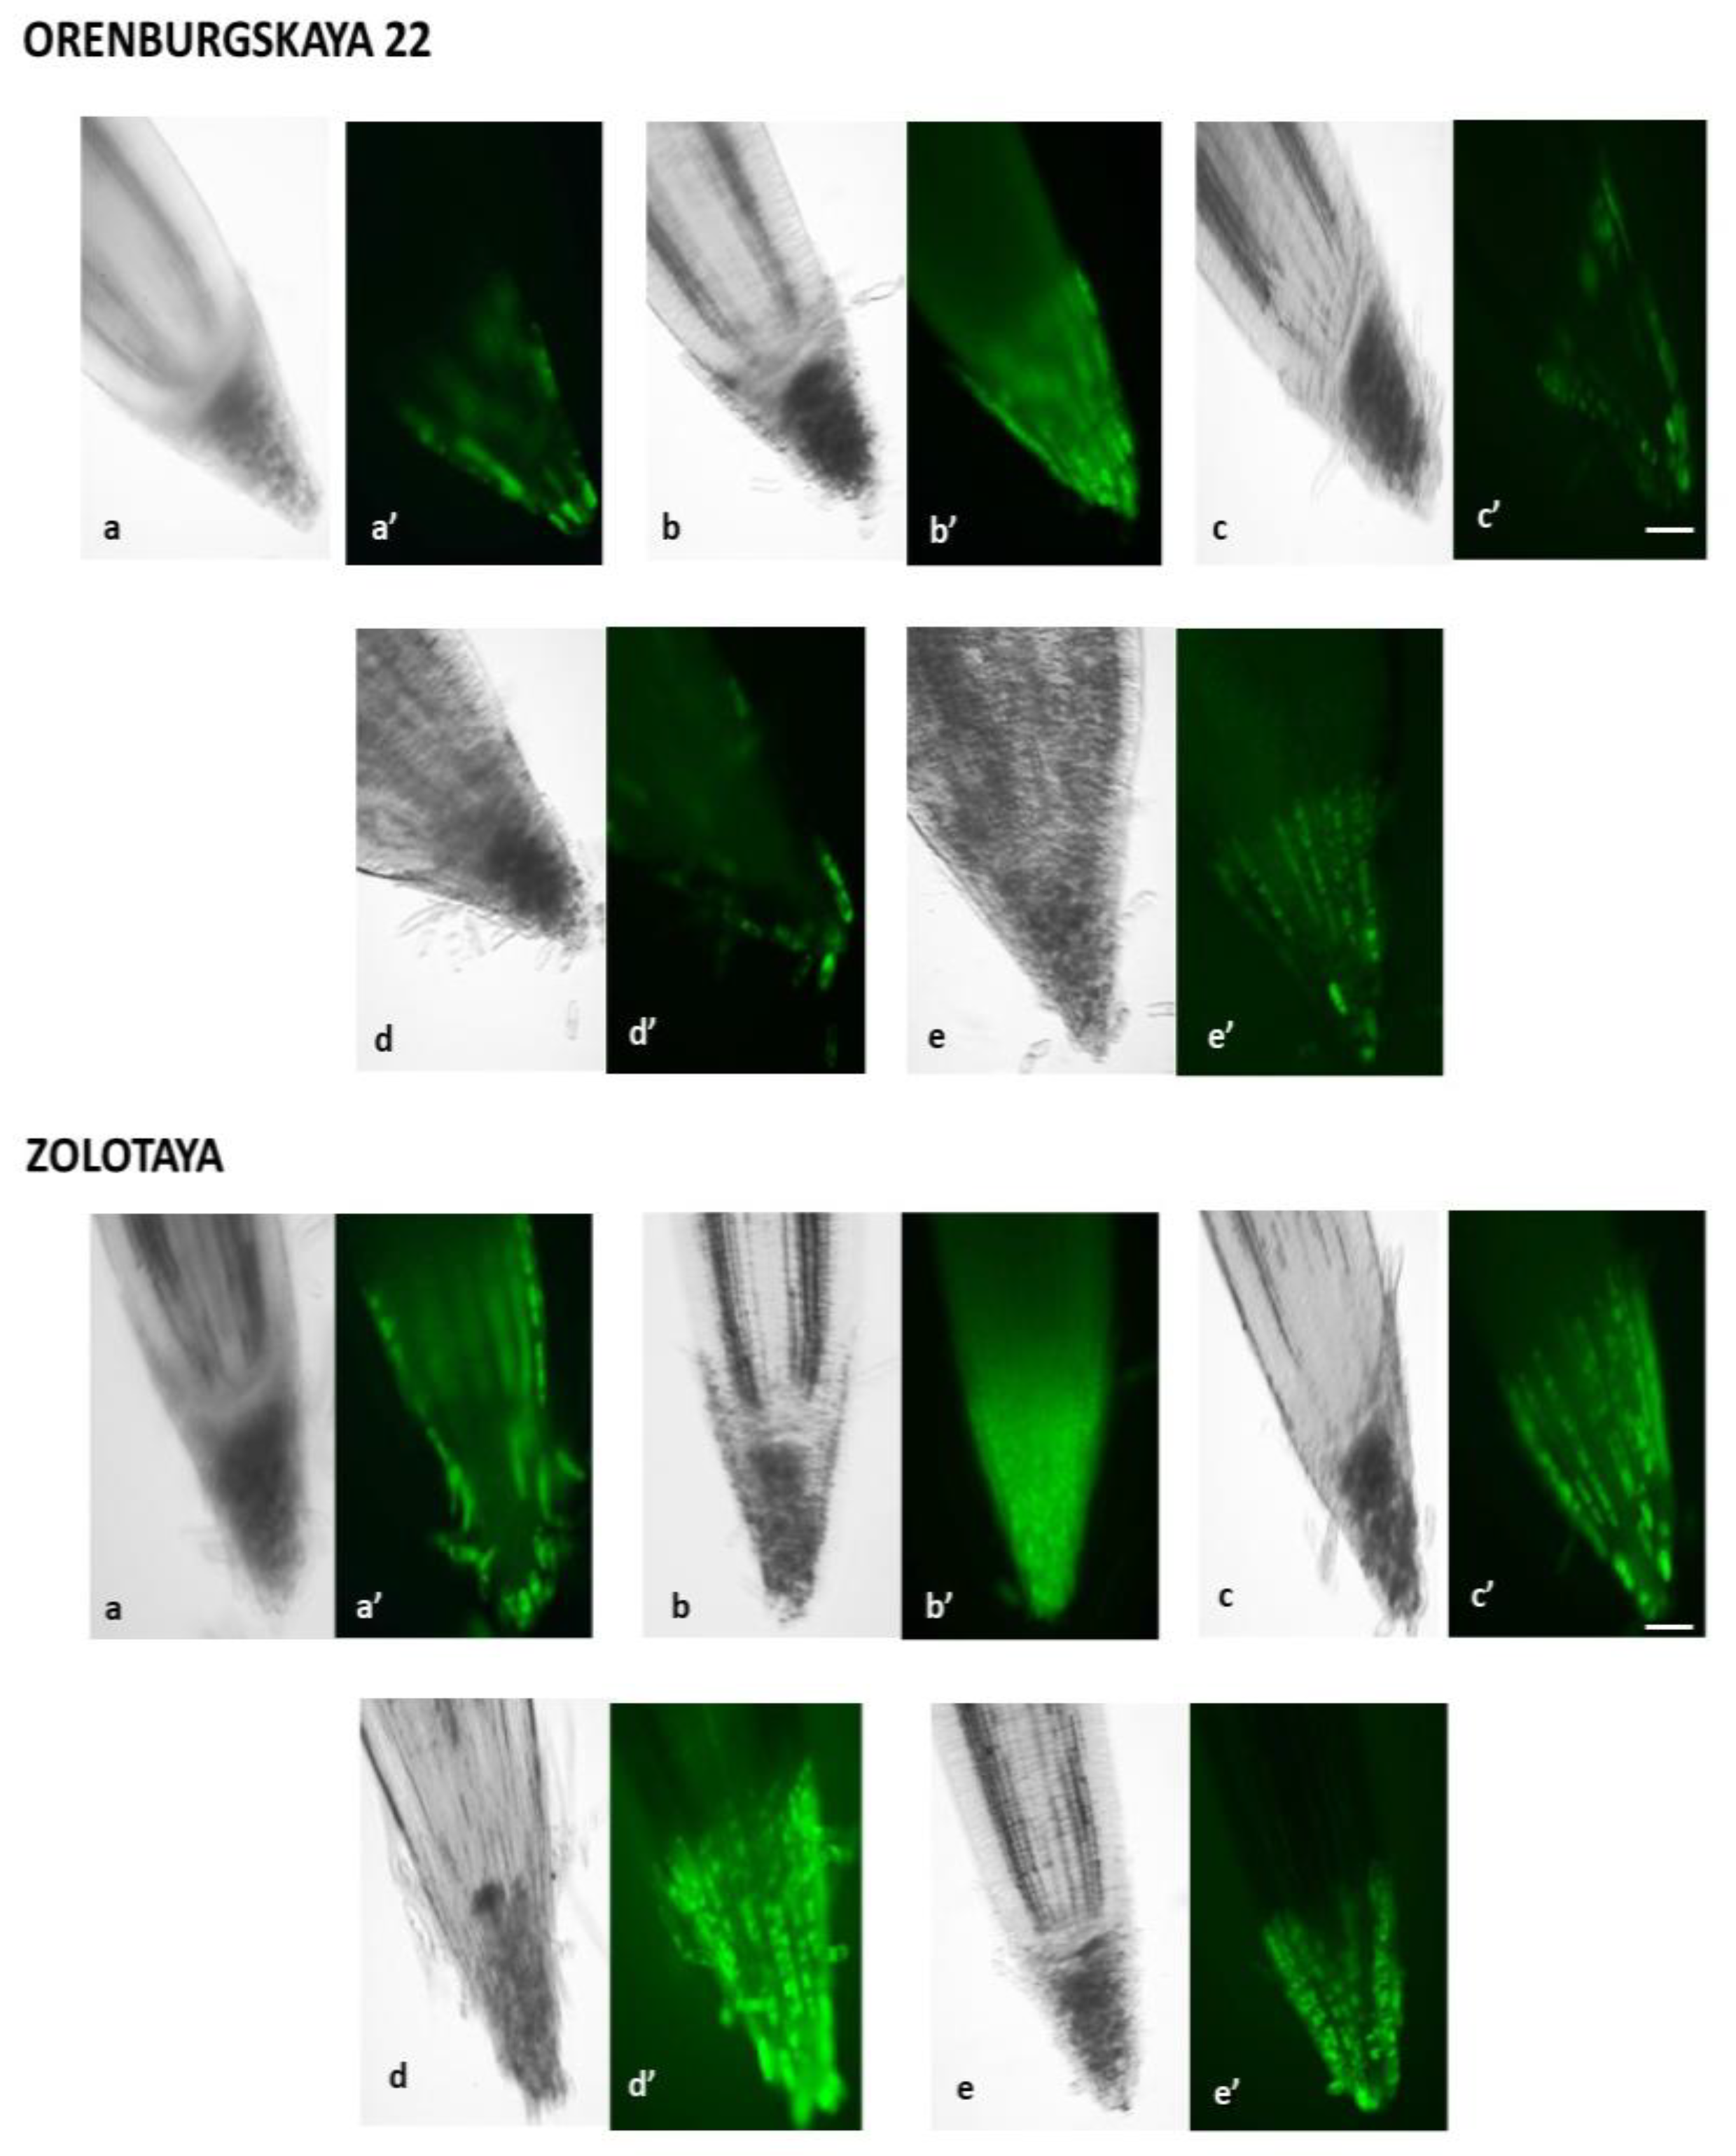
Reactive oxygen species (ROS) are natural metabolic products. When exposed to unfavorable environmental factors, plants increase ROS production, which leads to membrane damage, protein degradation, enzyme inactivation, and DNA damage, causing mutations [13,41,42]. Our studies using the Carboxy-H2DCFDA marker revealed that at a concentration of 150 mM NaCl, ROS formation occurs in all root tissues; however, fluorescence intensity varies depending on the root zone and wheat variety. ROS distribution was assessed using phase-contrast and fluorescence microscopy (Figure 2).
The data obtained indicate that under salinity, the most pronounced ROS accumulation observed in the root cap and division zone, indicating activation of oxidative stress in these areas. Furthermore, compared with the control, the greatest increase in ROS levels was recorded in epidermal and cortical cells, while this indicator was lower in the cells of the central cylinder. Thus, under salt stress, ROS is predominantly localized in the epidermal and cortical cells of the root cap and division zones. Addition of exogenous quercetin to salt-treated plants resulted in decreased antioxidant enzyme activity compared to the control. This may indicate that quercetin’s protective properties suppress the formation of ROS.
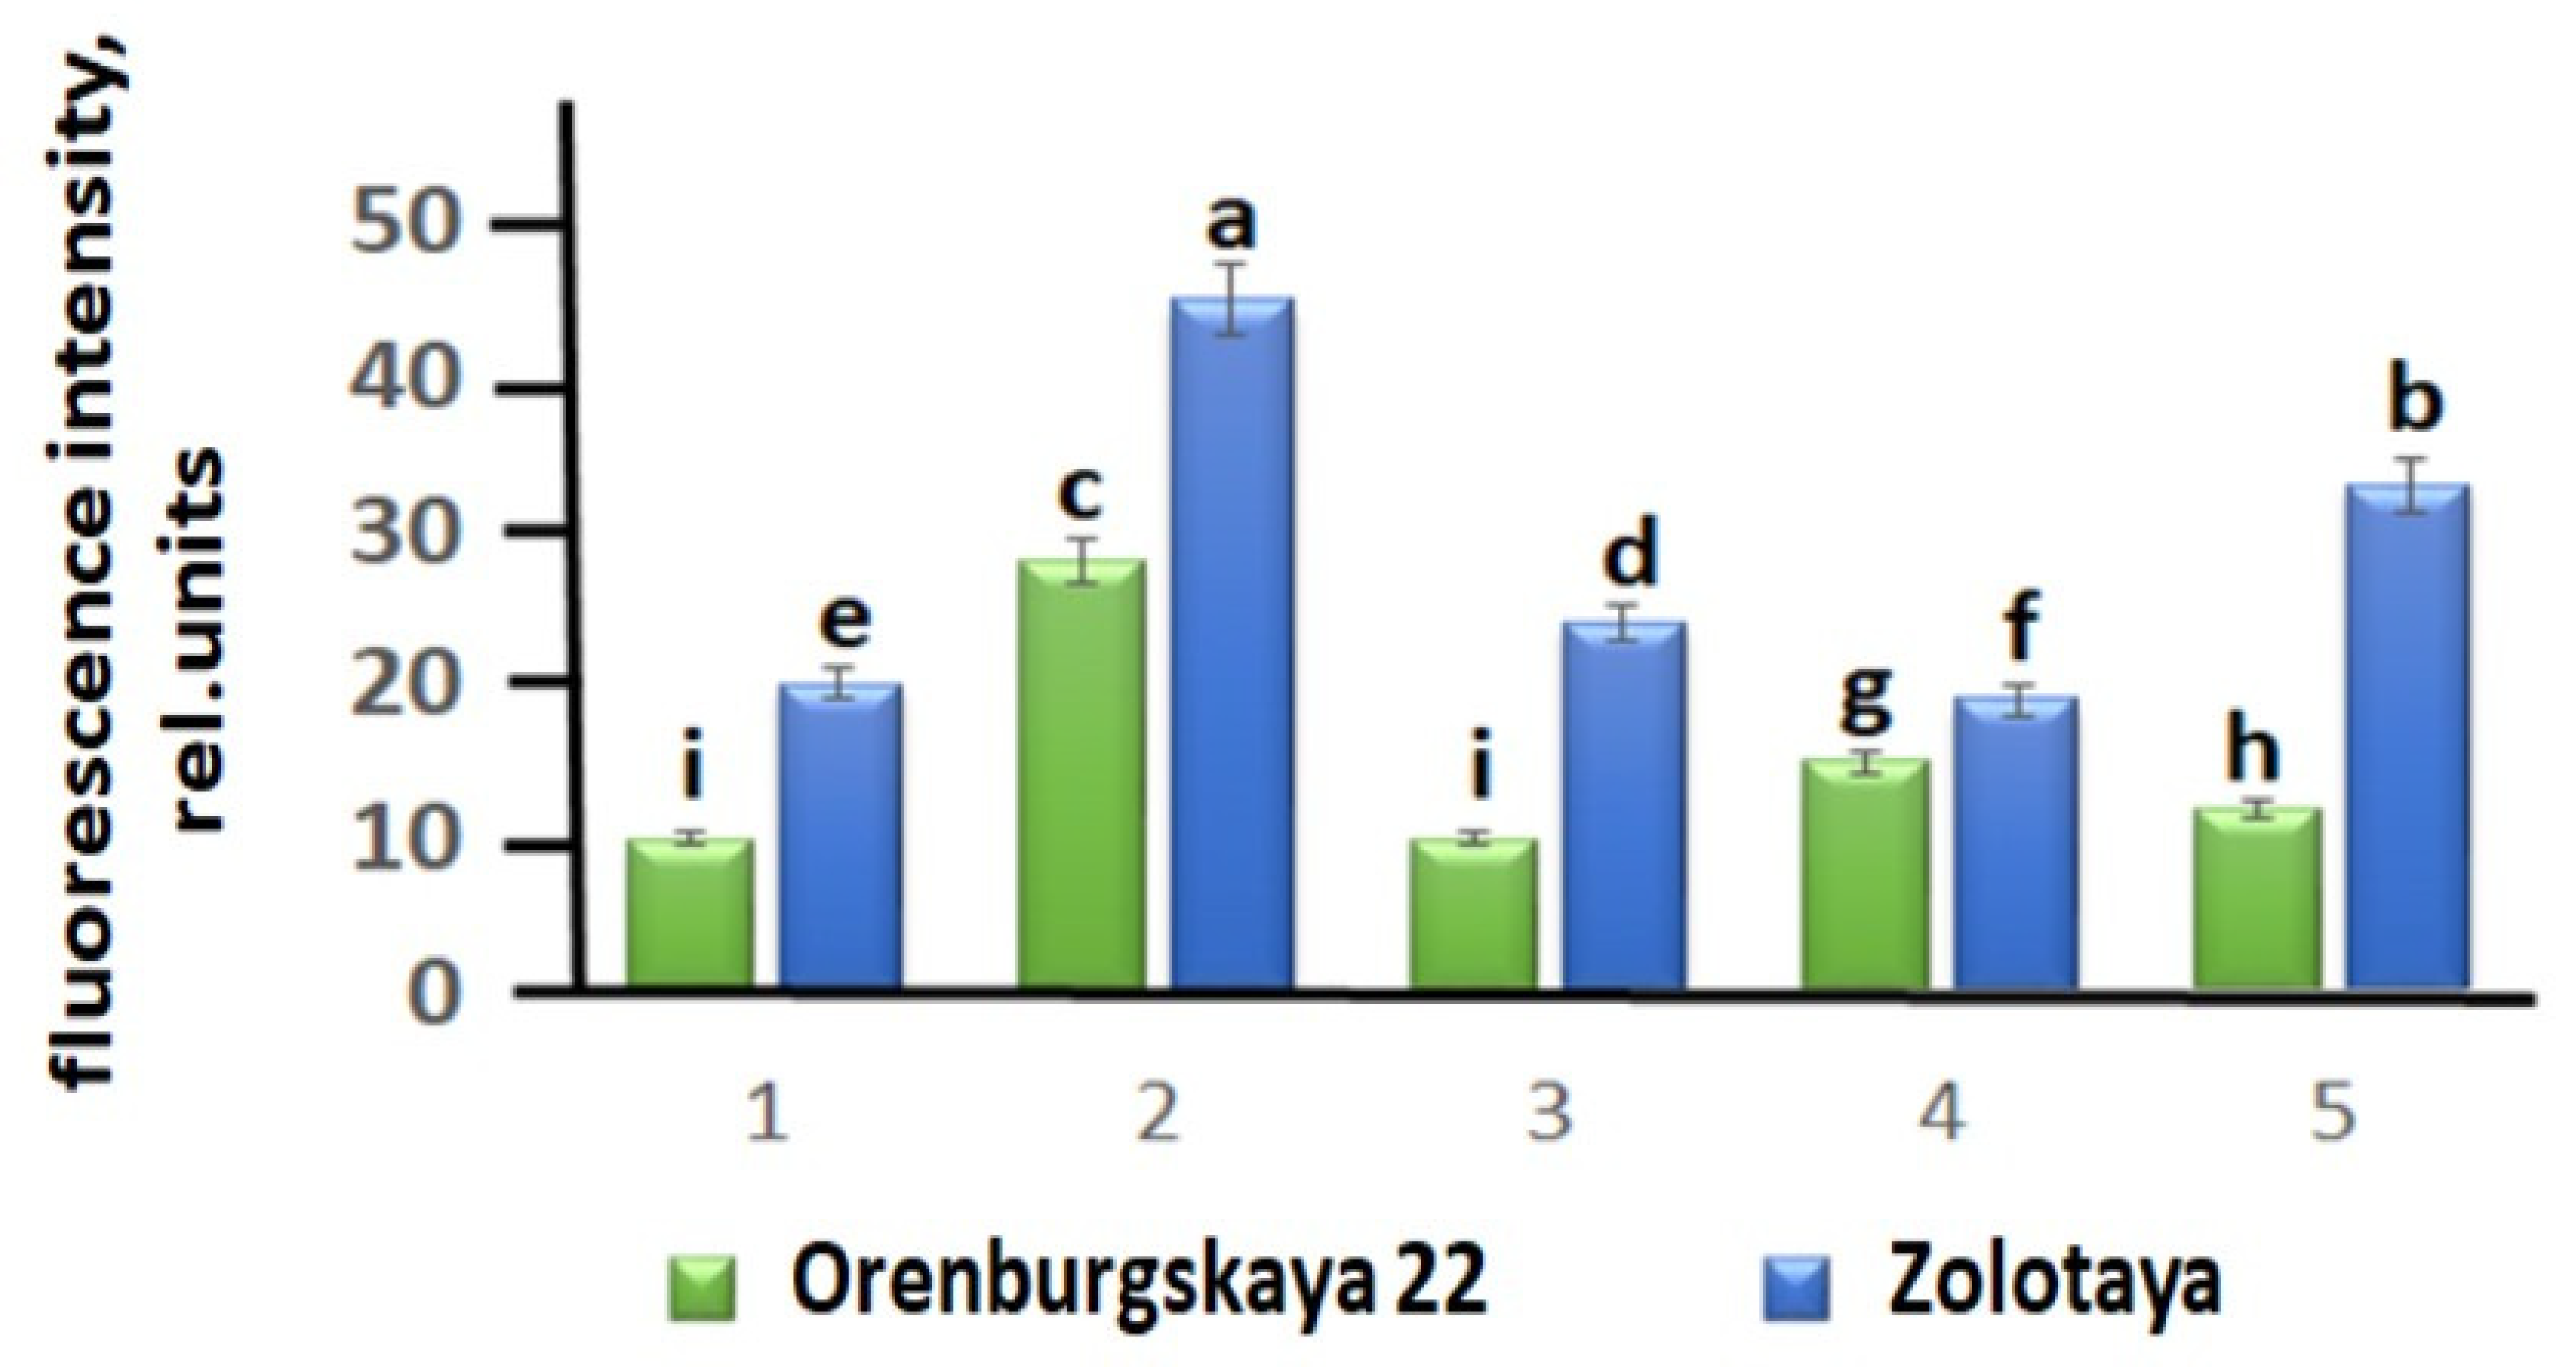
In plants, treatment of 6-day-old wheat seedlings with quercetin showed a decrease in ROS levels compared to the control (by 1.05 and 1.1 times, respectively) in the Orenburgskaya 22 and Zolotaya varieties (Figure 3). Salt treatment increased ROS production. An amount of 150 mM NaCl induced ROS formation by 2.81 times in the Orenburgskaya 22 variety and by 2.32 times in the Zolotaya variety. Pre-treatment with quercetin prior to exposure to 150 mM NaCl resulted in a decrease in fluorescence intensity in both varieties, as evidenced by a lower fluorescence intensity (2.33-fold for Orenburgskaya 22 and 1.36-fold for Zolotaya). Remarkably, quercetin application after salt stress demonstrated high efficacy for both varieties: growth increased 2.36-fold for the Zolotaya variety, and 1.87-fold for the Orenburgskaya variety. Furthermore, quercetin treatment both before and after salt exposure reduced the formation of ROS in the Orenburgskaya 22 variety to control levels. Quercetin treatment before and after salt exposure reduced ROS formation in the Orenburgskaya 22 variety to control levels. For the Zolotaya variety, quercetin neutralization of excess ROS after NaCl exposure was more effective than pre-treatment. Moreover, the Orenburgskaya 22 variety turned out to be the most resistant to salinity compared to the Zolotaya variety.

3.3.2. H2O2 Content

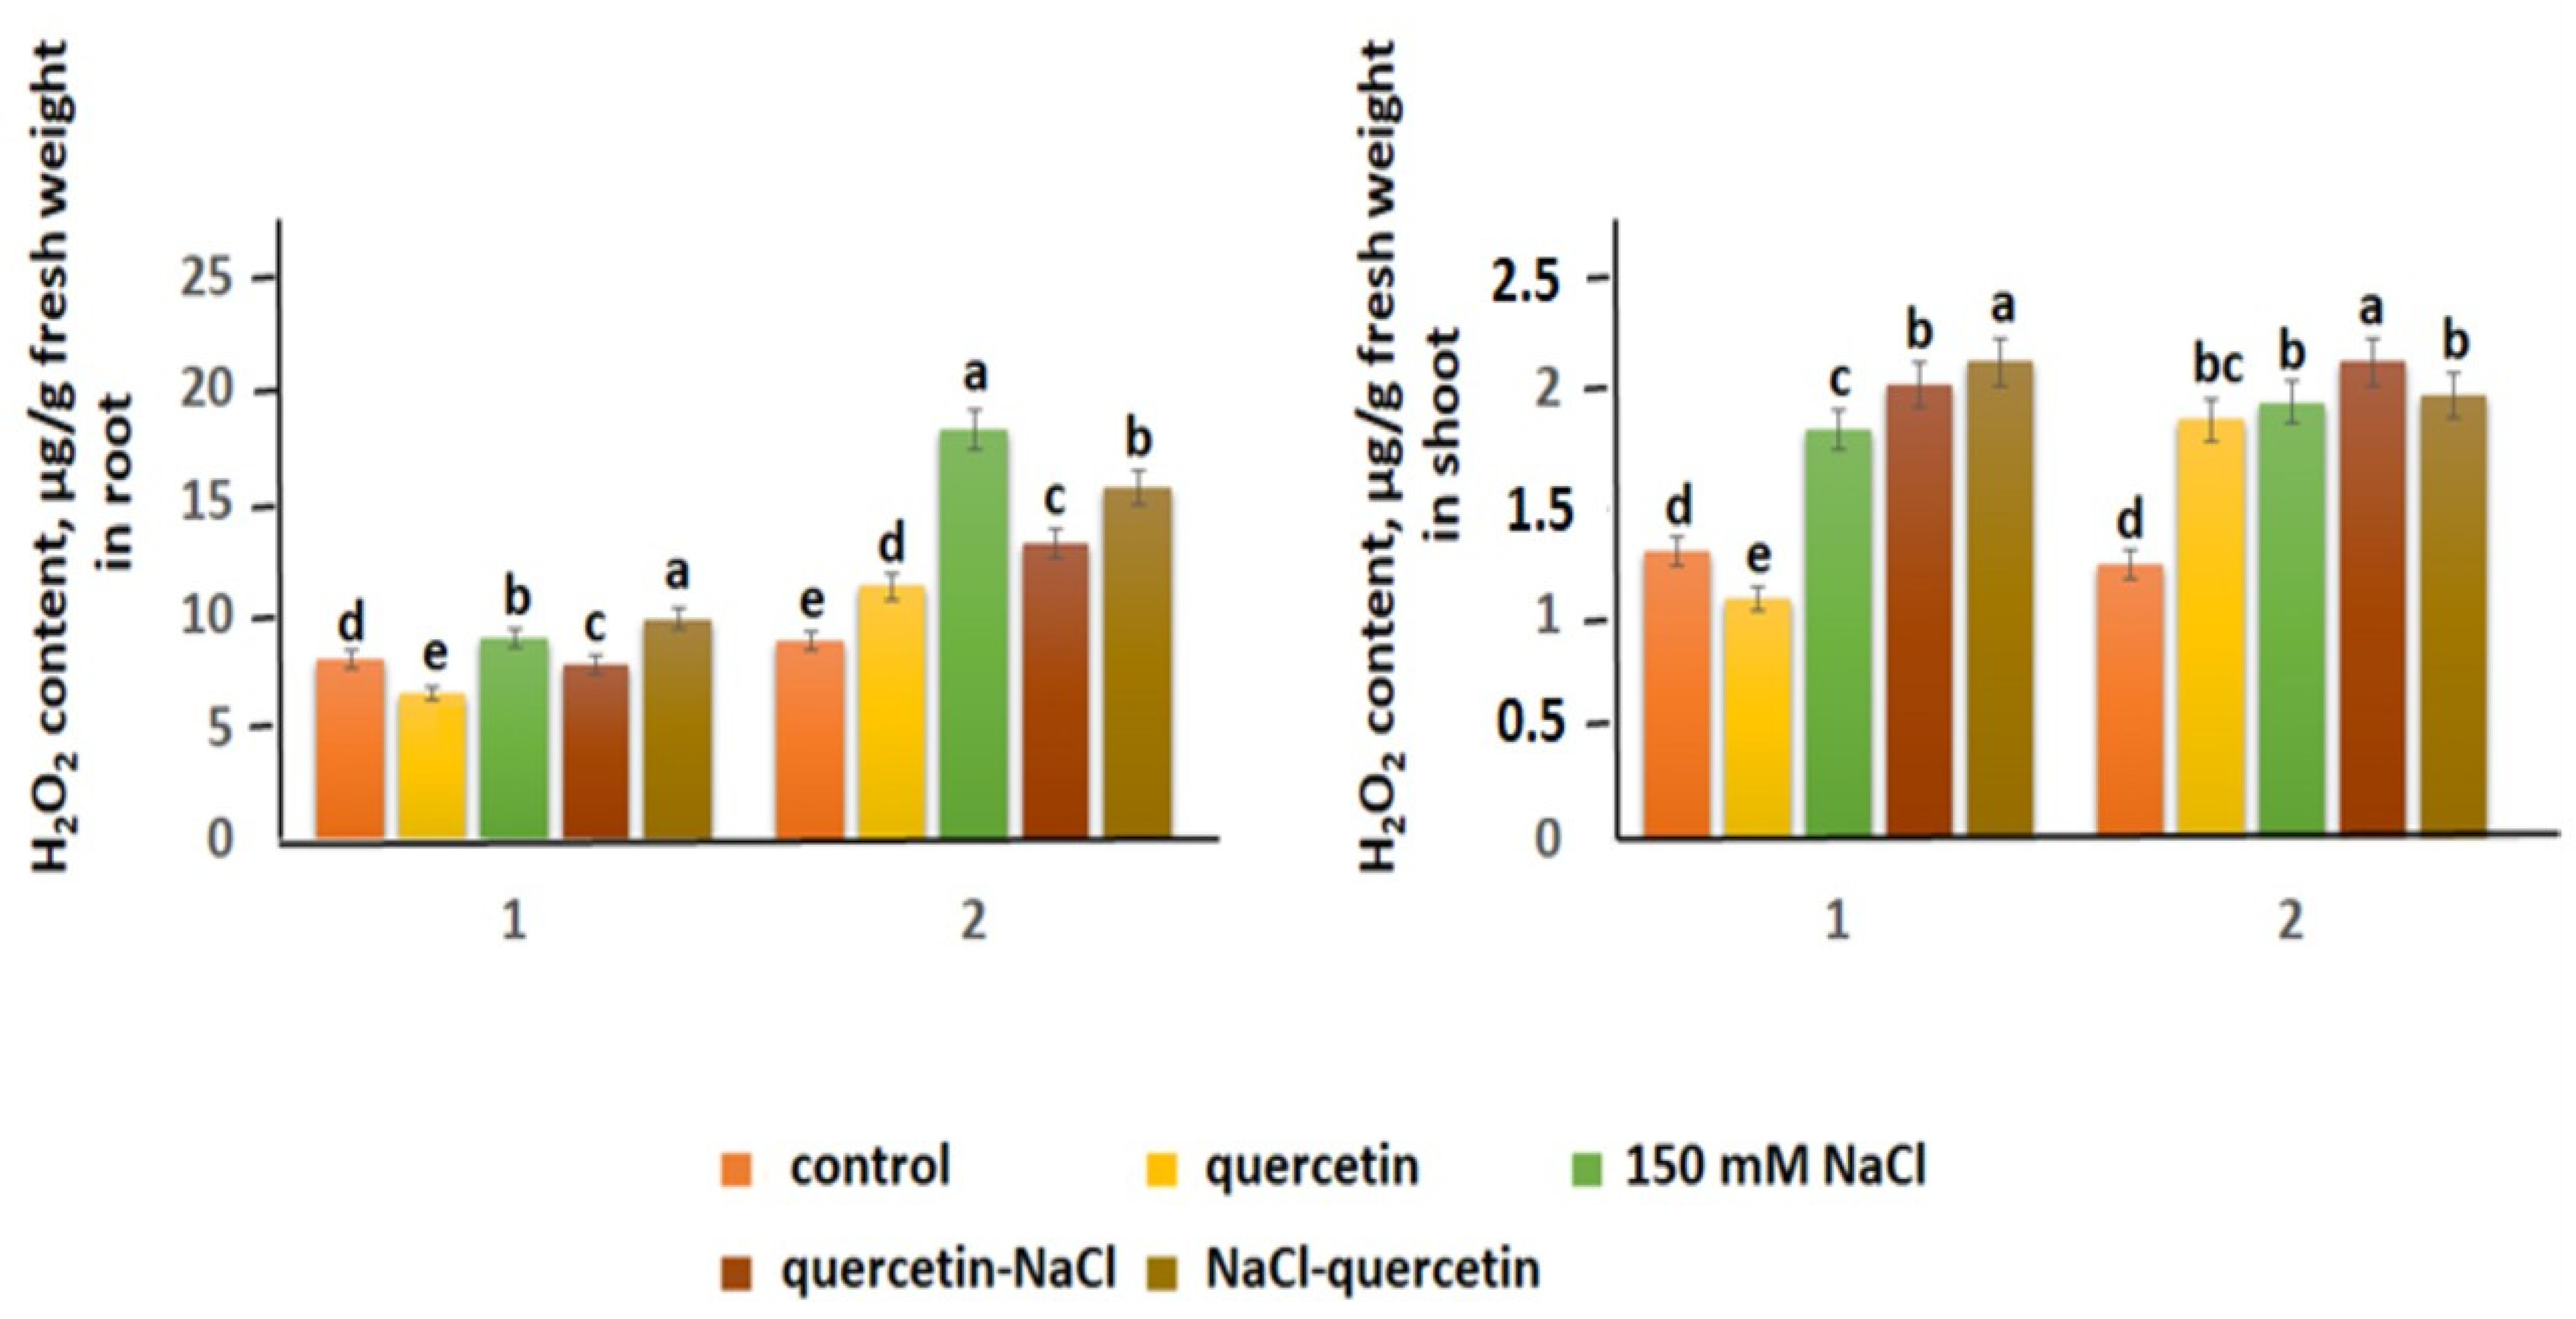
H2O2 is one of the main toxic ROS, the accumulation of which leads to protein oxidation. H2O2 content in the control shoots of both wheat varieties is comparable (Figure 4). However, H2O2 levels in the roots of the Zolotaya variety are 1.1 times higher than in the Orenburgskaya 22 variety. Salt stress provokes an increase in H2O2 concentrations in both the roots and shoots of both varieties. The effect of NaCl is most pronounced in the Zolotaya variety: the greatest increase in H2O2 content was observed in its roots (2.59 times), while in the Orenburgskaya 22 variety this value increases only 1.11 times. In shoots, an increase in H2O2 content is also observed under the influence of NaCl: in the Orenburgskaya 22 variety, it is 1.42 times, and in the Zolotaya variety, it is 1.59 times. The use of quercetin allows for reduction in the concentration of H2O2 exclusively in the Orenburgskaya 22 variety (in the roots—by 1.24 times, in the shoots—by 1.19 times).
Treatment of the Zolotaya variety with quercetin resulted in an increase in H2O2 content (by 1.27and 1.52 times, respectively). When exposed to 150 mM NaCl, quercetin also increased H2O2 levels in both the roots and shoots of the Orenburgskaya 22 cultivar, with these values exceeding those recorded under salt stress without quercetin. Conversely, pre-treatment of Orenburgskaya 22 cultivar with quercetin before salt exposure resulted in a 1.15-fold decrease in H2O2 content in the roots relative to the control sample. In the leaves of both wheat cultivars, quercetin treatment had no significant effect on H2O2 concentrations. It is worth noting that, although quercetin treatment (before and after exposure to 150 mM NaCl) reduced H2O2 levels compared to the salt effect, they still remained significantly higher than control values (1.48 and 1.71 times, respectively). Thus, these results suggest that quercetin negatively impact H2O2 levels in the Zolotaya variety, but promotes its neutralization in the Orenburgskaya 22 variety.
We have discovered an interesting fact: the effect of the low-molecular antioxidant quercetin significantly increases the H2O2 content in the Zolotaya variety and promotes the neutralization of H2O2 in the Orenburgskaya 22 variety.

3.4. Antioxidant System

3.4.1. Antioxidant Activity of Two Wheat Genotypes Grown Under Different Conditions

Plants possess a complex antioxidant system consisting of an enzymatic complex and a set of low-molecular-weight compounds. These mechanisms act synergistically, inhibiting uncontrolled oxidative processes and protecting cells from excessive accumulation of ROS [14,15]. It can be assumed that the high resistance of plants to various abiotic stresses that cause increased ROS production is directly due to the effectiveness of their antioxidant defenses [16]. Free radical oxidation is a branched chain reaction initiated by various types of ROS. This process produces molecular breakdown products with their own biological activity. Currently, there is no universal method for assessing the antioxidant activity (AOA) of biological systems. The most common method for testing AOA is the 2,2-diphenyl-1-picrylhydrazyl (DPPH) assay. AOA values determined in the roots and shoots of Orenburgskaya 22 and Zolotaya wheat varieties, grown under different conditions, are presented in Table 3.
The AOA level in the roots of the Orenburgskaya 22 variety exceeds that of the Zolotaya variety, but the opposite trend is observed in the shoots. A high NaCl concentration leads to a slight decrease in AOA in the Orenburgskaya 22 variety (by 1.04 and 1.05 times, respectively) and a significant decrease in the Zolotaya variety (by 1.58 and 1.71, respectively). Quercetin application stimulates AOA in the roots and shoots of Orenburgskaya 22 (by 1.22 and 1.03 times, respectively), while a slight decrease is observed in the Zolotaya variety (by 1.02 and 1.07 times, respectively). Abiotic stress leads to a decrease in AOA compared to the control variants in both wheat varieties. Interestingly, quercetin treatment does not increase AOA levels in the Orenburgskaya 22 variety when exposed to 150 mM NaCl. However, quercetin, in contrast, promotes AOA growth in the Zolotaya variety, offsetting the negative impact of salt stress.

3.4.2. Glutathione Content

One of the most common and important low-molecular-weight antioxidants in plants is glutathione (GSH) [43]. GSH is also involved in signaling processes in response to abiotic stress in plants [44].
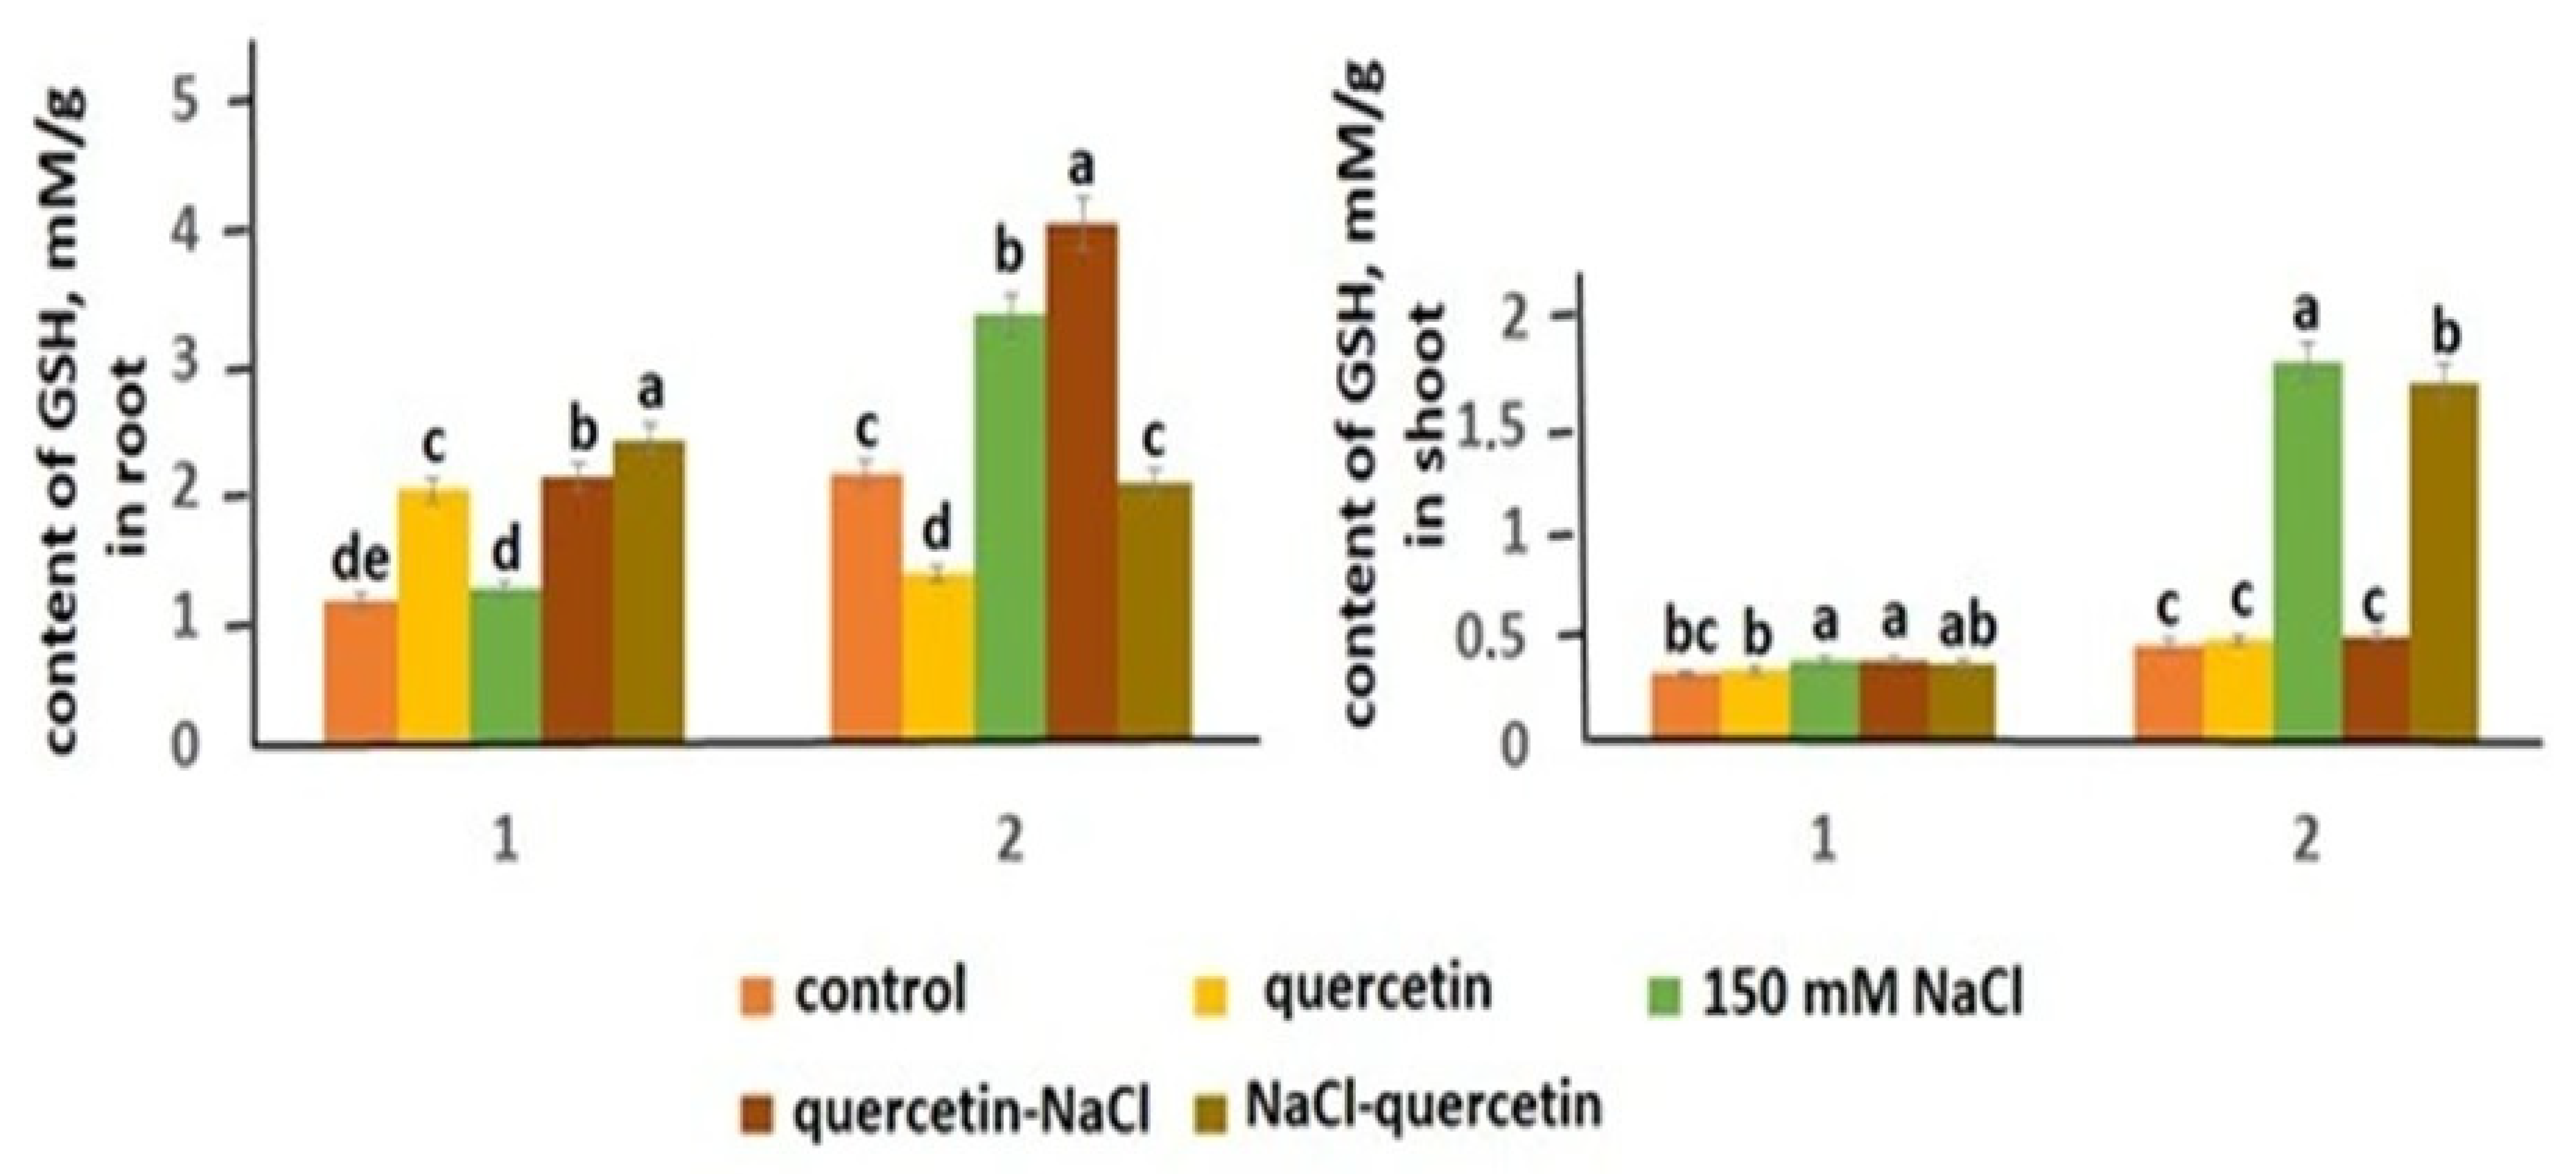
GSH is present in small amounts in the shoots of both wheat varieties (Figure 5). However, GSH content in the roots of the Zolotaya variety significantly exceeds that of the Orenburgskaya 22 variety (1.87 times). Abiotic stress leads to a significant increase in GSH content in the roots of the Zolotaya variety (1.59 times), as well as in the shoots (3.38 times). Quercetin promotes a 1.8-fold increase in the GSH content in the roots of the Orenburgskaya 22 variety and a 1.58-fold decrease in the GSH content in the roots of the Zolotaya variety. Treatment of the Zolotaya wheat variety with quercetin before exposure to NaCl proved to be the most effective and led to a 1.92-fold increase in the GSH content in the roots of the Zolotaya variety. At the same time, quercetin treatment after exposure to NaCl is effective in the shoots of the Zolotaya variety. Unlike the Zolotaya variety, salt stress did not cause an increase in GSH production in the shoots of the Orenburgskaya 22 variety. Also, various quercetin treatments had no significant effect on the shoots of the Orenburgskaya 22 variety. However, quercetin was found to have a positive effect on GSH content in the roots of the Orenburgskaya 22 variety. A positive effect of quercetin was also observed in response to quercetin treatment before and after NaCl exposure of the root of the Orenburgskaya 22 wheat variety.

3.4.3. Expression of MnSOD, Cu/ZnSOD, PX, GPX, GST, and CAT Genes

Plants possess a powerful antioxidant system that protects them from damage caused by oxidative stress. The system’s response to abiotic stress can be assessed by the dynamics of enzymatic activity and the expression level of the genes encoding the corresponding enzymes. In this study, we analyzed the expression of the MnSOD, Cu/ZnSOD, PX, GPX, GST, and CAT genes, examining changes in enzymatic activity and transcription as a complex response of the antioxidant system to abiotic stress.
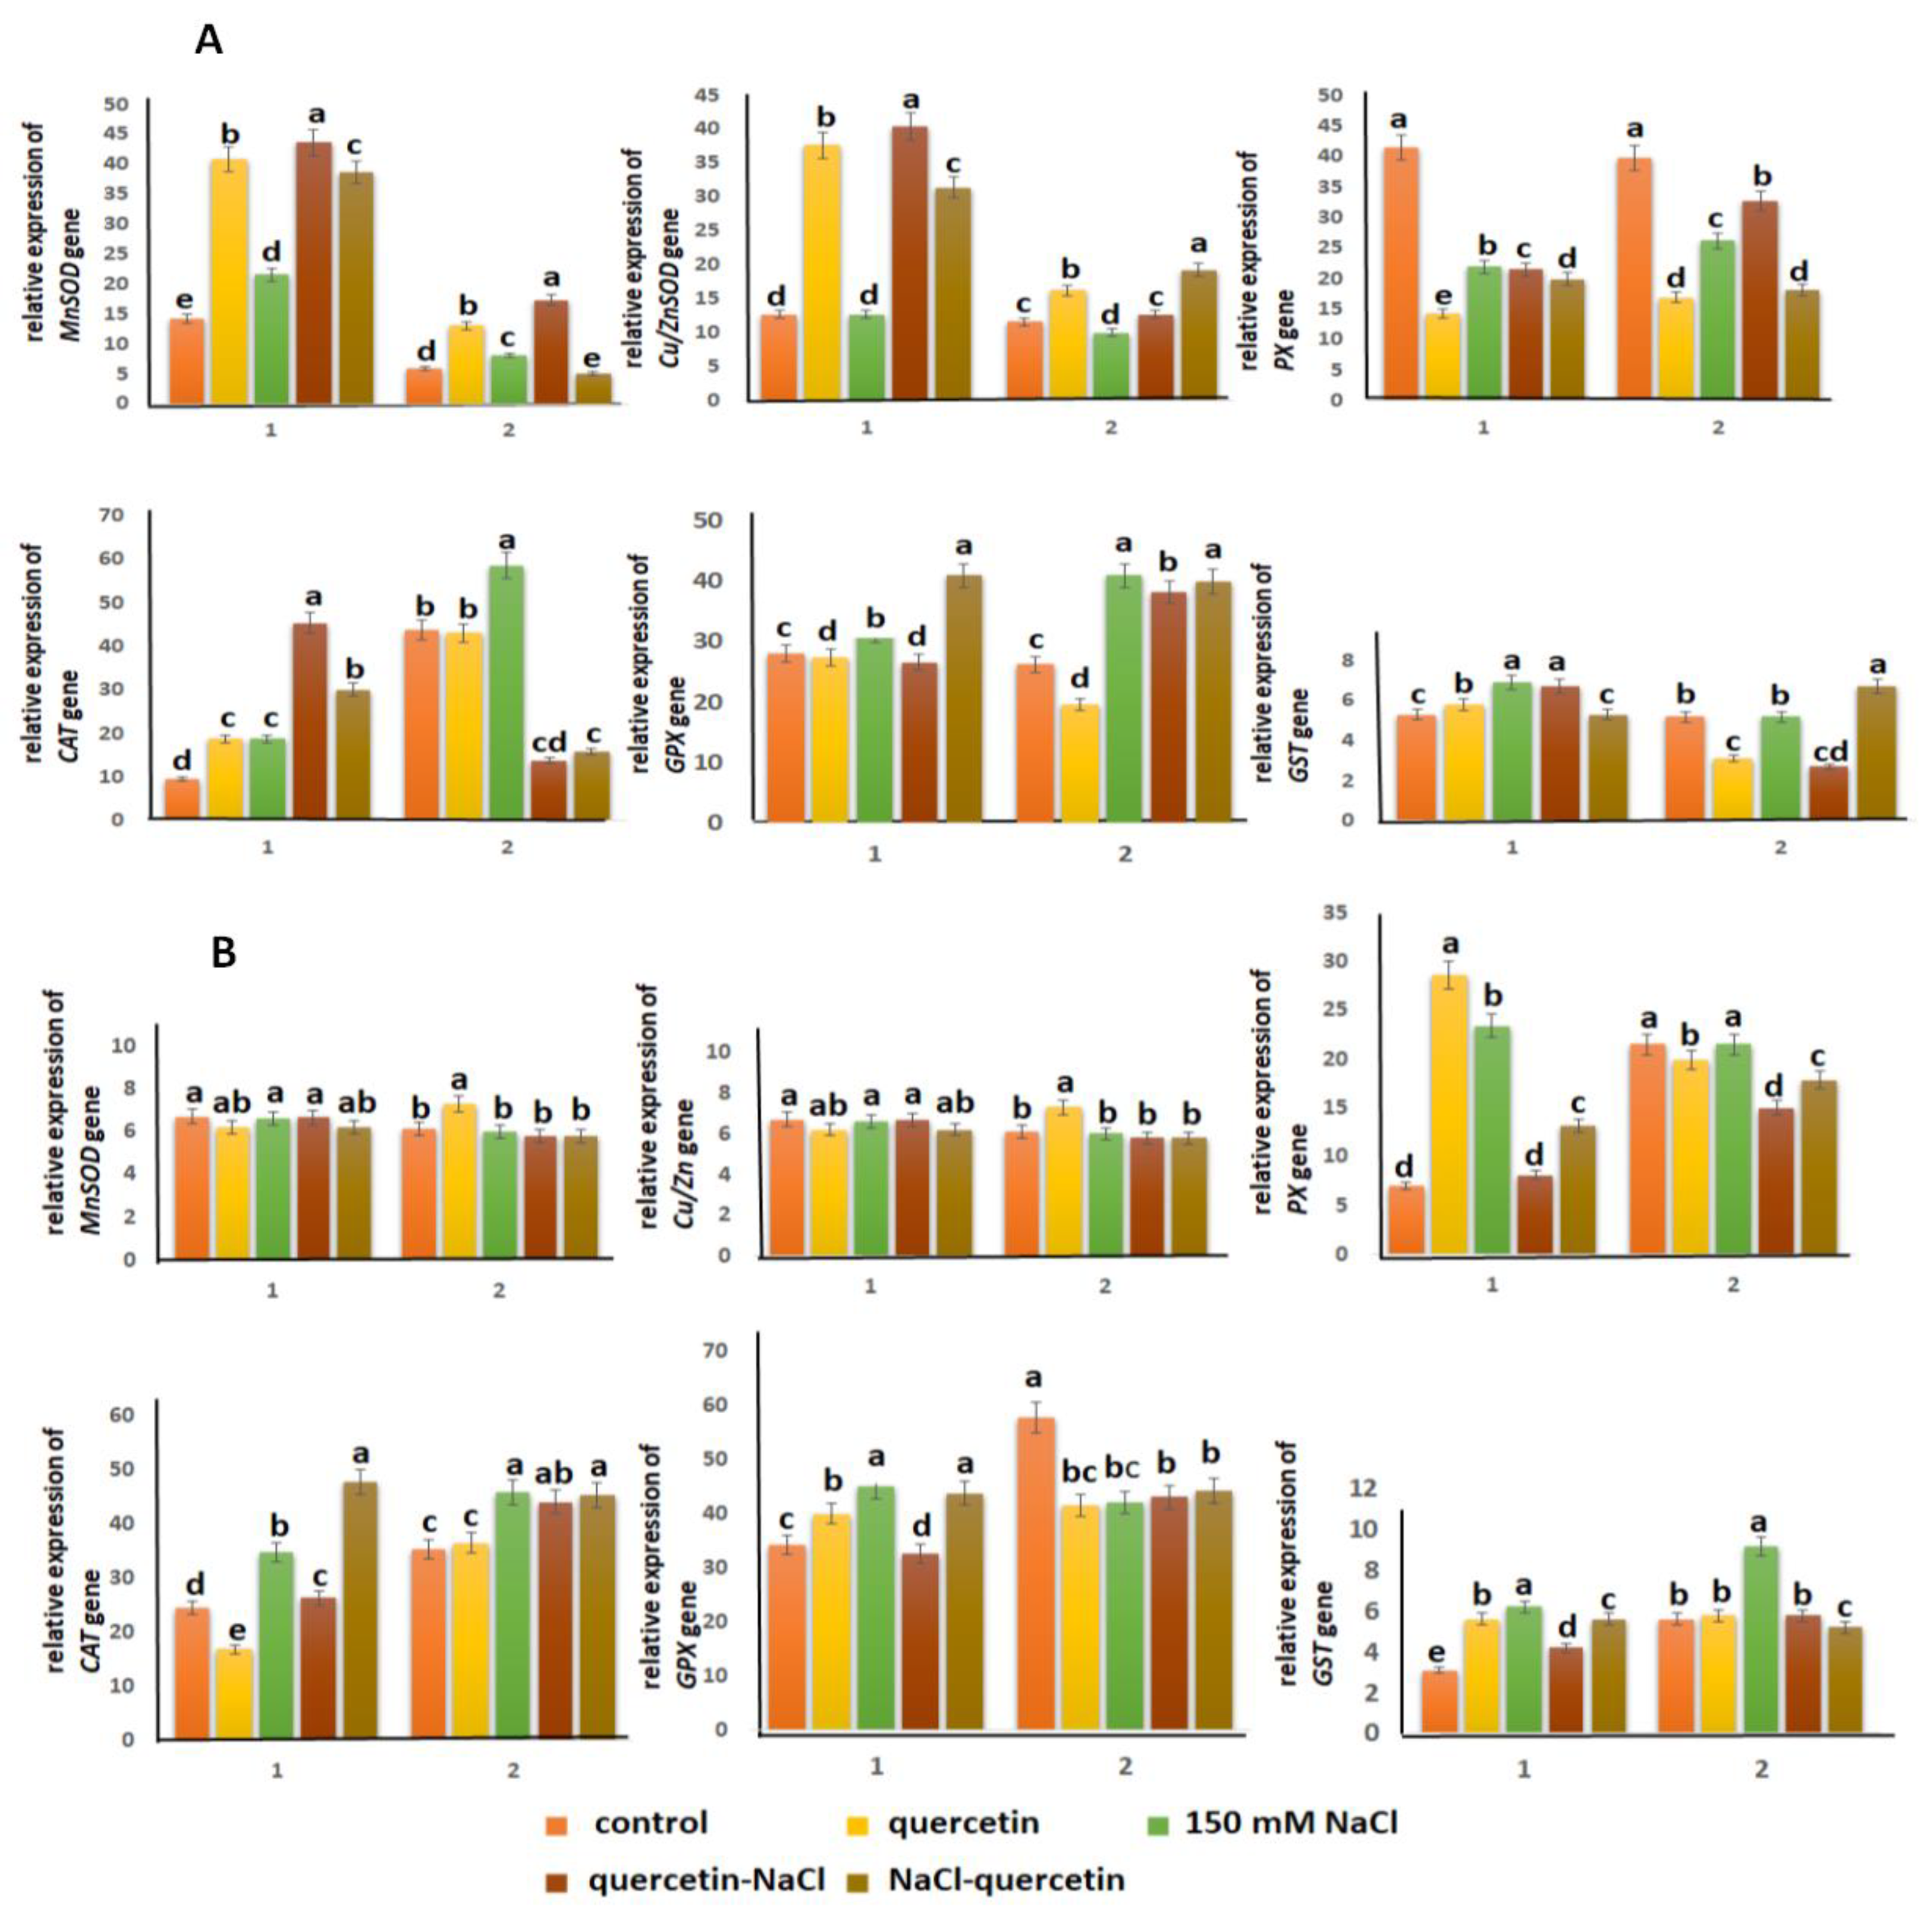
SOD activity increased in response to salt stress, suggesting a link between increased ROS formation and a defense mechanism that reduces stress-induced oxidative damage. H2O2, a product of SOD activity, remains reactive and harmful to cells, and must be the response of the antioxidant system to abiotic stress in plant, which can be considered both as changes in enzymatic activity and as changes in the expression of genes encoding antioxidant enzymes. In our study, we examined the expression of the MnSOD, Cu/ZnSOD, PX, GPX, GST, and CAT genes. The results are presented in Figure 6.
The expression levels of the MnSOD and Cu/ZnSOD genes in the roots of the Zolotaya cultivar are more than half those of the Orenburgskaya 22 cultivar (2.12- and 2.23-fold, respectively). Sodium chloride stimulates MnSOD gene expression in the Orenburgskaya 22 cultivar, increasing it by 1.52-fold in roots and 1.37-fold in shoots. However, NaCl had no effect on the expression of the mitochondrial MnSOD gene in the Zolotaya cultivar. As for the chloroplast Cu/ZnSOD gene, its expression remained virtually unchanged in both cultivars, with the exception of the Zolotaya cultivar, where a 1.35-fold increase observed in shoots. Quercetin treatment significantly increased MnSOD and Cu/ZnSOD gene expression in the Orenburgskaya 22 variety, while it had virtually no effect on the Zolotaya variety. Pre-treatment of the Orenburgskaya 22 variety with quercetin before exposure to 150 mM NaCl produced a similar effect of enhancing MnSOD and Cu/ZnSOD gene expression.
In the Orenburgskaya 22 cultivar, quercetin is involved in regulating MnSOD and Cu/ZnSOD gene expression, actively protecting the wheat from ROS formation when treated with 150 mM NaCl, and also capable of restoring ROS levels after exposure to NaCl. In the Zolotaya cultivar, quercetin has no protective effect when exposed to NaCl and does not promote the restoration of MnSOD and Cu/ZnSOD gene expression. However, pre-treatment with quercetin activates Cu/ZnSOD expression in both roots and shoots of this cultivar (by 1.75 and 1.65 times, respectively). This indicates that chloroplast SOD plays a more significant role in protective processes than mitochondrial SOD. Higher MnSOD and Cu/ZnSOD gene expression in roots than in shoots is likely due to the fact that roots are subject to oxidative stress more quickly and to a greater extent than shoots.
The main function of peroxidase (PX) under osmotic stress is to neutralize excess hydrogen peroxide and convert it into water [45]. In the Zolotaya variety, the PX gene expression level in the shoots is 1.85 times lower than in the Orenburgskaya 22 variety, and 5.93 times lower in the roots. Under salt stress, a sharp increase in the relative PX expression (by 3.34 times) was observed in the roots of the Zolotaya variety. The application of quercetin before and after stress exposure significantly reduces PX activity in this variety, especially in the root system, although the values still remain higher than the control values. In the Orenburgskaya 22 variety, on the contrary, salt stress causes a sharp decrease in PX expression both in the roots (by 1.89 times) and in the shoots (by 1.52 times). Unlike the first case, quercetin treatment of Orenburgskaya 22 increased PX expression in both plant parts compared to stress treatment, although it did not reach control levels.
The primary function of catalase (CAT) is to decompose H2O2 into water and molecular oxygen. The enzyme localized primarily in peroxisomes and glyoxysomes, but a specific form has also been identified in mitochondria [46,47]. Unlike peroxidase (PX), CAT operates effectively at high H2O2 concentrations, converting approximately 6 million substrate molecules into H2O and O2 per minute. Expression analysis revealed that CAT activity in the roots of the Zolotaya cultivar was 1.75 times higher than that of the Orenburgskaya 22 cultivar, while the opposite was true in shoots: the expression level of the Orenburgskaya 22 exceeded that of the Zolotaya by 1.23 times. When exposed to NaCl, CAT activity in the roots of the Orenburgskaya 22 variety increases by 1.96 times, while in the Zolotaya variety this indicator increases less significantly (by 1.42 times), but remains at a higher level (1.84 times higher than in the Orenburgskaya 22). The effect of quercetin on enzymatic activity also varies: in the Zolotaya variety, it reduces CAT activity in the roots by 1.44 times, while in the Orenburgskaya 22, it increases it by 1.96 times.
Glutathione peroxidase (GPX) is a key component of the ascorbate-glutathione cycle, maintaining a reduced GSH pool [48,49], which in turn serves as a substrate for this enzyme. In the Zolotaya cultivar, GPX activity in both the roots and (to a greater extent) the shoots exceeds that of the Orenburgskaya 22 cultivar by 1.24 and 2.2 times, respectively. Under salt stress, GPX expression in the Zolotaya cultivar increases by 1.32 times in the roots and decreases by 1.31 times in the shoots. Quercetin activates GPX gene expression in the roots of the Zolotaya cultivar by 1.17 times. In the roots of the Orenburgskaya cultivar, treatments with sodium chloride and quercetin had no significant effect on GPX gene expression. Only quercetin treatment after exposure to NaCl led to a sharp 1.3-fold increase in GPX expression in the Orenburgskaya 22 cultivar. A comparison of GSH content and GPX activity data suggests that GSH mechanisms play a significantly more important role in Zolotaya cultivar than in the Orenburgskaya 22 cultivar. This is supported by the dynamics of another GSH-related enzyme, glutathione-S-transferase (GST). GSTs are a superfamily of detoxifying enzymes that conjugate GSH for subsequent removal of toxins from the plant [50,51]. In the Orenburgskaya 22 variety, GST expression levels remained low and remained virtually unchanged under abiotic stress. In contrast, in the Zolotaya variety, GST expression increased 1.64-fold in roots and 2-fold in shoots under the influence of NaCl.

3.5. ROS Trigger Apoptosis-like

3.5.1. Immunodetection Atg8

The accumulation of toxic ions accompanied by increased ROS levels and progressive damage to root tissue. Abiotic stress triggers autophagy and the activation of autophagy proteins (ATG). It is worth noting that autophagy proteins were conserved and found in yeast, animal, and plant cells. To confirm the activation of autophagy in the macerated root meristem cells of two wheat genotypes (Triticum aestivum and Triticum durum) as a result of salt stress, immunodetection of the autophagy marker, ATG8, was performed on autophagosomal membranes (Figure 7).
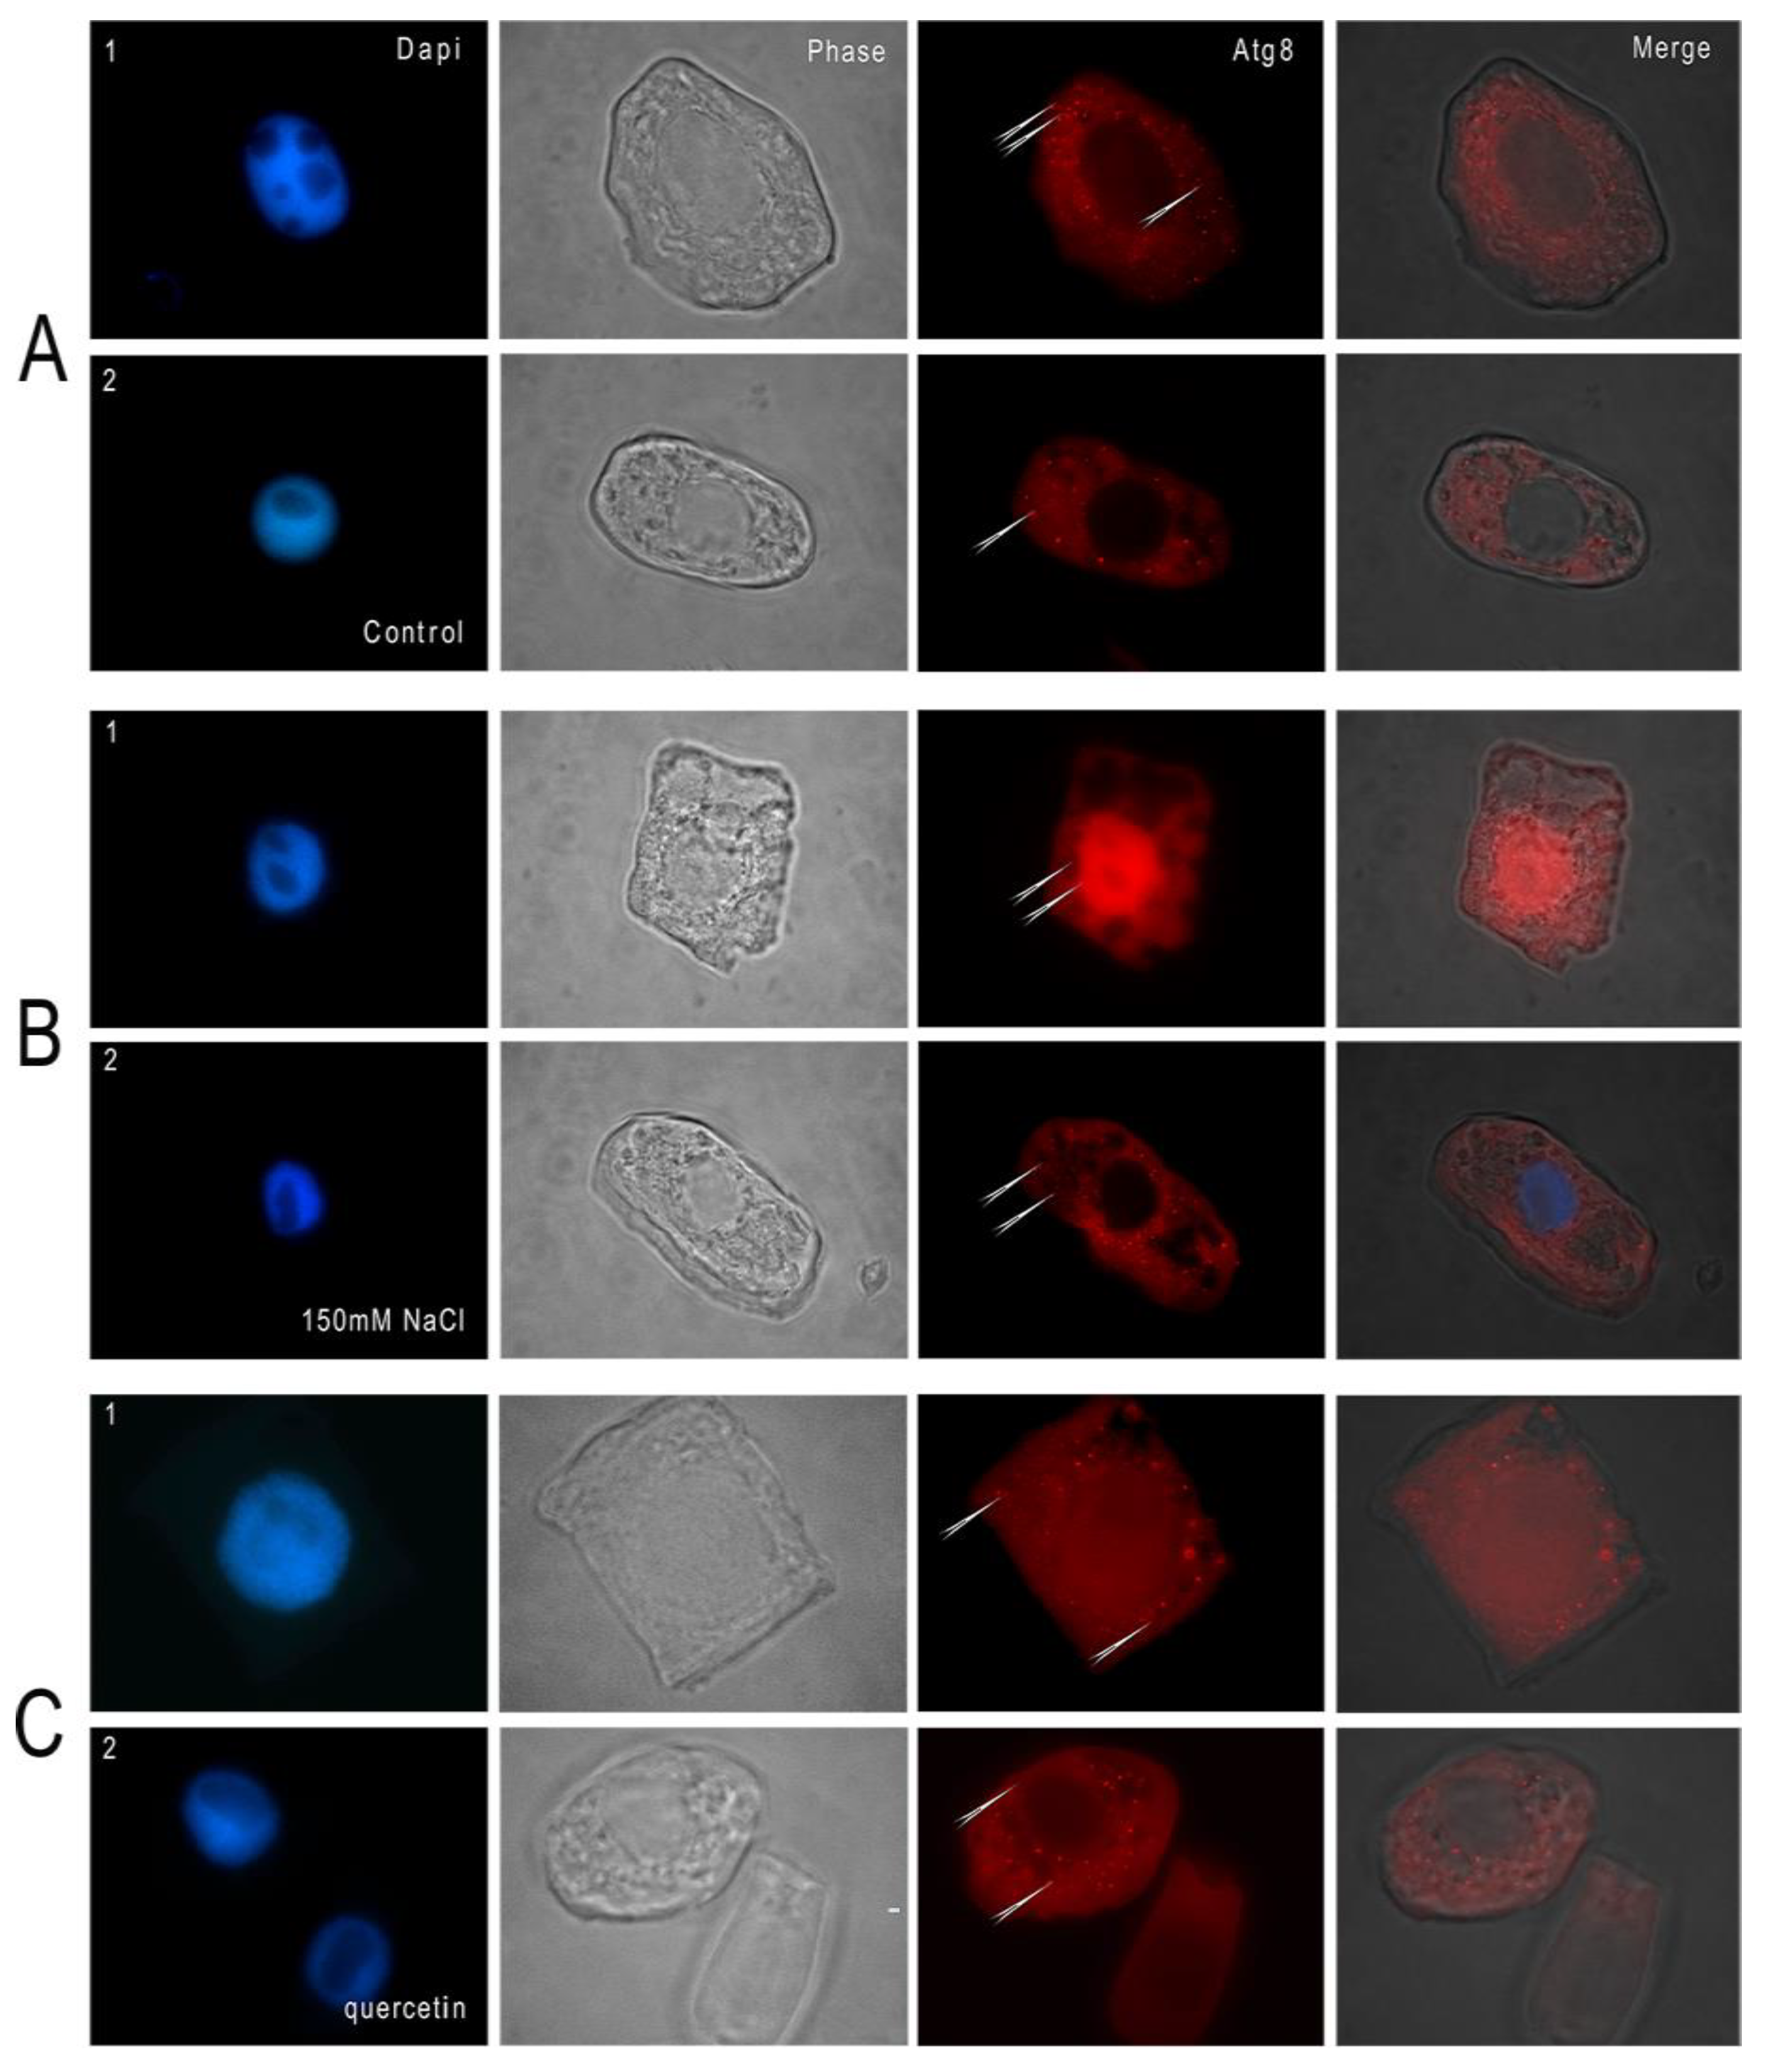
In the cytoplasm of root meristem cells of control wheat plants of the Triticum aestivum Orenburgskaya 22 variety and Triticum durum Zolotaya variety, ATG8 labels receptor binding sites on the surface of small autophagosomes (Figure 7A, 1 and 2). The cytoplasm of outer cortex cells of the Orenburgskaya 22 and Zolotaya wheat cultivars grown in the presence of 150 mM NaCl contains larger vacuoles (Figure 7B, phases 1 and 2) than in the control. In some outer cortex cells of the Orenburgskaya 22 cultivar, ATG8 is localized homogeneously in the cytoplasm, on the surface of the nuclear envelope, small autophagosomes around the nucleus, and as bright dots on the surface of individual large autophagosomes (Figure 7B, 1, ATG8, arrows). In the Zolotaya cultivar, the nuclear membrane is not labeled by ATG8, but is localized to individual small sites on the surface of autophagosomes (Figure 7B, 2, ATG8, arrows).
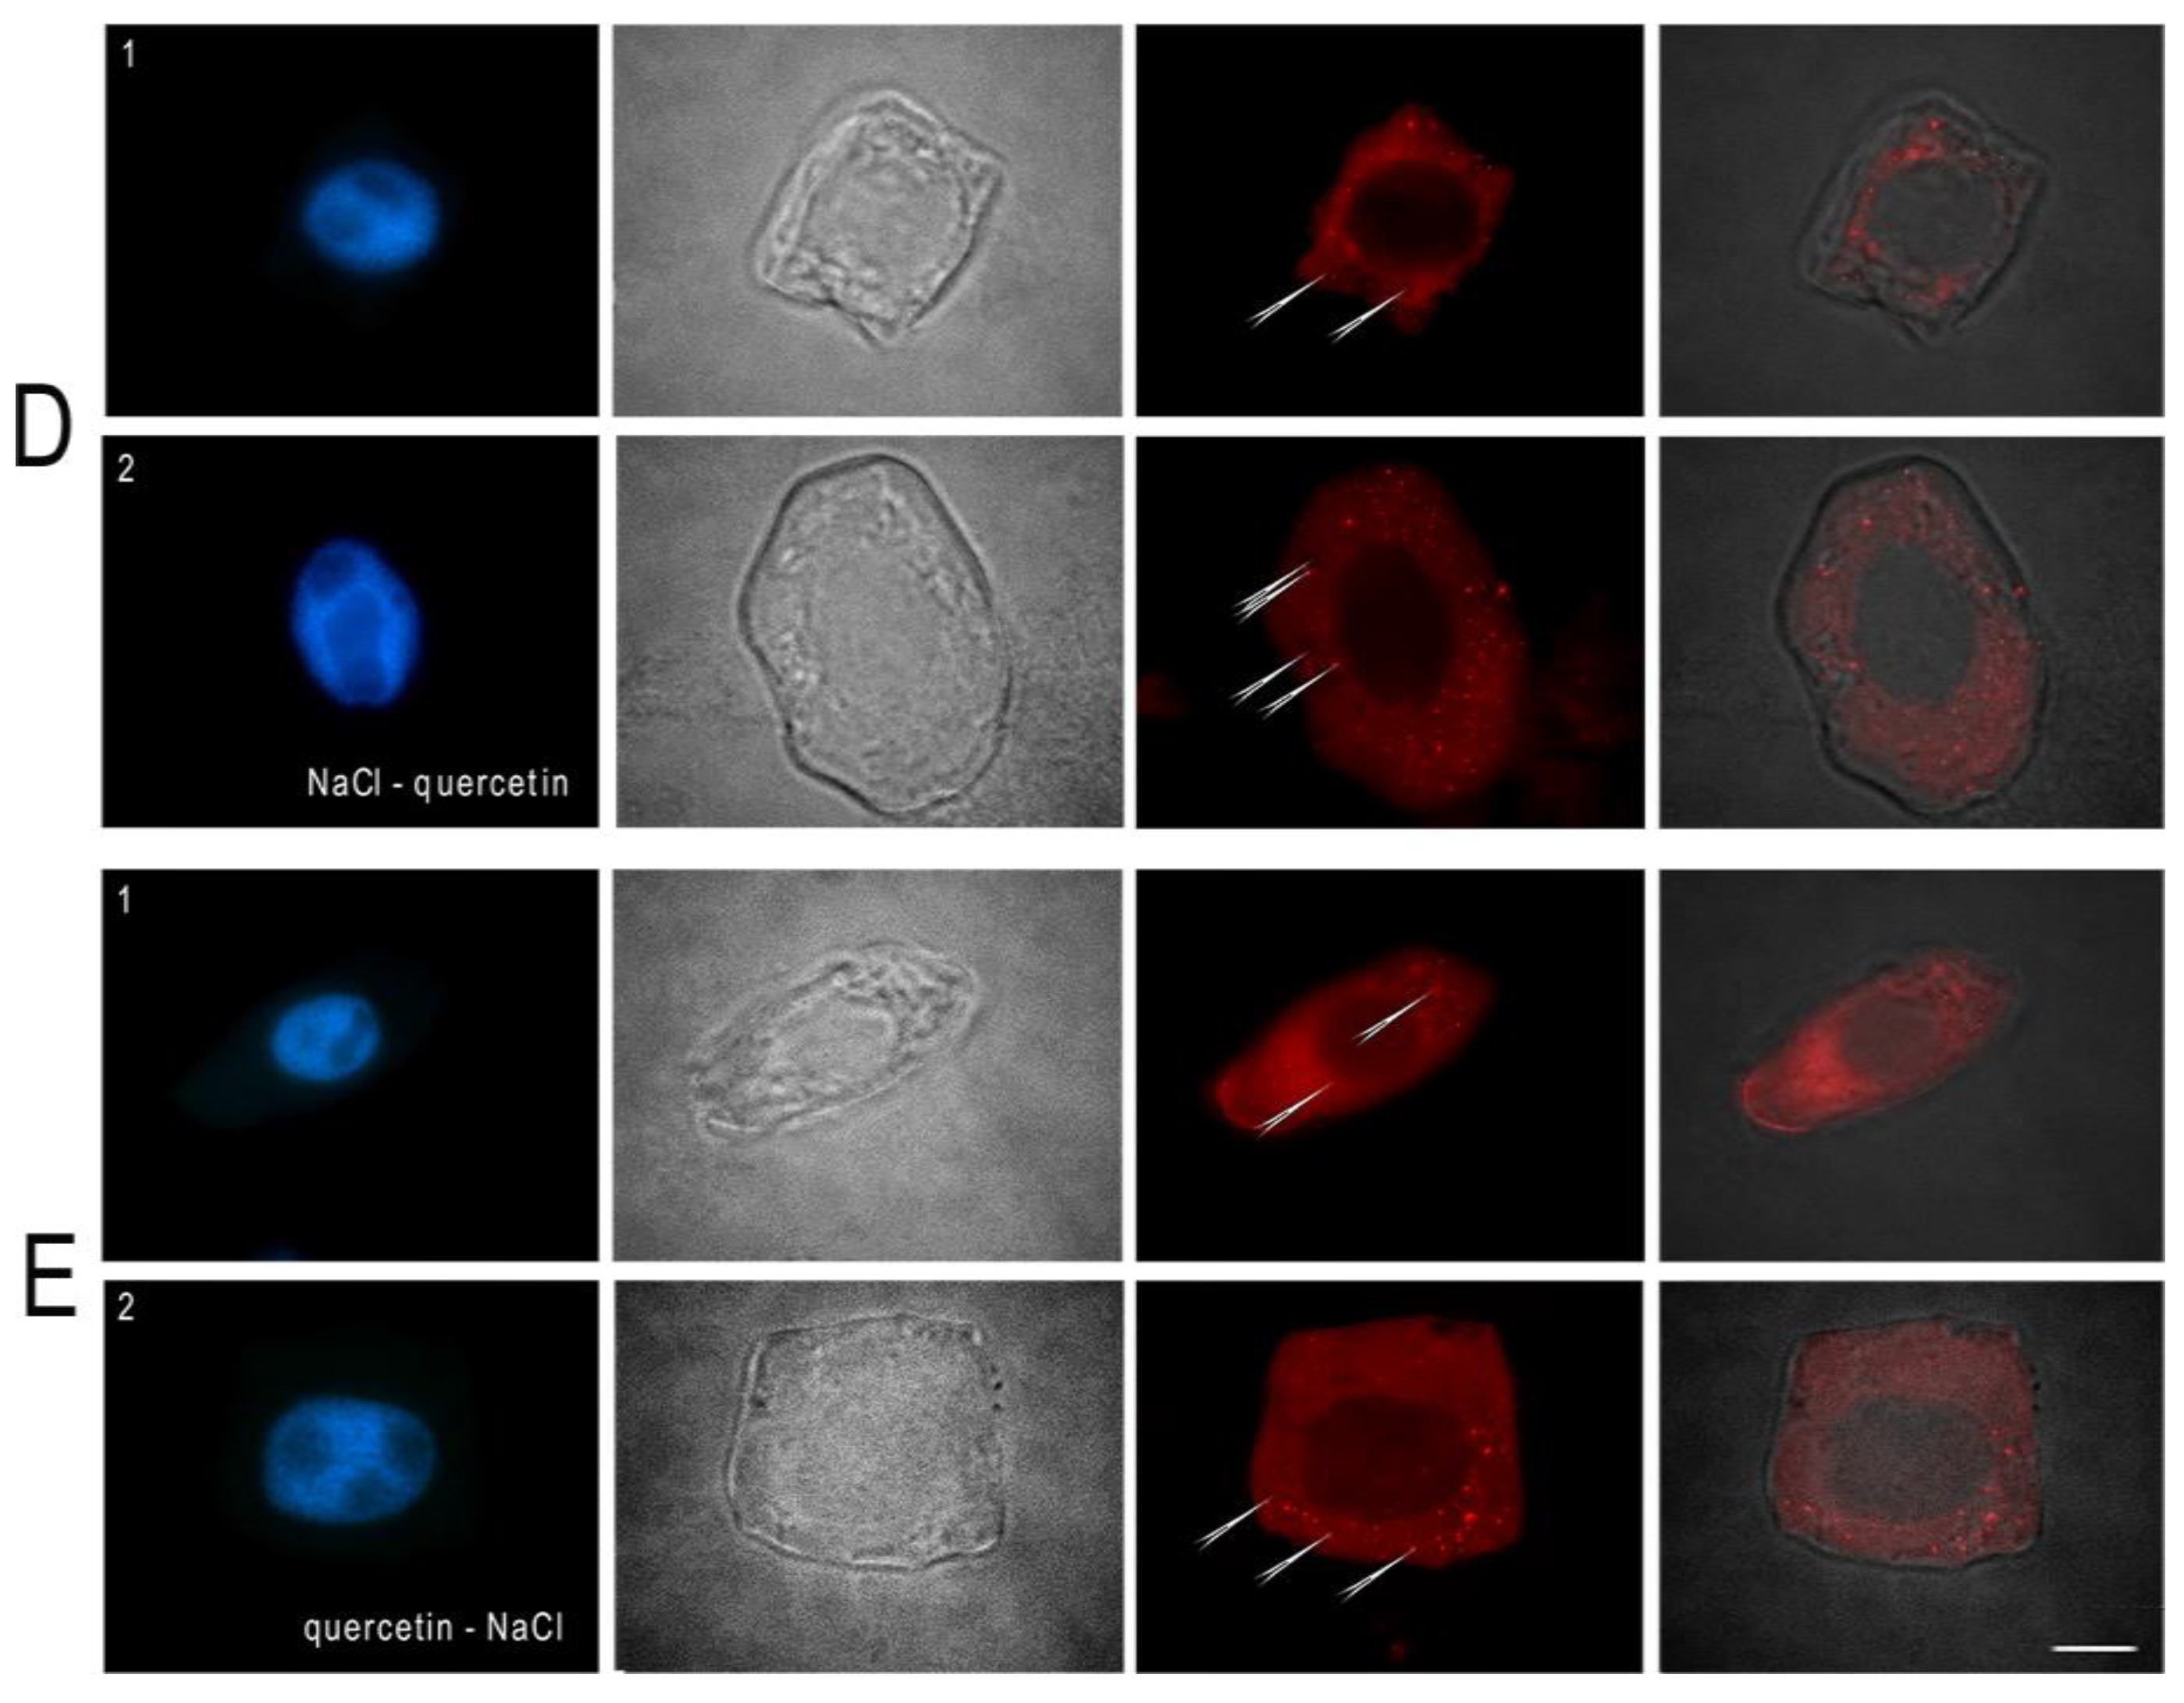
Incubation with 0.03% quercetin resulted in an increase in nuclear and cell size in the Orenburgskaya 22 cultivar, which requires further study. In the cells of this cultivar, ATG8 labels the surface of small autophagosomes or individual sites on the membranes of vacuoles near the nucleus (Figure 7C, 1, ATG8, arrows). The root cell size of the Zolotaya cultivar corresponded to that of the control plants, and ATG8 labeled individual sites on the membranes of each vacuole (Figure 7C, 2, ATG8, arrows). In wheat cultivars sequentially incubated first in the presence of 150 mM NaCl and then transferred to a 0.03% quercetin solution, the number of ATG8-labeled autophagosomes was comparable to their number in cells exposed to salt stress (Figure 7D, 1 and 2, ATG8, arrows).
When plants were incubated first in a 0.03% quercetin solution for 24 h and then in 150 mM NaCl for 24 h, the number of ATG8-labeled autophagosomes in the Zolotaya cultivar cells was significantly higher than in the Orenburgskaya 22 cultivar cells (Figure 7E, 2, ATG8, arrows). In the Orenburgskaya 22 cultivar, ATG8 diffusely distributed throughout the cytoplasm and labeled individual sites on autophagosomal membranes at the poles above the nucleus (Figure 7E, 1, ATG8, arrows).
The study revealed cells with diffusely distributed ATG8 in their cytoplasm. We calculated the ratio of cells with labeled autophagosomes to cells with homogeneous cytoplasmic staining (Table 4). In cells of control plants of both wheat varieties, the number of cells with autophagosomes was greater than the number of cells with diffuse protein distribution (approximately 1.5). Exposure of root cells of the Zolotaya variety to salt stress resulted in a 1.9-fold increase in the number of cells with autophagosomes. Exposure to quercetin did not significantly alter the cell ratio in either variety. A significant 3.8-fold increase in the number of cells with autophagosomes was observed in Zolotaya variety cells exposed to quercetin after salt stress. If the cells were first incubated with quercetin and then in salt, the number of cells with autophagosomes decreased and the number of cells with diffusely distributed ATG8 increased.

3.5.2. Expression ATG Genes

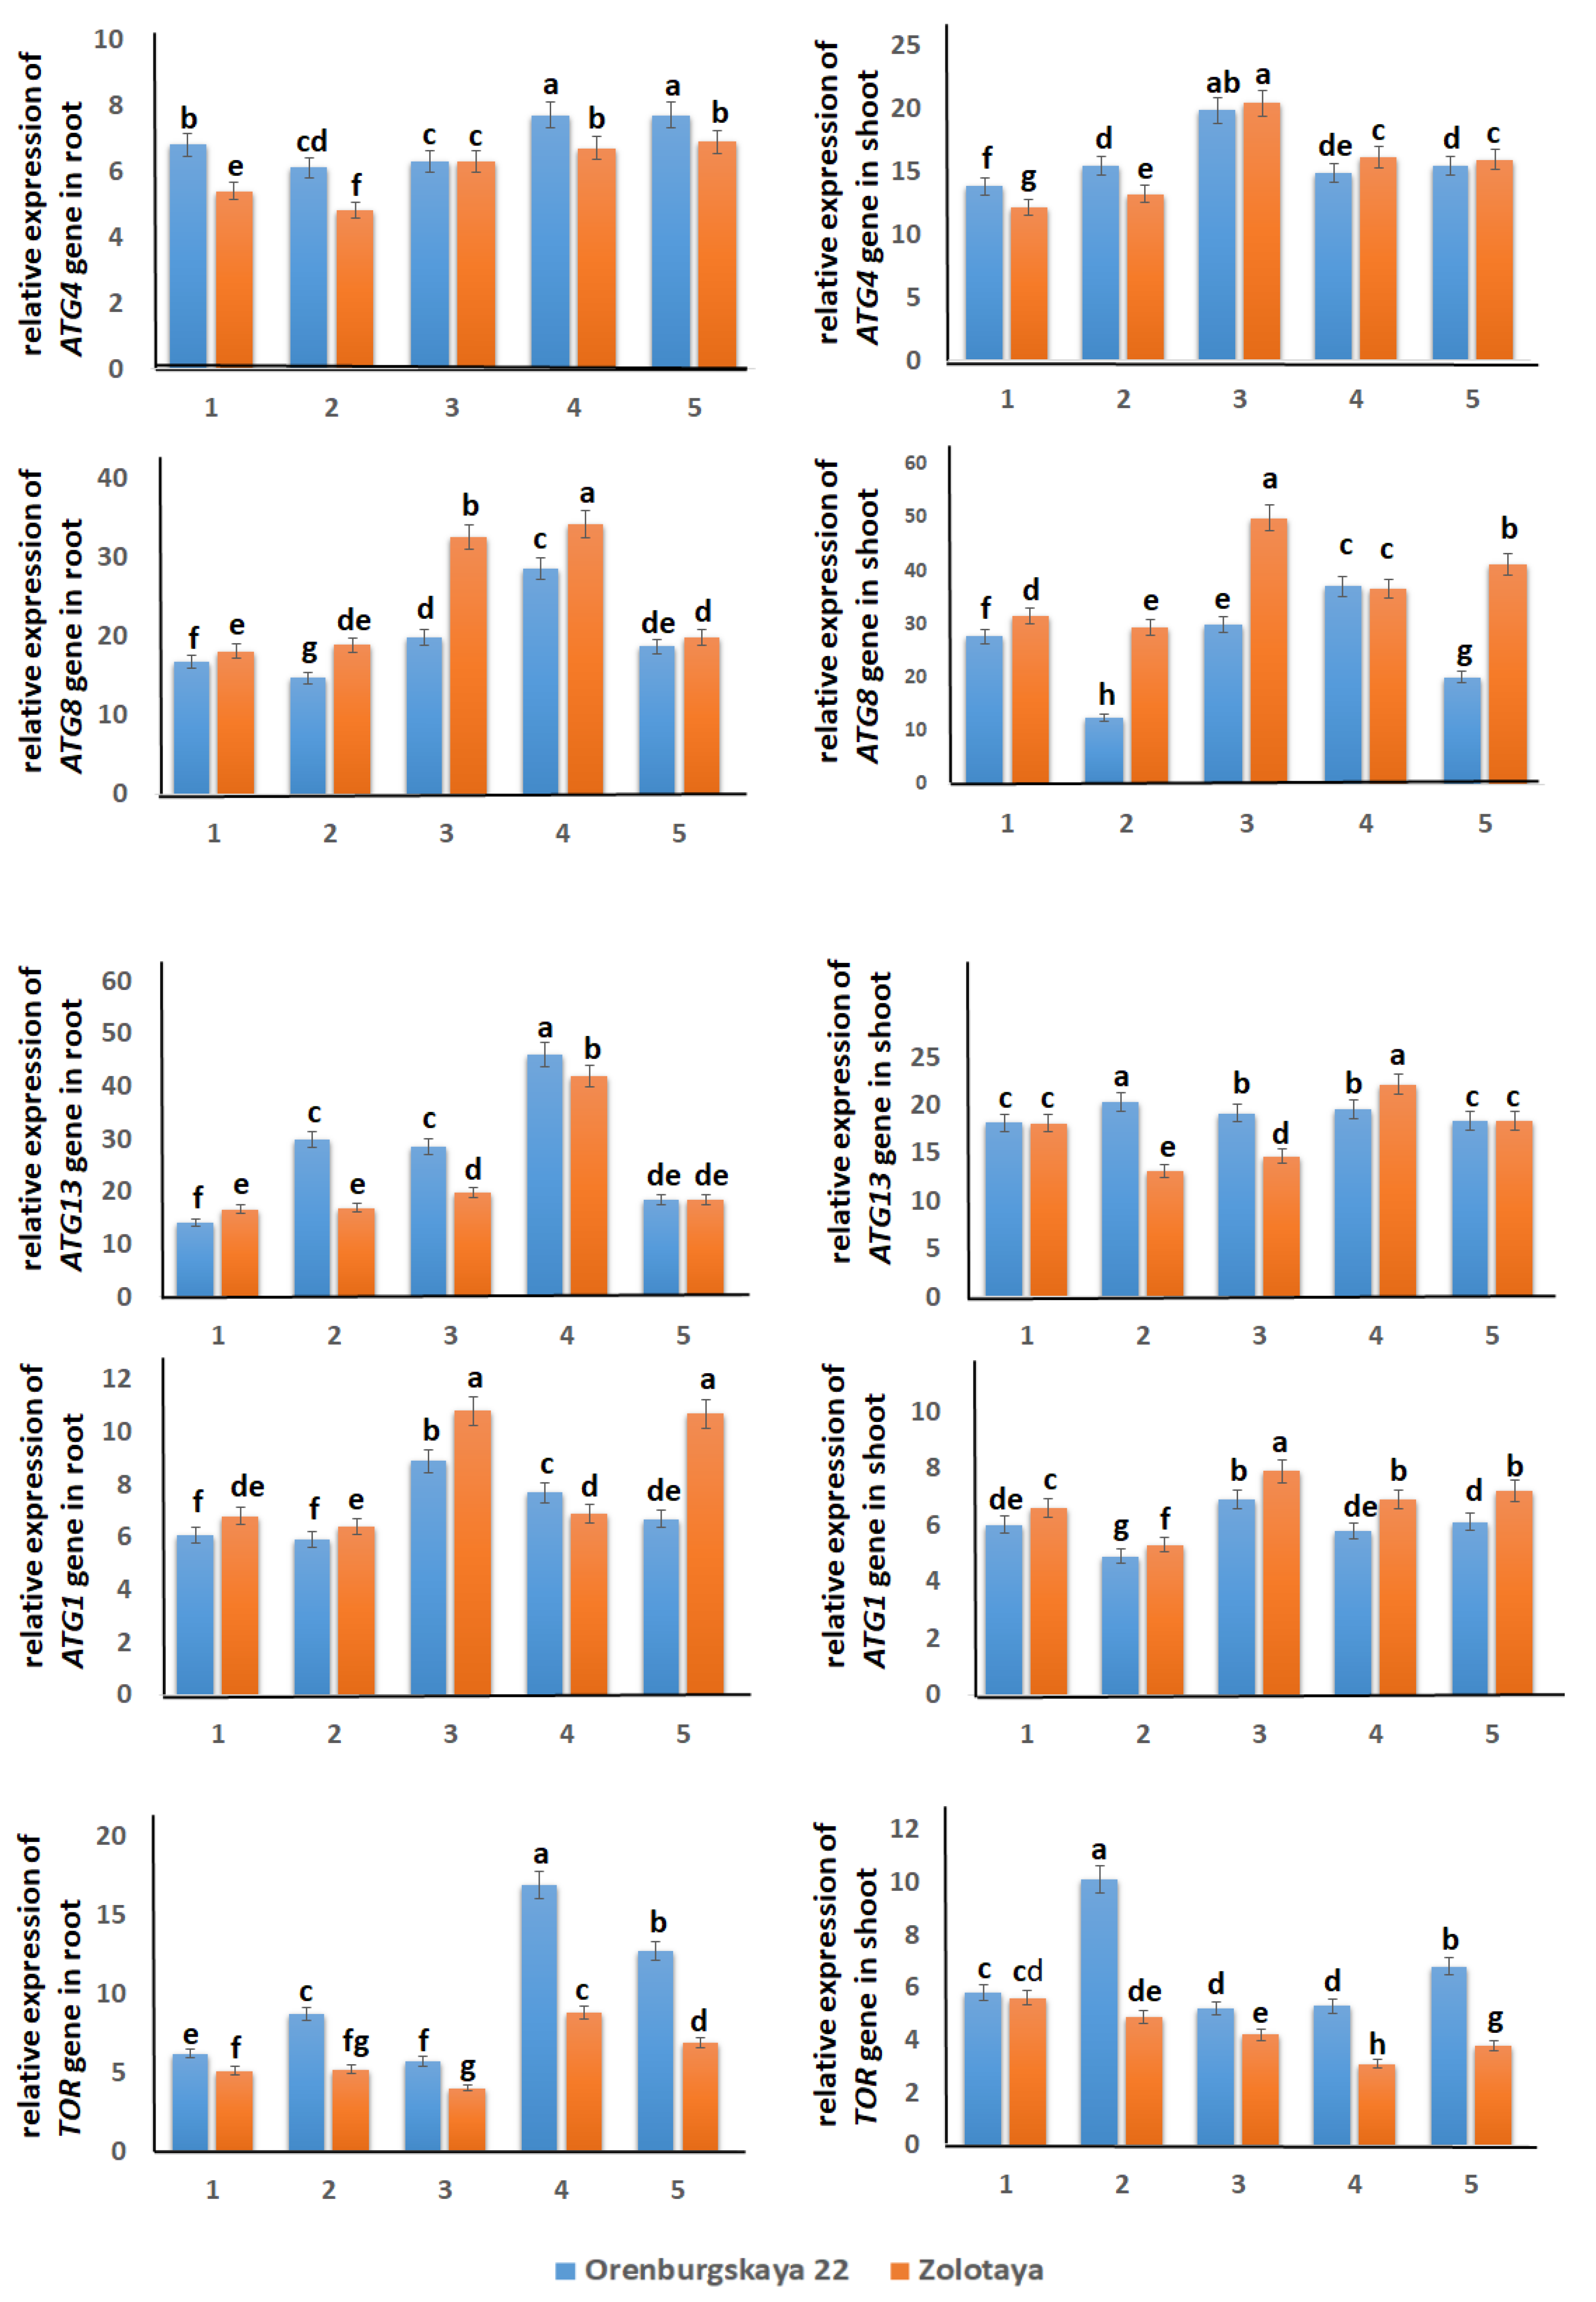
More than 30 ATG proteins play an important role in the process of programmed cell death [52,53]. Proteins required for the autophagy process are grouped into four main functional groups [54,55]. Rapamycin acts as a negative regulator of ATG1/ATG13-mediated autophagy [56]. Under control growing conditions, the level of TOR gene expression in the roots and shoots of both wheat varieties demonstrated virtually identical values. Increasing the NaCl concentration in the solution resulted in decreased TOR gene expression in all studied variants. For example, in the Orenburgskaya 22 variety, expression in roots and shoots decreased by 1.1 relative to the control, while in the Zolotaya variety, a more pronounced suppression was observed: 1.3 times in roots and 1.3 times in shoots (Figure 8). Since the TOR gene acts as a negative regulator of autophagy in plants, these data indicate its activation under salt stress, with this process being more intense in Zolotaya variety. Furthermore, quercetin stimulated TOR gene expression in the Orenburgskaya 22 variety, increasing it by 1.5 times in roots and 1.7 times in shoots.
In the Zolotaya variety, quercetin exhibits the opposite effect, causing a 1.1-fold increase in TOR gene expression in shoots relative to the control. Moreover, quercetin treatment (both before and after NaCl exposure) leads to an increase in TOR gene expression in roots and a decrease in shoots of this variety. Unlike the Zolotaya variety, the Orenburgskaya 22 variety exhibits an increase in TOR gene expression in roots (more than 2-fold). In shoots, changes in TOR gene expression are significantly lower.
Treatment of 6-day-old wheat seedlings with 150 mM NaCl stimulates ATG1 expression in shoots and, especially, roots. Quercetin treatment had virtually no effect on expression in either wheat variety. Quercetin treatment before or after sodium chloride treatment in the Orenburgskaya 22 variety resulted in a decrease in ATG1 expression, while in the Zolotaya variety, a decrease in ATG1 expression occurred only after quercetin pretreatment. Sodium chloride activated ATG13 gene expression in the Orenburgskaya 22 variety by 2.28 times in roots, while in the Zolotaya variety, the increase in expression was only 1.07-fold. Quercetin also significantly activated ATG13 expression in the Orenburgskaya 22 variety by 2.27 times. The ATG4 expression level in the roots of the Zolotaya variety is 1.28 times lower than that of the Orenburgskaya 22 variety. Quercetin reduces ATG4 expression in both Zolotaya and Orenburgskaya 22 varieties by 1.14 times. The ATG8 expression level in the roots differs insignificantly between the wheat varieties (in the Zolotaya variety, it is 1.03 times higher than in the Orenburgskaya 22 variety). However, exposure to sodium chloride initiates an increase in ATG8 expression in the Zolotaya variety by 1.82 times, and in the Orenburgskaya 22 variety only by 1.14 times. Quercetin contributes to a decrease in ATG8 expression activity in the Orenburgskaya 22 variety (by 1.27 times). Interestingly, treatment with quercetin followed by exposure to sodium chloride stimulates ATG8 expression activity in the Orenburgskaya 22 variety.

4. Discussion

Plants are constantly under stress, so they have developed a complex acclimation system to survive in a constantly changing environment. Stress is thought to result in the production of excess ROS in plants. ROS causes cell death, a direct consequence of oxidative stress, and activates programmed cell death (PCD) pathways [6]. Oxidative stress damages DNA, proteins, lipids, and other cellular components [2]. To protect themselves from salt stress, plants have developed a variety of salt-tolerance mechanisms. These include the removal of Na+ and Cl ions into vacuoles, blocking Na+ transport into the cell, excluding Na+ from the transpiration stream, and a number of other mechanisms [57]. High Na+ concentrations are toxic to cellular metabolism, as they can slow cell division and reproduction, inhibit the activity of many key enzymes, and cause membrane disorganization. Ultimately, these processes lead to growth retardation and even plant death.
Six-day-old seedlings of two wheat genotypes—Triticum aestivum (Orenburgskaya 22 variety) and Triticum durum (Zolotaya variety)—were found to contain different levels of ROS. According to staining of seedling root cells with the fluorescent marker Carboxy-H2DCFDA, fluorescence intensity was 1.96 times higher in the Zolotaya variety than in the Orenburgskaya 22 variety. This significant difference in ROS content is a characteristic of these wheat genotypes.
Phytoprotectors, which are low-molecular-weight phenolic compounds, are used to neutralize the toxic effects of stress [58]. Quercetin is the most studied antioxidant. Quercetin maintains a balanced concentration of ROS in plant cells and provides resistance to abiotic stress by reducing H2O2 levels and scavenging ROS [59]. Quercetin shown to affect plant resistance to oxidative stress by inactivating reactive oxygen species and interacting with ROS with electron transport in chloroplasts and mitochondria [60]. Addition of exogenous quercetin to wheat seedlings resulted in a 1.1-fold decrease in ROS, as evidenced by fluorescence intensity data (Figure 2 and Figure 3) in the Orenburgskaya 22 variety. However, quercetin had a negative effect on the Zolotaya variety, increasing ROS levels by 1.05 times. Exposure to 150 mM NaCl in both wheat varieties significantly increased ROS production: 2.32-fold in the Zolotaya variety and 2.81-fold in the Orenburgskaya variety. However, since the Zolotaya cultivar had a significantly higher ROS content in the control variant, the ROS level also exceeded that of the Orenburgskaya 22 cultivar under salt stress. Adding quercetin reduced ROS content in both wheat varieties, both after pre-treatment and after exposure to sodium chloride. This may indicate quercetin’s protective properties against oxidative stress by suppressing the formation of excess ROS. We have discovered an interesting fact: the effect of the low-molecular antioxidant quercetin significantly increases the H2O2 content in Zolotaya variety and promotes the neutralization of H2O2 in the Orenburgskaya 22 variety.
Morphometric parameters of plant growth are among the most important for characterizing abiotic and biotic influences on plant development [40]. These parameters determine a plant’s resistance or sensitivity to stress factors. Based on the morphometric parameters presented in Table 1, it follows that 6-day-old seedlings of the Zolotaya variety have longer roots and taller seedlings than those of the Orenburgskaya 22 variety. This is also a characteristic of the Zolotaya variety. It should be noted that quercetin slows root and shoot growth in the Zolotaya variety; whereas, in the Orenburgskaya 22 variety, quercetin accelerates seedling growth. It can be hypothesized that excess ROS, initiated by the presence of quercetin, slows the growth of Zolotaya seedlings. Exposure to 150 mM NaCl slightly inhibits seedling development in both wheat varieties. Pre-treatment with quercetin helps neutralize sodium chloride-induced oxidative stress and enhances the growth of seedlings of both wheat varieties.
Excess sodium and chloride ions (salt stress) have a negative impact on plants: the content of chlorophyll and carotenoids decreases, leaf necrosis occurs, and metabolic functions of the cell, including photosynthesis, are disrupted [57,61]. Osmotic stress caused by ionic imbalance can lead to oxidative damage [62,63]. High salt concentrations in the soil damage the photosynthetic apparatus [64] and disrupt the redox balance of the cell [65]. Determination of the content of chlorophyll a and b is an effective method for quantitatively assessing damage to the photosynthetic apparatus caused by abiotic stress [66,67,68].
Chlorophyll content is an indicator of chloroplast activity. In chloroplasts, light energy converted into ATP and NADPH [66,67,68]. An increase in ATP molecules promotes more active plant growth and development. A decrease in Chl a content during NaCl treatment is accompanied by a decrease in ATP synthesis and, consequently, a slowdown in plant growth. It can be assumed that quercetin treatment of the Orenburgskaya 22 wheat variety, which leads to an increase in Chl a content, is a favorable factor for more intensive growth and development.
Thus, quercetin effectively increases the Chl a content in the Orenburgskaya 22 variety and has virtually no effect on the Zolotaya variety, providing protection against pigment degradation primarily in the first case. However, only in the Orenburgskaya 22 variety is quercetin able to partially restore Chl a content after exposure to 150 mM NaCl. These results suggest that in the Orenburgskaya 22 variety, quercetin may help maintain the structural integrity of the PSI reaction center, increase the efficiency of light dissipation, and reduce damage to the photosynthetic system caused by ROS. Reducing damage to the photosynthetic system allows photosynthesis to function efficiently, thereby increasing wheat tolerance to the negative effects of salt [66,67,68].
The AOA level in the roots of the Orenburgskaya 22 variety exceeds that of the Zolotaya variety, but the opposite trend observed in the shoots. Quercetin application stimulates AOA in the roots and shoots of Orenburgskaya 22 (by 1.2 and 1.1 times, respectively), while a slight decrease is observed in the Zolotaya variety. Abiotic stress leads to a decrease in AOA compared to the control variants in both wheat varieties. Interestingly, quercetin treatment does not increase AOA levels in the Orenburgskaya 22 variety when exposed to 150 mM NaCl. However, quercetin, in contrast, promotes AOA growth in the Zolotaya variety, offsetting the negative impact of salt stress.
One of the most common and important low-molecular-weight antioxidants in plants is glutathione (GSH) [43,44]. GSH (γ-glutamylcysteinylglycine tripeptide) is a unique compound in which a peptide bond formed between the amino group of cysteine and the carboxyl group of the side chain of γ-glutamic acid. In plants, GSH acts as an effective antioxidant: by binding to reactive oxygen species (ROS), it protects cells from stress [69,70]. When interacting with H2O2 molecules, GSH is converted to the oxidized form (GSSG), which alters the GSH/GSSG ratio. Therefore, GSH serves as a reliable marker of oxidative stress caused by excess hydrogen peroxide. GSH is also involved in signaling processes in response to abiotic stress in plants [44]. In addition, an important function of GSH is the chelation of heavy metals [71,72], as well as the participation of GSH in the detoxification of xenobiotics together with glutathione S-transferase (GST) [73]. The oxidized form of quercetin has a high affinity for thiol groups and will form adduct with GSH, as well as with proteins containing thiol groups. Adduct formation leads to an increase in GSH concentration, which reduced under abiotic stress. Thus, quercetin is able to compensate for the decrease in GSH levels and increase cellular resistance to oxidative stress. However, the process of GSH recovery is temporary and depends on the quercetin concentration [74].
The GSH content in the Zolotaya variety exceeds that in the Orenburgskaya 22 variety. In the presence of quercetin, GSH content significantly decreases in the Zolotaya variety, but in the Orenburgskaya 22 variety, quercetin induces an increase in GSH content, especially in the roots. This suggests that the mechanisms of involvement of low-molecular-weight components of the antioxidant system in the two wheat genotypes differ significantly. We propose that the exogenous low-molecular-weight antioxidant quercetin competes with the low-molecular-weight antioxidant glutathione and suppresses its biosynthesis in durum wheat. Importantly, subsequent treatment with 150 mM NaCl promotes an increase in GSH due to the formation of an adduct with the oxidized form of quercetin. This fact underscores the important role of GSH in neutralizing excess ROS in the Zolotaya variety.
Plants possess a powerful antioxidant system that protects them from damage caused by oxidative stress. The system’s response to abiotic stress can be assessed by the dynamics of enzymatic activity and the expression level of the genes encoding the corresponding enzymes. A key component of this system is superoxide dismutase (SOD), which catalyzes the conversion of O2•− to H2O2. SOD is involved in most physiological and biochemical processes [13,14]. Depending on the metal cofactor, SOD enzymes are divided into three types: Fe2SOD, Mn2SOD, and Cu/Zn2SOD [17,18,75]. Different isoforms differ in amino acid sequence, crystal structure, subcellular localization, and sensitivity to H2O2 in vitro [76,77]. Cu/Zn2SOD, present in all eukaryotes, is localized in chloroplasts, cytoplasm, and/or extracellular space [78], Mn2SOD is found in mitochondria [79,80], and Fe2SOD is found in chloroplasts and cytoplasm [81]. SOD activity increases under salt stress, confirming a relationship between increased formation of ROS and activation of defense mechanisms that minimize oxidative damage. However, H2O2, a product of SOD reactions, remains a reactive and potentially toxic compound; to prevent harm, it must be neutralized by conversion to H2O during subsequent reactions [15,16]. In plants, H2O2 levels are controlled by catalase (CAT) and glutathione peroxidase (GPX) [46,47]. CAT activity regulates the O2 and H2O2 balance, reducing the risk of forming highly reactive hydroxyl radicals (OH·), which can damage cell membranes, proteins, and DNA [47].
It was shown that antioxidant enzyme activity increased in response to salt stress in different wheat genotypes, suggesting a link between increased ROS formation and activation of defense mechanisms that reduce stress-induced oxidative damage. The activity of the most important antioxidant enzymes—MnSOD and Cu/ZnSOD—significantly increased in the Orenburgskaya 22 variety compared to the Zolotaya variety (by 2.1 and 2.2 times, respectively). However, while sodium chloride increased MnSOD and Cu/ZnSOD gene expression in the Orenburgskaya 22 variety by 1.5 and 1.4 times, respectively, virtually no changes in expression were observed in the Zolotaya variety. However, other enzymes—PX and CAT—were activated in the Zolotaya variety as a result of sodium chloride exposure. Of particular note is the high expression activity of the glutathione-dependent enzyme genes—GST and GPX—in the Zolotaya variety, compared to the Orenburgskaya 22 variety. H2O2, a product of SOD activity, remains reactive and harmful to cells and must be the response of the antioxidant system to abiotic stress in plants, which can be considered both as changes in enzymatic activity and as changes in the expression of genes encoding antioxidant enzymes. Analysis of H2O2 content showed that salt stress increased hydrogen peroxide concentrations in the shoots and roots of both varieties, with the most pronounced increase in the roots of Zolotaya. Despite a significant increase in PX expression in Zolotaya under salt treatment, this level was insufficient to effectively remove excess H2O2. Meanwhile, quercetin treatment increased PX activity in Orenburgskaya 22; although, H2O2 levels in this variety remained lower than in Zolotaya.
The primary function of catalase (CAT) is to decompose H2O2 into water and molecular oxygen [46,47]. The enzyme is localized primarily in peroxisomes and glyoxysomes, but a specific form has also been found in mitochondria [46,47]. Unlike peroxidase (PX), CAT operates efficiently at high H2O2 concentrations, converting approximately 6 million substrate molecules into H2O and O2 per minute. Expression analysis showed that CAT activity in the roots of the Zolotaya cultivar was significantly higher than that of the Orenburgskaya 22 cultivar; whereas, the opposite was observed in shoots: the expression level in the Orenburgskaya 22 cultivar exceeded that of the Zolotaya cultivar. NaCl treatment was accompanied by an increase in CAT gene expression in both wheat genotypes. Thus, the total activity of H2O2-neutralizing enzymes in the Zolotaya variety exceeds the combined activity of PX and CAT in the Orenburgskaya 22 variety.
It should be noted that quercetin reduced the expression level of PX in the Orenburgskaya 22 variety and increased it in the Zolotaya variety. Concurrently, quercetin increased the expression level of CAT in the Orenburgskaya 22 variety and decreased it in the Zolotaya variety. This change in PX and CAT activity levels is likely due to quercetin’s role in H2O2 neutralization. Moreover, quercetin treatment (both before and after exposure to NaCl) in the Orenburgskaya 22 variety was accompanied by an increase in the activities of both PX and CAT.
These results suggest that different wheat genotypes use different mechanisms to neutralize hydrogen peroxide.
Glutathione peroxidase (GPX) is a key component of the ascorbate-glutathione cycle, maintaining the pool of reduced GSH [48,49], which in turn serves as a substrate for this enzyme. In the Zolotaya cultivar, GPX activity in both roots and (to a greater extent) shoots exceeds that of the Orenburgskaya 22 cultivar. Salt stress causes a decrease in GPX expression levels in the Zolotaya cultivar. Quercetin treatment leads to enzyme inactivation. Comparison of data on GSH content and GPX activity suggests that GSH mechanisms play a significantly more important role in the Zolotaya cultivar than in the Orenburgskaya 22 cultivar. This thesis is supported by the dynamics of another GSH-related enzyme, glutathione S-transferase (GST). GSTs are a superfamily of detoxifying enzymes that conjugate GSH for subsequent removal of toxins from the plant [50,51]. In the Orenburgskaya 22 variety, GST expression levels remained low and remained virtually unchanged under abiotic stress. In contrast, in the Zolotaya variety, GST expression increased under the influence of NaCl.
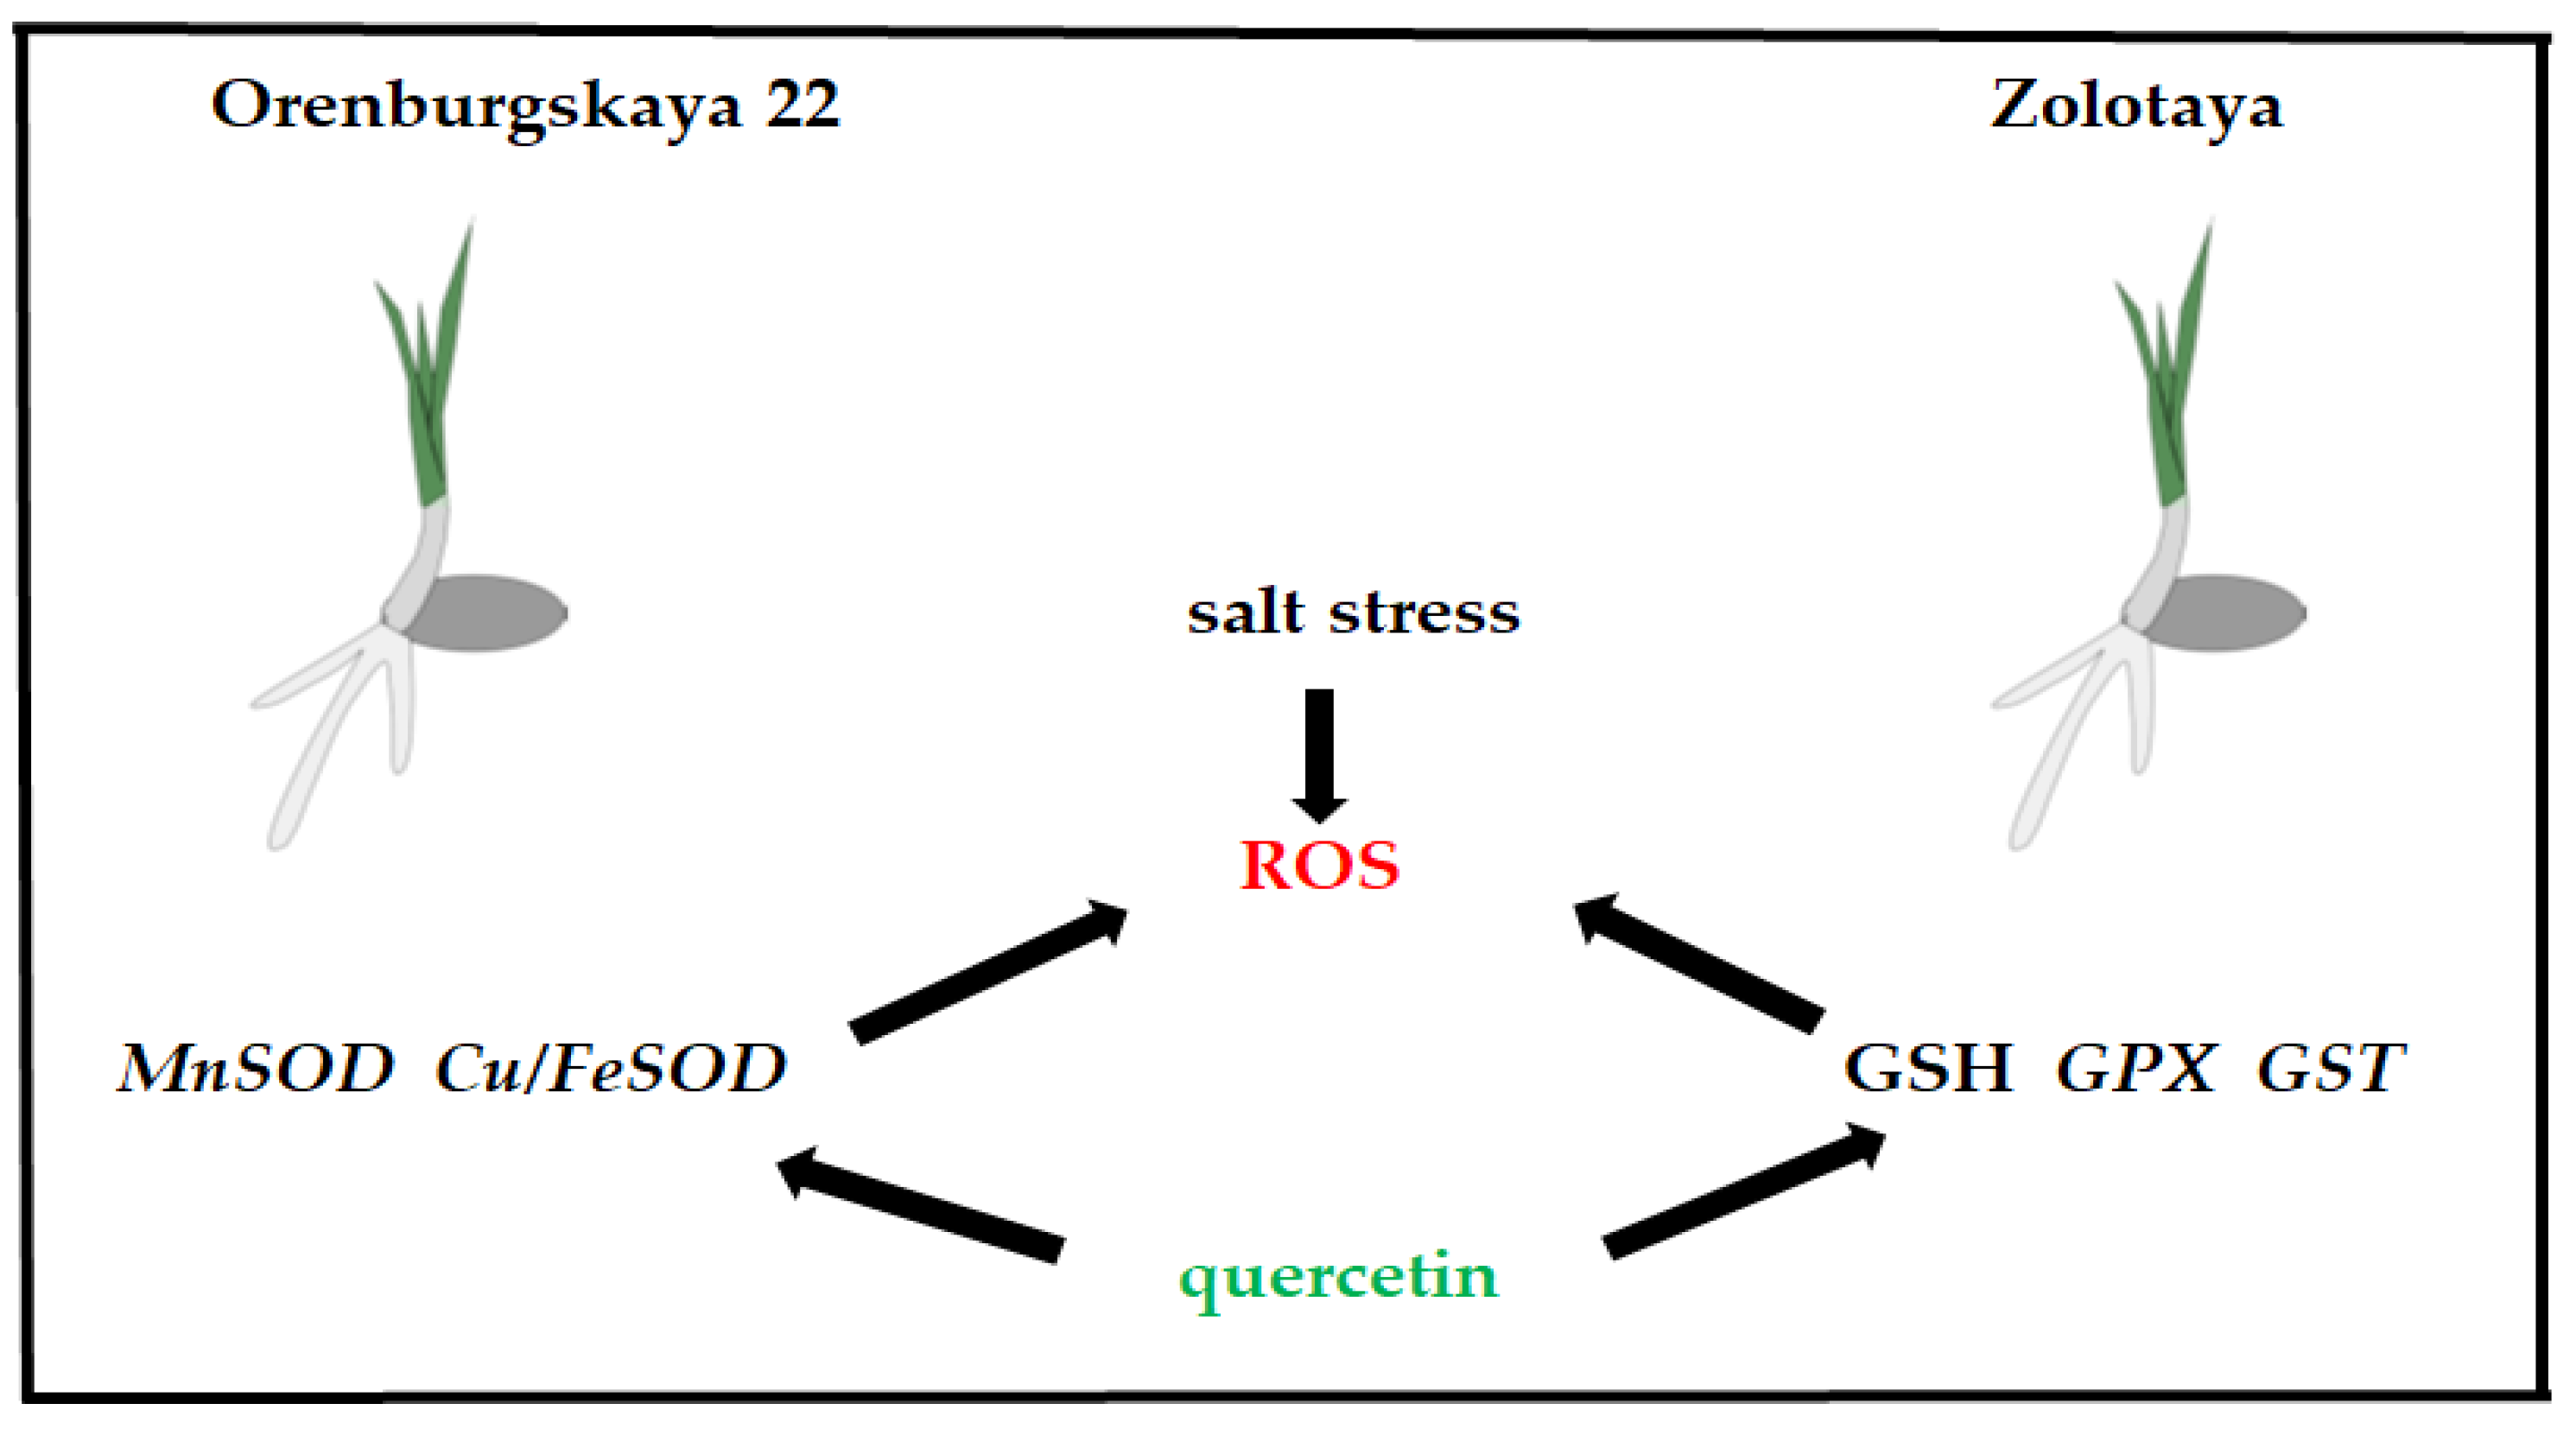
GSH content and PCR data indicate that Triticum aestivum has the most active enzymatic antioxidant system, while Triticum durum has the most active GSH and GSH-dependent enzymes. The presence of different antioxidant defense mechanisms in the two wheat genotypes likely explains why the action of the low-molecular-weight antioxidant quercetin is less effective in the Zolotaya variety than in the Orenburgskaya 22 variety (Figure 9).
Salt stress increases ROS formation. ROS, as signaling molecules, activate the antioxidant system in both genotypes. However, in the Orenburgskaya 22 variety (Triticum aestivum), enzymes that convert O2•− to H2O2-Mn2SOD, and Cu/Zn2SOD are most important in neutralizing excess ROS. In the Zolotaya variety (Triticum durum), GSH-dependent enzymes and the low-molecular-weight antioxidant GSH are most active in removing excess ROS. Quercetin is also a low-molecular-weight antioxidant. Its addition to the Zolotaya variety, where glutathione is most active, leads to the interaction of two low-molecular-weight antioxidants, resulting in a decrease in total antioxidant activity. Unlike the Zolotaya variety, quercetin addition to the Orenburgskaya 22 variety is beneficial in neutralizing excess ROS.
The processes of formation of excess ROS and their subsequent neutralization by organelles play a key role in the mechanisms of programmed cell death [82]. There is evidence that ROS molecules can be signaling molecules that trigger autophagy as a survival mechanism [83]. Oxidative stress caused by abiotic factors induces the process of autophagy [84]. As has been shown, the induction of oxidative stress in wheat under the influence of prooxidants—paraquat and salicylic acid, leads to intensive formation of autophagosomes [85]. On the other hand, when the process of autophagosome formation is disrupted by enzyme inhibitors and gene knockout, oxidative stress increases [86,87]. In plants, two pathways of programmed cell death distinguished: “apoptosis-like”, accompanied by DNA fragmentation and the release of cytochrome c from mitochondria, and “vacuolar death”, in which primary vacuoles and autophagosomes are formed [88]. Within the framework of the processes of degradation of macromolecules and organelles, various types of autophagy are distinguished: micro-, macro- and mega-autophagy [89]. The best-studied mechanism in plants is macro-autophagy (often simply called autophagy), which is activated under environmental stress [90,91]. Thus, under salt stress, toxic ions (Cl and Na+) are found in all organs of wheat, but in the Zolotaya variety their accumulation is more pronounced than in the Orenburgskaya 22 variety [32].
The accumulation of toxic ions is accompanied by an increase in the level of ROS and progressive damage to root tissue. This process particularly pronounced in the Zolotaya variety, triggering autophagy and programmed cell death (PCD) mechanisms. The TUNEL method confirmed the presence of DNA breaks in nuclei and metaphase chromosomes, and immunodetection revealed the release of cytochrome c into the cytoplasm; this indicates the activation of the mitochondrial pathway of root cell death under salinity conditions [32,49]. It is worth noting that autophagy proteins (e.g., ATG) are conserved and found in yeast, animal, and plant cells. To confirm the process in macerated root meristem cells of two wheat genotypes, immunodetection of the autophagy marker, the ATG8 protein, performed on autophagosomal membranes.
Autophagy is a key means of plant defense against the effects of abiotic stress. Since this study examined the diverse characteristics of wheat seedlings exposed to salt stress and possible protection against it, we immunodetected the autophagy marker, ATG8, on autophagosomal membranes in macerated root meristem cells of two wheat varieties, Triticum aestivum and Triticum durum.
In control plant cells from both wheat varieties, the number of cells with autophagosomes was higher than the number of cells with a diffuse protein distribution in the cytoplasm. Salt stress stimulated autophagosome formation more actively in the Zolotaya variety than in the Orenburgskaya 22 variety. Quercetin treatment did not significantly affect the cell ratio in either variety. However, the number of cells with autophagosomes significantly increased after quercetin treatment following salt stress. In the root cells of the Zolotaya variety, the number of cells with autophagosomes increased significantly.
More than 30 ATG proteins play an important role in the process of programmed cell death [52,53]. Proteins required for the autophagy process are grouped into four main functional groups [54,55]. The ATG1/ATG13 kinase complex, which initiates the formation of autophagosomes in response to any signal of the cell’s need for nutrients, as well as in response to various stress factors, belongs to the first ATG group. The second ATG group includes the ATG9 protein, which promotes phagophore expansion by transferring membrane components from various sources and its maturation [55]. The main function of the ATG5-ATG12/ATG16 protein complex is to transfer phosphatidylethanolamine (PE) to ATG8 in vitro [92], resulting in the formation of the lipid form ATG8-PE, localized in the autophagosome [93]. Rapamycin acts as a negative regulator of ATG1/ATG13-mediated autophagy [56]. Autophagy processes are controlled by both TOR-dependent and TOR-independent pathways [94]. It assumed that TOR overexpression blocks the initiation of autophagy under salt stress and nutrient deficiency, but does not affect its activation under oxidative stress or endoplasmic reticulum stress. For example, a decrease in TOR activity is necessary for the initiation of autophagy in Arabidopsis under various stress conditions [95]. Ji et al. [96] found that quercetin stimulates autophagy in mammalian cells by inhibiting the mTOR signaling pathway and activating mitogen-activated protein kinase (MAPK). Moreover, under control growing conditions, the level of TOR gene expression in the roots and shoots of both wheat varieties demonstrated virtually identical values. Increasing the NaCl concentration in the solution resulted in decreased TOR gene expression in all studied variants. For example, in the Orenburgskaya 22 variety, expression in roots and shoots decreased by 1.1 relative to the control, while in the Zolotaya variety was a more pronounced suppression.
As follows from the data presented above, ROS induced more actively under salt stress in the Zolotaya variety than in the Orenburgskaya 22 variety. It can be assumed that ROS contribute to increased TOR activity, which is accompanied by activation of the autophagy process. Consequently, ROS are triggers of autophagy.
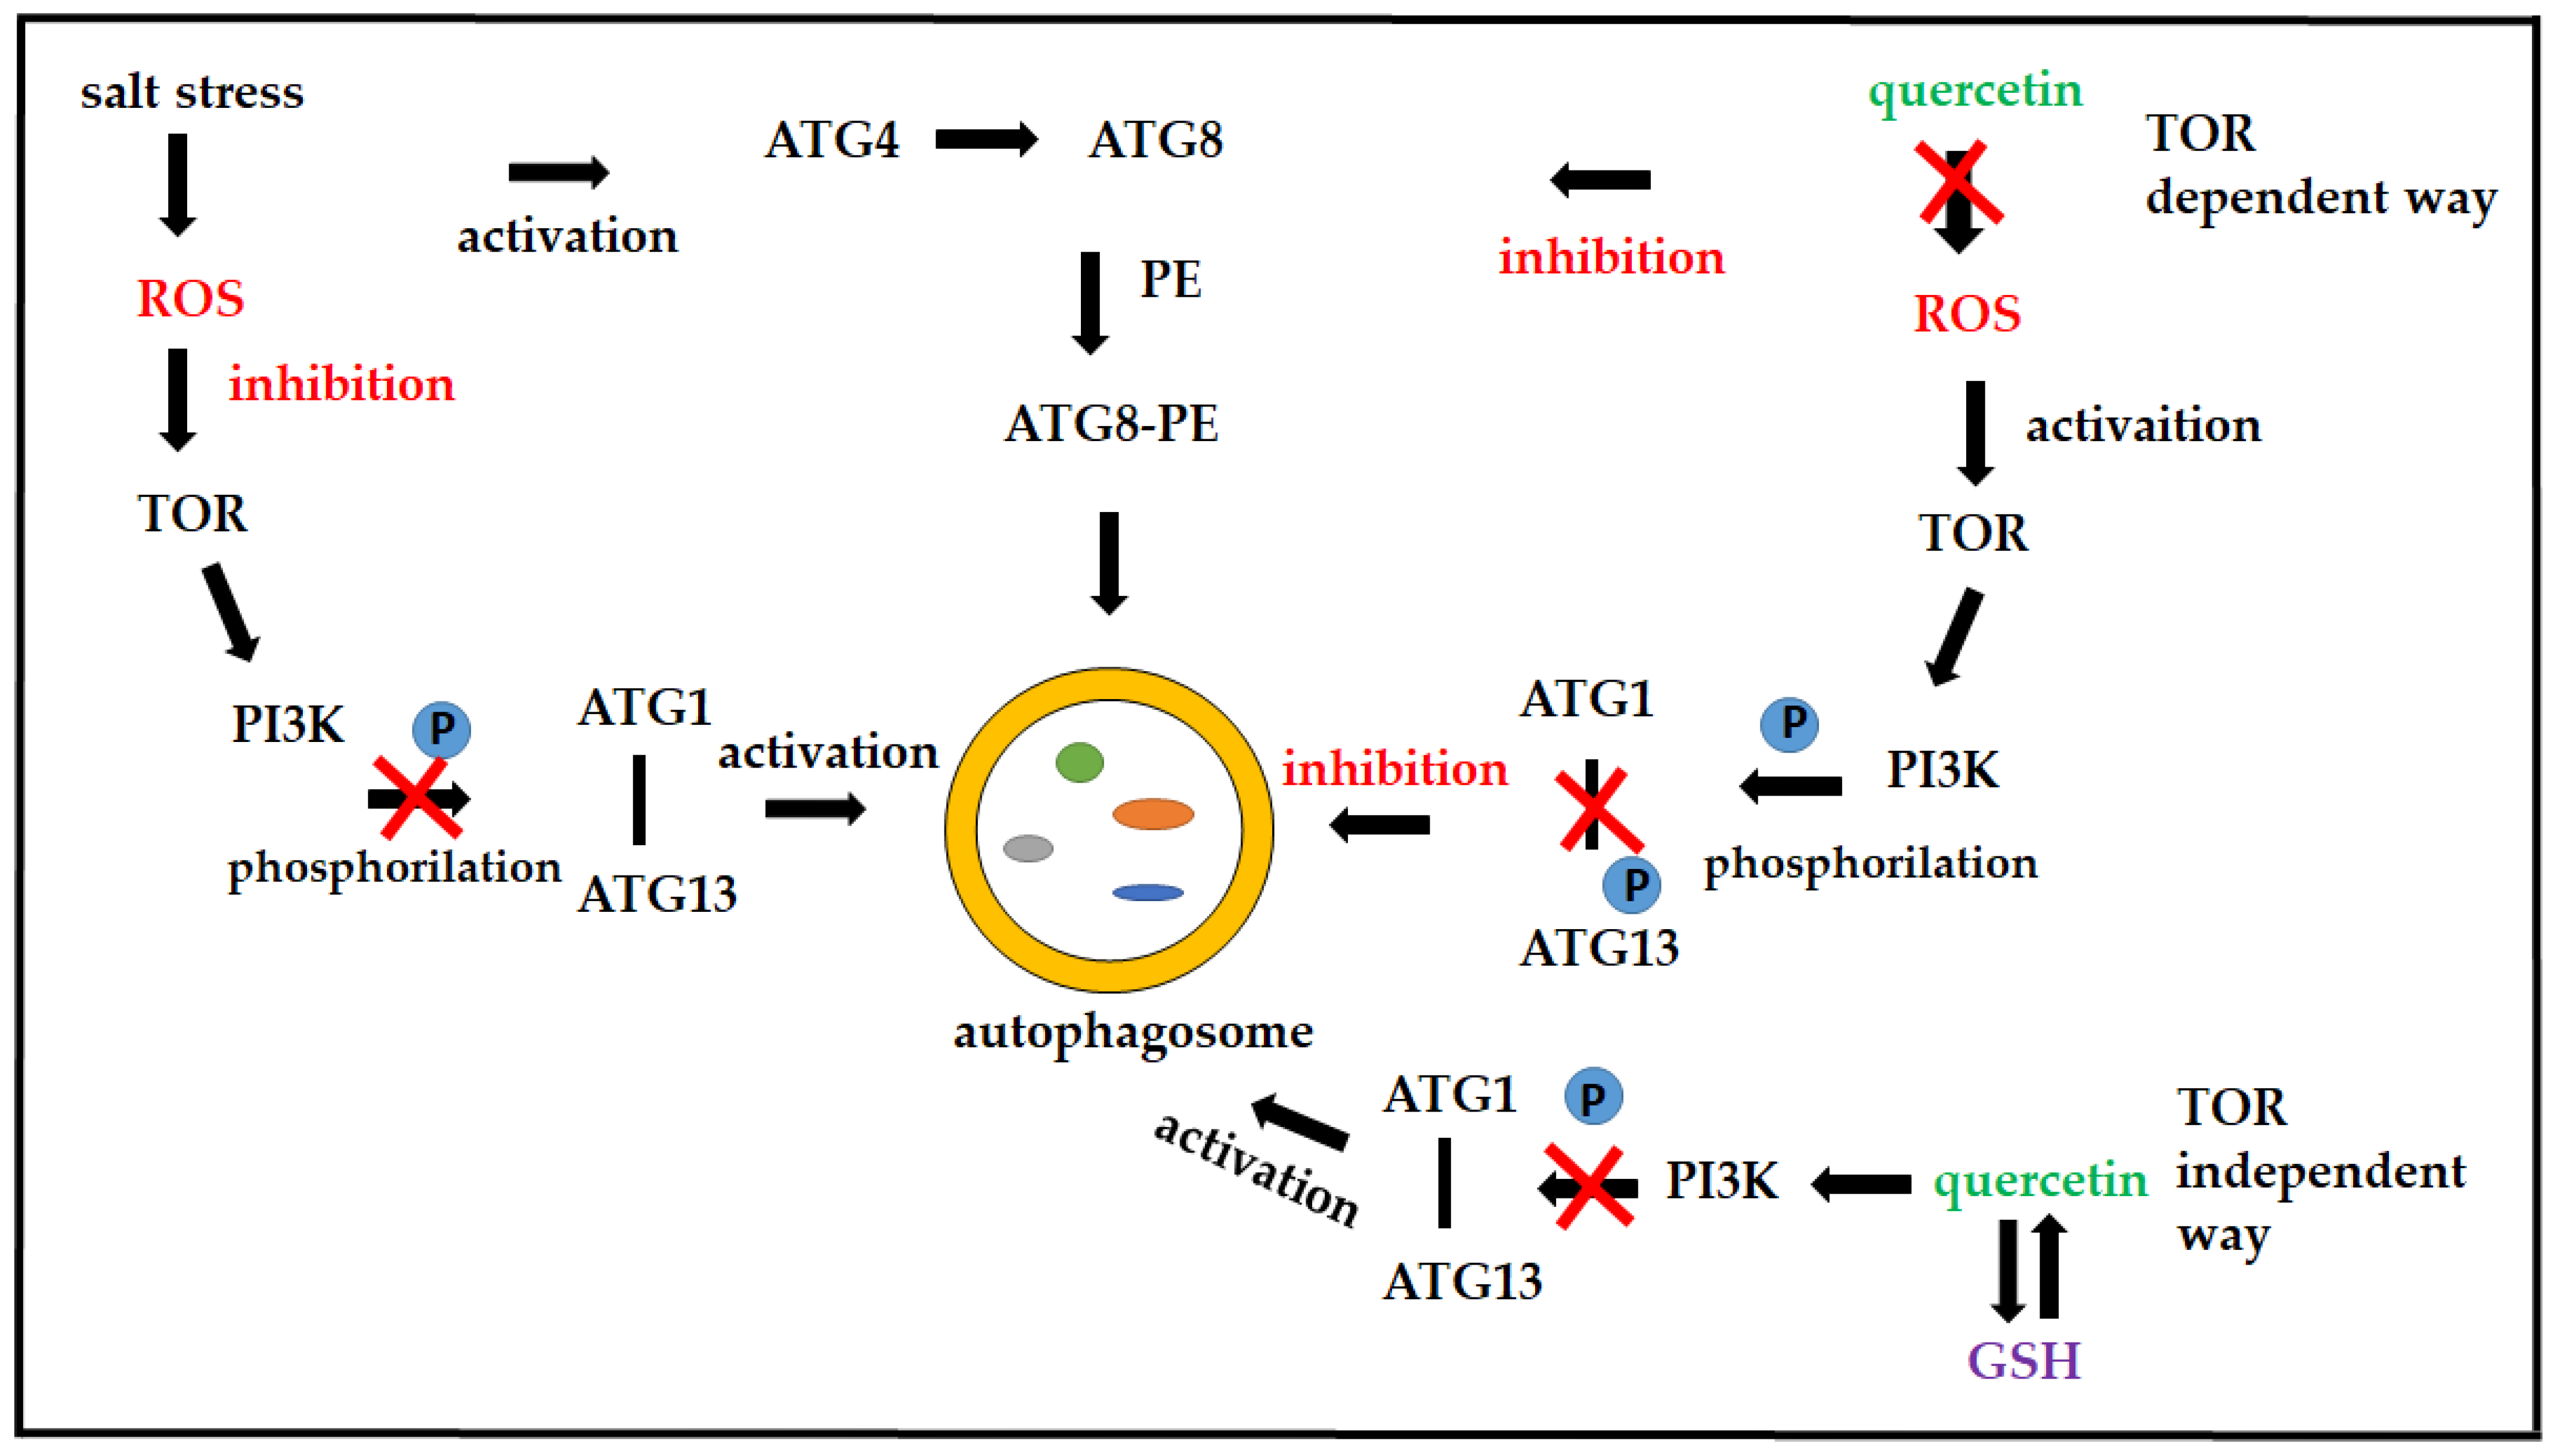
The target of rapamycin is phosphatidylinositol 3-kinase (PI3K), a serine/threonine protein kinase that suppresses autophagy [97,98,99]. PI3K phosphorylates ATG13, whose phosphorylation leads to a decrease in its affinity for ATG1, thereby reducing the activation of autophagosome initiation. TOR activation is accompanied by inactivation of PI3K, which leads to a decrease in ATG13 phosphorylation, which is accompanied by an increase in the affinity between ATG13 and ATG1. Salt stress does not increase ATG1 activity in the roots of either wheat genotype, but it does lead to a sharp increase in ATG13 expression in the Orenburgskaya 22 variety. Inhibition with rapamycin stimulates PI3K kinase, which enhances ATG13 phosphorylation, especially in the Orenburgskaya 22 variety. This process is accompanied by a decrease in the formation of the ATG13-ATG1 complex. The Zolotaya variety exhibits increased ATG1 activity, which may lead to activation of autophagosome formation and autophagy. These data indicate that the process of autophagosome initiation varies significantly among wheat genotypes. Furthermore, quercetin also increases ATG13 expression. It is likely that the decreased affinity of ATG13 for ATG1 due to phosphorylation requires additional ATG13 to initiate autophagosome formation (Figure 10). Quercetin activates TOR expression in the Orenburgskaya 22 variety, inhibiting the initiation of autophagosome formation. This process is most pronounced in the Orenburgskaya 22 variety.
Autophagy processes are controlled by both TOR-dependent and TOR-independent pathways [94]. An example of TOR-independent initiation of autophagy is the interaction of quercetin with PI3K kinase.
PI3K is a heterodimeric enzyme whose kinase domain contains an ATP-binding site and the catalytic apparatus required for phosphate transfer [100]. A study of the crystal structure of PI3K in complex with quercetin showed that quercetin incorporated into the ATP-binding site [101]. By blocking ATP binding, quercetin interferes with the phosphate transfer reaction, which leads to the inhibition of PI3K catalytic activity. This, in turn, increases the affinity of the ATG1 and ATG13 proteins and activates the formation of autophagosomes. Thus, quercetin initiates two autophagic processes: TOR-dependent and TOR-independent. The two pathways compete with each other and depend on ROS levels. Furthermore, they may also depend on the amount of GSH. As mentioned above, GSH binds to quercetin, and this relationship is reversible. Thus, it suggested that GSH may indirectly regulate the process of autophagosome formation.
The ubiquitin-like protein ATG8 plays a key role in autophagy processes [102]. ATG8 is synthesized in an inactive form, and is activated by cleavage of the C-terminal glycine by the cysteine protease ATG4. The mature form of ATG8 binds to phosphatidylethanolamine, forming an adduct [103]. The formation of the lipidated form of mature ATG8 allows the protein to localize on the autophagosome membrane, which is critical for the processes of assembly, expansion, closure, and subsequent fusion of the autophagic membrane with the vacuole [104]. Subsequently, with the participation of the ATG4 protease, ATG8 released from the membranes, which promotes the maturation of autophagosomes and their fusion [104].
Under all cultivation conditions, the level of ATG8 gene expression in the Zolotaya variety exceeded that of the Orenburgskaya 22 variety, indicating more intense autophagosome formation in the former variety. At the same time, ATG4 gene expression was higher in the Orenburgskaya 22 variety, especially in the root system. This suggests that ATG4 protease not only participates in the activation and degradation of ATG8, but also plays an active role in the proteolysis of cytoplasmic proteins.

5. Conclusions

Wheat is exposed to many adverse abiotic stresses. One of the main stresses is soil salinity, which reduces productivity. The Orenburgskaya 22 and Zolotaya wheat varieties were chosen as model plants because they differed significantly in their ability to adapt to salt stress. The negative effects of high sodium chloride concentrations result in increased ROS generation. To restore the redox balance, the antioxidant system activates in wheat cells. Different wheat genotypes activate different components of the antioxidant system. In Triticum aestivum, the enzymatic system makes the greatest contribution to antioxidant protection, while in Triticum durum it is the system of low-molecular compounds, one of the main components of which is GSH and related enzymes. ROS regulate the activity of TOR, a negative regulator of autophagy. Quercetin activates two pathways regulating autophagosome formation—TOR-dependent and TOR-independent—through the binding of quercetin to phosphate groups. This process regulated by the reversible binding of GSH to quercetin.
The antioxidant quercetin reduces ROS formation. Quercetin increases the expression of MnSOD and Cu/ZnSOD genes in Triticum aestivum. Treatment with a 0.03% quercetin solution prior to exposure to 150 mM NaCl exerts a protective effect against the negative effects of toxic ions on common wheat root cells and partially restores this effect after exposure to sodium chloride.
Thus, quercetin can be recommended as a promising agent for protecting agricultural plants from oxidative stress, and its effectiveness directly depends on the plant’s antioxidant system.

Author Contributions

N.V.K.—fluorescent analysis, writing, design, and finalization of the manuscript; E.M.L.—TEM analysis, light microscopy, writing, design, and finalization of the manuscript; L.I.F.—PCR analysis, writing, design, and finalization of the manuscript. All authors have read and agreed to the published version of the manuscript.

Funding

The reported study supported by FGUM-2025-0003 of the Ministry of Science and Higher Education of the Russian Federation and carried out within the framework of the State Assignment of Lomonosov Moscow State University.

Institutional Review Board Statement

Not applicable.

Informed Consent Statement

Not applicable.

Data Availability Statement

The original contributions presented in this study are included in the article. Further inquiries can be directed to the corresponding author.

Conflicts of Interest

The authors declare no conflicts of interest.

References

  1. Saddiq, M.; Iqbal, S.; Hafeez, M.; Ibrahim, A.; Raza, A.; Fatima, E.; Baloch, H.; Jahanzaib; Woodrow, P.; Ciarmiello, L. Effect of Salinity Stress on Physiological Changes in Winter and Spring Wheat. Agronomy 2021, 11, 1193. [Google Scholar] [CrossRef] [Scilit]
  2. Cramer, G.R.; Urano, K.; Delrot, S.; Pezzotti, M.; Shinozaki, K. Effects of abiotic stress on plants: A systems biology perspective. BMC Plant Biol. 2011, 11, 163. [Google Scholar] [CrossRef] [Scilit] [PubMed]
  3. Ibrahimova, U.; Talai, J.; Hasan, M.M.; Huseynova, I.; Raja, V.; Rastogi, A.; Ghaffari, H.; Zivcak, M.; Yang, X.; Brestic, M. Dissecting the osmotic and oxidative stress responses in salt-tolerant and salt-sensitive wheat genotypes under saline conditions. Plant Soil Environ. 2025, 71, 36–47. [Google Scholar] [CrossRef] [Scilit]
  4. Corwin, D.L. Climate change impacts on soil salinity in agricultural areas. Eur. J. Soil Sci. 2021, 72, 842–862. [Google Scholar] [CrossRef] [Scilit]
  5. Kumar, S.; Beena, A.S.; Awana, M.; Singh, A. Physiological, biochemical, epigenetic and molecular analyses of wheat (Triticum aestivum) genotypes with contrasting salt tolerance. Front. Plant Sci. 2017, 8, 1151. [Google Scholar] [CrossRef] [Scilit] [PubMed]
  6. Tuteja, N. Mechanisms of high salinity tolerance in plants. Methods Enzymol. 2007, 428, 419–438. [Google Scholar] [CrossRef] [Scilit] [PubMed]
  7. Deinlein, U.; Stephan, A.B.; Horie, T.; Luo, W.; Xu, G.; Schroeder, J.I. Plant salt-tolerance mechanisms. Trends Plant Sci. 2014, 19, 371–379. [Google Scholar] [CrossRef] [Scilit] [PubMed]
  8. Yamaguchi, T.; Hamamoto, S.; Uozumi, N. Sodium transport system in plant cells. Front. Plant Sci. 2013, 4, 410–417. [Google Scholar] [CrossRef] [Scilit] [PubMed]
  9. Miller, G.A.D.; Suzuki, N.; Ciftci-Yilmaz, S.; Mittler, R.O.N. Reactive oxygen species homeostasis and signaling during drought and salinity stresses. Plant Cell Environ. 2010, 33, 453–467. [Google Scholar] [CrossRef] [Scilit] [PubMed]
  10. Gill, S.S.; Tuteja, N. Reactive oxygen species and antioxidant machinery in abiotic stress tolerance in crop plants. Plant Physiol. Biochem. 2010, 48, 909–930. [Google Scholar] [CrossRef] [Scilit] [PubMed]
  11. Demidchik, V. Mechanisms of oxidative stress in plants: From classical chemistry to cell biology. Environ. Exp. Bot. 2015, 109, 212–228. [Google Scholar] [CrossRef] [Scilit]
  12. Raja, V.; Majeed, U.; Kang, H.; Andrabi, K.I.; John, R. Abiotic stress: Interplay between ROS, hormones and MAPKs. Environ. Exp. Bot. 2017, 137, 142–157. [Google Scholar] [CrossRef] [Scilit]
  13. Del Rio, L.A. ROS and RNS in plant physiology: An overview. J. Exp. Bot. 2015, 66, 2827–2837. [Google Scholar] [CrossRef] [Scilit] [PubMed]
  14. Parihar, P.; Singh, S.; Singh, R.; Singh, V.P.; Prasad, S.M. Effect of salinity stress on plants and its tolerance strategies: A review. Environ. Sci. Pollut. Res. 2015, 22, 4056–4075. [Google Scholar] [CrossRef] [Scilit] [PubMed]
  15. Noctor, G.; Foyer, C.H. Ascorbate and glutathione: Keeping active oxygen under control. Annu. Rev. Plant Physiol. Plant Mol. Biol. 1998, 49, 249–279. [Google Scholar] [CrossRef] [Scilit] [PubMed]
  16. Navrot, N.; Finnie, C.; Svensson, B.; Hägglund, P. Plant redox proteomics. J. Proteom. 2011, 12, 1450–1462. [Google Scholar] [CrossRef] [Scilit] [PubMed]
  17. You, J.; Chan, Z. ROS regulation during abiotic stress responses in crop plants. Front. Plant Sci. 2015, 6, 1092. [Google Scholar] [CrossRef] [Scilit] [PubMed]
  18. Rohman, M.M.; Talukder, M.Z.A.; Hossain, M.G.; Uddin, M.S.; Amiruzzaman, M.; Biswas, A.; Ahsan, A.F.M.S.; Chowdhury, M.A.Z. Saline sensitivity leads to oxidative stress and increases the antioxidants in presence of proline and betaine in maize (Zea mays L.) inbred. Plant Omics. J. 2016, 9, 35–47. [Google Scholar]
  19. Miller, A.F. Superoxide dismutases: Ancient enzymes and new insights. FEBS Lett. 2012, 586, 585–595. [Google Scholar] [CrossRef] [Scilit] [PubMed]
  20. Sirin, S.; Aslım, B. Determination of antioxidant capacity, phenolic acid composition and antiproliferative effect associated with phenylalanine ammonia lyase (PAL) activity in some plants naturally growing under salt stress. Med. Chem. Res. 2018, 28, 229–238. [Google Scholar] [CrossRef] [Scilit]
  21. Løvdal, T.; Olsen, K.M.; Slimestad, R.; Verheul, M.; Lillo, C. Synergetic effects of nitrogen depletion, temperature, and light on thecontent of phenolic compounds and gene expression in leaves of tomato. Phytochemistry 2010, 71, 605–613. [Google Scholar] [CrossRef] [Scilit] [PubMed]
  22. Agati, G.; Azzarello, E.; Pollastri, S.; Tattini, M. Flavonoids as antioxidants in plants: Location and functional significance. Plant Sci. 2012, 196, 67–76. [Google Scholar] [CrossRef] [Scilit] [PubMed]
  23. Caretto, S.; Linsalata, V.; Colella, G.; Mita, G.; Lattanzio, V. Carbon fluxes between primary metabolism and phenolic pathway inplant tissues under stress. Int. J. Mol. Sci. 2015, 16, 26378–26394. [Google Scholar] [CrossRef] [Scilit] [PubMed]
  24. Singh, P.; Arif, Y.; Bajguz, A.; Hayat, S. The role of quercetin in plants. Plant Physiol. Biochem. 2021, 166, 10–19. [Google Scholar] [CrossRef] [Scilit] [PubMed]
  25. Khan, M.; Ulrichs, C.; Mewis, I. Effect of water stress and aphid herbivory on flavonoids in broccoli (Brassica oleracea var. italica Plenck). J. Appl. Bot. Food Qual. 2011, 84, 178–182. [Google Scholar]
  26. Han, R.-M.; Zhang, J.-P.; Skibsted, L.H. Reaction dynamics of flavonoids and carotenoids as antioxidants. Molecules 2012, 17, 2140–2160. [Google Scholar] [CrossRef] [Scilit] [PubMed]
  27. Amić, D.; Davidović-Amić, D.; Bešlo, D.; Trinajstić, N. Structure-radical scavenging activity relationships of flavonoids. Croat. Chem. Acta. 2003, 76, 55–61. [Google Scholar] [CrossRef] [Scilit] [PubMed]
  28. Boots, A.W.; Haenen, G.R.; Bast, A. Health effects of quercetin: From antioxidant to nutraceutical. Eur. J. Pharmacol. 2008, 585, 325–337. [Google Scholar] [CrossRef] [Scilit] [PubMed]
  29. Maeda, H.; Dudareva, N. The shikimate pathway and aromatic amino Acid biosynthesis in plants. Annu. Rev. Plant Biol. 2012, 3, 73–105. [Google Scholar] [CrossRef] [Scilit] [PubMed]
  30. Pollastri, S.; Tattini, M. Flavonols: Old compound for old roles. Ann. Bot. 2011, 108, 1225–1233. [Google Scholar] [CrossRef] [Scilit]
  31. Dobrikova, A.G.; Apostolova, E.L. Damage and protection of the photosynthetic apparatus from UV-B radiation. II. Effect ofquercetin at different pH. J. Plant Physiol. 2015, 184, 98–105. [Google Scholar] [CrossRef] [Scilit] [PubMed]
  32. Parvin, K.; Hasanuzzaman, M.; Bhuyan, M.H.M.B.; Mohsin, S.M.; Fujita, M. Quercetin mediated salt tolerance in tomato through the enhancement of plant antioxidant defense and glyoxalase systems. Plants 2019, 8, 247. [Google Scholar] [CrossRef] [Scilit] [PubMed]
  33. Yang, J.; Zhang, L.; Jiang, L.; Zhan, Y.G.; Fan, G.Z. Quercetin alleviates seed germination and growth inhibition in Apocynum venetum and Apocynum pictum under mannitol-induced osmotic stress. Plant Physiol. Biochem. 2021, 159, 268–276. [Google Scholar] [CrossRef] [Scilit] [PubMed]
  34. Kononenko, N.V.; Lazareva, E.M.; Fedoreyeva, L.I. Mechanisms of Antioxidant Resistance in Different Wheat Genotypes under Salt Stress and Hypoxia. Int. J. Mol. Sci. 2023, 24, 16878. [Google Scholar] [CrossRef] [Scilit] [PubMed]
  35. Fedoreyeva, L.I.; Lazareva, E.M.; Shelepova, O.V.; Baranova, E.N.; Kononenko, N.V. Salt-Induced Autophagy and Programmed Cell Death in Wheat. Agronomy 2022, 20, 1909. [Google Scholar] [CrossRef] [Scilit]
  36. Rahini, D.; Anuradha, R. In vitro antioxidant activity of Artabotrys hexapetallus. Res. J. Pharm. Biol. Chem. Sci. 2014, 5, 396–405. [Google Scholar]
  37. Zalutskaya, Z.M.; Skryabina, U.S.; Ermilova, E.V. Hydrogen peroxide generation and transcription regulation of antioxidant enzyme expression Chlamydomonas reinbardtii under hypothermia. Plant Physiol. 2019, 66, 104–111. [Google Scholar] [CrossRef] [Scilit]
  38. Ellman, G.L. Tissue sulfhydryl groups. Arch. Biochem. Biophys. 1959, 82, 70–81. [Google Scholar] [CrossRef] [Scilit] [PubMed]
  39. Hu, X.; Tanaka, A.; Tanaka, R. Simple extraction methods that prevent the artifactual conversion of chlorophyll to chlorophylllide during pigment isolation from leaf samples. Plant Methods 2013, 9, 19. [Google Scholar] [CrossRef] [Scilit] [PubMed]
  40. Papini, A. Investigation of morphological features of autophagy during plant programmed cell death. Methods Mol. Biol. 2018, 1743, 9–19. [Google Scholar] [CrossRef] [Scilit] [PubMed]
  41. Wang, L.Y.; Wang, G. Salt stress-induced programmed cell death in tobacco protoplastsis mediated by reactive oxygen species and mitochondrial permeability transition pore status. J. Plant Physiol. 2006, 63, 731–739. [Google Scholar] [CrossRef] [Scilit] [PubMed]
  42. Inze, I.; Van Montagu, M. Oxidative stress in plants. Curr. Opin. Biotech. 1995, 6, 153–158. [Google Scholar] [CrossRef] [Scilit]
  43. Guo, Z.; Ou, W.; Lu, S.; Zhong, Q. Differential responses of antioxidative system to chilling and drought in four rice cultivars differing in sensitivity. Plant Physiol. Biochem. 2006, 44, 828–836. [Google Scholar] [CrossRef] [Scilit] [PubMed]
  44. Pasternak, T.; Palme, K.; Paponov, I. Glutathione Enhances Auxin Sensitivity in Arabidopsis Roots. Biomolecules 2020, 10, 1550. [Google Scholar] [CrossRef] [Scilit] [PubMed]
  45. Sellami, K.; Couvert, A.; Nasrallah, N.; Maachi, R.; Abouseoud, M.; Amrane, A. Peroxidase enzymes as green catalysts for bioremediation and biotechnological applications. Sci. Total Environ. 2022, 806, 150500. [Google Scholar] [CrossRef] [Scilit] [PubMed]
  46. Anjum, N.A.; Sharma, P.; Gill, S.S.; Hasanuzzaman, M.; Khan, E.A.; Kachhap, K.; Mohamed, A.A.; Thangavel, P.; Devi, G.D.; Vasudhevan, P.; et al. Catalase and ascorbate peroxidase-representative H2O2-detoxifying heme enzymes in plants. Environ. Sci. Pollut. Res. Int. 2016, 23, 19002–19029. [Google Scholar] [CrossRef] [Scilit] [PubMed]
  47. Pan, L.; Luo, Y.; Wang, J.; Li, X.; Tang, B.; Yang, H.; Hou, X.; Liu, F.; Zou, X. Evolution and functional diversification of catalase genes in the green lineage. BMC Genom. 2022, 23, 411. [Google Scholar] [CrossRef] [Scilit] [PubMed]
  48. Bela, K.; Horváth, E.; Gallé, Á.; Szabados, L.; Tari, I.; Csiszár, J. Plant glutathione peroxidases: Emerging role of the antioxidant enzymes in plant development and stress responses. J. Plant Physiol. 2015, 176, 192–201. [Google Scholar] [CrossRef] [Scilit] [PubMed]
  49. Lian, Z.; Zhang, J.; Hao, Z.; Zhu, L.; Liu, Y.; Fang, H.; Lu, Y.; Li, X.; Shi, J.; Chen, J.; et al. The Glutathione Peroxidase Gene Family in Nitraria sibirica: Genome-Wide Identification, Classification, and Gene Expression Analysis under Stress Conditions. Genes 2023, 14, 950. [Google Scholar] [CrossRef] [Scilit] [PubMed]
  50. Meng, H.; Zhao, J.; Yang, Y.; Diao, K.; Zheng, G.; Li, T.; Dai, X.; Li, J. PeGSTU58, a Glutathione S-Transferase from Populus euphratica, Enhances Salt and Drought Stress Tolerance in Transgenic Arabidopsis. Int. J. Mol. Sci. 2023, 24, 9354. [Google Scholar] [CrossRef] [Scilit] [PubMed]
  51. Zou, Y.; Cao, S.; Zhao, B.; Sun, Z.; Liu, L.; Ji, M. Increase in glutathione S-transferase activity and antioxidant damage ability drive resistance to bensulfuron-methyl in Sagittaria trifolia. Plant Physiol. Biochem. 2022, 190, 240–247. [Google Scholar] [CrossRef] [Scilit] [PubMed]
  52. Mizushima, N.; Yoshimori, T.; Ohsumi, Y. The role of Atg proteins in autophagosome formation. Annu. Rev. Cell Dev. Biol. 2011, 27, 107–132. [Google Scholar] [CrossRef] [Scilit] [PubMed]
  53. Reggiori, F.; Klionsky, D.J. Autophagic processes in yeast: Mechanism, machinery and regulation. Genetics 2013, 194, 341–361. [Google Scholar] [CrossRef] [Scilit] [PubMed]
  54. Behrends, C.; Sowa, M.E.; Gygi, S.P.; Harper, J.W. Network organization of the human autophagy system. Nature 2010, 466, 68–76. [Google Scholar] [CrossRef] [Scilit] [PubMed]
  55. Suzuki, K.; Ohsumi, Y. Current knowledge of the pre-autophagosomal structure (PAS). FEBS Lett. 2010, 584, 1280–1286. [Google Scholar] [CrossRef] [Scilit] [PubMed]
  56. Noda, T.; Ohsumi, Y. Tor, a phosphatidylinositol kinase homologue, controls autophagy in yeast. J. Biol. Chem. 1998, 273, 3963–3966. [Google Scholar] [CrossRef] [Scilit] [PubMed]
  57. Munns, R.; Tester, M. Mechanisms of salinity tolerance. Annu. Rev. Plant Biol. 2008, 59, 651–681. [Google Scholar] [CrossRef] [Scilit] [PubMed]
  58. Rahman, A.; Nahar, K.; Mahmud, J.; Mirza, H.; Hossain, M.; Fujita, M. Salt Stress Tolerance in Rice: Emerging Role of Exogenous Phytoprotectants. In Advances in International Rice Research; Li, J., Ed.; InTech: London, UK, 2017. [Google Scholar]
  59. Kurepa, J.; Smalle, J.; Van Montagu, M.; Inze, D. Polyamines and paraquat toxicity in Arabidopsis thaliana. Plant Cell Physiol. 1997, 39, 987–992. [Google Scholar] [CrossRef] [Scilit] [PubMed]
  60. Jańczak-Pieniążek, M.; Migut, D.; Piechowiak, T.; Buczek, J.; Balawejder, M. The Effect of Exogenous Application of Quercetin Derivative Solutions on the Course of Physiological and Biochemical Processes in Wheat Seedlings. Int. J. Mol. Sci. 2021, 22, 6882. [Google Scholar] [CrossRef] [Scilit] [PubMed]
  61. Pan, T.; Liu, M.; Kreslavski, V.D.; Zharmukhamedov, S.K.; Nie, C.; Yu, M.; Kuznetsov, V.V.; Allakhverdiev, S.I.; Shabala, S. Non-stomatal limitation of photosynthesis by soil salinity. Crit. Rev. Environ. Sci. Technol. 2021, 51, 791–825. [Google Scholar] [CrossRef] [Scilit]
  62. Arif, Y.; Singh, P.; Siddiqui, H.; Bajguz, A.; Hayat, S. Salinity induced physiological and biochemical changes in plants: An omic approach towards salt stress tolerance. Plant Physiol. Biochem. 2020, 156, 64–77. [Google Scholar] [CrossRef] [Scilit] [PubMed]
  63. Zahra, N.; Mahmood, S.; Raza, Z.A. Salinity stress on various physiological and biochemical attributes of two distinct maize (Zea mays L.) genotypes. J. Plant Nutr. 2018, 41, 1368–1380. [Google Scholar] [CrossRef] [Scilit]
  64. Wang, L.; Pan, D.; Li, J.; Tan, F.; Hoffmann-Benning, S.; Liang, W.; Chen, W. Proteomic analysis of changes in the Kandelia candel chloroplast proteins reveals pathways associated with salt tolerance. Plant Sci. 2015, 231, 159–172. [Google Scholar] [CrossRef] [Scilit] [PubMed]
  65. Abdelkader, A.F.; Aronsson, H.; Sundqvist, C. High salt stress in wheat leaves causes retardation of chlorophyll accumulation due to a limited rate of protochlorophyllide formation. Physiol. Plant. 2007, 130, 157–166. [Google Scholar] [CrossRef] [Scilit]
  66. Abdeshahian, M.; Nabipour, M.; Meskarbashee, M. Chlorophyll fluorescence as criterion for the diagnosis salt stress in wheat (Triticum aestivum) plants. World Acad. Sci. Eng. Technol. 2010, 71, 569–571. [Google Scholar]
  67. Mehta, P.; Jajoo, A.; Mathur, S.; Bharti, S. Chlorophyll a fluorescence study revealing effects of high salt stress on Photosystem II in wheat leaves. Plant Physiol. Biochem. 2010, 48, 16–20. [Google Scholar] [CrossRef] [Scilit] [PubMed]
  68. Murata, N.; Takahashi, S.; Nishiyama, Y.; Allakhverdiev, S.I. Photoinhibition of photosystem II under environmental stress. Biochim. Biophys. Acta (BBA) Bioenerg. 2007, 1767, 414–421. [Google Scholar] [CrossRef] [Scilit] [PubMed]
  69. Diaz-Vivancos, P.; Wolff, T.; Markovic, J.; Pallard, O.F.V.; Foyer, C.H. A nuclear glutathione cycle with in the cell cycle. Biochem. J. 2010, 431, 169–178. [Google Scholar] [CrossRef] [Scilit] [PubMed]
  70. Noctor, G.; Arisi, A.; Jouanin, L.; Kunert, K.; Rennenberg, H.; Foyer, C.H. Glutathione: Biosynthesis, metabolism and relationship to stress tolerance explored intransformed plants. J. Exp. Bot. 1998, 49, 623–647. [Google Scholar] [CrossRef] [Scilit]
  71. Cazalé, A.C.; Clemens, S. Arabidopsis thaliana expresses a second functional phytochelatin synthase. FEBS Lett. 2001, 507, 215–219. [Google Scholar] [CrossRef] [Scilit] [PubMed]
  72. Cobbett, C.; Goldsbrough, P. Phytochelatins and metallothioneins: Roles in heavy metal detoxifaction and homeostasis. Annu. Rev. Plant Biol. 2002, 53, 159–182. [Google Scholar] [CrossRef] [Scilit] [PubMed]
  73. Dorion, S.; Ouellet, J.C.; Rivoal, J. Glutathione metabolism in plants under stress: Beyond reactive oxygen species detoxification. Metabolites 2021, 11, 641. [Google Scholar] [CrossRef] [Scilit] [PubMed]
  74. Schafer, F.Q.; Buettner, G.R. Redox environment of the cell as viewed through the redox state of the glutathione disulfide/glutathione couple. Free Radic. Biol. Med. 2001, 30, 1191–1212. [Google Scholar] [CrossRef] [Scilit] [PubMed]
  75. Rohman, M.; Islam, R.; Monsur, M.B.; Amiruzzaman, M.; Fujita, M.; Hasanuzzaman, M. Trehalose Protects Maize Plants from Salt Stress and Phosphorus Deficiency. Plants 2019, 8, 568. [Google Scholar] [CrossRef] [Scilit] [PubMed]
  76. Yan, J.J.; Zhang, L.; Wang, R.Q.; Xie, B.; Li, X.; Chen, R.L.; Guo, L.X.; Xie, B.G. The sequence characteristics and expression models reveal superoxide dismutase involved in cold response and fruiting body development in Volvariella volvacea. Int. J. Mol. Sci. 2016, 17, 34. [Google Scholar] [CrossRef] [Scilit] [PubMed]
  77. Feng, K.; Yu, J.; Cheng, Y.; Ruan, M.; Wang, R.; Ye, Q.; Zhou, G.; Li, Z.; Yao, Z.; Yang, Y.; et al. The SOD gene family in tomato: Identification, phylogenetic relationships, and expression patterns. Front. Plant Sci. 2016, 7, 1279. [Google Scholar] [CrossRef] [Scilit] [PubMed]
  78. Abreu, I.A.; Cabelli, D.E. Superoxide dismutases—A review of the metal-associated mechanistic variations. Biochim. Biophys. Acta (BBA)-Proteins Proteom. 2019, 1804, 263–274. [Google Scholar] [CrossRef] [Scilit] [PubMed]
  79. Mittler, R.; Vanderauwera, S.; Gollery, M.; Van Breusegem, F. Reactive oxygen gene network of plants. Trends Plant Sci. 2004, 9, 490–498. [Google Scholar] [CrossRef] [Scilit] [PubMed]
  80. Das, K.; Roychoudhury, A. Reactive oxygen species (ROS) and response of antioxidants as ROS-scavengers during environmental stress in plants. Front. Environ. Sci. 2014, 2, 53. [Google Scholar] [CrossRef] [Scilit]
  81. Pilon, M.; Ravet, K.; Tapken, W. The biogenesis and physiological function of chloroplast superoxide dismutases. Biochim. Biophys. Acta (BBA) -Bioenerg. 2011, 180, 989–998. [Google Scholar] [CrossRef] [Scilit] [PubMed]
  82. Broda, M.; Millar, A.H.; Van Aken, O. Mitophagy: A mechanism for plant growth and survival. Trends Plant Sci. 2018, 23, 434–450. [Google Scholar] [CrossRef] [Scilit] [PubMed]
  83. Scherz-Shouval, R.; Shvets, E.; Fass, E.; Shorer, H.; Gil, L.; Elazar, Z. Reactive oxygen species are essential for autophagy and specifically regulate the activity of Atg4. EMBO J. 2007, 26, 1749–1760. [Google Scholar] [CrossRef] [Scilit] [PubMed]
  84. Bassham, D.C. Plant autophagy—More than a starvation response. Curr. Opin. Plant Biol. 2007, 10, 587–593. [Google Scholar] [CrossRef] [Scilit] [PubMed]
  85. Sarkar, S.; Floto, R.A.; Berger, Z.; Imarisio, S.; Cordenier, A.; Pasco, M.; Cook, L.J.; Rubinsztein, D.C. Lithium induces autophagy by inhibiting inositol monophosphatase. J. Cell Biol. 2005, 170, 1101–1111. [Google Scholar] [CrossRef] [Scilit] [PubMed]
  86. Kim, I.; Rodriguez-Enriquez, S.; Lemasters, J.J. Selective degradation of mitochondria by mitophagy. Arch. Biochem. Biophys. 2007, 462, 245–253. [Google Scholar] [CrossRef] [Scilit] [PubMed]
  87. Lee, J.; Giordano, S.; Zhang, J. Autophagy, mitochondria and oxidative stress: Cross-talk and redox signaling. Biochem. J. 2012, 41, 523–540. [Google Scholar] [CrossRef] [Scilit] [PubMed]
  88. Van Doorn, W.G.; Beers, E.P.; Dangl, J.L.; Franklin-Tong, V.E.; Gallois, P.; Hara-Nishimura, I.; Jones, A.M.; Kawai-Yamada, M.; Lam, E.; Mundy, J.; et al. Morphological classification of plant cell deaths. Cell Death Differ. 2011, 18, 1241–1246. [Google Scholar] [CrossRef] [Scilit] [PubMed]
  89. Inoue, Y.; Suzuki, T.; Hattori, M.; Yoshimoto, K.; Ohsumi, Y.; Moriyasu, Y. AtATG genes, homologs of yeast autophagy genes, are involved in constitutive autophagy in Arabidopsis root tip cells. Plant Cell Physiol. 2006, 47, 1641–1652. [Google Scholar] [CrossRef] [Scilit] [PubMed]
  90. Yang, X.; Bassham, D.C. New insight into the mechanism and function of autophagy in plant cells. Int. Rev. Cell Mol. Biol. 2015, 320, 1–40. [Google Scholar] [CrossRef] [Scilit] [PubMed]
  91. Lamb, C.A.; Yoshimori, T.; Tooze, S.A. The autophagosome: Origins unknown, biogenesis complex. Nat. Rev. Mol. Cell Biol. 2013, 14, 759–774. [Google Scholar] [CrossRef] [Scilit] [PubMed]
  92. Chung, T.; Phillips, A.R.; Vierstra, R.D. ATG8 lipidation and ATG8-mediated autophagy in Arabidopsis require ATG12 expressed from the differentially controlled ATG12A and ATG12 B loci. Plant J. 2010, 62, 483–493. [Google Scholar] [CrossRef] [Scilit] [PubMed]
  93. Lv, X.; Pu, X.; Qin, G.; Zhu, T.; Lin, H. The roles of autophagy in development and stress responses in Arabidopsis thaliana. Apoptosis 2014, 19, 905–921. [Google Scholar] [CrossRef] [Scilit] [PubMed]
  94. Pu, Y.; Luo, X.; Bassham, D.C. TOR-dependent and -independent pathways regulate autophagy in Arabidopsis thaliana. Front. Plant Sci. 2017, 8, 1204–1217. [Google Scholar] [CrossRef] [Scilit] [PubMed]
  95. Liu, Y.; Bassham, D.C. TOR is a negative regulator of autophagy in Arabidopsis thaliana. PLoS ONE 2010, 5, e11883. [Google Scholar] [CrossRef] [Scilit] [PubMed]
  96. Ji, Y.; Li, L.; Ma, Y.X.; Li, W.-T.; Li, L.; Zhu, H.-Z.; Wu, M.-H.; Zhou, J.-R. Quercetin inhibits growth of hepatocellular carcinoma by apoptosis induction in part via autophagy stimulation in mice. J. Nutr. Biochem. 2019, 69, 108–119. [Google Scholar] [CrossRef] [Scilit] [PubMed]
  97. Pattingre, S.; Espert, L.; Biard-Piechaczyk, M.; Codogno, P. Regulation of macroautophagy by mTOR and Beclin 1 complexes. Biochimie 2008, 90, 313–323. [Google Scholar] [CrossRef] [Scilit] [PubMed]
  98. Vanhaesebroeck, B.; Stephens, L.; Hawkins, P. PI3K signaling: The path to discovery and understanding. Nat. Rev. Mol. Cell Biol. 2012, 13, 195–203. [Google Scholar] [CrossRef] [Scilit] [PubMed]
  99. Cantley, L.C. The phosphoinositide 3-kinase pathway. Science 2002, 296, 1655–1657. [Google Scholar] [CrossRef] [Scilit] [PubMed]
  100. Welker, M.E.; Kulik, G. Recent syntheses of PI3K/Akt/mTOR signaling pathway inhibitors. Bioorg. Med. Chem. 2013, 21, 4063–4091. [Google Scholar] [CrossRef] [Scilit] [PubMed]
  101. Walker, E.H.; Pacold, M.E.; Perisic, O.; Stephens, L.; Hawkins, P.T.; Wymann, M.P.; Williams, R.L. Structural determinants of phosphoinositide 3-kinase inhibition by wortmannin, LY294002, quercetin, myricetin, and staurosporine. Mol. Cell 2000, 6, 909–919. [Google Scholar] [CrossRef] [PubMed]
  102. Ryabovol, V.V.; Minibayeva, F.V. Autophagic Proteins ATG4 and ATG8 in Wheat: Structural Characteristics and Their Role under Stress Conditions. Dokl. Biochem. Biophys. 2014, 458, 179–181. [Google Scholar] [CrossRef] [Scilit] [PubMed]
  103. Xie, Z.; Nair, U.; Klionsky, D.J. Atg8 controls phagophore expansion during autophagosome formation. Mol. Biol. Cell. 2008, 19, 3290–3298. [Google Scholar] [CrossRef] [Scilit]
  104. Nair, U.; Yen, W.L.; Mari, M.; Cao, Y.; Xie, Z.; Baba, M. A role for Atg8-PE deconjugation in autophagosome biogenesis. Autophagy 2012, 8, 780–793. [Google Scholar] [CrossRef] [Scilit] [PubMed]
Figure 1. Schemeof the experiment.
Agronomy 16 01727 g001
Figure 2. Distribution of ROS+ and ROS in root cells of 6-day-old wheat seedlings of the Orenburgskaya 22 and Zolotaya varieties: (a,a′)—control; (b,b′)—150 mM NaCl; (c,c′)—quercetin; (d,d′)—quercetin + 150 mM NaCl; (e,e′)—150 mM NaCl − quercetin. Bar 400 µm.
Agronomy 16 01727 g002
Figure 3. Theintensity of ROS fluorescence under the influence of stress factors in wheat: 1—control; 2—150 mM NaCl; 3—quercetin; 4—quercetin + 150 mM NaCl; 5—150 mM NaCl − quercetin. Different lowercase letters (a–i) indicate significant differences at the p < 0.05 level.
Agronomy 16 01727 g003
Figure 4. H2O2 content in roots and shoots in the Orenburgskaya 22 variety (1) and the Zolotaya variety (2). Different lowercase letters (a–e) indicate significant differences at the p < 0.05 level.
Agronomy 16 01727 g004
Figure 5. GSHcontent in roots and shoots in the Orenburgskaya 22 variety (1) and the Zolotaya variety (2). Different lowercase letters (a–e) indicate significant differences at the p < 0.05 level.
Agronomy 16 01727 g005
Figure 6. Expression of MnSOD, Cu/ZnSOD, PX, GPX, GST and CAT genes in wheat varieties Orenburgskaya (A) and Zolotaya (B) under the influence of various factors in 1, roots, and 2, shoots. Different lowercase letters (a–e) indicate significant differences at the p < 0.05 level.
Agronomy 16 01727 g006
Figure 7. Immunodetectionof the autophagy marker-ATG8 in wheat root tip cells under different growth conditions. 1—root cells of Orenburgskaya 22; 2—root cells of Zolotaya. (A)—control; (B)—after treatment with 150 mM NaCl; (C)—after treatment with 0.03% quercetin; (D)—after sequential treatment with 150 mM NaCl and 0.03% quercetin; (E)—after sequential treatment with 0.03% quercetin and 150 mM NaCl. White arrows mark the localization sites of ATG8 on the membranes of autophagosomes, phagophores, and the nuclear envelope. Bar 100 μm.
Agronomy 16 01727 g007aAgronomy 16 01727 g007b
Figure 8. ATG gene expression in roots and shoots of wheat varieties Orenburgskaya 22 and Zolotaya under the influence of various factors: 1—controls; 2—0.03% quercetin; 3—150 mM NaCl; 4—quercetin—NaCl; 5—NaCl—quercetin. Different lowercase letters (a–h) indicate significant differences at the p < 0.05 level.
Agronomy 16 01727 g008
Figure 9. Schemeof neutralization of excess ROS in two different wheat genotypes Triticum aestivum and Triticum durum under salt stress.
Agronomy 16 01727 g009
Figure 10. Schematicdiagram of initiation of autophagosome formation under salt stress and quercetin in two different wheat genotypes, Triticum aestivum and Triticum durum. ROS—reactive oxygen species; ATG—autophagy-related protein; PE—phosphatidylethanolamine; TOR—Target of Rapamycin; PI3K—phosphatidylinositol 3-kinase; GSH—glutathione; P—phosphate group.
Agronomy 16 01727 g010
Table 1. Morphologicalparameters of two genotype wheat Orenburgskaya 22 and Zolotaya grown under different conditions.
WheatGrowth ConditionRoot Length, cmShoot Height, cmWeight Biomass, cm
Orenburgskaya 22Control11.2 ± 0.56 b11.6 ± 0.58 b9.2 ± 0.46 a
150 mM NaCl10.9 ± 0.54 d11.6 ± 0.58 b7.8 ± 0.39 c
quercetin12.3 ± 0.61 a12.3 ± 0.61 a9.3 ± 0.46 a
150 mM NaCl − quercetin10.7 ± 0.53 d9.8 ± 0.49 c8.8 ± 0.44 b
quercetin − 150 mM NaCl12.2 ± 0.61 a11.5 ± 0.57 b8.9 ± 0.44 b
ZolotayaControl15.9 ± 0.79 a12.4 ± 0.62 a11.3 ± 0.56 a
150 mM NaCl14.8 ± 0.74 b11.2 ± 0.56 b11.0 ± 0.55 a
quercetin14.4 ± 0.72 b9.9 ± 0.49 c10.1 ± 0.50 b
150 mM NaCl − quercetin14.6 ± 0.73 b9.8 ± 0.49 c11.3 ± 0.56 a
quercetin − 150 mM NaCl14.9 ± 0.74 b9.9 ± 0.49 c9.5 ± 0.47 c
Data were expressed as mean ± standard deviation (SD; n = 30), and different lowercase letters (a–d) indicate significant differences at the p < 0.05.
Table 2. Content Chl a and Chl b in wheat Orenburgskaya 22 and Zolotaya grown under different conditions.
WheatGrowth ConditionChl a, (mg/g)Chl b, (mg/g)Chl a/Chl b
Orenburgskaya 22 control4.14 ± 0.2 c1.71 ± 0.08 a2.42 ± 0.12 c
150 mM NaCl1.98 ± 0.1 e0.72 ± 0.03 d2.75 ± 0.14 b
quercetin5.09 ± 0.25 a1.79 ± 0.09 a2.93 ± 0.15 a
150 mM NaCl − quercetin2.45 ± 0.12 d1.06 ± 0.05 c2.31 ± 0.11 c
quercetin − 150 mM NaCl4.73 ± 0.23 b1.59 ± 0.08 b2.97 ± 0.15 a
Zolotaya control2.48 ± 0.12 a0.87 ± 0.04 a2.85 ± 0.14 a
150 mM NaCl1.33 ± 0.07 c0.48 ± 0.02 c2.77 ± 0.13 b
quercetin2.44 ± 0.12 a0.92 ± 0.05 a2.66 ± 0.13 b
150 mM NaCl − quercetin1.23 ± 0.06 d0.51 ± 0.02 c2.42 ± 0.12 c
quercetin − 150 mM NaCl1.54 ± 0.08 b0.56 ± 0.03 b2.77 ± 0.14 b
Data were expressed as mean ± standard deviation (SD; n = 30), and different lowercase letters (a–e) indicate significant differences at the p < 0.05.
Table 3. Antioxidantactivity (AOA) in roots and shoots of wheat varieties Orenburgskaya 22 and Zolotaya grown under different conditions.
WheatGrowth ConditionAOA in RootAOA in Shoot
Orenburgskaya 22control56.86 ± 2.84 b52.08 ± 2.6 a
150 mM NaCl54.61 ± 2.73 bc49.8 ± 2.49 b
quercetin69.55 ± 3.48 a53.52 ±2.67 a
150 mM NaCl − quercetin49.02 ± 2.45 d45.47 ± 2.27 c
quercetin − 150 mM NaCl46.68 ± 2.33 e48.46 ± 2.42 b
Zolotayacontrol54.24 ± 2.71 a53.42 ± 2.67 a
150 mM NaCl34.38 ± 1.72 e31.24 ± 1.56 e
quercetin53.4 ± 2.67 ab49.82 ± 2.49 b
50 mM NaCl − quercetin41.67 ± 2.08 c35.62 ± 1.78 d
quercetin − 150 mM NaCl38.92 ± 1.94 d39.25 ± 1.96 c
Data are presented as mean ± standard deviation (SD; n = 30). Different lowercase letters (a–e) indicate significant differences at the p < 0.05 level.
Table 4. Root cells of 6-day-old wheat seedlings, with structures labeled with antibodies to ATG8.
Growth ConditionOrenburgskaya 22Zolotaya
Cells Containing ATG8Unmarked CellsCells Containing ATG8Unmarked Cells
control42584060
150 mM NaCl46546634
quercetin44564852
150 mM NaCl − quercetin43577921
quercetin − 150 mM NaCl50506040
Disclaimer/Publisher’s Note: The statements, opinions and data contained in all publications are solely those of the individual author(s) and contributor(s) and not of MDPI and/or the editor(s). MDPI and/or the editor(s) disclaim responsibility for any injury to people or property resulting from any ideas, methods, instructions or products referred to in the content.