1. Introduction
One of the greatest issues confronting society is expanding food production to meet the demands of a growing human population [
1], a challenge that is becoming increasingly difficult due to limited and declining agricultural production resources [
2]. Among these resources, water plays a critical role, making sustainable water resource management one of the most pressing environmental concerns of the twenty-first century and a key factor in ensuring food security [
3]. Consequently, improving water use efficiency in agricultural production has become essential, particularly for economically important crops such as sugar beet (
Beta vulgaris L.) and sugar cane, which are the primary sources of sugar for human consumption. Sugar beet alone accounts for approximately 20% of global sugar production [
4]. In Egypt, sugar beet is the primary source of sugar production, accounting for approximately 62% of the total national production compared to 38% from cane, with production in 2023 totalling around 1.79 million tons from beets [
5]. Sugar beet (
Beta vulgaris L.) cultivation in Egypt does not have a long history; large-scale production began in 1982 in response to limited water resources and the growing demand for sugar [
6]. Since then, increasing sugar production per unit area has become one of the most important domestic goals for closing the gap between sugar consumption and production. Achieving this goal largely depends on efficient water management, as adequate water supply is essential for obtaining high yields and better root quality in sugar beet [
7]. The importance of irrigation management is expected to increase under changing climatic conditions. Donatelli et al. [
8] found that sugar beet production would not be significantly affected under the climate change scenarios considered, while irrigated sugar beet yields could increase 2–15% at most sites under climate change irrigated yields in Italy. Similarly, Sánchez-Sastre et al. [
9] suggested that agriculture can mitigate weather-related losses through adaptive measures, particularly by improving irrigation management, resulting in yield increases of up to 17%. Because irrigation practices strongly influence sugar beet root development and quality, proper irrigation management is critical to avoid the adverse effects of both water deficit and excessive water application. Therefore, optimizing irrigation volumes has become a key strategy for sustainable sugar beet production, and deficit-irrigation approaches are increasingly recognized as effective tools for improving water use efficiency [
10]. Given the expected impacts of climate change [
11] and the potential increase in global sugar demand, it is necessary to implement highly efficient, sustainable irrigation practices, of which magnetic water technology is considered an eco-friendly irrigation alternative [
12]. Magnetic water technology, which exposes irrigation water to a magnetic field before use, has received significant attention due to its wide-ranging agricultural, industrial, and environmental management applications. This treatment changes the physical properties of the water, which can improve soil infiltration, nutrient solubility, and plant uptake efficiency [
13,
14]. Consequently, plants such as sugar beets show better germination, stronger root systems and increased resilience to water-deficit conditions [
15,
16]. Magnetic water treatment can change the water architecture, reducing surface tension, boosting mineral solubilization, and ensuring enough water supply [
17]. The magnetic water irrigation also results in higher and better-quality yield of sugar beet, compared to nonmagnetic water usage. Additionally, this study demonstrated that magnetically treated water positively influenced sugar beet growth and contributed to the improvement of soil properties [
18]. Furthermore, it plays an important role in increasing the percentage of dissolved oxygen in water, which increases the speed of chemical reactions, and it has a beneficial impact on the surface tension of the water, which is a useful predictor of plant growth when the contact angle decreases by (23%) because the plant’s absorption rate improves due to the capillary property, as well as the amount of nutrients (NO
2, NO
3, and NH
3) readily available. According to the findings of a study, in many parameters, magnetized water treatment resulted in an increased leaf area index, photosynthetic pigment content, improved root traits, higher sucrose and extractable sugar percentages, enhanced quality index, and greater root, top, and sugar yields compared with non-magnetized well water [
19].
The nutrient supply is important for sugar beet production. Sugar beet needs big amounts of nitrogen because nitrogen is one of the most important yield carriers, and is an element that improves growth characteristics, yield, its attributes, and root quality. So, nitrogen has a marked effect on plant growth characteristics. Nitrogen application has positive effects on plant growth, the physical and chemical properties, and yield of the plant [
20]. The knowledge of the amount of nitrogen doses is very important; the low nitrogen doses retard leaf growth, result in pale and low-level chlorophyll concentration of the leaf, and reduce the dry matter yield [
21,
22]. On the other hand, too much nitrogen increases the concentrations of alpha-amino N compounds in the root, thereby decreasing the crystallizable sugar ratio [
23,
24]. Malnou et al. [
25] concluded that the positive effect of nitrogen supply is primarily due to radiation interception sugar beet in terms of sugar yield. The use of magnetically treated irrigation water may reduce the nitrogen fertilizer requirement of sugar beet crops by improving nutrient availability and uptake efficiency [
26]. Magnetic water treatment can enhance the accessibility of soil nutrients to plants and may also decrease the salinity of both irrigation water and soil through improved leaching of salts and specific anions [
27]. Phosphorus has an important role in photosynthesis, sugar transformation, genetic information transfer, and nutrient movement within the plant [
28]. Potassium helps with enzyme activity, osmoregulation, biosynthesis, and sucrose transfer of plants [
29,
30]. Several researchers have stated that nitrogen and potassium have an important role in increasing the yield and quality of sugar beet [
31,
32]. Based on experimental findings, potassium fertilization improved nitrogen use efficiency parameters, especially when magnesium sulfate was added at the same time to the soil [
33]. According to Marinković et al. [
34], the phosphorus application has positive effects on the yield production of sugar beet.
In view of the earlier-presented information, we hypothesized that magnetized water and the use of the recommended doses of NPK per unit area could increase sugar beet productivity. Therefore, this study aimed to enhance growth, yield, and its attributes, as well as quality of sugar beet plants by evaluating the integrated effects of MWT, evapotranspiration-based irrigation levels, and reduced NPK fertilization on the agronomic development, water relations, and technological quality metrics of sugar beet under the ecological conditions of Kafrelsheikh Government, Egypt.
2. Materials and Methods
2.1. Description of Experimental Site and Characterization of Climate and Soil
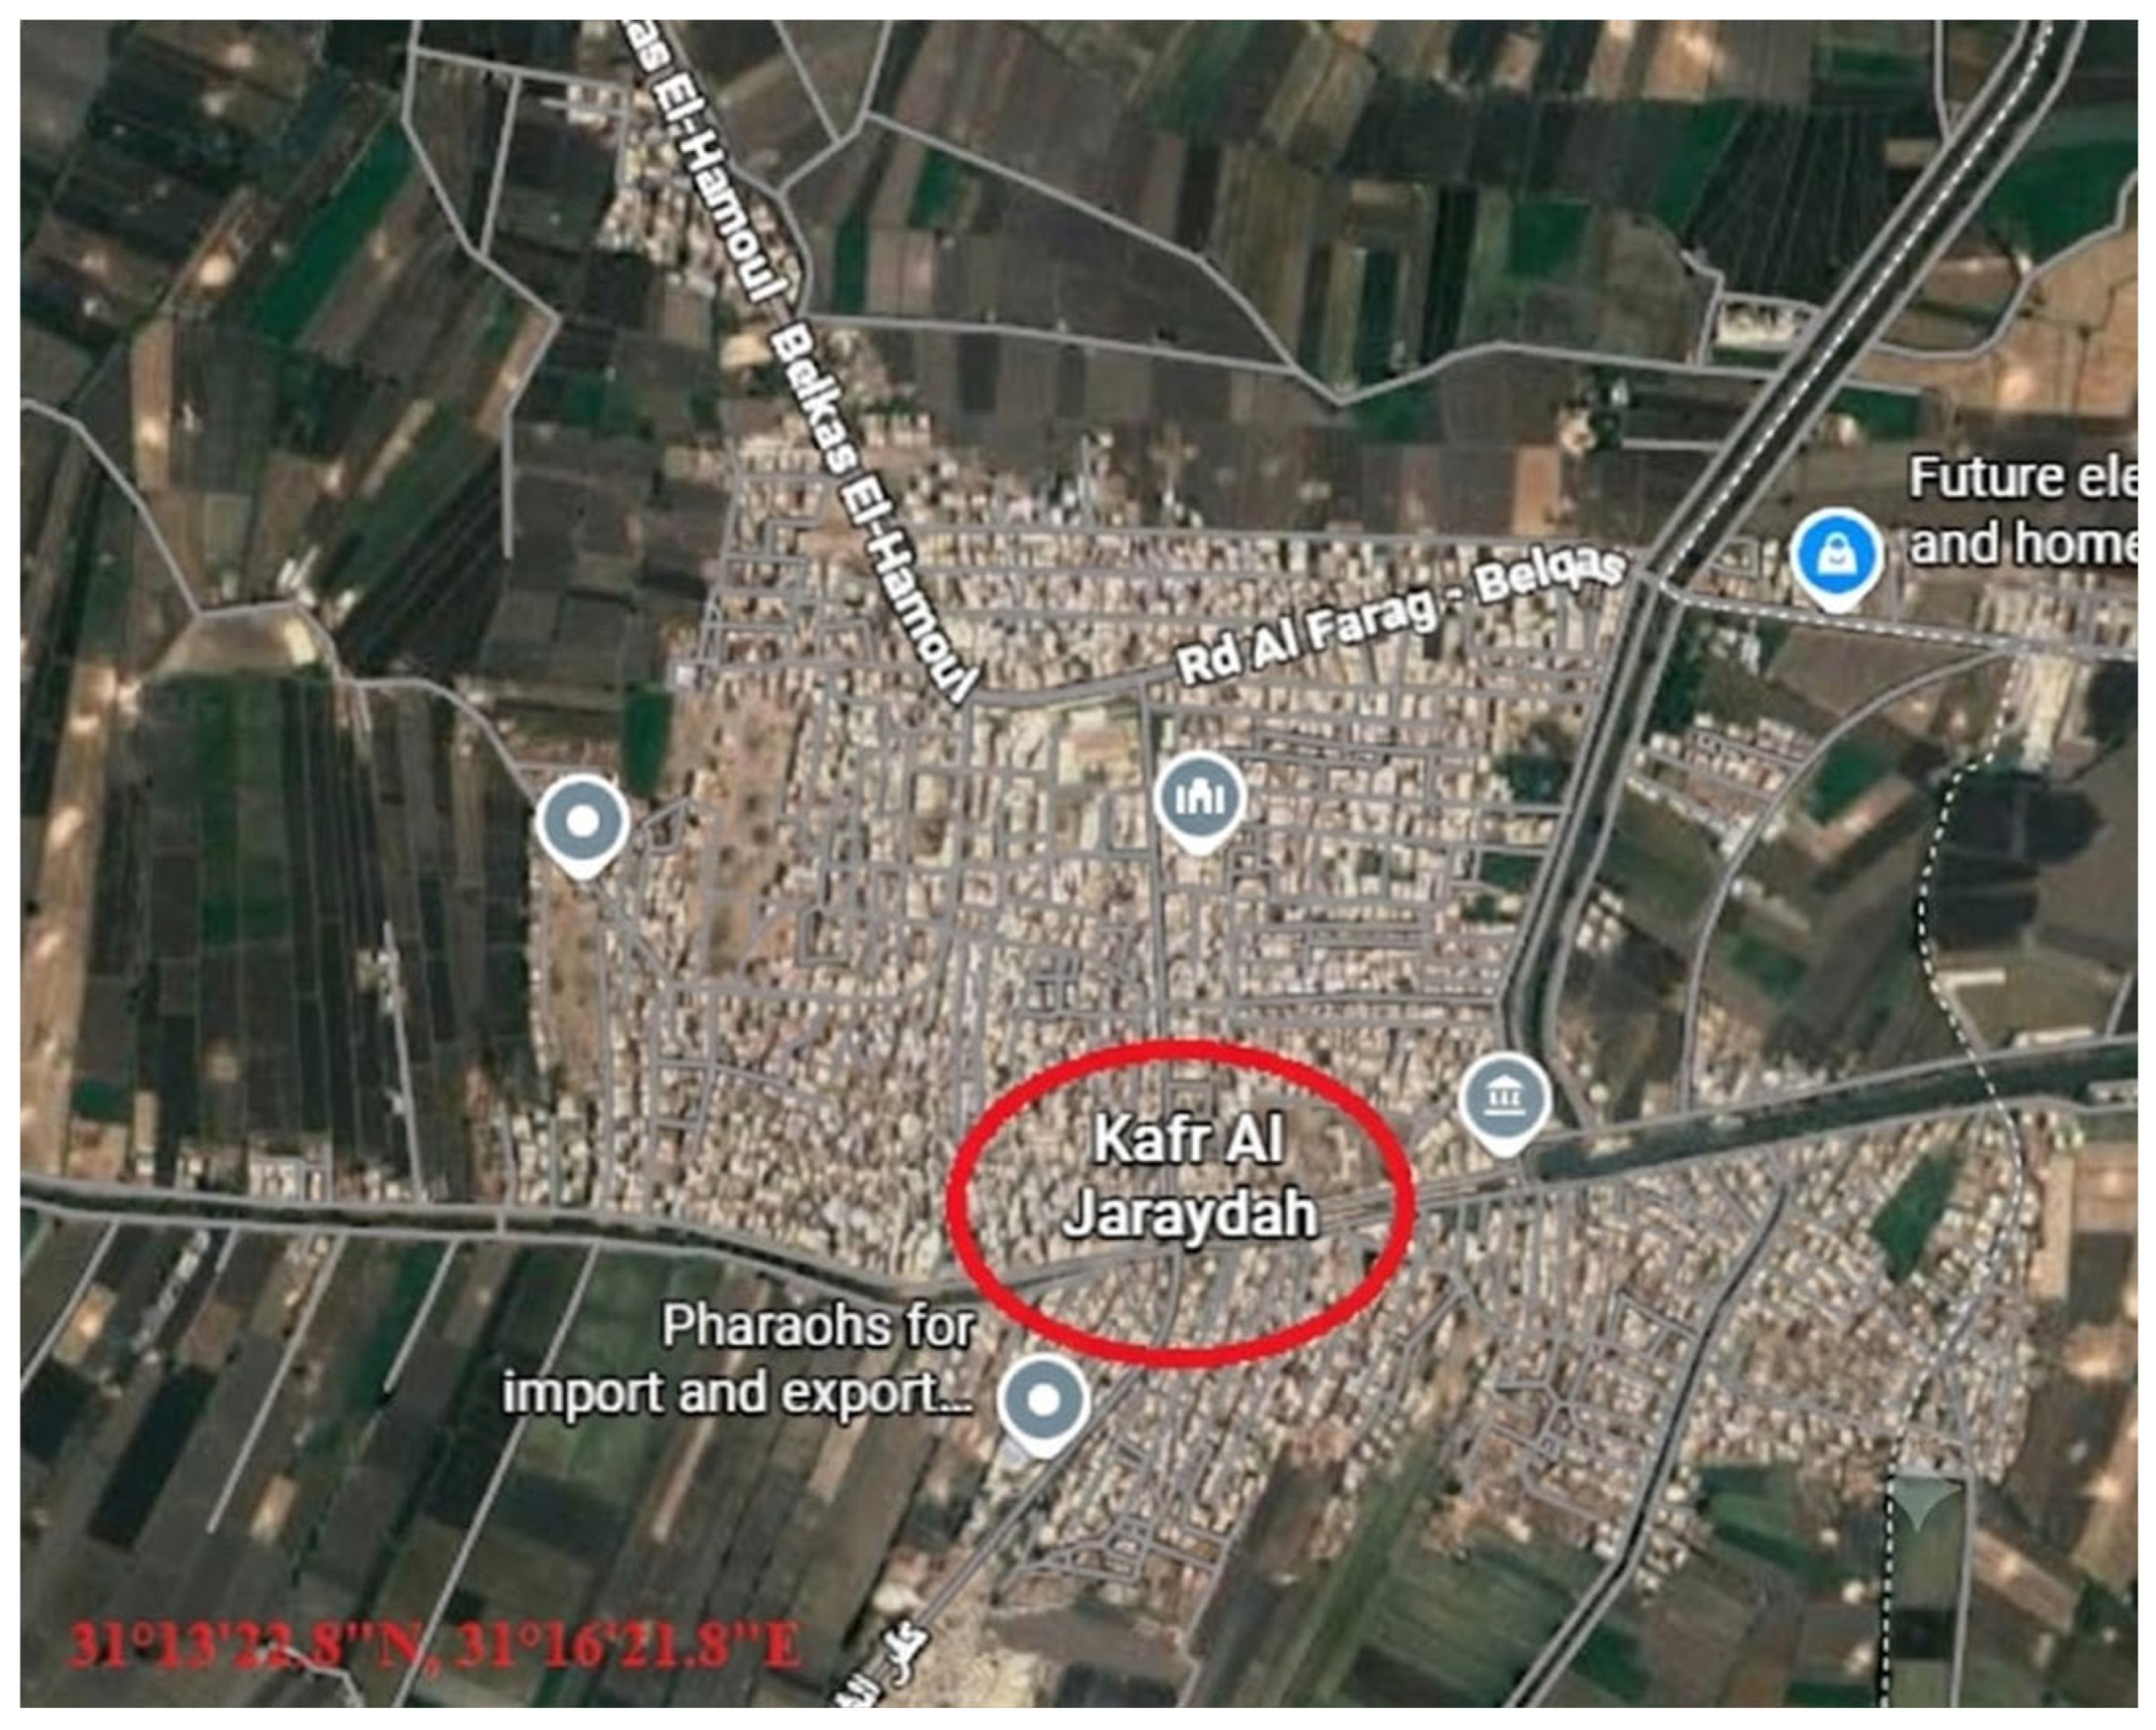
The field experiment was conducted for only one year at one location during the 2023/2024 winter season near the Village Kafraljaraydh (
Figure 1), which is in Kafrelsheikh Governorate (Egypt) (31°13′22.8″ N, 31°16′21.8″ E). The main meteorological data of the experimental site are presented in
Table 1.
According to the soil properties of the experimental site, the soil was clayey in texture, and the soil samples were collected at a depth of 0–60 cm (comprising 0–15, 15–30, 30–45, and 45–60 cm layers) from nine sample sites chosen randomly. The soil samples were analyzed in the laboratory of the Faculty of Agriculture, University of Mansoura, before sowing. After removing the plant remains, the soil was air-dried and ground well, and then it was sifted through a sieve with holes of 2 mm in diameter. Thereafter, the dried soil samples were mixed and homogenized, representative samples were taken, and then the physical and chemical tests were performed according to [
35,
36]. The main soil characteristics are summarized in
Table 2 and
Table 3.
Moreover, chemical properties of irrigation water before and after magnetized water are summarized in
Table 4.
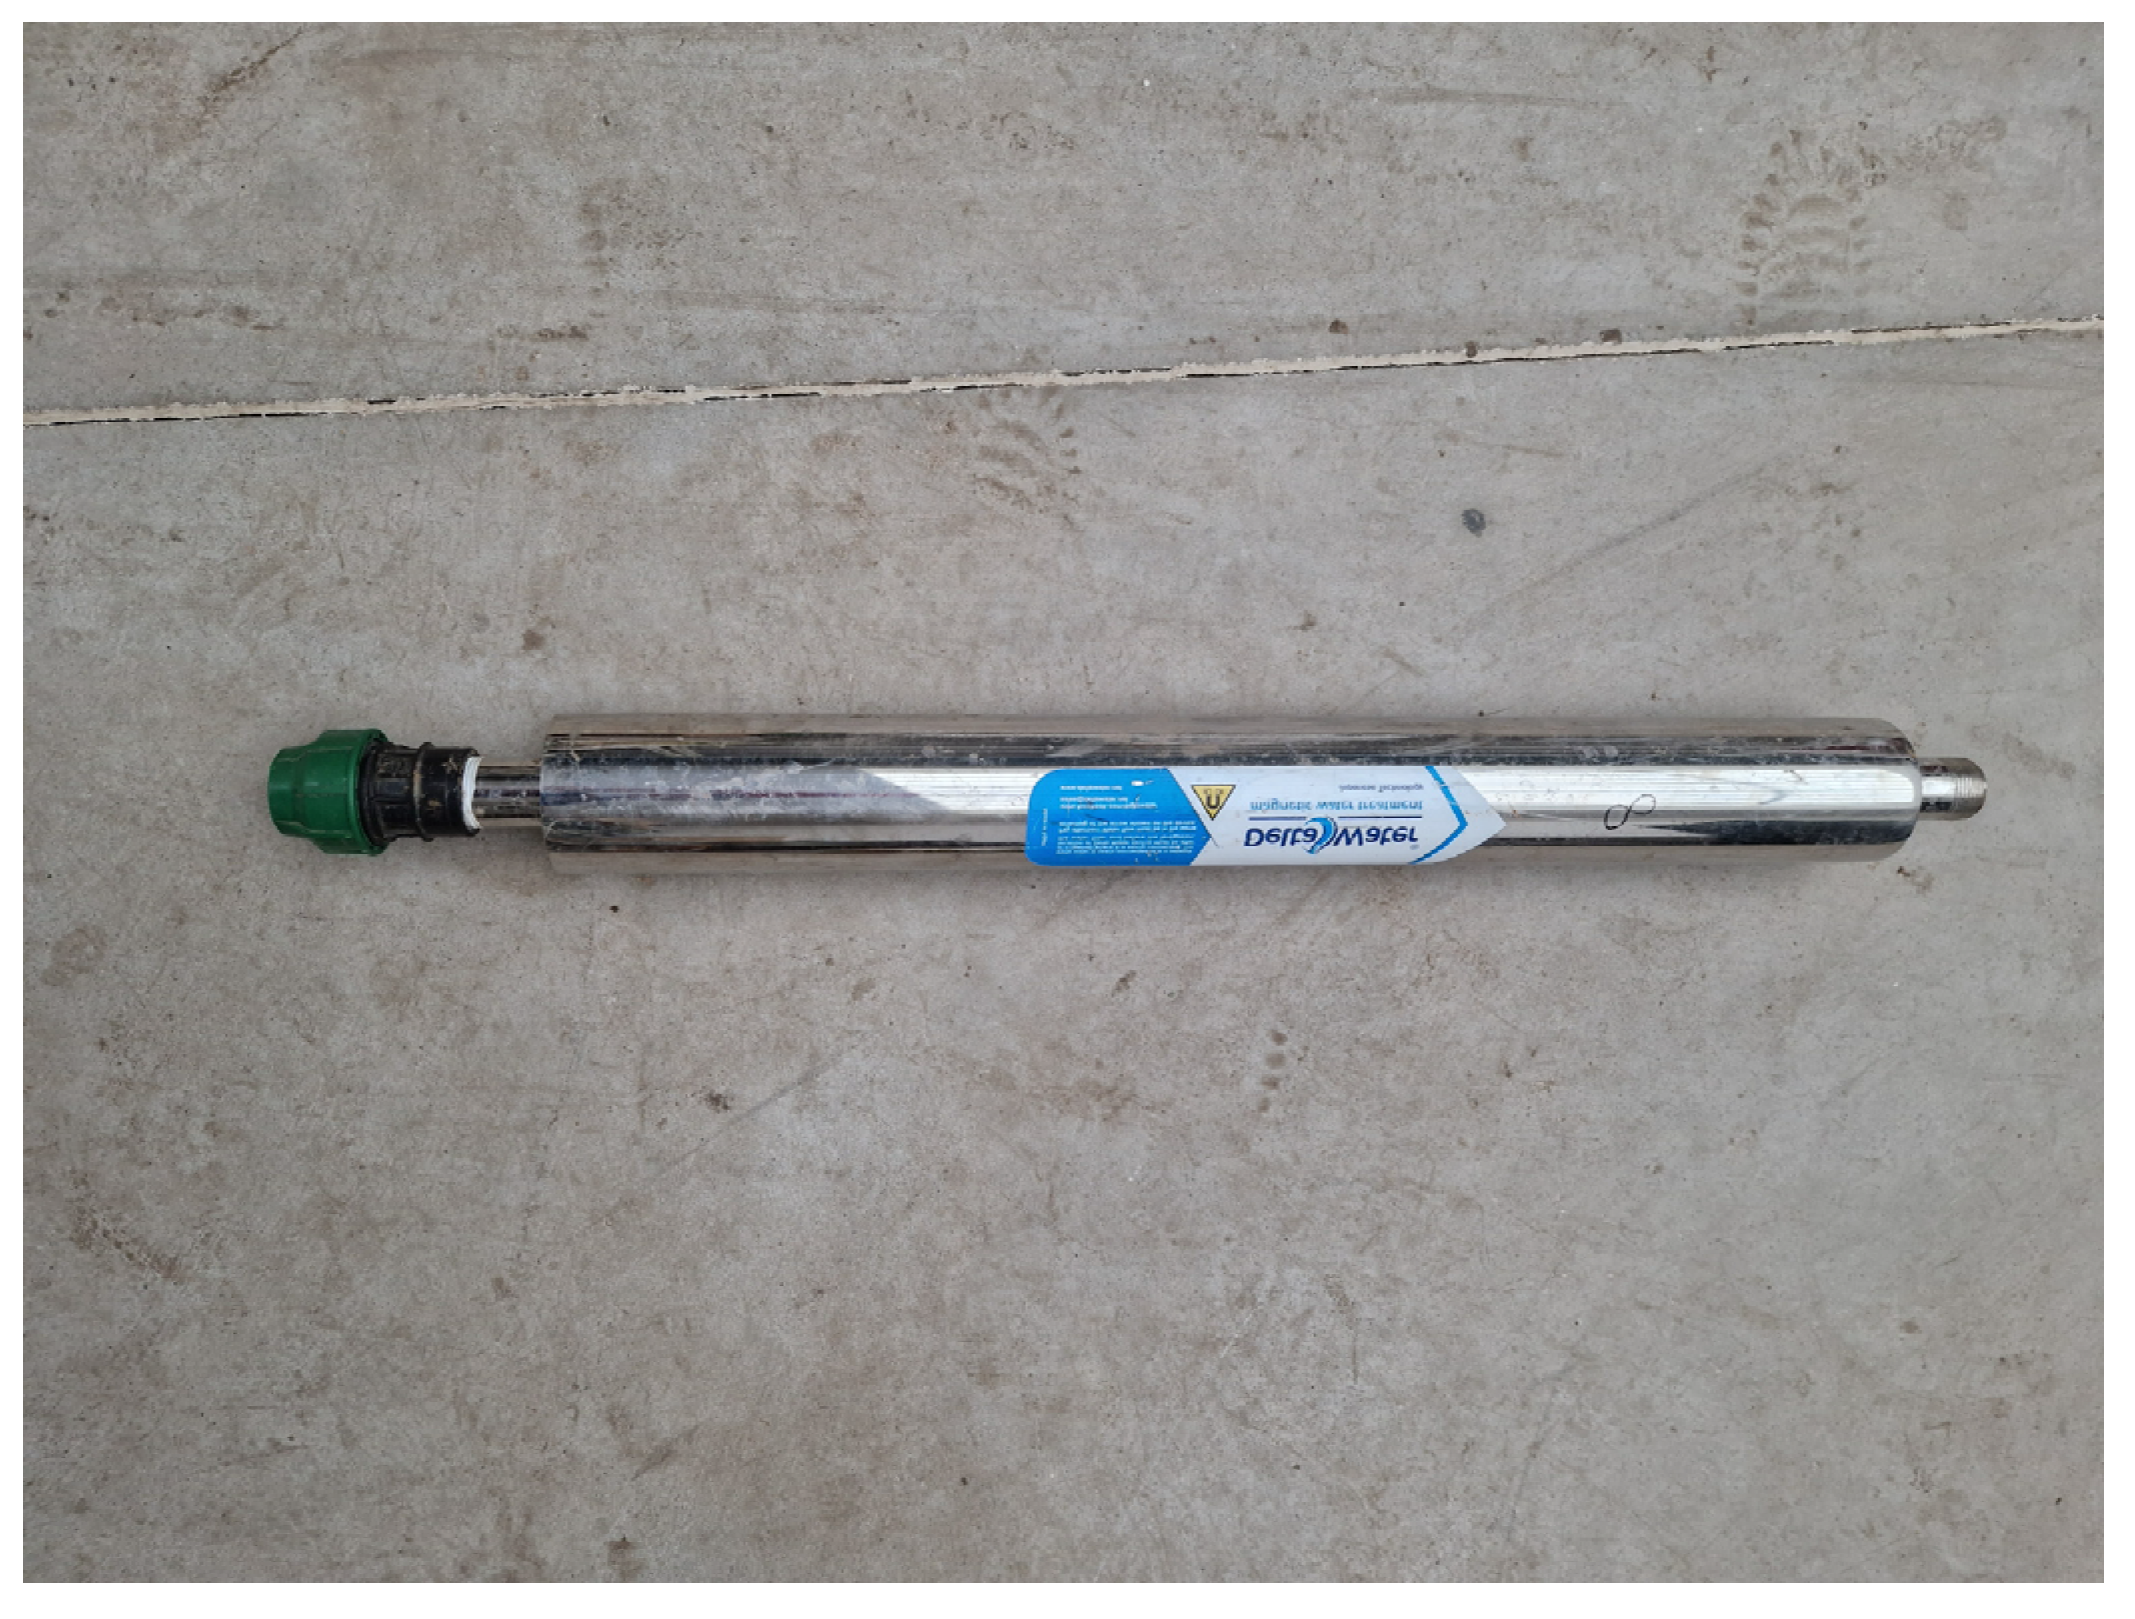
Surface drip irrigation water system was magnetized using a commercial 2-inch inline permanent magnetic device manufactured by Delta Water (Alexandria, Egypt), as shown in
Figure 2. The device was installed directly onto the sub-main irrigation line feeding the magnetized treatment plots, downstream from the main filtration and pressure regulation valves. The irrigation water passed dynamically through the permanent magnetic fields inside the unit prior to field application, generating a permanent magnetic flux density of approximately 1400 Gauss (0.14 Tesla) at an optimal operating water flow rate of 12–15 m
3 ha
−1 and exposure transit time of approximately (0.5 s) through the high-intensity magnetic chamber. Moreover, to prevent cross-contamination, separate distribution pipelines were utilized to deliver the magnetized and normal irrigation treatments to their respective plots.
2.2. Experimental Design, Treatments, and Plant Materials
The experiment was set in a strip-plot design with three replicates. The basic unit area of each experiment was 10.5 m2 and included five ridges, each 60 cm wide and 3.5 m long. The experiment included sixteen treatments comprising four combined irrigation treatments, including two types of irrigation water (normal and magnetized) and two levels of potential evapotranspiration (100 and 75% of ETc), allocated in the vertical plots, while the horizontal plots were occupied with four levels of NPK fertilizers as follows: (a) 100% of the recommended dose (214.2 kg N + 71.4 kg P2O5 + 114.24 kg K2O/ha); (b) 80% of the recommended level (171.36 kg N + 57.12 kg P2O5 + 91.39 kg K2O/ha); (c) 60% of the recommended level (128.52 kg N + 42.84 kg P2O5 + 68.54 kg K2O/ha); and (d) 40% of the recommended level (85.68 kg N + 28.56 kg P2O5 + 45.69 kg K2O/ha). The baseline mineral NPK fertilization rates were determined in accordance with the official recommendations for sugar beet cultivation established by the Ministry of Agriculture in Egypt.
2.3. Agricultural Practices
The experimental field was prepared by two ploughings, leveling, and compaction, and then divided to create the experimental units. Sugar beet cv. Raspoly (multigerm type, which was obtained from the Research Section of Sugar Research Institute ARC, Ministry of Agriculture, Egypt) was hand-dry sown using the sugar beet sowing method, in which 3–5 balls per hill were sown in hills 20 cm apart on one side of the ridge. The date of sowing was the 15th of November. After sowing, all plots were irrigated, using a surface drip irrigation system equipped with lateral lines per ridge, with inline emitters spaced at (30 cm) intervals, with an emitter discharge capacity of (2.0 or 4.0 L/h) operating at a localized pressure of (1.0 to 2.5 bar). The actual irrigation depth applied per plot during each individual watering event was calculated based on the cumulative ETc recorded since the preceding irrigation event, adjusted for treatment levels (100% or 75% ETc) and accounting for an irrigation application efficiency (Ea) of 85%. Over the course of the 210-day crop cycle, a total of 6 irrigation events were carried out after the uniform sowing irrigation. The applied water depth per event ranged from 45.0 to 65.0 mm for the 100% ETc treatment, and 33.75 to 48.75 mm for the 75% deficit ETc treatment, which corresponded to actual volumetric water deliveries ranging between 472.5 and 682.5 L and 354.4 to 511.9 L per 10.5 m2 plot area, respectively. Plants were thinned after full germination, after 35 days from sowing (DFS) to produce one plant/hill, with a plant population of 83,300 plants/ha. The nitrogen in the form of urea (46.0% N) was added in two similar doses as topdressing; the first dose was added after thinning (35 DFS) and before the 2nd irrigation, and the other dose was applied after (50 DFS) and before the 3rd irrigation. The recommended dose of calcium superphosphate (15.5% P2O5) was 150 kg/ha, and it was added entirely and incorporated into the field during soil preparation as a baseline practice. Potassium fertilizer in the form of potassium sulphate (48% K2O) was applied at the aforementioned levels on the surface as a topdressing in one dose after thinning and before the second irrigation (35 days from sowing). The recommendations for growing sugar beet of the Ministry of Agriculture were applied, excluding the factors under study.
2.4. Agronomic Characteristics Studied
Different morphological traits were assessed at 120 DFS, five guarded plants were collected randomly from the two outer ridges (numbers one and five) of each plot. These plants were chosen from guarded, interior positions within those ridges to avoid edge effects and to estimate the following traits:
a. Total chlorophyll (SPAD): by using SPAD-502 (Minolta Co., Ltd., Osaka, Japan) total chlorophyll content was estimated.
b. Leaf area plant
−1 (cm
2): It was estimated by applying the dry-weight method as confirmed by [
37], using the following Equation (1):
After 120 and 150 days of DFS, samples of five plants were collected randomly from the two outer ridges (numbers one and five) of each plot. These plants were chosen from guarded, interior positions within those ridges to avoid edge effects and to estimate the following traits:
c. Crop growth rate (CGR) in g m
−2 week
−1: It was calculated by using Equation (2) as confirmed by [
38]:
where W
1 and W
2 refer to the total dry weights of plants (g) at sampling times T
1 and T
2 (weeks), respectively, and GA represents the ground area (m
2) allocated per plant based on the commercial density profile. To determine dry weight, all were samples air-dried, then oven dried at 70 °C till constant weight.
d. Relative growth rate (RGR) in g g
−1 week
−1: as described by [
38], it was estimated by using the following Equation (3):
where Log
e refer to the natural log, and W
1 and W
2 refer to the dry weights of the plant at sampling recorded at times T
1 and T
2 (weeks), respectively.
After maturity and 210 DFS, five plants were randomly collected from the central ridges (numbers two, three and four) of each plot to measure the following characters:
a—Root fresh weight (g/plant). b—Foliage fresh weight (g/plant).
c—Root length (cm). d—Root diameter (cm).
e—Total soluble solids (TSS %) were estimated in the juice of fresh roots by using a fully automatic digital refractometer, model RX-5000 (ATAGO Co., Ltd., Tokyo, Japan).
f—Sucrose (%) was determined polarimetrically on lead acetate extract of fresh root weight according to the method confirmed by Carruthers and Oldfield [
38].
g—Apparent purity (%) was determined as following Equation (4) as described by [
39].
For sugar beet yields, only the three central/inner ridges (ridges 2, 3, and 4) were harvested cleaned, and their roots and leaves separated and weighed. The outer ridges (1 and 5) were completely excluded from the final yield calculations to ensure no border effects influenced the productivity data. in order to determine the following characteristics:
a. Root yield (tha).
b. Top yield (t/ha).
c. Sugar yield (t/ha): It was calculated by multiplying sucrose % by root yield/ha.
2.5. Assessment of Technical Quality
All examined root quality characteristics of sugar beet were determined in the Dakahlia Sugar Company Laboratories (Belqas District, Dakahlia Governorate, Egypt). Alpha-amino nitrogen (α-N) was determined using ninhydrin according to the methods of Carruthers and Oldfield [
40]. Nitrogen content was estimated using the modified improved Kjeldahl method as described in AOAC [
41]. Phosphorous content was determined spectrophotometrically, as defined by Peters et al. [
42]. Potassium and Na contents were calculated using flame photometry (PFP7, Jenway Ltd., Felsted, Dunmow, Essex, UK) at a wavelength of 767 and 589 nm, respectively, in accordance with ICUMSA [
43] method. All three values were converted and standardized to meq/100 g of fresh beet to facilitate precise impurity calculations.
The sugar in molasses, which cannot crystallize, causes the greatest sugar loss in a sugar mill. Thus, using estimate formulae of certain non-sugars in beet, an attempt was made to assess the technical grade of sugar beet. The standard molasses loss (Equation (5)) and an alkalinity coefficient (AC, Equation (6)) were computed for the current investigation using the following method from Reinfeld et al. [
44]:
where Na, K and α-N were expressed as mmol/100 g of fresh beet.
Impurity value (IV) was determine based on the Formula (7) as mentioned by Carruthers and Oldfield [
45] and Carruthers and Oldfield [
40], respectively.
where Na, K, and α-N are expressed as mmol/100 g beet.
2.6. Water Parameters
Gravimetric soil samples at 0.15 m intervals to a depth of 0.60 m were collected after sowing, before and after each irrigation, and at harvest time to determine the amount of applied water at each irrigation and the actual evapotranspiration (ET
a) values. The ET
a values for the soil profile were calculated according to Equation (8) given by Israelson and Hansen [
46] as follows:
where
= actual evapotranspiration (mm),
= number of soil layers (1 to 4) down to a total root depth profile of 60 cm.
= total number of soil layers,
= volumetric soil moisture percentage (%, mass basis) measured 48 h after irrigation (at field capacity).
= volumetric soil moisture percentage (%, mass basis) measured immediately before the next irrigation event.
= soil bulk density (g cm
−3),
= root zone soil layer thickness (mm).
Water use efficiency values (WUE) were calculated using Equation (9) given by Jensen [
47] as follows:
where sugar beet crop efficiency (Kc) values at Kafralgraidh for the growing season were calculated according to the following Equation (10):
where ET
a = actual evapotranspiration (water consumptive use), ET
o = potential evapotranspiration. The measured ET
o values at the experimental site were determined using the class A pan according to Doorenbos and Kassam [
48].
The absolute seasonal precipitation recorded at the experimental field station during the 2023/2024 crop cycle was 55.70 mm (accumulated as 9.4 mm in Nov, 13.8 mm in December, 16.2 mm in January, 13.2 mm in Febraury, 6.4 mm in March, 1.41 mm in April, and 0.29 mm in May). Using the USDA-SCS model, effective rainfall (Pe) was determined to be 50.74 mm (507.4 m3 ha−1). This environmental water contribution was explicitly included as part of the initial water balance and seasonal crop water availability matrix.
2.7. Statistical Analysis
The mean effects of factors under study, including two types of irrigation water and two levels of potential evapotranspiration combined into four irrigation treatments and four levels of NPK fertilization, were further evaluated with Two-Way Analysis of Variance (ANOVA) followed by Tukey’s Post Hoc Test (p < 0.05). The interaction between factors under studies were ranked based on the averages of the examined characteristics, and then the ranking averages were calculated. All analyses were performed using SPSS software, version 20.0 (SPSSR) for Windows.
3. Results
The field experiment was performed with winter sugar beet for only one year at one location during the 2023/2024 winter season. Two types of irrigation water, two levels of potential evapotranspiration (combined into four irrigation treatments) and four levels of NPK fertilization were tested. According to the multivariate test, we summarized the results of the Two-Way ANOVA test as presented in
Table 5, whereas the results of the Two-Way ANOVA test for each studied trait are presented in
Table 5.
3.1. Vegetative Growth Parameters
In the case of vegetative growth parameters, significant differences were detected due to the tested irrigation doses (75% ETc and 100% ETc), the type of irrigation water (magnetized water treatment, normal water treatment) and the different NPK fertilization levels (
p < 0.05). In the case of both tested vegetative parameters, the treatments irrigated with magnetic water at the 100 ETc level showed the highest values (
Table 6,
Table 7 and
Table 8).
The total chlorophyll content (SPAD), the development of the leaf area, and the growth rate values (CGR and RGR) showed a parallel response to the treatments. The highest values were measured in the combination of magnetic irrigation at 100% ETc and higher NPK levels, while the lowest values were detected in the normal irrigation, 75% ETc treatment with reduced nutrient supply (40% NPK). A decrease was observed in both parameters with decreasing NPK levels, indicating a strong nutrient response of sugar beet. However, this decrease was less pronounced in the case of magnetic irrigation, suggesting that magnetic water may mitigate the adverse effects of nutrient deficiency. A similar trend was observed in the case of root morphological parameters (root length and root diameter), which changed in accordance with the above-ground parameters of the plants. Plants treated with magnetic water and full irrigation developed a more developed root system, which was accompanied by more intensive vegetative growth. The highest values were observed with magnetic irrigation at 100% ETc, while the lowest values occurred in the combination of 75% ETc irrigation and low NPK supply.
It could be noticed that the interaction between irrigation water type (normal vs. magnetized), irrigation levels (100 and 75% ETc) combined into four irrigation treatments, and NPK fertilization levels significantly modified the physiological and canopy growth traits of the crop, demonstrating that magnetized water functions as a prominent driver that maximizes water and nutrient utilization efficiency. The combination of magnetized irrigation at 100% ETc paired with 100% NPK fertilization maximized performance, yielding the highest total chlorophyll content (54.97 SPAD), leaf area expansion (3303.08 cm2), crop growth rate (13.535 g m−2 week−1), relative growth rate (0.090 g g−1 week−1), root length (32.62 cm), and root diameter (15.79 cm), which represent remarkable increases of 18.01% for SPAD, 11.00% for leaf area, 25.57% for CGR, 8.43% for RGR, 36.26% for root length, and 39.86% for root diameter, respectively, compared to the standard regional baseline management (normal irrigation, 75% ETc, 100% NPK).
The highest values were measured for magnetic irrigation and 100% ETc water dose. The higher chlorophyll content and leaf area were associated with higher growth intensity and more developed root formation, suggesting that magnetic irrigation positively influenced both photosynthetic activity and biomass accumulation.
3.2. Root and Top Yield
The development of root fresh weight, top yield and root yield was also significantly influenced by the irrigation system, irrigation water type and NPK fertilization level (
p < 0.05). A similar trend was observed for all yield parameters: irrigation with magnetic water and full irrigation (100% ETc) resulted in the highest values (
Table 9).
In the case of root fresh weight, significant differences were detected for both irrigation and nutrient supply levels. The highest root fresh weight value (736.01 g plant−1) was measured in the combination of magnetic irrigation at 100% ETc and 100% NPK treatment, while the lowest value (544.44 g plant−1) occurred in the normal irrigation, 75% ETc treatment with 40% NPK. With the reduction in NPK levels, a gradual decrease in root fresh weight was observed in all treatments.
A similar trend was observed in the case of top yield and root yield. The highest top yield (41.36 t ha−1) and root yield (80.34 t ha−1) were achieved by the combination of full irrigation (100% ETc), magnetic water and 100% fertilization, while the lowest values were measured in the normal irrigation (75% Etc) treatment with reduced NPK supply. Significantly the highest top and root yields were measured in case of the magnetic irrigation water treatment.
Deficit irrigation (75% ETc) reduced both root and top yield compared to full irrigation in both water treatments; however, magnetic irrigation partially mitigated these negative effects. The values achieved with reduced magnetic water rate significantly exceeded the results achieved with normal irrigation and reduced water rate. With the reduction in NPK levels, the values of the yield components gradually decreased; however, the differences between 100% and 80% NPK treatments were not statistically different, moderate fertilizer reduction did not cause significant yield losses.
Our results showed that under magnetized irrigation at 100% ETc levels, individual root fresh weights were only slightly affected as NPK fertilizers decreased from 100% to 80% of their total amount (736.01 g to 735.44 g—a drop of only 0.08%) but significant effects occurred when decreasing the amount of NPK fertilizer from 100% to 80% or similar levels under both normal (75% and 100% ETc) and magnetized (75% ETc) irrigation during that time period. All three treatments resulted in larger total top yield reductions (2.57% under magnetized; 4.16% under normal 75% ETc; 2.89% under normal 100% ETc) while top yield was more sensitive due to limited NPK fertilizer at the beginning than at the end of the study. The sharpest reduction (17.51–17.06 t/ha, or 2.57%) occurred with the use of magnetically produced NPK. Significant reductions (from 4.16% under normal 75% ETc, 2.89% under normal 100% ETc, and 2.33% under magnetically produced 75% ETc) also followed those same types of applications on all occasions/harvests leading to very similar effects (top yield) from magnetization versus non-magnetization. As the nutritional gap widened down to the 60% NPK level, a severe performance drop occurred relatively uniformly across all blocks, resulting in an 11.45% reduction in root fresh weight and a 13.71% reduction in top yield within the magnetized 100% Etc treatment, and matching patterns of 11.60% to 13.46% root losses and 13.88% to 14.16% top yield declines across the remaining three environments. At the lowest nutritional extreme (40% NPK), conventional deficit irrigation (Normal 75% ETc) suffered a heavy biomass crash, experiencing a 23.72% reduction in root fresh weight and a 27.06% reduction in top yield; conversely, full-volume magnetized irrigation strongly mitigated these heavy deficits, restricting the maximum root fresh weight loss to 15.82% and top yield loss to 26.21%, thereby confirming that magnetic water properties dramatically improve plant resilience against severe nutritional starvation.
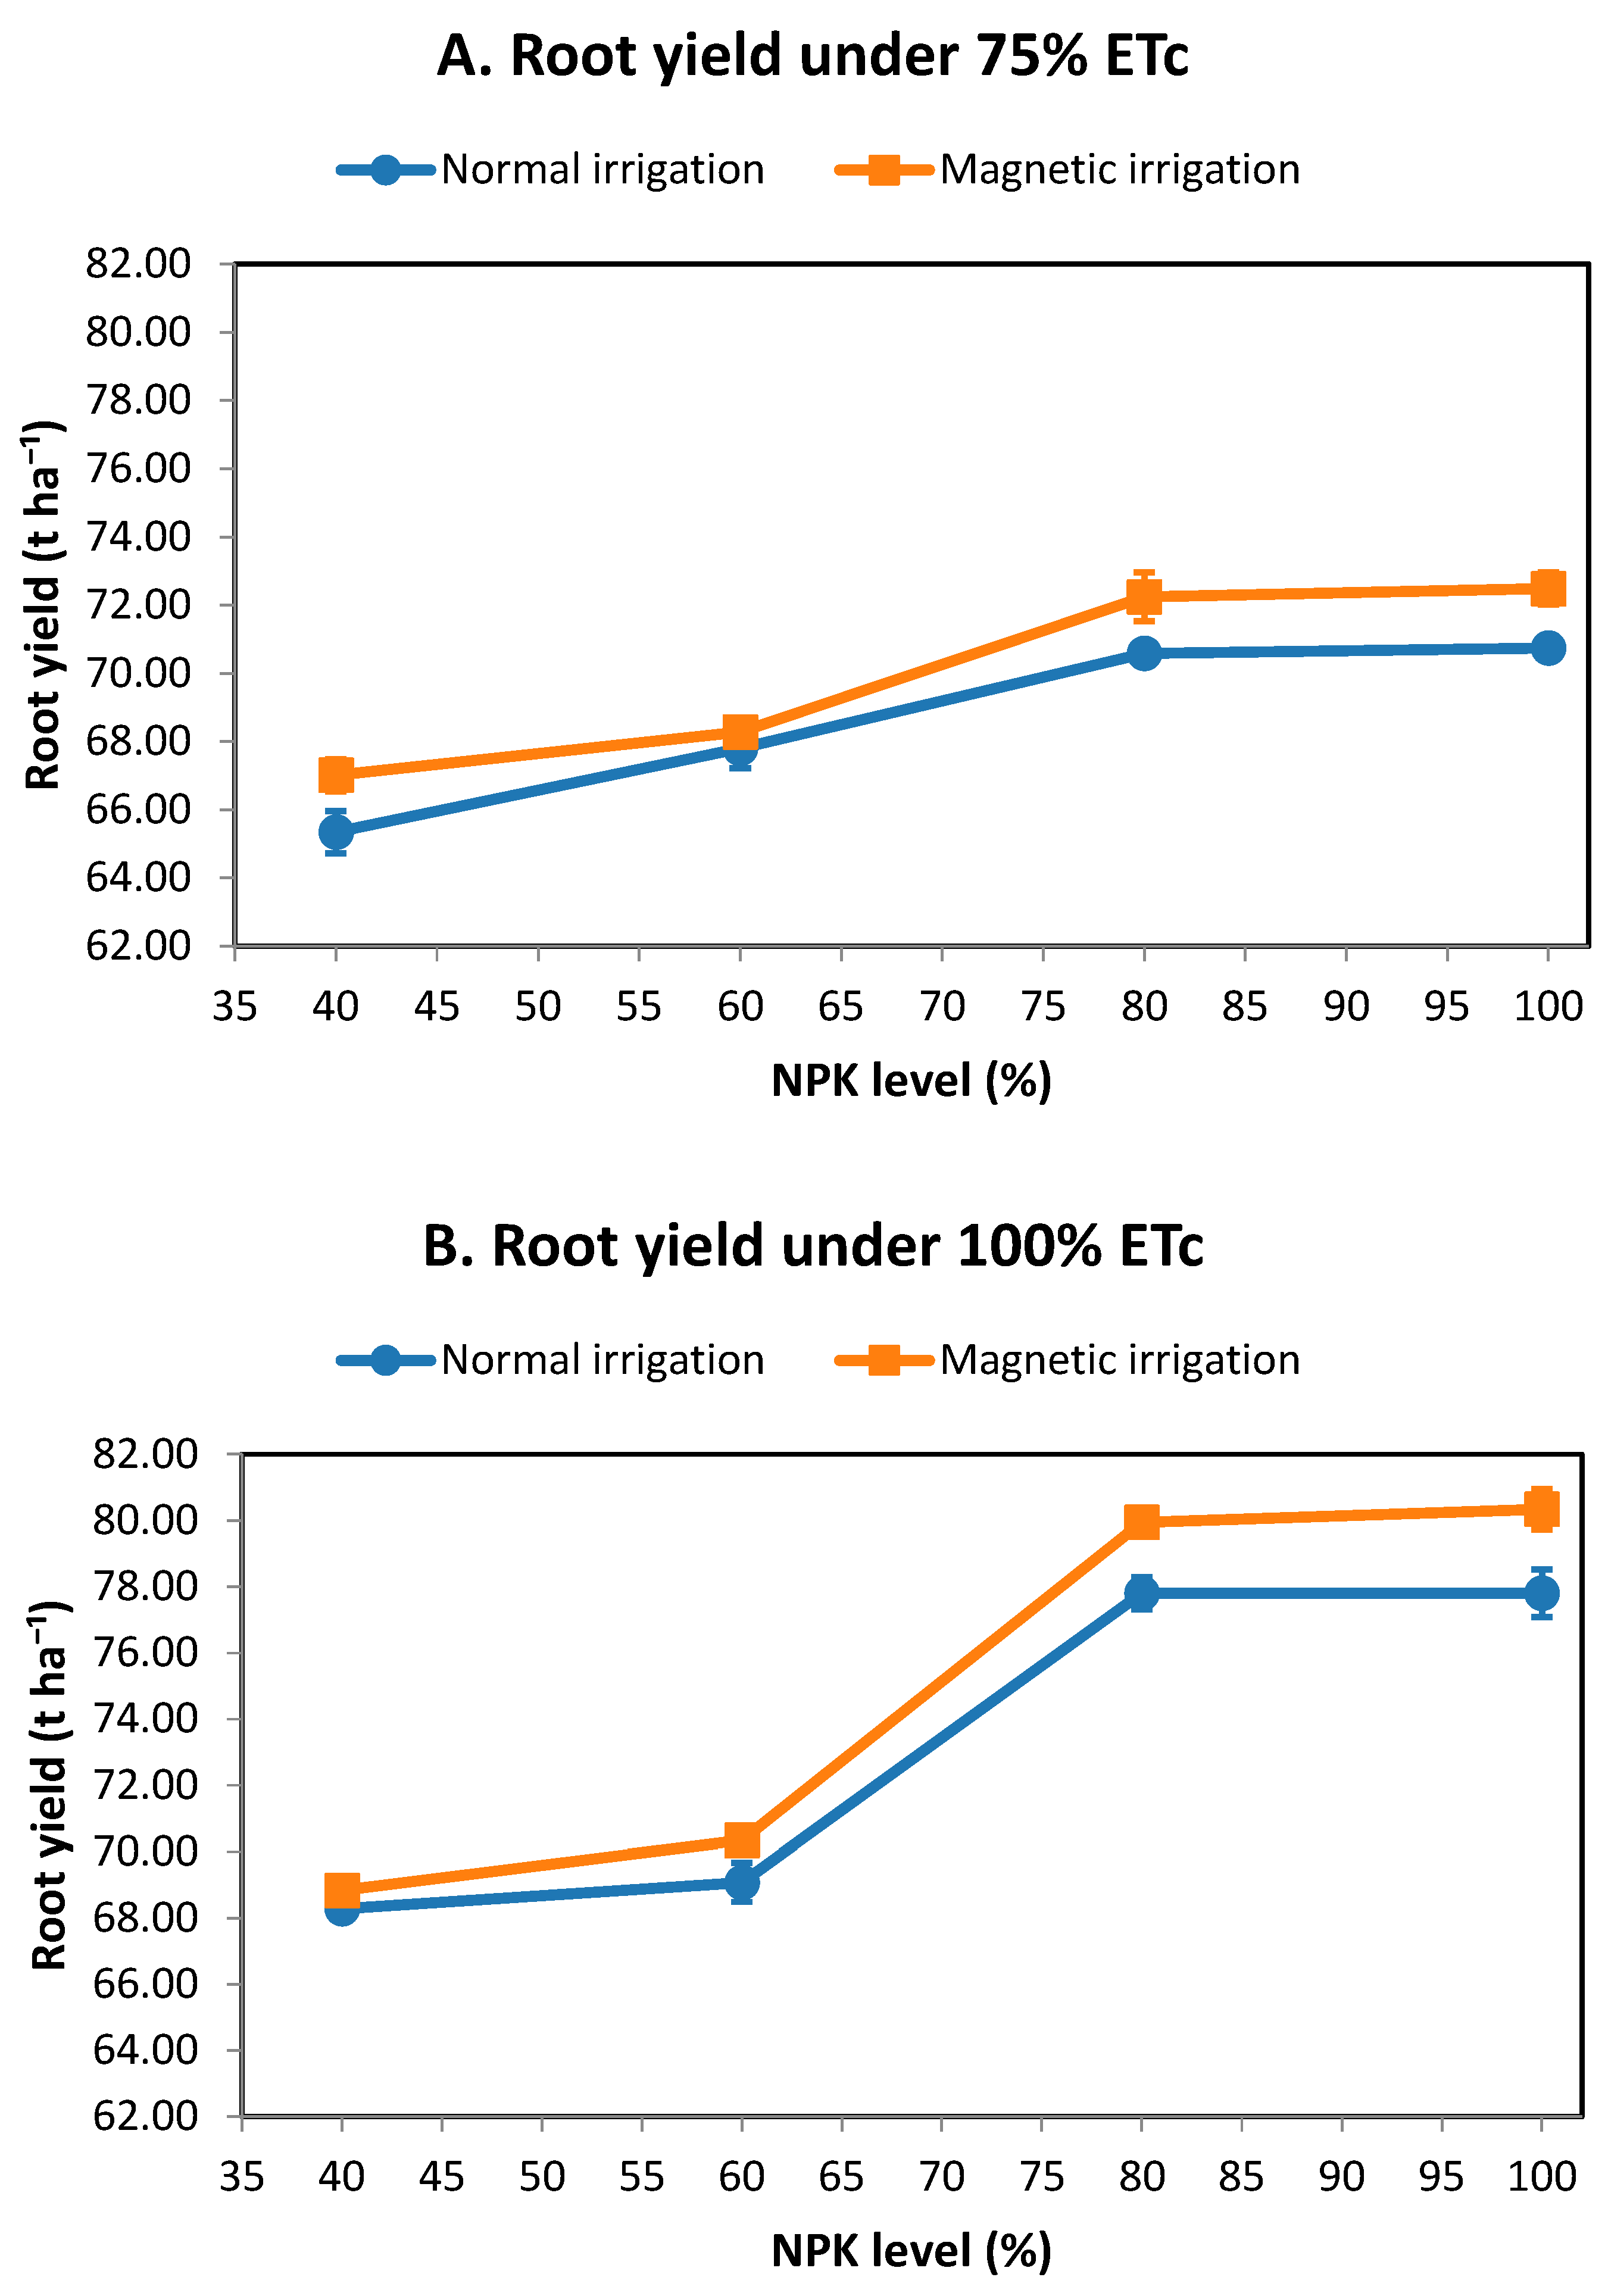
Figure 3 shows the development of sugar beet root yield at different irrigation levels (75% Etc (panel A), 100% ETc (panel B)) in the case of different fertilization levels and the application of normal and magnetized irrigation. The figure shows that for both irrigation levels, the largest decrease in root yield occurred between the 80% and 60% NPK levels, while the difference between the 100% and 80% fertilization levels was moderate. Consistently, for both irrigation levels, the plants treated with magnetized irrigation water achieved higher root yield than the plants treated with normal irrigation water.
3.3. Sugar Yield and Technological Quality
Significant differences were detected in terms of technological quality parameters and sugar yield due to different irrigation systems, irrigation water types and NPK fertilization levels (
p < 0.05). Magnetic irrigation combined with a full water dose (100% ETc) resulted in the highest sugar yield and the most favorable technological quality parameters (
Table 10 and
Table 11).
The development of total soluble solids (TSS), apparent purity and sucrose content values also showed a similar trend. The highest TSS value (25.88) was measured in the combination of magnetic irrigation at 100% ETc and 100% NPK treatment, while the lowest value (22.45) was detected in the normal irrigation, 75% ETc treatment with 40% NPK level.
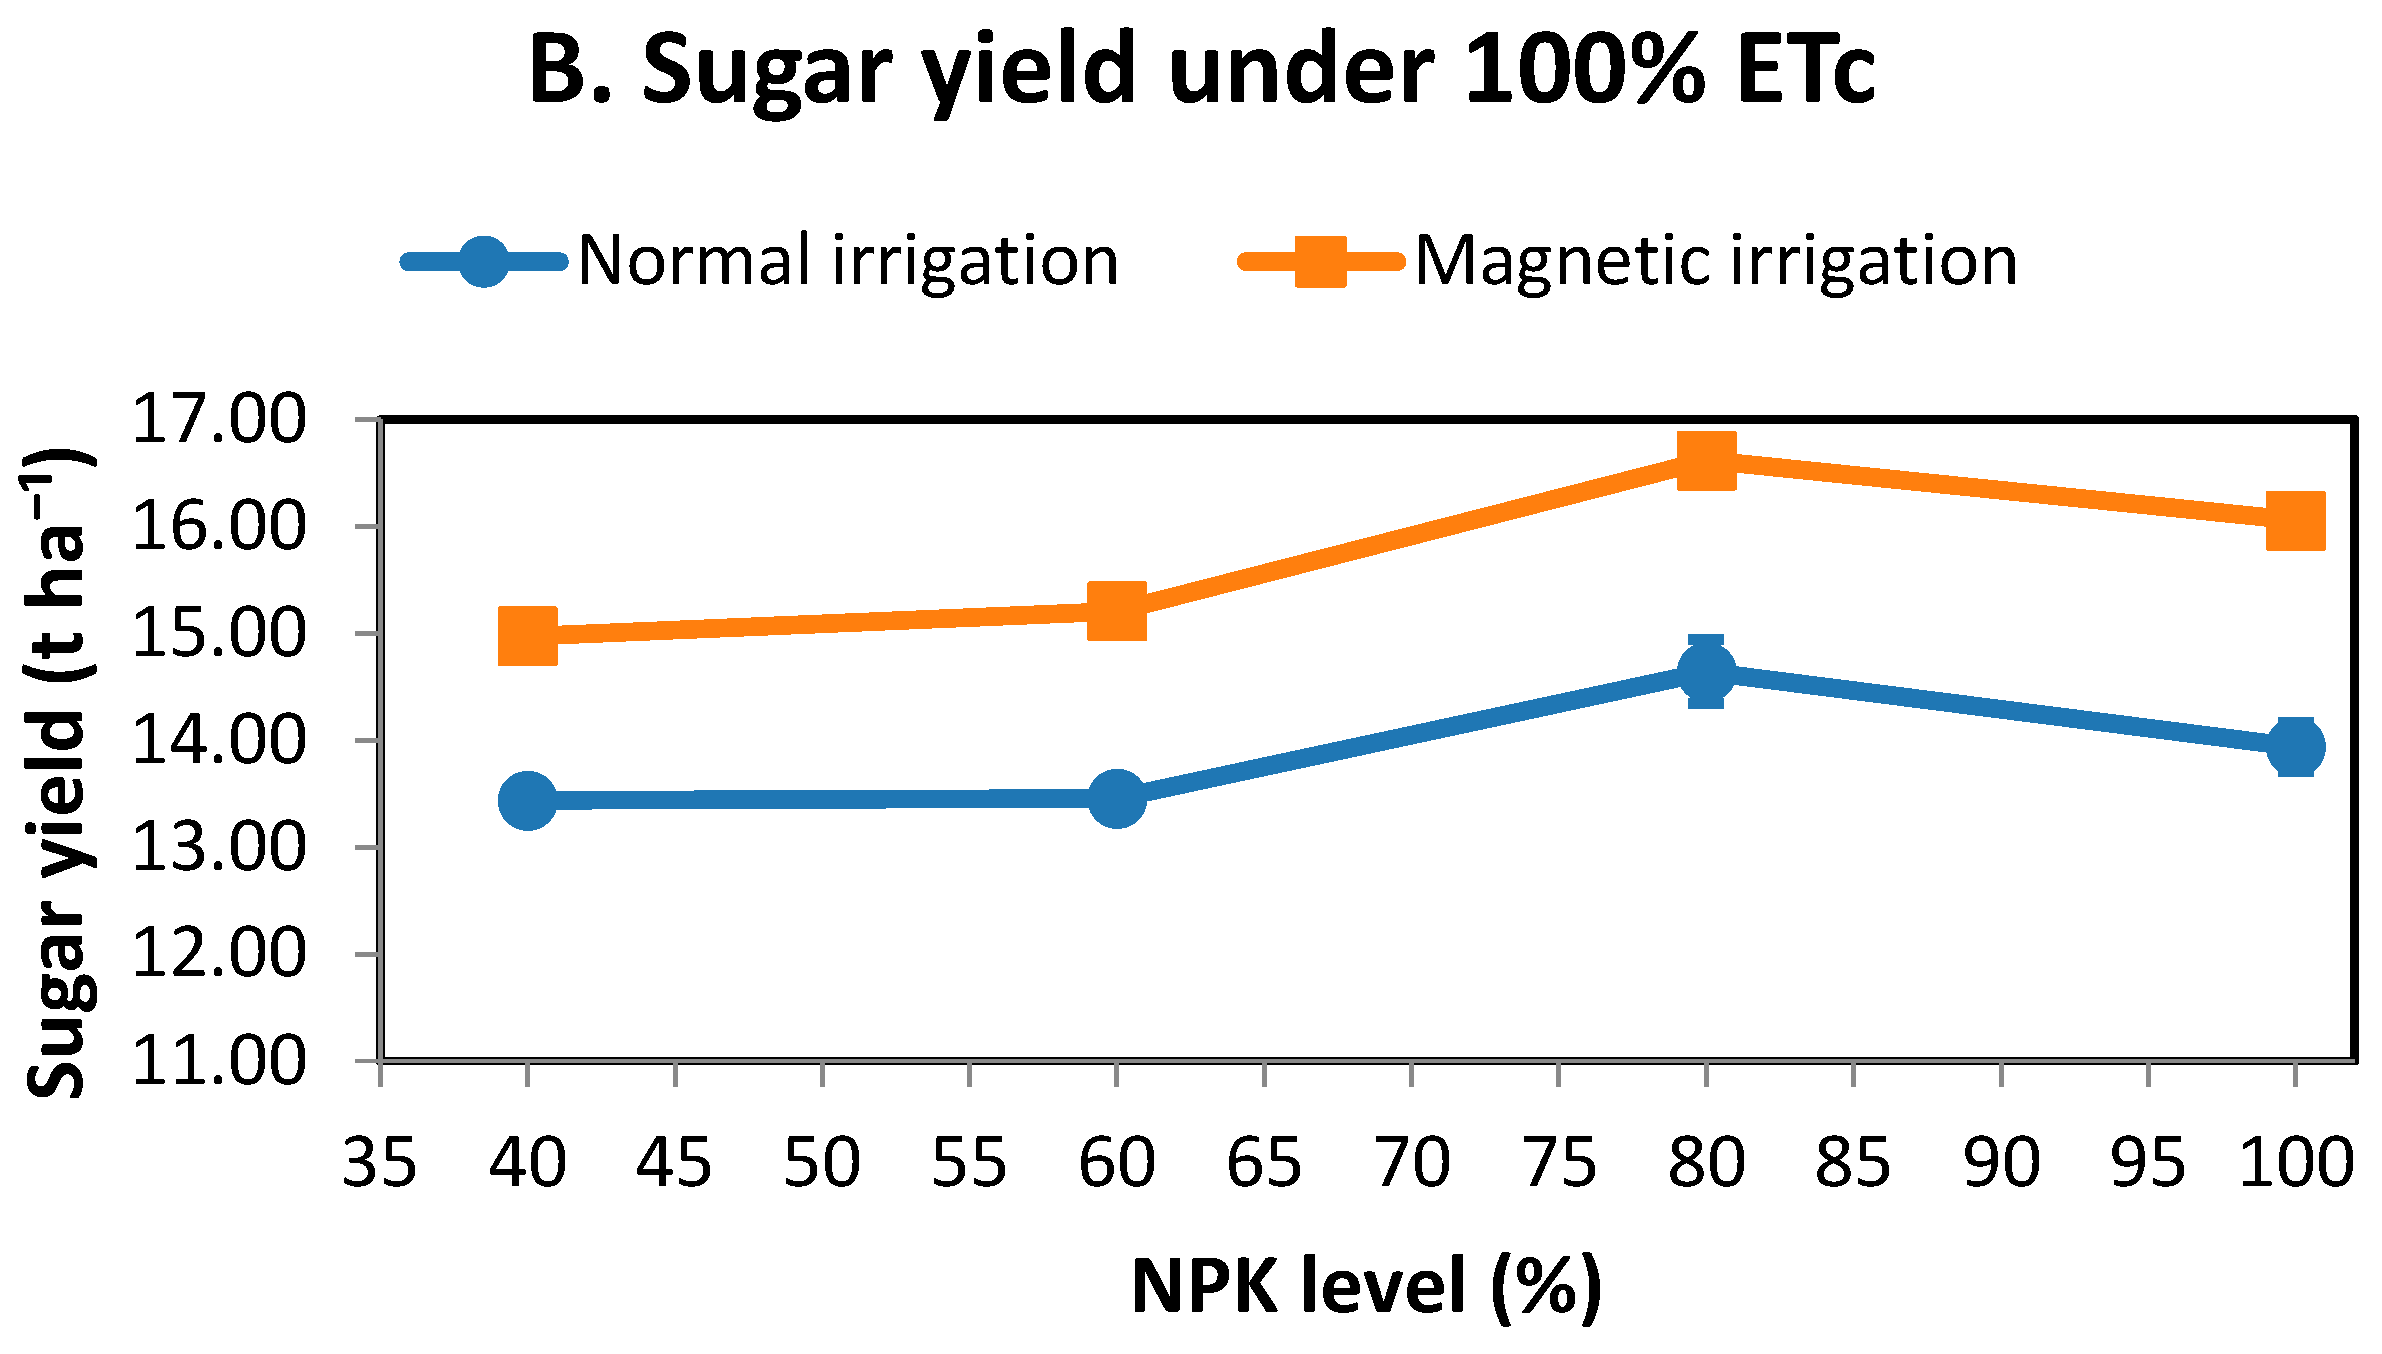
Sugar yield reflected the combined effect of root yield and sucrose accumulation. The highest sugar yield (16.62 t ha−1) was achieved in the combination of magnetic irrigation at 100% ETc and 80% NPK treatment, while the lowest values (11.54 t ha−1) were measured in the normal irrigation, 75% ETc treatments. In most cases, sugar yield was the highest in the 80% NPK level among the treatments, except for the normal irrigation, 75% ETc.
In the case of apparent purity, the highest value (91.19%) was measured in the magnetic irrigation at 100% ETc and 40% NPK treatment, while the lowest value (83.98%) was observed in the normal irrigation, 75% ETc and 100% NPK treatment.
The sucrose content values ranged from 16.31% in the normal irrigation water, 75% ETc and 100% NPK treatments to 21.75% in the magnetic irrigation with 100% ETc and 40% NPK treatments. In general, sucrose concentrations were higher under magnetic irrigation and 100% ETc irrigation conditions, but lower NPK levels resulted in higher values.
The improvement in sucrose content, TSS and apparent purity values due to magnetic irrigation contributed to higher sugar yield, indicating a close relationship between technological quality and yield formation.
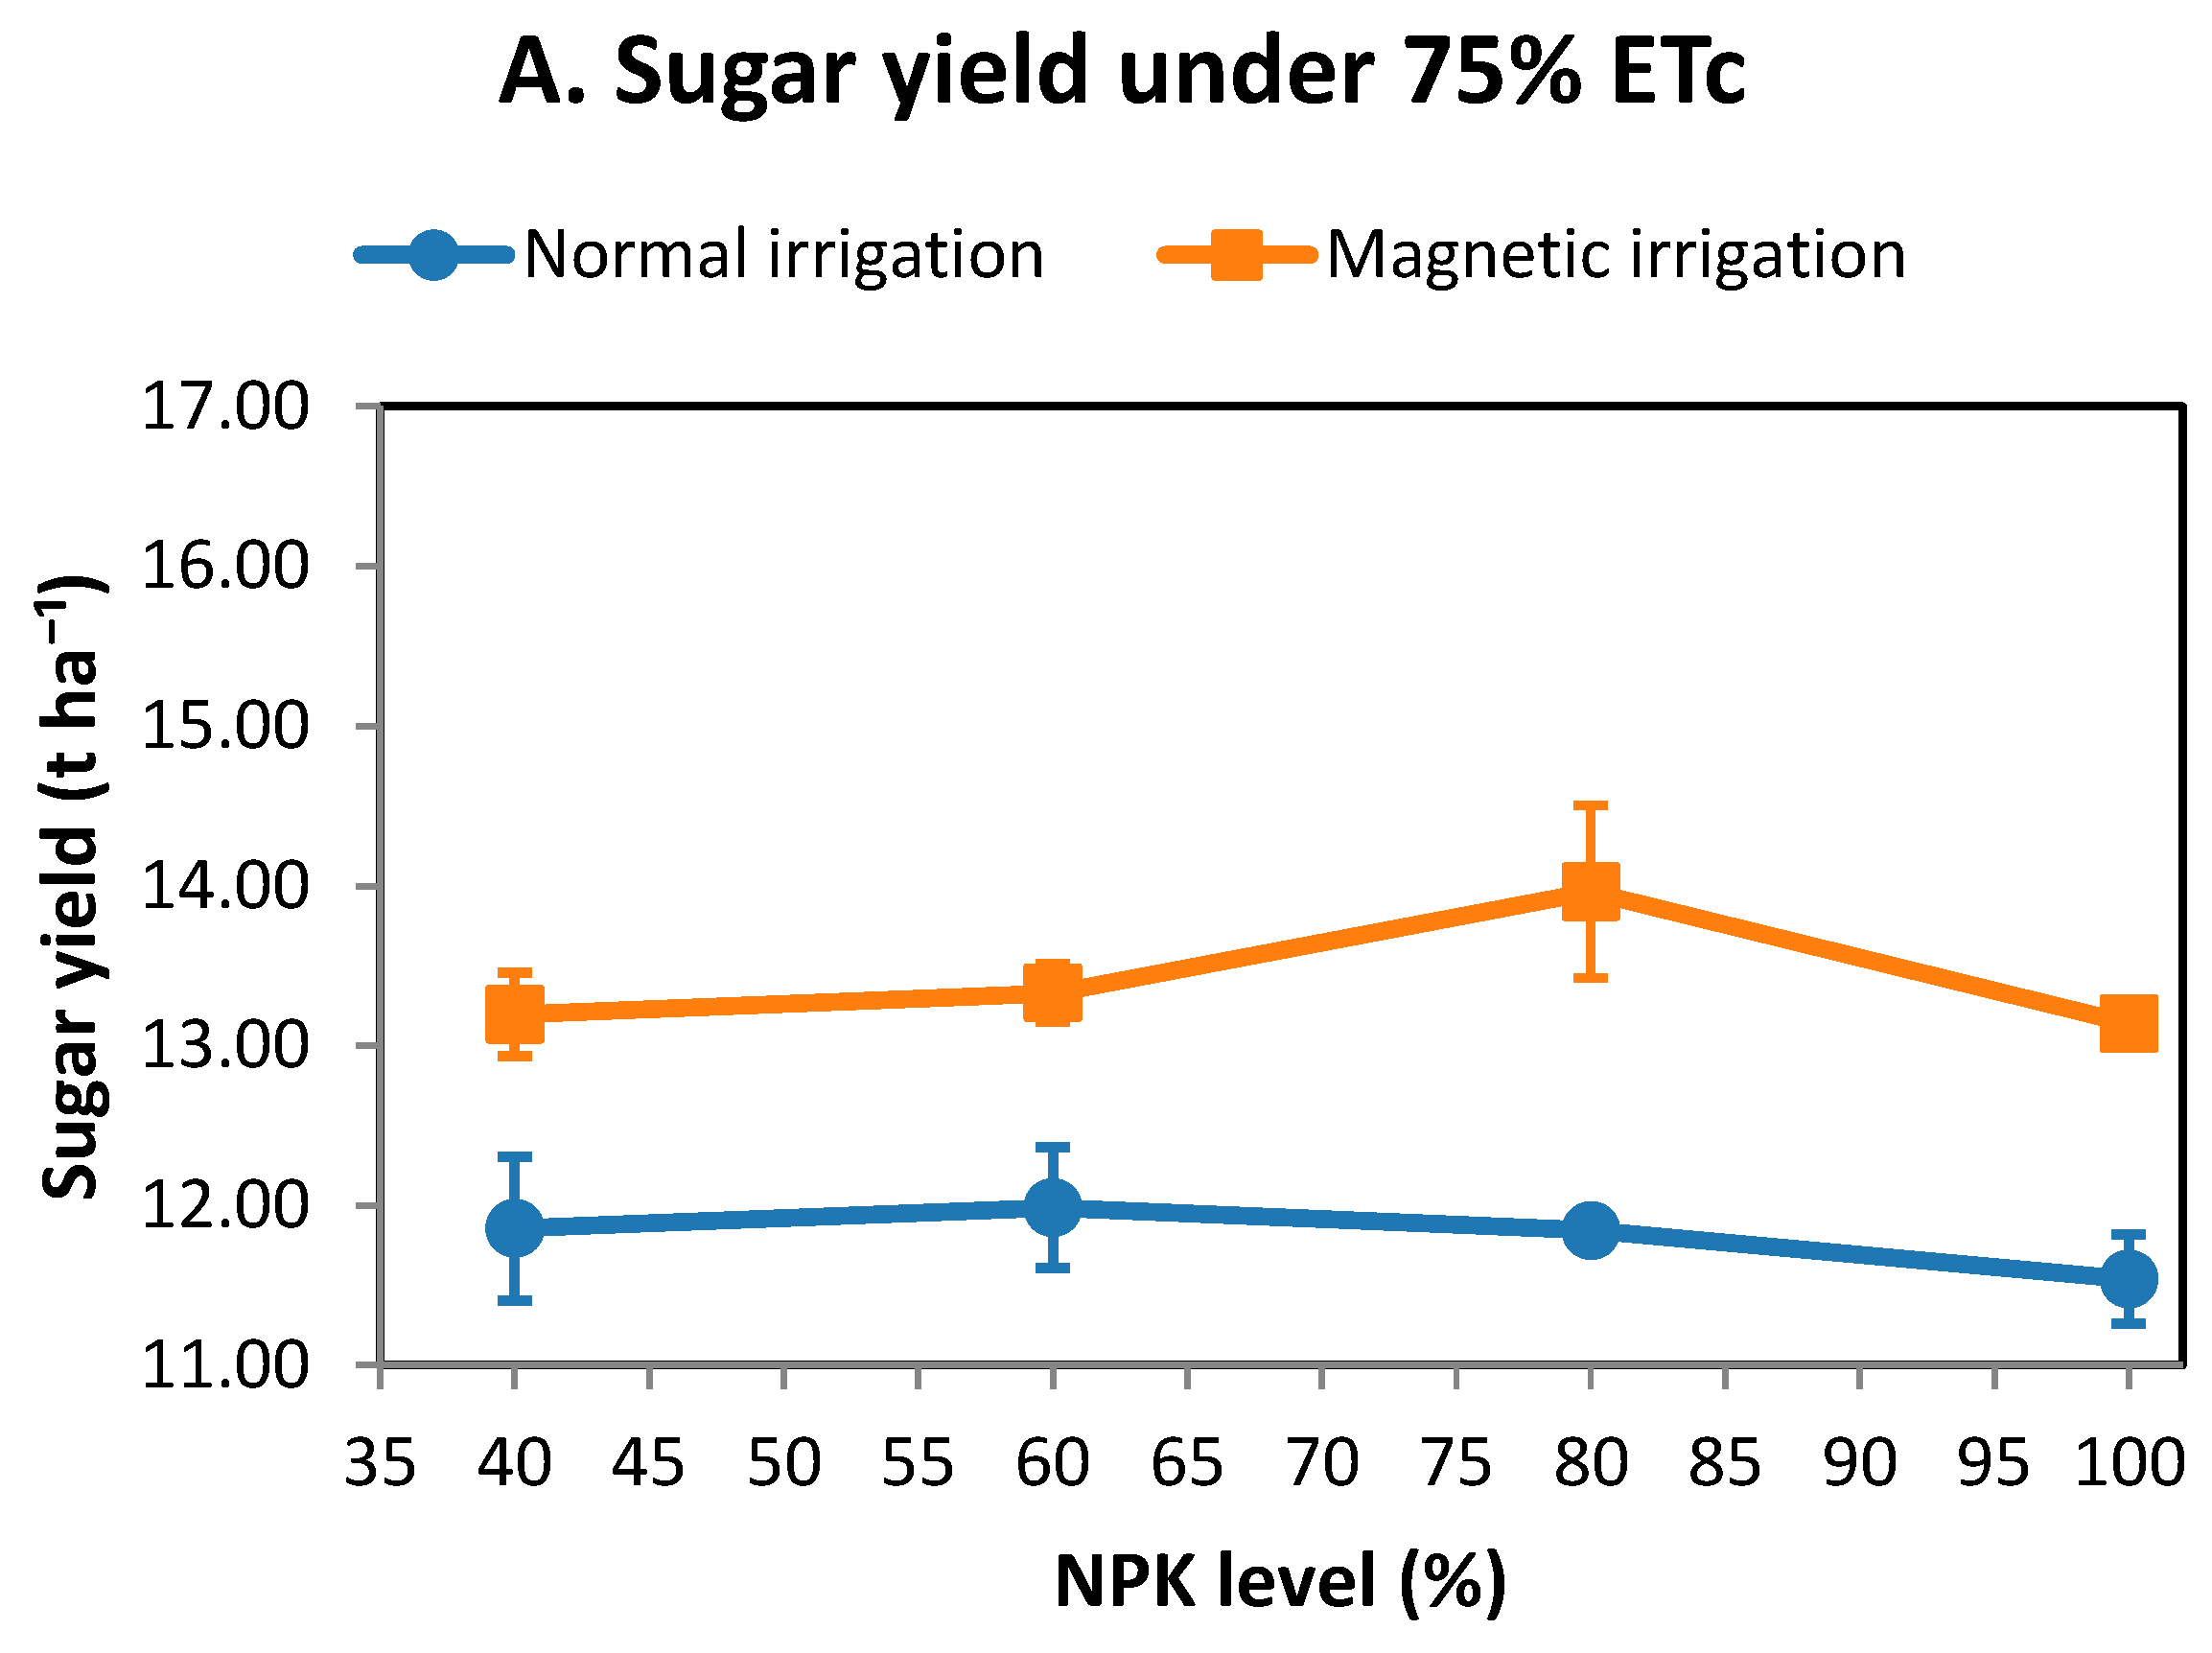
Sugar beet sugar yield was clearly influenced by the irrigation system, fertilization level and irrigation water type (
Figure 4).
The results show that optimal sugar production requires optimization of nutrient supply. The highest sugar yield was observed at the 80% NPK supply level. The 100% NPK level promoted vegetative growth and increased impurity-related constituents, while moderate fertilization maintained a more favorable balance between biomass production and sucrose accumulation.
Magnetic irrigation resulted in higher sugar yield in all cases compared to normal irrigation. In the case of deficit irrigation (75% ETc, panel A), the differences between NPK levels were less pronounced, and the reduced water supply reduced the plant’s nutrient response. In contrast, under full irrigation (100% ETc, panel B), the response to fertilization was stronger, with a clearly observable maximum at the 80% NPK level.
The development of sugar yield followed a similar trend to that of root yield, but a more pronounced optimum was observed at 80% NPK fertilizer levels, highlighting the importance of balancing biomass production and sucrose accumulation.
3.4. Impurity-Related Parameters
Significant differences were observed for the impurity-related parameters among the treatments (p < 0.05). Magnetic irrigation and reduced fertilization levels resulted in lower impurity concentrations and improved processing quality.
Alpha-amino nitrogen and total nitrogen content showed a clear decreasing trend with decreasing NPK levels and were significantly lower in the case of magnetic irrigation compared to normal irrigation (
Table 11 and
Table 12). The highest alpha-amino nitrogen value (4.997 mmol 100 g
−1 sugar) was detected under normal irrigation, 75% ETc and 100% NPK, while the lowest value (1.213 mmol 100 g
−1 sugar) was measured under magnetic irrigation, 100% ETc and 40% NPK level. A similar trend was observed for nitrogen content, with maximum values observed with high fertilization and normal irrigation, and minimum values observed with a combination of magnetic irrigation and reduced NPK level.
The amounts of mineral impurity components (P, K and Na) followed similar trends (
Table 12 and
Table 13) to those observed for the alpha-amino nitrogen and nitrogen contents. Potassium and sodium contents were generally higher under normal irrigation and higher fertilization levels. Magnetic irrigation and reduced NPK fertilization levels resulted in lower concentrations. Sodium contents ranged from 3.703 to 1.723 mg 100 g
−1 sugar, with the lowest values measured under magnetic irrigation at 100% ETc and 40% NPK. Phosphorus contents also decreased with decreasing fertilization doses and were lowest under magnetic irrigation treatments.
The molasses sugar values, alkalinity coefficient values and impurity values were significantly influenced by the treatments applied (
p < 0.05). Based on the results, magnetic irrigation generally resulted in a more favorable technological quality, which was also supported by the lower impurity value and molasses sugar values (
Table 14).
Molasses sugar content decreased in all treatments with the reduction in NPK levels. The highest percentage of molasses sugar was recorded in the 100% NPK treatments (2.270 and 2.263%). In contrast, the 40% NPK treatments had the lowest percentage of molasses sugar (1.641–1.669%). Magnetic irrigation had a moderate effect on reducing the amount of molasses sugar compared to non-magnetic irrigation methods, and an increase in the amount of irrigation resulted in decreased percentages of molasses sugar in both irrigation methods.
Increasing the amount of NPK (nitrogen, phosphorus and potassium) fertilizer from 80% to 100% caused a marked physiological trade-off among root yield, concentration of sucrose and build up of impurities in the roots. The maximum nutrient application (100% NPK) was associated with vegetative growth, and raw physical biomass was significantly influenced by higher root yields, but on the other hand, the high level of fertilization influenced the cells in the roots and reduced total concentration of sucrose through dilution. In addition, the increased fertilization caused excessive consumption of nutrients, which contributed to the increased concentration of processing impurities, but also a high abundance of α-amino nitrogen, potassium and sodium were found to be present in root juice following the application of 100% NPK. As non-sugar impurities are extremely volatile the products of these impurities counteract crystallization and thus aid in causing non-crystallization of the sucrose during commercial processing of extracted sugar leading to lower net sugar yields as compared to the optimized or recommended maximum sugar yield of 80% NPK.
However, the alkalinity coefficient showed an increasing trend with decreasing NPK levels, especially in the case of magnetic irrigation. The highest value (4.467) was detected in the combination of magnetic irrigation with 100% ETc and 40% NPK, while the lowest value (0.531) occurred in the normal irrigation, 75% ETc and 100% NPK treatment, with the alkalinity coefficient level being significantly lower in the case of normal irrigation water.
In the case of impurity value, a decreasing trend was observed with both magnetic irrigation and decreasing NPK doses. Among all treatments, the normal irrigation treatment group had the highest impurity values (58.32) in comparison to magnetic irrigation with 100% ETc and 60% NPK (27.94). Importantly, magnetic irrigation produced consistently lower impurity values than all other treatment groups of normal irrigation regardless of NPK levels as well; therefore, magnetic irrigation with 100% ETc produced significantly lower impurity values as well when compared to normal irrigation.
The results indicate that reduced fertilization and using magnetic irrigation enhances beet quality through decreasing impurity parameters and improving processing efficiency. These findings illustrate that an integrative approach to managing water/nutrients will maximize both yield and technological quality of sugar beets.
3.5. Water Relations (ETa, ETo, Kc, and WUE)
The effect of irrigation and fertilization on water relationships has been considerable, as well as the effect of irrigation on actual evapotranspiration (ETa), which was moderately variable within treatments but generally higher under full irrigation (100% ETc) than under deficit irrigation (75% ETc).
The highest average ETa (41.05) was recorded under magnetic irrigation at 100% ETc, while the lowest value (39.65) occurred under normal irrigation at 75% ETc. Across NPK levels, ETa showed a slight decreasing trend with reduced fertilization, ranging from 41.60 at 100% NPK to 38.80 at 40% NPK (
Table 15).
The monthly distribution of water consumptive use (ETa) followed a clear seasonal pattern across all treatments (
Table 16). Water use was lowest during the early growth stage in November (2.6 mm) and gradually increased with crop development, reaching maximum values during the late growth period in April–May (up to 8.0–9.9 mm), reflecting increased canopy development and evaporative demand.
After January, the contrasts between the various irrigation styles (full—100% ETc vs. deficit—75% ETc) became stronger as time passed. Specifically, in March to May (the peak growth phase), the ETa was significantly higher with full irrigation (100% ETc), thereby confirming that the supply of water is the most important factor in determining the amount of crop water consumed.
Under full irrigation (100% ETc), magnetic irrigation was marginally higher than with normal irrigation but this effect was particularly noticeable in later stages of crop growth, when magnetic irrigation (100% ETc) produced the largest monthly ETa value (improved plant water uptake and transpiration activity).
There was a trend for reduced fertilization to result in declining monthly ETa across NPK levels, particularly with deficit irrigation, but these reductions were minimal relative to the influence of the irrigation regime, indicating that water supply has a larger effect on the total amount of crop water consumed in the season than N supply.
These findings follow closely the estimated seasonal Kc dynamic, thereby confirming the consistency of the water balance calculations.
Monthly measurements of actual evapotranspiration (ETa), reference evapotranspiration (ETo), and crop coefficient (Kc) combined the influence of climate on the crops and their development throughout the growing season (
Table 17). ETa progressively increased from its initial value during the early development phase (0.8 mm/day in November) through its maximum value during the active growth phase in May (4.0 mm/day), which indicates an increase in the amount of water plants need for expanding their canopies and producing biomass.
There is a similar temporal pattern exhibited by reference evapotranspiration (ETo) from November where it had the lowest amount with 1.6 mm/day; this increased to its highest value of 5.6 mm/day in May, when the maximum value occurs due to the increasing amount of water that the atmosphere can evaporate according to the temperature and humidity levels and other factors extending from these two causes. Therefore, crop water utilization exhibits strong climatic control from both ETo and ETa over this time period.
The value of the crop coefficient (Kc) demonstrated a clear temporal variation, increasing from 0.50 in the month of November to a peak of 1.14 in January, then declining gradually through the remainder of the growing season (final value of 0.71). The peak value of Kc occurs during mid-season while there is the greatest development of the canopy and highest transpiration activity, while the decline following mid-season development corresponds to low physiological activity and the beginning of the maturation process.
ETa, ETo, and Kc show that both atmospheric demand and crop development stage have influenced the amount of water consumed by crops at any given time. There is also evidence from comparing the Kc dynamics to the seasonal pattern of ETa to support the accuracy of the calculations used to develop the water balance.
While ETa describes the magnitude and temporal dynamics of water use, WUE reflects how effectively this water is converted into yield.
Water use efficiency (WUE) combines how much water is used and how much yield is produced (
Table 18). Although ETa showed only limited variability among the treatments, yield variability resulted in measurable differences in WUE.
Compared to deficit irrigation (75% ETc), WUE was higher under full irrigation (100% ETc), indicating that increased water availability is proportionally correlated to increased yield. Magnetized irrigation slightly increased the WUE as compared to standard irrigation under both levels of irrigation (full and deficit), illustrating that magnetized irrigation positively affects yield “without” significantly increasing the amount of water used.
The study revealed that all treatments were significantly different from each other, as reflected in the mean measurements across all replications. Magnetized water treatment (MWT) exhibited a distinct positive main effect, moderately increasing WUE under both full and deficit irrigation regimes. Because MWT physical changes (reduced surface tension and increased molecular mobility) enhance tissue-level nutrient assimilation and root development without altering the actual volumetric crop water consumption (ETa), it consistently optimized water productivity. Regarding nutrient application, an intermediate optimization point was identified: maximizing NPK to 100% did not yield the highest water efficiency due to excessive tissue hydration and late-season vegetative bias. Instead, the main effect of NPK showed that restricting inputs to 80% NPK achieved the peak standalone WUE of 18.38 kg m−3 1.21 over 100% NPK and 5.51 over 40% NPK). Furthermore, a significant interaction between irrigation water type (normal vs. magnetized), irrigation levels (100 and 75% ETc) combined into four irrigation treatments, and NPK fertilization levels was confirmed (p < 0.05). While cutting fertilizer to 60% or 40% NPK caused a severe crop biomass collapse that sharply degraded WUE across all environments, pairing an 80% NPK dose with magnetized irrigation water at 100% ETc acted as a prominent efficiency multiplier, yielding optimal raw root tonnage alongside highly stabilized moisture extraction dynamics.
Thus, it can be concluded that magnetized water can improve WUE; however, greater increases will occur when levels of nutrient fertilizers are applied at much lower levels than normal use due to the reduced volume of water required because of the increased ability of the root system to absorb air and moisture from the soil. In summary, WUE remains largely affected by irrigation regime; magnetized irrigation can improve efficiencies in terms of increased yields with a limited amount of water.
4. Discussion
The present study demonstrated that sugar beet performance was strongly influenced by the combined effects of magnetized water treatment (MWT), irrigation level, and NPK fertilization rather than by any single management factor alone. Across most measured parameters, MWT consistently improved vegetative growth, yield formation, and technological quality, while the crop response to fertilization depended on water supply, particularly with respect to sugar yield and processing quality. The observed responses appear to reflect the combined contribution of enhanced canopy development, improved root growth, more efficient utilization of available water and nutrients, and a more favorable balance between sucrose accumulation and impurity formation. Importantly, the results suggest that reducing fertilizer input to 80% of the recommended NPK rate maintained productivity while improving sugar quality, indicating that optimizing the interaction between water supply and nutrient availability may be more beneficial than maximizing fertilizer inputs. However, it is important to distinguish between responses directly measured in this study—including SPAD value, leaf area, root traits, yield, sugar content, impurity parameters, and water use efficiency—and the physicochemical mechanisms proposed to explain the effects of MWT. Mechanistic explanations related to changes in water structure, nutrient mobility, root uptake, or salinity mitigation were not directly investigated in the present experiment and therefore should be regarded as hypotheses supported by previous studies rather than mechanisms demonstrated by the present data.
4.1. Growth Response and Physiological Background
The coordinated improvement in chlorophyll content, leaf area, crop growth rate, relative growth rate, and root morphology observed under magnetized water treatment (MWT) indicates that MWT promoted overall plant vigor rather than affecting a single physiological trait. The most pronounced responses were observed for root morphology, where the combination of magnetized irrigation, full irrigation (100% ETc), and the recommended NPK rate increased root length and root diameter by approximately 36% and 40%, respectively, relative to the regional baseline management. Rather than representing isolated improvements, these responses suggest a coordinated enhancement of aboveground and belowground growth, ultimately supporting greater biomass accumulation and subsequent yield formation.
The simultaneous improvement in canopy development and root architecture may reflect a more efficient acquisition and utilization of available resources throughout the growing season. Increased chlorophyll content and leaf area generally enhance light interception and photosynthetic capacity, while a larger and better-developed root system may improve access to soil water and nutrients, thereby supporting sustained crop growth. Similar responses have previously been reported in sugar beet irrigated with magnetized water. Hozayn et al. [
15] observed increases in chlorophyll content, leaf area and vegetative growth, whereas Faiyad and Hozayn [
18] reported greater root length and root diameter under MWT. Collectively, these findings suggest that magnetized irrigation may stimulate coordinated whole-plant development rather than improving only individual growth characteristics.
Several hypotheses have been proposed to explain the beneficial effects of MWT. Previous studies suggested that magnetized water may alter certain physicochemical properties of irrigation water, potentially improving nutrient availability and reducing the adverse effects of salinity through changes in water behavior and ion mobility [
27,
49,
50]. However, these mechanisms remain incompletely understood and continue to be debated. Importantly, none of these physicochemical processes were directly evaluated in the present study. Consequently, the observed improvements in vegetative growth should primarily be interpreted as agronomic responses that are consistent with previously proposed mechanisms rather than as direct evidence confirming changes in water structure, nutrient mobility, root membrane transport, or salinity mitigation.
The positive response to increasing NPK fertilization was also physiologically consistent with the complementary functions of the three major macronutrients. Nitrogen promotes chlorophyll synthesis, leaf expansion and photosynthetic activity [
20,
51], phosphorus plays a fundamental role in photosynthesis, energy transfer, assimilate transport and metabolic regulation [
28], whereas potassium regulates enzyme activity, osmotic adjustment, carbohydrate metabolism and sucrose transport while also improving nitrogen use efficiency [
29,
30,
33]. Nevertheless, the relatively small differences observed between the 80% and 100% NPK treatments indicate that maximum vegetative growth did not necessarily require maximum fertilizer input. This finding suggests that optimizing the interaction between irrigation management and nutrient supply may be more effective than simply increasing fertilizer application and provides the physiological basis for the yield and quality responses discussed in the following sections.
4.2. Yield Formation and Fertilizer Optimization
Yield formation reflected the integrated effects of water availability, nutrient supply, and the improved vegetative performance discussed in the previous section. The consistently greater root fresh weight, root yield, and top yield obtained under magnetized irrigation indicate that the enhanced canopy development and root growth translated into greater biomass production. Similar improvements in sugar beet yield under magnetized irrigation have been reported previously by Hozayn et al. [
15] and Faiyad and Hozayn [
18], suggesting that the positive effect of MWT on crop productivity is reproducible under field conditions.
A key finding of the present study was that yield did not respond linearly to increasing fertilizer input. Although the highest biomass production was generally obtained with full fertilization, the differences between the 80% and 100% NPK treatments were minimal, whereas a pronounced decline occurred when fertilizer application was reduced to 60% or 40% of the recommended rate. This indicates that the agronomic optimum was reached before maximum fertilizer input was applied. Such a response suggests that sugar beet productivity depends more on achieving a balanced interaction between water supply and nutrient availability than on maximizing fertilizer application alone.
The beneficial effect of NPK fertilization on yield is consistent with the complementary physiological functions of the three macronutrients. Nitrogen promotes assimilate production and the translocation of photosynthates towards developing storage roots, thereby enhancing dry matter accumulation [
52]. Zalat and Youssef [
53] likewise reported that increasing nitrogen supply significantly affected nutrient accumulation in sugar beet roots. Furthermore, nitrogen and potassium are recognized as major determinants of sugar beet yield and technological quality [
31,
32], while phosphorus contributes to biomass production through its role in energy transfer and carbon metabolism [
34].
From a practical perspective, the limited yield difference between the 80% and 100% NPK treatments has important agronomic implications. Maintaining comparable yield with a 20% reduction in fertilizer input could decrease fertilizer costs while reducing the environmental risks associated with excessive nutrient application. However, the marked decline observed at 60% and 40% NPK indicates that fertilizer reduction below the agronomic optimum cannot be compensated for by magnetized irrigation alone. Therefore, the results suggest that MWT should be considered as a complementary management practice that improves resource-use efficiency rather than as a substitute for balanced nutrient supply. This interpretation is consistent with the conclusions of Faiyad and Hozayn [
18], who also emphasized the importance of optimizing fertilizer management when magnetized irrigation is applied.
4.3. Technological Quality, Impurity Accumulation and Processing Implications
Technological quality reflected the balance between biomass production, sucrose accumulation, and impurity formation rather than simply following the trends observed for root yield. Although magnetized irrigation consistently improved both yield and quality parameters, the highest sugar yield was achieved at the 80% NPK level rather than under full fertilization. This demonstrates that maximizing root biomass does not necessarily maximize recoverable sugar production, highlighting the importance of balancing biomass formation with sucrose accumulation and technological quality.
The simultaneous increase in sucrose concentration, apparent purity, and total soluble solids under magnetized irrigation suggests that MWT favored assimilate partitioning towards economically valuable storage compounds while maintaining high biomass production. Similar improvements in sucrose concentration and extractable sugar under magnetized irrigation have previously been reported by Hozayn et al. [
15]. In the present study, however, the improvement in technological quality was not associated solely with higher sucrose concentration, but also with a more favorable impurity profile. Consequently, relatively small differences in root biomass between the 80% and 100% NPK treatments resulted in greater differences in sugar yield and recoverable sugar, emphasizing that processing quality is determined by both sucrose concentration and impurity composition.
The contrasting responses of biomass production and technological quality to increasing fertilizer input indicate a physiological trade-off between vegetative growth and sugar quality. Although higher NPK levels promoted root biomass production, they also increased the accumulation of α-amino nitrogen, phosphorus, potassium, sodium, and molasses-forming compounds. Consequently, the quality of the harvested roots declined despite the greater biomass production. These findings explain why the agronomic optimum for root yield did not coincide with the technological optimum for sugar production.
The detrimental effect of excessive nitrogen supply on sugar quality has been widely documented. Higher nitrogen availability promotes the accumulation of α-amino compounds and other non-sugar constituents that reduce the proportion of crystallizable sugar and increase sugar losses to molasses during industrial processing [
24]. Excessive nitrogen supply may also increase root water content, thereby diluting sucrose concentration. Similar relationships were described by Abdel-Motagally and Attia [
51], who associated reduced sucrose concentration with increased cation accumulation, whereas Nemeata Alla [
54] reported improved sucrose concentration under reduced nitrogen fertilization.
The reduction in impurity-related parameters observed under magnetized irrigation and moderate NPK application further supports this interpretation. Lower concentrations of α-amino nitrogen, potassium, sodium, and molasses sugar were accompanied by higher apparent purity, indicating improved processing quality. In agreement with Faiyad and Hozayn [
18], the present results demonstrate that optimizing fertilizer input not only improves crop performance but also enhances processing efficiency by reducing impurity accumulation and increasing the proportion of recoverable sugar.
From an industrial perspective, these findings have important practical implications. While growers often focus primarily on maximizing root yield, sugar factories benefit from maximizing recoverable sugar yield and processing efficiency. The combination of relatively high root yield, increased apparent purity, reduced impurity concentrations, and lower molasses sugar observed at the 80% NPK level suggests that moderate fertilizer optimization may simultaneously improve processing efficiency, reduce sugar losses during extraction, and increase the economic value of sugar beet production. Therefore, technological quality should be considered together with agronomic productivity when defining optimal fertilizer management strategies.
4.4. Water Relations and Efficiency
Water relations were influenced primarily by irrigation regime rather than by magnetized water treatment (MWT). The higher seasonal actual evapotranspiration (ETa) observed under full irrigation reflected greater water availability and increased crop demand during the period of maximum canopy development. Likewise, the seasonal dynamics of ETa closely followed crop development, with the highest values occurring during the active growth stage, indicating that crop water consumption was largely determined by plant developmental stage and irrigation regime.
Although magnetized irrigation had only a limited effect on seasonal ETa, it consistently resulted in slightly higher water use efficiency (WUE) under both irrigation regimes. This suggests that the improvement in WUE was achieved primarily through increased biomass production and yield rather than through a reduction in crop water consumption. In other words, MWT appeared to improve water productivity instead of substantially altering the amount of water consumed by the crop.
These findings indicate that irrigation levels remained the dominant factor controlling crop water use, whereas MWT acted as a complementary management practice that modestly enhanced the efficiency with which available water was converted into yield. Similar improvements in WUE under magnetized irrigation have been reported previously for sugar beet by Hozayn et al. [
55], while comparable responses have also been observed in other crops, including strawberry, banana, and orange [
56,
57,
58]. Nevertheless, the magnitude of these responses has varied considerably among studies, suggesting that the effectiveness of MWT is influenced by crop species, environmental conditions, and irrigation management.
Since the present study did not directly investigate the physiological mechanisms responsible for the observed improvement in WUE, it cannot be concluded whether the response resulted from changes in plant water relations, nutrient utilization, or other physiological processes. Instead, the present results provide agronomic evidence that MWT can slightly improve water productivity under the experimental conditions without substantially affecting seasonal crop water consumption.
4.5. Implications for Sustainable Sugar Beet Production
The present results demonstrate that sustainable sugar beet production should not be interpreted simply as maximizing biomass production but rather as optimizing the balance between yield, technological quality, and resource use efficiency. Under the experimental conditions, reducing fertilizer input to 80% of the recommended NPK rate maintained root yield close to that obtained with full fertilization while improving sugar yield, reducing impurity accumulation, and enhancing processing quality. These findings indicate that moderate fertilizer optimization can improve production efficiency without compromising crop performance.
From an agronomic perspective, the ability to maintain high productivity with reduced fertilizer input offers several potential advantages. Lower fertilizer application may reduce production costs while decreasing the environmental risks associated with excessive nutrient inputs, including nutrient losses and unnecessary resource consumption. At the same time, improved technological quality increased the proportion of recoverable sugar, providing additional economic benefits for the sugar industry beyond root yield alone.
Although magnetized irrigation only marginally improved water use efficiency, it consistently enhanced crop performance across most measured parameters without substantially increasing seasonal crop water consumption. Consequently, MWT should not be considered a replacement for optimized irrigation or balanced fertilization but rather as a complementary management practice that may contribute to improving overall production efficiency when integrated with appropriate irrigation scheduling and nutrient management. Future multi-year and multi-location studies will be required to determine the consistency of these benefits under a wider range of environmental conditions.
4.6. Study Limitations
Although the present study provides valuable evidence regarding the combined effects of magnetized water treatment, irrigation regime, and NPK fertilization on sugar beet growth, yield formation, technological quality, and water use efficiency, several limitations should be considered when interpreting the results.
First, the experiment was conducted during a single growing season (2023/2024), at one experimental site, and with a single sugar beet cultivar. Consequently, the observed responses may have been influenced by the specific environmental conditions of the study area. Multi-year, multi-location experiments including different sugar beet cultivars are therefore required to evaluate the stability and general applicability of the observed responses under a wider range of climatic, soil, and genetic conditions.
Second, the present study focused primarily on agronomic performance and technological quality. Although the observed responses are consistent with several physiological and physicochemical mechanisms proposed in previous studies, including changes in water properties, nutrient availability, and plant water uptake, these mechanisms were not directly investigated in the present experiment. Future research combining agronomic evaluations with detailed analyses of soil physical properties, plant physiology, nutrient uptake dynamics, and root functioning would provide a better understanding of the mechanisms underlying the effects of magnetized irrigation.
Finally, the economic feasibility of magnetized irrigation was beyond the scope of the present study. Future investigations should therefore integrate agronomic, physiological, and economic assessments to determine whether the observed improvements in yield, technological quality, and resource-use efficiency justify the practical adoption of this technology under commercial sugar beet production.
5. Conclusions
According to the present results, sugar beet growth, yield, technological quality, and water productivity were influenced by the combined effects of irrigation levels, NPK fertilization, and irrigation water type.
The study demonstrated that the combination of magnetized water treatment, full irrigation (100% ETc), and the recommended NPK rate consistently produced the highest values for vegetative growth, root development, yield, and technological quality. At the same time, magnetized irrigation combined with 80% of the recommended NPK rate maintained crop productivity and sugar yield at levels comparable to full fertilization while improving processing quality through reduced impurity accumulation.
An important finding was that magnetized irrigation under deficit irrigation (75% ETc) produced crop performance comparable to, or in some cases exceeding, that obtained under conventional irrigation with full water supply (100% ETc), indicating that MWT may partially alleviate the adverse effects of moderate water deficit under the experimental conditions.
Overall, the results suggest that integrating magnetized irrigation with optimized irrigation scheduling and moderate fertilizer reduction has the potential to improve production efficiency while maintaining high agronomic and technological performance. However, because the present study was conducted during a single growing season and did not include economic analyses or direct measurements of nutrient use efficiency, further multi-year investigations incorporating agronomic, physiological, and economic assessments are required before broad practical recommendations can be made.




 ,
,