Article

Projected Range Expansion of the Red Palm Weevil (Rhynchophorus ferrugineus) Across the Arabian Peninsula Under Future Climate Scenarios


by
Hathal M. Al Dhafer
1,*,
Amr Mohamed
2,
Ioannis Eleftherianos
3 and
Mahmoud S. Abdel-Dayem
1
1
King Saud University Museum of Arthropods (KSMA), Plant Protection Department, College of Food and Agriculture Sciences, King Saud University, P.O. Box 2460, Riyadh 11451, Saudi Arabia
2
Department of Entomology, Faculty of Science, Cairo University, Giza 12613, Egypt
3
School of Biological Sciences, Institute for Global Food Security, Queen’s University Belfast, Belfast BT9 5DL, UK
*
Author to whom correspondence should be addressed.
Agronomy 2026, 16(13), 1286; https://doi.org/10.3390/agronomy16131286
Submission received: 22 April 2026 / Revised: 19 June 2026 / Accepted: 1 July 2026 / Published: 3 July 2026

Abstract

The red palm weevil, Rhynchophorus ferrugineus (Olivier, 1791), is among the most destructive pests of date palm (Phoenix dactylifera L.) globally, posing a severe and escalating threat to agricultural productivity across the Arabian Peninsula. Despite its well-documented economic impact, the potential influence of climate change on its future distributional dynamics within this region remains poorly quantified. This study employed Maximum Entropy (MaxEnt) species distribution modelling to assess current and projected habitat suitability for R. ferrugineus across the Arabian Peninsula (~3.2 million km2) under two contrasting Shared Socioeconomic Pathways (SSP1-2.6 and SSP5-8.5) for the mid-century (2050) and late-century (2070). The model was calibrated using 52 spatially thinned occurrence records and six non-collinear environmental predictors selected following Variance Inflation Factor (VIF) analysis, with sampling bias corrected through a kernel density-based background weighting approach. Model performance was robust, with mean training and test AUC values of 0.921 ± 0.023 and 0.840 ± 0.052, respectively, and a mean TSS of 0.583 ± 0.046. Precipitation of the coldest quarter (Bio 19) and precipitation seasonality (Bio 15) emerged as the most influential predictors of habitat suitability, followed by elevation. Currently, approximately 727,589.8 km2 (26.11%) of the peninsula is classified as suitable habitat, concentrated along the eastern Arabian Gulf coastline and the western Red Sea plain. Under SSP1-2.6, suitable habitat is projected to expand by 16.34% and 31.60% by 2050 and 2070, respectively. Under the high-emission SSP5-8.5 scenario, expansions are considerably more pronounced, reaching 34.11% by 2050 and 60.15% by 2070, with total suitable area approaching 1,158,474.8 km2 (41.58%) by late-century. Habitat contraction was negligible across all scenarios, indicating a unidirectional range expansion dynamic. These findings highlight the substantial threat posed by climate-driven habitat expansion of R. ferrugineus and provide spatially explicit projections to inform proactive biosecurity planning and pest management strategies for date palm cultivation across the Arabian Peninsula.

1. Introduction

Invasive insect pests are among the most persistent drivers of agricultural loss and biosecurity risk that their establishment and spread are shaped by the interaction between dispersal opportunity, host availability, and environmental filtering [1,2,3]. Climate change intensifies this problem by altering thermal regimes, moisture balance, and seasonal synchrony, thereby redistributing climatic suitability across landscapes rather than simply shifting species uniformly poleward or upward [2,4]. For invasive invertebrates in particular, future climate can expand suitable habitat in some regions while simultaneously creating novel areas of risk that have not historically been exposed to the pest. These projections are useful, but they also require caution because model outputs can be highly sensitive to variable selection, climate scenarios, and other assumptions used in species distribution modeling [5,6,7].
The red palm weevil, Rhynchophorus ferrugineus (Olivier), is one of the most damaging invasive palm pests worldwide and a major threat to date palm-based agroecosystems [8]. Native to South and Southeast Asia, it has expanded dramatically since the 1980s and is now established across the Middle East, North Africa, Southern Europe, and parts of Asia, where it attacks multiple palm species and can cause severe internal damage before external symptoms become visible [9,10]. In date palm systems, this cryptic feeding behavior makes detection difficult, increases management costs, and elevates the risk of late intervention and tree loss. Consequently, R. ferrugineus is not only an entomological problem but also a long-term economic and plant health threat to perennial palm landscapes [8,10,11].
Temperature and precipitation are key determinants of insect distributions because they regulate development rate, survivorship, reproduction, and seasonal activity, while also influencing host plant condition and microclimatic buffering [12,13]. Under climate change, these variables can shift habitat suitability in nonlinear ways, producing range contraction in some areas and new suitability in others rather than a simple expansion of the current range [14]. For invasive species, this creates particular uncertainty because projected distributions depend not only on climate trajectories but also on the ecological realism of the model and the degree to which uncertainty is represented [15,16]. As a result, climate-driven habitat suitability mapping is most informative when it is framed as a scenario-based risk assessment rather than a deterministic forecast [5,6,7].
Species distribution models (SDMs) provide a spatially explicit framework for linking species occurrences to environmental predictors and estimating potential habitat suitability across space and time [17]. Among these approaches, MaxEnt is especially attractive for invasive pests because it is designed for presence-only data, performs well with limited records, and has been shown to produce robust projections when implemented carefully [18,19,20]. However, its popularity should not be mistaken for immunity to bias: results can be affected by sampling bias, background definition, collinearity, feature selection, and model complexity, and these issues become more consequential when models are projected into future climates [6,20,21]. For that reason, MaxEnt should be used critically—as a tool for structured inference and risk prioritization, not as a black-box predictor of realized distribution [22].
The Arabian Peninsula is particularly important for this question because its ecological template is defined by strong aridity gradients, desert wadis, sand seas, and oasis agroecosystems, with vegetation patterns shaped by microclimate, soil heterogeneity, and water limitation [23,24,25,26]. Date palm cultivation is deeply embedded in the region’s agriculture and livelihoods, yet climate change is already projected to alter date palm suitability in Saudi Arabia, underscoring the vulnerability of the broader palm production system on which R. ferrugineus depends [27]. Existing work on the red palm weevil has largely focused on global ecological niche modeling or country-scale management assessments, rather than a Peninsula-wide analysis that explicitly integrates the region’s climatic heterogeneity and future climate scenarios [9,10,11]. This leaves a clear methodological and geographic gap: available studies remain fragmented across local, national, and global scales, with limited standardized, bias-aware, Peninsula-wide projections of current and future habitat suitability for R. ferrugineus under SSP climate pathways.
Accordingly, this study assesses the current and future habitat suitability of the red palm weevil across the Arabian Peninsula using MaxEnt and SSP-based climate projections. We specifically tested whether suitability is associated more strongly with hydroclimatic variables than with temperature alone, whether low-lying coastal and irrigated palm landscapes remain climatically favorable, and whether future warming and precipitation change expand suitability into currently marginal inland areas. By comparing present-day suitability with future scenario-based projections, the study aims to identify areas of persistence, expansion, and potential emerging risk, thereby providing a regionally relevant evidence base for surveillance, quarantine prioritization, and long-term pest management planning.

2. Materials and Methods

2.1. Study Area

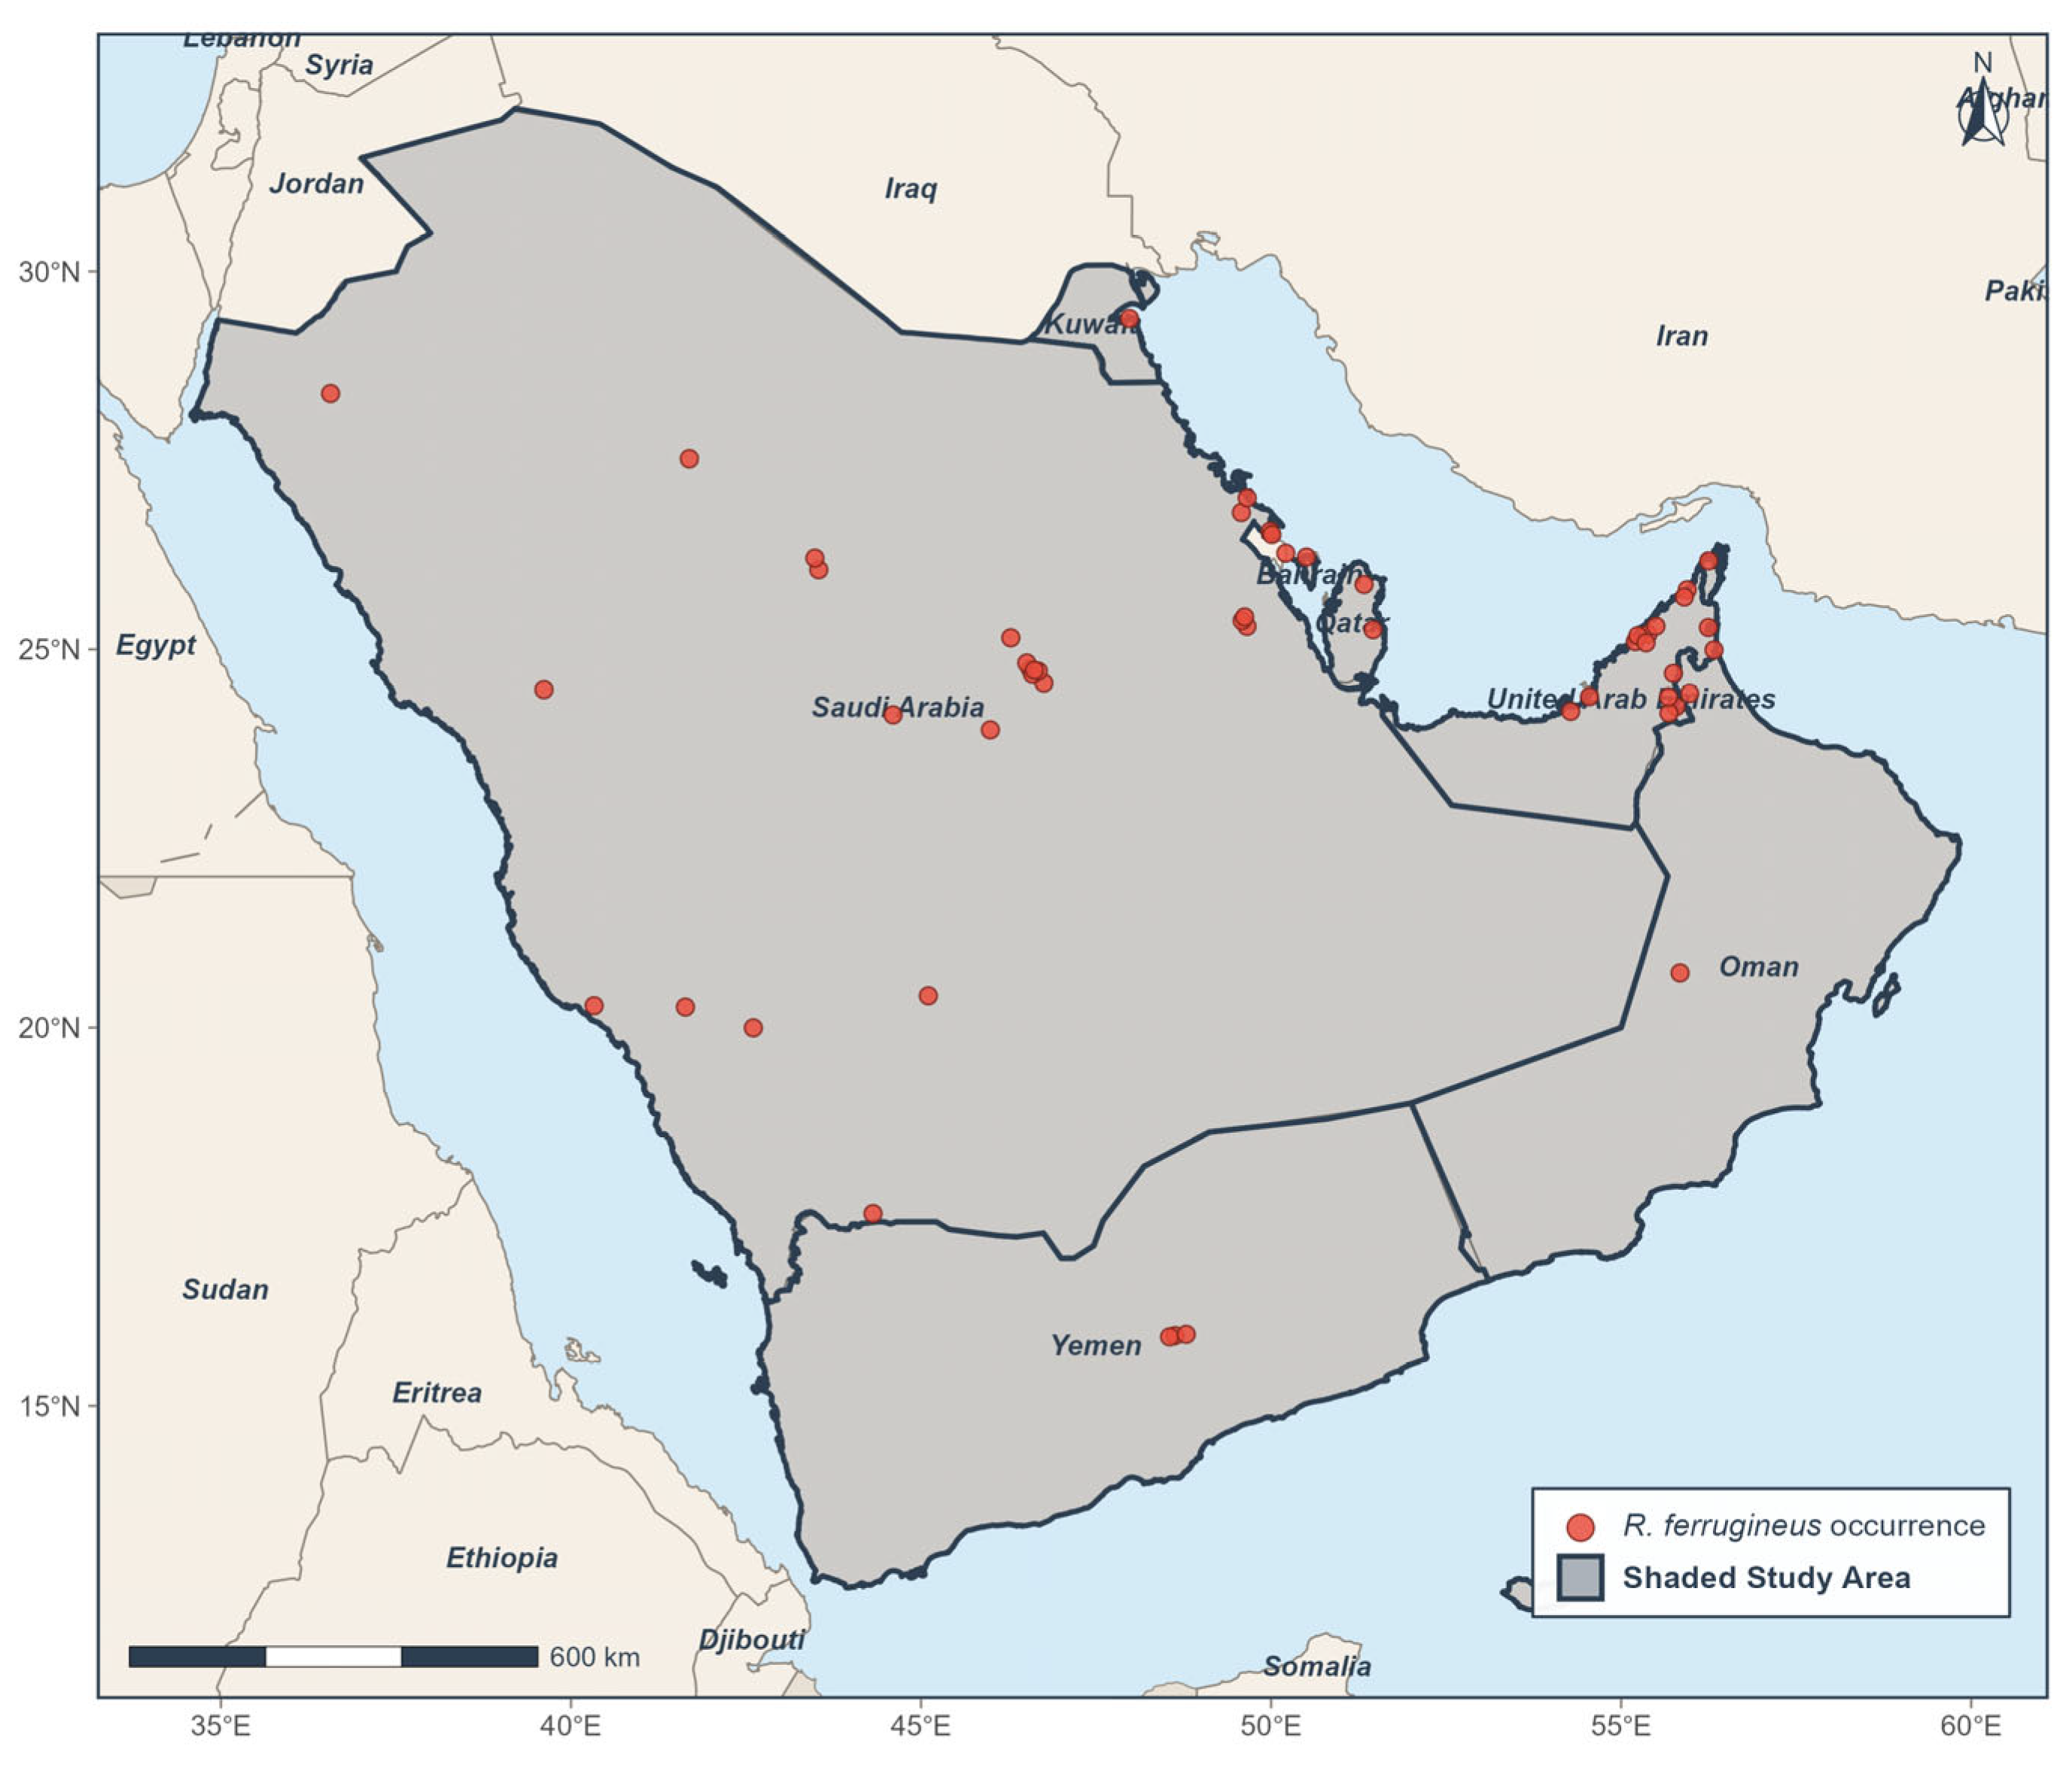
The study area encompasses the Arabian Peninsula and its immediate surroundings, spanning approximately 15° N to 33° N latitude and 34° E to 61° E longitude (Figure 1). This region includes the sovereign territories of Saudi Arabia, Yemen, Oman, the United Arab Emirates, Bahrain, Qatar, and Kuwait, collectively covering an area of approximately 3.2 million km2 [28].
The Arabian Peninsula is characterized by pronounced climatic heterogeneity, ranging from hyper-arid desert interiors, most notably the Rub’ al Khali (Empty Quarter), one of the largest continuous sand deserts in the world [29], to relatively humid coastal margins along the Red Sea, the Arabian Gulf, and the Gulf of Oman. Mean annual temperatures across the region typically range from 25 °C to 35 °C, with extreme summer maxima frequently exceeding 45 °C in interior lowlands [30]. Precipitation is highly variable and generally scarce, averaging less than 100 mm annually across most of the peninsula, with slightly higher values recorded along the southwestern highlands of Saudi Arabia and Yemen [31,32].
Date palm cultivation is concentrated in irrigated coastal and oasis-based agricultural zones, especially in eastern Saudi Arabia, the United Arab Emirates, Qatar, Bahrain, and parts of Oman, with additional plantations scattered across interior agricultural districts [26,27]. Because R. ferrugineus attacks multiple palm hosts and its occurrence records strongly coincide with these irrigated croplands (Figure 1), host availability is an essential companion to climatic suitability when interpreting potential risk.
The occurrence records of R. ferrugineus used in this study were georeferenced across the study area (Figure 1), with the majority of records concentrated along the eastern coastal zones of Saudi Arabia, the United Arab Emirates, and Oman—regions where date palm (Phoenix dactylifera L.) cultivation is most intensive [9,33]. Additional occurrence points were distributed across interior agricultural areas of Saudi Arabia and the southwestern regions of Yemen, reflecting the broad geographic extent of the pest within the peninsula [34,35].
The delineated study area was selected to capture the full range of climatic conditions relevant to the potential distribution of R. ferrugineus within the Arabian Peninsula, thereby providing a robust environmental background for Maximum Entropy (MaxEnt) species distribution modelling [18,19].

2.2. Occurrence Data and Spatial Filtering

Georeferenced occurrence records of R. ferrugineus across the Arabian Peninsula were compiled from multiple sources, including the Global Biodiversity Information Facility (GBIF; incorporating records from iNaturalist, GenBank/BOLD, and other aggregated datasets), the EPPO Global Database, and peer-reviewed published literature [36,37,38,39,40,41,42]. A complete list of data sources is provided in Supplementary Materials File S1. All records were visually inspected and cross-validated against known distributional data to identify and exclude erroneous, duplicate, or spatially imprecise entries. Records lacking reliable geographic coordinates were removed prior to analysis. A total of 60 occurrence records were initially assembled, spanning seven countries: Saudi Arabia (n = 33), the United Arab Emirates (n = 16), Oman (n = 4), Yemen (n = 3), Qatar (n = 2), Bahrain (n = 1), and Kuwait (n = 1). Records spanned the period from 1985 to 2025, covering a geographic extent of approximately 15.91° N–29.38° N latitude and 36.57° E–56.33° E longitude.
A spatial thinning procedure was applied to the cleaned occurrence dataset using the spThin package (version 0.2.0) [43] in R version 4.4.1 (R Foundation for Statistical Computing, Vienna, Austria) [44], with a minimum inter-point distance threshold of 5 km. This procedure ensures that no two retained records are located closer than the specified distance, thereby reducing the influence of spatially autocorrelated observations on model fitting [45]. Following thinning, 52 records were retained for subsequent modelling, representing a reduction of 8 records (13.3%) from the original dataset (Figure 1).

2.3. Sampling Bias Correction

Geographic sampling bias presents a critical methodological challenge in species distribution modeling, as occurrence data often reflect survey intensity rather than the true ecological distribution of a species [46]. In the Arabian Peninsula, sampling effort for R. ferrugineus exhibits distinct spatial heterogeneity. Records are heavily skewed toward regions with intensive date palm (Phoenix dactylifera L.) cultivation and active pest management—primarily the Eastern Province of Saudi Arabia and the coastal zones of the United Arab Emirates—while interior and non-agricultural areas remain significantly undersampled. To mitigate this bias beyond standard spatial thinning, we applied a bias-corrected background selection method [46]. Using the “Create Bias File” tool in SDMtoolbox 2.0 [47,48] for ArcGIS 10.7, we derived a Gaussian kernel density surface from the occurrence data to approximate regional sampling effort. This surface was then integrated into MaxEnt to probabilistically weight the selection of 10,000 background points. In practical terms, this means that background points were sampled more densely from heavily surveyed date-palm landscapes and less densely from poorly surveyed interior areas, so that the background more closely matched the spatial structure of the occurrence data rather than the raw geography of the peninsula. By aligning selection probability with the bias surface, this method ensures presence records are compared against similarly surveyed background environments, substantially reducing the confounding effects of uneven sampling [46].

2.4. Environmental Variables

This study utilized two primary categories of environmental predictors: 19 bioclimatic variables and one topographic parameter (elevation) (Supplementary Materials File S2). These predictors were retained because they represent biologically plausible controls on R. ferrugineus occurrence: thermal variability and seasonality influence development and activity, whereas cold-season precipitation and precipitation seasonality provide coarse proxies for host hydration, irrigation buffering, and lowland microclimatic stability; elevation was included as a topographic surrogate but interpreted cautiously because it may capture correlated environmental gradients rather than a direct physiological effect. Although elevation is not a direct physiological driver, it was retained because its sharp gradient in this arid region compactly captures the joint effects of temperature, humidity, and host-crop distribution that co-vary with altitude; its interpretation as a surrogate is fully acknowledged in the Discussion. To ensure temporal alignment between occurrence records (1985–2025) and environmental data, monthly climate grids were sourced from TerraClimate [49] via Google Earth Engine [50]. Specifically, monthly maximum temperature, minimum temperature, and total precipitation were downloaded as GeoTIFFs at a ~4 km spatial resolution, pre-clipped to the Arabian Peninsula Region. Long-term monthly climatological means were calculated across this 40-year period, from which the 19 standard bioclimatic variables (Bio 1–19) were derived using the terra package in R version 4.4.1. This temporal matching ensures the predictors reflect the actual climatic conditions—including post-2000 warming trends—experienced by R. ferrugineus populations. Consequently, this approach upholds the pseudo-equilibrium assumptions fundamental to correlative species distribution modeling. The derived bioclimatic layers were subsequently resampled to a 30 arc-second (~1 km2) spatial resolution to align with both the elevation data—sourced from the WorldClim 2.1 database [51]—and the requirements for future climate projections in MaxEnt. The TerraClimate dataset is publicly available at https://www.climatologylab.org/terraclimate.html (accessed on 2 April 2026); WorldClim data at https://www.worldclim.org (last accessed on 9 April 2026). All predictor variables were used in their original units without centering or scaling, as MaxEnt internally handles variable scaling during model fitting.
To minimize multicollinearity while maintaining ecological relevance, variable selection was conducted prior to model fitting. We performed a Variance Inflation Factor (VIF) analysis on the initial set of 20 variables using the usdm package in R version 4.4.1. Variables were subjected to a stepwise removal procedure applying a conservative VIF threshold of <5 (Supplementary Materials File S3). This statistically robust approach systematically excluded highly collinear predictors that could otherwise destabilize model coefficients or artificially inflate variable importance metrics. The final predictor set was therefore chosen to balance ecological interpretability with statistical independence rather than to maximize variable count. Ultimately, six non-collinear predictors were retained (Table 1), representing the fundamental environmental axes hypothesized to govern the distribution of R. ferrugineus.
Finally, all environmental layers were masked to the study area boundaries and converted to ASCII format using the terra package in R version 4.4.1. The relative influence of each environmental driver was assessed using two complementary metrics: percent contribution, which reflects a variable’s heuristic contribution during the model training process, and permutation importance, which quantifies the decrease in the Area Under the Curve (AUC) when a variable’s values are randomly permuted [18]. Evaluated in tandem, these metrics provide a comprehensive assessment of the environmental parameters driving the model [20].

2.5. Future Climate Projections

Future distribution patterns were projected using climate data derived from five General Circulation Models (GCMs): GFDL-ESM4, IPSL-CM6A-LR, MPI-ESM1-2-HR, MRI-ESM2-0, and UKESM1-0-LL. These specific models were selected because they constitute the core ensemble recommended by the Inter-Sectoral Impact Model Intercomparison Project (ISIMIP3b) [52], ensuring a robust representation of key climate sensitivities within CMIP6 [53]. High-resolution datasets (30 arc-seconds) for the mid-century (2050; 2040–2060) and late-century (2070; 2060–2080) epochs were sourced from WorldClim 2.1 [51]. Projections were evaluated under two contrasting Shared Socioeconomic Pathways (SSPs): SSP1-2.6, representing a stringent low-emission scenario, and SSP5-8.5, representing a high-emission, fossil-fueled scenario [54,55]. To mitigate the structural uncertainty inherent in any single climate model, we applied a multi-model ensemble approach [56]. For each combination of SSP and time period, the calibrated species distribution model was projected independently onto the climatic layers of the five GCMs. A final consensus projection was then generated by calculating the pixel-wise arithmetic mean of these continuous suitability scores. Complete model specifications are detailed in Supplementary Materials File S4.

2.6. MaxEnt Model Implementation and Parameterization

Species distribution modelling was performed using MaxEnt version 3.4.4 [57], selected for its robust performance with presence-only occurrence data and relatively small sample sizes [18,58], and its established utility in climate change projection studies [59]. It also provides well-documented procedures for regularization, feature-class tuning, and sampling-bias correction, making it particularly suitable for invasive species distribution modeling [18,58]. MaxEnt contrasts species presence records with background points to estimate habitat suitability, producing continuous maps with values ranging from 0 (unsuitable) to 1 (optimal conditions) [60,61]. A total of 10,000 background points were sampled using the bias file described in Section 2.3, with selection probability proportional to estimated sampling effort, implemented via the “bias file” option in MaxEnt.
Model complexity was systematically optimized prior to final model fitting using the ENMeval 2.0 package [62] in R version 4.4.1 [44]. A total of 40 candidate models were evaluated across a grid of five feature class (FC) combinations—Linear (L), Hinge (H), Linear–Quadratic (LQ), Linear–Quadratic–Hinge (LQH), and Linear–Quadratic–Hinge–Product (LQHP)—and eight regularization multiplier (RM) values (0.5, 1.0, 1.5, 2.0, 2.5, 3.0, 3.5, and 4.0). These 40 models reflect the 5 × 8 combinations of feature classes and regularization multipliers evaluated after the predictor set had already been reduced to six non-collinear variables; they do not represent all possible subsets of the six predictors. The purpose of this tuning step was therefore to optimize MaxEnt complexity for a fixed biologically screened predictor set, not to perform exhaustive subset selection. Feature classes determine the shape of the response curves fitted to environmental predictors, while the regularization multiplier controls model complexity and penalizes overfitting [21,63]. Model selection was guided by the corrected Akaike Information Criterion (AICc), which penalizes model complexity relative to sample size to prevent overfitting [64]. The optimal model configuration was identified as FC = LQ (Linear–Quadratic features) with RM = 0.5, yielding the lowest AICc value (AICc = 1086.93, ΔAICc = 0, wAIC = 0.69, ncoef = 7), indicating substantially superior support relative to all competing candidate models (Supplementary Materials File S5).
Model predictive performance was evaluated using two complementary metrics: the Area Under the Receiver Operating Characteristic Curve (AUC) and the True Skill Statistic (TSS). AUC provides a threshold-independent measure of the model’s ability to discriminate between presence and background points, with values >0.7, >0.8, and >0.9 indicating acceptable, good, and excellent performance, respectively [65]. Conversely, TSS provides a threshold-dependent assessment of classification accuracy that accounts for both sensitivity and specificity; values >0.5 denote good predictive performance, while values >0.6 are considered very good [66]. The combined use of threshold-independent (AUC) and threshold-dependent (TSS) metrics ensures a robust, multifaceted evaluation of model quality, aligning with established best practices in ecological modeling [67,68].

2.7. Threshold Selection and Binary Classification

To quantify potential spatial shifts in species distribution under future climate scenarios, continuous suitability outputs from MaxEnt were converted into binary presence–absence maps. We applied the “10th percentile training presence” threshold, which classifies environments as suitable if their predicted value meets or exceeds the suitability score of the lowest 10% of training presence records. This threshold was selected for two primary reasons. First, from an agricultural biosecurity perspective, the risk of underestimating potentially suitable habitat (false negatives) far outweighs the cost of moderate overestimation (false positives) [69]. Undetected suitable areas could facilitate unmonitored pest establishment and subsequent spread. Second, this conservative threshold maintains high model sensitivity; it effectively accounts for minor spatial inaccuracies in georeferenced data while ensuring that marginal or transitional habitats—which may become increasingly favorable under projected warming and aridity trends—are retained in the projections [70,71]. Finally, the resulting binary maps were used to compare current distributions against future climate projections (SSP1-2.6 and SSP5-8.5 for 2050 and 2070), allowing us to quantify spatial dynamics across four distinct categories: stable presence (suitable under both current and future conditions), expansion (newly suitable), contraction (loss of suitability), and stable absence (unsuitable under both conditions). For descriptive convenience, continuous suitability values were qualitatively grouped as unsuitable (<0.2), low (0.2–0.4), moderate (0.4–0.8), and high (>0.8), following interpretative thresholds commonly adopted in MaxEnt studies (e.g., [61]).

2.8. Multi-Model Climate Projections and Synthesis

In total, 20 future habitat suitability scenarios were generated by projecting the calibrated MaxEnt model across five GCMs, two SSPs, and two future time horizons. Current potential distributions were established by averaging the continuous suitability outputs derived from ten bootstrap replicates. For the future projections, consensus maps were generated for each specific SSP and time-period combination (e.g., SSP1-2.6 for 2050) by calculating the pixel-wise mean of the continuous suitability values across all five GCMs. This multi-model ensemble approach effectively mitigates the inter-model uncertainty inherent in future climate simulations, ensuring robust spatial predictions while holding the underlying ecological model structure constant [72,73].

3. Results

3.1. Model Performance and Environmental Variables

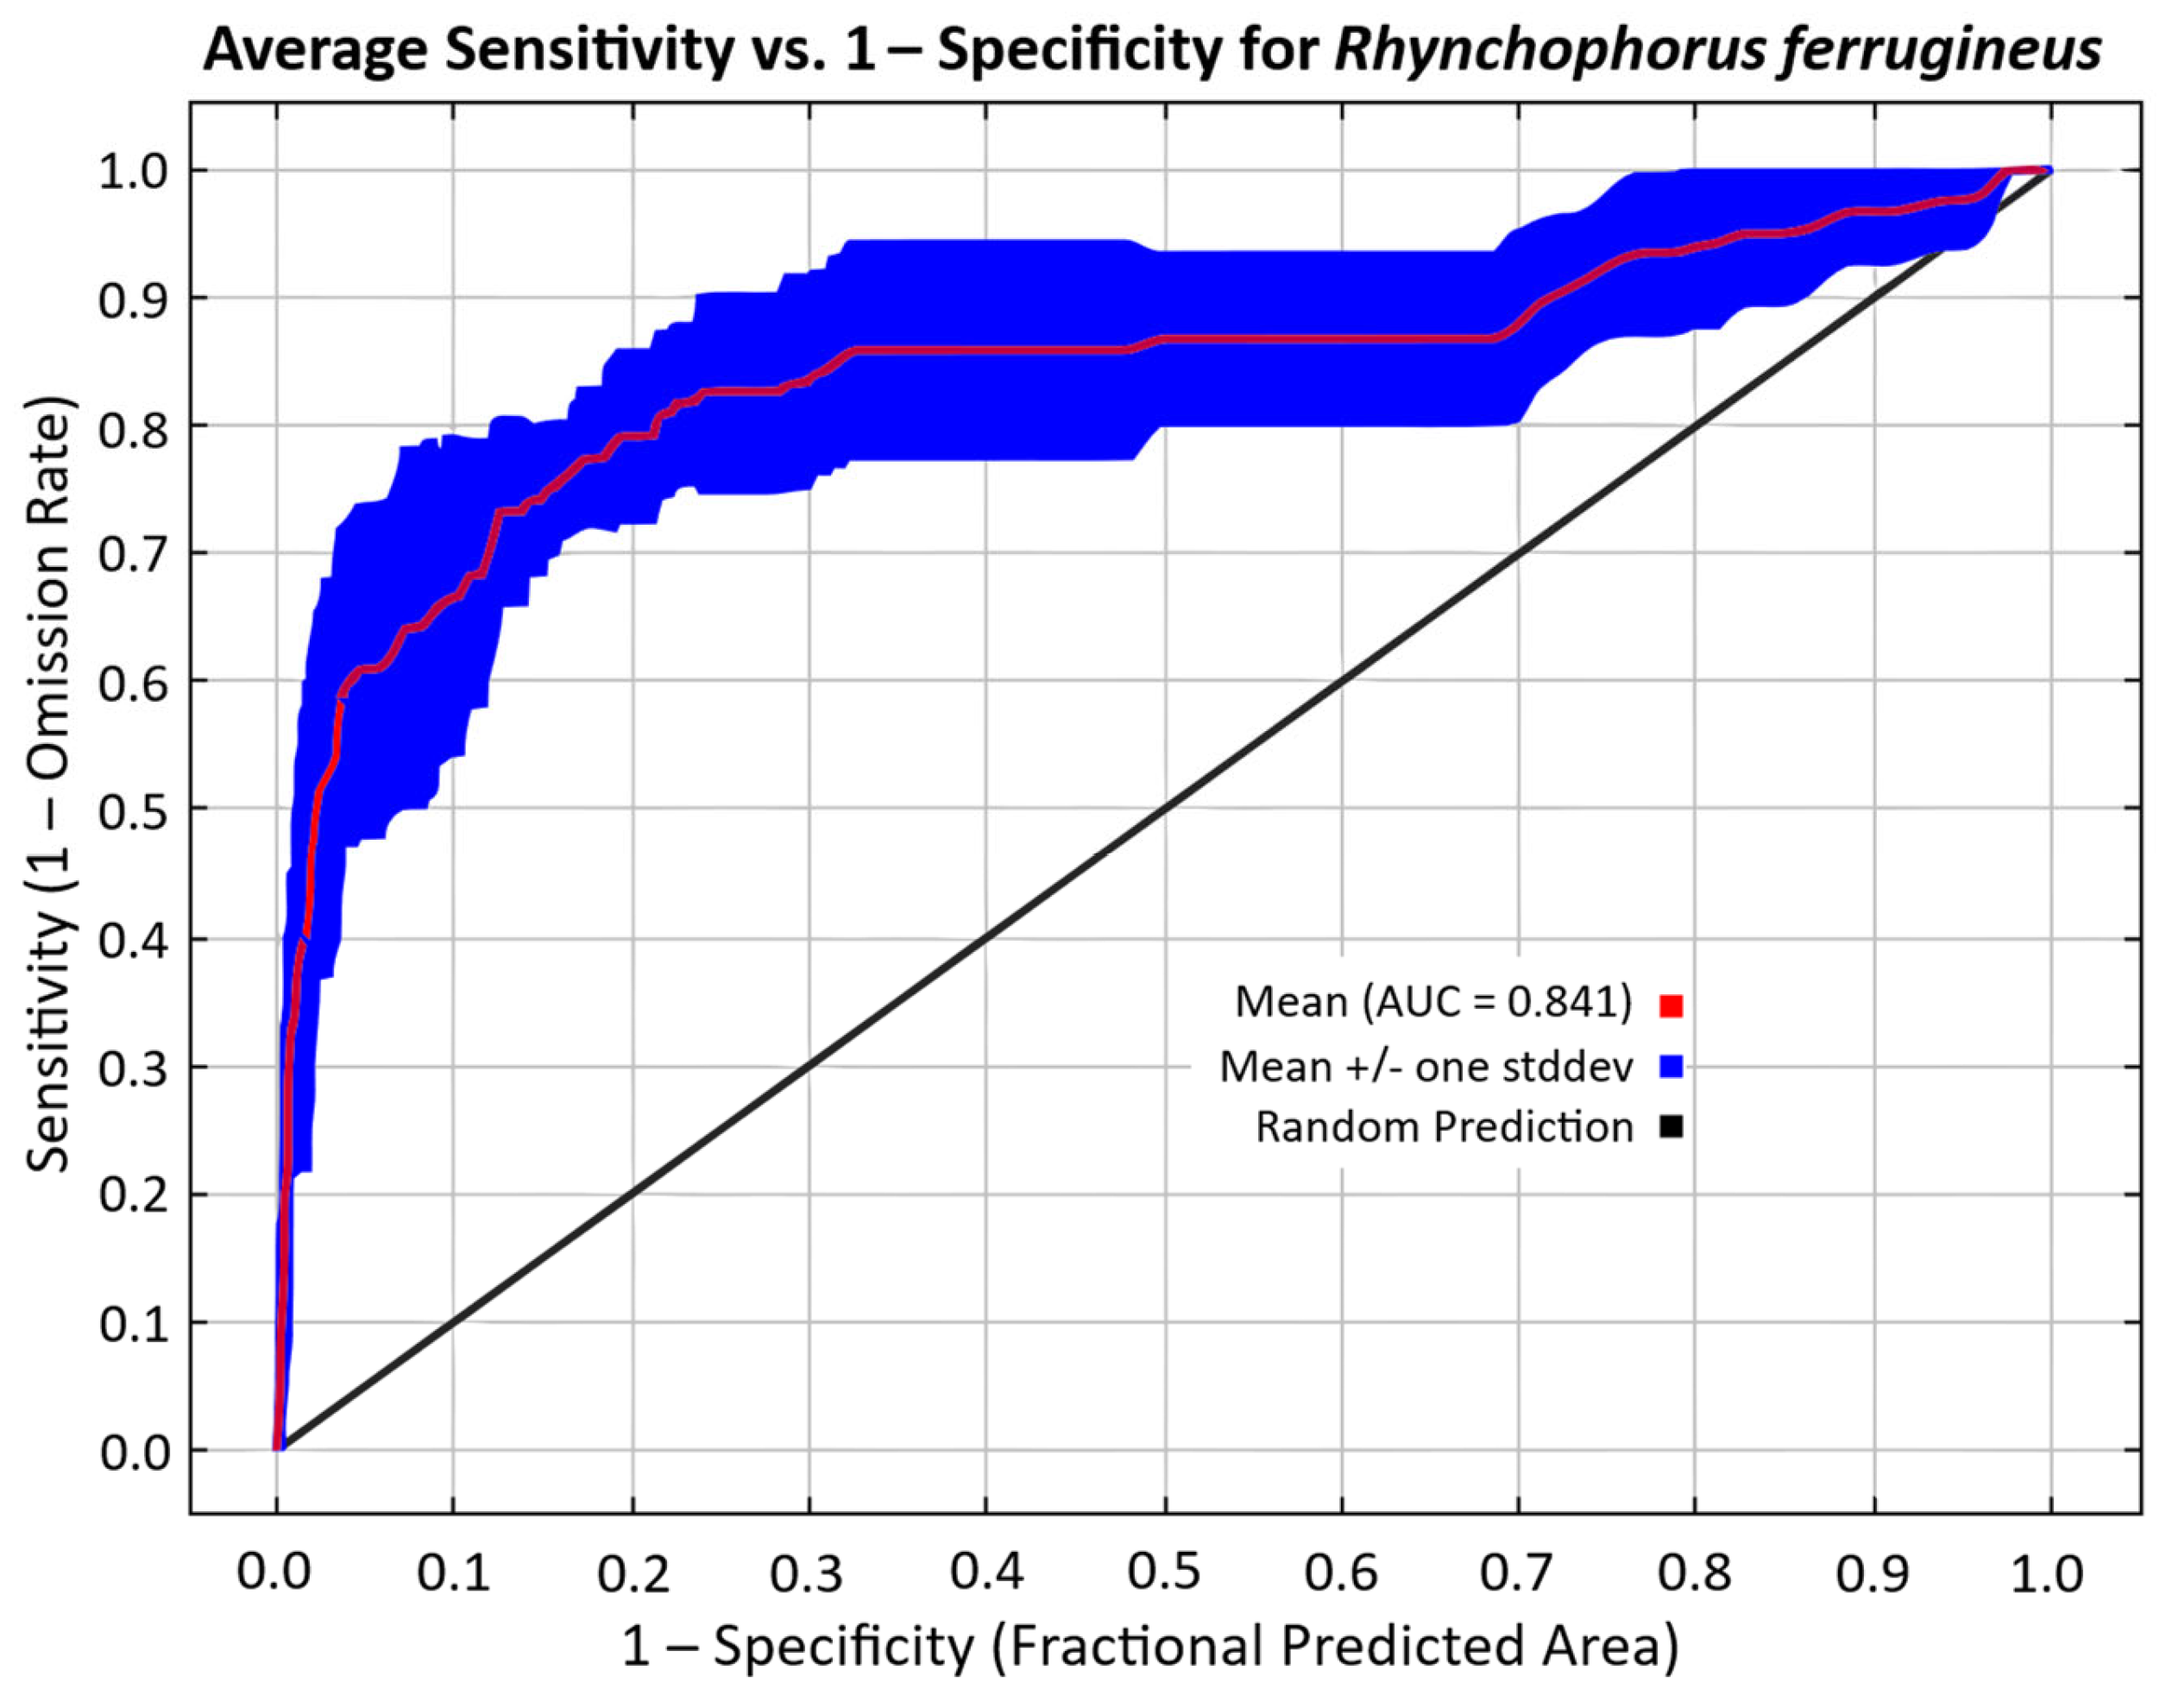
The MaxEnt model demonstrated consistently strong predictive performance across all ten replicates (Figure 2 and Supplementary Materials File S6). Mean training AUC was 0.921 ± 0.023, while mean test AUC was 0.840 ± 0.052, both well above the accepted threshold of ≥0.7 [18], indicating excellent discriminatory ability between suitable and unsuitable habitat. The relatively small difference between training and test AUC values suggests minimal overfitting, supporting the model’s generalizability. True Skill Statistic (TSS) values ranged from 0.532 to 0.648 across replicates, yielding a mean of 0.583 ± 0.046. All TSS values exceeded the ≥0.5 threshold considered indicative of acceptable model performance [66], confirming the model’s reliable capacity to distinguish presences from absences beyond random expectation.
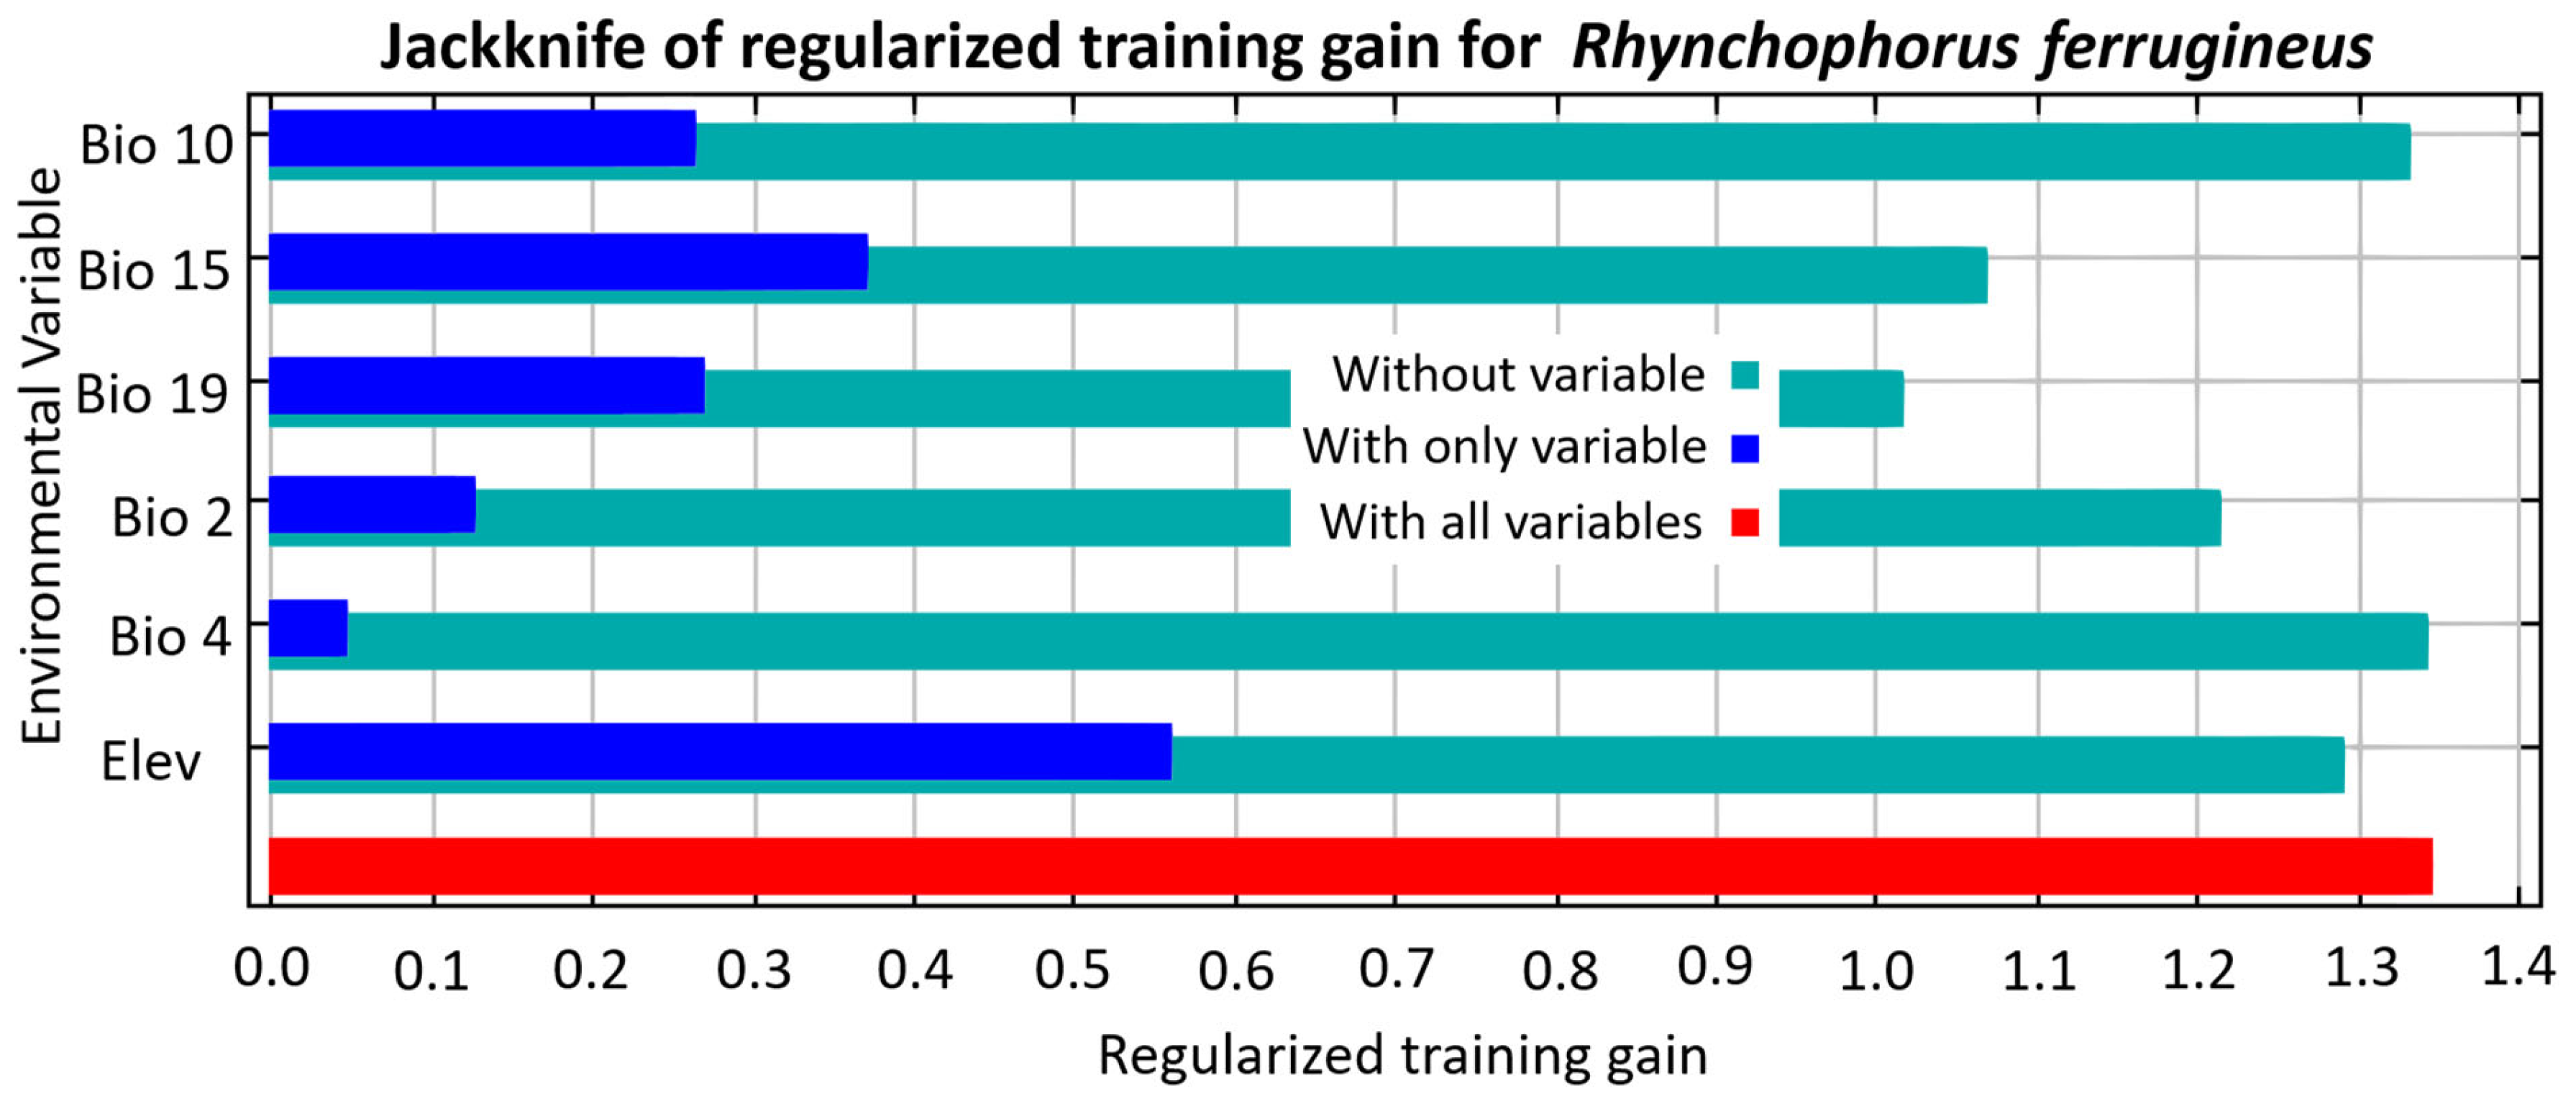
Six environmental variables were retained in the final MaxEnt model following multicollinearity filtering, collectively explaining the predicted distribution of Rhynchophorus ferrugineus across the Arabian Peninsula (Table 1 and Figure 3). Elevation (Elev) emerged as the single largest contributor to model output, accounting for 36.2% of the percentage contribution; however, its low permutation importance (3.5%) suggests that while it dominates model structure, it is not the most independently informative predictor when variable order is randomized. Precipitation seasonality (Bio 15) and precipitation of the coldest quarter (Bio 19) were the next most influential variables, contributing 27.4% and 24.2%, respectively. Notably, Bio 19 exhibited the highest permutation importance of all variables (50.2%), suggesting that it carries the greatest independent predictive weight for habitat suitability—a finding that underscores the critical role of cold-season moisture availability in structuring the pest’s distribution. Bio 15 also showed substantial permutation importance (29.3%), further reinforcing the significance of precipitation variability in driving habitat suitability patterns. Mean diurnal range (Bio 2) contributed moderately to both metrics (10.0% contribution; 12.3% permutation importance), suggesting a secondary but meaningful thermal influence. In contrast, mean temperature of the warmest quarter (Bio 10) and temperature seasonality (Bio 4) contributed minimally to model performance (1.7% and 0.6%, respectively), implying limited independent roles in delimiting the species’ realized niche under current conditions.
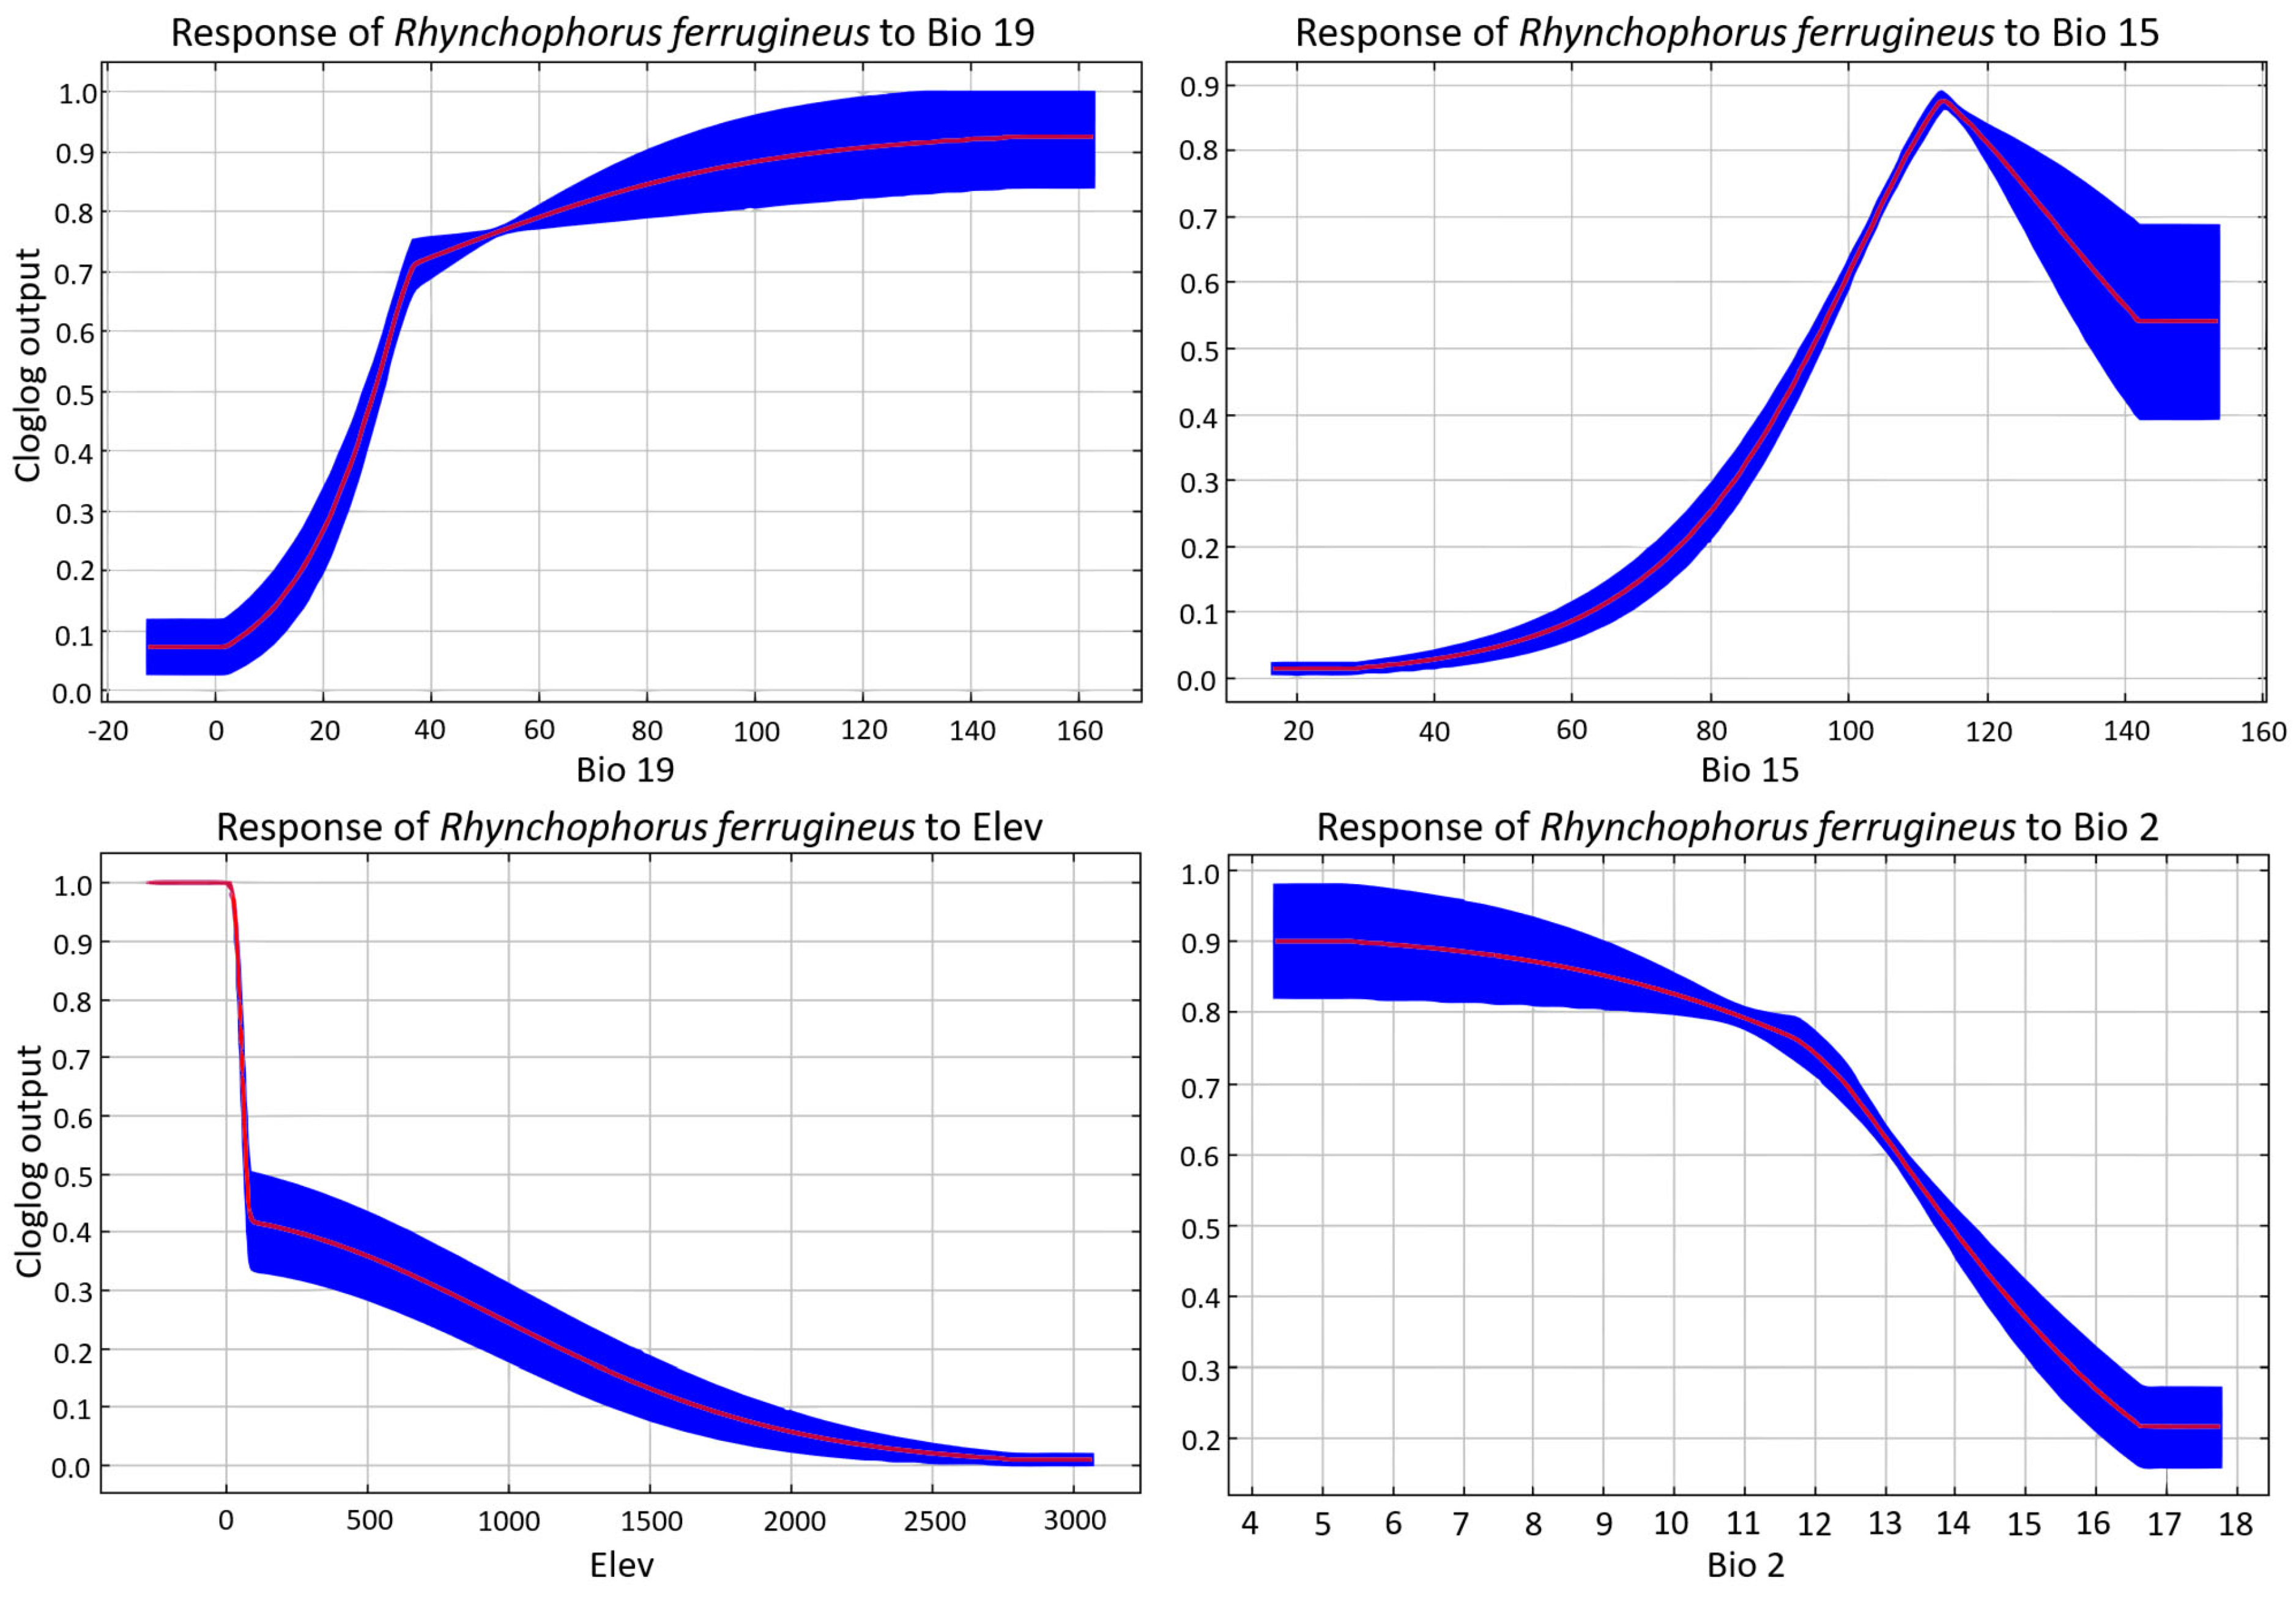
The marginal response curves for the four most influential environmental predictors revealed distinct and ecologically interpretable relationships between habitat suitability and each variable (Figure 4). For precipitation of the coldest quarter (Bio 19), habitat suitability was low under near-zero values (≤5 mm), but increased sharply at approximately 20–40 mm, plateauing at high suitability (probability > 0.8) beyond ~80 mm. This sigmoidal response suggests a clear moisture threshold below which the species is unlikely to establish, highlighting the importance of cold-season precipitation in sustaining suitable habitat. The response to precipitation seasonality (Bio 15) was unimodal, with suitability rising steeply from low values and peaking at a coefficient of variation of approximately 110–115, beyond which suitability declined markedly. This pattern suggests that R. ferrugineus is optimally associated with intermediate-to-high precipitation variability, while extremely high seasonality becomes limiting. The elevation response curve exhibited a sharp threshold near sea level, with maximum suitability confined to low-lying areas (<100 m asl) and a steep, near-monotonic decline at higher elevations, approaching near-zero suitability above ~1500 m. This response is consistent with the species’ documented association with lowland coastal and agricultural zones across the Arabian Peninsula. The response to mean diurnal temperature range (Bio 2) was predominantly negative, with high suitability under narrow diurnal ranges (4–8 °C) that declined progressively as diurnal fluctuations increased beyond ~12 °C. This suggests that R. ferrugineus favors thermally stable environments and may be physiologically constrained in regions with pronounced day–night temperature variation.

3.2. Current Habitat Suitability Distribution

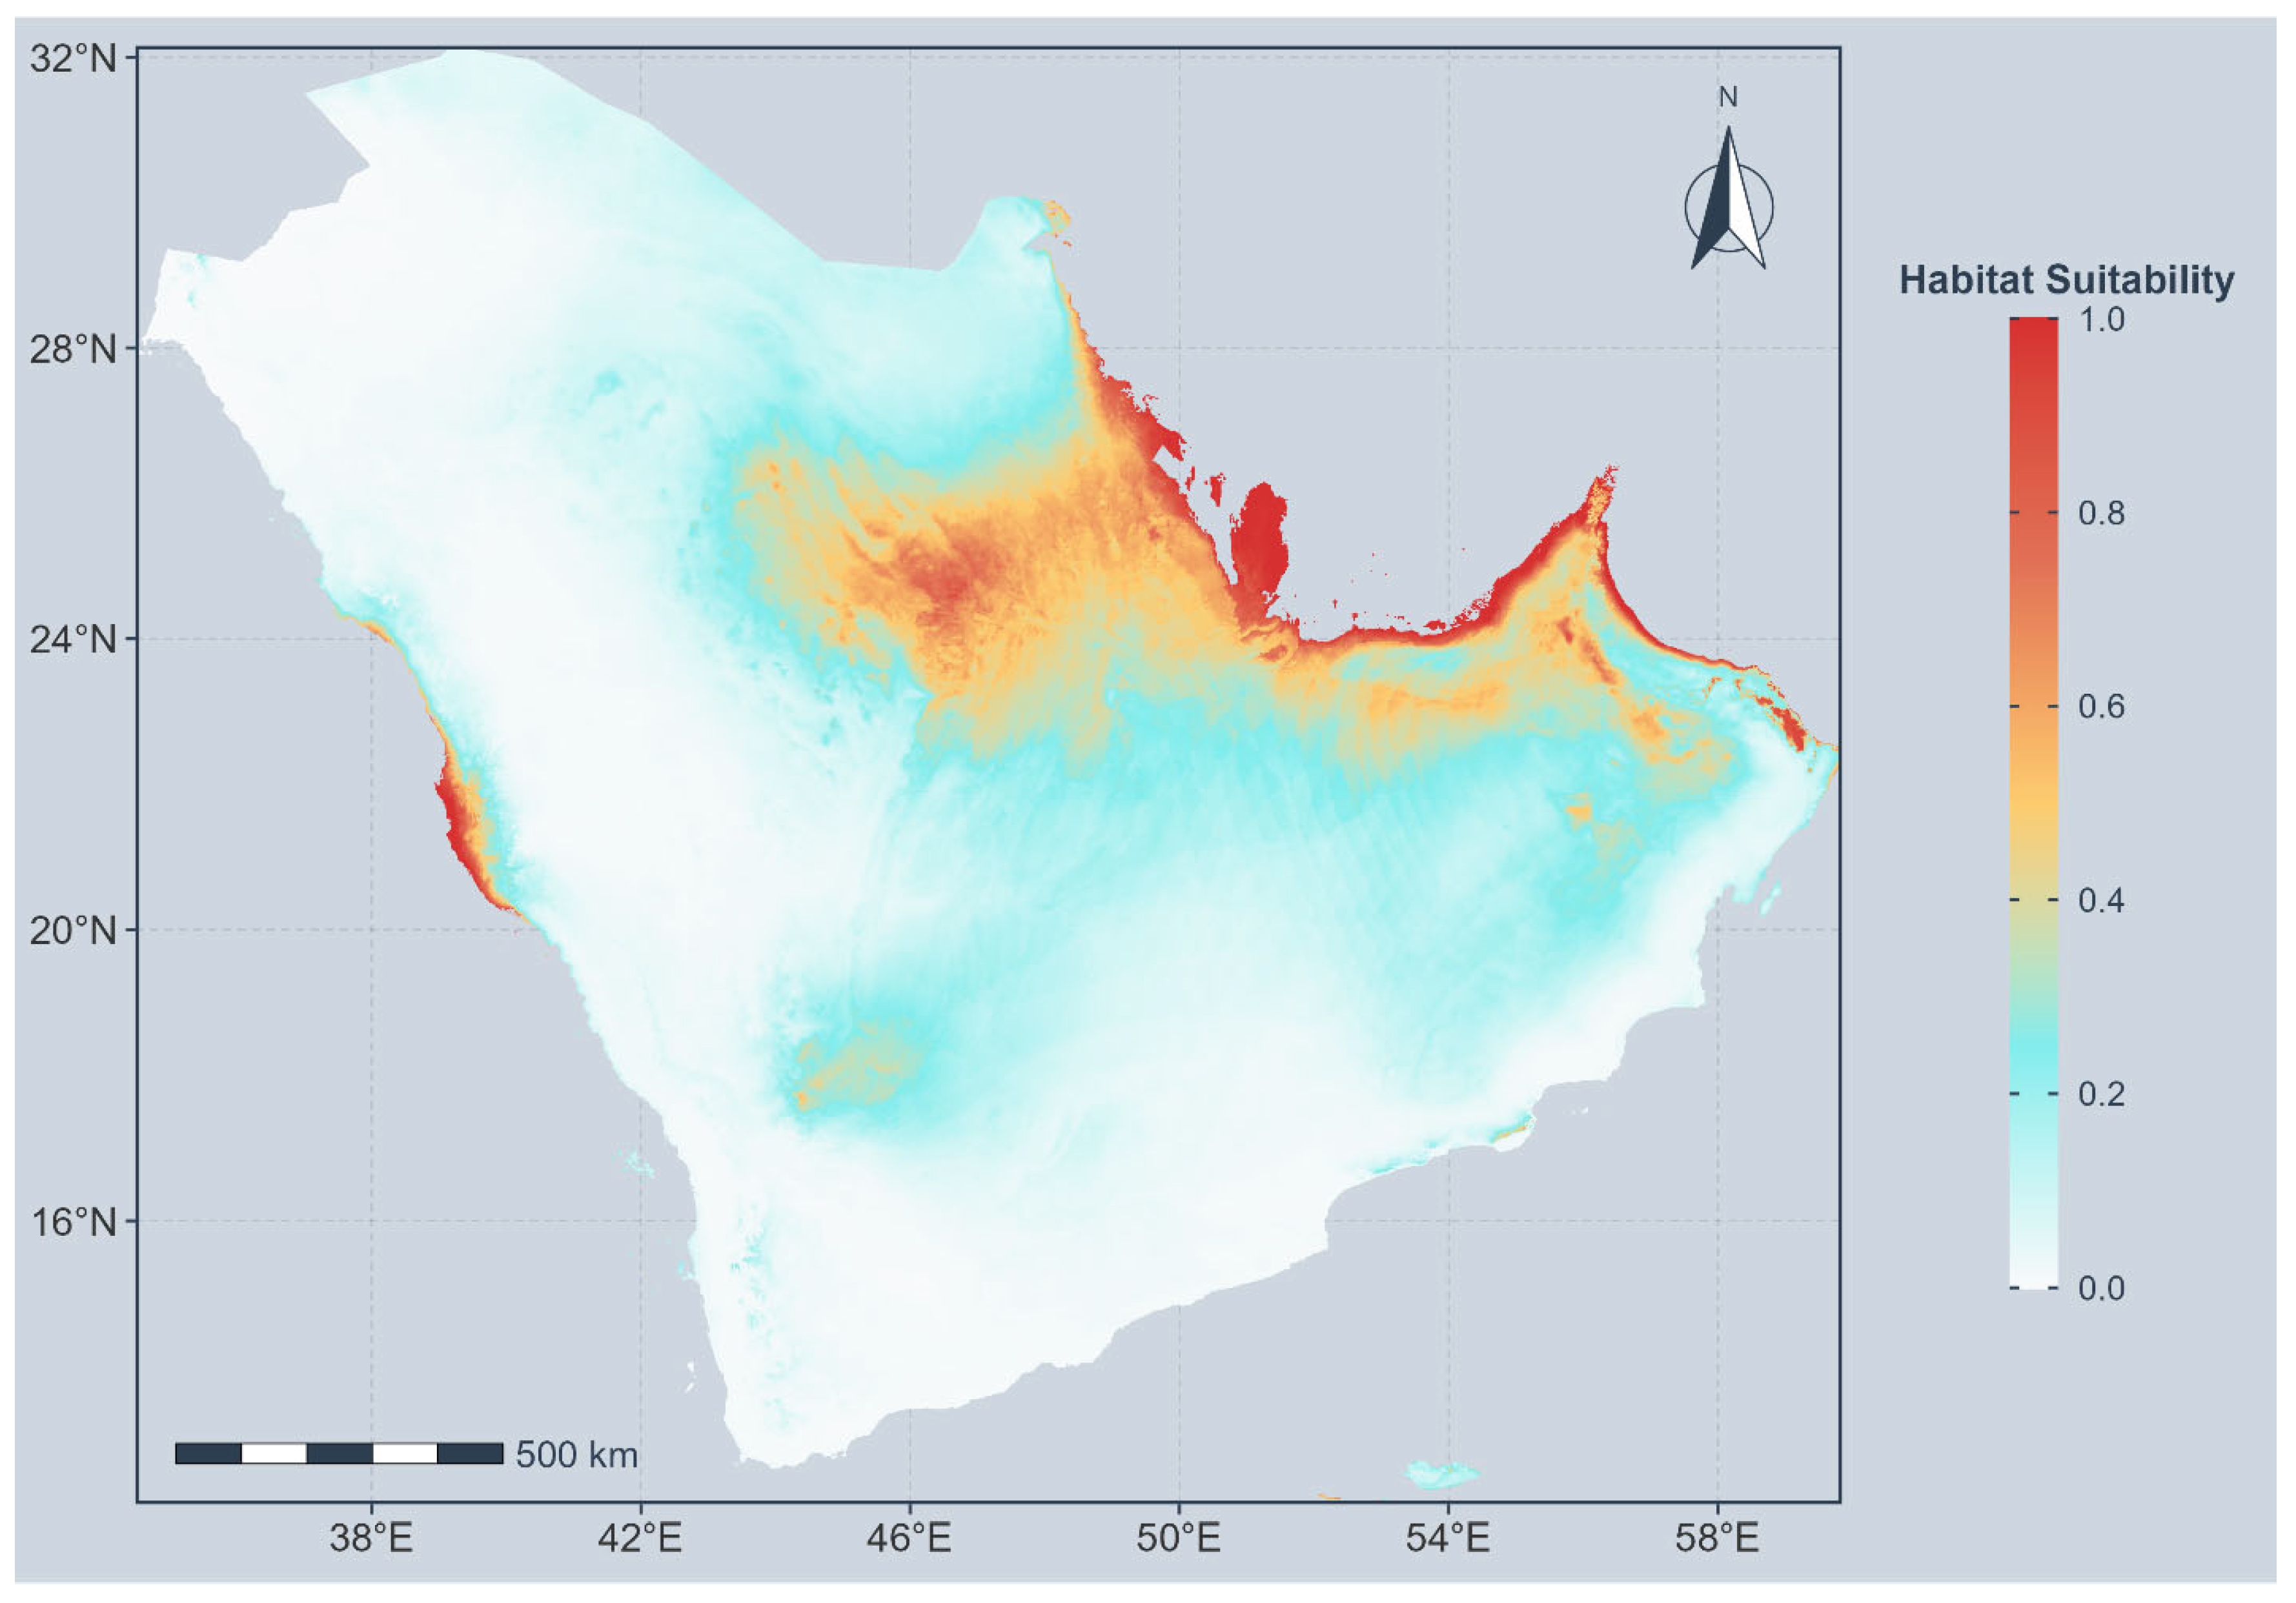
The MaxEnt model projected that approximately 727,589.8 km2 (26.11%) of the Arabian Peninsula currently constitutes suitable habitat for R. ferrugineus (Supplementary Materials File S7). Spatially, highly suitable areas (habitat suitability index > 0.8) were concentrated along the eastern coastal lowlands bordering the Arabian Gulf, particularly across Bahrain, Qatar, the UAE, and the eastern provinces of Saudi Arabia, where the characteristic combination of low elevation, moderate cold-season precipitation, and intermediate precipitation seasonality converges (Figure 5). A secondary zone of high suitability was identified along the narrow Red Sea coastal plain in western Saudi Arabia, consistent with the low-elevation, humid conditions that favor the species. Moderate suitability values (0.4–0.8) were distributed across a broader transitional zone extending through the central and northern portions of Saudi Arabia, as well as parts of Oman, reflecting areas where environmental conditions are partially suitable but fall short of optimal thresholds. The interior of the Arabian Peninsula—dominated by the Rub’ al Khali and Nafud deserts—was largely projected as unsuitable (<0.2), corresponding to the extreme aridity, high diurnal temperature ranges, and high elevation gradients that the marginal response curves identified as limiting factors. Overall, the spatial pattern of current habitat suitability closely reflects the distributional constraints imposed by precipitation-related variables and elevation, as identified in the variable contribution analysis.

3.3. Projected Future Habitat Suitability

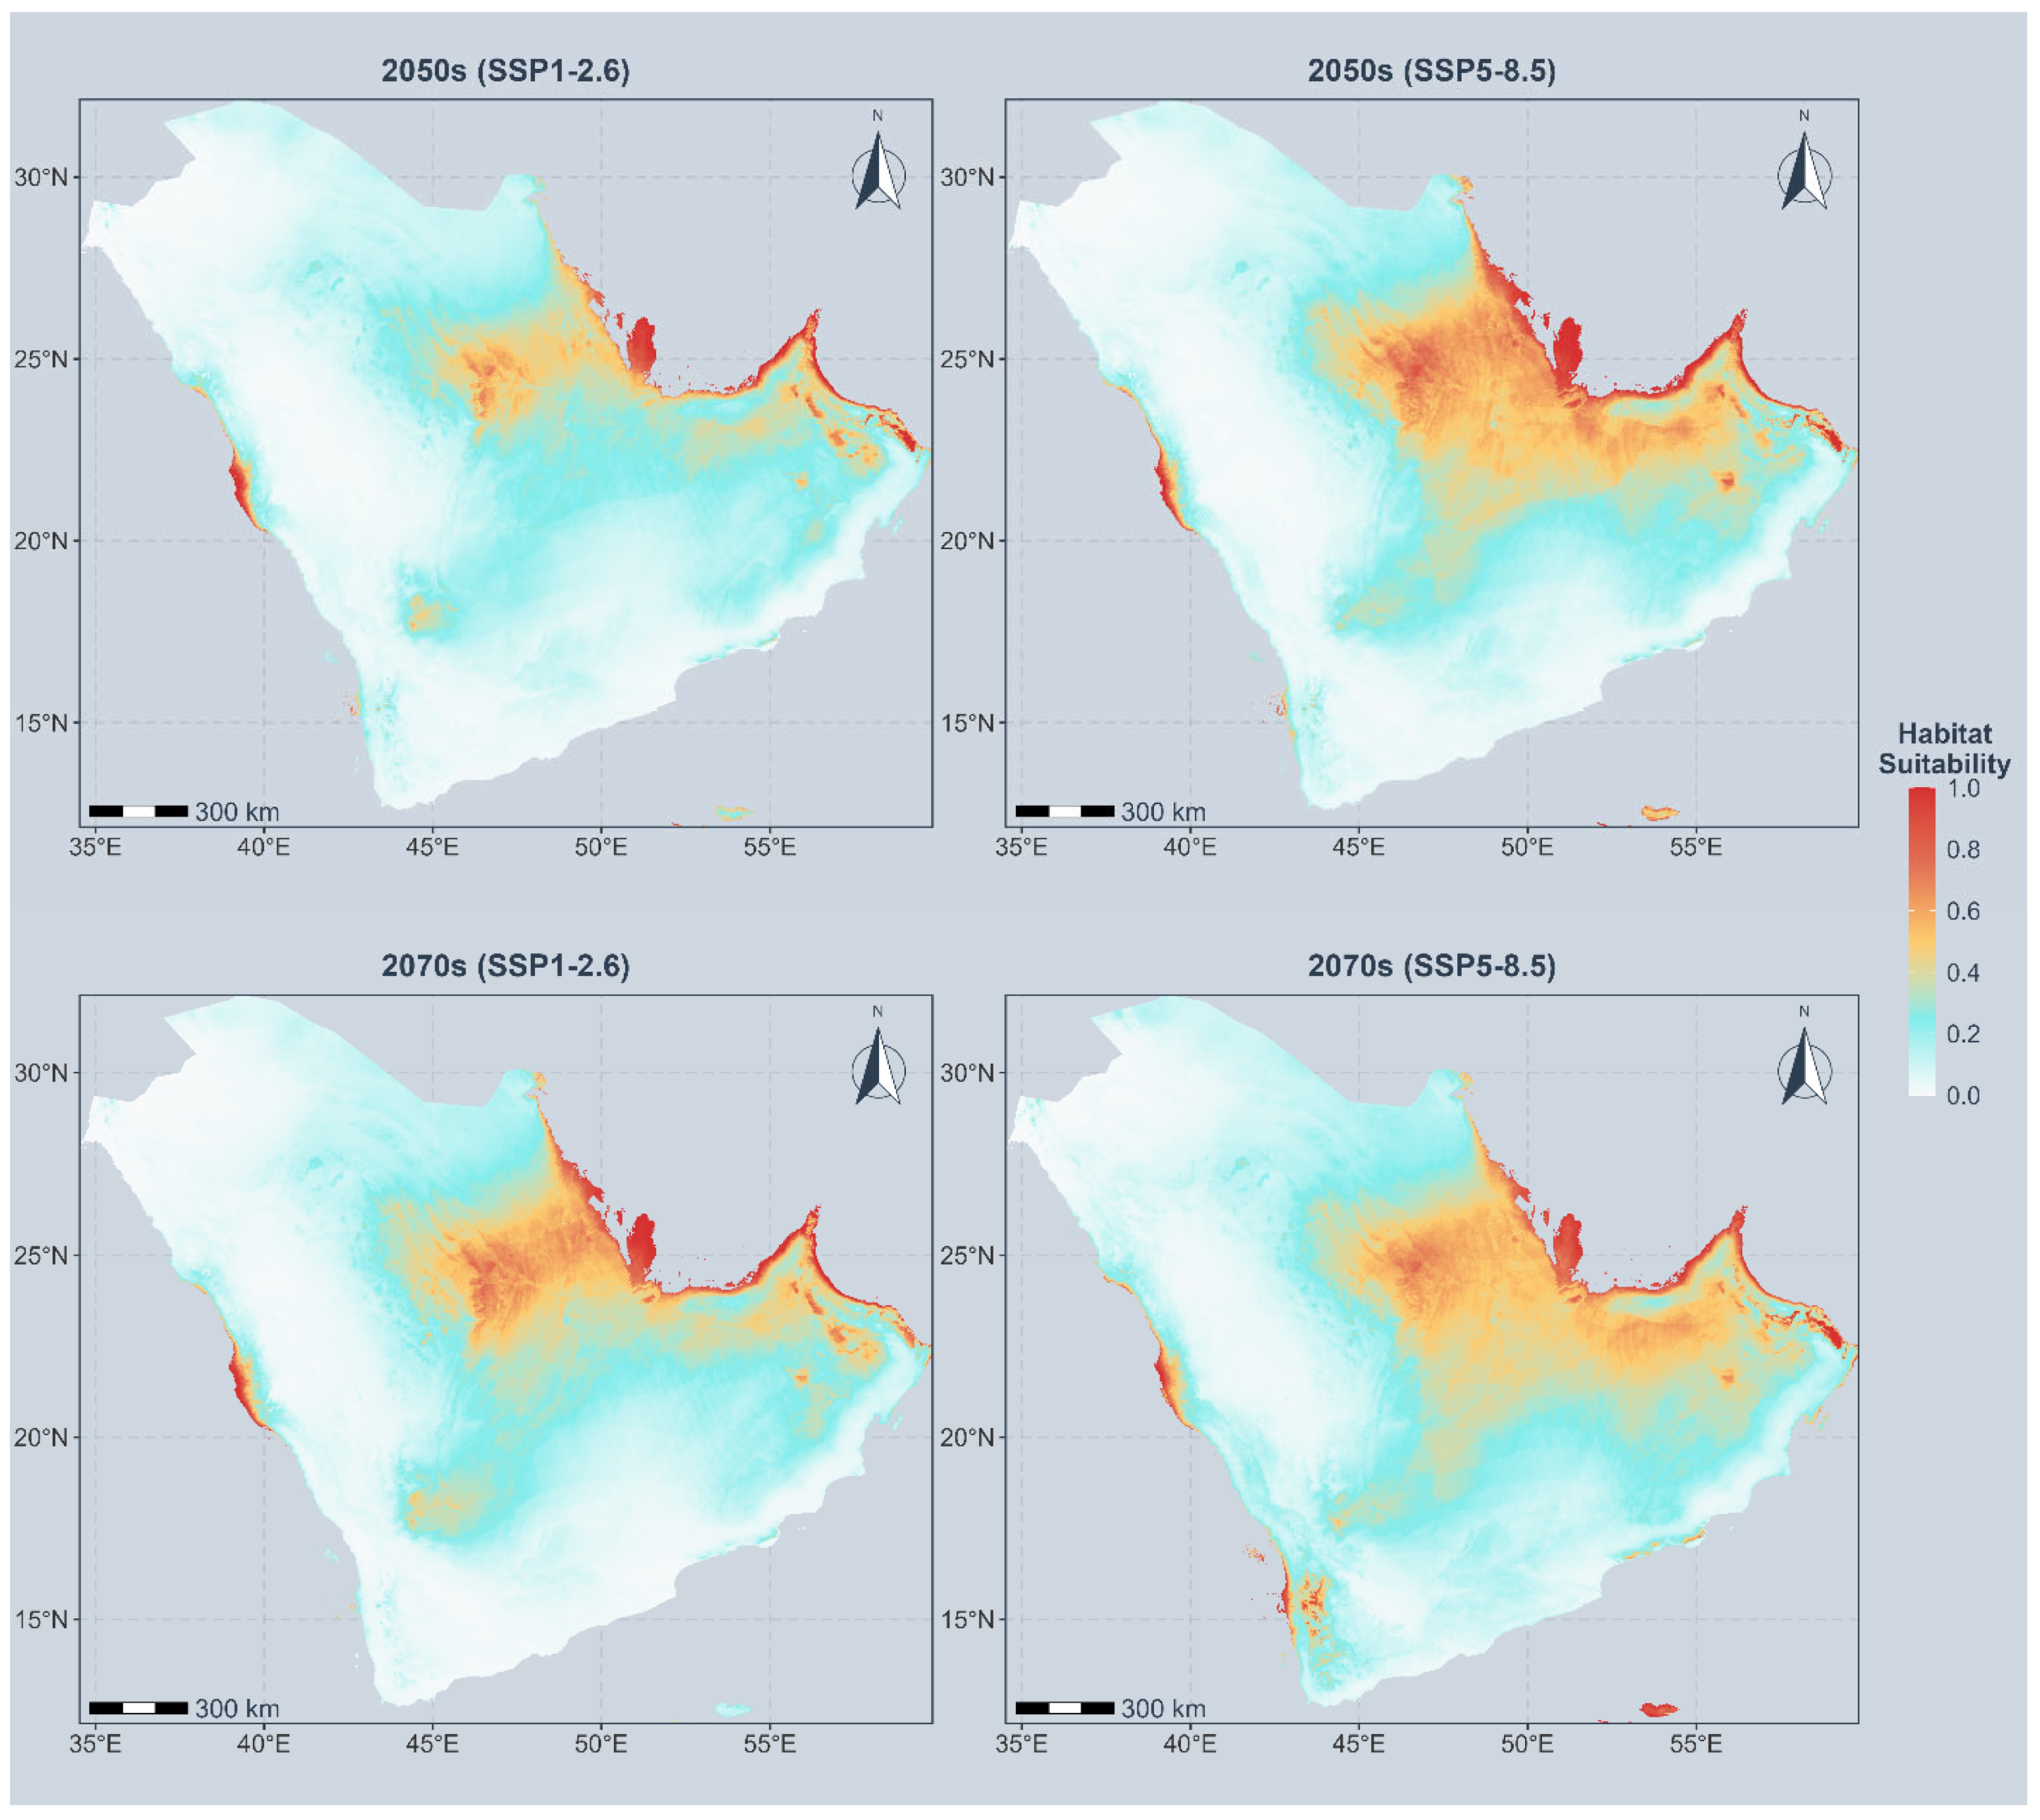
Under both climate scenarios, the model projected a net expansion of suitable habitat for R. ferrugineus across the Arabian Peninsula by mid- and late-century, with the magnitude of change increasing markedly under the high-emission pathway (Figure 6; Supplementary Materials File S7). Under SSP1-2.6, suitable habitat is projected to increase from the current 727,589.8 km2 (26.11%) to 788,529.9 km2 (28.30%) by 2050 and 950,606.3 km2 (34.12%) by 2070, representing expansions of 16.34% and 31.60% relative to the current distribution, respectively. Contraction under this scenario was minimal, declining from 7.97% in 2050 to 0.95% by 2070, suggesting progressive habitat consolidation under moderate warming. Under the high-emission SSP5-8.5 scenario, projections were considerably more pronounced, with suitable area reaching 943,543.5 km2 (33.86%) by 2050 and 1,158,474.8 km2 (41.58%) by 2070—equivalent to expansions of 34.11% and 60.15%, respectively. Contraction under SSP5-8.5 was similarly negligible (4.43% in 2050; 0.93% in 2070), further underscoring the predominantly expansionary trajectory of the species’ range under intensified warming.
Spatially, the projected expansion was most conspicuous across the central and northern interior of Saudi Arabia, where areas previously classified as moderately or marginally suitable transitioned toward higher suitability values under both scenarios (Figure 6). The eastern Arabian Gulf coastline and the UAE maintained consistently high suitability scores across all time periods and scenarios, reinforcing these zones as core refugia for the species. Under SSP5-8.5 by 2070, high suitability values extended further inland and southward into previously marginal areas, reflecting the increasing influence of altered precipitation regimes and thermal conditions on habitat configuration.
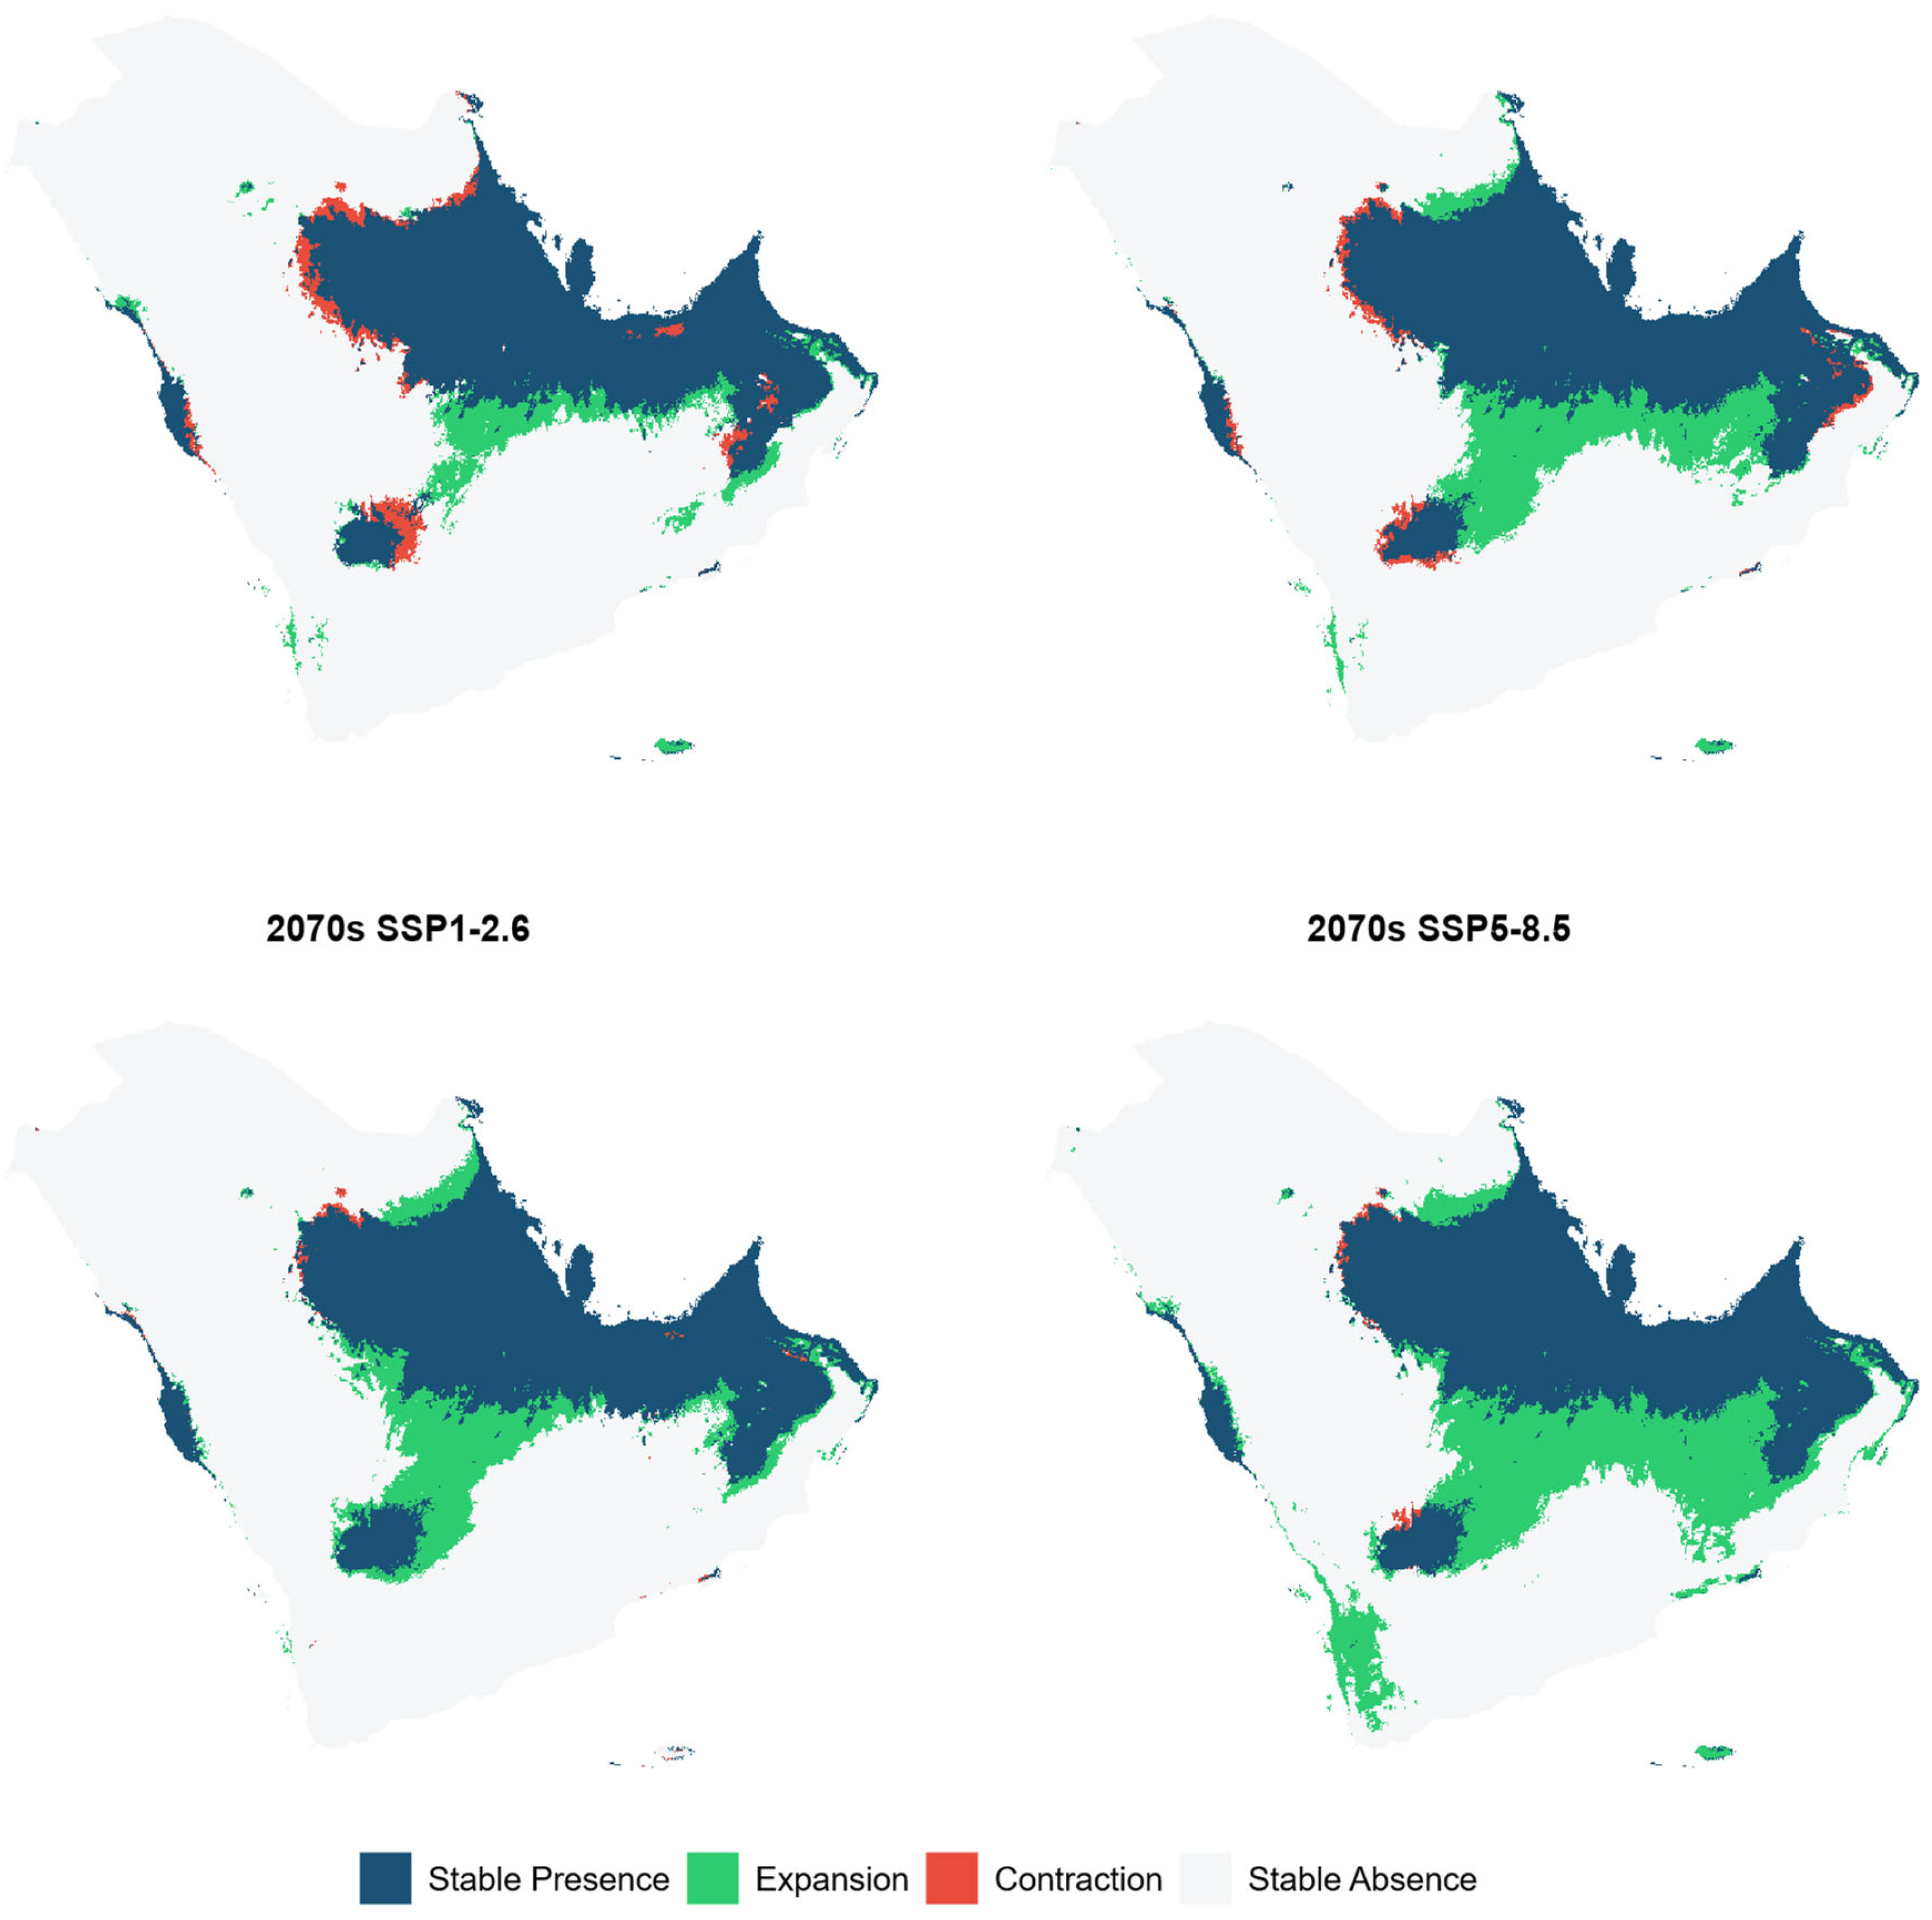
The binary change maps (Figure 7) corroborate these patterns, illustrating that stable presence dominated the northeastern portions of the peninsula across all scenarios, while range expansion progressively encroached into central Saudi Arabia and parts of Yemen and Oman, particularly under SSP5-8.5 by 2070. Contraction zones, shown in red, were spatially restricted and largely confined to localized areas along the western Red Sea coastal plain, consistent with the relatively low contraction percentages reported across all scenarios. The near-absence of contraction by 2070 under both pathways suggests that climatically suitable conditions are unlikely to deteriorate substantially within the species’ current range, implying a unidirectional range shift dynamic driven primarily by habitat gain rather than displacement.

4. Discussion

This correlative MaxEnt analysis suggests that the distribution of R. ferrugineus across the Arabian Peninsula is associated primarily with hydroclimatic conditions, especially precipitation of the coldest quarter and precipitation seasonality, whereas the temperature variables retained after collinearity filtering contributed less strongly to the final model [18,19,20,21]. Because the model was built from presence-only records and evaluated within the same bias-corrected sampling framework, these results should be interpreted as statistically supported spatial associations rather than direct evidence of causation [18,20,22]. Even so, the pattern is ecologically plausible. R. ferrugineus larvae develop concealed within palm tissues, and successful establishment is likely influenced by the physiological condition of the host plant; in date-palm agroecosystems, water availability and seasonal moisture regime are therefore likely to matter because they influence host vigor, tissue condition, and the buffering capacity of the surrounding agroenvironment [9,34,39]. In this sense, Bio 19 and Bio 15 may function as broad climatic proxies for host hydration status and the degree to which irrigated palm landscapes remain permissive for the pest, rather than as direct measures of local microclimate. Any interpretation invoking microclimatic buffering should therefore remain cautious, because the climatic layers used here describe regional conditions and do not explicitly resolve canopy-level or irrigation-driven heterogeneity.
Elevation emerged as the strongest contributor in percent contribution, but its low permutation importance indicates that its explanatory value is largely shared with other predictors rather than independent [20,21]. This pattern suggests that elevation is acting mainly as a composite surrogate for lowland environmental structure in the Arabian Peninsula, where altitude co-varies with temperature regime, atmospheric moisture, exposure, and the distribution of intensive palm cultivation [30,31,32,34,39]. The response curve, in which suitability is concentrated below low elevations and declines sharply at higher altitudes, is consistent with the species’ strong association with coastal plains, oasis systems, and irrigated agricultural belts. However, this should not be read as evidence that elevation itself constrains the insect directly; rather, it likely captures a set of correlated ecological conditions that are favorable in low-lying palm-growing areas. Mean diurnal temperature range showed a secondary but meaningful effect, with greater suitability under narrower daily thermal fluctuations. This pattern is consistent with the expectation that thermally stable environments may support more favorable host and insect conditions than highly variable interiors, although the variable should again be viewed as a broad climatic proxy rather than a mechanistic measurement of physiological stress.
The spatial pattern of current suitability reinforces this interpretation. High-suitability areas are concentrated along the eastern Arabian Gulf coastline and the western Red Sea plain, with additional moderate suitability extending through transitional zones in central Saudi Arabia and parts of Oman. These are also the regions where date palm cultivation is most extensive, which suggests that host distribution likely reinforces the realized risk landscape even though host availability was not explicitly included as a predictor. That omission is important: climate-only suitability should not be equated with realized occupancy, particularly for a pest whose spread is tightly linked to cultivated palms and human-mediated movement of infested planting material. The correspondence between predicted suitability and known occurrence clusters therefore supports the ecological plausibility of the model, but it may also partly reflect the concentration of records in accessible agricultural landscapes [9,11]. For that reason, the mapped suitability should be interpreted as a conservative estimate of potential risk, especially in areas where host density and irrigation infrastructure may extend establishment beyond what climate alone would predict.
The projected expansion under both SSP1-2.6 and SSP5-8.5 suggests that the climatic envelope suitable for R. ferrugineus is likely to broaden across much of the peninsula by mid- and late-century. This finding is ecologically consistent with the general expectation that climate change can increase suitability for warm-adapted invasive species in regions where hydroclimatic constraints are relaxed [7]. Under the high-emission scenario, the larger expansion likely reflects stronger shifts in seasonal moisture conditions and evaporative demand, which may reduce the climatic barriers currently limiting establishment in marginal inland zones. In arid landscapes such as the Arabian Peninsula, relatively small changes in precipitation timing and moisture balance can have disproportionate effects on the persistence of irrigated agroecosystems and the degree of environmental buffering available to pests. Nevertheless, these effects should be interpreted as scenario-based projections of climatic permissiveness rather than as deterministic forecasts of actual spread, because the model does not include dispersal limitation, pest management, or host distribution dynamics [5,7].
The near-absence of contraction across scenarios is also informative. It suggests that the current core areas of suitability are likely to remain climatically favorable, while the dominant future signal is one of habitat gain rather than replacement of existing suitable zones. This pattern is consistent with the response curves, which indicate that the species is associated with broad hydroclimatic permissiveness rather than a narrow dependence on highly specialized climatic conditions. In practical terms, that means the eastern Gulf corridor and associated palm-growing districts may continue to function as stable source areas, while central and northern parts of Saudi Arabia become increasingly permissive under future climates. However, because the study is correlative, these projections should be viewed as relative risk surfaces that identify where the climate becomes more suitable, not as direct predictions that populations will necessarily establish there without dispersal opportunity and host availability.
The choice of MaxEnt is defensible for this question because the available data are presence-only, spatially thinned, and relatively limited in sample size, which makes many alternative modeling frameworks less suitable or less stable [18,19,20,58]. MaxEnt also has well-established procedures for sampling-bias correction, feature-class tuning, and regularization, all of which are important when projecting into future climates [20,21,57,63]. At the same time, the method remains correlative and therefore cannot infer mechanism in a causal sense. Its value here lies in structured inference: it identifies the climatic combinations associated with known occurrences and translates them into spatially explicit risk estimates. The relatively strong AUC and TSS values indicate good model discrimination, but they do not remove the need for caution in interpretation, especially given the dependence of the output on background selection, collinearity filtering, and the assumption that the species–climate relationship is sufficiently stable to be projected forward [20,21,64,65,66,67,68].
From an applied perspective, the findings support surveillance prioritization in coastal lowlands, irrigated agricultural zones, and transitional inland areas projected to become suitable under future climates. This is particularly important because R. ferrugineus is a cryptic internal feeder, making early detection difficult and allowing populations to persist until damage is advanced [9,11]. The concentration of occurrence records in major palm-growing districts also emphasizes that biosecurity planning should integrate host distribution, movement pathways, and local management intensity rather than relying on climate alone. In that regard, future modelling efforts would benefit from explicit host-layer data, irrigation intensity, land-use information, and dispersal processes, all of which would improve realism and help distinguish climatic suitability from realized invasion risk [27]. Such integration would be especially valuable in regions where date palm cultivation creates anthropogenic refugia that may partially decouple pest persistence from regional aridity. More generally, the present results should be understood as a conservative climatic baseline for risk assessment, one that is robust enough to guide current planning but still incomplete without host and land-use dimensions.
Overall, the model indicates that hydroclimatic conditions, lowland structure, and the spatial distribution of date-palm agroecosystems are likely to shape the current and future suitability of the Arabian Peninsula for R. ferrugineus [9,34,39]. The principal ecological message is not that warming alone will uniformly drive expansion, but rather that changing precipitation regimes and moisture balance may relax the environmental constraints that currently limit the pest in arid interior landscapes. Because the model is correlative, this conclusion should be framed as a projection of increased climatic suitability, not a confirmation of future invasion. Even with that limitation, the consistency between the response curves, the geographic pattern of suitability, and the known biology of the species suggests that the projections are biologically coherent and operationally useful for biosecurity planning [5,7,18,19,20,21,22].

5. Conclusions

This study provides a bias-aware MaxEnt assessment of current and future habitat suitability for R. ferrugineus across the Arabian Peninsula under SSP climate scenarios. The model performed well and suggests that precipitation of the coldest quarter and precipitation seasonality are the main environmental correlates of habitat suitability, indicating that hydroclimatic constraints may be more influential than temperature alone in this system. Currently, approximately 26.11% of the peninsula is predicted to be suitable habitat, concentrated along the eastern Arabian Gulf coastline and the western Red Sea plain. Under both SSP1-2.6 and SSP5-8.5, the projections indicate a predominantly expansionary trajectory, with suitable area increasing to 41.58% of the peninsula by 2070 under the high-emission scenario, while habitat contraction remains negligible across all pathways. These results suggest an increasing climate-related risk to date palm agroecosystems and provide spatially explicit, scenario-based risk surfaces that may help prioritize surveillance, quarantine planning, and integrated pest management across the region. Future work integrating host distribution, irrigation infrastructure, and mechanistic physiological processes would further improve the translation of climatic suitability into long-term biosecurity planning.

Supplementary Materials

The following supporting information can be downloaded at: https://www.mdpi.com/article/10.3390/agronomy16131286/s1, Table S1 provides occurrence records of Rhynchophorus ferrugineus in the Arabian Peninsula, including country, locality, geographic coordinates, data source, and year of collection (Supplementary File S1). Table S2 presents the list of environmental variables used in the distribution modelling of R. ferrugineus, including their description, units, and sources (Supplementary File S2). Table S3 reports the Variance Inflation Factor (VIF) analysis of environmental variables before and after selection, where variables with VIF > 5 were iteratively removed (Supplementary File S3). Table S4 describes the five primary General Circulation Models (GCMs) used for future habitat suitability predictions, including institution, native resolution, ensemble member, and priority (Supplementary File S4). Table S5 summarizes hyperparameter tuning results for the MaxEnt model, including feature class combinations, regularization multipliers, evaluation metrics (AUC, CBI, OR), and AICc-based model selection (Supplementary File S5). Table S6 presents model performance across 10 bootstrap replicates, including training AUC, test AUC, and True Skill Statistic (TSS), reported as mean ± standard deviation (Supplementary File S6). Table S7 provides predicted current and future suitable habitat area (km2 and %) for R. ferrugineus under SSP1-2.6 and SSP5-8.5 for 2050 and 2070, including expansion and contraction estimates (Supplementary File S7).

Author Contributions

Conceptualization, H.M.A.D. and M.S.A.-D.; methodology, H.M.A.D. and M.S.A.-D.; software, M.S.A.-D.; validation, H.M.A.D., M.S.A.-D., I.E. and A.M.; formal analysis, H.M.A.D. and M.S.A.-D.; investigation, H.M.A.D., M.S.A.-D., I.E. and A.M.; resources, H.M.A.D.; data curation, H.M.A.D. and M.S.A.-D.; writing—original draft preparation, A.M.; writing—review and editing, H.M.A.D., M.S.A.-D., I.E. and A.M.; visualization, A.M.; supervision, H.M.A.D. and M.S.A.-D.; project administration, H.M.A.D.; funding acquisition, H.M.A.D. All authors have read and agreed to the published version of the manuscript.

Funding

This research was supported by the Ongoing Research Funding Program (ORF-2026-1241), King Saud University, Riyadh, Saudi Arabia.

Data Availability Statement

Data supporting this study are included within the article and/or its Supplementary Materials.

Acknowledgments

The authors gratefully acknowledge the valuable support and continuous assistance provided by Mustafa Soliman during this study. The authors gratefully acknowledge the technical staff of the King Saud University Museum of Arthropods (KSMA), Saudi Arabia, for their valuable assistance and logistical support during this study. Editorial tools (Curie for Microsoft Word and Paperpal) were used solely to improve language and readability. All scientific content, interpretation, and conclusions were independently developed, reviewed, and validated by the authors.

Conflicts of Interest

The authors declare no conflicts of interest. The funders had no role in the design of the study; in the collection, analyses, or interpretation of data; in the writing of the manuscript; or in the decision to publish the results.

Abbreviations

The following abbreviations are used in this manuscript:
AUCArea Under the Receiver Operating Characteristic Curve
Bio 2Mean Diurnal Temperature Range
Bio 4Temperature Seasonality
Bio 10Mean Temperature of the Warmest Quarter
Bio 15Precipitation Seasonality
Bio 19Precipitation of the Coldest Quarter
BOLDBarcode of Life Data System
CMIP6Coupled Model Intercomparison Project Phase 6
DEMDigital Elevation Model
ENMEcological Niche Model
ENMevalEcological Niche Model Evaluation (R package)
EPPOEuropean and Mediterranean Plant Protection Organization
FCFeature Class
GBIFGlobal Biodiversity Information Facility
GCMGeneral Circulation Model
GFDL-ESM4Geophysical Fluid Dynamics Laboratory Earth System Model version 4
GISGeographic Information System
GDEMGlobal Digital Elevation Model
HHinge (feature class)
IPCCIntergovernmental Panel on Climate Change
IPSL-CM6A-LRInstitut Pierre-Simon Laplace Climate Model 6A Low Resolution
ISIMIP3bInter-Sectoral Impact Model Intercomparison Project phase 3b
LLinear (feature class)
LQLinear-Quadratic (feature class combination)
LQHLinear-Quadratic-Hinge (feature class combination)
LQHPLinear-Quadratic-Hinge-Product (feature class combination)
MaxEntMaximum Entropy (species distribution modelling software)
MPI-ESM1-2-HRMax Planck Institute Earth System Model version 1.2 High Resolution
MRI-ESM2-0Meteorological Research Institute Earth System Model version 2.0
ROCReceiver Operating Characteristic
RMRegularization Multiplier
RPWRed Palm Weevil
SDMSpecies Distribution Model
SDMtoolboxSpecies Distribution Modelling Toolbox (ArcGIS plugin)
spThinSpatial Thinning (R package)
SSPShared Socioeconomic Pathway
SSP1-2.6Shared Socioeconomic Pathway 1—Radiative Forcing 2.6 W/m2
SSP5-8.5Shared Socioeconomic Pathway 5—Radiative Forcing 8.5 W/m2
TSSTrue Skill Statistic
UAEUnited Arab Emirates
UKESM1-0-LLUnited Kingdom Earth System Model version 1.0 Low Resolution
UN ESCWAUnited Nations Economic and Social Commission for Western Asia
usdmUncertainty Analysis for Species Distribution Models (R package)
VIFVariance Inflation Factor
AICcCorrected Akaike Information Criterion
wAICAkaike Information Criterion Weight
ΔAICcDelta Corrected Akaike Information Criterion

References

  1. Moran, E.V.; Alexander, J.M. Evolutionary responses to global change: Lessons from invasive species. Ecol. Lett. 2014, 17, 637–649. [Google Scholar] [CrossRef] [Scilit] [PubMed]
  2. IPCC. Climate Change 2023: Synthesis Report. Contribution of Working Groups I, II and III to the Sixth Assessment Report of the Intergovernmental Panel on Climate Change; Lee, H., Romero, J., Eds.; Intergovernmental Panel on Climate Change (IPCC): Geneva, Switzerland, 2023; 184p. [Google Scholar]
  3. Stastny, M.; Corley, J.C.; Allison, J.D. Regional adaptation of integrated pest management to control invasive forest insects. Front. Ecol. Environ. 2025, 23, e2829. [Google Scholar] [CrossRef] [Scilit]
  4. Seebens, H.; Meyerson, L.A.; Richardson, D.M.; Lenzner, B.; Tricarico, E.; Courchamp, F.; Aleksanyan, A.; Keskin, E.; Saeedi, H.; Akite, P.; et al. Biological invasions: A global assessment of geographic distributions, long-term trends, and data gaps. Biol. Rev. Camb. Philos. Soc. 2025, 100, 2542–2583. [Google Scholar] [CrossRef] [Scilit] [PubMed]
  5. Elith, J.; Leathwick, J.R. Species distribution models: Ecological explanation and prediction across space and time. Annu. Rev. Ecol. Evol. Syst. 2009, 40, 677–697. [Google Scholar] [CrossRef] [Scilit]
  6. Porfirio, L.L.; Harris, R.M.B.; Lefroy, E.C.; Hugh, S.; Gould, S.F.; Lee, G.; Bindoff, N.L.; Mackey, B. Improving the use of species distribution models in conservation planning and management under climate change. PLoS ONE 2014, 9, e113749. [Google Scholar] [CrossRef] [Scilit] [PubMed]
  7. Bellard, C.; Jeschke, J.M.; Leroy, B.; Mace, G.M. Insights from modeling studies on how climate change affects invasive alien species geography. Ecol. Evol. 2018, 8, 5688–5700. [Google Scholar] [CrossRef] [Scilit] [PubMed]
  8. El-Shafie, H.A.F.; Faleiro, J.R. Red Palm Weevil Rhynchophorus ferrugineus (Coleoptera: Curculionidae): Global Invasion, Current Management Options, Challenges and Future Prospects. In Invasive Species: Introduction Pathways, Economic Impact, and Possible Management Options; El-Shafie, H.A.F., Ed.; IntechOpen: London, UK, 2020; Chapter 1. [Google Scholar] [CrossRef] [Scilit]
  9. Faleiro, J.R. A review of the issues and management of the red palm weevil Rhynchophorus ferrugineus (Coleoptera: Rhynchophoridae) in coconut and date palm during the last one hundred years. Int. J. Trop. Insect Sci. 2006, 26, 135–154. [Google Scholar] [CrossRef]
  10. Fiaboe, K.K.M.; Peterson, A.T.; Kairo, M.T.K.; Roda, A.L. Predicting the potential worldwide distribution of the red palm weevil Rhynchophorus ferrugineus (Olivier) (Coleoptera: Curculionidae) using ecological niche modeling. Fla. Entomol. 2012, 95, 659–673. [Google Scholar] [CrossRef] [Scilit]
  11. Al-Dosary, N.M.N.; Al-Dobai, S.; Faleiro, J.R. Review on the management of red palm weevil Rhynchophorus ferrugineus Olivier in date palm Phoenix dactylifera L. Emir. J. Food Agric. 2016, 28, 34–44. [Google Scholar] [CrossRef] [Scilit]
  12. Chown, S.L.; Hoffmann, A.A.; Kristensen, T.N.; Angilletta, M.J., Jr.; Stenseth, N.C.; Pertoldi, C. Adapting to climate change: A perspective from evolutionary physiology. Clim. Res. 2010, 43, 3–15. [Google Scholar] [CrossRef] [Scilit]
  13. Ojija, F.; Mng’ong’o, M.; Aloo, B.N.; Mayengo, G.; Helikumi, M. Effect of global climate change on insect populations, distribution, and its dynamics. J. Asia-Pac. Entomol. 2025, 28, 102442. [Google Scholar] [CrossRef] [Scilit]
  14. Neupane, N.; Larsen, E.A.; Ries, L. Ecological forecasts of insect range dynamics: A broad range of taxa includes winners and losers under future climate. Curr. Opin. Insect Sci. 2024, 62, 101159. [Google Scholar] [CrossRef] [Scilit] [PubMed]
  15. Brodie, S.; Smith, J.A.; Muhling, B.A.; Barnett, L.A.K.; Carroll, G.; Fiedler, P.; Bograd, S.J.; Hazen, E.L.; Jacox, M.G.; Andrews, K.S.; et al. Recommendations for quantifying and reducing uncertainty in climate projections of species distributions. Glob. Change Biol. 2022, 28, 6586–6601. [Google Scholar] [CrossRef] [Scilit] [PubMed]
  16. Thomas, S.M.; Verhoeven, M.R.; Walsh, J.R.; Larkin, D.J.; Hansen, G.J.A. Improving species distribution forecasts by measuring and communicating uncertainty: An invasive species case study. Ecology 2024, 105, e4297. [Google Scholar] [CrossRef] [Scilit] [PubMed]
  17. Zurell, D.; Fritz, S.A.; Rönnfeldt, A.; Steinbauer, M.J. Predicting extinctions with species distribution models. Camb. Prism. Extinction 2023, 1, e8. [Google Scholar] [CrossRef] [Scilit] [PubMed]
  18. Phillips, S.J.; Anderson, R.P.; Schapire, R.E. Maximum entropy modeling of species geographic distributions. Ecol. Model. 2006, 190, 231–259. [Google Scholar] [CrossRef] [Scilit]
  19. Phillips, S.J.; Dudík, M. Modeling of species distributions with MaxEnt: New extensions and a comprehensive evaluation. Ecography 2008, 31, 161–175. [Google Scholar] [CrossRef] [Scilit]
  20. Elith, J.; Phillips, S.J.; Hastie, T.; Dudík, M.; Chee, Y.E.; Yates, C.J. A statistical explanation of MaxEnt for ecologists. Divers. Distrib. 2011, 17, 43–57. [Google Scholar] [CrossRef] [Scilit]
  21. Merow, C.; Smith, M.J.; Silander, J.A., Jr. A practical guide to MaxEnt for modeling species’ distributions: What it does, and why inputs and settings matter. Ecography 2013, 36, 1058–1069. [Google Scholar] [CrossRef] [Scilit]
  22. Sillero, N.; Barbosa, A.M. Common mistakes in ecological niche models. Int. J. Geogr. Inf. Sci. 2021, 35, 213–226. [Google Scholar] [CrossRef] [Scilit]
  23. Al-Yahya’ei, M.N.; Oehl, F.; Vallino, M.; Lumini, E.; Redecker, D.; Wiemken, A.; Bonfante, P. Unique arbuscular mycorrhizal fungal communities uncovered in date palm plantations and surrounding desert habitats of Southern Arabia. Mycorrhiza 2011, 21, 195–209. [Google Scholar] [CrossRef] [Scilit] [PubMed]
  24. Ali-Dinar, H.; Munir, M.; Mohammed, M. Drought-tolerance screening of date palm cultivars under water stress conditions in arid regions. Agronomy 2023, 13, 2811. [Google Scholar] [CrossRef] [Scilit]
  25. Ghazanfar, S.A. Biogeography and conservation in the Arabian Peninsula: A present perspective. Plants 2024, 13, 2091. [Google Scholar] [CrossRef] [Scilit] [PubMed]
  26. Manikandan, S.K.; Jenifer, D.A.; Gowda, N.K.; Nair, V.; Al-Ruzouq, R.; Gibril, M.B.A.; Lamghari, F.; Klironomos, J.; Al Hmoudi, M.; Sheteiwy, M.; et al. Advancing date palm cultivation in the Arabian Peninsula and beyond: Addressing stress tolerance, genetic diversity, and sustainable practices. Agric. Water Manag. 2025, 307, 109242. [Google Scholar] [CrossRef] [Scilit]
  27. Allbed, A.; Kumar, L.; Shabani, F. Climate change impacts on date palm cultivation in Saudi Arabia. J. Agric. Sci. 2017, 155, 1203–1218. [Google Scholar] [CrossRef] [Scilit]
  28. United Nations Economic and Social Commission for Western Asia (UN ESCWA). Demographic Trends in the Arab Region: 1950–2030; ESCWA Policy Briefs; UN ESCWA: Beirut, Lebanon, 2025; 12p, Available online: https://www.unescwa.org/sites/default/files/pubs/pdf/demographic-trends-arab-region-1950-2030-english.pdf (accessed on 2 April 2026).
  29. Abrams, M.; Crippen, R.; Fujisada, H. ASTER global digital elevation model (GDEM) and ASTER global water body dataset (ASTWBD). Remote Sens. 2020, 12, 1156. [Google Scholar] [CrossRef] [Scilit]
  30. Lelieveld, J.; Proestos, Y.; Hadjinicolaou, P.; Tanarhte, M.; Tyrlis, E.; Zittis, G. Strongly increasing heat extremes in the Middle East and North Africa (MENA) in the 21st century. Clim. Change 2016, 137, 245–260. [Google Scholar] [CrossRef] [Scilit]
  31. Almazroui, M.; Islam, M.N.; Athar, H.; Jones, P.D.; Rahman, M.A. Recent climate change in the Arabian Peninsula: Annual rainfall and temperature analysis of Saudi Arabia for 1978–2009. Int. J. Climatol. 2012, 32, 953–966. [Google Scholar] [CrossRef] [Scilit]
  32. Hasanean, H.; Almazroui, M. Rainfall: Features and variations over Saudi Arabia—A review. Climate 2015, 3, 578–626. [Google Scholar] [CrossRef] [Scilit]
  33. Al-Ayedh, H.; Hussain, A.; Rizwan-ul-Haq, M.; Al-Jabr, A.M. Status of insecticide resistance in field-collected populations of Rhynchophorus ferrugineus (Olivier) (Coleoptera: Curculionidae). Int. J. Agric. Biol. 2016, 18, 103–110. [Google Scholar] [CrossRef] [Scilit]
  34. Aleid, S.M.; Al-Khayri, J.M.; Al-Bahrany, A.M. Date palm status and perspective in Saudi Arabia. In Date Palm Genetic Resources and Utilization: Volume 2: Asia and Europe; Springer: Dordrecht, The Netherlands, 2015; pp. 49–95. [Google Scholar] [CrossRef] [Scilit]
  35. European and Mediterranean Plant Protection Organization (EPPO). Rhynchophorus ferrugineus (RHYCFE). EPPO Global Database. Available online: https://gd.eppo.int/taxon/RHYCFE (accessed on 5 May 2026).
  36. Abraham, V.A.; Al-Shuaibi, M.A.; Faleiro, J.R.; Abozuhairah, R.A.; Vidyasagar, P.S.P.V. An integrated management approach for red palm weevil Rhynchophorus ferrugineus Oliv., a key pest of date palm in the Middle East. J. Agric. Mar. Sci. 1998, 3, 77–83. [Google Scholar] [CrossRef] [Scilit]
  37. Abraham, V.A.; Faleiro, J.R.; Al Shuaibi, M.A.; Al Abdan, S. Status of pheromone trap captured female red palm weevils from date gardens in Saudi Arabia. J. Trop. Agric. 2006, 39, 197–199. [Google Scholar]
  38. Al-Yahyai, R.A.; Al-Kharusi, L.M.; Khan, M.M.; Al-Adawi, A.O.; Al-Subhi, A.M.; Al-Kalbani, B.S.; Al-Sadi, A.M. Biotic and abiotic stresses of major fruit crops in Oman: A review. J. Agric. Mar. Sci. 2022, 27, 16–37. [Google Scholar] [CrossRef] [Scilit]
  39. Giblin-Davis, R.M.; Faleiro, J.R.; Jacas, J.A.; Peña, J.E.; Vidyasagar, P.S.P.V. Biology and management of the red palm weevil. In Potential Invasive Pests of Agricultural Crops; CABI: Wallingford, UK, 2013; pp. 1–44. [Google Scholar] [CrossRef] [Scilit]
  40. Hussain, A.; Rizwan-ul-Haq, M.; Al-Jabr, A.M.; Al-Ayied, H.Y. Managing invasive populations of red palm weevil. J. Food Agric. Environ. 2013, 11, 456–463. [Google Scholar]
  41. Ba-Angood, S.A. Date palm status in Yemen. In Date Palm Genetic Resources and Utilization; Springer: Berlin/Heidelberg, Germany, 2015; pp. 241–263. [Google Scholar] [CrossRef] [Scilit]
  42. Abdel-Baky, N.F.; Aldeghairi, M.A.; Motawei, M.I.; Al-Shuraym, L.A.M.; Al-Nujiban, A.A.S.; Alharbi, M.T.M.; Rehan, M. Monitoring infestation percentages of red palm weevil. Braz. J. Biol. 2022, 82, e263707. [Google Scholar] [CrossRef] [Scilit] [PubMed]
  43. Aiello-Lammens, M.E.; Boria, R.A.; Radosavljevic, A.; Vilela, B.; Anderson, R.P. spThin: R package for spatial thinning. Ecography 2015, 38, 541–545. [Google Scholar] [CrossRef] [Scilit]
  44. R Core Team. R: A Language and Environment for Statistical Computing; R Foundation for Statistical Computing: Vienna, Austria, 2024; Available online: https://www.R-project.org/ (accessed on 12 April 2026).
  45. Veloz, S.D. Spatially autocorrelated sampling falsely inflates measures of accuracy for presence-only niche models. J. Biogeogr. 2009, 36, 2290–2299. [Google Scholar] [CrossRef] [Scilit]
  46. Phillips, S.J.; Dudík, M.; Elith, J.; Graham, C.H.; Lehmann, A.; Leathwick, J.; Ferrier, S. Sample selection bias in presence-only models. Ecol. Appl. 2009, 19, 181–197. [Google Scholar] [CrossRef] [Scilit] [PubMed]
  47. Brown, J.L. SDMtoolbox. Methods Ecol. Evol. 2014, 5, 694–700. [Google Scholar] [CrossRef] [Scilit]
  48. Brown, J.L.; Bennett, J.R.; French, C.M. SDMtoolbox 2.0. PeerJ 2017, 5, e4095. [Google Scholar] [CrossRef] [Scilit] [PubMed]
  49. Abatzoglou, J.T.; Dobrowski, S.Z.; Parks, S.A.; Hegewisch, K.C. TerraClimate dataset. Sci. Data 2018, 5, 170191. [Google Scholar] [CrossRef] [Scilit] [PubMed]
  50. Gorelick, N.; Hancher, M.; Dixon, M.; Ilyushchenko, S.; Thau, D.; Moore, R. Google Earth Engine. Remote Sens. Environ. 2017, 202, 18–27. [Google Scholar] [CrossRef] [Scilit]
  51. Fick, S.E.; Hijmans, R.J. WorldClim 2: New 1-km spatial resolution climate surfaces for global land areas. Int. J. Climatol. 2017, 37, 4302–4315. [Google Scholar] [CrossRef] [Scilit]
  52. Lange, S.; Büchner, M. ISIMIP3b bias-adjusted atmospheric climate input data (v1.1). ISIMIP Repos. 2021. [Google Scholar] [CrossRef] [Scilit]
  53. Eyring, V.; Bony, S.; Meehl, G.A.; Senior, C.A.; Stevens, B.; Stouffer, R.J.; Taylor, K.E. Overview of CMIP6 experimental design and organization. Geosci. Model Dev. 2016, 9, 1937–1958. [Google Scholar] [CrossRef] [Scilit]
  54. O’Neill, B.C.; Tebaldi, C.; van Vuuren, D.P.; Eyring, V.; Friedlingstein, P.; Hurtt, G.; Knutti, R.; Kriegler, E.; Lamarque, J.-F.; Lowe, J.; et al. ScenarioMIP for CMIP6. Geosci. Model Dev. 2016, 9, 3461–3482. [Google Scholar] [CrossRef] [Scilit]
  55. Riahi, K.; van Vuuren, D.P.; Kriegler, E.; Edmonds, J.; O’Neill, B.C.; Fujimori, S.; Bauer, N.; Calvin, K.; Dellink, R.; Fricko, O.; et al. Shared Socioeconomic Pathways overview. Glob. Environ. Change 2017, 42, 153–168. [Google Scholar] [CrossRef] [Scilit]
  56. Knutti, R.; Furrer, R.; Tebaldi, C.; Cermak, J.; Meehl, G.A. Challenges in combining climate model projections. J. Clim. 2010, 23, 2739–2758. [Google Scholar] [CrossRef] [Scilit]
  57. Phillips, S.J.; Dudík, M.; Schapire, R.E. Maxent Software for Modeling Species Niches and Distributions, Version 3.4.1. Available online: http://biodiversityinformatics.amnh.org/open_source/maxent/ (accessed on 16 June 2026).
  58. Elith, J.; Graham, C.H.; Anderson, R.P.; Dudík, M.; Ferrier, S.; Guisan, A.; Hijmans, R.J.; Huettmann, F.; Leathwick, J.R.; Lehmann, A.; et al. Novel methods for species distribution prediction. Ecography 2006, 29, 129–151. [Google Scholar] [CrossRef] [Scilit]
  59. Yan, H.; He, J.; Zhao, Y.; Zhang, L.; Zhu, C.; Wu, D. Climate response of Gentiana macrophylla. Glob. Ecol. Conserv. 2020, 22, e00948. [Google Scholar] [CrossRef] [Scilit]
  60. Khanum, R.; Mumtaz, A.S.; Kumar, S. Predicting impacts of climate change on medicinal asclepiads of Pakistan using Maxent modeling. Acta Oecol. 2013, 49, 23–31. [Google Scholar] [CrossRef] [Scilit]
  61. Gebrewahid, Y.; Abrehe, S.; Meresa, E.; Eyasu, G.; Abay, K.; Gebreab, G.; Kidanemariam, K.; Adissu, G.; Abreha, G. Current and future potential distribution areas of Oxytenanthera abyssinica (A. Richard) using MaxEnt model under climate change in Northern Ethiopia. Ecol. Process. 2020, 9, 6. [Google Scholar] [CrossRef] [Scilit]
  62. Kass, J.M.; Muscarella, R.; Galante, P.J.; Bohl, C.L.; Pinilla-Buitrago, G.E.; Boria, R.A.; Soley-Guardia, M.; Anderson, R.P. ENMeval 2.0. Methods Ecol. Evol. 2021, 12, 1602–1608. [Google Scholar] [CrossRef] [Scilit]
  63. Muscarella, R.; Galante, P.J.; Soley-Guardia, M.; Boria, R.A.; Kass, J.M.; Uriarte, M.; Anderson, R.P. ENMeval R package. Methods Ecol. Evol. 2014, 5, 1198–1205. [Google Scholar] [CrossRef] [Scilit]
  64. Warren, D.L.; Seifert, S.N. Maxent model complexity. Ecol. Appl. 2011, 21, 335–342. [Google Scholar] [CrossRef] [Scilit] [PubMed]
  65. Swets, J.A. Measuring the accuracy of diagnostic systems. Science 1988, 240, 1285–1293. [Google Scholar] [CrossRef] [Scilit] [PubMed]
  66. Allouche, O.; Tsoar, A.; Kadmon, R. Assessing the accuracy of species distribution models: Prevalence, kappa and the true skill statistic (TSS). J. Appl. Ecol. 2006, 43, 1223–1232. [Google Scholar] [CrossRef] [Scilit]
  67. Liu, C.; White, M.; Newell, G. Measuring and comparing the accuracy of species distribution models with presence–absence data. Ecography 2011, 34, 232–243. [Google Scholar] [CrossRef] [Scilit]
  68. Sofaer, H.R.; Jarnevich, C.S.; Pearse, I.S.; Smyth, R.L.; Auer, S.; Cook, L.G.; Edwards, T.C., Jr.; Guala, G.F.; Howard, T.G.; Morisette, J.T.; et al. Development and delivery of species distribution models to inform decision-making. BioScience 2019, 69, 544–557. [Google Scholar] [CrossRef] [Scilit]
  69. Peterson, A.T.; Papeş, M.; Soberón, J. Rethinking receiver operating characteristic analysis applications in ecological niche modeling. Ecol. Model. 2008, 213, 63–72. [Google Scholar] [CrossRef] [Scilit]
  70. Pearson, R.G.; Raxworthy, C.J.; Nakamura, M.; Peterson, A.T. Predicting species distributions from small numbers of occurrence records: A test case using cryptic geckos in Madagascar. J. Biogeogr. 2007, 34, 102–117. [Google Scholar] [CrossRef] [Scilit]
  71. Barve, N.; Barve, V.; Jiménez-Valverde, A.; Lira-Noriega, A.; Maher, S.P.; Peterson, A.T.; Soberón, J.; Villalobos, F. The crucial role of the accessible area in ecological niche modeling and species distribution modeling. Ecol. Model. 2011, 222, 1810–1819. [Google Scholar] [CrossRef] [Scilit]
  72. Araújo, M.; New, M. Ensemble forecasting of species distributions. Trends Ecol. Evol. 2007, 22, 42–47. [Google Scholar] [CrossRef] [Scilit] [PubMed]
  73. McSweeney, C.F.; Jones, R.G.; Lee, R.W.; Rowell, D.P. Selecting CMIP5 GCMs for downscaling over multiple regions. Clim. Dyn. 2015, 44, 3237–3260. [Google Scholar] [CrossRef] [Scilit]
Figure 1. Geographic distribution of Rhynchophorus ferrugineus occurrence records across the Arabian Peninsula and surrounding regions. Red circles indicate confirmed occurrence localities within the study area (shaded in grey), which includes Saudi Arabia, Yemen, Oman, the United Arab Emirates, Qatar, Bahrain, and Kuwait. The records show a clear clustering pattern in major irrigated agricultural zones across the peninsula, particularly within established date palm cultivation areas (see text for details). The figure provides a spatial overview of the species’ distribution and highlights its association with key agro-ecological regions.
Agronomy 16 01286 g001
Figure 2. Receiver Operating Characteristic (ROC) curve for the MaxEnt species distribution model of Rhynchophorus ferrugineus across the Arabian Peninsula. The red line represents the mean sensitivity (1 − omission rate) plotted against 1 − specificity (fractional predicted area) across replicate model runs, with the blue shading indicating ± one standard deviation.
Agronomy 16 01286 g002
Figure 3. Jackknife analysis of regularized training gain for Rhynchophorus ferrugineus MaxEnt model, illustrating the relative contribution of each environmental predictor variable. Teal bars represent model training gain when the respective variable is excluded; blue bars represent gain when only that variable is used; and the red bar represents the gain of the full model incorporating all variables.
Agronomy 16 01286 g003
Figure 4. Marginal response curves depicting the relationship between Rhynchophorus ferrugineus habitat suitability and the four most influential environmental predictors retained in the MaxEnt model: Bio 19 (precipitation of the coldest quarter), Bio 15 (precipitation seasonality), elevation, and Bio 2 (mean diurnal temperature range). Red lines denote the mean response across replicate model runs; blue shading represents ± one standard deviation. Cloglog denotes the complementary log–log output transformation used by MaxEnt; higher values indicate greater relative suitability.
Agronomy 16 01286 g004
Figure 5. Predicted habitat suitability map for Rhynchophorus ferrugineus in the Arabian Peninsula. The color gradient represents the probability of occurrence, ranging from low suitability (0.0, white/light blue) to high suitability (1.0, dark red).
Agronomy 16 01286 g005
Figure 6. Projected future habitat suitability for Rhynchophorus ferrugineus in the Arabian Peninsula under different climate change scenarios. The panels display model outputs for the 2050s and 2070s based on two Shared Socioeconomic Pathways (SSPs): SSP1-2.6 (sustainability/low emissions) and SSP5-8.5 (fossil-fueled development/high emissions). The color gradient represents the probability of occurrence, ranging from low suitability (0.0, white/light blue) to high suitability (1.0, dark red).
Agronomy 16 01286 g006
Figure 7. Predicted changes in the climatic suitability for Rhynchophorus ferrugineus across the Arabian Peninsula for the 2050s and 2070s time periods. Maps represent binary distribution shifts under SSP1-2.6, and SSP5-8.5 climate scenarios compared to current conditions. Status categories indicate areas of stable presence (suitability maintained), range expansion (newly suitable), range contraction (loss of suitability), and stable absence (unsuitable under both current and future conditions).
Agronomy 16 01286 g007
Table 1. Percentage contributions and permutation importance of environmental variables incorporated in the Maximum Entropy (MaxEnt) distribution models for Rhynchophorus ferrugineus, derived from ten model replicates.
VariableDescriptionPercent Contribution (%)Permutation Importance (%)
ElevAltitude (m)36.23.5
Bio15Precipitation seasonality (coefficient of variation)27.429.3
Bio19Precipitation of coldest quarter24.250.2
Bio2Mean diurnal range10.012.3
Bio10Mean temperature of warmest quarter1.74.2
Bio4Temperature seasonality (coefficient of variation)0.60.5
Disclaimer/Publisher’s Note: The statements, opinions and data contained in all publications are solely those of the individual author(s) and contributor(s) and not of MDPI and/or the editor(s). MDPI and/or the editor(s) disclaim responsibility for any injury to people or property resulting from any ideas, methods, instructions or products referred to in the content.