Article

Agricultural and Hydrogeochemical Controls on Nitrate and Sulfate in a Karst Surface Water–Groundwater System


1
Key Laboratory of Fluid and Power Machinery Ministry of Education, Xihua University, Chengdu 610039, China
2
School of Energy and Power Engineering, Xihua University, Chengdu 610039, China
3
114 Geological Brigade of Guizhou Geological and Mineral Exploration and Development Bureau, Zunyi 563000, China
4
Guizhou Provincial Institute of Geology and Mineral Resources Development, Guiyang 550000, China
5
Research Center for Climate Change, Ministry of Water Resources, Nanjing 210029, China
6
State Key Laboratory of Water Disaster Prevention, Hohai University, Nanjing 210098, China
7
Yangtze Institute for Conservation and Development, Nanjing 210098, China
*
Authors to whom correspondence should be addressed.
Agronomy 2026, 16(13), 1281; https://doi.org/10.3390/agronomy16131281
Submission received: 28 May 2026 / Revised: 25 June 2026 / Accepted: 25 June 2026 / Published: 2 July 2026

Abstract

Agricultural karst watersheds are highly vulnerable to nutrient loss because strong surface water–groundwater (SW–GW) connectivity can rapidly transfer nitrogen and sulfur species from soils, agricultural activities, and human settlements into aquatic systems. However, the coupled behavior and contrasting controls of nitrate (NO3) and sulfate (SO42−) in such agroecosystems remain insufficiently understood, limiting effective nutrient and groundwater-quality management. In this study, a typical karst agricultural watershed in Southwest China was selected to investigate the sources, transformation processes, and transport pathways of NO3 and SO42− under strong SW–GW interactions. During the rainy season, 44 groundwater and 40 surface water samples were collected for major hydrochemical and nitrate–sulfate stable isotope analyses. An integrated framework combining hydrochemical analysis, self-organizing maps (SOM), positive matrix factorization (PMF), and MixSIAR were used to identify dominant sources, quantify source contributions, and clarify controlling processes. The results showed that groundwater was mainly characterized by carbonate-controlled Ca-HCO3 facies, whereas surface water exhibited higher mineralization and a shift toward Ca-SO4 facies, indicating stronger external inputs and rapid hydrological responses. Nitrate was primarily controlled by external nitrogen inputs, with manure and sewage and soil nitrogen contributing 39–62% and 16–33%, respectively. Nitrate was also regulated by nitrification under oxic conditions, while denitrification was negligible. In contrast, sulfate was predominantly governed by geogenic processes, with sulfide oxidation contributing 63–83%, while other sources were minor. These contrasting controls resulted in distinct spatial and process behaviors: nitrate showed source-driven variability associated with agricultural and domestic inputs, whereas sulfate displayed process-driven accumulation mainly controlled by water–rock interactions. Strong SW–GW connectivity enhanced the transfer of anthropogenic nutrient signals, while subsurface mixing and buffering regulated their expression in groundwater and surface water. These findings demonstrate a clear decoupling between nitrate and sulfate controls in agricultural karst systems and provide a scientific basis for nutrient pollution control, groundwater protection, and sustainable agricultural water management in vulnerable karst regions.

1. Introduction

Karst aquifers, characterized by extensive carbonate dissolution, fractures, and well-developed conduit network, form highly connected surface water–groundwater (SW–GW) systems with limited contaminant buffering capacity [1,2,3]. The coexistence of surface and subsurface flow, combined with a thin vadose zone and rapid infiltration pathways, results in strong hydrological connectivity and weak natural attenuation [4,5]. Under such conditions, contaminants introduced at the surface can rapidly penetrate into aquifers through sinkholes, fractures, and underground conduits, and they may subsequently re-emerge in surface water via spring discharge or baseflow [6]. This tight coupling between surface water and groundwater significantly enhances solute exchange and influences hydrogeochemical evolution in karst basins.
Nitrate (NO3) and sulfate (SO42−) are two major inorganic pollutants widely observed in karst water environments and are commonly used key indicators of anthropogenic disturbance and geochemical processes [7,8]. Nitrate is commonly associated with agricultural fertilization, soil nitrogen transformation, livestock waste, domestic sewage, and atmospheric deposition [9,10,11]. In contrast, sulfate may derive from more complex sources, including evaporite dissolution, sulfide oxidation, atmospheric inputs, and mining-related activities [12,13]. In karst basins affected by intensive agriculture, rural settlements, and mining activities, these two solutes of ten exhibit overlapping source contributions and strong spatial heterogeneity [14]. However, their coupled transport behavior and source-process interactions under surface water–groundwater exchange remain insufficiently understood.
In recent years, integrated approaches combining hydrochemical indicators, stable isotope techniques, and multivariate statistical models have been widely applied to investigate hydrogeochemical processes and pollution sources in karst systems [4]. Major ion compositions and ion ratios provide insights into dominant water–rock interactions such as carbonate dissolution, sulfate mineral weathering, and ion exchange [9,15], while isotopic tracers (δ15N–NO3 δ18O–NO3, δ34S–SO42−, δ18O–SO42−) enable the identification of pollution sources and biogeochemical transformations, including nitrification, denitrification, and sulfide oxidation [16,17]. Furthermore, data-driven and receptor models provide effective tools for disentangling complex multisource contributions. Despite these advances, most previous studies have focused on individual aspects of karst water pollution. For example, some studies have mainly examined nitrate sources and transformations in karst groundwater or surface-water systems [18,19], whereas others have focused on sulfate sources and related geochemical processes, such as sulfide oxidation and gypsum-dissolution [9]. In addition, several studies have investigated hydrochemical evolution or contaminant transport in karst aquifers without jointly comparing nitrate and sulfate source controls across coupled surface water–groundwater systems [4]. Therefore, the contrasting sources, migration patterns, and controlling mechanisms of nitrate and sulfate under strong surface water–groundwater connectivity remain insufficiently understood, especially in agricultural karst watersheds.
The karst region of Guizhou, Southwest China represents one of the most typical karst landscapes globally, with extensive carbonate rock distribution and a fragile hydrogeochemical environment [6,18]. The Fengshan Township basin in Dafang County is a representative small karst watershed characterized by strong surface water–groundwater interactions and diverse potential pollution sources, including mining activities, livestock waste inputs, and rural domestic discharge. These features make it an ideal natural laboratory for investigating multi-source-contaminant solute transport and hydrogeochemical responses in karst systems.
Against this background, and considering the complex hydrogeochemical setting of the Fengshan Township basin, this study focuses on the contrasting sources and controlling mechanisms of nitrate and sulfate under coupled surface water–groundwater interactions. By integrating hydrochemical indicators, nitrate and sulfate isotopes, SOM, PMF, and Bayesian isotope mixing models, this study provides a multi-evidence framework for identifying nitrate and sulfate sources and revealing their distinct controlling mechanisms in a strongly connected surface water–groundwater system. Specifically, this study aims to: (1) clarify the hydrochemical differentiation between groundwater and surface water under strong surface water–groundwater interactions; (2) reveal the contrasting controls on the sources, spatial distribution, and migration–transformation processes of nitrate and sulfate; and (3) quantify their source contributions and further explore their implications for nitrogen–sulfur cycling and water environment management in karst basins.

2. Materials and Methods

2.1. Study Area

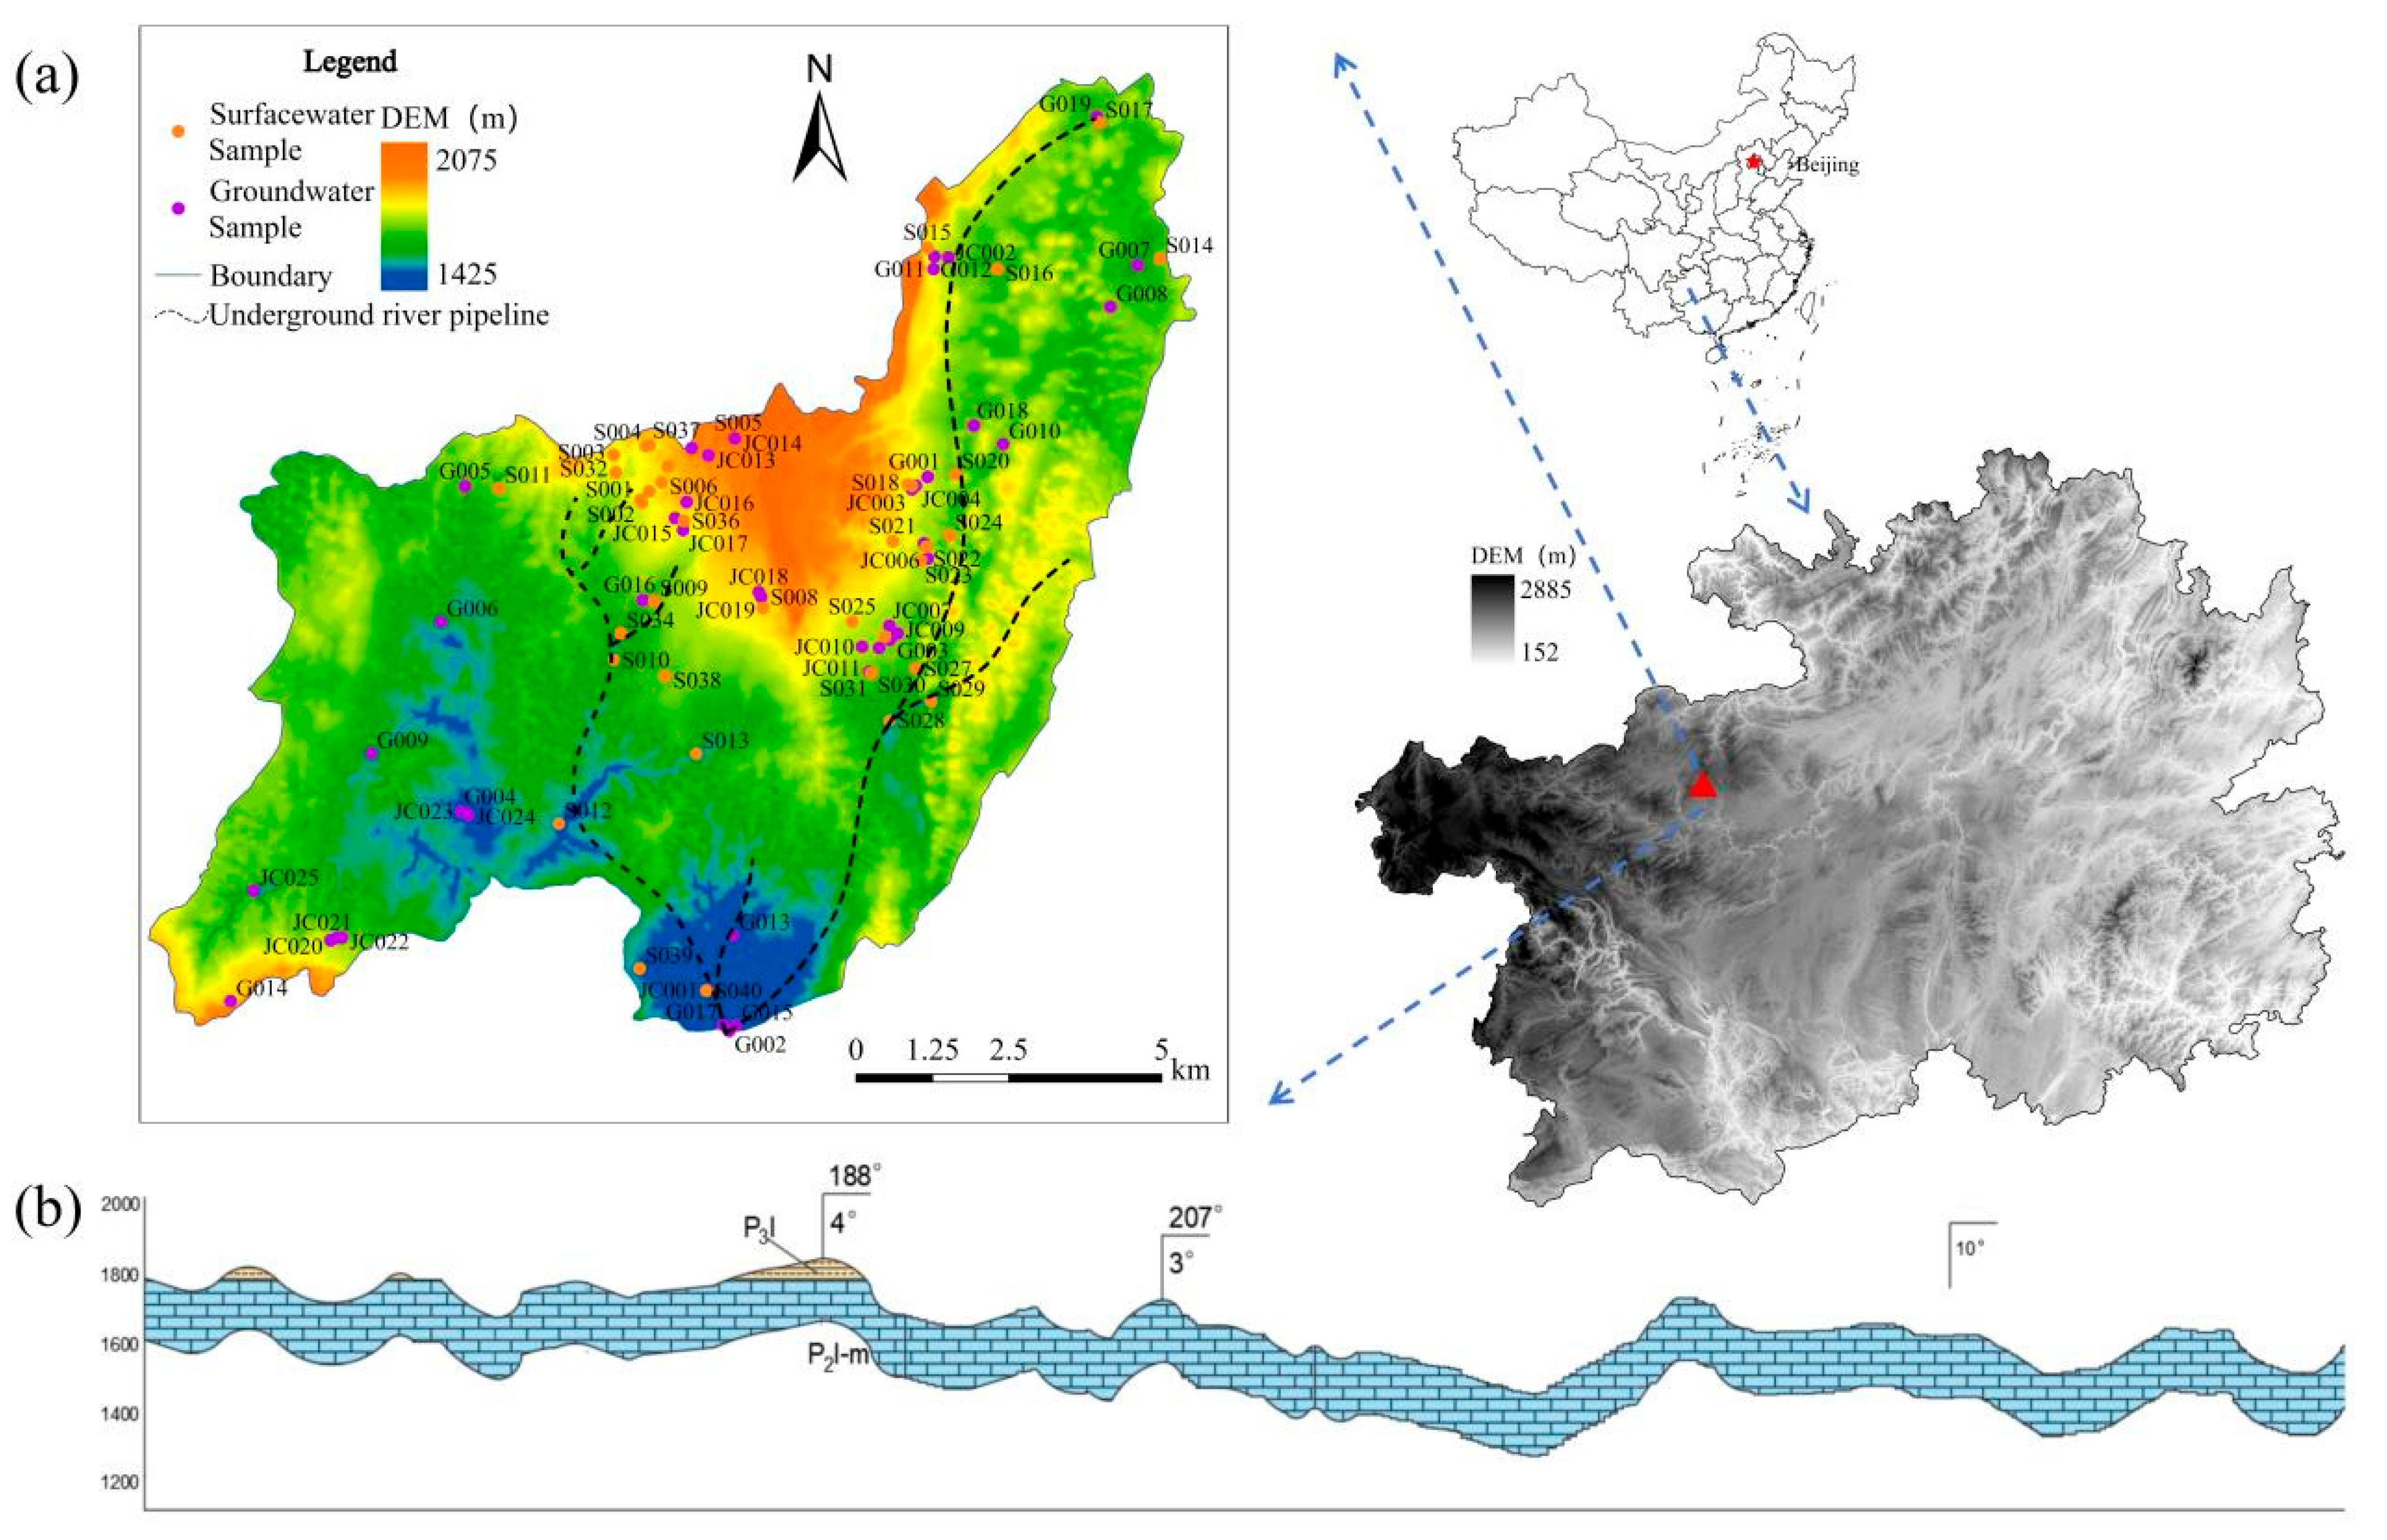
The study area is located in Fengshan Township, eastern Dafang County, Bijie City, Guizhou Province, China (105°36′57″–105°47′46″ E, 27°09′01″–27°18′33″ N), covering an area of approximately 130 km2 (Figure 1). The region has a subtropical humid monsoon climate, with a mean annual temperature of 11.8 °C and a mean annual precipitation of 1155 mm. Precipitation is unevenly distributed throughout the year, and rainfall during the wet season (May to August) reaches 623.18 mm, accounting for 59.64% of the annual total. The study area lies within the Wujiang River system of the Yangtze River Basin and is part of a fourth-order sub-watershed of the Liuchong River, where the Wuxi River serves as the main trunk stream. Karst landforms are strongly developed in the area, promoting frequent exchange between surface runoff and subsurface flow. Soils are mainly distributed within the yellow-soil belt of the mid-subtropical ever-green broad-leaved forest zone and are generally characterized by clay-rich texture and low nutrient availability. The dominant soil types include yellow soil, yellow–brown soil, and paddy soil, which are closely associated with agricultural land use and nutrient cycling in the watershed. Land use in the study area is dominated by forestland and cultivated land, accounting for 54.76% (7758.53 ha) and 35.92% (5088.90 ha) of the total area, respectively. The remaining land-use types, including residential land, mining land, transportation land, water bodies and water conservancy facilities, and industrial land, together account for 9.32%.
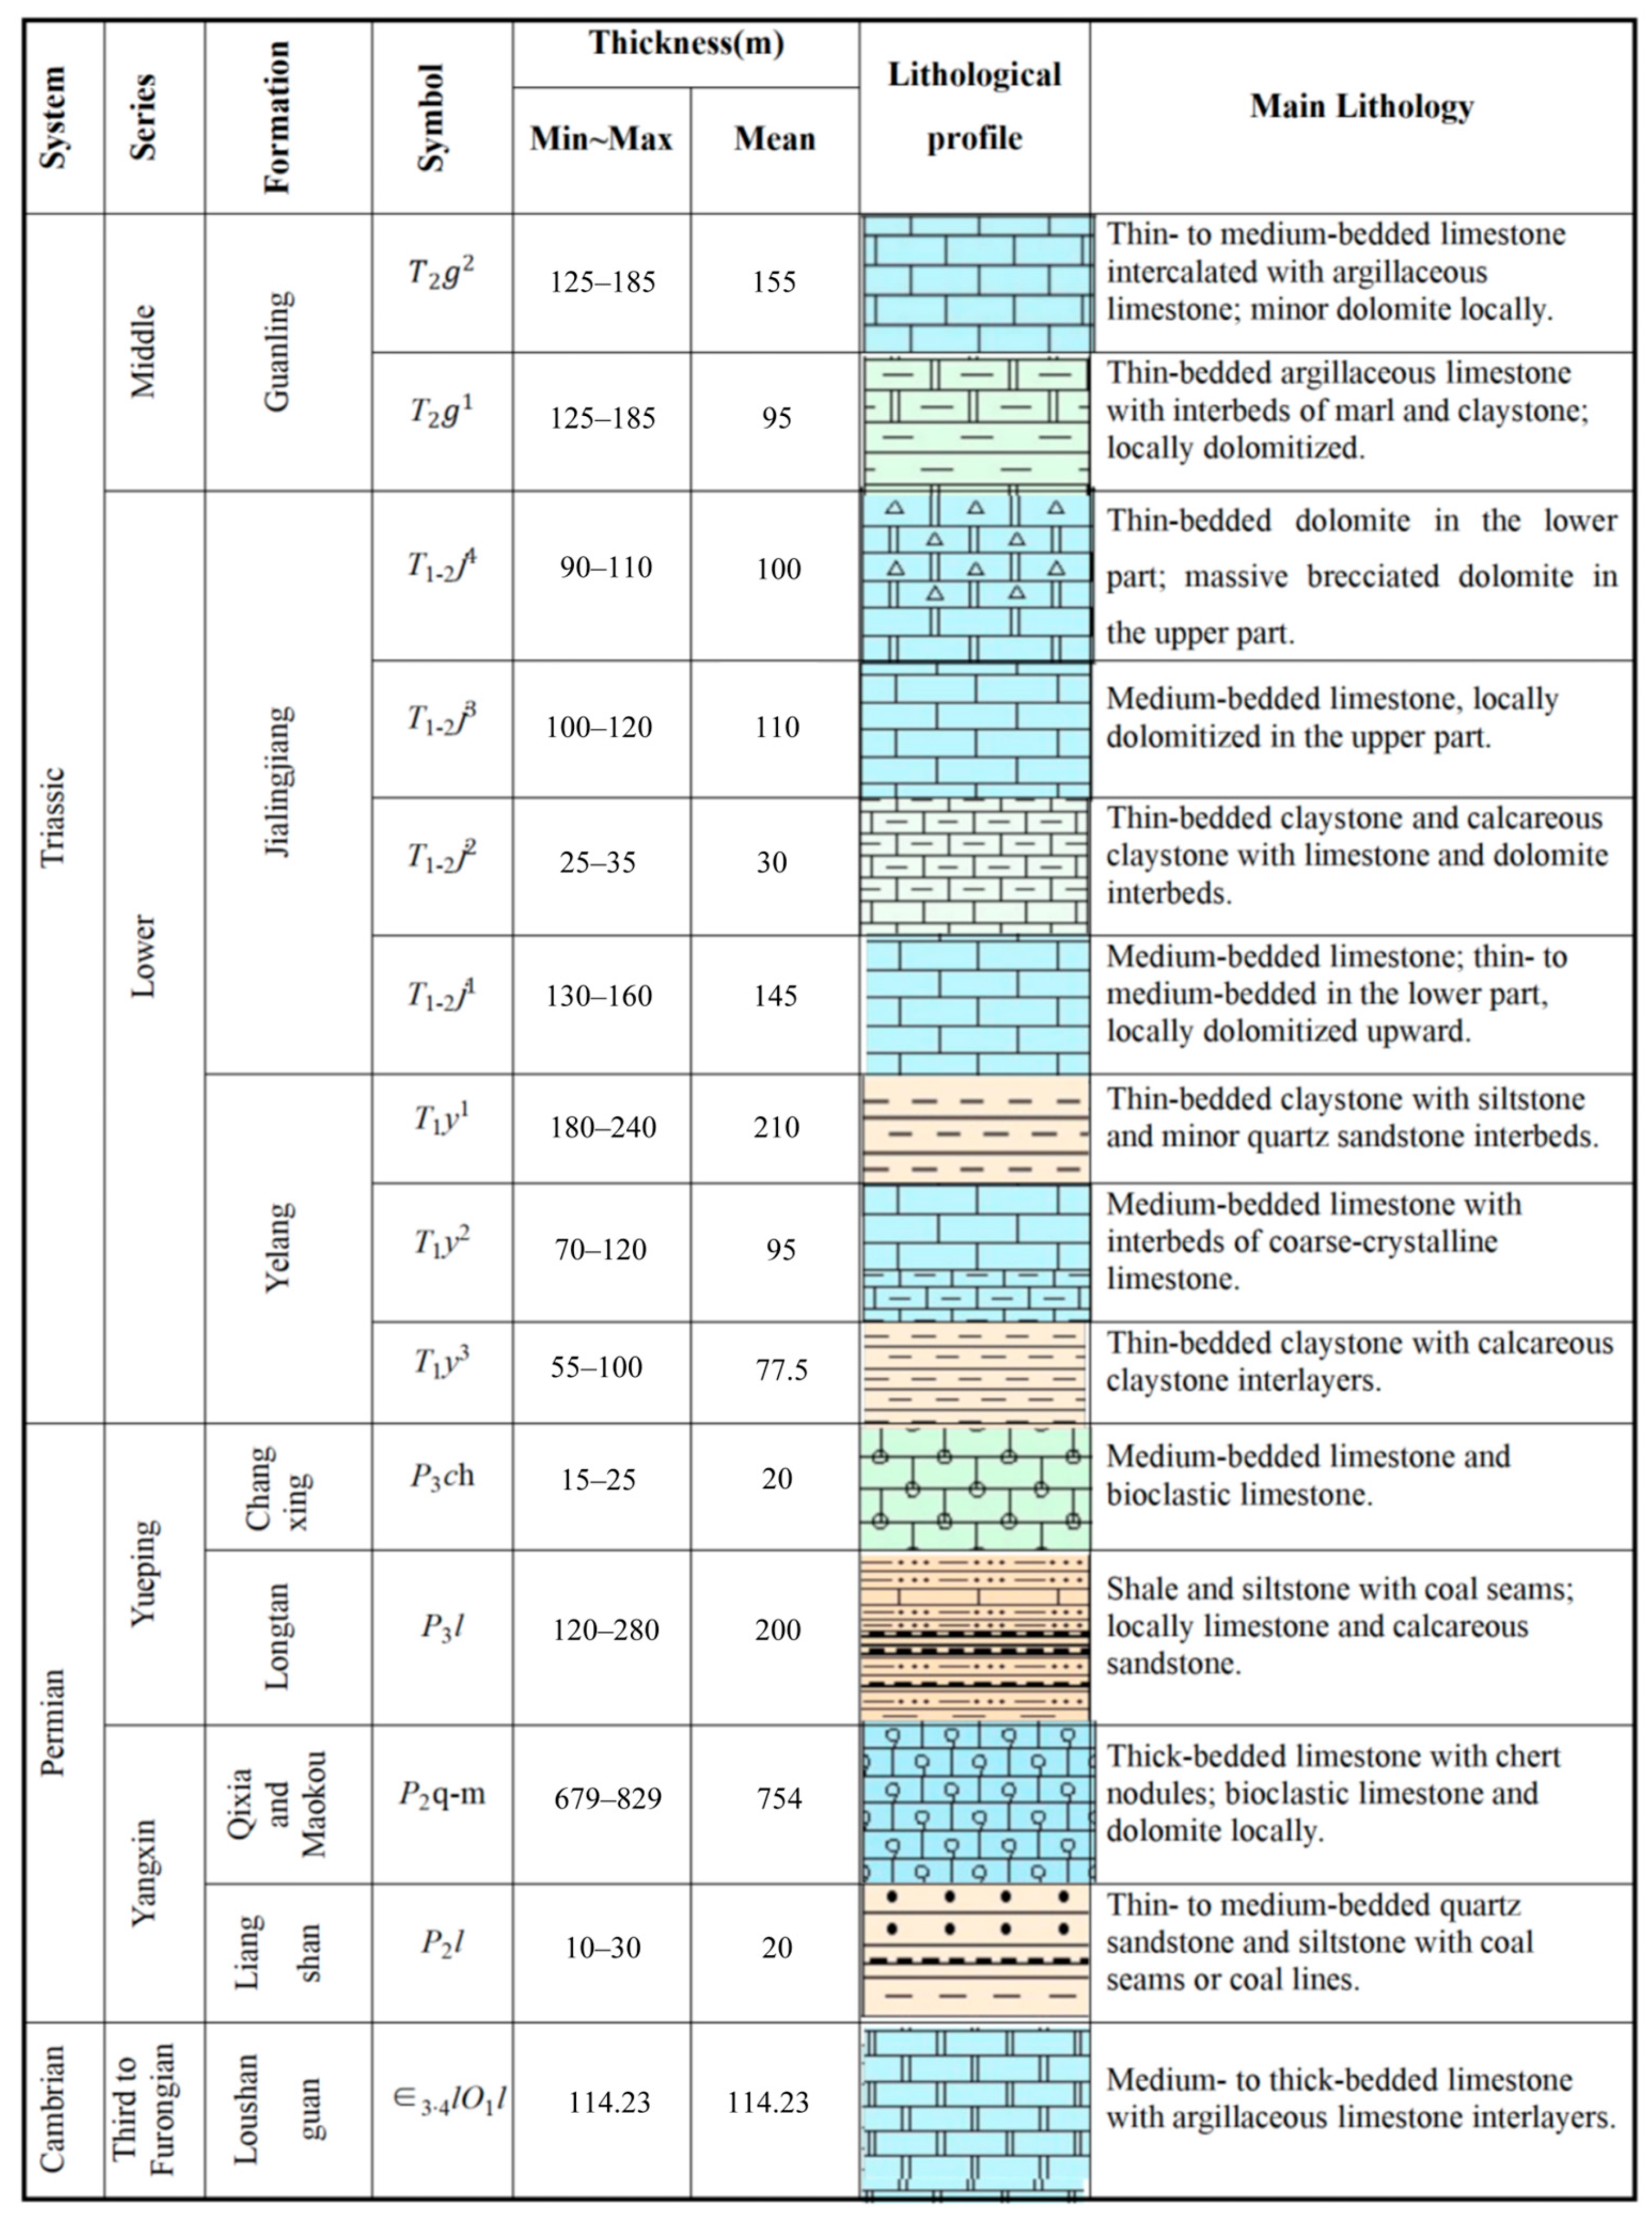
Based on previous geological and hydrogeological investigations, the exposed strata in the study area range from the Cambrian to the Triassic and are mainly composed of Cambrian (∈), Permian (P), and Triassic (T) formations, with Ordovician to Devonian strata locally absent (Figure 2). The aquifer system is dominated by limestone and dolomite-bearing carbonate formations, with locally interbedded carbonate–clastic rocks. Hydrogeologically, the study area is characterized by a fissure–conduit karst system, in which dissolution fractures, conduits, and subterranean caves serve as the main water-bearing and flow media. Surface karst landforms, including sinkholes, karst depressions, and swallets, are distributed in a bead-like pattern and serve as critical recharge pathways directly connected to runoff with the subsurface aquifer. The subterranean conduits show a dendritic branching pattern and can be divided into three main networks: the western, central, and eastern systems. Together with fold- and fault-related fracture networks, this fissure–conduit structure controls groundwater storage, flow pathways, and underground drainage, thereby facilitating the transfer of surface-derived solutes and complicating hydrochemical evolution in this agricultural karst watershed (Figure 1a).

2.2. Water Sampling and Analysis

To analyze the hydrochemical characteristics and the sources of nitrate and sulfate in the study area, field sampling was conducted in August 2023. A total of 84 water samples were collected, including 40 surface-water samples and 44 groundwater samples. Sampling sites were selected based on hydrogeological conditions, the distribution of surface-water and groundwater systems, land use, sampling accessibility, potential anthropogenic pollution sources, and previous local hydrogeological survey reports. Precipitation samples were collected at fixed stations and used only as reference endmembers to evaluate atmospheric inputs to nitrate and sulfate; they were not included in the hydrochemical statistical analyses of groundwater and surface water.
Surface-water samples were collected from the mainstream, representative tributaries, rivers, ditches, and drainage outlets, covering upstream and downstream reaches and anthropogenically affected areas. These samples were collected below the water surface at representative points while avoiding bank disturbance, floating materials, and resuspended bottom sediments. Groundwater samples were collected along the main groundwater flow paths, including sinkholes, underground river outlets, and monitoring wells. Spring and underground-river-outlet samples were collected directly from representative discharge points, whereas monitoring-well samples were collected after sufficient water pumping. Based on field investigation, water type, hydrochemical differences, NO3 and SO42− concentration gradients, pollution-source characteristics, and sample quality, 44 representative samples were selected for isotope analysis, including 13 groundwater and 31 surface-water samples.
In situ water temperature and pH were measured using a portable multiparameter water-quality analyzer (HandyLab 100, SI Analytics GmbH, Mainz, Germany). After collection, all water samples were filtered on site through 0.45 μm membrane filters and transferred into pre-cleaned 250 mL polyethylene bottles. The bottles were sealed, refrigerated, and transported to the laboratory. Before use, the filters were soaked in 3% nitric acid for 24 h and thoroughly rinsed with deionized water. Major-ion samples were preserved according to the Water quality sampling—Technical regulation of the preservation and handling of samples (HJ 493—2009) [20], stored at 4 °C, and analyzed within 72 h. Samples for cation analysis were acidified to pH < 2 using high-purity nitric acid.
Major anions, including Cl, SO42−, and NO3, were measured using an ion chromatograph (761 Compact IC/813 Compact Autosampler, Metrohm, Herisau, Switzerland). Multi-point external calibration curves were established using mixed anion standard solutions containing Cl, SO42−, and NO3. HCO3 was determined by acid–base titration. Major cations, including Ca2+, Mg2+, Na+, and K+, were measured using an inductively coupled plasma atomic emission spectrometer (IRIS Intrepid II XSP, Thermo Electron Corporation, MA, USA), with external calibration performed using multi-element standard solutions containing Ca, Mg, Na, and K.
For isotope analysis, δ18O–H2O in water samples was measured using a stable isotope ratio mass spectrometer (MAT 251, Thermo Finnigan MAT, Bremen, Germany), and the results were calibrated against the VSMOW–SLAP scale [21]. Dissolved NO3 was converted to N2O gas using the bacterial denitrification method [22], whereas dissolved SO42− was precipitated as BaSO4 before isotope ratio mass spectrometric analysis. Filtered nitrate isotope samples were frozen directly without chemical preservatives, while sulfate isotope samples were pretreated by hydrochloric acid acidification before BaSO4 precipitation. The nitrate and sulfate isotope compositions were measured using a stable isotope ratio mass spectrometer (MAT 251, Thermo Finnigan MAT, Germany). Sulfate δ34S was calibrated using IAEA-S-2, IAEA-S-3, and IAEA-SO-5 standards, whereas sulfate δ18O was calibrated using the NBS-127 standard [23,24]. Nitrate δ15N and δ18O were calibrated using USGS-34, USGS-35, IAEA-NO-3, and laboratory nitrate standards [25].
Duplicate samples, blank samples, and reference materials were included throughout the analytical procedures for quality control. The reliability of the major-ion data was verified using charge balance error (CBE), and the CBE values of all samples were within ±5%.

2.3. Statistical Analysis and Modeling Framework

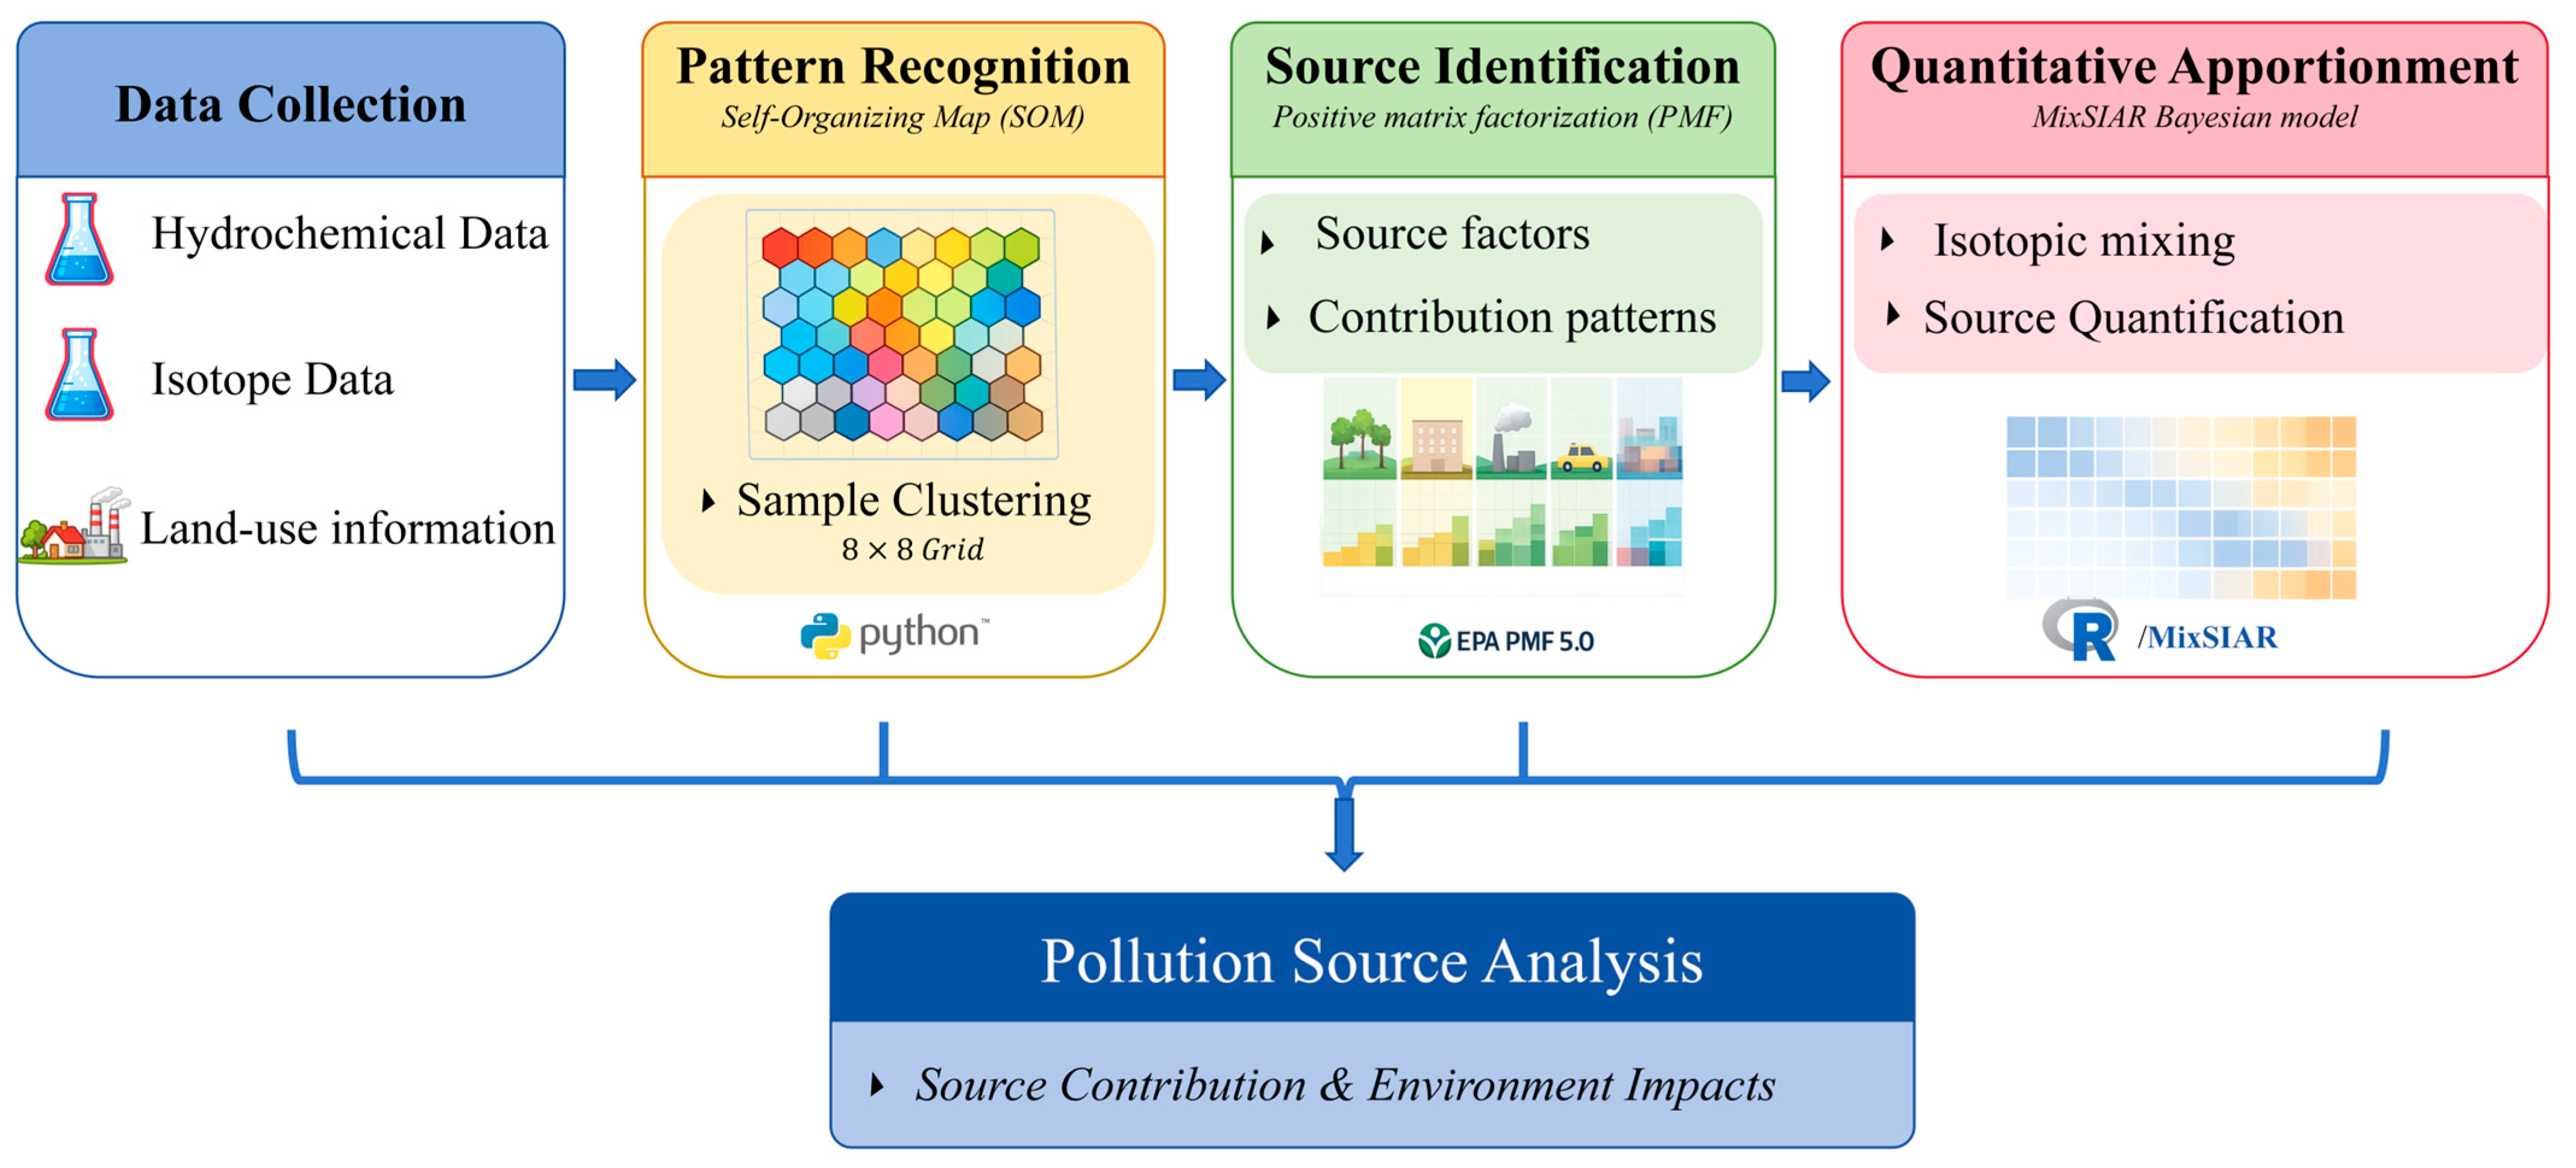
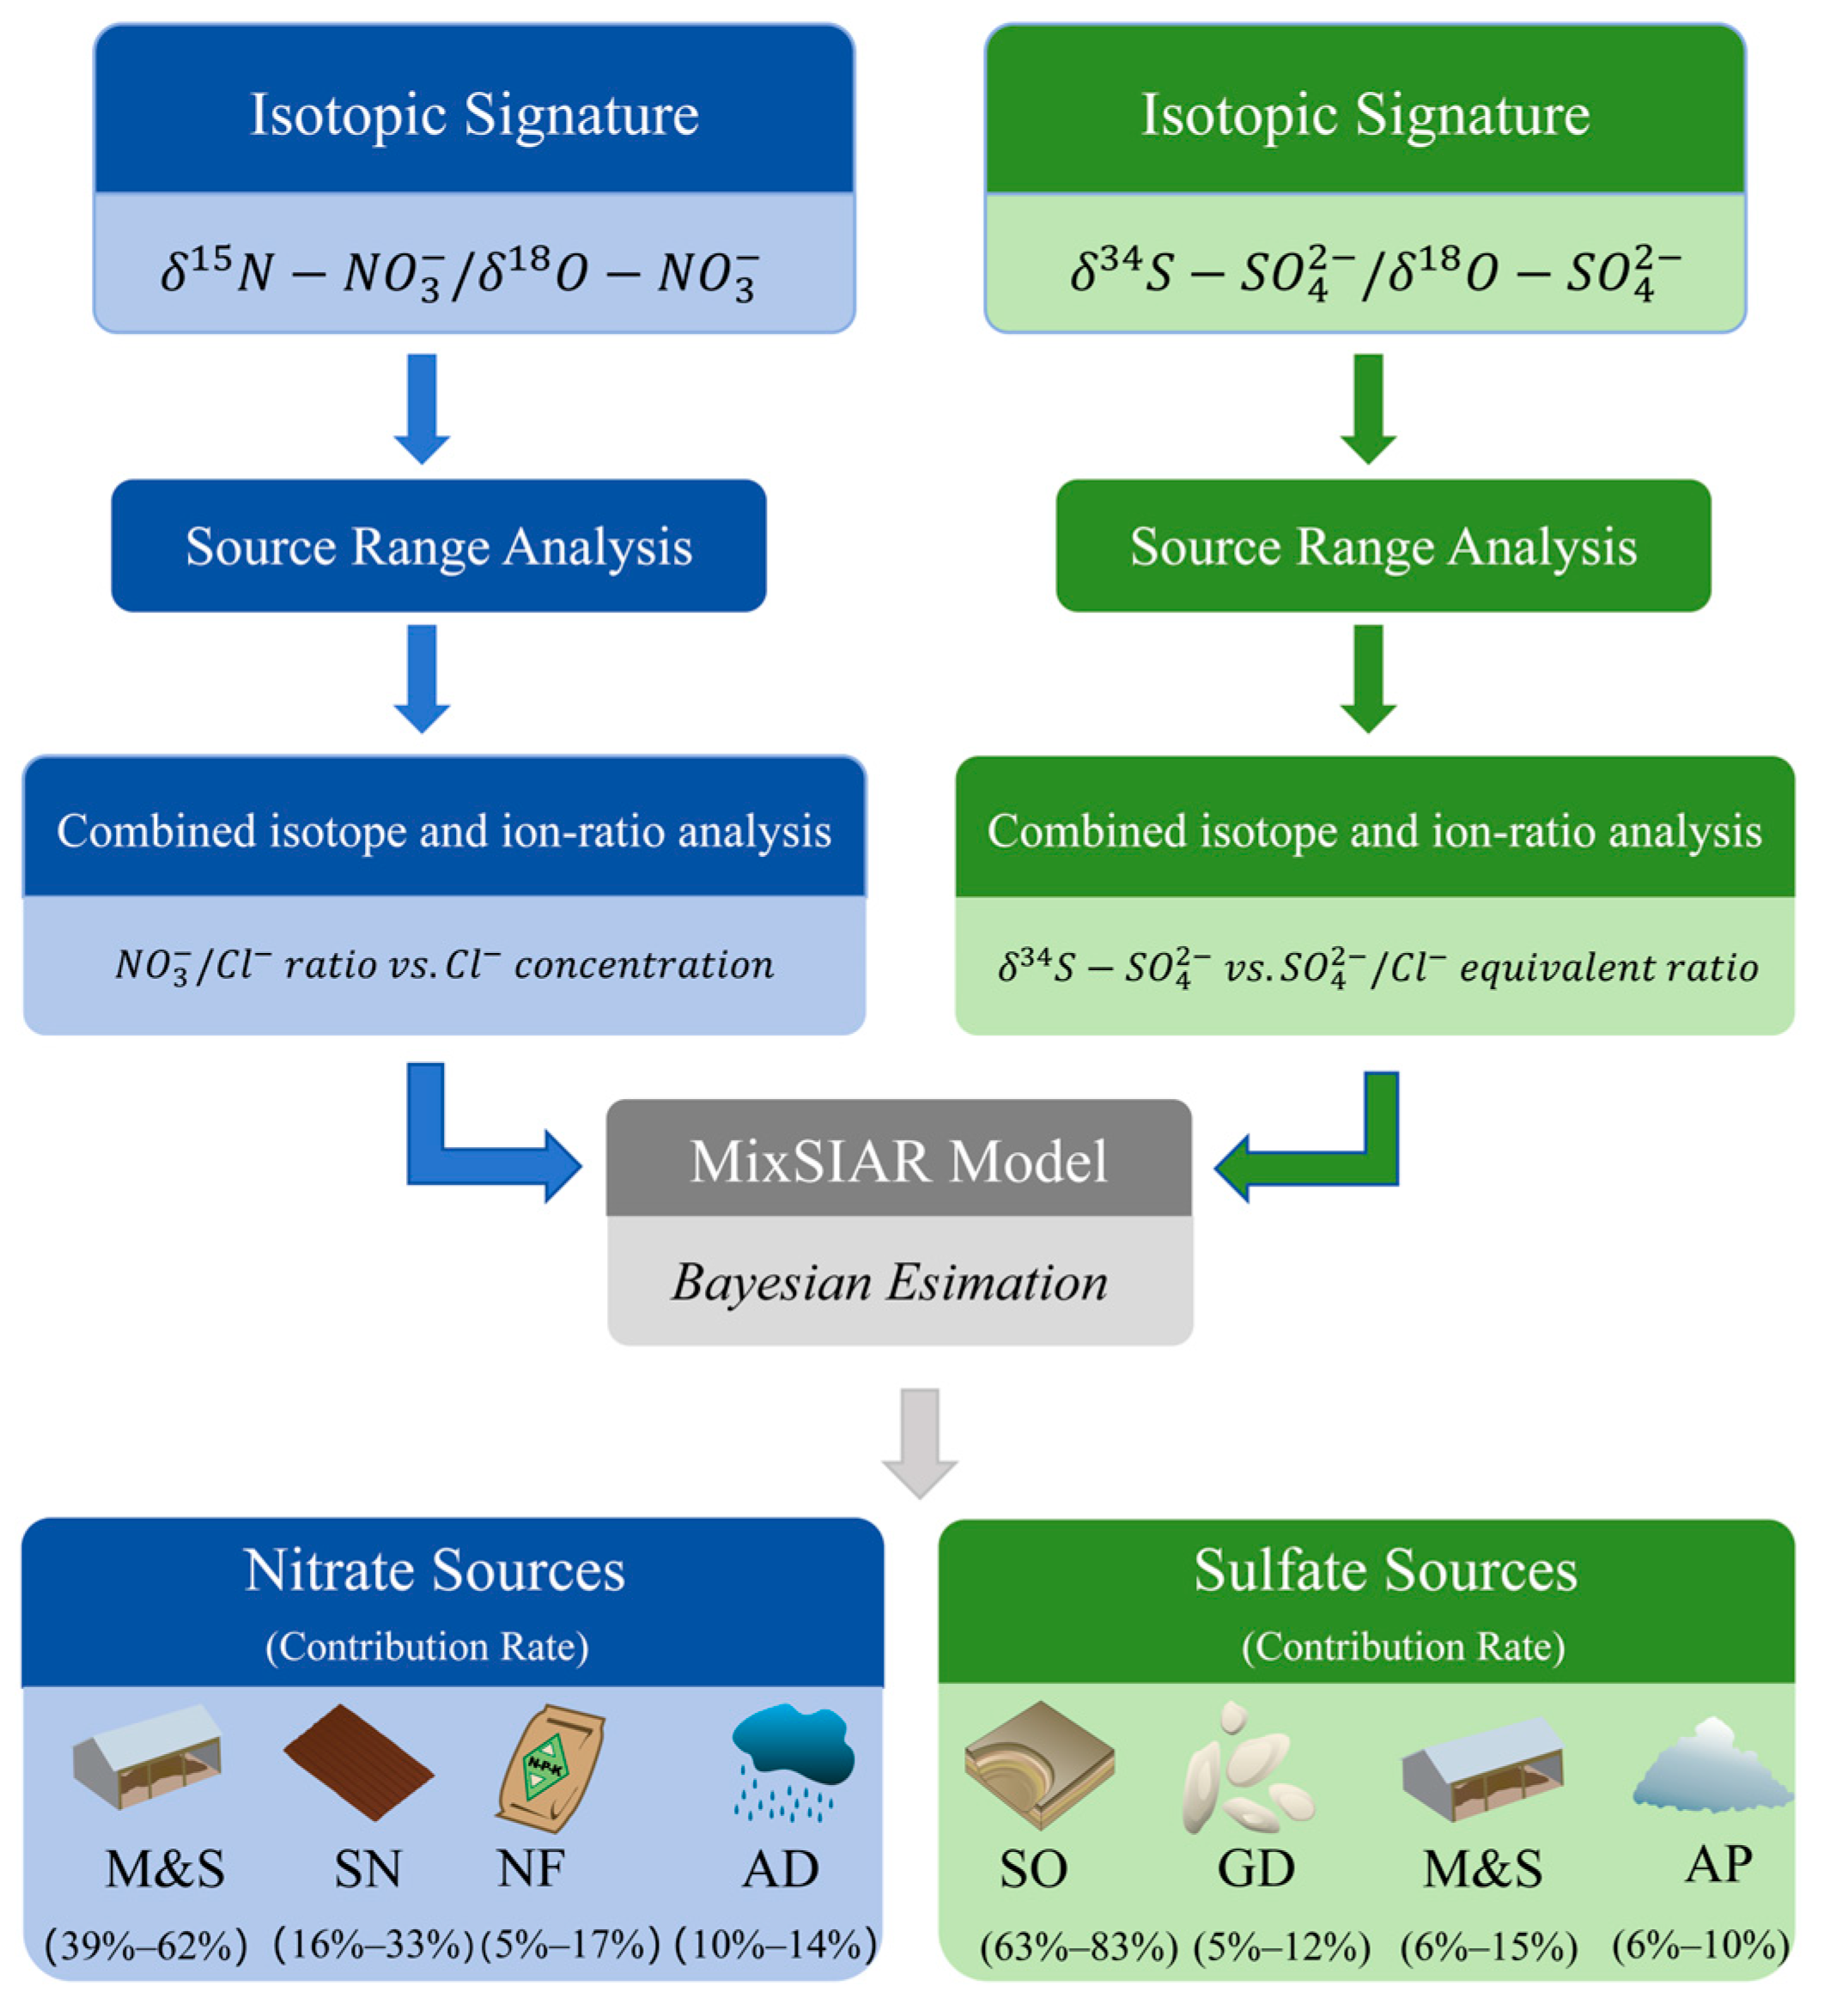
To characterize hydrochemical patterns, identify sources, and quantify potential contributions, an integrated analytical framework combining self-organizing maps (SOM), positive matrix factorization (PMF), and the Bayesian mixing model MixSIAR was employed (Figure 3). SOM was used to identify hydrochemical patterns and classify samples [6], while PMF was applied to identify potential source factors [26]. Data processing and preliminary calculations were conducted in Microsoft Excel 2010 [27]. Microsoft Excel 2010 was used for data processing and preliminary calculations. Spatial distribution maps were generated using ArcGIS Pro 3.5. Piper diagrams, Gibbs plots, and ion-ratio diagrams were prepared using Origin 2024, and the conceptual model was produced using Adobe Illustrator 2025.

2.3.1. Self-Organizing Map (SOM)

The self-organizing map (SOM) is an unsupervised neural network algorithm that projects high-dimensional data onto a low-dimensional space while preserving topological relationships [28]. This method has been widely applied in hydrochemical studies for pattern recognition and cluster analysis [29,30,31]. In this study, SOM was used to classify groundwater and surface-water samples based on hydrochemical variables. The optimal number of neurons was estimated using the empirical relationship M = 5 n , where M is the number of neurons and n is the number of samples [32,33]. Accordingly, an 8 × 8 map grid was adopted. K means clustering was subsequently applied to the neuron weight vectors, and the final grouping was determined by combining the unified distance matrix (U-matrix) with the within-cluster variance criterion. All SOM analyses were performed using Python 3.14.

2.3.2. Positive Matrix Factorization (PMF)

Positive matrix factorization (PMF) is a receptor model that decomposes the observed data matrix into factor contributions and factor profiles under non-negativity constraints [34]. It has been widely used to identify potential sources and their relative contributions in environmental systems [35,36,37].
x ij = k = 1 p g ik f kj + e ij
where i and j represent the sample and indicator, respectively; xij is the measured value of indicator j in sample i; gik is the contribution of factor k to sample i; fkj is the loading of indicator j in factor k; eij is the residual error; and p is the number of factors. The model achieves optimal fitting by minimizing the objective function Q:
Q = i = 1 n j = 1 m e ij u ij 2
where uij is the uncertainty of indicator j in sample i. This study quantitatively analyzes the potential sources of hydrochemical components in groundwater and surface water based on EPA PMF 5.0 [38].

2.3.3. MixSIAR

To quantitatively estimate the contributions of multiple sources, the Bayesian isotope mixing model MixSIAR (version 3.1.12) was run in the R environment [27]. This model incorporates isotopic compositions of samples and source end members while explicitly accounting for source and measurement uncertainties. Based on regional characteristics and previous studies [8,39,40], nitrate sources were classified as atmospheric deposition (AD), nitrate fertilizer (NF), soil nitrogen (SN), and manure/sewage (M&S). Sulfate sources included gypsum dissolution (GD), sulfide oxidation (SO), atmospheric precipitation (AP), and manure/sewage (M&S). For nitrate source apportionment, δ15N–NO3 and δ18O–NO3 were used, wheras δ34S–SO42− and δ18O–SO42− were applied for sulfate. The model is expressed as follows:
X ij = k = 1 K P k ( S jk + C jk ) + ε ij
S jk ~ N ( μ jk , ω jk 2 )
C jk ~ N ( λ jk , τ jk 2 )
ε jk ~ N ( 0 , σ j 2 )
where Xij represents the measured value of isotope j of sample i (i = 1, 2, 3, …, N; j = 1, 2, 3, …, J); Sjk denotes the isotopic end−member value of source k for isotope j with a mean of μjk and a variance of ω jk 2 ; Pk denotes the proportional contribution of source k; Cjk denotes the fractionation factor of isotope j on source k, with a mean of λjk and a variance of τ jk 2 ; and εij denotes the residual error term, with a mean of 0 and a variance of σ j 2 .

3. Results

3.1. Hydrochemical Characteristics of Surface Water and Groundwater

3.1.1. Hydrochemical Characteristics

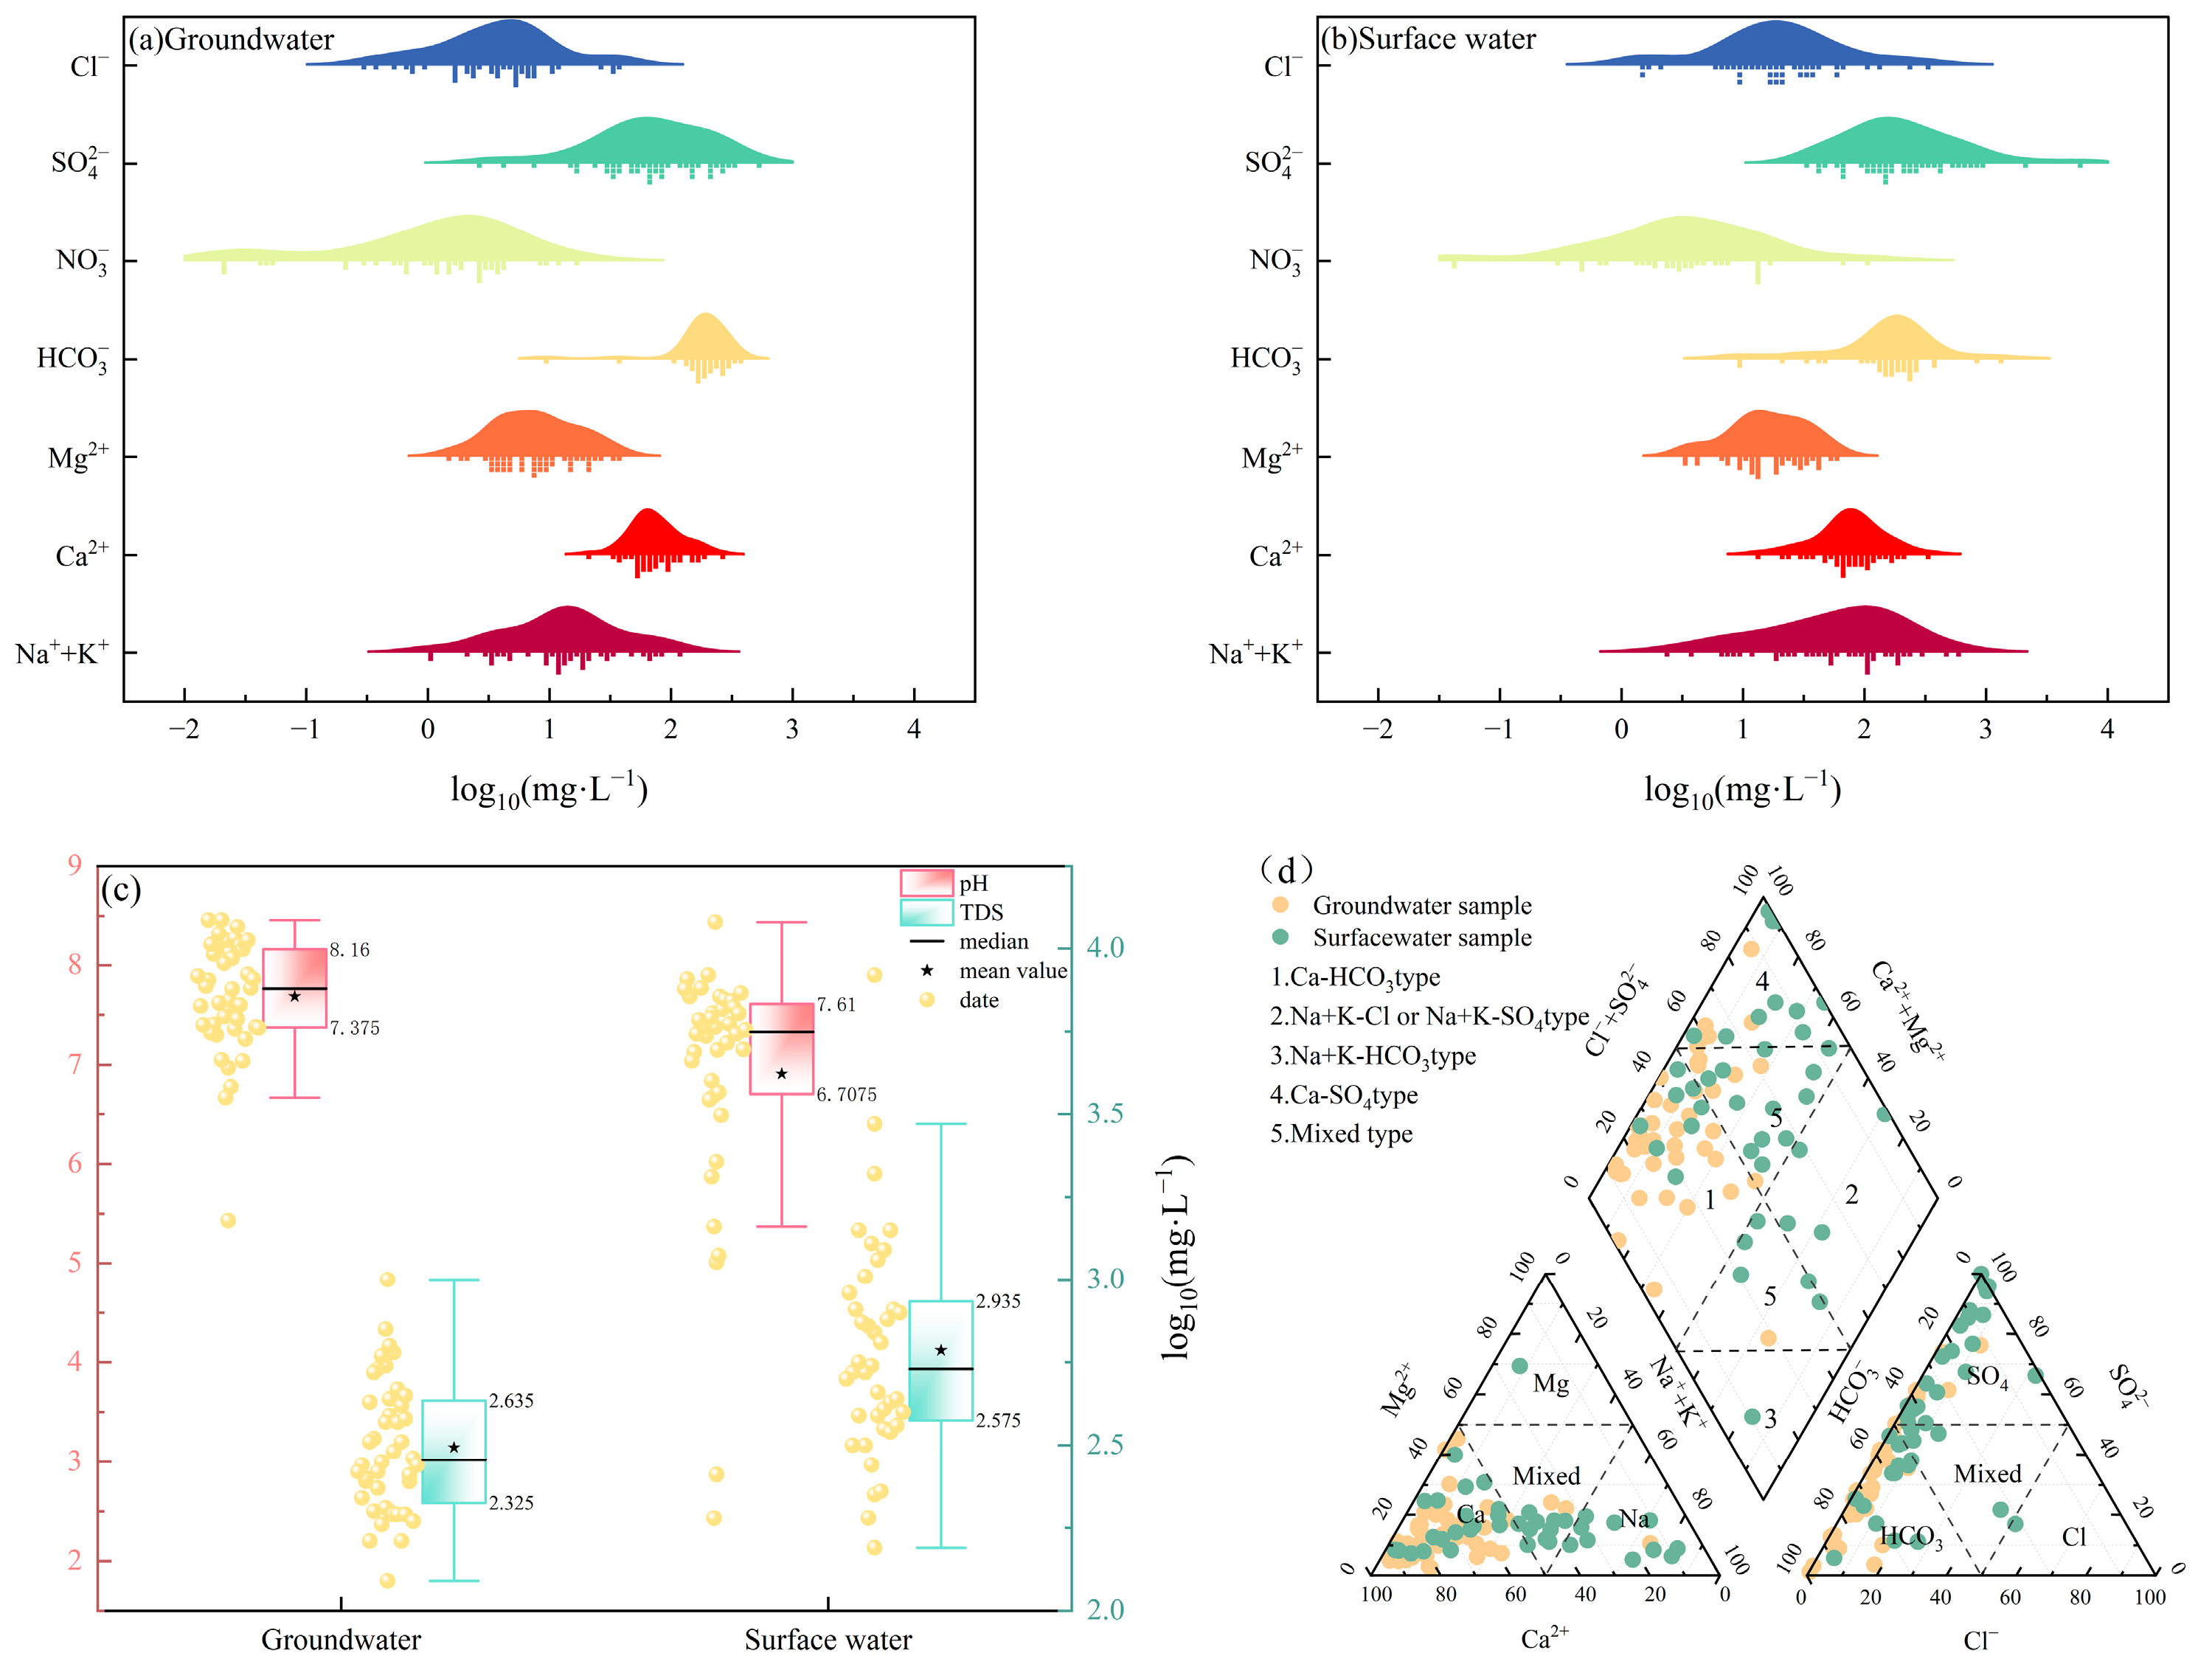
The statistical results of the physicochemical parameters for groundwater and surface water are presented in Figure S1. As shown in Figure 4c, the two water bodies exhibited distinct differences. Groundwater was generally weakly alkaline, with a mean pH of 7.69, whereas surface water was near neutral to weakly alkaline, with a mean pH of 6.91, indicating a stronger carbonate buffering in groundwater [41]. In contrast, total dissolved solids (TDS) was markedly higher in surface water and showed a much wider range (153.54–8389.83 mg/L; mean: 905.05 mg/L) than in groundwater (122.79–998.07 mg/L; mean: 345.98 mg/L), suggesting that surface water in the agricultural karst watershed was more directly influenced by agricultural inputs, domestic wastewater discharge, and local disturbances. The kernel density distributions of major ions (Figure 4a,b) showed that the two water bodies were generally similar in ionic composition but differed substantially in concentration levels and dispersion. HCO3 and SO42− were the dominant anions in both water bodies, whereas NO3- showed relatively large variability. Cl concentrations were low and narrowly distributed in groundwater but were higher and more dispersed in surface water. Among cations, Ca2+ was the dominant cation in both water bodies, with only minor differences between them. Mg2+ was slightly lower in groundwater, whereas Na+ + K+ showed higher concentrations and greater variability in surface water, implying a stronger influence of surface-derived inputs associated with agricultural and residential activities [42].
The Piper diagram (Figure 4d) further showed that groundwater was dominated by the Ca–HCO3 type, with minor occurrences of the mixed-type and Ca–SO4 type waters. In contrast, surface water exhibited more complex hydrochemical facies, with markedly higher proportions of Ca–SO4 type and mixed-type waters, as well as a few samples of the Na + K–SO4 type. Overall, groundwater showed a relatively stable hydrochemical composition mainly controlled by water–rock interactions, whereas surface water displayed more diverse hydrochemical facies and greater variability, reflecting the combined effects of natural processes, agricultural activities, and other local anthropogenic disturbances.

3.1.2. Hydrochemical Clustering

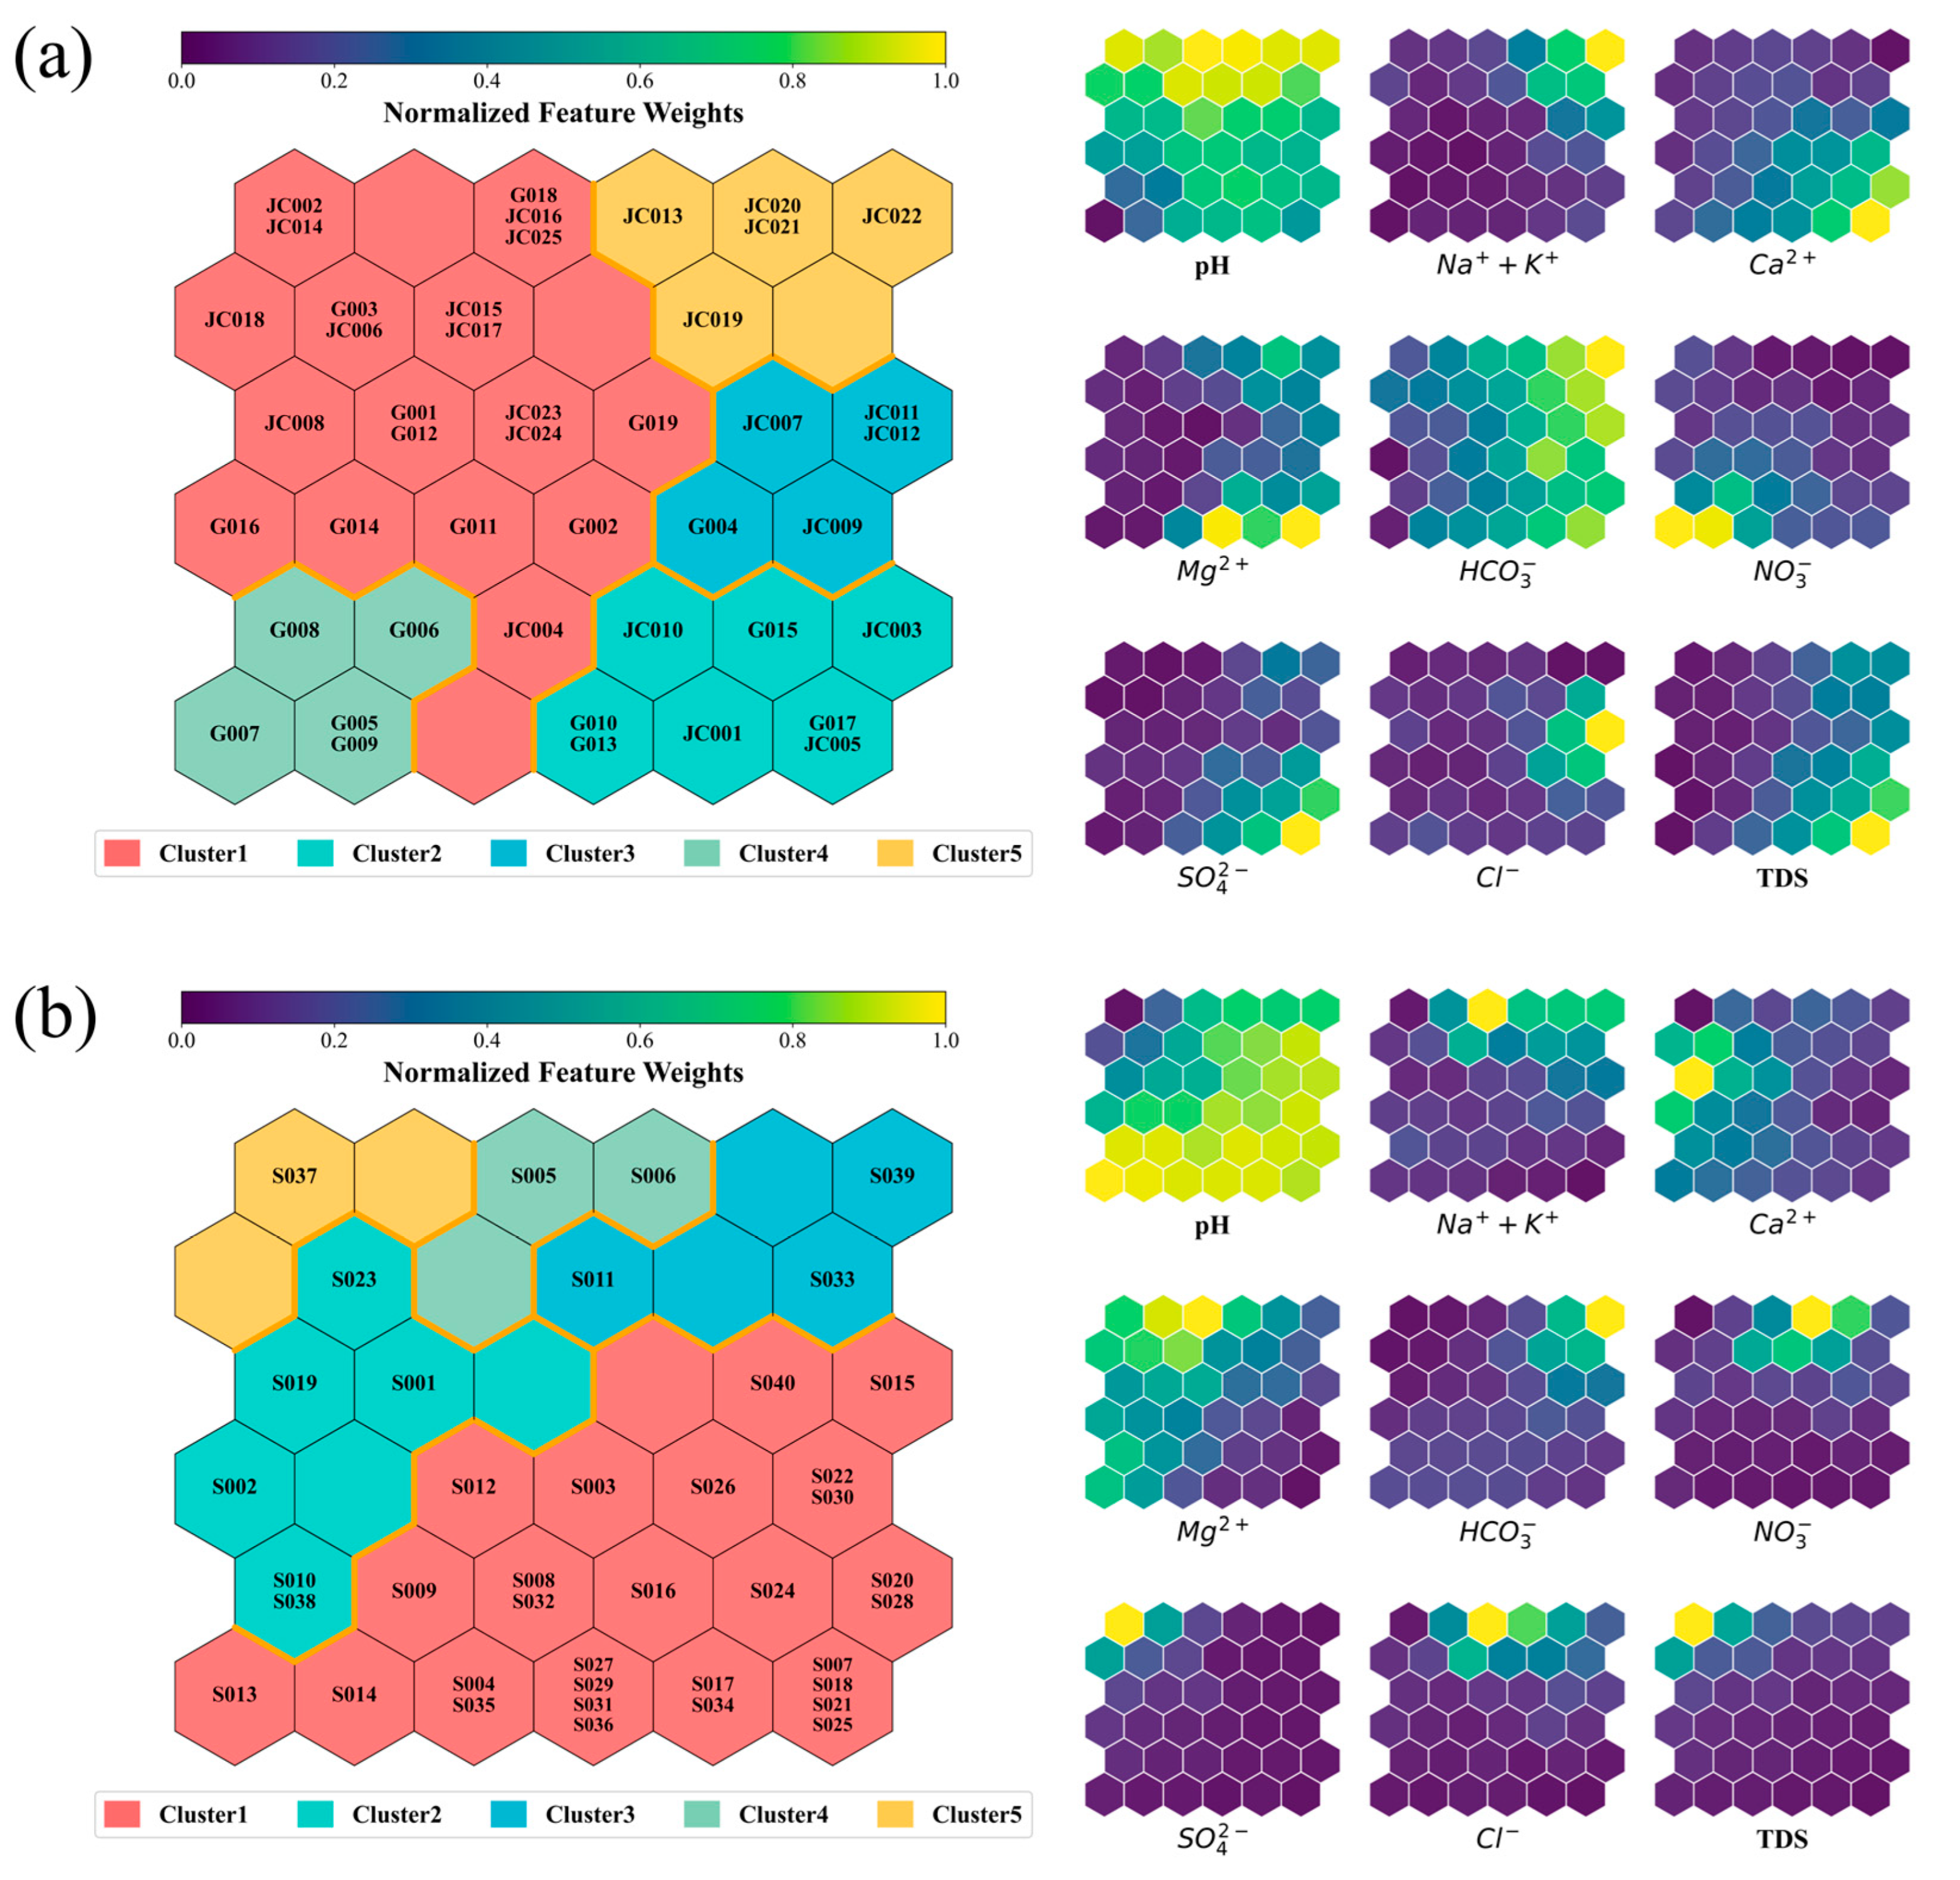
Based on nine hydrochemical indicators (Na+ + K+, Mg2+, Ca2+, Cl, SO42−, NO3, HCO3, pH, and TDS), groundwater (n = 44) and surface water (n = 40) samples were classified using the self-organizing map (SOM) method. Both groundwater and surface water samples were divided into five clusters (Figure 5). Groundwater samples showed clear clustering patterns (Figure 5a). Cluster 1 (n = 21); the dominant group was characterized by generally low ion concentrations and low TDS, but relatively high pH. Cluster 2 (n = 8) showed elevated concentrations of HCO3, Ca2+, Mg2+, and SO42−, together with high TDS, indicating relatively strong mineralization. Cluster 3 (n = 5) was characterized by relatively high HCO3, Ca2+, and TDS, accompanied by locally elevated Cl. Cluster 4 (n = 5) was mainly distinguished by significantly elevated NO3. Cluster 5 (n = 5) showed relatively high HCO3, Na+ + K+, and pH. Surface water likewise exhibited pronounced heterogeneity (Figure 5b). Cluster 1 (n = 28), the dominant group, was characterized by relatively high pH and generally low concentrations of other ions. Cluster 2 (n = 6) was marked by elevated Ca2+ and Mg2+. Cluster 3 (n = 3) showed increased HCO3, accompanied by higher Na+ + K+, Cl, and NO3. Cluster 4 (n = 2) exhibited synchronous enrichment of Na+ + K+, Cl, and NO3. Cluster 5 (n = 1) was characterized by markedly elevated SO42− and high TDS. The SOM results indicated substantial internal hydrochemical heterogeneity in both groundwater and surface water. These differences were mainly reflected in the degree of mineralization, ion assemblage patterns, and the extent of NO3 enrichment. These patterns highlight the combined imprint of carbonate weathering, hydrological connectivity, and localized anthropogenic inputs in the agricultural karst watershed.

3.2. Distribution Characteristics of Nitrate and Sulfate

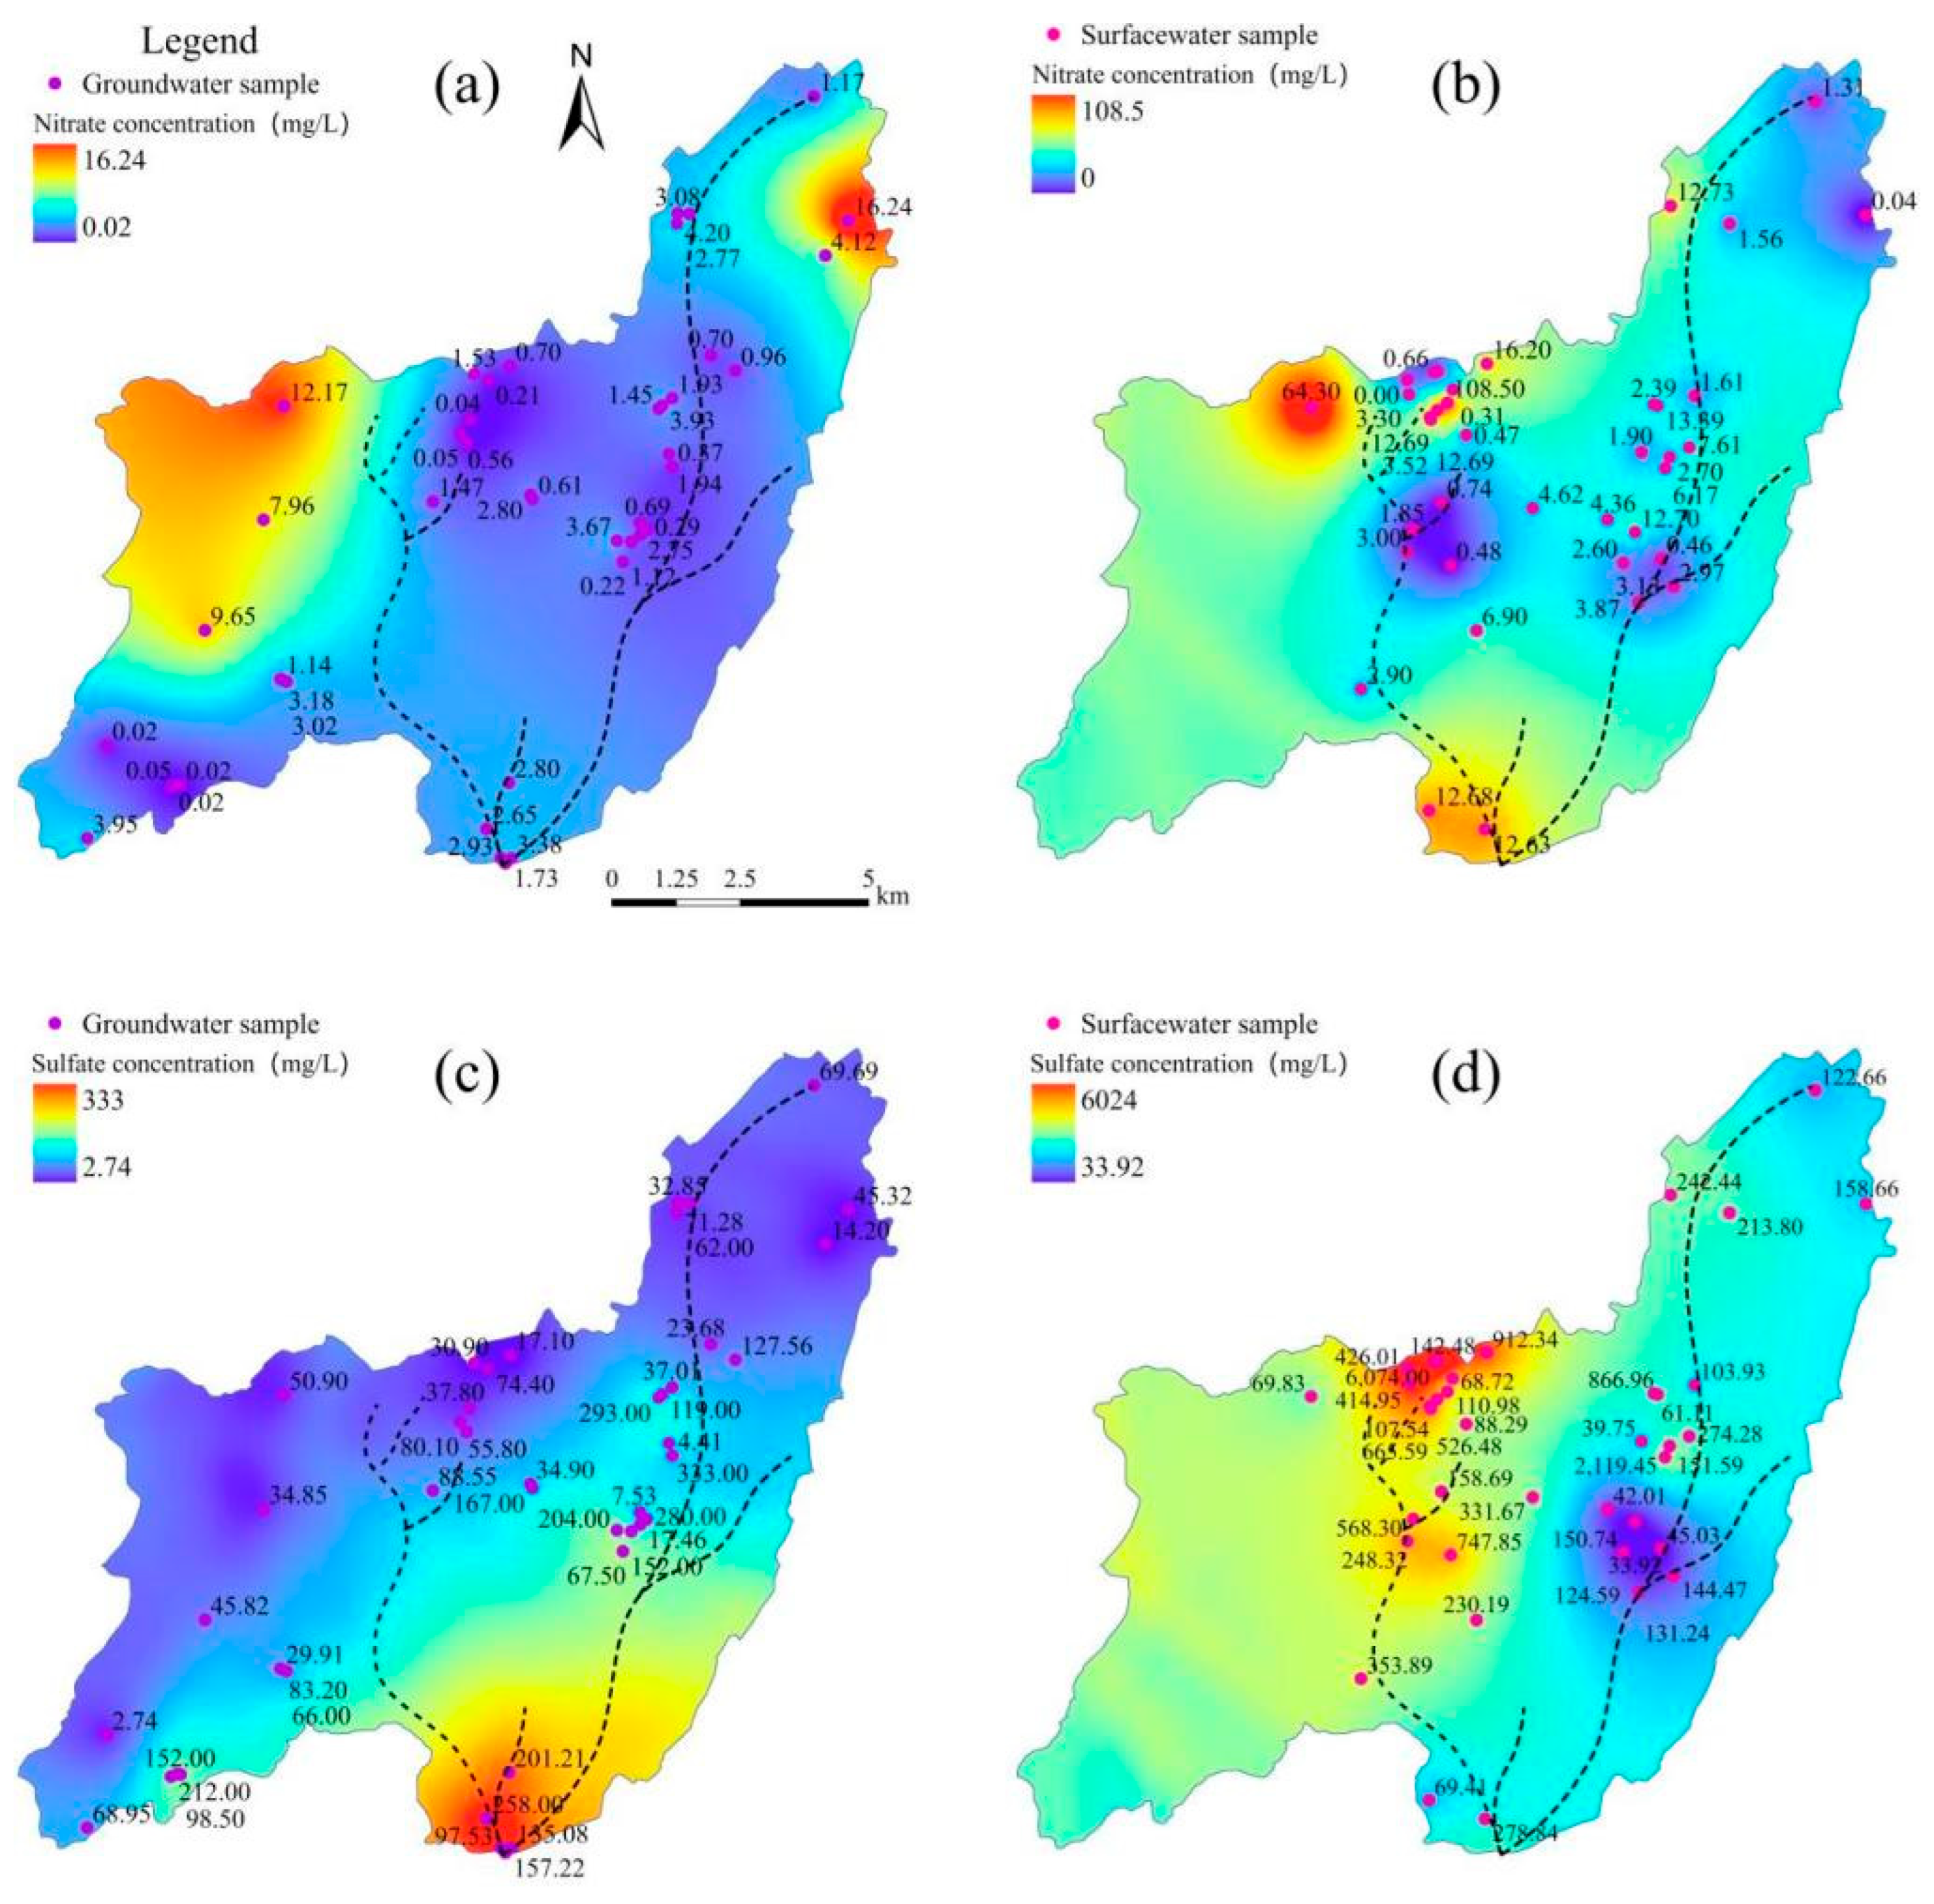
Nitrate and sulfate exhibited significant spatial heterogeneity in both groundwater and surface water (Figure 6). Overall, the concentration and spatial variability of these two solutes are higher in surface water than in groundwater. Nitrate concentrations in groundwater were generally characterized by low values, with local high-value zones occurring only in the western and northeastern parts, showing a scattered spatial distribution (Figure 6a). In contrast, nitrate concentration in surface water was relatively high overall, with high-value zones mainly concentrated in the west, while the eastern part remains relatively low but contained several local anomalous points (Figure 6b).
Sulfate concentrations showed stronger spatial differentiation than nitrate. High sulfate concentrations in groundwater were mainly distributed in the southern and central–eastern regions, whereas high values in surface water were clearly concentrated in the western region, with secondary high-value zones and several anomalous points in the eastern region (Figure 6c). Overall, sulfate concentration levels and the spatial extent of sulfate enrichment were greater in surface water, and high-value zones in surface water were more concentrated (Figure 6d). In general, solute distributions in groundwater were relatively moderate and dispersed, whereas surface water exhibited stronger spatial variability and more pronounced local enrichment.

3.3. Source Identification of Nitrate and Sulfate

3.3.1. Identification and Quantification of Nitrate Sources

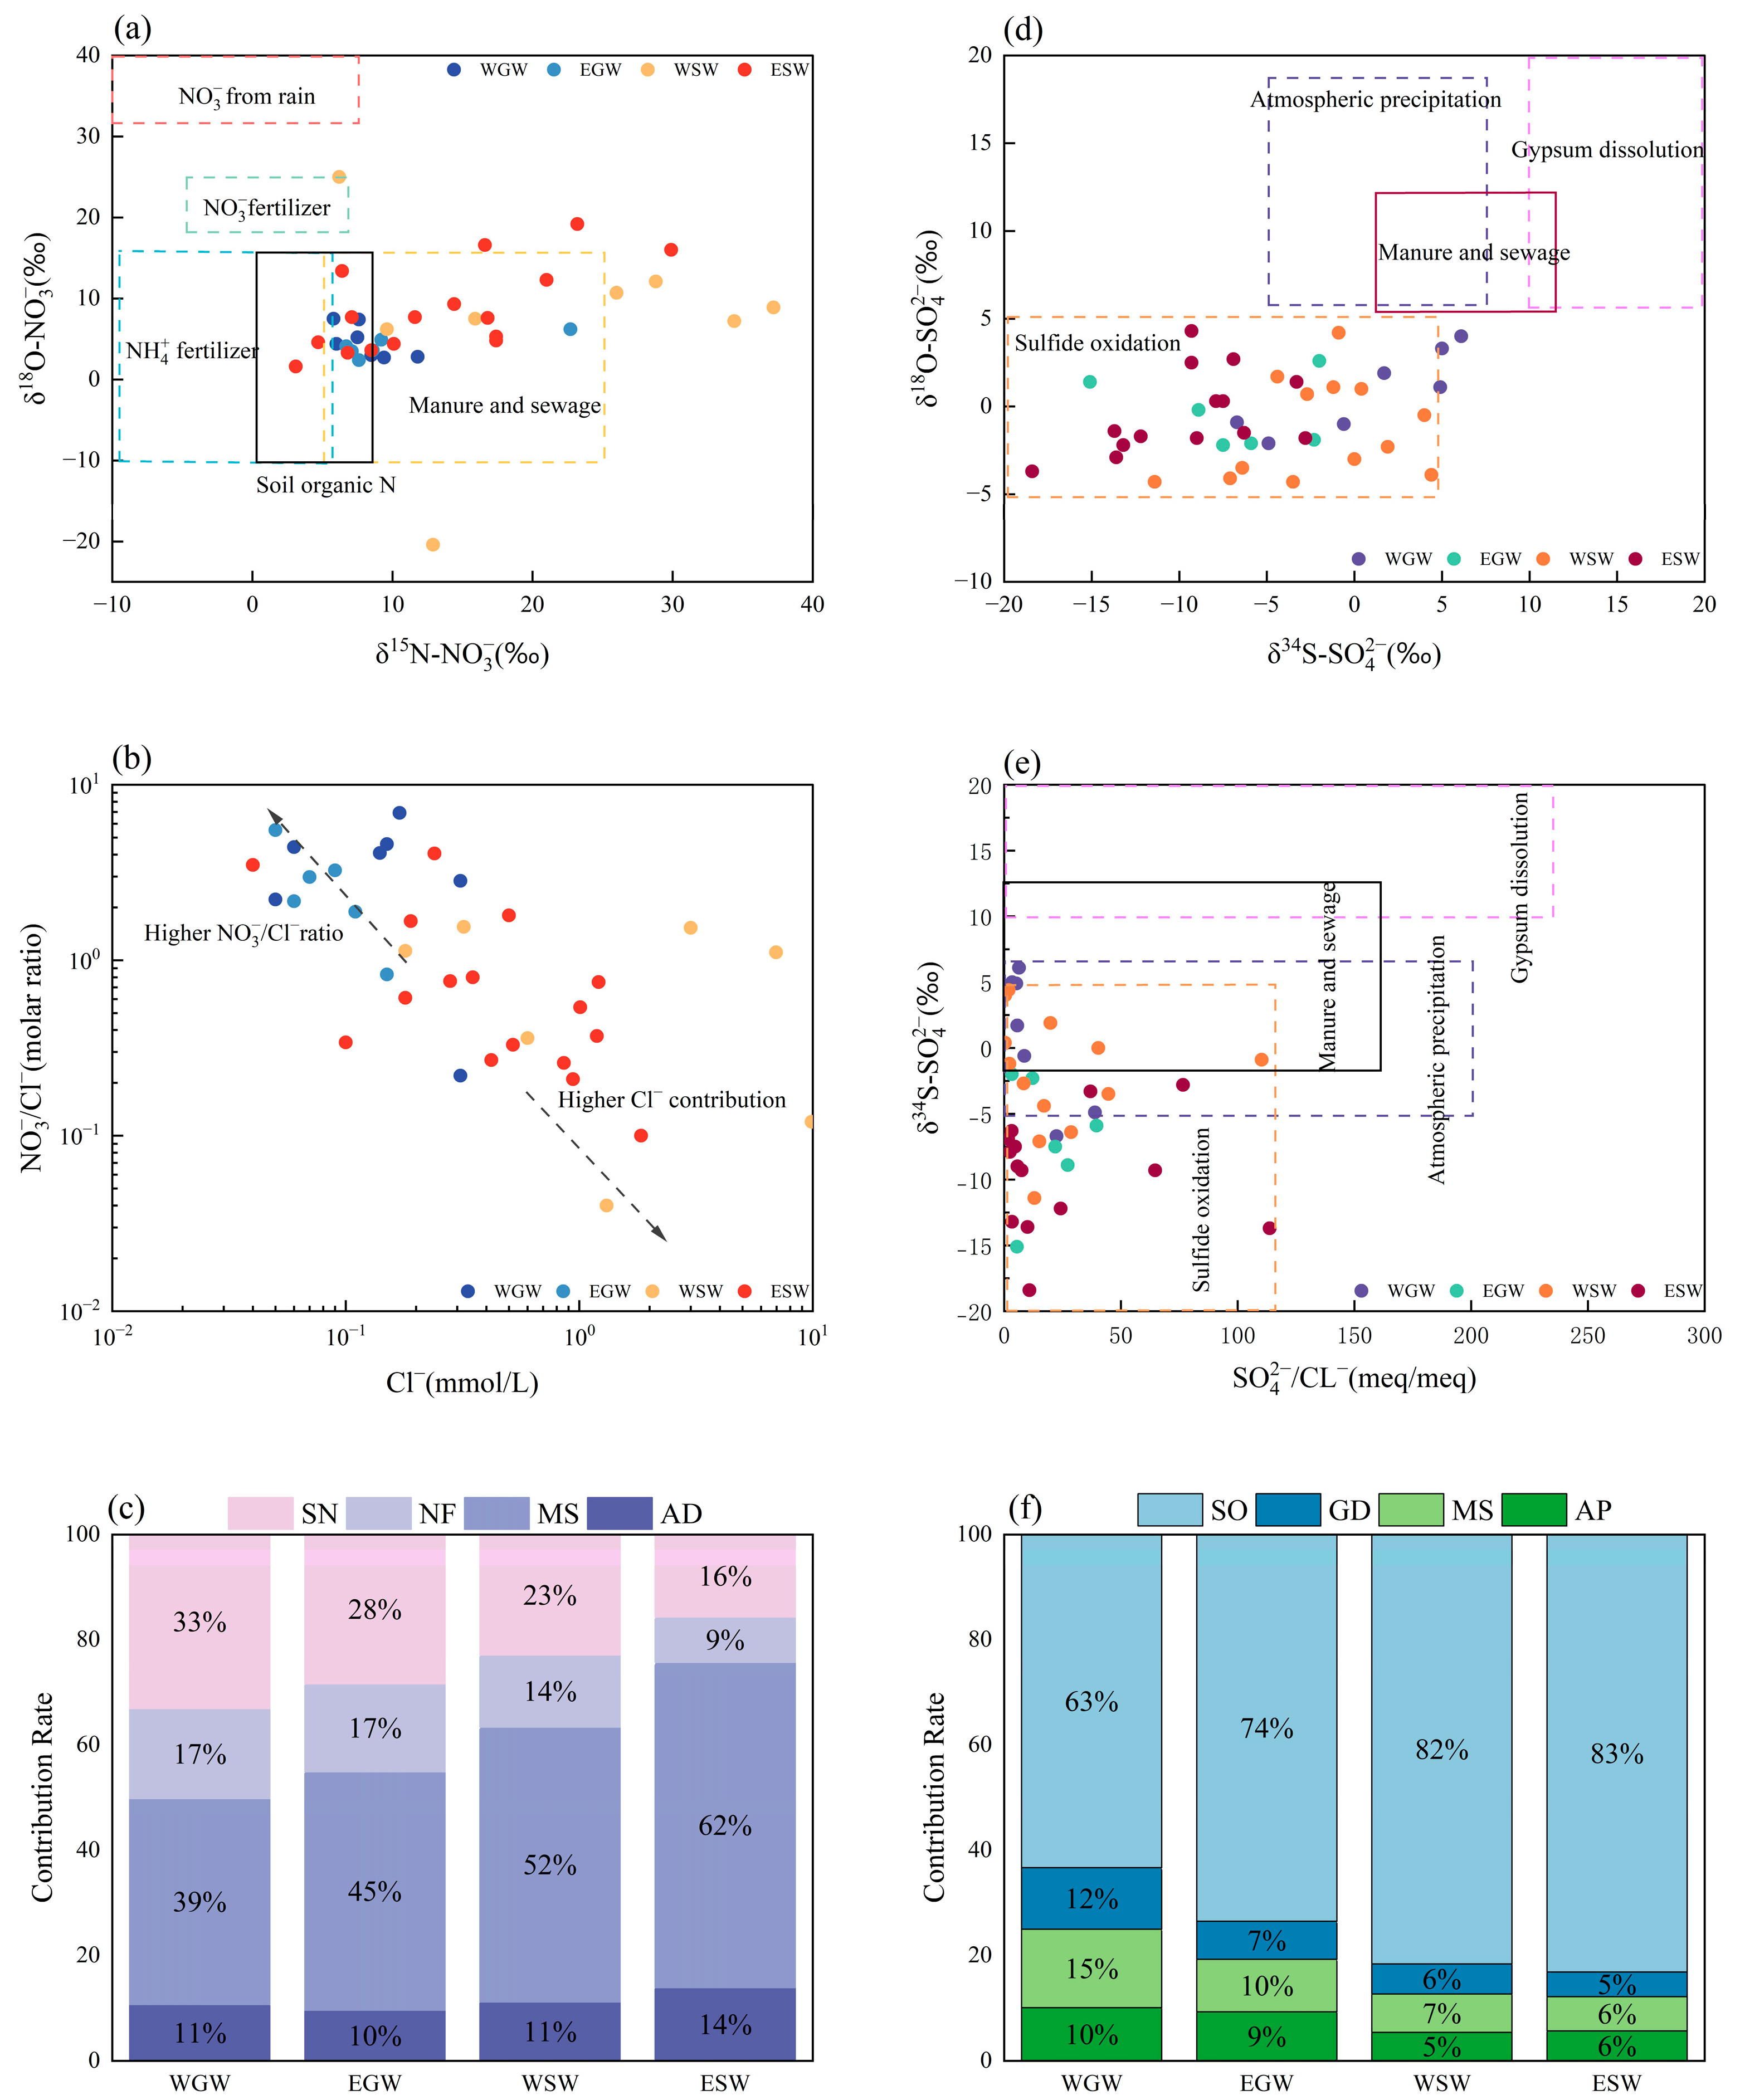
The δ15N–δ18O distribution appeared relatively concentrated, mainly falling within the overlapping region of soil nitrogen and manure/sewage sources, with a few samples shifting toward the NH4+ fertilizer end-member (Figure 7a). In contrast, the surface water samples were more widely dispersed, mainly clustering within the manure/sewage source range and extending toward higher isotopic values (Figure 7a). The relationship between the NO3/Cl molar ratio and Cl concentration (Figure 7b) showed that the NO3/Cl ratio generally decreased with increasing Cl concentration. Groundwater samples were mainly distributed in the low-Cl, high-ratio region, whereas surface water samples cover a broader range and extend into the high Cl, low-ratio region. The MixSIAR quantitative results (Figure 7c) further showed that manure/sewage is the dominant source, contributing 39%, 45%, 52%, and 62% to WGW, EGW, WSW, and ESW, respectively. Soil nitrogen was the secondary source, with contributions of 33%, 28%, 23%, and 16%, respectively. In comparison, the contributions from NH4+ fertilizer and atmospheric deposition were relatively minor. Overall, nitrate in the agricultural karst watershed was mainly derived from manure/sewage and soil nitrogen, with a higher contribution of manure/sewage in surface water.

3.3.2. Identification and Quantification of Sulfate Sources

The δ34S–δ18O distribution indicated that most samples were concentrated within the sulfide oxidation end-member range (Figure 7d), suggesting that sulfide oxidation was the dominant sulfate source in the agricultural karst watershed. Compared with groundwater samples, surface water samples were more widely dispersed, with a few samples shifting toward the margin of the manure/sewage end-member field. The relationship between the δ34S-SO42− and SO42−/Cl ratio (Figure 7e) showed that most samples were located in the low SO42−/Cl ratio region and cluster within the sulfide oxidation-dominated domain, whereas a few surface-water samples extended toward the high-ratio region. The MixSIAR results (Figure 7f) further show that sulfide oxidation was the dominant source, contributing 63%, 74%, 82%, and 83% to WGW, EGW, WSW, and ESW, respectively. In contrast, the contributions from gypsum dissolution, manure/sewage, and atmospheric deposition were relatively minor. Overall, sulfate was mainly derived from sulfide oxidation, with a higher contribution to surface water.

4. Discussion

4.1. Hydrogeochemical Patterns and Driving Factors

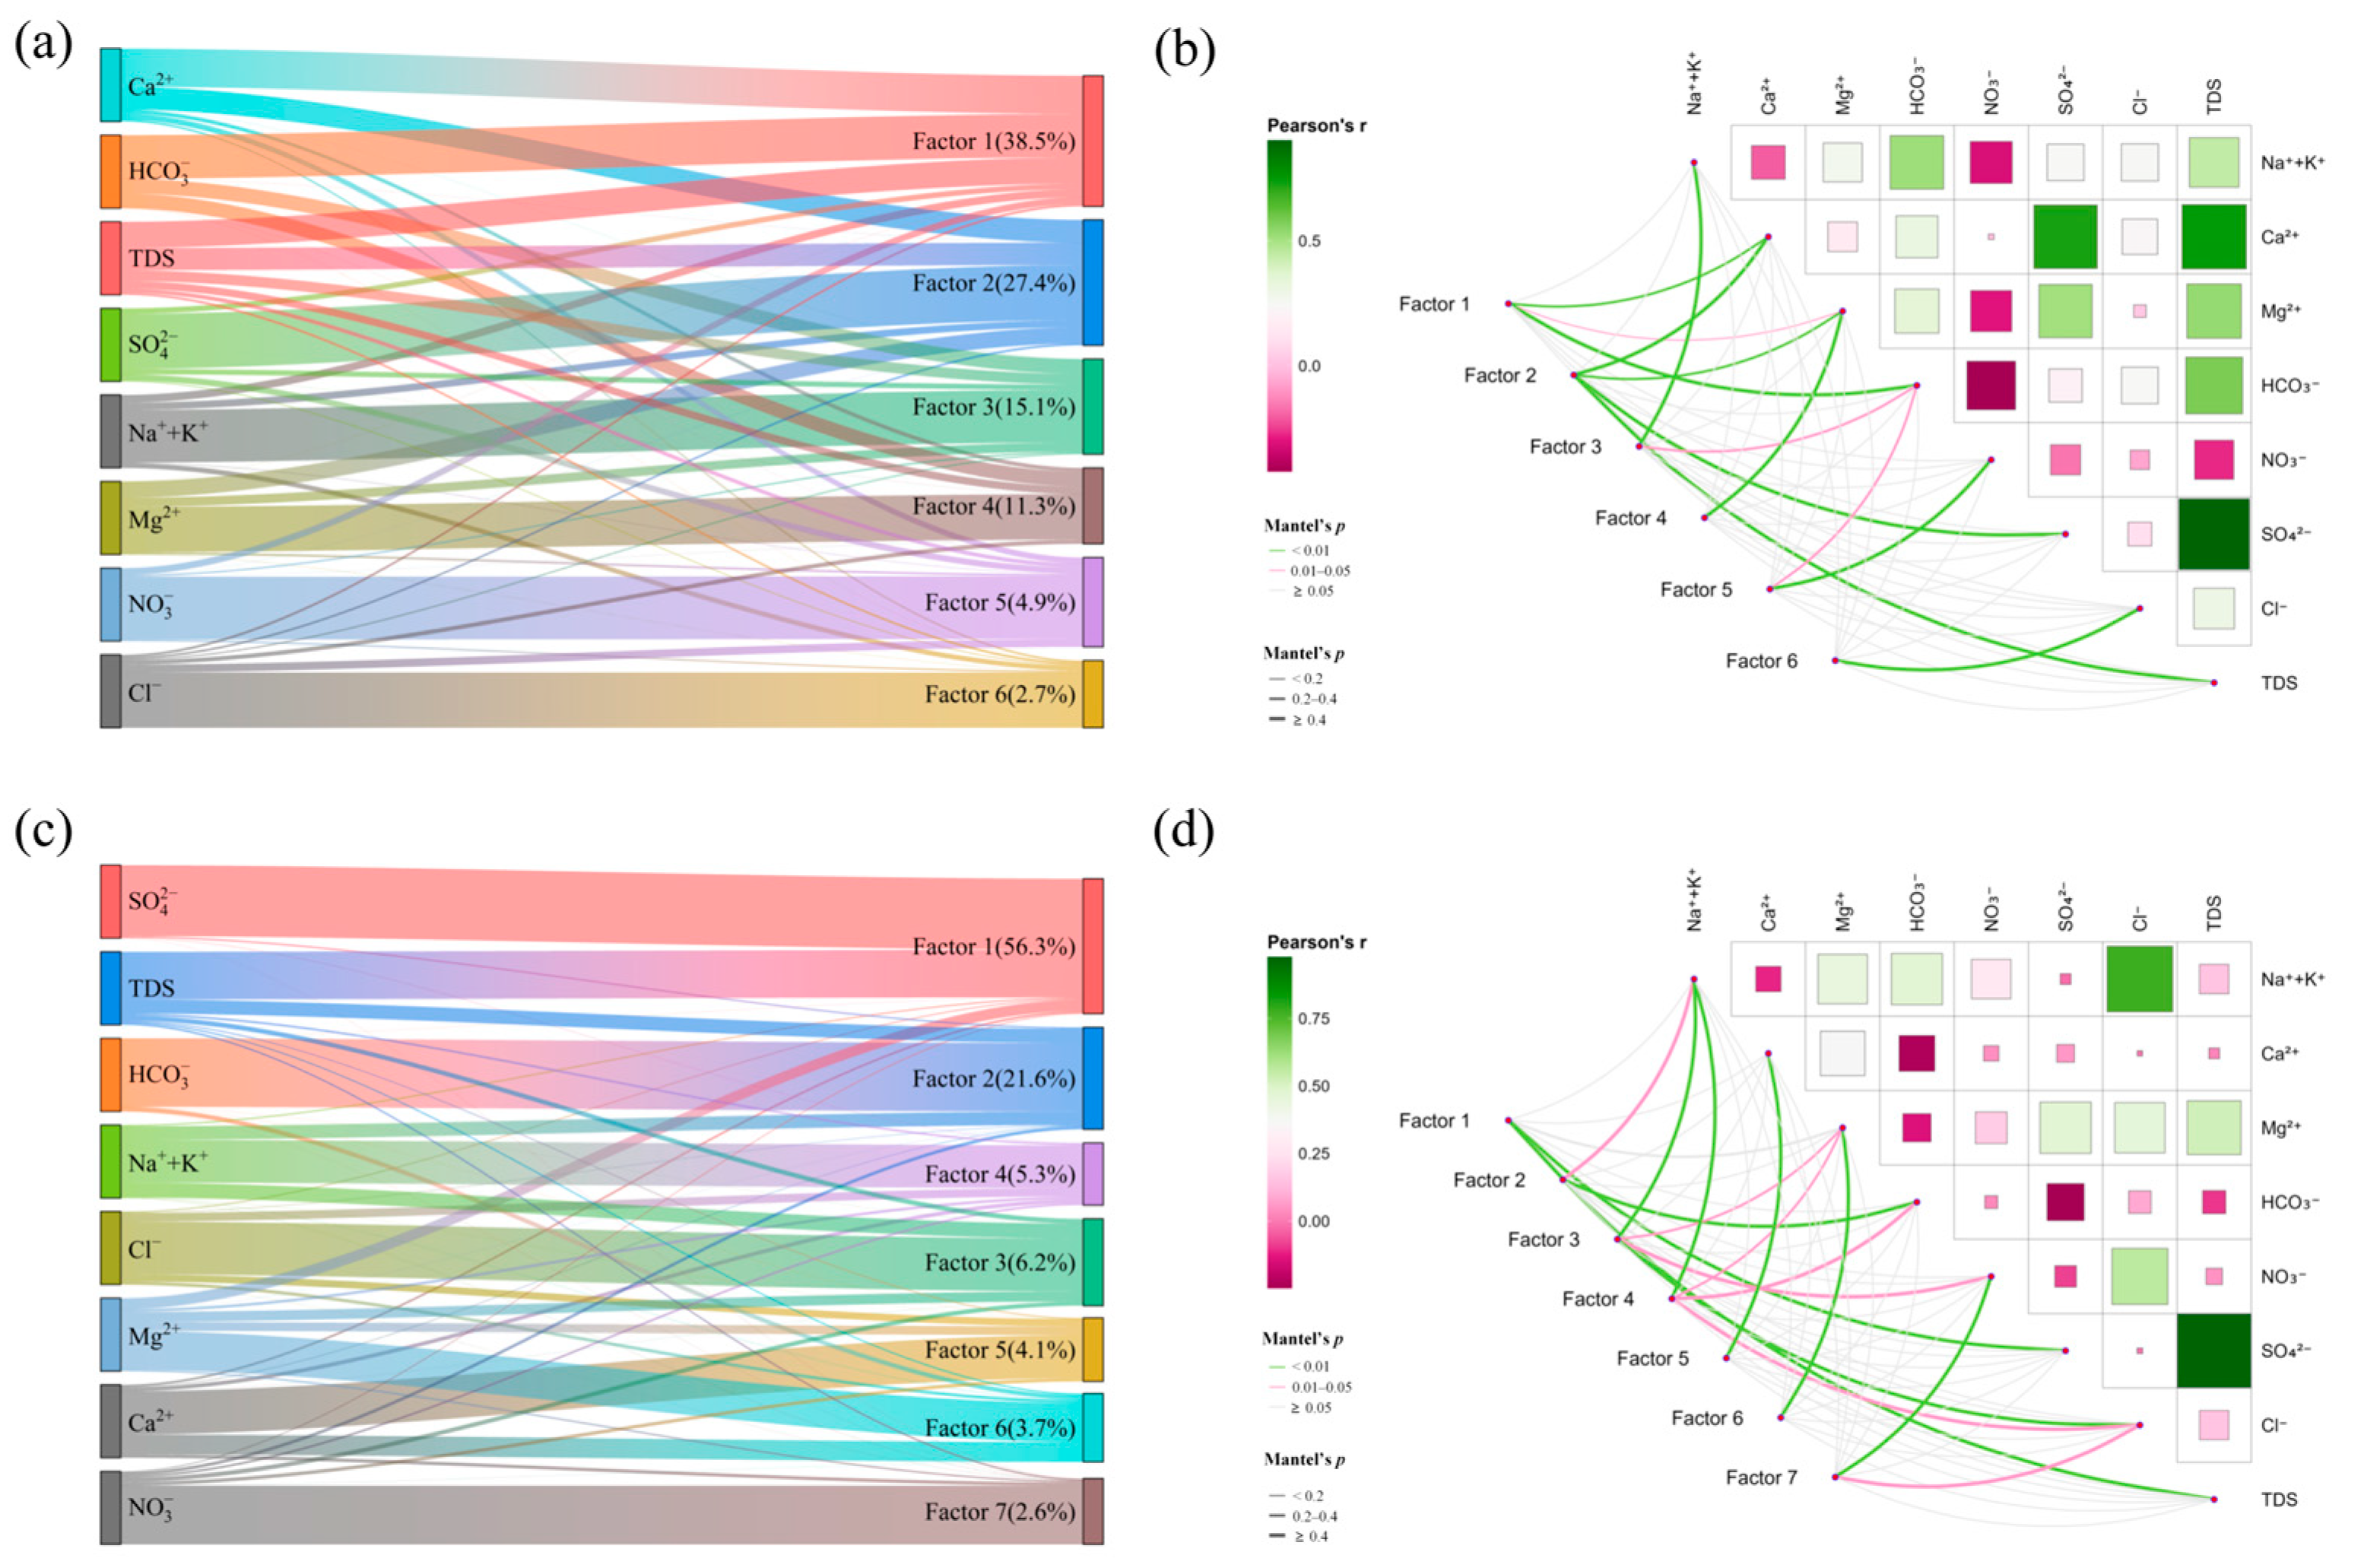
Groundwater in the study area was dominated by the Ca-HCO3 type, whereas surface water was predominantly characterized by the Ca-SO4 type, indicating marked differences in the dominant hydrogeochemical controls between two water bodies. The PMF resolve identified six source-related factors for groundwater and seven factors source-related for surface water (Figure 8), and the high coefficient of determination (R2) and signal-to-noise ratio indicate good model performance [43]. These factors suggest that the hydrochemical differentiation between groundwater and surface water is mainly controlled by different contributions from carbonate dissolution, sulfate-related geochemical processes, and external inputs. Further comparison with previous studies in carbonate karst watersheds shows that the Ca–HCO3-type groundwater observed in this study is consistent with the commonly reported hydrochemical background of karst groundwater controlled by carbonate dissolution and water–rock interaction [44]. However, unlike some karst systems in which both groundwater and surface water retain carbonate-buffered hydrochemical characteristics [5,45], the pronounced Ca–SO4-type signature of surface water in this study indicates stronger influences from sulfate-related processes and external inputs. This contrasting pattern suggests that groundwater in the study watershed largely preserves a carbonate-controlled hydrochemical background, whereas surface water is more sensitive to sulfide oxidation, sulfate mineral inputs, and anthropogenic disturbances.
Carbonate dissolution acts as the primary process the hydrochemical evolution of groundwater. A significant positive correlation was observed between Ca2+ and HCO3 (p < 0.01, r > 0.5), with most sample points aligning closely with the 1:1 stoichiometric ratio, indicating that these ions are primarily derived from the dissolution of carbonate minerals [46]. The Gibbs diagram (Figure S2) further demonstrates that groundwater is mainly regulated by water–rock interactions, rather than precipitation or evaporation [47,48,49], which accounts for the formation of the Ca-HCO3 type. SO42− exhibited a significant positive correlation with Ca2+, Mg2+, and total dissolved solids (TDS) (p < 0.01, r > 0.5) [17,46]. The excess of Ca2+ relative to SO42− indicates that its sources include not only gypsum dissolution (Figure S3), but also sulfide oxidation and the carbonate dissolution enhanced by this process [17,50]. In addition, the deviation between (Na+ + K+) and Cl, together with negative values of the ChlorAlkali Index (CAI), indicates the widespread occurrence of reverse cation exchange processes (Figure S4) [34], which may be superimposed with silicate weathering [46,51]. In contrast, the variation of Mg2+, along with the concentrations of NO3 and Cl, mainly reflects local water–rock interactions and exogenous inputs. Specifically, NO3 is derived from soil nitrogen, agricultural activities, and manure/sewage inputs [52], whereas Cl serves as a robust indicator of multi-source exogenous recharge in the karst agricultural system (Figure S5) [53,54].
Surface water exhibited a sulfate-dominated hydrochemical system (Figure S6). SO42− showed a significant positive correlation with total dissolved solids (TDS) (p < 0.01) and covaried synchronously covariation with Ca2+, indicating that sulfate mineral dissolution is the core driving process of water mineralization [17], which is consistent with the distribution of the Ca-SO4 hydrochemical type. Deviation from the 1:1 stoichiometric ratio was observed in a small number of local samples, pointing to additional exogenous inputs or oxidative processes [17]. Carbonate dissolution was relatively weakened in surface water. The excess of (Ca2+ + Mg2+) relative to HCO3- indicates that acidic inputs (e.g., from sulfate or nitrate) may promote carbonate dissolution, thereby enhancing cation release [17]. Meanwhile, surface water showed a more pronounced response to exogenous inputs. Among them, NO3- as an independent factor reflects in-puts from agricultural non-point sources and domestic pollution [54], whereas the variations of Cl and Na+ indicate that in addition to halite dissolution, silicate weathering or cation exchange processes may also be involved in hydrochemical evolution [51]. In addition, the variation of Mg2+ may be related to dolomite dissolution or secondary water–rock interactions [55].
Overall, the hydrochemical evolution in the study area is characterized by a coupled interaction pattern between a “carbonate-dominated groundwater system” and a “sulfate-dominated, exogenously driven surface water system”. Carbonate rocks provide the fundamental geological background for regional hydrochemistry, while sulfate-related geochemical processes and nitrogen inputs are more pronounced in surface water. Groundwater is primarily governed by water–rock interactions, which contributed to its relative buffering capacity; in contrast, surface water was more susceptible to disturbances from agricultural activities, domestic inputs, mining-related disturbances, and hydrological processes. Although hydraulic connectivity exists between the two water bodies, they maintain dominant controlling mechanisms.
The elevated levels of NO3 and SO42− in surface water directly indicate the substantial impacts of agricultural activities and exogenous inputs on water quality, highlighting the need to optimize fertilization management and reduce nutrient losses in agricultural karst watersheds [54]. Although groundwater possesses a certain buffering capacity, continuous input may still lead to the accumulation of NO3 [52]. Furthermore, the sulfate-dominated characteristics may potentially affect irrigation water quality and soil salinity evolution, which warrants close attention in agricultural water management practices [17].

4.2. Driving Mechanisms of Nitrate and Sulfate in SW-GW

Nitrate and sulfate concentrations in groundwater and surface water of the study area exhibited distinct spatial variations, with overall higher levels in surface water than in groundwater, and higher levels in the western region than in the eastern region. This pattern reflects not only the spatial variability in agricultural and domestic input intensity, but also the influence of well-developed fracture–conduit systems in karst regions, frequent surface water–groundwater interactions, and differences in hydrodynamic conditions. The formation of local high-value zones and anomalous points is essentially the result of the combined effects of pollutant source distribution, hydraulic connectivity, and geochemical processes [15,56,57]. For nitrate, high-value zones in surface water are mainly concentrated in the west, indicating a more direct response to surface-derived nitrogen inputs such as agricultural fertilization, livestock waste discharge, and domestic sewage. These inputs tend to form local enrichment under the effects of rainfall erosion and surface runoff in the agricultural karst watershed [58,59]. In contrast, nitrate concentrations in groundwater were generally low, with only local elevations in the western and northeastern regions, suggesting that nitrate enrichment in groundwater mainly occurred as localized anomalies associated with preferential flow pathways.
Although groundwater flow velocity and residence time were not directly quantified during this sampling campaign, previous tracer studies in analogous karst systems of Southwest China indicate that fracture–conduit–underground river networks can facilitate rapid subsurface transport [60,61]. Once surface-derived water and mobile solutes enter interconnected karst pathways through recharge features such as sinkholes, losing stream reaches, or fractures, they may be efficiently transported toward springs or underground-river outlets under short residence-time conditions [60,62]. Such limited residence time can reduce water–rock/media contact and natural attenuation, thereby weakening the buffering capacity of the vadose zone and aquifer matrix against nitrate migration. Consequently, mobile NO3 from surface inputs likely migrates efficiently within the subsurface system, potentially contributing to the localized accumulation of groundwater NO3 observed in certain zones [11,63].
Further analysis of ion relationships revealed that surface water was generally characterized by a distinct sulfate-dominated hydrochemical type. SO42− showed a significant positive correlation with total dissolved solids (TDS) and covaried synchronously with Ca2+, indicating sulfate-related processes, including sulfate mineral dissolution and sulfide oxidation, played an important role in surface water mineralization [15,64]. Deviation from the theoretical stoichiometric relationship between Ca2+ and SO42− in few local samples suggested the potential co-involvement of additional exogenous inputs or oxidative processes [64,65]. In contrast, groundwater still retained a strong carbonate dissolution background, with its hydrochemical composition primarily governed by water–rock interactions, thus exhibiting a relatively stronger buffering capacity.
Overall, the spatial contrasts of nitrate and sulfate between groundwater and surface water reflect differences in source distribution, hydrodynamic connectivity, and hydrogeochemical buffering capacity. Surface water responded more directly to exogenous inputs and, therefore, exhibits stronger local enrichment and greater spatial heterogeneity, whereas groundwater was characterized by more localized anomalies controlled by preferential flow, subsurface mixing, and aquifer buffering. These results indicate that the spatial differentiation of solutes in agricultural karst watersheds is jointly shaped by external nutrient and pollutant inputs and internal hydrological–geochemical regulation under strong surface water–groundwater interactions.

4.3. Source Apportionment Under Multi-Evidence Constraints

Under multiple-source input conditions in agricultural karst watersheds, a single indicator is often insufficient to distinguish the sources of nitrate and sulfate effectively. Therefore, this study applied an integrated multi-method, multi-evidence framework to enhance the discrimination and reliability of source apportionment results.
For nitrate, the combined characteristics of δ15N–NO3 and δ18O–NO3 provided an initial constraint on the range of potential sources [66,67]. Samples from the study area generally fell within the overlapping domain of manure/sewage (M&S) and soil nitrogen (SN) while being clearly distinct from the typical isotopic ranges of fertilizer nitrogen (NF) and atmospheric deposition (AD), thereby excluding their dominant contributions at the source level. However, isotopic ranges alone were still insufficient to distinguish the relative contributions of M&S and SN. Therefore, the relationship between the molar ratio of NO3/Cl molar ratio and Cl molar concentration was further introduced to constrain source identification. The results showed that most samples did not exhibit the characteristic combination of high NO3/Cl ratio and low Cl concentration, thereby weakening the interpretation of fertilizer input. In contrast, some surface-water samples showed a concurrent increase in NO3 concentration with increasing Cl concentration, indicating the influence of domestic sewage and live-stock waste inputs [68].
Meanwhile, the quantitative source apportionment based on the MixSIAR model further clarified the nitrate source structure in the study area, indicating that M&S and SN were the dominant contributing end members. Comparison with previous studies on nitrate source apportionment in karst watersheds shows that the dominance of M&S and SN in this study provides strong support for the widely recognized view that nitrate in karst water systems is commonly driven by both anthropogenic inputs and natural soil nitrogen transformation [18]. On the other hand, the high contribution of M&S in both surface water and groundwater in this study differs markedly from some agricultural karst systems where chemical fertilizer (NF) or soil nitrogen was identified as the dominant nitrate source [69,70]. This source pattern points to a stronger influence of rural domestic sewage discharge, livestock waste, organic manure input, and related surface an-thropogenic activities on nitrate pollution in the study area.
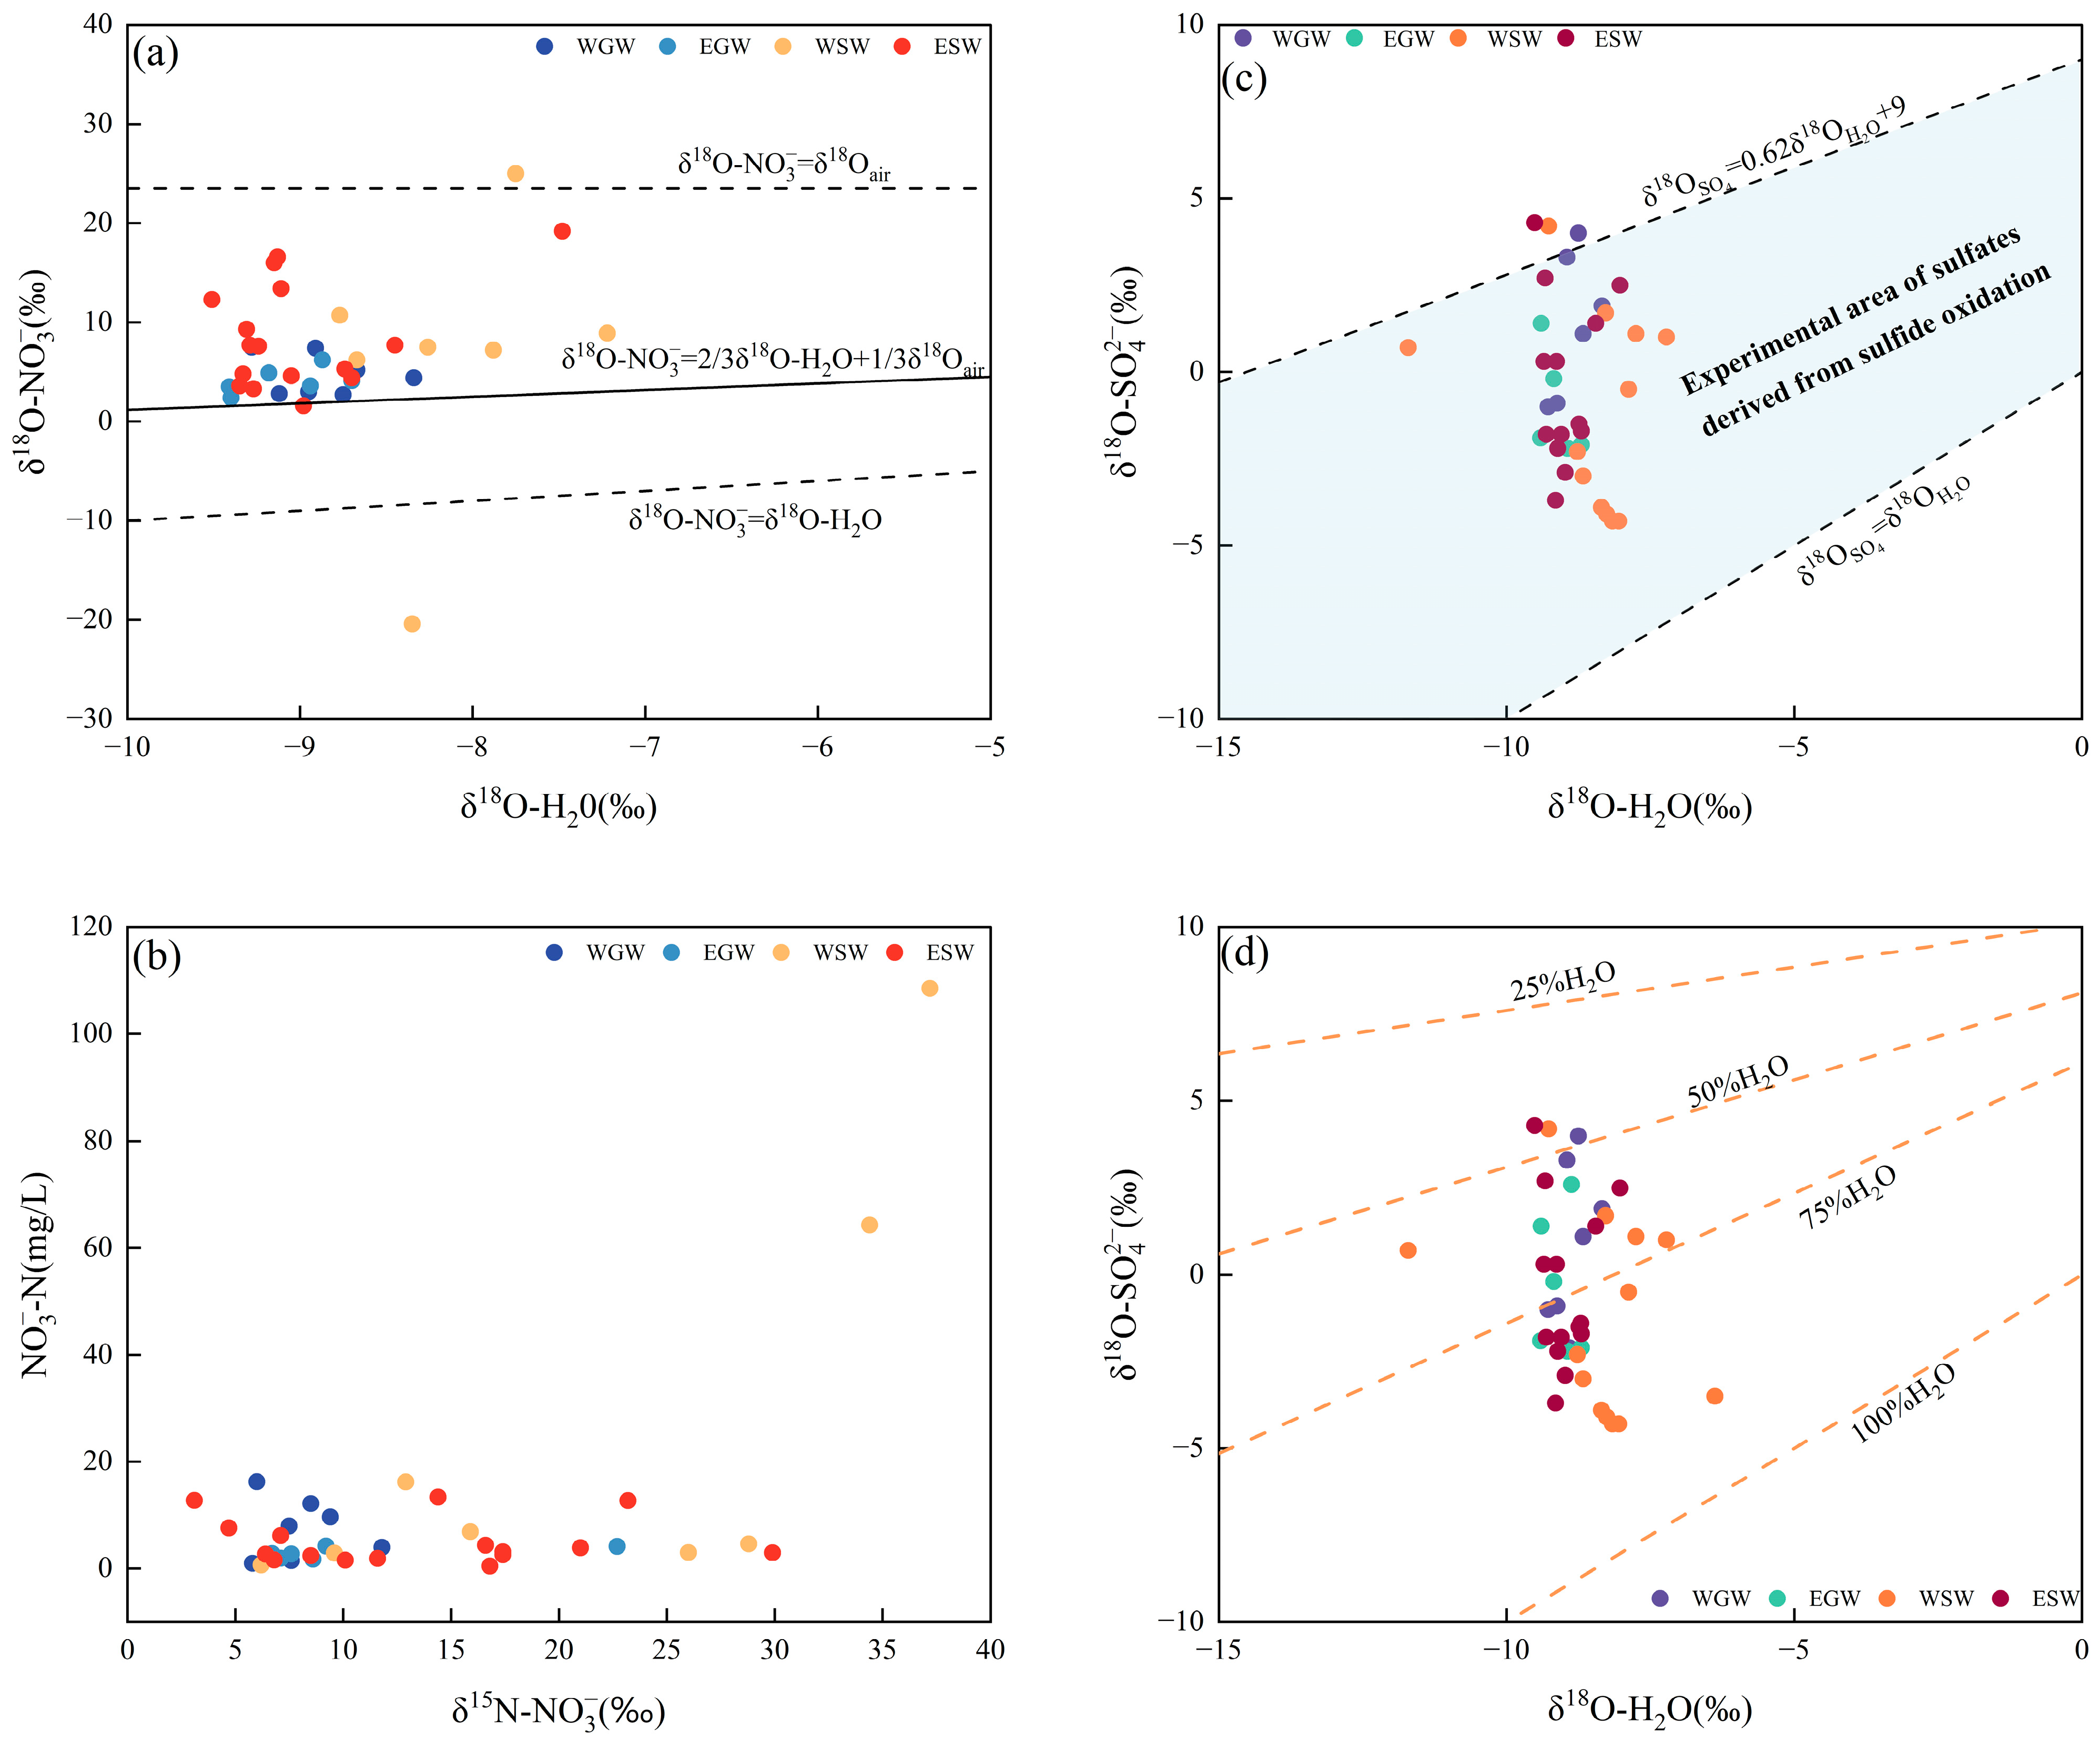
This conclusion was not based on MixSIAR alone; rather, it was also supported by the isotope signatures and ion-ratio evidence, thereby reducing uncertainty under multi-source mixing conditions [71]. Notably, the contribution of M&S was higher in surface water, whereas the proportion of SN increased in groundwater. This difference does not simply reflect differences in input intensity, but it is more likely related to the migration pathways and residence times in different water bodies, as well as the biogeochemical transformation processes that nitrogen undergoes after entering the aquatic system [72,73]. Surface water responds rapidly to near-surface and point-source inputs, whereas in groundwater systems, nitrogen undergoes soil leaching and aquifer filtration, thereby enhancing the relative signal of soil nitrogen [74,75]. Meanwhile, the relationships shown in Figure 9a,b indicate that nitrification is the dominant process in the study area, whereas denitrification is not significant, suggesting that nitrogen does not simply retain its original input signature during migration, but was mainly converted to nitrate through mineralization–nitrification processes [76].
Compared with nitrate, sulfate source identification shows a higher degree of consistency. The combined characteristics of δ34S–SO42− and δ18O–SO42− indicate that most samples were concentrated within the sulfide oxidation domain while being clearly distinct from the typical ranges of gypsum dissolution and atmospheric deposition, supporting the dominant role of sulfide oxidation at the source level. Furthermore, the relationships shown in Figure 9c,d indicate that most samples fell within the sulfate range associated with sulfide oxidation [77], suggesting that the oxygen in sulfate is jointly controlled by water and atmospheric oxygen [78,79], which is consistent with the process characteristics of sulfate formation during sulfide oxidation. At the same time, the relationship between δ34S–SO42− and the equivalent ratio of SO42−/Cl indicates that most samples cluster within the sulfide oxidation domain and do not exhibit the typical signature of manure/sewage input, thereby further weakening the interpretation that domestic sewage is the dominant source [80]. This sulfate source pattern differs from some karst systems strongly controlled by gypsum dissolution, atmospheric deposition, or anthropogenic sulfate inputs [81,82]. Instead, this result is more similar to carbonate or mining-affected karst environments, where sulfide oxidation can release sulfate and acidity, thereby promoting carbonate dissolution and water mineralization [83]. On this basis, although the MixSIAR results also indicated certain contributions from gypsum dissolution, manure/sewage, and atmospheric precipitation, their proportions were relatively low and remained consistent with the isotopic discrimination results, suggesting that these end members mainly act as local supplementary sources. In contrast, sulfide oxidation not only dominates statistically but is also supported by both isotopic and ion-ratio evidence in source identification, thereby providing greater certainty.
A comprehensive comparison of nitrogen and sulfur source apportionment results revealed fundamental differences in the source structures and controlling mechanisms of the two solutes: Nitrate exhibited a pronounced multi-end-member mixing characteristic under the combined influence of agricultural activities, domestic inputs, and soil nitrogen transformation, and thus required joint constraints from multiple indicators for effective source discrimination. In contrast, sulfate was characterized by a single dominant source, with strong consistency among different analytical methods. From a methodological perspective, this difference indicates that, in agricultural karst watersheds where the nitrogen cycle was strongly disturbed by human activities in agricultural karst watersheds, a single isotopic or ratio-based indicator may lead to source misclassification. Therefore, multi-evidence integration is essential for improving the reliability of source apportionment [84,85]. By contrast, for sulfur cycling dominated by geological processes, stable isotopes can provide a relatively robust basis for source discrimination (Figure 10).

4.4. Implications for Agricultural Water Management

Compared with many non-karst aquifers, karst systems are generally more susceptible to pollution because their thin or discontinuous soil cover, sinkholes, fractures, and conduit networks weaken natural filtration and promote rapid surface water–groundwater connectivity [86] In non-karst systems, contaminants carried by precipitation and runoff may be partly filtered and attenuated during slow percolation through soils and porous media [86], whereas in karst terrains, surface-derived contaminants can bypass the soil zone through sinkholes and preferential flow paths and rapidly enter aquifers [87]. Southwest China’s karst regions are commonly characterized by thin soil layers and a dual surface–subsurface structure; therefore, agricultural nutrient inputs, livestock waste, rural domestic discharge, and other surface-derived contaminants can enter groundwater systems more rapidly under limited natural attenuation conditions [88].
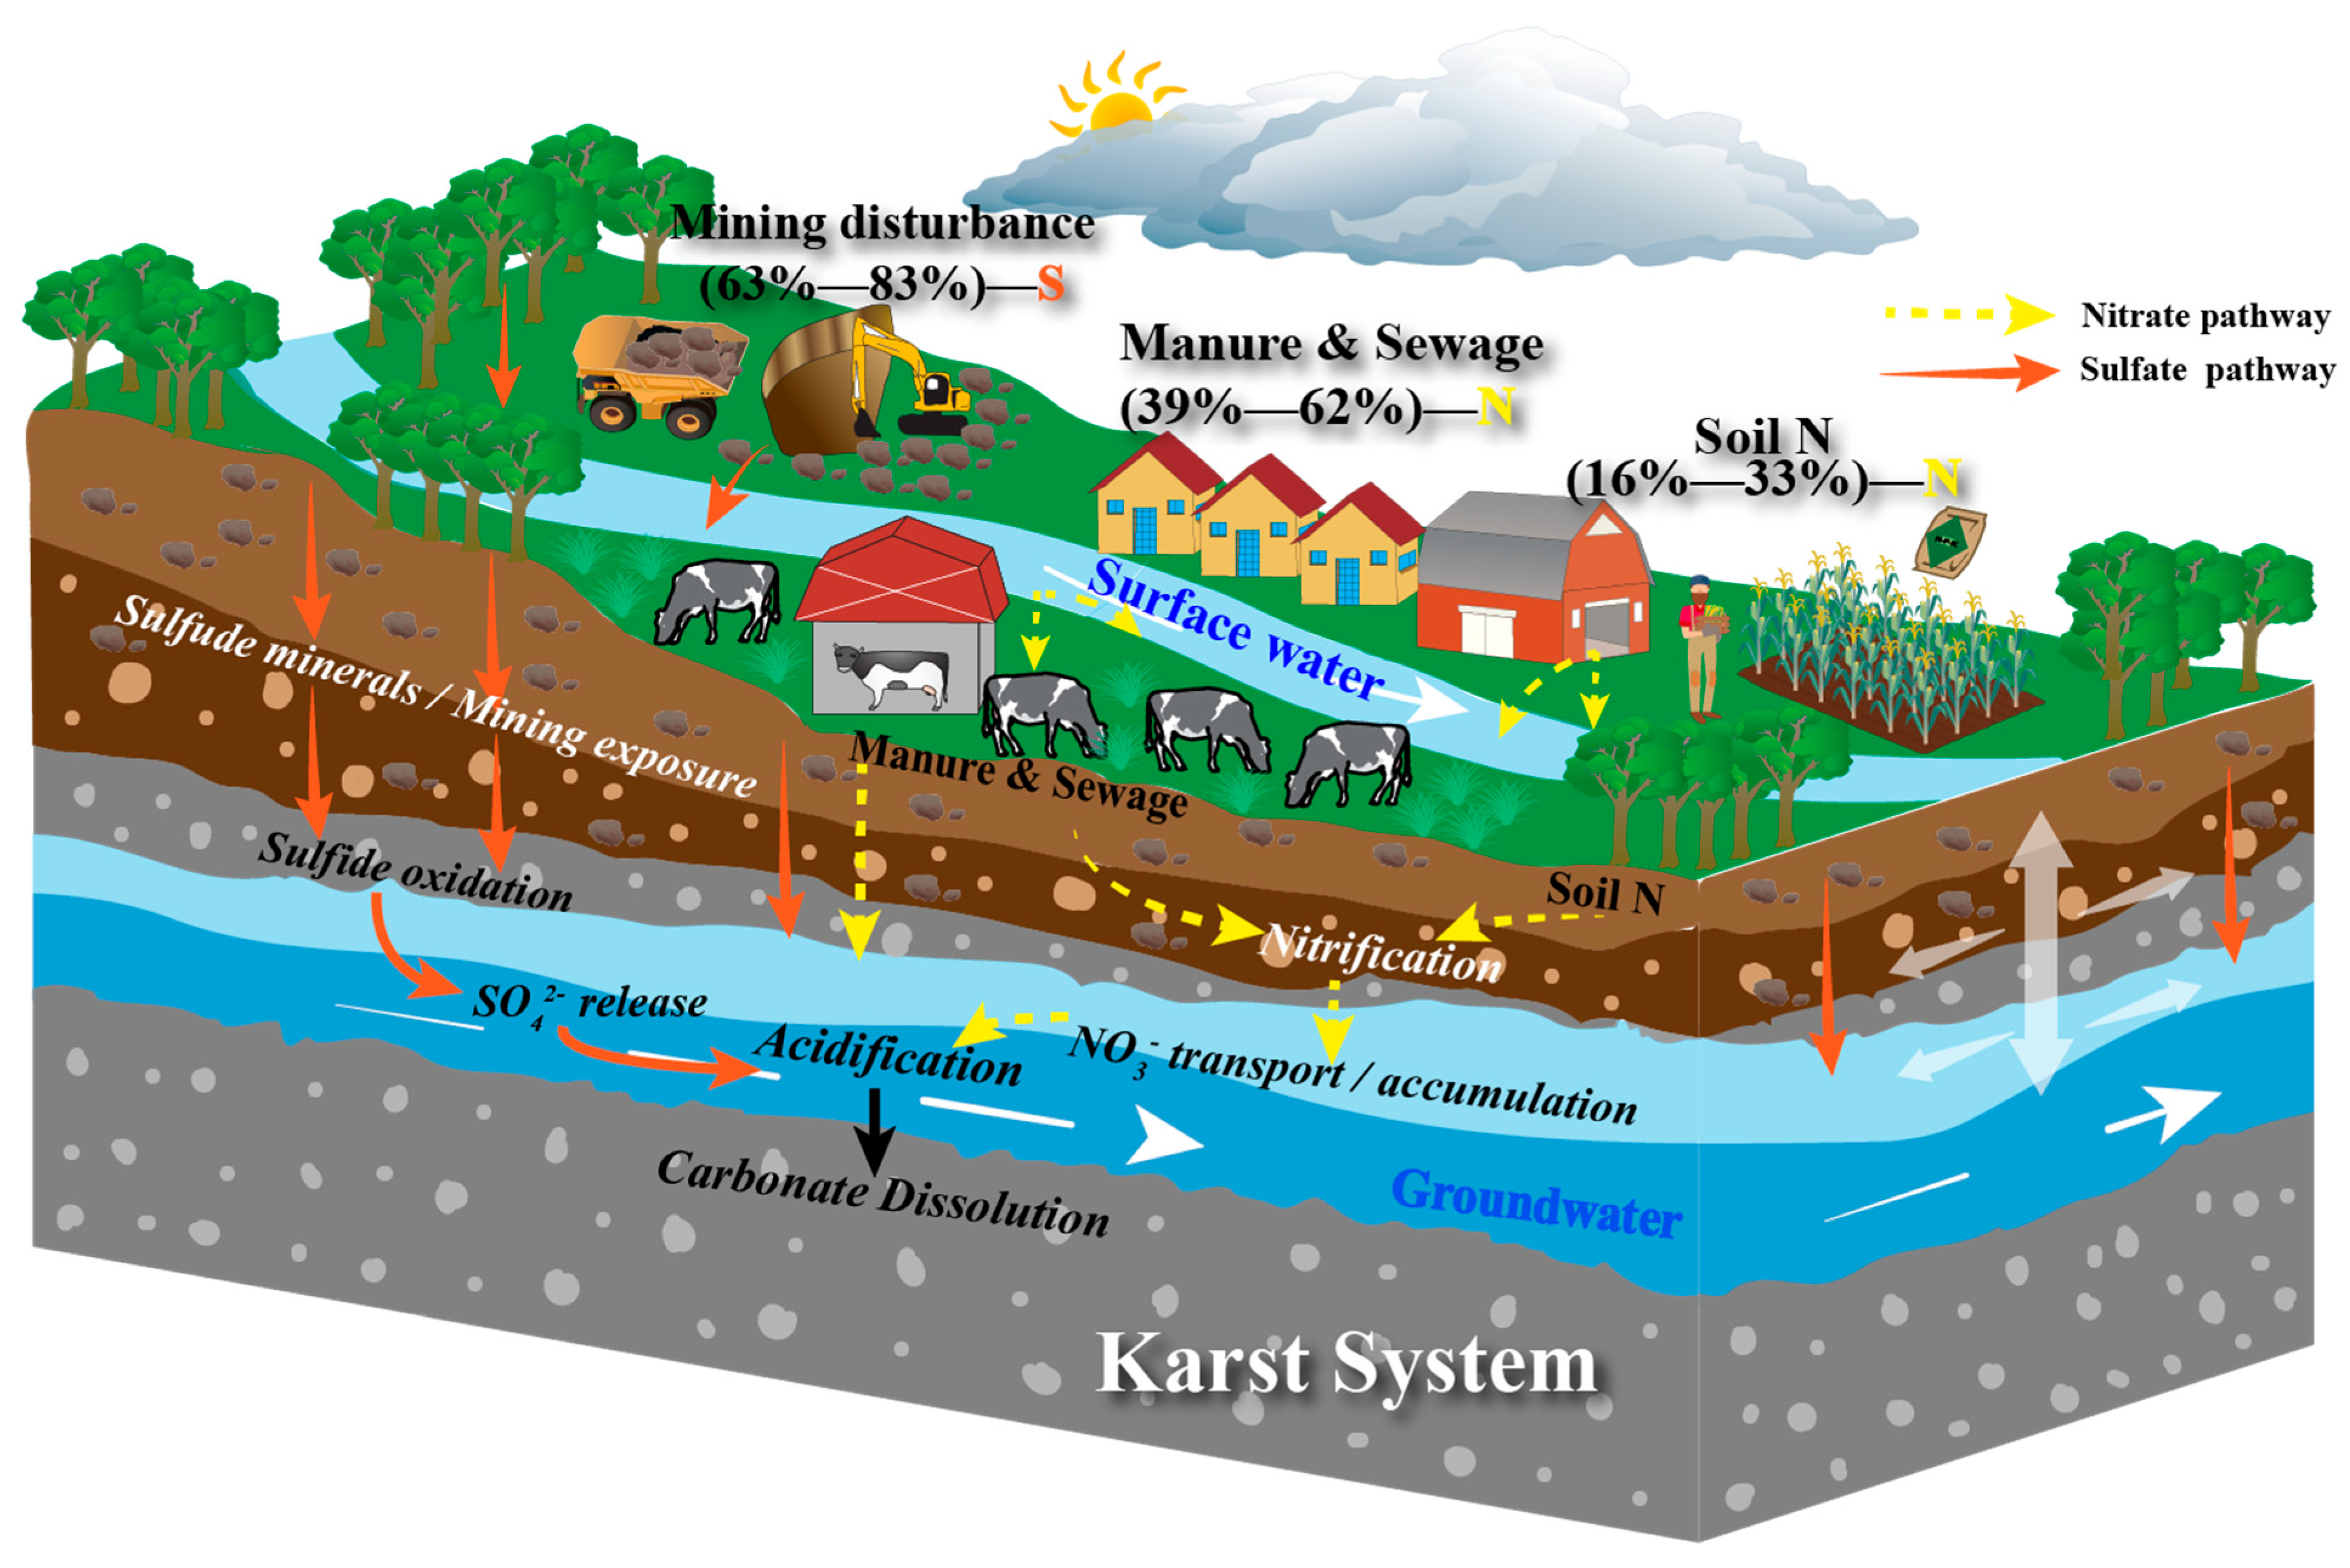
This high connectivity and weak filtration capacity not only enhance contaminant migration between surface water and groundwater, but they also complicate the source signals and transformation processes of nitrate and sulfate. Based on the karst geomorphology, hydrochemical characteristics, and source apportionment results, a conceptual model was established to summarize the migration and transformation of nitrate and sulfate in the agricultural karst watershed (Figure 11). The study area is characterized by well-developed karst fractures and underground conduits, a thin vadose zone, and rapid infiltration, which enhance the hydraulic connectivity between surface water and groundwater and enable exogenous pollutants to enter the aquifer system through rapid flow pathways, thereby influencing hydrochemical evolution [87,89]. Under this hydrological setting, groundwater is still dominated overall by the Ca–HCO3 hydrochemical facies, indicating that its evolution is fundamentally controlled by natural water–rock interactions such as carbonate dissolution. However, sulfate-related reactions, cation exchange, and anthropogenic inputs also modify its chemical composition. In contrast, surface water responded more directly to agricultural, domestic, and other surface-derived inputs and is characterized by higher TDS and more complex hydrochemical types, reflecting the combined influences of agricultural activities, domestic sewage, and mining disturbances [90,91].
In terms of solute evolution mechanisms, nitrate and sulfate exhibit markedly different yet coupled process controls. Nitrate is mainly derived from manure/sewage inputs and undergoes continuous transformation and accumulation through nitrification under oxidizing conditions, indicating that anthropogenic nitrogen inputs are the primary driver of nitrate concentration variability. Sulfate, by contrast, is primarily derived from sulfide oxidation and is jointly controlled by geological background and mining activities, reflecting a stronger natural dominance. Notably, both sulfide oxidation and exogenous nitrogen inputs can increase system acidity and thereby promote carbonate dissolution, enhance water mineralization, and forming a coupled interaction between nitrogen–sulfur processes and water–rock interactions [92,93]. Based on the above processes, the study area can be generalized as a hydrogeochemical system characterized by “rapid infiltration–strong connectivity–multi-source inputs–and coupled transformation. In this system,” surface water exhibits a rapid response to pollution and a complex chemical composition, whereas groundwater, although constrained by the buffering effect of the aquifer, still preserves superimposed signatures of exogenous inputs.
From the perspective of agricultural water management, this conceptual model indicates that the water environments in agricultural karst watersheds are highly sensitive to both non-point and point-source pollution [94,95], and that the traditional perception of groundwater as a well-buffered reservoir is not fully applicable in such regions. Therefore, priority should be given to controlling manure and domestic sewage discharge, strengthening the management of agricultural nitrogen inputs and livestock wastewater treatment, and implementing control measures to limit the exposure and oxidation of sulfide-bearing materials caused by mining activities. In addition, targeted protection and long-term monitoring should be implemented out in key recharge zones and highly connected flow–pathway areas to reduce the long-term impacts of rapid pollutant infiltration on the groundwater system and to support sustainable agricultural water management in vulnerable karst regions.

5. Conclusions

This study integrated hydrochemical characteristics, stable isotopes, ion ratios, self-organizing maps (SOM), positive matrix factorization (PMF), and a Bayesian mixing model to systematically identify the sources, migration pathways, and transformation mechanisms of nitrate and sulfate in a typical agricultural karst watershed. The results further clarified the hydrochemical evolution of the coupled surface water–groundwater system under the combined influence of natural hydrogeochemical processes and agriculture-related anthropogenic activities. Clear hydrochemical differentiation was observed between groundwater and surface water. Groundwater was predominantly characterized by the Ca-HCO3 type and was mainly controlled by carbonate weathering, showing relatively high hydrochemical stability. In contrast, surface water exhibited higher TDS, more complex hydrochemical types, and greater sensitivity to external inputs, including agricultural activities, domestic sewage, and mining disturbances. Multi-proxy source apportionment indicated that nitrate was mainly derived from manure/sewage and soil nitrogen, contributing 39–62% and 16–33%, respectively. In contrast, sulfate was predominantly deprived from sulfide oxidation, contributing 63–83%. These results suggest that nitrogen cycling in the study area is largely affected by agricultural and domestic inputs, whereas sulfur cycling is mainly governed by geological processes. The migration and transformation pathways of nitrate and sulfate were also distinct. Nitrate mainly underwent nitrification under oxic conditions, with limited evidence of denitrification, while sulfate was primarily generated through sulfide oxidation. The rapid infiltration and strong hydraulic connectivity typical of the karst system intensified solute exchange between surface water and groundwater. This connectivity made surface water more responsive to short-term pollution inputs, while groundwater remained vulnerable to cumulative impacts despite its buffering capacity. Overall, the anthropogenically driven nitrogen cycle and geologically dominated sulfur cycle jointly shape the regional hydrochemical pattern in the agricultural karst watershed. This study provides a process-based scientific basis for nutrient pollution control, groundwater protection, and water environment management in karst agricultural areas, and it has important implications for protecting water resources in karst basins experiencing strong agricultural and other anthropogenic disturbances.

Supplementary Materials

The following supporting information can be downloaded at: https://www.mdpi.com/article/10.3390/agronomy16131281/s1. Table S1. Basic information of groundwater and surface-water sampling sites in the study area. Figure S1. Boxplots of major hydrochemical parameters in groundwater (a) and surface water (b). Figure S2. Influence of the F1 driving factor on the hydrochemical composition of groundwater in different clusters. The relationships between variables are shown as follows: (a) Ca2+ vs. HCO3; (b) TDS vs. (Na+ + K+)/(Na+ + K+ + Ca2+). Figure S3. Influence of the F2 driving factor on the hydrochemical composition of groundwater in different clusters. The relationships between variables are shown as follows: (a) Ca2+ vs. SO42; (b) TDS vs. SO42. Figure S4. Influence of the F3 driving factor on the hydrochemical composition of groundwater in different clusters. The relationships between variables are shown as follows: (a) Na+ + K+ vs. Cl; (b) CAI-2 vs. CAI-1; (c) Ca2+ + Mg2+ − HCO3 − SO42 vs. Na+ + K+ − Cl; (d) Na+ + K+ vs. HCO3. Figure S5. Influence of the F4–F6 driving factors on the hydrochemical composition of groundwater in different clusters. The relationships between variables are shown as follows: (a) Ca2+ vs. Mg2+; (b) Mg2+ vs. SO42; (c) NO3 vs. Cl. Figure S6. Influence of the driving factor on the concentrations of surface-water components in different clusters. The relationships between variables are shown as follows: (a) Ca2+ vs. SO42; (b) Ca2+ + Mg2+ vs. HCO3; (c) Na+ vs. Cl; (d) NO3 vs. Cl; (e) TDS vs. Cl.

Author Contributions

Conceptualization, H.L., Q.L., L.Z., and J.J.; Methodology, H.L., S.L., and L.Z.; Software, S.L.; Formal analysis, L.Q. and A.Z.; Investigation, S.L.; Resources, S.L.; Data curation, H.L.; Writing—original draft, H.L., L.Q. and A.Z.; Writing—review and editing, H.L., L.Q., A.Z., and J.J.; Visualization, H.L., L.Q., A.Z., and J.J.; Supervision, S.L., L.Z., C.L., and J.J.; Project administration, S.L., Q.L., and C.L.; Funding acquisition, H.L., Q.L., and C.L. All authors have read and agreed to the published version of the manuscript.

Funding

This study has also been financially supported by the Karst Water Resources and Environment Academician Workstation of Guizhou Province (Qiankehepingtai-KXJZ [2024]005) and by the National Natural Science Foundation of China (grant no. 42501037, 52525902, 42401504, 52279018, 52121006), and the Sichuan Natural Science Foundation (Grant No. 2026NSFSC1121). This study has also been financially supported by the Open Research Subject of Key Laboratory of Fluid and Power Machinery (Xihua University), Ministry of Education (grant number LTDL-2025016) and by China Postdoctoral Science Foundation Funded Project (grant no. 2024M753154).

Data Availability Statement

The raw data supporting the conclusions of this article will be made available by the authors on request due to restrictions related to sampling-site information and ongoing project data management.

Acknowledgments

This study has also been financially supported by the Karst Water Resources and Environment Academician Workstation of Guizhou Province (Qiankehepingtai-KXJZ [2024]005) and by the National Natural Science Foundation of China (grant nos. 42501037, 52525902, 42401504, 52279018, 52121006), and the Sichuan Natural Science Foundation (Grant No. 2026NSFSC1121). This study has also been financially supported by the Open Research Subject of Key Laboratory of Fluid and Power Machinery (Xihua University), Ministry of Education (grant number LTDL-2025016) and by China Postdoctoral Science Foundation Funded Project (grant no. 2024M753154). The authors utilized ChatGPT (GPT-5.5 Thinking, OpenAI, CA, USA) only for language polishing and editing of the manuscript.

Conflicts of Interest

The authors declare no conflict of interest.

References

  1. Ren, K.; Pan, X.; Yuan, D.; Zeng, J.; Liang, J.; Peng, C. Nitrate sources and nitrogen dynamics in a karst aquifer with mixed nitrogen inputs (Southwest China): Revealed by multiple stable isotopic and hydrochemical proxies. Water Res. 2022, 210, 118000. [Google Scholar] [CrossRef]
  2. Wang, F.; Chen, H.; Lian, J.; Nie, Y. Hydrological response of karst stream to precipitation variation recognized through the quantitative separation of runoff components. Sci. Total Environ. 2020, 748, 142483. [Google Scholar] [CrossRef] [PubMed]
  3. Zhang, Z.; Chen, X.; Cheng, Q.; Soulsby, C. Storage dynamics, hydrological connectivity and flux ages in a karst catchment: Conceptual modelling using stable isotopes. Hydrol. Earth Syst. Sci. 2019, 23, 51–71. [Google Scholar] [CrossRef]
  4. Kalhor, K.; Ghasemizadeh, R.; Rajic, L.; Alshawabkeh, A. Assessment of groundwater quality and remediation in karst aquifers: A review. Groundw. Sustain. Dev. 2019, 8, 104–121. [Google Scholar] [PubMed]
  5. Maas, B.; Peterson, E.W.; Honings, J.; Oberhelman, A.; Oware, P.; Rusthoven, I.; Watson, A. Differentiation of Surface Water and Groundwater in a Karst System Using Anthropogenic Signatures. Geosciences 2019, 9, 148. [Google Scholar] [CrossRef]
  6. Lang, Y.-C.; Liu, C.-Q.; Zhao, Z.-Q.; Li, S.-L.; Han, G.-L. Geochemistry of surface and ground water in Guiyang, China: Water/rock interaction and pollution in a karst hydrological system. Appl. Geochem. 2006, 21, 887–903. [Google Scholar] [CrossRef]
  7. Chang, L.; Ming, X.; Groves, C.; Ham, B.; Wei, C.; Yang, P. Nitrate fate and decadal shift impacted by land use change in a rural karst basin as revealed by dual nitrate isotopes. Environ. Pollut. 2022, 299, 118822. [Google Scholar] [CrossRef] [PubMed]
  8. Zhu, M.; Chen, J.; He, C.; Ren, S.; Liu, G. Multi-method characterization of groundwater nitrate and sulfate contamination by karst mines in southwest China. Sci. Total Environ. 2024, 946, 174375. [Google Scholar] [CrossRef] [PubMed]
  9. Tang, C.; Jin, H.; Liang, Y. Using Isotopic and Hydrochemical Indicators to Identify Sources of Sulfate in Karst Groundwater of the Niangziguan Spring Field, China. Water 2021, 13, 390. [Google Scholar] [CrossRef]
  10. Zhao, H.; Xiao, Q.; Miao, Y.; Wang, Z.; Wang, Q. Sources and transformations of nitrate constrained by nitrate isotopes and Bayesian model in karst surface water, Guilin, Southwest China. Environ. Sci. Pollut. Res. Int. 2020, 27, 21299–21310. [Google Scholar] [CrossRef] [PubMed]
  11. Yang, P.; Wang, Y.; Wu, X.; Chang, L.; Ham, B.; Song, L.; Groves, C. Nitrate sources and biogeochemical processes in karst underground rivers impacted by different anthropogenic input characteristics. Environ. Pollut. 2020, 265, 114835. [Google Scholar] [CrossRef] [PubMed]
  12. Jiang, C.; Cheng, L.; Li, C.; Zheng, L. A hydrochemical and multi-isotopic study of groundwater sulfate origin and contribution in the coal mining area. Ecotoxicol. Environ. Saf. 2022, 248, 114286. [Google Scholar] [CrossRef] [PubMed]
  13. Qu, S.; Wang, C.; Liang, X.; Luo, A.; Shi, Z.; Wang, G.; Yu, R. Regional characteristics of groundwater sulfate source and evolution in the multi-layer aquifer system of the northern Shaanxi coal mine base, northwestern China: Evidence from geo-chemical and isotopic fingerprints. J. Hazard. Mater. 2024, 480, 135866. [Google Scholar] [PubMed]
  14. Zhou, X.; He, S.; Yang, Y.; Wu, P.; Luo, W. Hydrochemical fingerprints of karst underground river systems impacted by urbanization in Guiyang, Southwest China. J. Contam. Hydrol. 2024, 264, 104356. [Google Scholar] [CrossRef] [PubMed]
  15. Tao, L.; Zhang, Y.; Yuan, X.; Chen, Q.; Yu, J.; Ma, Y.; Liu, H.; Tu, C. Hydrological processes in multi-layered aquifers of a karst watershed with coal mining activity: Insights from hydrochemistry and isotopes. J. Hydrol. Reg. Stud. 2024, 56, 102016. [Google Scholar] [CrossRef]
  16. Nikolenko, O.; Jurado, A.; Borges, A.V.; Knöller, K.; Brouyère, S. Isotopic composition of nitrogen species in groundwater under agricultural areas: A review. Sci. Total Environ. 2018, 621, 1415–1432. [Google Scholar] [CrossRef] [PubMed]
  17. Wang, H.; Zhang, Q. Research Advances in Identifying Sulfate Contamination Sources of Water Environment by Using Stable Isotopes. Int. J. Environ. Res. Public Health 2019, 16, 1914. [Google Scholar] [CrossRef] [PubMed]
  18. Liao, H.; Jiang, Z.; Zhou, H.; Qin, X.; Huang, Q. Isotope-Based Study on Nitrate Sources in a Karst Wetland Water, Southwest China. Water 2022, 14, 1533. [Google Scholar] [CrossRef]
  19. Peng, G.; Gao, X.; Naseem, A.; Zhang, Y.; Wang, X.; Fu, W.; Yu, F.; Ma, S.; Shi, W.; Yi, L.; et al. Karst water quality, source of pollution, and health risk assessment in China. Sci. Total Environ. 2025, 973, 179120. [Google Scholar] [CrossRef] [PubMed]
  20. HJ 493-2009; Water Quality—Technical Regulation of the Preservation and Handling of Samples. China Environmental Science Press: Beijing, China, 2009.
  21. International Atomic Energy Agency. Reference Sheet for VSMOW2 and SLAP2 International Measurement Standards; IAEA: Vienna, Austria, 2017. [Google Scholar]
  22. Sigman, D.M.; Casciotti, K.L.; Andreani, M.; Barford, C.; Galanter, M.; Böhlke, J.K. A bacterial method for the nitrogen isotopic analysis of nitrate in seawater and freshwater. Anal. Chem. 2001, 73, 4145–4153. [Google Scholar] [CrossRef] [PubMed]
  23. International Atomic Energy Agency. Reference Sheet: Reference Materials for δ34S-Isotope Values IAEA-S-1, IAEA-S-2, IAEA-S-3; IAEA: Vienna, Austria, 2020. [Google Scholar]
  24. Halas, S.; Szaran, J. Improved thermal decomposition of sulfates to SO2 and mass spectrometric determinations of δ34S of IAEA-SO-5, IAEA-SO-6 and NBS-127 sulfate standards. Rapid Commun. Mass Spectrom. 2001, 15, 1618–1620. [Google Scholar]
  25. Böhlke, J.K.; Mroczkowski, S.J.; Coplen, T.B. Oxygen isotopes in nitrate: New reference materials for 18O:17O:16O measurements and observations on nitrate-water equilibration. Rapid Commun. Mass Spectrom. 2003, 17, 1835–1846. [Google Scholar]
  26. Paatero, P.; Tapper, U. Positive matrix factorization: A non-negative factor model with optimal utilization of error estimates of data values. Environmetrics 1994, 5, 111–126. [Google Scholar]
  27. Stock, B.C.; Jackson, A.L.; Ward, E.J.; Ward, E.J.; Parnell, A.C.; Phillips, D.L.; Semmens, B.X. Analyzing mixing systems using a new generation of Bayesian tracer mixing models. PeerJ 2018, 6, e5096. [Google Scholar] [CrossRef] [PubMed]
  28. Kohonen, T. Self-organized formation of topologically correct feature maps. Biol. Cybern. 1982, 43, 59–69. [Google Scholar] [CrossRef]
  29. Nakagawa, K.; Amano, H.; Kawamura, A.; Berndtsson, R. Classification of groundwater chemistry in Shimabara, using self-organizing maps. Hydrol. Res. 2016, 48, 840–850. [Google Scholar] [CrossRef]
  30. Kalteh, A.M.; Hjorth, P.; Berndtsson, R. Review of the self-organizing map (SOM) approach in water resources: Analysis, modelling and application. Environ. Model. Softw. 2008, 23, 835–845. [Google Scholar] [CrossRef]
  31. Hao, Q.; Xiao, Y.; Liu, K.; Yang, H.; Chen, H.; Wang, L.; Wang, J.; Zhang, Y.; Hu, W.; Liu, Y.; et al. Spatial pattern of groundwater chemistry in a typical piedmont plain of Northern China driven by natural and anthropogenic forces. Sci. Rep. 2025, 15, 7643. [Google Scholar] [CrossRef] [PubMed]
  32. Kim, K.-H.; Park, M.; Park, T.; Baek, D.; Kim, G.; Heo, N.; Chun, D.J. Spatial heterogeneity patterns along the human footprint gradient and their ecological implications: A case study in South Korea. Ecol. Indic. 2025, 177, 113771. [Google Scholar] [CrossRef]
  33. Rahman, A.T.M.S.; Kono, Y.; Hosono, T. Self-organizing map improves understanding on the hydrochemical processes in aquifer systems. Sci. Total Environ. 2022, 846, 157281. [Google Scholar] [CrossRef] [PubMed]
  34. Fan, W.; Zhou, J.; Zheng, J.; Guo, Y.; Hu, L.; Shan, R. Hydrochemical characteristics, control factors and health risk assessment of groundwater in typical arid region Hotan Area, Chinese Xinjiang. Environ. Pollut. 2024, 363, 125301. [Google Scholar] [CrossRef] [PubMed]
  35. Sheng, Y.; Gao, W.; Cao, M.; Cheng, H.; Cai, Y.; Hu, X.; Liu, Y.; Li, B.; Zhang, Y.; Wang, Z.; et al. Enhancing source apportionment of carbon, nitrogen, and phosphorus through integrating PMF and observed source profiles in a subtropical river. Heliyon 2024, 10, e38190. [Google Scholar] [CrossRef] [PubMed]
  36. Guan, Q.; Wang, F.; Xu, C.; Pan, N.; Lin, J.; Zhao, R.; Yang, Y.; Luo, H. Source apportionment of heavy metals in agricultural soil based on PMF: A case study in Hexi Corridor, northwest China. Chemosphere 2018, 193, 189–197. [Google Scholar] [CrossRef] [PubMed]
  37. Ustaoğlu, F.; Yüksel, B.; Yazman, M.M.; Jaskuła, J.; Tokatli, C. Chemometric investigation of river system contamination: Source identification and risk assessment using positive matrix factorization and Monte Carlo simulation. J. Contam. Hydrol. 2025, 273, 104627. [Google Scholar] [CrossRef] [PubMed]
  38. Zanotti, C.; Rotiroti, M.; Fumagalli, L.; Stefania, G.A. Groundwater and surface water quality characterization through positive matrix factorization combined with GIS approach. Water Res. 2019, 159, 122–134. [Google Scholar] [CrossRef] [PubMed]
  39. Zhang, Q.; Wang, H.; Lu, C. Tracing sulfate origin and transformation in an area with multiple sources of pollution in northern China by using environmental isotopes and Bayesian isotope mixing model. Environ. Pollut. 2020, 265, 115105. [Google Scholar] [CrossRef] [PubMed]
  40. Luan, B.; Wang, A.; Huo, Z.; Lin, X. Identification of Nitrate Sources in the Upper Reaches of Xin’an River Basin Based on the MixSIAR Model. Water 2025, 17, 3584. [Google Scholar] [CrossRef]
  41. Zhu, H.; Zhou, J.; Liu, Z.; Yang, L. Hydrogeochemistry Evidence for Impacts of Chemical Acidic Wastewater on Karst Aquifer in Dawu Water Source Area, Northern China. Int. J. Environ. Res. Public Health 2021, 18, 8478. [Google Scholar] [CrossRef] [PubMed]
  42. Ali Khan, M.; Wen, J. Evaluation of physicochemical and heavy metals characteristics in surface water under anthropogenic activities using multivariate statistical methods, Garra River, Ganges Basin, India. Environ. Eng. Res. 2021, 26, 200280. [Google Scholar]
  43. Cui, H.; Duan, L.; Pan, H.; Liu, T. Geochemical pattern, quality and driving forces of multi-layer groundwater in a high-capacity mining area basin: A comprehensive analysis based on the interweaving of multiple factors. J. Hydrol. 2025, 660, 133376. [Google Scholar]
  44. Zhu, X.; Liu, L.; Lan, F.; Li, J. Hydrogeochemistry Characteristics of Groundwater in the Nandong Karst Water System, China. Atmosphere 2022, 13, 604. [Google Scholar] [CrossRef]
  45. Song, K.; Yang, G.; Wang, F.; Liu, J. Application of Geophysical and Hydrogeochemical Methods to the Protection of Drinking Groundwater in Karst Regions. Int. J. Environ. Res. Public Health 2020, 17, 3627. [Google Scholar] [CrossRef] [PubMed]
  46. Zhang, C.; Zhang, B.; Zhang, W.; Zou, J. Hydrochemical Characteristics and Evolution under the Influence of Multiple Anthropogenic Activities in Karst Aquifers, Northern China. Water 2024, 16, 1656. [Google Scholar] [CrossRef]
  47. Gibbs, R.J. Mechanisms controlling world water chemistry. Science 1970, 170, 1088–1090. [Google Scholar] [CrossRef] [PubMed]
  48. Razi, M.H.; Wilopo, W.; Putra, D.P.E. Hydrogeochemical evolution and water–rock interaction processes in the multilayer volcanic aquifer of Yogyakarta-Sleman Groundwater Basin, Indonesia. Environ. Earth Sci. 2024, 83, 164. [Google Scholar]
  49. Ma, N.; Gao, L.; Ge, Z.; Li, M. Hydrochemical characteristics of groundwater in a plain river network region: Establishing linkages between source and water quality variables. Chemosphere 2023, 331, 138809. [Google Scholar] [CrossRef] [PubMed]
  50. Qiao, W.; Wang, Y.; He, P.; Yin, X.; Zhang, D.; Bai, G.; Sun, W.; Luo, Z.; Wei, X.; Lan, J.; et al. Groundwater arsenic and antimony mobility from an antimony mining area: Controls of sulfide oxidation, carbonate and silicate weathering, and secondary mineral precipitation. Water Res. 2025, 273, 123086. [Google Scholar] [CrossRef] [PubMed]
  51. Li, X.; Wu, H.; Qian, H.; Gao, Y. Groundwater Chemistry Regulated by Hydrochemical Processes and Geological Structures: A Case Study in Tongchuan, China. Water 2018, 10, 338. [Google Scholar] [CrossRef]
  52. Xue, D.; Botte, J.; De Baets, B.; Accoe, F.; Nestler, A.; Taylor, P.; Van Cleemput, O.; Berglund, M.; Boeckx, P. Present limitations and future prospects of stable isotope methods for nitrate source identification in surface- and groundwater. Water Res. 2009, 43, 1159–1170. [Google Scholar] [CrossRef] [PubMed]
  53. Chen, R.; Hu, Q.; Shen, W.; Guo, J.; Yang, L.; Yuan, Q.; Lu, X.; Wang, L. Identification of nitrate sources of groundwater and rivers in complex urban environments based on isotopic and hydrochemical evidence. Sci. Total Environ. 2023, 871, 162026. [Google Scholar] [CrossRef] [PubMed]
  54. Gao, H.; Wang, G.; Fan, Y.; Wu, J.; Yao, M.; Zhu, X.; Guo, X.; Long, B.; Zhao, J. Tracing groundwater nitrate sources in an intensive agricultural region integrated of a self-organizing map and end-member mixing model tool. Sci. Rep. 2024, 14, 16873. [Google Scholar] [PubMed]
  55. Sappa, G.; Ferranti, F.; De Filippi, F.M.; Cardillo, G. Mg2+-Based Method for the Pertuso Spring Discharge Evaluation. Water 2017, 9, 67. [Google Scholar] [CrossRef]
  56. Cao, L.; Cheng, Q.; Wang, S.; Xu, S.; He, Q.; Li, Y.; Peng, T.; Wang, S. Hydrological and Geochemical Responses to Agricultural Activities in a Karst Catchment: Insights from Spatiotemporal Dynamics and Source Apportionment. Water 2025, 17, 3264. [Google Scholar] [CrossRef]
  57. Ren, K.; Pan, X.; Peng, C.; Chen, J.; Li, J.; Zeng, J. Tracking contaminants in groundwater flowing across a river bottom within a complex karst system: Clues from hydrochemistry, stable isotopes, and tracer tests. J. Environ. Manag. 2023, 342, 118099. [Google Scholar] [CrossRef]
  58. Wang, Z.-J.; Li, S.-L.; Yue, F.-J.; Qin, C.-Q.; Buckerfield, S.; Zeng, J. Rainfall driven nitrate transport in agricultural karst surface river system: Insight from high resolution hydrochemistry and nitrate isotopes. Agric. Ecosyst. Environ. 2020, 291, 106787. [Google Scholar] [CrossRef]
  59. Yue, F.-J.; Li, S.-L.; Waldron, S.; Wang, Z.-J.; Oliver, D.M.; Chen, X.; Liu, C.-Q. Rainfall and conduit drainage combine to accelerate nitrate loss from a karst agroecosystem: Insights from stable isotope tracing and high-frequency nitrate sensing. Water Res. 2020, 186, 116388. [Google Scholar] [CrossRef] [PubMed]
  60. Qi, J.; Xu, M.; Cen, X.; Wang, L.; Zhang, Q. Characterization of Karst Conduit Network Using Long-Distance Tracer Test in Lijiang, Southwestern China. Water 2018, 10, 949. [Google Scholar] [CrossRef]
  61. Geng, X.; Zhang, C.; Zhang, F.E.; Chen, Z.; Nie, Z.; Liu, M. Hydrological Modeling of Karst Watershed Containing Subterranean River Using a Modified SWAT Model: A Case Study of the Daotian River Basin, Southwest China. Water 2021, 13, 3552. [Google Scholar] [CrossRef]
  62. Baker, T.W.; Groves, C.G. Water Quality Impacts from Agricultural Land Use in Karst Drainage Basins of SW Kentucky and SW China. In Planning for an Uncertain Future-Monitoring, Integration, and Adaptation; Fort Collins Science Center: Fort Collins, CO, USA, 2008; pp. 103–114. [Google Scholar]
  63. Ji, H.; Luo, M.; Yin, M.; Li, C.; Wan, L.; Huang, K. Storage and release of conservative solute between karst conduit and fissures using a laboratory analog. J. Hydrol. 2022, 612, 128228. [Google Scholar] [CrossRef]
  64. Mao, H.; Wang, C.; Qu, S.; Liao, F.; Wang, G.; Shi, Z. Source and evolution of sulfate in the multi-layer groundwater system in an abandoned mine—Insight from stable isotopes and Bayesian isotope mixing model. Sci. Total Environ. 2023, 859, 160368. [Google Scholar] [PubMed]
  65. Yuan, R.; Li, Z.; Guo, S. Hydrochemical evolution of groundwater in a river corridor: The compounded impacts of various environmental factors. Discov. Water 2024, 4, 32. [Google Scholar] [CrossRef]
  66. Alassane Zakari, A.; Kpegli Ka, R.; Gnazou, D.-T.M.; Alassane, A.; Chabi, B.G.; Lawson, F.M.A.; Yalo, N.; Mama, D.; Boukari, M. Groundwater hydrochemistry and identification of nitrate pollution sources in the Ouémé Delta (Southern-Benin) using dual isotopes (15N–NO3 and 18O–NO3) and a Bayesian isotope mixing model. Case Stud. Chem. Environ. Eng. 2026, 13, 101303. [Google Scholar]
  67. Udeshani, C.; Yue, F.-J.; Gong, Y.-Q.; Li, S.-L.; Chandrajith, R. Sources and dynamics of nitrate in groundwater in a crystalline terrain of tropical Sri Lanka based on a dual isotope approach. Water Res. 2025, 282, 123914. [Google Scholar] [CrossRef] [PubMed]
  68. Aleku, D.L.; Dähnke, K.; Pichler, T. Source, transport, and fate of nitrate in shallow groundwater in the eastern Niger Delta. Environ. Sci. Pollut. Res. Int. 2024, 31, 65034–65050. [Google Scholar] [CrossRef] [PubMed]
  69. Zhang, J.; Zhang, L.; Zheng, T.; Jin, M.; Kang, F.; Jiang, J.; Yuan, Z.; Luo, J. Tracing Nitrate Contamination Sources and Transformations in a Rural−Urban Karst Groundwater System in North China Using Multiple Isotopes and Simmr Modeling. Water Resour. Res. 2025, 61, e2025WR040156. [Google Scholar] [CrossRef]
  70. Li, X.; Yang, X.; Zhang, W.; Yang, H.; Huang, X.; Hu, C. Origin and Transformation of Nitrate in Karst Cave Groundwater in the Middle Reaches of the Qingjiang River. J. Earth Sci. 2026, 37, 241–250. [Google Scholar] [CrossRef]
  71. Tong, H.; Gao, R.; Yue, C.; Xie, L.; Duan, L.; Zhu, Y.; Wang, G. Hydrochemical evolution and nitrate sources, migration, and transformation in surface water and groundwater of a typical tributary of the Yellow River. J. Environ. Manag. 2025, 390, 126218. [Google Scholar] [CrossRef]
  72. Wang, J.; Hao, X.; Liu, X.; Ouyang, W.; Li, T.; Cui, X.; Pei, J.; Zhang, S.; Zhu, W.; Jin, R. Groundwater–surface water exchange affects nitrate fate in a seasonal freeze–thaw watershed: Sources, migration and removal. J. Hydrol. 2025, 654, 132803. [Google Scholar]
  73. Li, J.; Zhu, D.; Zhang, S.; Yang, G.; Zhao, Y.; Zhou, C.; Lin, Y.; Zou, S. Application of the hydrochemistry, stable isotopes and MixSIAR model to identify nitrate sources and transformations in surface water and groundwater of an intensive agricultural karst wetland in Guilin, China. Ecotoxicol. Environ. Saf. 2022, 231, 113205. [Google Scholar] [CrossRef] [PubMed]
  74. Calabrese, A.; Campanale, M. Agricultural Nitrate Leaching into Groundwater Case of Study in Apulia Region. Ecol. Eng. Env. Technol. 2024, 25, 387–394. [Google Scholar] [CrossRef]
  75. Liu, X.; Beusen, A.H.; van Grinsven, H.J.; Wang, J.; van Hoek, W.J.; Ran, X.; Mogollón, J.M.; Bouwman, A.F. Impact of groundwater nitrogen legacy on water quality. Nat. Sustain. 2024, 7, 891–900. [Google Scholar] [CrossRef]
  76. Zhao, X.; Xu, H.; Kang, L.; Zhu, G.; Paerl, H.W.; Li, H.; Liu, M.; Zhu, M.; Zou, W.; Qin, B.; et al. Nitrate sources and transformations in a river-reservoir system: Response to extreme flooding and various land use. J. Hydrol. 2024, 638, 131491. [Google Scholar] [CrossRef]
  77. Otero, N.; Canals, À.; Soler Gil, A. Using dual-isotope data to trace the origin and processes of dissolved sulphate: A case study in Calders stream (Llobregat basin, Spain). Aquat. Geochem. 2007, 13, 109–126. [Google Scholar] [CrossRef]
  78. Hao, Y.; Pang, Z.; Gong, Q.; Li, N.; Liao, D.; Luo, Z. Oxygen and Sulfur Isotope Systematics of Dissolved Sulfate in a Nonvolcanic Geothermal System: Sulfate Source, Evolution and Impact on Geothermometers. Water 2025, 17, 788. [Google Scholar] [CrossRef]
  79. Natali, S.; Franceschi, L.; Giannecchini, R.; D’Orazio, M.; Delgado-Huertas, A.; Zanchetta, G.; Doveri, M. Tracing contamination in mining areas through sulfur and oxygen isotopes in groundwater sulfates: A case study from the Apuan Alps (Italy). Environ. Geochem. Health 2025, 47, 249. [Google Scholar] [CrossRef] [PubMed]
  80. Wang, L.; Li, Y.; Zhang, Y.; Liu, W.; Zhang, H. Tracing Sulfate Sources of Surface Water and Groundwater in Liuyang River Basin Based on Hydrochemistry and Environmental Isotopes. Water 2025, 17, 2105. [Google Scholar] [CrossRef]
  81. Wang, J.; Zhou, Z.; Dong, H.; Ding, S.; Wang, X.; Zhang, Y.; Huang, Y. Tracking sources and transformations of dissolved sulfate in karstic sub-basins in Southwest China using dual isotopes and water chemistry. Sci. Rep. 2025, 15, 38081. [Google Scholar] [CrossRef] [PubMed]
  82. Lin, Y.; Wang, Y.; Wu, Y.; Xu, B. Analyzing the Source of Sulfate in Karst Groundwater Based on a Bayesian Stable Isotope Mixing Model: A Case Study of Xujiagou Spring Area, Northern China. Water 2025, 17, 794. [Google Scholar] [CrossRef]
  83. Liu, J.; Han, G.; Wang, D. CO2 Release Driven by the Combination of Sulfide Oxidation and Carbonate Dissolution in the Upper Changjiang River: Effect of Erosion and Lithology on Chemical Weathering. J. Geophys. Res. Biogeosci. 2023, 128, e2022JG007201. [Google Scholar] [CrossRef]
  84. Ye, H.; Tang, C.; Cao, Y. Sources and transformation mechanisms of inorganic nitrogen: Evidence from multi-isotopes in a rural-urban river area. Sci. Total Environ. 2021, 794, 148615. [Google Scholar] [PubMed]
  85. Huang, X.; Jin, M.; Ma, B.; Liang, X.; Cao, M.; Zhang, J.; Zhang, Z.; Su, J. Identifying nitrate sources and transformation in groundwater in a large sub-tropical basin under a framework of groundwater flow systems. J. Hydrol. 2022, 610, 127943. [Google Scholar]
  86. Kačaroğlu, F. Review of Groundwater Pollution and Protection in Karst Areas. Water Air Soil Pollut. 1999, 113, 337–356. [Google Scholar] [CrossRef]
  87. Çallı, K.Ö.; Chiogna, G.; Bittner, D.; Sivelle, V.; Labat, D.; Richieri, B.; Çallı, S.S.; Hartmann, A. Karst Water Resources in a Changing World: Review of Solute Transport Modeling Approaches. Rev. Geophys. 2025, 63, e2023RG000811. [Google Scholar] [CrossRef]
  88. Xiong, Y.; Liu, J.; Yuan, W.; Liu, W.; Ma, S.; Wang, Z.; Li, T.; Wang, Y.; Wu, J. Groundwater Contamination Risk Assessment Based on Groundwater Vulnerability and Pollution Loading: A Case Study of Typical Karst Areas in China. Water 2022, 14, 9898. [Google Scholar] [CrossRef]
  89. De Giglio, O.; Triggiano, F.; Apollonio, F.; Pousis, C.; Calia, C.; Diella, G.; Bagordo, F.; Murgolo, S.; Grassi, T.; De Ceglie, C.; et al. The Geological Characteristics of the Vadose Zone Influence the Impact of Treated Wastewater on the Groundwater Quality (SCA.Re.S. Project 2019–2020). Pathogens 2022, 11, 677. [Google Scholar] [PubMed]
  90. Tian, B.; Lu, C.; Zhao, D.; Li, J.; Zhu, H.; Dong, F. Hydrochemical Evolution of Karst Groundwater and Mining-Induced Activation Effects in a Coal Mining Area: A Case Study from the Tengxian Coalfield, China. ACS Omega 2025, 10, 42548–42560. [Google Scholar] [CrossRef] [PubMed]
  91. Feng, Y.; Kang, F.; Guo, Y.; Li, Z.; Liu, B.; Bu, H.; Xia, C.; He, Q. Evolution of hydrochemistry and water quality of karst groundwater under the effects of intense anthropogenic activities. J. Environ. Manag. 2024, 371, 123059. [Google Scholar] [CrossRef]
  92. Qiao, X.; Chai, X.; Cheng, Y.; Wang, D.; Yu, W.; Tang, C. The potential sources of sulfate and its effect on carbonates weathering in karst spring area, North China. J. Hydrol. 2026, 672, 135304. [Google Scholar] [CrossRef]
  93. Kong, J.; Zhou, Z.; Xie, R.; Chen, Z.; Li, R.; Li, L.; Cao, W. Anthropogenic exogenous nitric and sulfuric acids in karst plateau reservoirs and their impact on carbon sinks. J. Hydrol. 2025, 660, 133394. [Google Scholar] [CrossRef]
  94. Lukač Reberski, J.; Terzić, J.; Maurice, L.D.; Lapworth, D.J. Emerging organic contaminants in karst groundwater: A global level assessment. J. Hydrol. 2022, 604, 127242. [Google Scholar]
  95. An, R.; Li, B.; Li, J.; Li, S.; Zhu, Q.; Liu, X.; Guo, H.; Li, W.; Liu, K. Quantifying the vulnerability of karst groundwater to emerging organic compounds in southwest China. Environ. Pollut. 2026, 388, 127374. [Google Scholar] [PubMed]
Figure 1. Study area and hydrogeological setting: (a) location of the study area, elevation, distribution of groundwater and surface-water sampling sites, and underground river pipeline; (b) topographic–geological cross-section of the study area.
Agronomy 16 01281 g001
Figure 2. Lithological profile map of the study area.
Agronomy 16 01281 g002
Figure 3. Framework of the research methodology.
Agronomy 16 01281 g003
Figure 4. Comparison of hydrochemical characteristics between groundwater and surface water: (a) density distribution of major ion concentrations in groundwater; (b) density distribution of major ion concentrations in surface water; (c) boxplots of pH and TDS for groundwater and surface water; (d) Piper diagram illustrating the hydrochemical facies of groundwater and surface water.
Agronomy 16 01281 g004
Figure 5. Self-organizing map (SOM) results for groundwater and surface water: (a) groundwater; (b) surface water. The left panels show the SOM clustering patterns and sample distribution, and the right panels present the component planes of pH, major ions (Na+ + K+, Ca2+, Mg2+, HCO3, NO3, SO42−, and Cl), and TDS based on normalized feature weights.
Agronomy 16 01281 g005
Figure 6. Spatial distribution of nitrate-N and sulfate concentrations in groundwater and surface water: (a) groundwater nitrate-N concentration; (b) surface-water nitrate-N concentration; (c) groundwater sulfate concentration; and (d) surface-water sulfate concentration.
Agronomy 16 01281 g006
Figure 7. Nitrate and sulfate source identification and apportionment in different water groups: (a) δ15N–NO3 versus δ18O–NO3; (b) NO3/Cl molar ratio versus Cl molar concentration; (c) nitrate source contributions estimated by MixSIAR. WGW, west groundwater; EGW, east groundwater. WSW, west surface water; ESW, east surface water; (d) δ34S–SO42− versus δ18O–SO42−; (e) δ34S–SO42− versus SO42−/Cl equivalent ratio; and (f) sulfate source contributions estimated by MixSIAR.
Agronomy 16 01281 g007
Figure 8. (a) Contribution of each factor to different hydrochemical components in groundwater and their combined effects; (b) Mantel analysis of groundwater factors and hydrochemical indicators; (c) Contribution of each factor to different hydrochemical components in surface water and their combined effects; (d) Mantel analysis of surface-water factors and hydrochemical indicators.
Agronomy 16 01281 g008
Figure 9. Isotopic relationships of nitrate and sulfate in different water groups: (a) δ18O–NO3 versus δ18O–H2O; (b) NO3–N concentration versus δ18N–NO3; (c) δ18O–SO42− versus δ18O–H2O with the experimental field of sulfide oxidation; and (d) δ18O–SO42− versus δ18O–H2O showing the contribution of H2O-derived oxygen.
Agronomy 16 01281 g009
Figure 10. Framework for nitrate and sulfate source identification and apportionment.
Agronomy 16 01281 g010
Figure 11. Conceptual model of nitrate and sulfate sources, migration, and transformation in the surface water–groundwater interaction system of the karst area.
Agronomy 16 01281 g011
Disclaimer/Publisher’s Note: The statements, opinions and data contained in all publications are solely those of the individual author(s) and contributor(s) and not of MDPI and/or the editor(s). MDPI and/or the editor(s) disclaim responsibility for any injury to people or property resulting from any ideas, methods, instructions or products referred to in the content.