Article

Development of Multi-Unit Orchard Centrifugal Spray System and Deposition Evaluation on Pear Trees


1
College of Advanced Agricultural Sciences, Zhejiang Wanli University, Ningbo 315101, China
2
College of Science, China Agricultural University, Beijing 100193, China
3
Weifang Engineering Vocational College, Weifang 262500, China
4
Centre for Agricultural Robotics Innovation, Shandong Academy of Agricultural Machinery Sciences, Jinan 250100, China
*
Author to whom correspondence should be addressed.
Agronomy 2026, 16(13), 1251; https://doi.org/10.3390/agronomy16131251
Submission received: 1 June 2026 / Revised: 24 June 2026 / Accepted: 26 June 2026 / Published: 28 June 2026

Abstract

An air-assisted sprayer is a primary tool for pest and disease control in orchards. However, conventional systems often suffer from insufficient deposition at the canopy top and poor coverage on the abaxial leaf surfaces, which are highly susceptible to pests and diseases. To address this limitation, a centrifugal air-assisted spraying system was developed to generate finer droplets and improve deposition distribution within tree canopies, particularly on the abaxial surfaces. Vertical deposition tests were conducted to characterize the droplet distribution pattern of the system. Single-unit spray tests were then performed under Foliage Area Volume Density (FAVD, the foliage area per unit canopy volume) of 3.3 and 1.4 m2·m−3, and three outlet air velocities (4, 8, and 11 m·s−1) to evaluate the effects of these variables on coverage and droplet density. Comparative experiments between the centrifugal and a conventional hydraulic system were also carried out at the same flow rate (3.6 L·min−1), as well as at a 30% reduced application rate for the centrifugal system. The results showed that the droplet distribution pattern followed a normal distribution and correlated well with the spindle-shaped pear tree canopy. At both FAVD levels, an air velocity of 8 m·s−1 produced superior leaf coverage compared with 4 and 11 m·s−1. At the same flow rate, the centrifugal system achieved significantly higher coverage on the abaxial surfaces of outer canopy leaves than the hydraulic system. Remarkably, even with a 30% reduction in application volume, the centrifugal system maintained coverage and droplet density comparable to those of the hydraulic system at its full rate. We conclude that the centrifugal air-assisted orchard spraying system effectively improves pesticide deposition distribution within pear tree canopies, with particular advantages in depositing droplets on the abaxial leaf surfaces. Future work will include a systematic assessment of spray drift potential to further evaluate its field applicability and environmental compatibility.

1. Introduction

In orchard pest and disease control, air-assisted sprayers are the most commonly used pesticide application equipment. By utilizing strong airflow to deliver droplets to the tree canopy, the pesticide deposition efficiency is significantly improved [1,2,3]. Conventional orchard air-assisted sprayers are typically equipped with axial fans, where airflow is distributed and directed to different positions through diversion devices. Research by Grella et al. demonstrated that adjusting the angle of the deflectors according to canopy characteristics can enhance spraying performance [4]. However, such adjustments are limited, particularly for tall-canopy trees, where the pesticide deposition can be insufficient [5]. Qiu et al. [6] developed a crawler-type multi-channel air-assisted sprayer, which improved deposition uniformity by 19.4% compared to conventional sprayers. When applied in walnut orchards, the multi-channel sprayer achieved a coverage of 69.9% in the upper canopy [7]. In field application, improved coverage corresponds to less non-target impact for droplets not deposited on the leaf surface, which is more environmentally friendly. Nevertheless, all ducts are supplied by a single centrifugal fan in multi-duct air-assisted sprayers. When the airflow velocity in one channel is adjusted, the velocities in the other channels are also affected. Therefore, multi-unit orchard air-assisted sprayers can be considered where precise control of application parameters is needed. They can offer advantages in both deposition [8] and drift reduction [9].
The amount of deposition on the abaxial leaf surface is often overlooked in pesticide deposition evaluations although various types of orchard sprayers are available on the market. The abaxial leaf surface contains numerous stomata, which serve as the primary entry points for many phyllosphere microorganisms to initiate infection [10,11,12,13]. Concurrently, many pests such as whiteflies, aphids, and spider mites prefer to inhabit concealed areas [14,15,16], making it a high-incidence zone for both diseases and pests. Numerous studies have focused on developing different technologies to enhance pesticide deposition on the abaxial leaf surface. Electrostatic spraying is one of the most commonly used techniques. It enables sprayed droplets to carry an electric charge, thereby improving their adhesion to the abaxial leaf surface. Gan-Mor et al. [17] applied electrostatic nozzles in vineyards, and a 200% increase in spray deposition on the abaxial leaf surface was achieved. Nanotechnology has also provided new strategies for modulating pesticide deposition at the microscopic level. Zhang et al. [18] developed a novel co-condensate carrier using bile salts and cationic surfactants. This formulation adheres strongly to superhydrophobic surfaces, thereby significantly enhancing deposition on the abaxial leaf surface. However, limitations of these methods have been identified. Electrostatic spraying technology suffers from poor stability and presents certain safety risks [19]. The development cycle for engineered pesticide formulations is lengthy, and consequently, commercially viable products cannot be mass-produced in the short term.
The adjustment of spraying parameters represents another more straightforward and conventional approach. Adjustment strategies can be modified to achieve better deposition results depending on the application equipment and scenario. Dario et al. [20] demonstrated that varying the spray pressure and application rate of a manual sprayer can significantly alter deposition. Similarly, Xu et al. [21] reported that adjusting the airflow direction increased deposition on the abaxial leaf surfaces of strawberries by over 40%.
Droplet size is one of the most critical spraying parameters, significantly influencing both pesticide deposition and drift [22,23]. As droplet size decreases, droplet penetration through the canopy tends to improve, and the potential for deposition on the abaxial leaf surface may increase. By setting the droplet size to 100 μm in UAV applications on bananas, Yu et al. reported an increase in coverage on the abaxial leaf surface to 1.2% [24]. Therefore, smaller droplet sizes are effective in increasing deposition on the abaxial leaf surface but at the expense of off-target movement.
In spraying applications, droplet size is primarily determined by the type of nozzle used. Conventional hydraulic nozzles can produce droplets of different sizes depending on the orifice diameter, but the range is limited. Achieving a volume median diameter (DV50) below 100 µm is particularly challenging. When smaller orifice nozzles are used to generate finer droplets, the flow rate decreases accordingly, which may result in insufficient spray volume. Centrifugal nozzles are relatively new developments. They are currently used primarily in crop protection UAVs [25,26,27]. Unlike hydraulic nozzles, they can vary droplet size by adjusting the rotational speed of the atomizer, while maintaining a constant flow rate. In our previous work, the performance of a multiple centrifugal nozzle was evaluated [28]. At specific atomizer speeds, a DV50 of approximately 50 µm was achieved. Furthermore, field applications demonstrated that it provided higher deposition efficiency on both the adaxial and abaxial leaf surfaces.
Centrifugal nozzles have rarely been implemented in orchard air-assisted sprayers despite the advantages in atomization and pesticide deposition. Therefore, this study integrated centrifugal nozzles into an orchard air-assisted sprayer—sprayers use an orchard air-assisted spraying system (CASS). The system was designed to improve pesticide deposition in orchard applications. This system aims to improve pesticide deposition during orchard operations particularly on the abaxial leaf surface. The vertical deposition of the new system was tested, and for its deposition within the canopy (evaluated under field conditions) with comparisons made against a conventional orchard air-assisted sprayer.

2. Materials and Methods

2.1. Development and Testing of the CASS

2.1.1. Design of the CASS

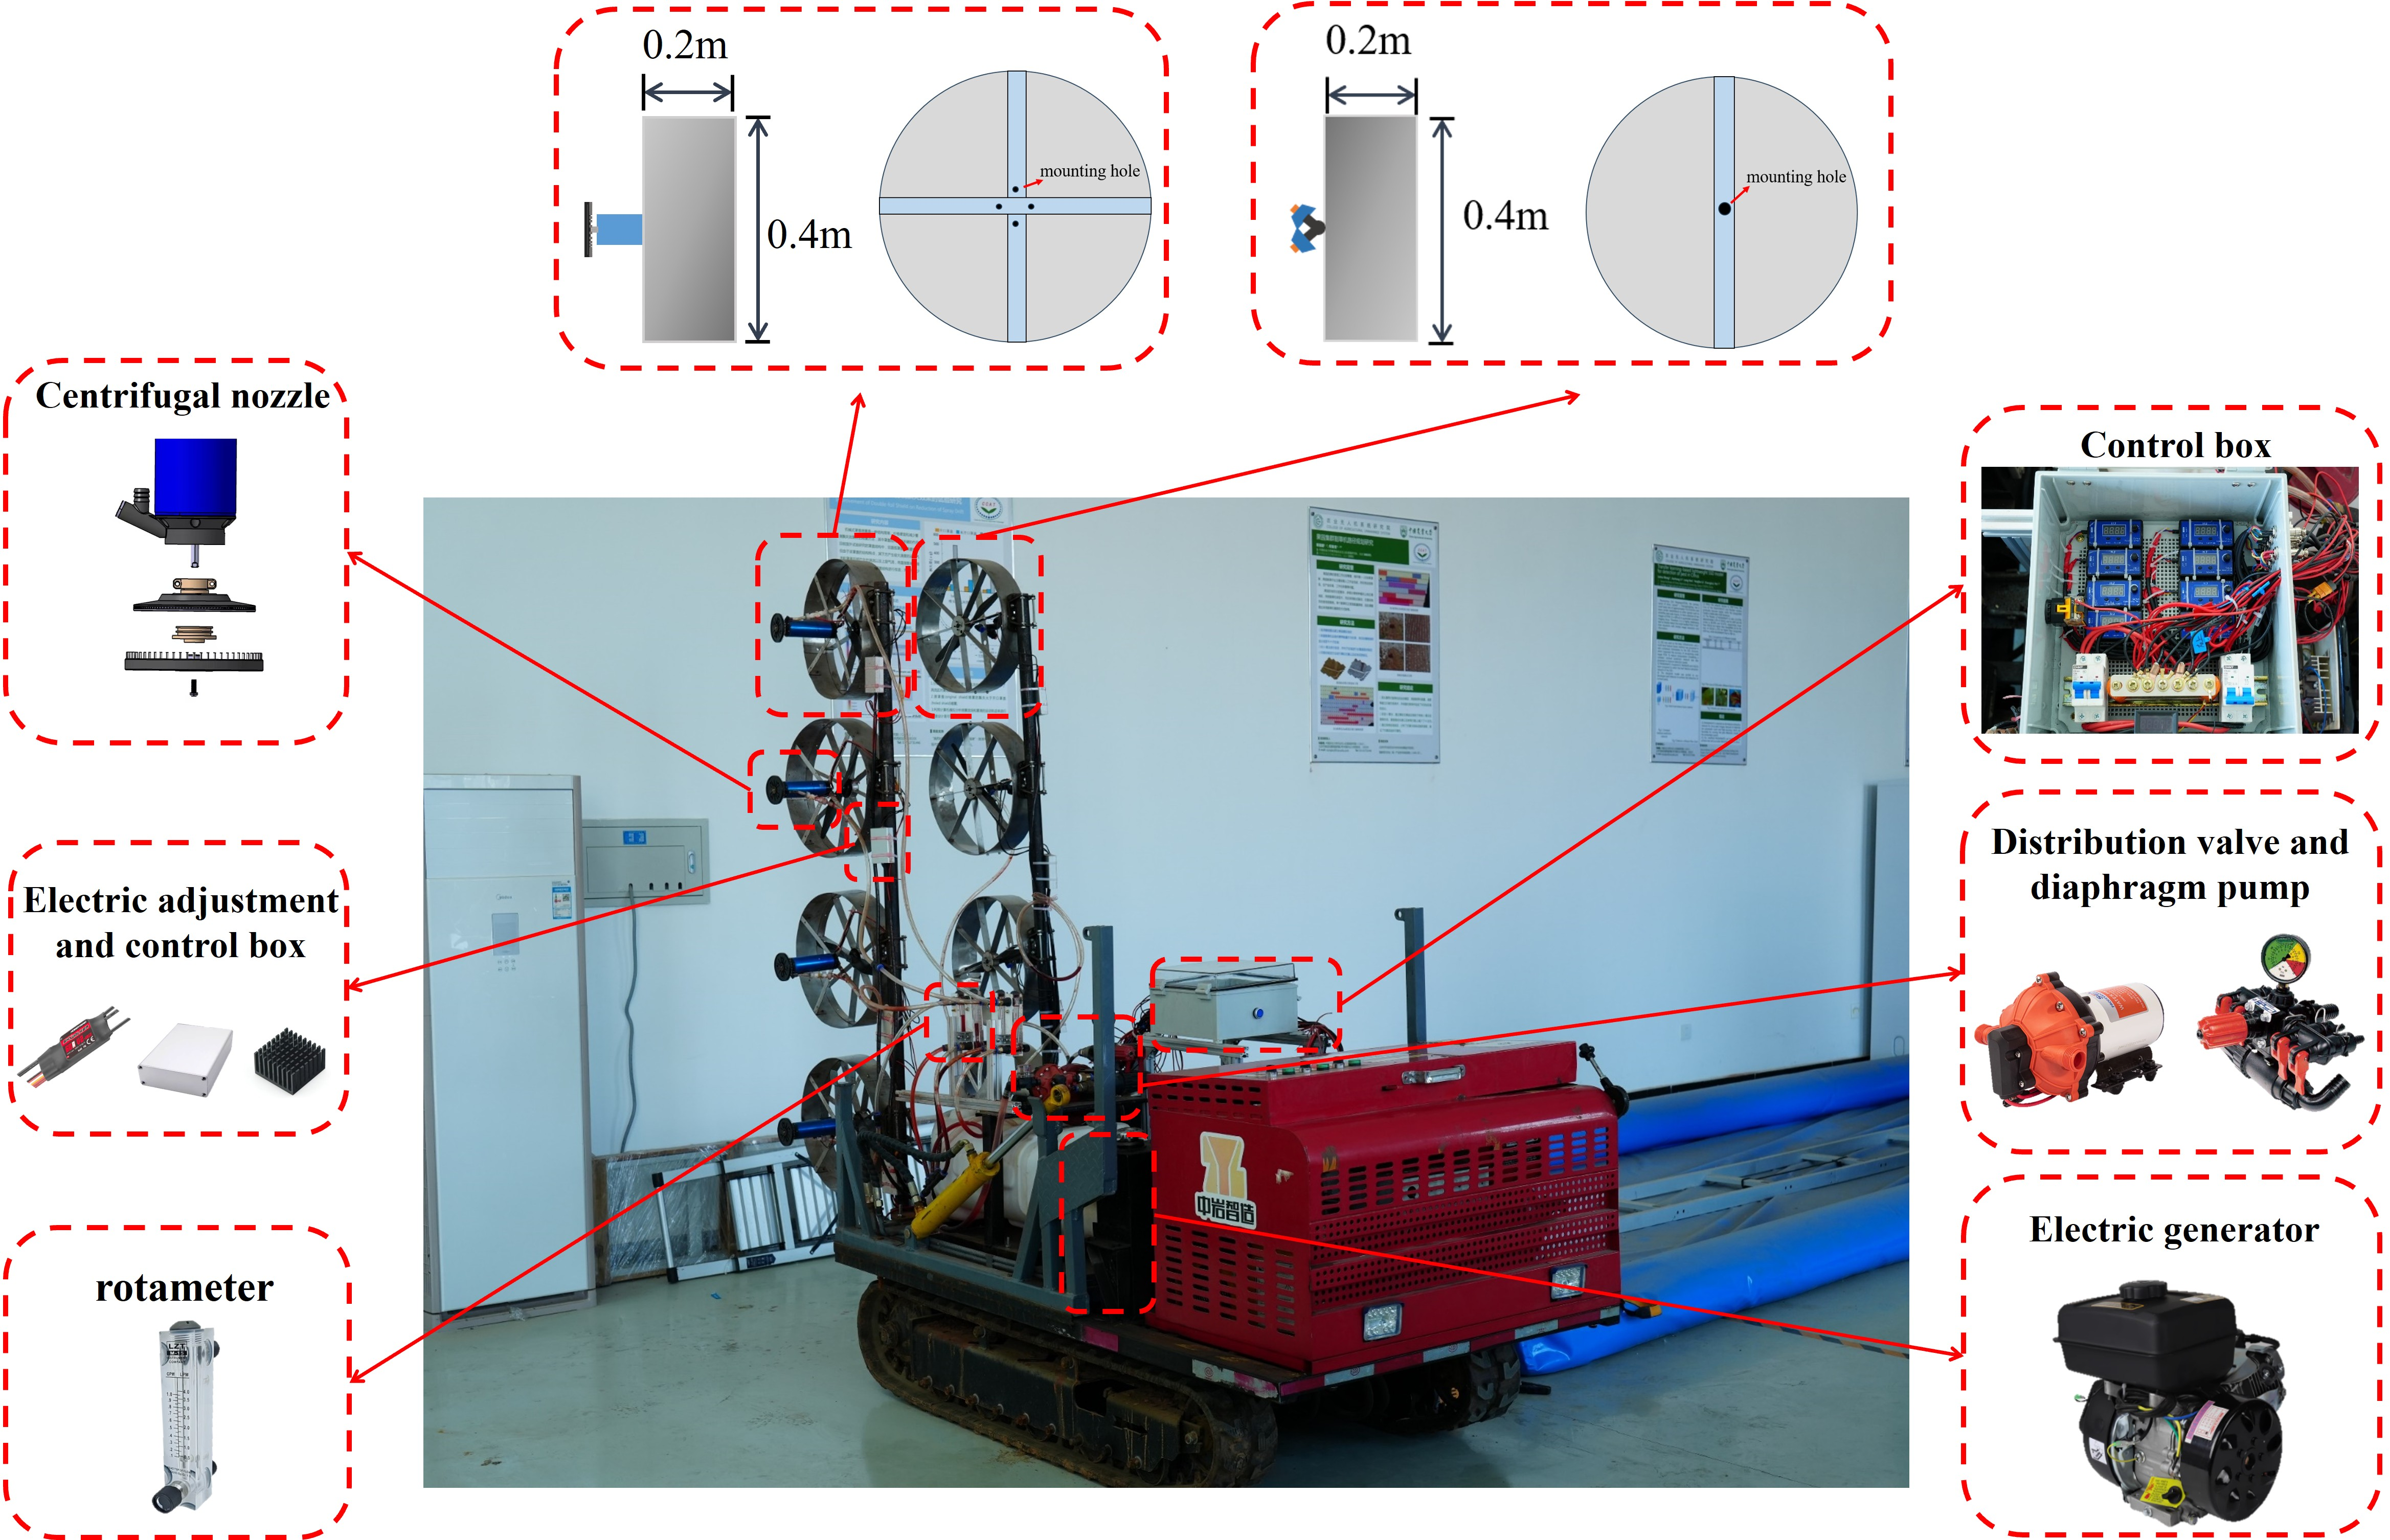
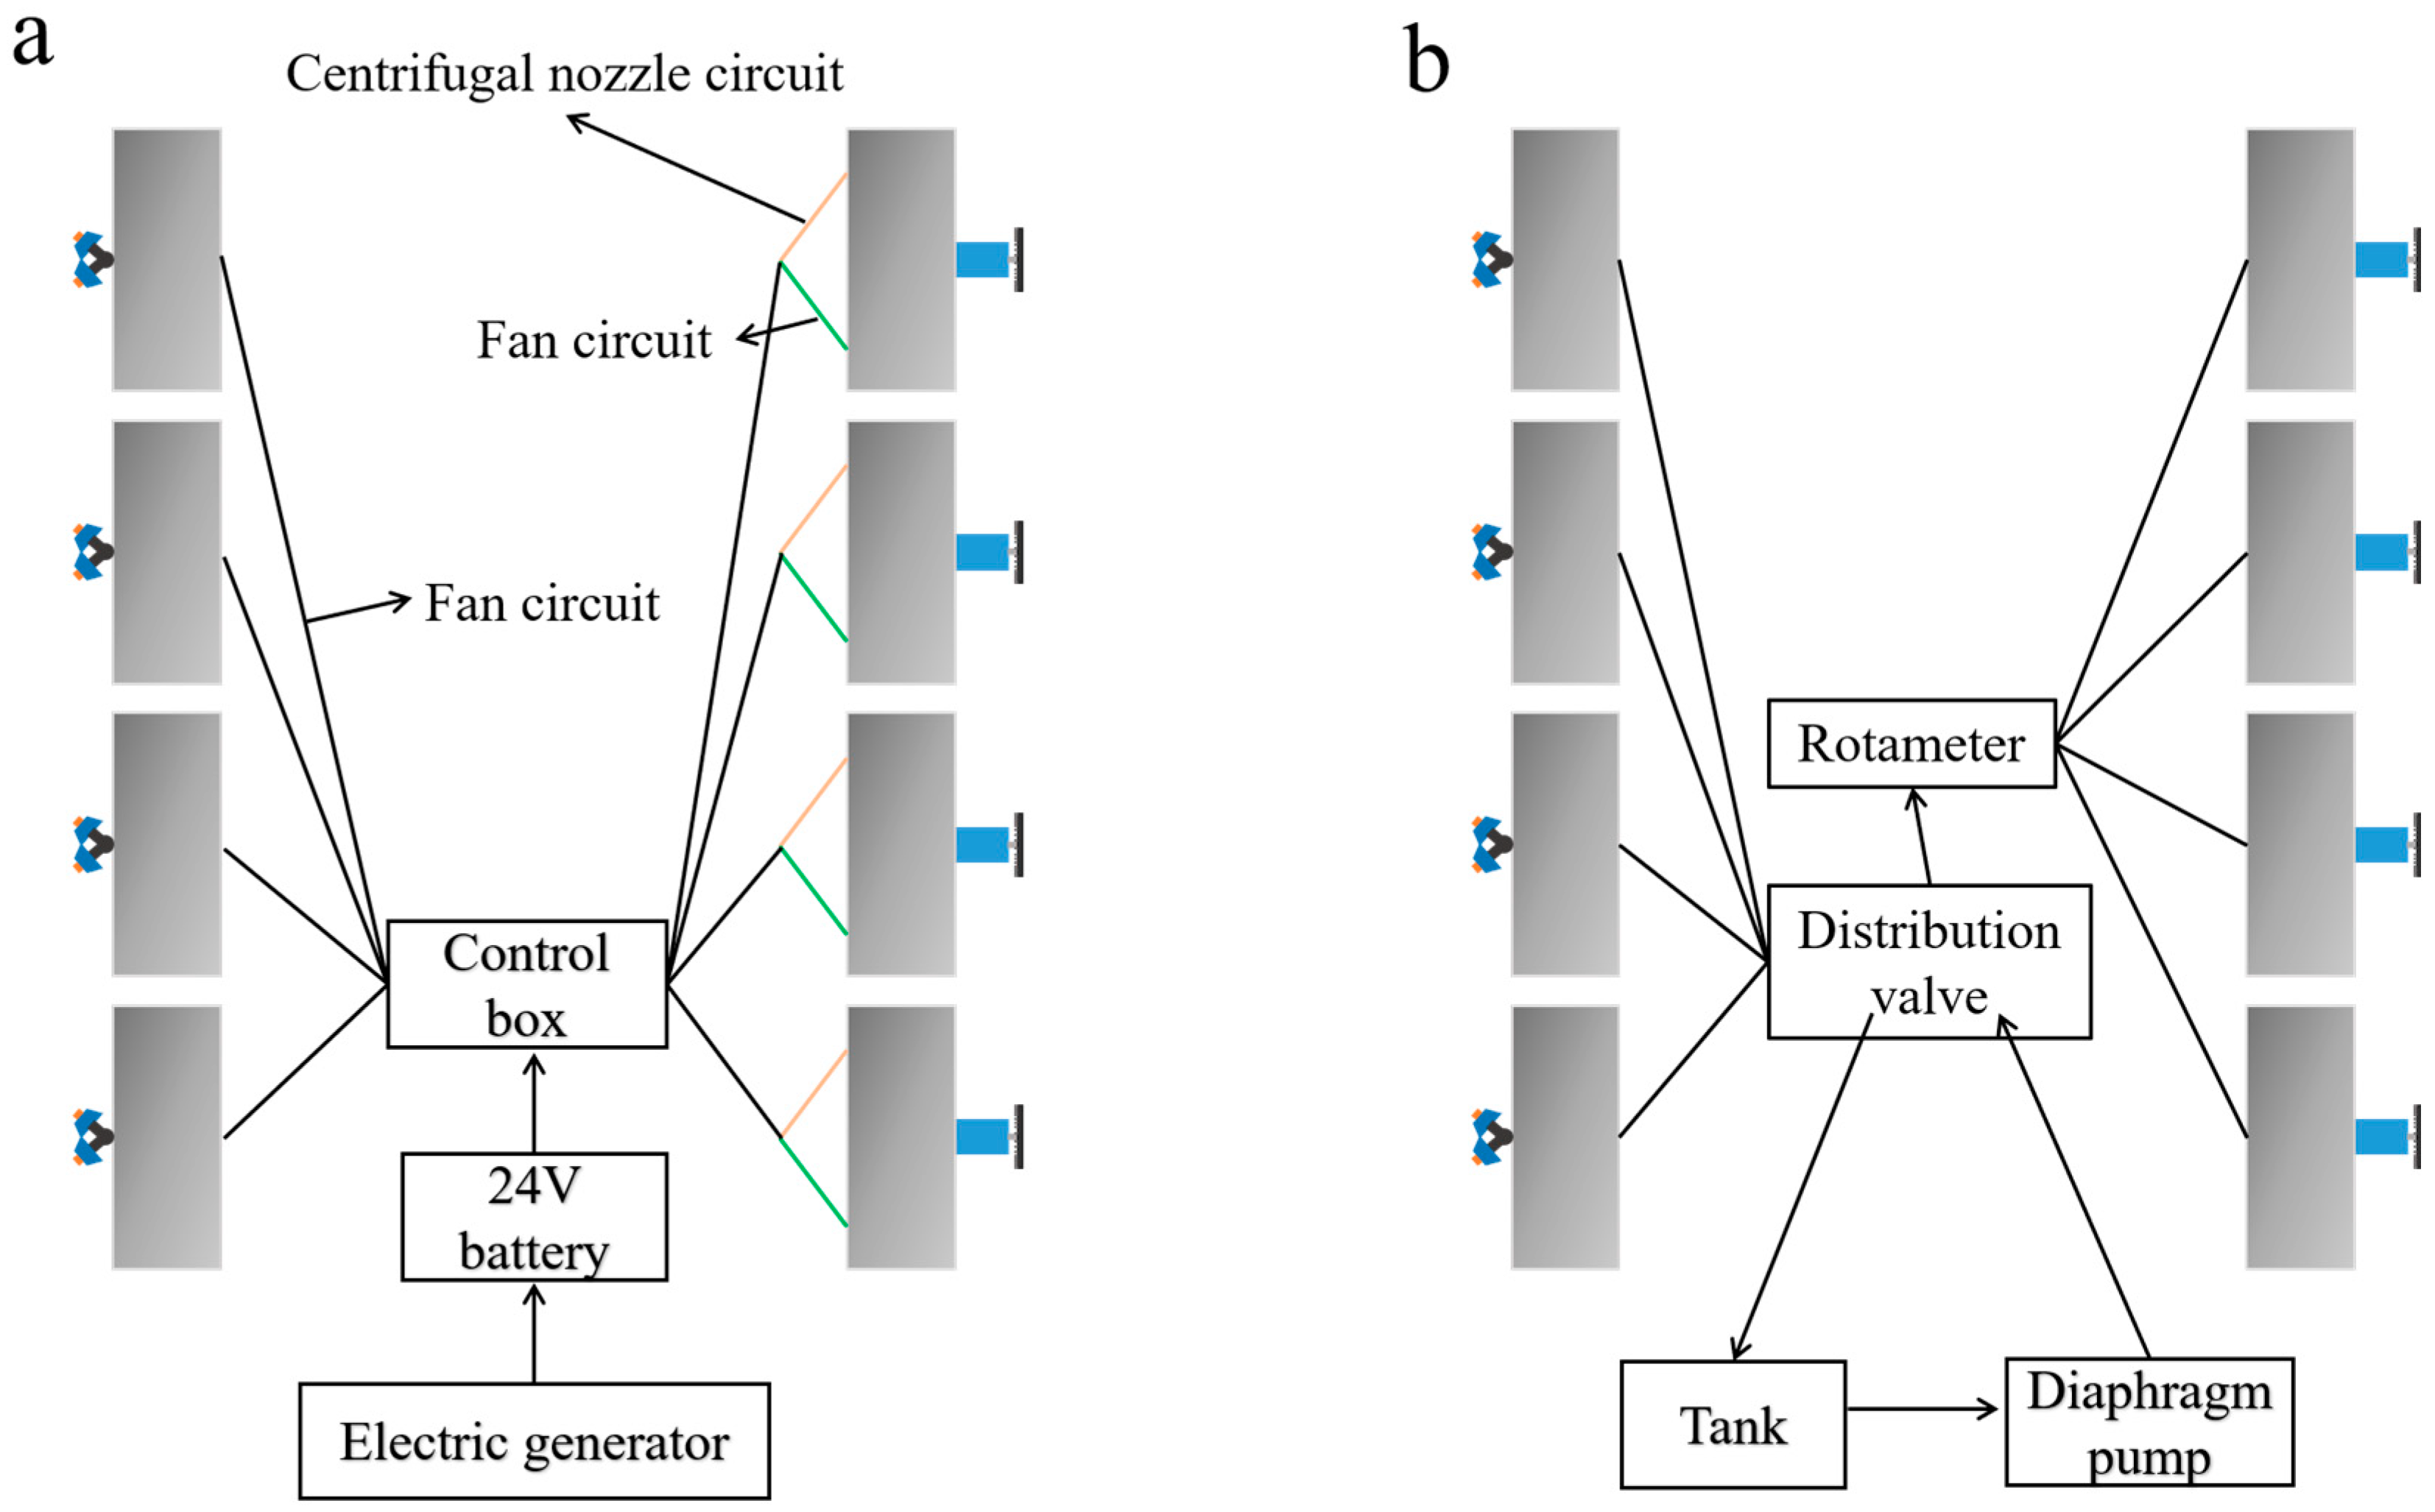
The CASS was developed by modifying a conventional multi-unit air-assisted orchard sprayer. The sprayer chassis is hydraulically driven by a diesel engine and can be remotely controlled. It is equipped with a 3000 W generator, with a central control box managing and distributing the power supply. The spraying system consists of a total of eight spray units, four on each side. The vertical distance between the centers of each spray unit on the same side is 0.45 m. The distance between the two vertical arms is 0.8 m. To facilitate a direct comparison with a conventional hydraulic system, only the four units on one side were modified by replacing the hydraulic nozzles with centrifugal nozzles. The modified sprayer is shown in Figure 1. The spray boom on the right side retains the conventional hydraulic system with TR80-01 nozzles, while the left side is equipped with the centrifugal spraying system. The airflow channel has a diameter of 0.4 m and a length of 0.2 m. For the centrifugal nozzle installation, two mutually perpendicular iron strips were fixed onto the airflow channel, each equipped with four screw holes to secure the nozzle. For the hydraulic nozzle installation, a single iron strip was fixed onto the airflow channel, with a circular hole drilled through it to accommodate the nozzle body. The centrifugal nozzle used in this study features dual atomization disks (inner and outer). Droplet size can be controlled by adjusting the rotational speed of the disks, a relationship characterized in our previous work [28]. In the present study, the rotational speed was programmatically controlled to achieve a target droplet size of 50 µm. During operation, the rated power of each centrifugal nozzle was 235 W. The fan in each spray unit is driven by a brushless motor, with its speed regulated by an electronic speed controller. A schematic of the electrical circuit distribution for the nozzles and fans is provided in Figure 2a. Liquid is supplied to the nozzles by a diaphragm pump, with flow rate controlled by a distribution valve. Since the flow rate of centrifugal nozzles cannot be characterized by water pressure alone, a rotameter was installed upstream of each centrifugal nozzle to monitor and regulate the individual flow rates (Figure 2b).

2.1.2. Vertical Deposition Distribution Test and Evaluation of the Sprayer

The vertical deposition distribution is a key indicator for assessing spray uniformity and effectiveness. By testing the vertical distribution of droplets, the spray coverage and deposition characteristics can be accurately determined, providing critical data for optimizing spray system design, improving application efficiency, and ensuring consistent spray performance. Therefore, the vertical deposition distribution of the developed system was evaluated.
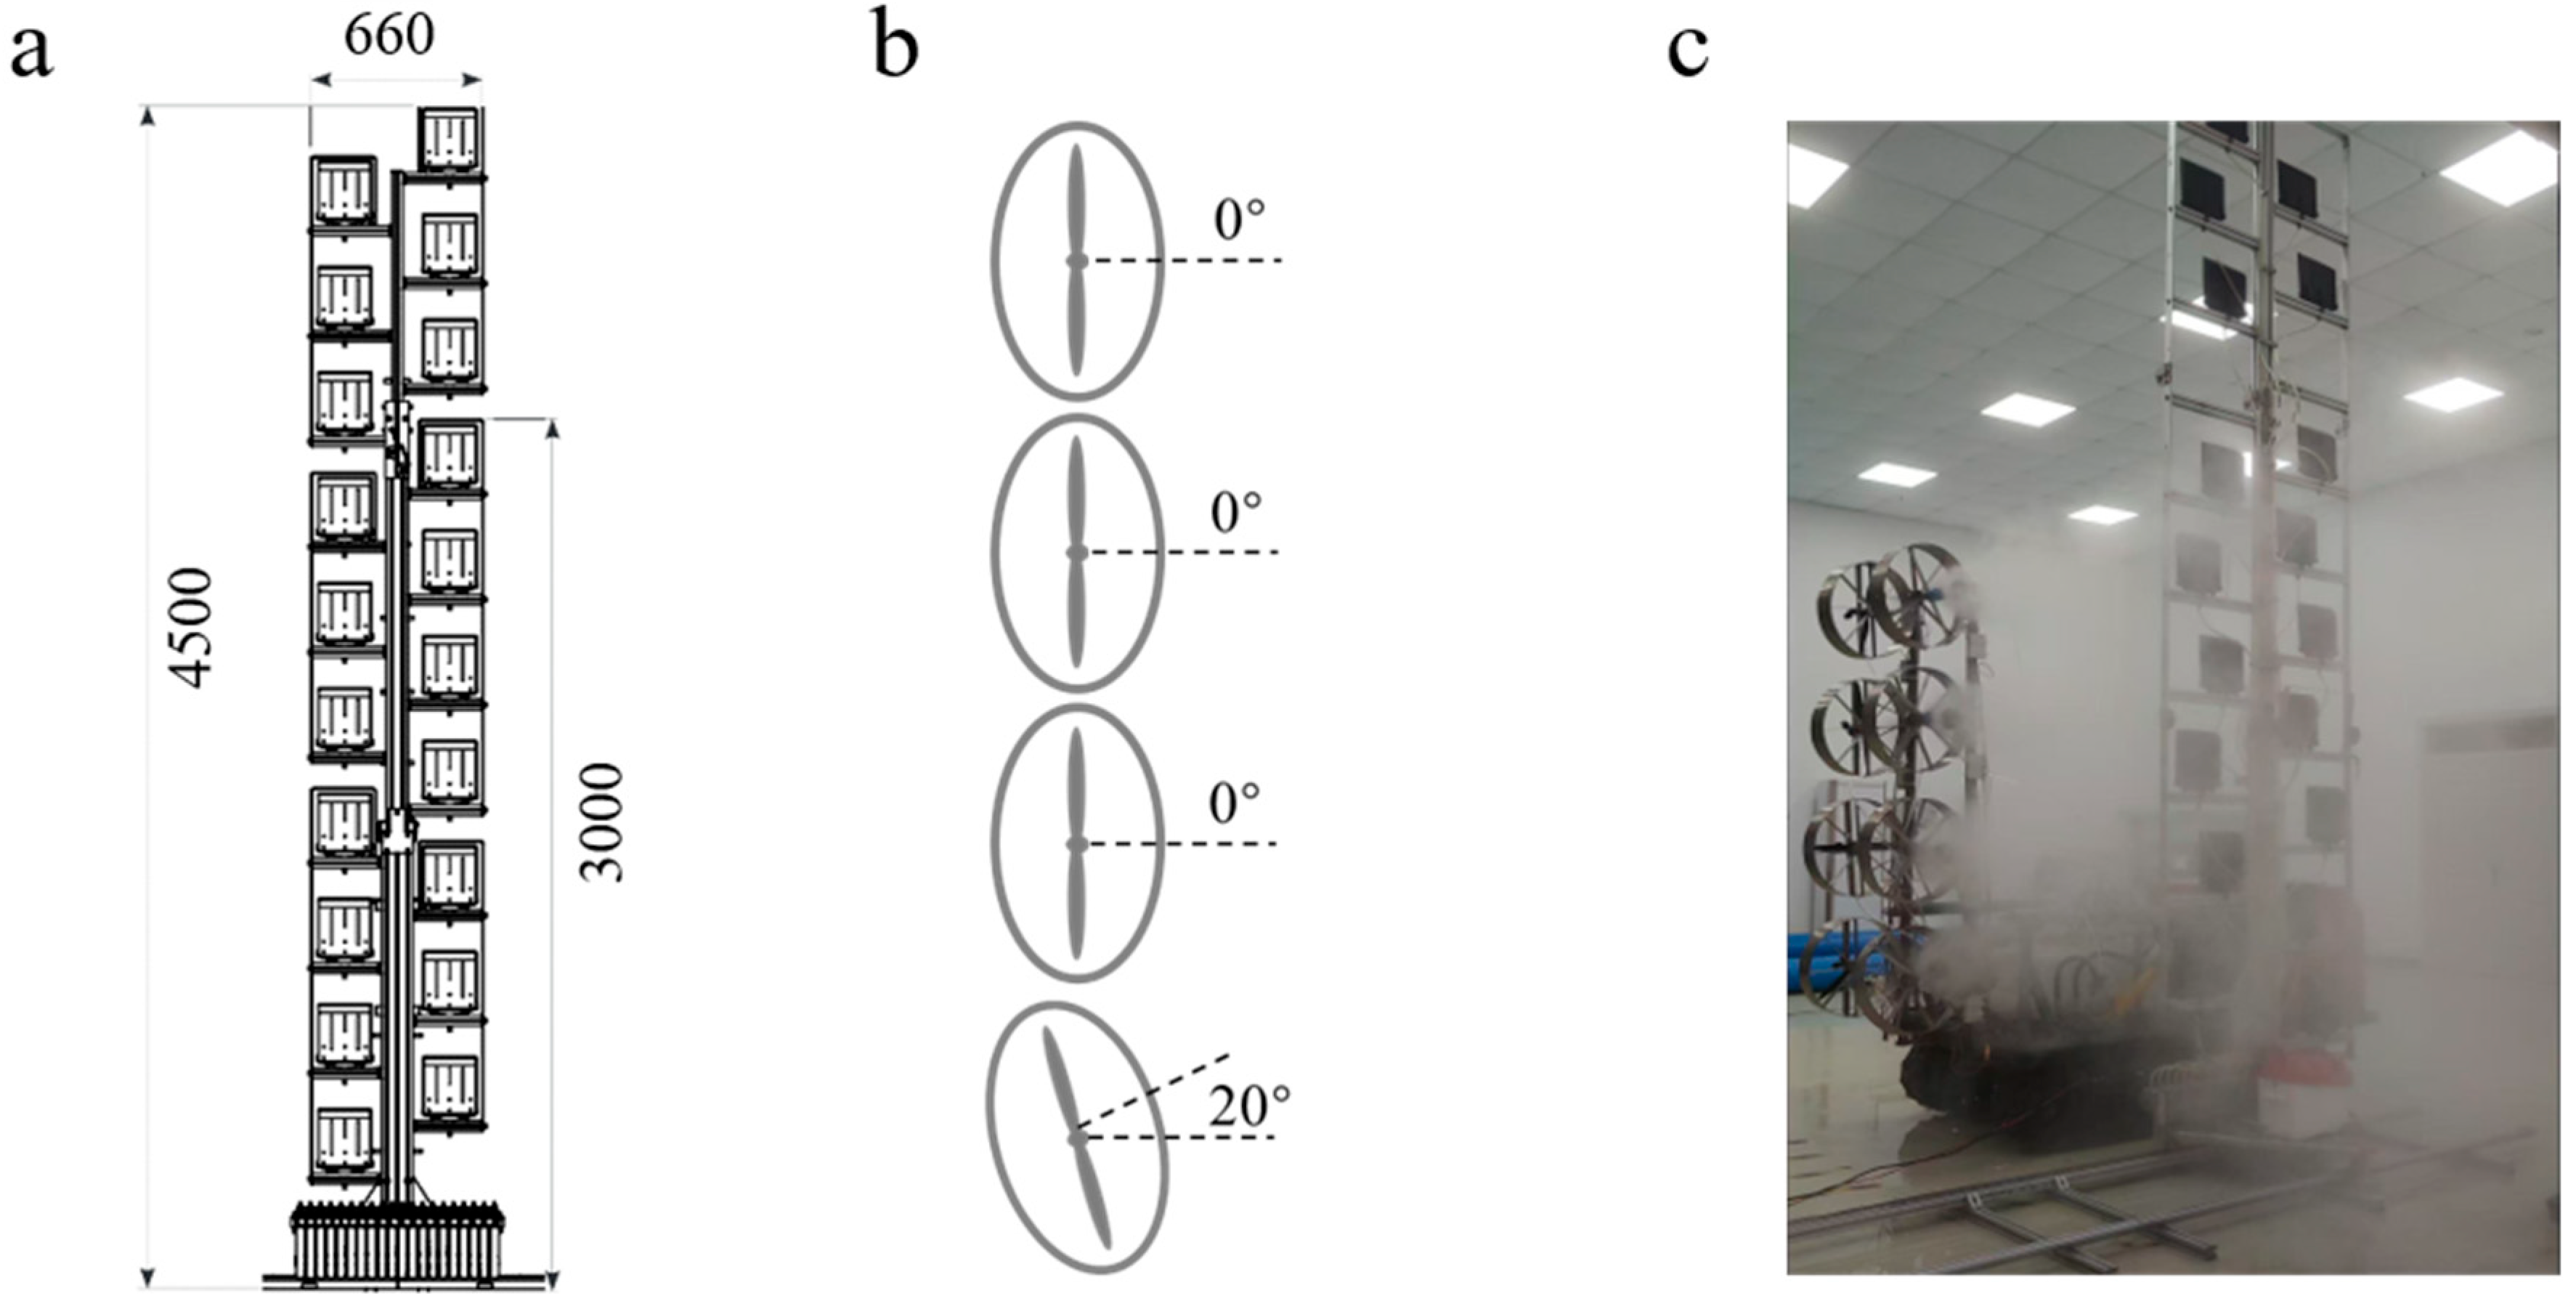
The vertical deposition distribution was measured using a vertical patternator (AAMS.be, Mardheim, Belgium), as shown in Figure 3. The apparatus consists of a drive platform and a collector assembly. The drive platform includes a 4 m-long rail and a motor-driven base. The base, powered by a 12 V motor, moves along the rail at a constant speed via a gear mechanism. The collector stand is 4.5 m tall and is equipped with collection trays mounted at 20 cm intervals, each connected to a 100 mL measuring cylinder for collecting spray droplets. The lowest tray is positioned 0.5 m above the ground.
The installation angles of the individual spray units are shown in Figure 3b. To counteract the effect of gravity on the droplet, the lowest spray unit was angled upward by 20°. During testing, the position of the profile tester remained fixed, while the horizontal distance between the nozzles and the vertical patternator was varied at 0.5 m, 0.75 m, 1.0 m, 1.25 m, and 1.5 m. Three different outlet air velocities were tested: 4 m·s−1, 7 m·s−1, and 10 m·s−1. Each treatment was conducted with three replications. These values were selected to systematically investigate the influence of air velocity on droplet distribution.

2.2. Field Evaluation of the CASS on Pear Trees

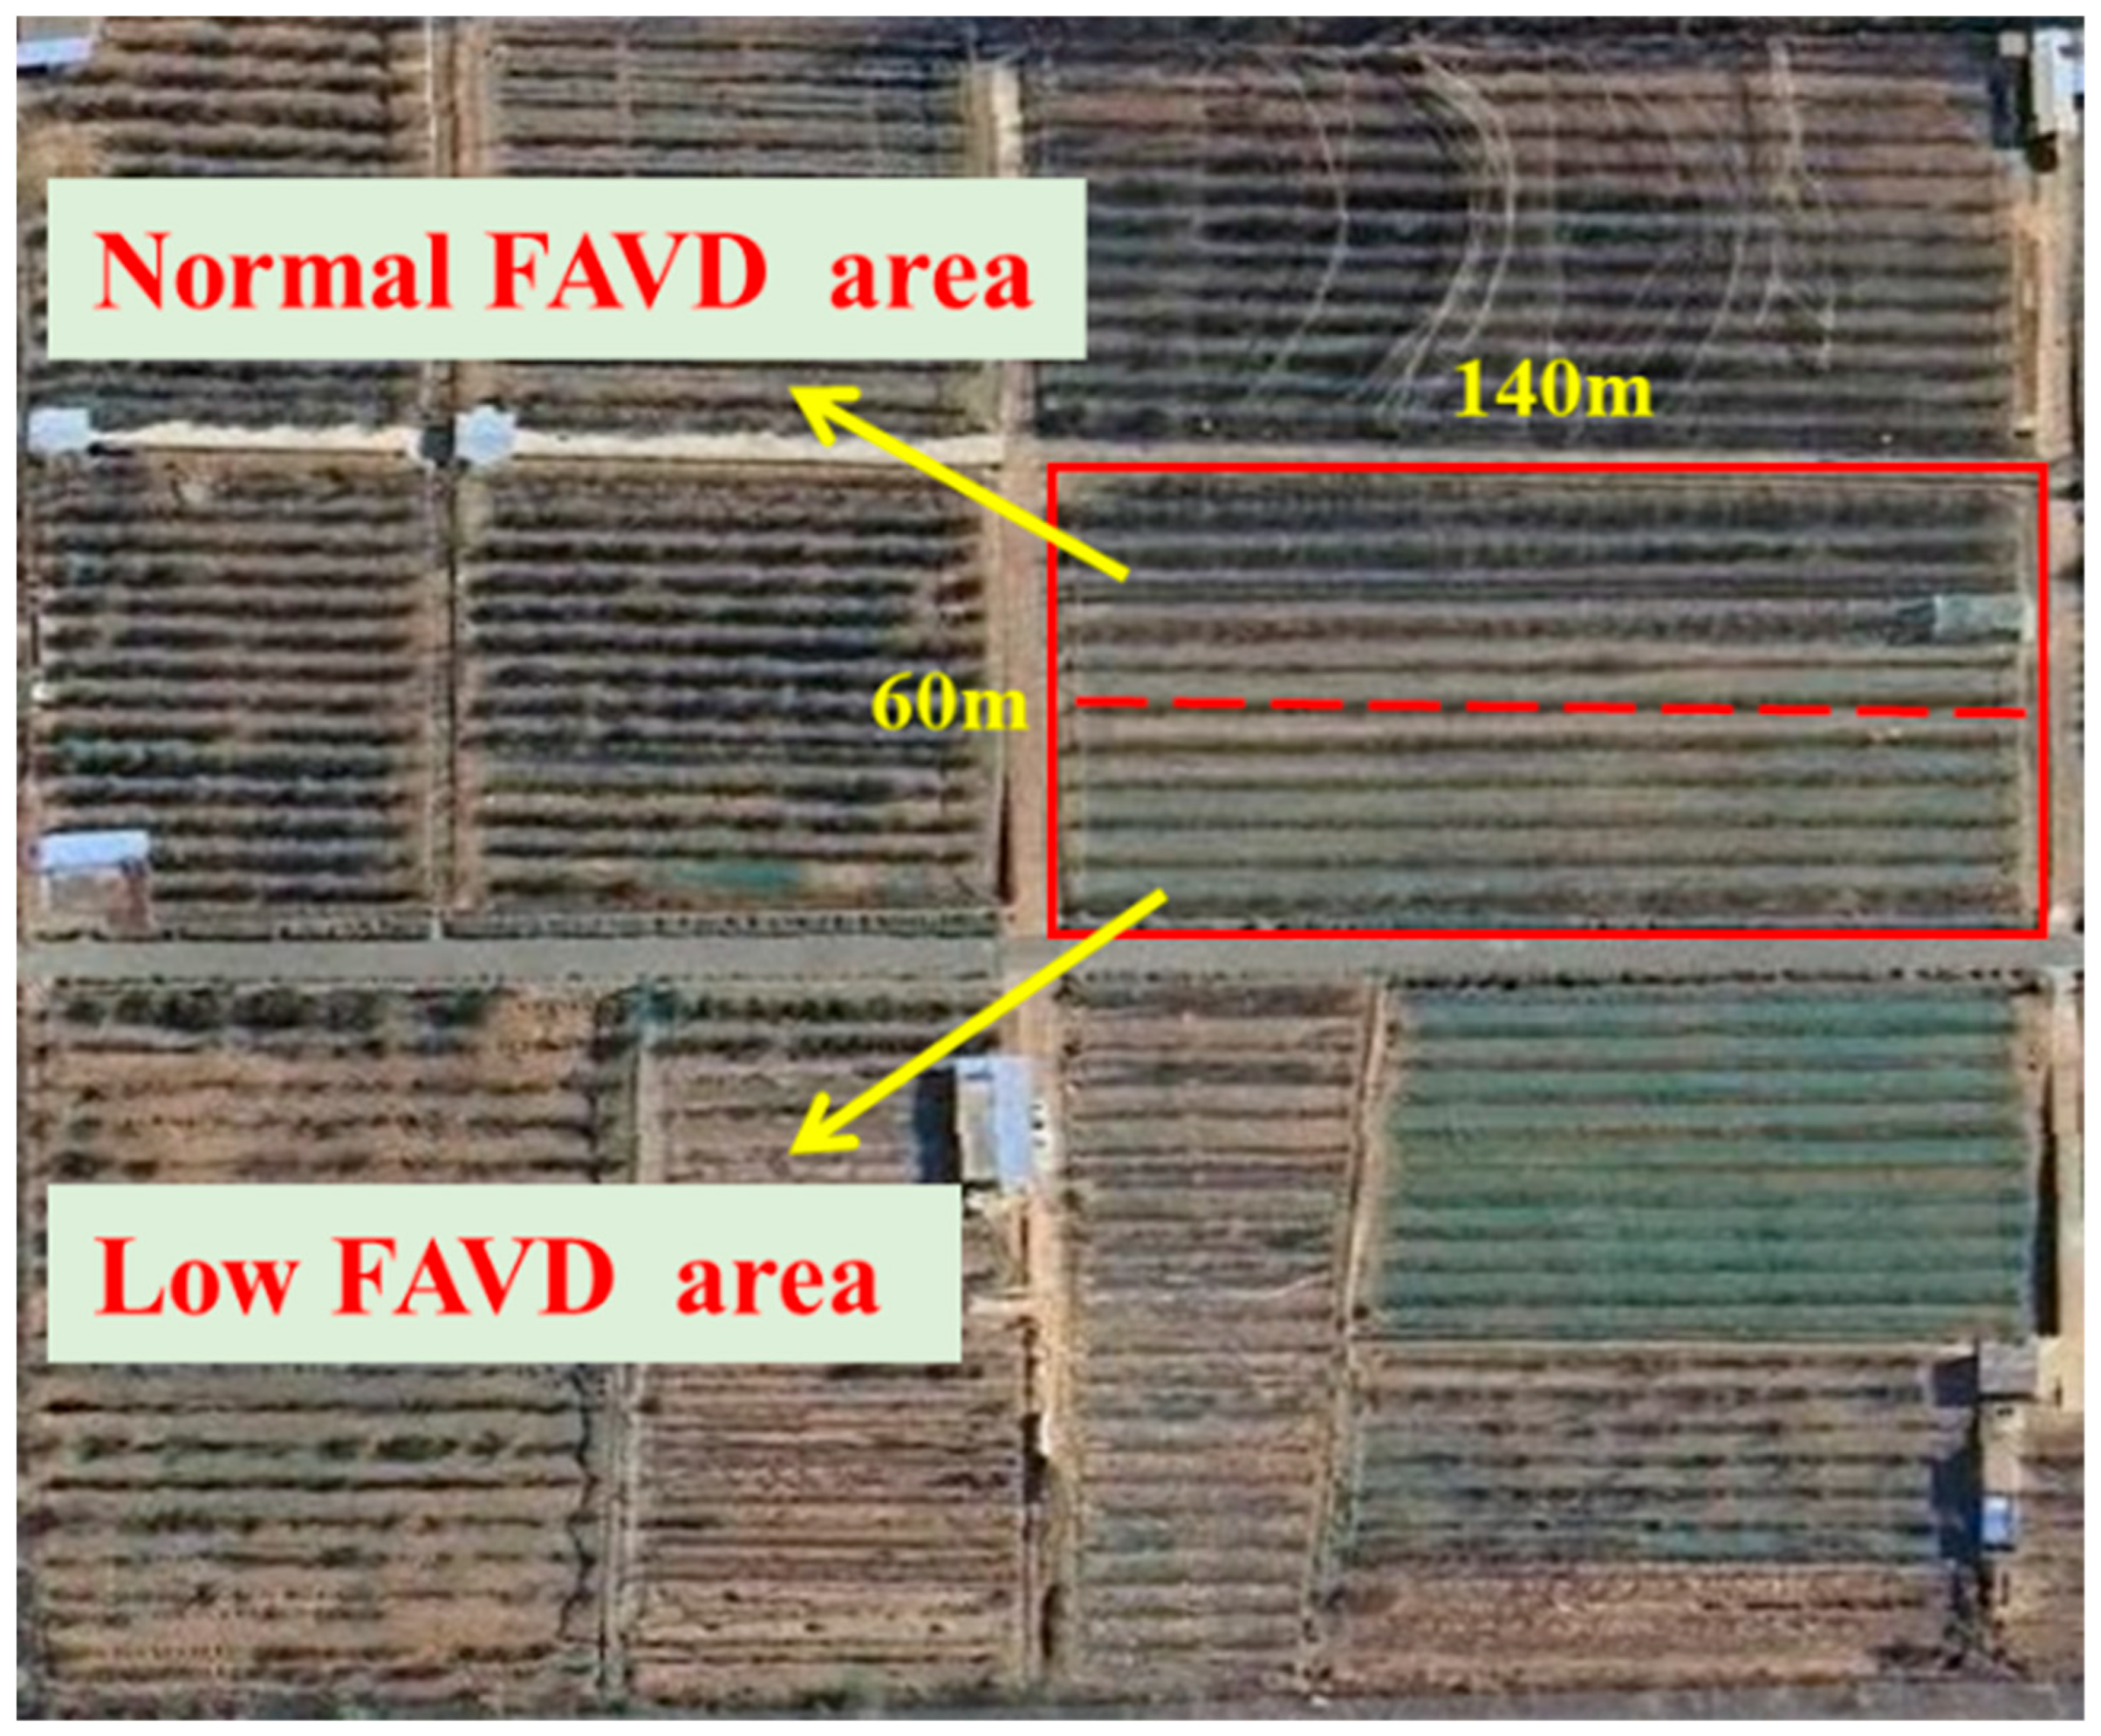
The field trial was conducted in a pear orchard at the Tianping Lake Base of the Shandong Institute of Pomology (117.0° E, 36.2° N), located in Taian City, Shandong Province. The orchard grows various fruit crops, including pear, apple, cherry, and peach trees. The surrounding terrain is relatively open, with a ground slope not exceeding 5°. The selected pear plot had row spacing of 4.2–4.5 m and plant spacing of 3.5 m, covering an area of 140 m in length and 60 m in width (Figure 4). Pear trees were 10 years old, with a height of 2.8–3.0 m and a canopy width of 2.5–3 m. Trees were at the same growth stage, and received uniform annual pruning such that their Foliage Area Volume Density (FAVD) was considered comparable. To obtain canopies with different FAVD for comparison, half of the trees were pruned to reduce the leaf density without altering the overall canopy structure.

2.2.1. Measurement of Canopy FAVD

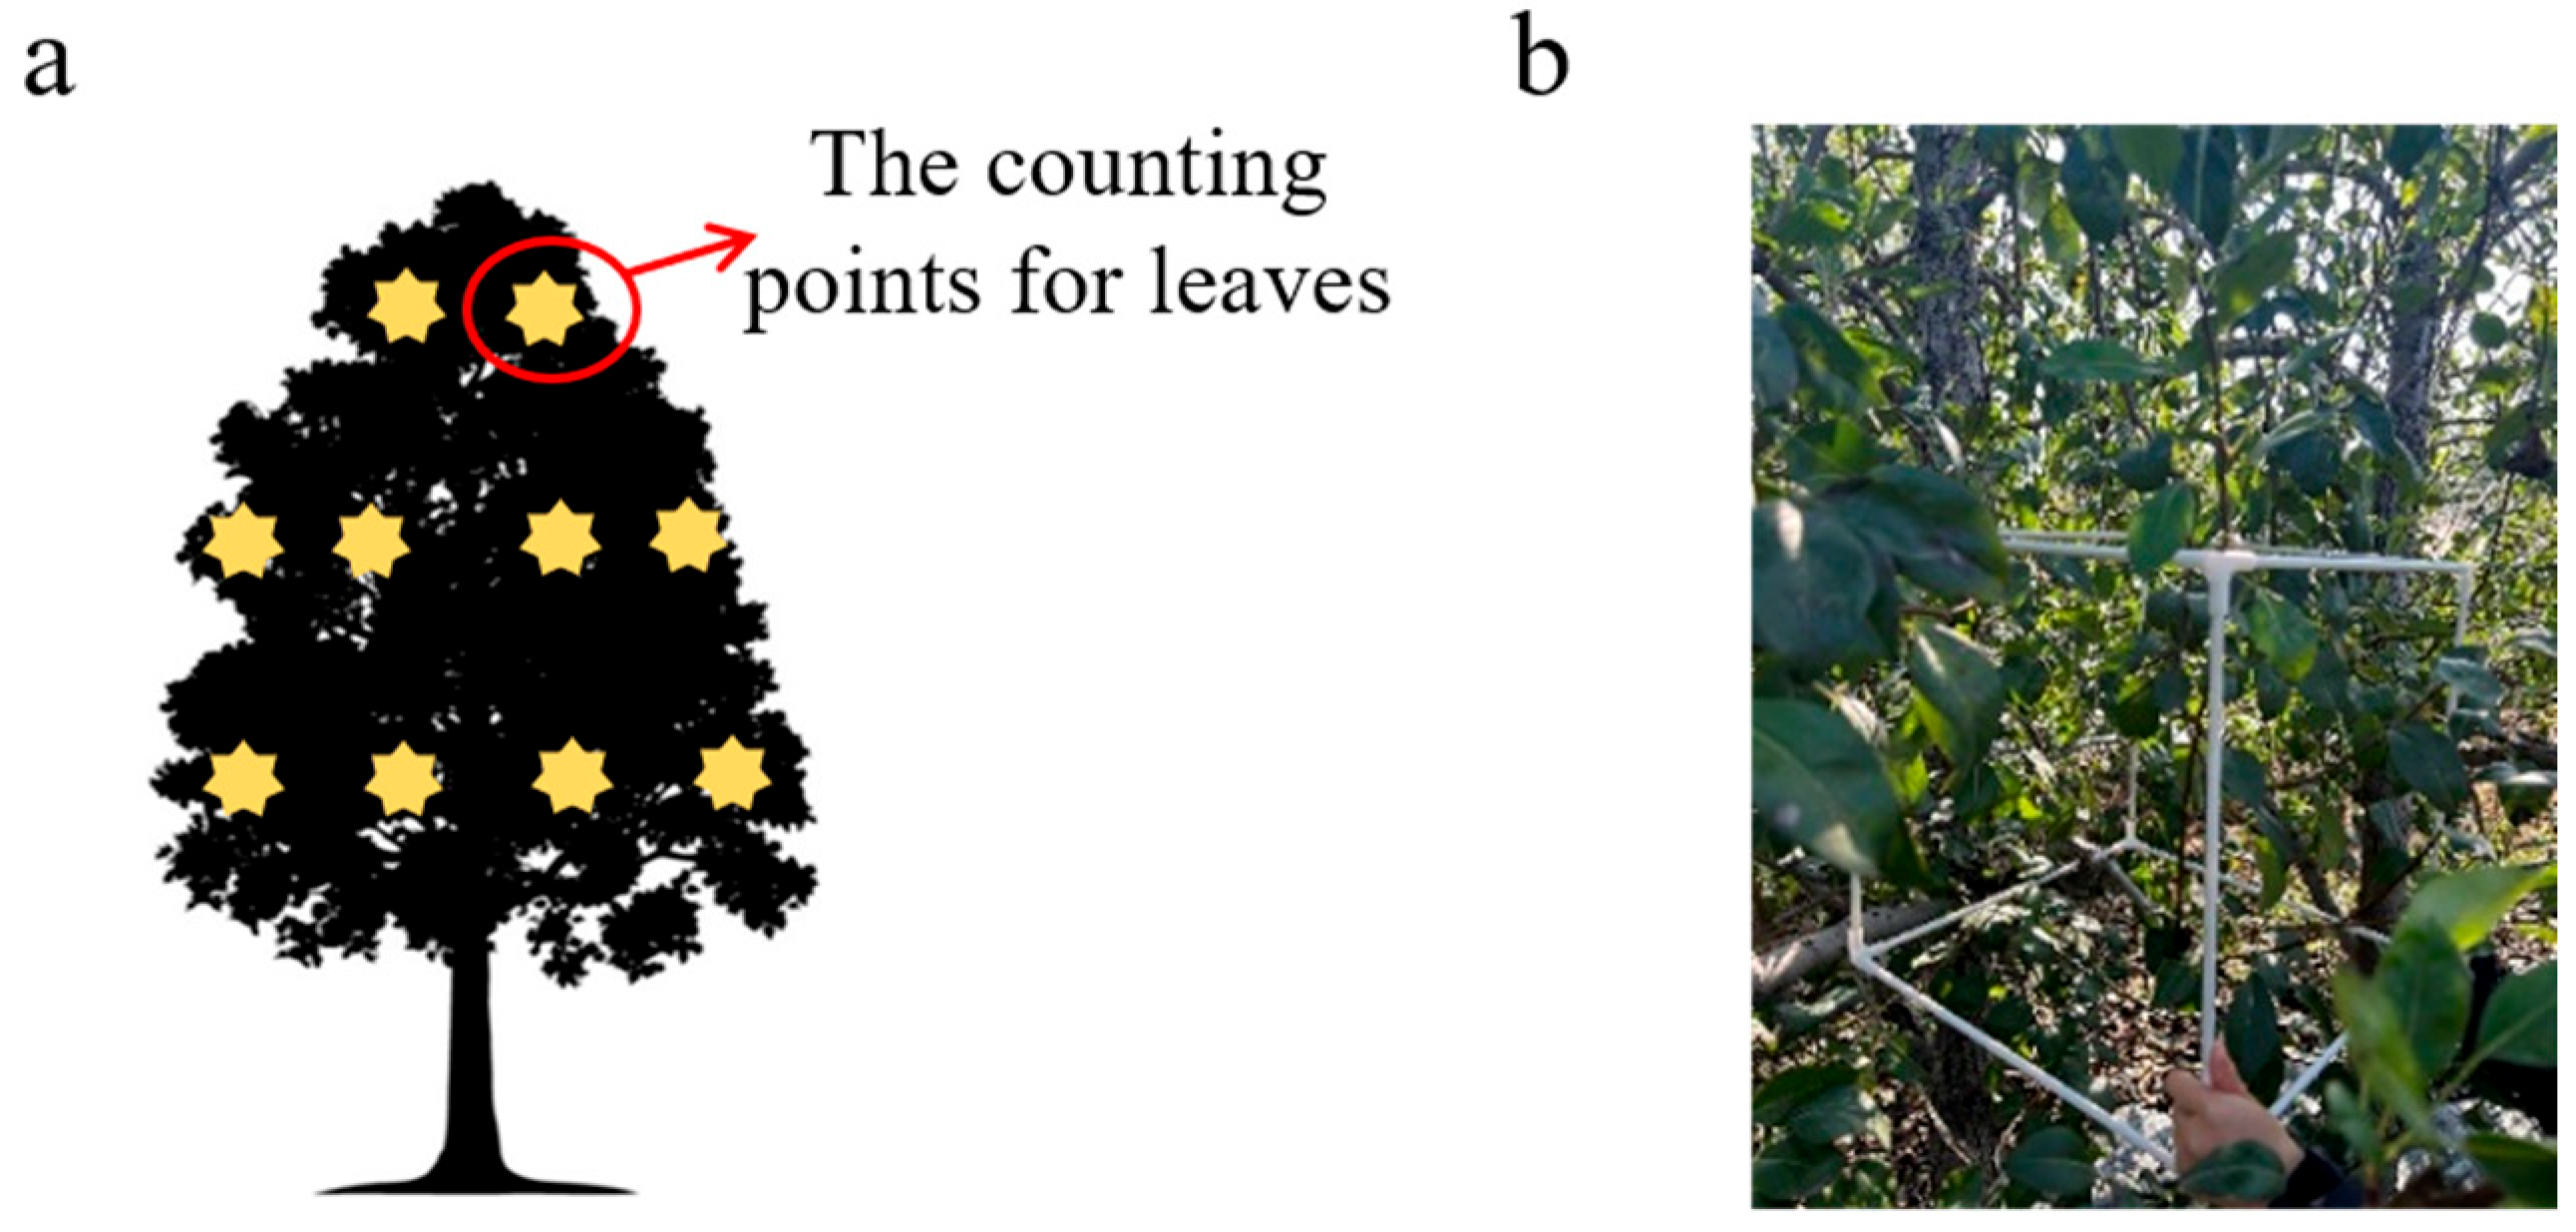
Canopies with two leaf densities were sampled to determine their FAVD. A stratified sampling protocol was implemented to quantify leaf number within a defined canopy area. Each canopy was vertically divided into upper, middle, and lower strata, with four sampling points established in both the middle and lower strata, and two points in the upper strata (Figure 5a). A 50 cm cubic sampling frame was deployed as a standardized measurement unit. This frame was systematically positioned at each predetermined sampling location, followed by complete enumeration and recording of leaves contained within its volume (Figure 5b). Upon completion of leaf counting at each sampling site, ten representative leaves were selected as specimens. These leaf samples were digitized using a scanner at 600 dpi resolution. The pixel count of the collected leaves from each sampling area was then extracted and converted to leaf area. Finally, the FAVD of the pear trees was calculated according to the following formula:
S l e a f = i = 1 10 ( N l e a f N r e f × S r e f ) i 10 × N
F A V D = j 1 10 ( S l e a f V ) j 10
where Sleaf is the total leaf area in the sampling region (cm2), Nleaf is the total pixel count of leaves in the sampling region, Nref is the pixel count of the standard reference object, Sref is the area of the standard reference object (cm2), N is the number of leaves within the sampling frame, and V is the volume of the cubic sampling frame (m3).

2.2.2. Measurement of Wind Fields Within the Canopy

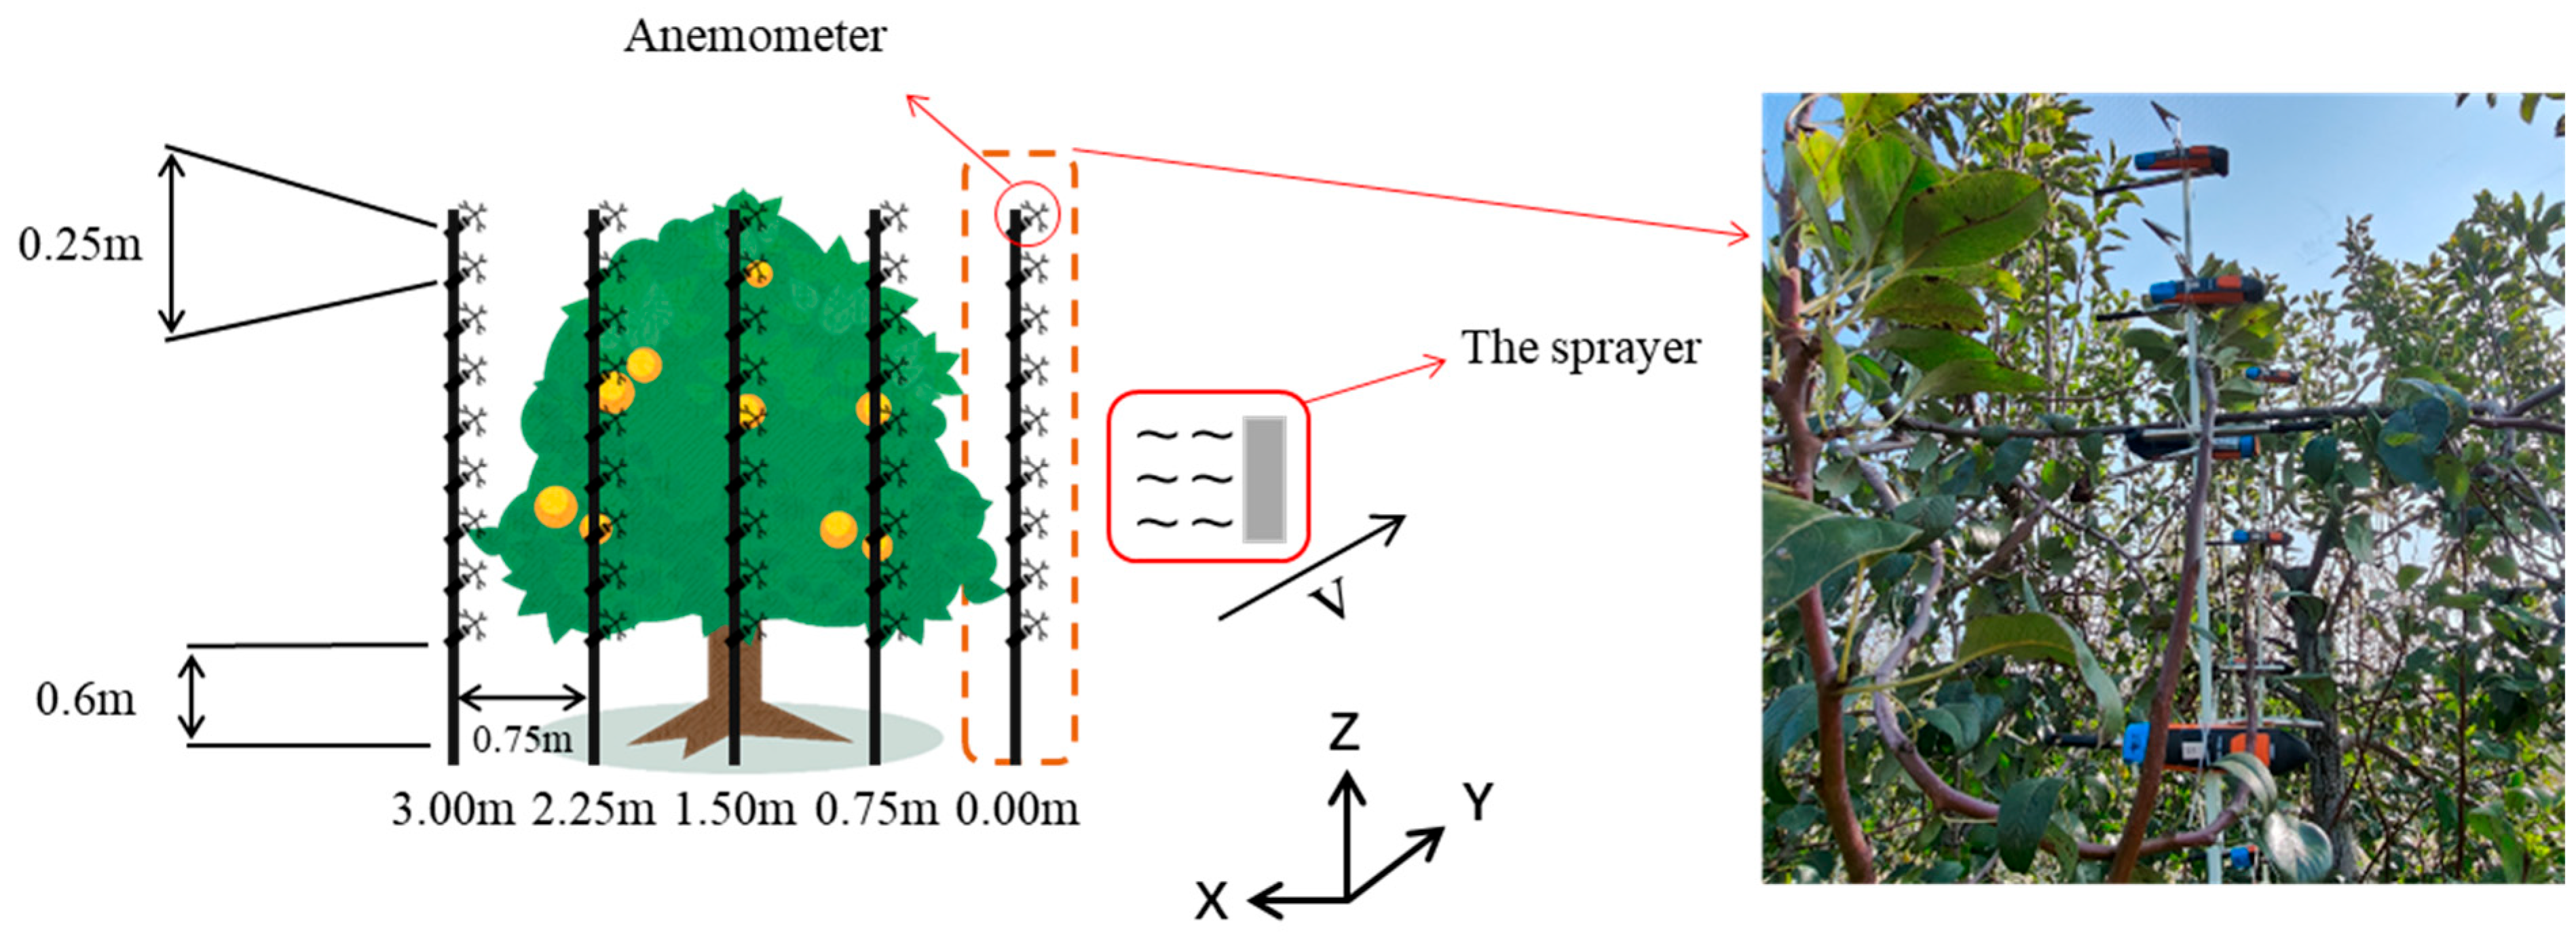
Air velocity at different positions within the canopy was measured using a thermal anemometer (Testo 405i, Testo SE & Co. KGaA, Berlin, Germany). The sensor’s sampling frequency was set to 1 Hz, with an accuracy of 0.01 m·s−1. As shown in Figure 6, five vertical PVC pipes, each 2.8 m long, were installed in the canopy as measurement supports. Pipes at 0.0 m and 3.0 m were placed outside the canopy to measure boundary air velocity. Pipes at 0.75 m, 1.5 m, and 2.25 m were positioned inside the canopy. The pipe at 1.5 m was located at the center of the canopy. The horizontal spacing between adjacent PVC pipes was 0.75 m. The anemometers were mounted on the PVC pipes at vertical intervals of 0.25 m, with the lowest probe positioned 0.6 m above the ground. To ensure accurate measurement of the airflow generated by the sprayer, the intake tube of each probe was aligned parallel to the travel direction of the sprayer.
Prior to the experiment, all sensors were activated and checked, with connection status verified via the smartphone app. When starting the test, all fans were adjusted to an outlet air velocity of 8 m·s−1. The sprayer was then remotely controlled to move forward at a steady speed of 0.8 m·s−1. This study focused on measuring the air velocity distribution on one side; therefore, each measurement concluded after the sprayer completed a single pass. After each test, measurement data were exported using the Testo Smart Probes App. The airflow characteristics under two different FAVD conditions were measured, with three replicates for each condition.

2.2.3. Evaluation of the Deposition Distribution Characteristics of a Single Centrifugal Spray Unit in the Canopy

The single-unit, one-sided spray test was designed to establish a baseline for the intrinsic deposition characteristics of the centrifugal atomizer, free from multi-unit interference, thereby providing a fundamental reference for understanding droplet transport and guiding subsequent multi-unit optimization.
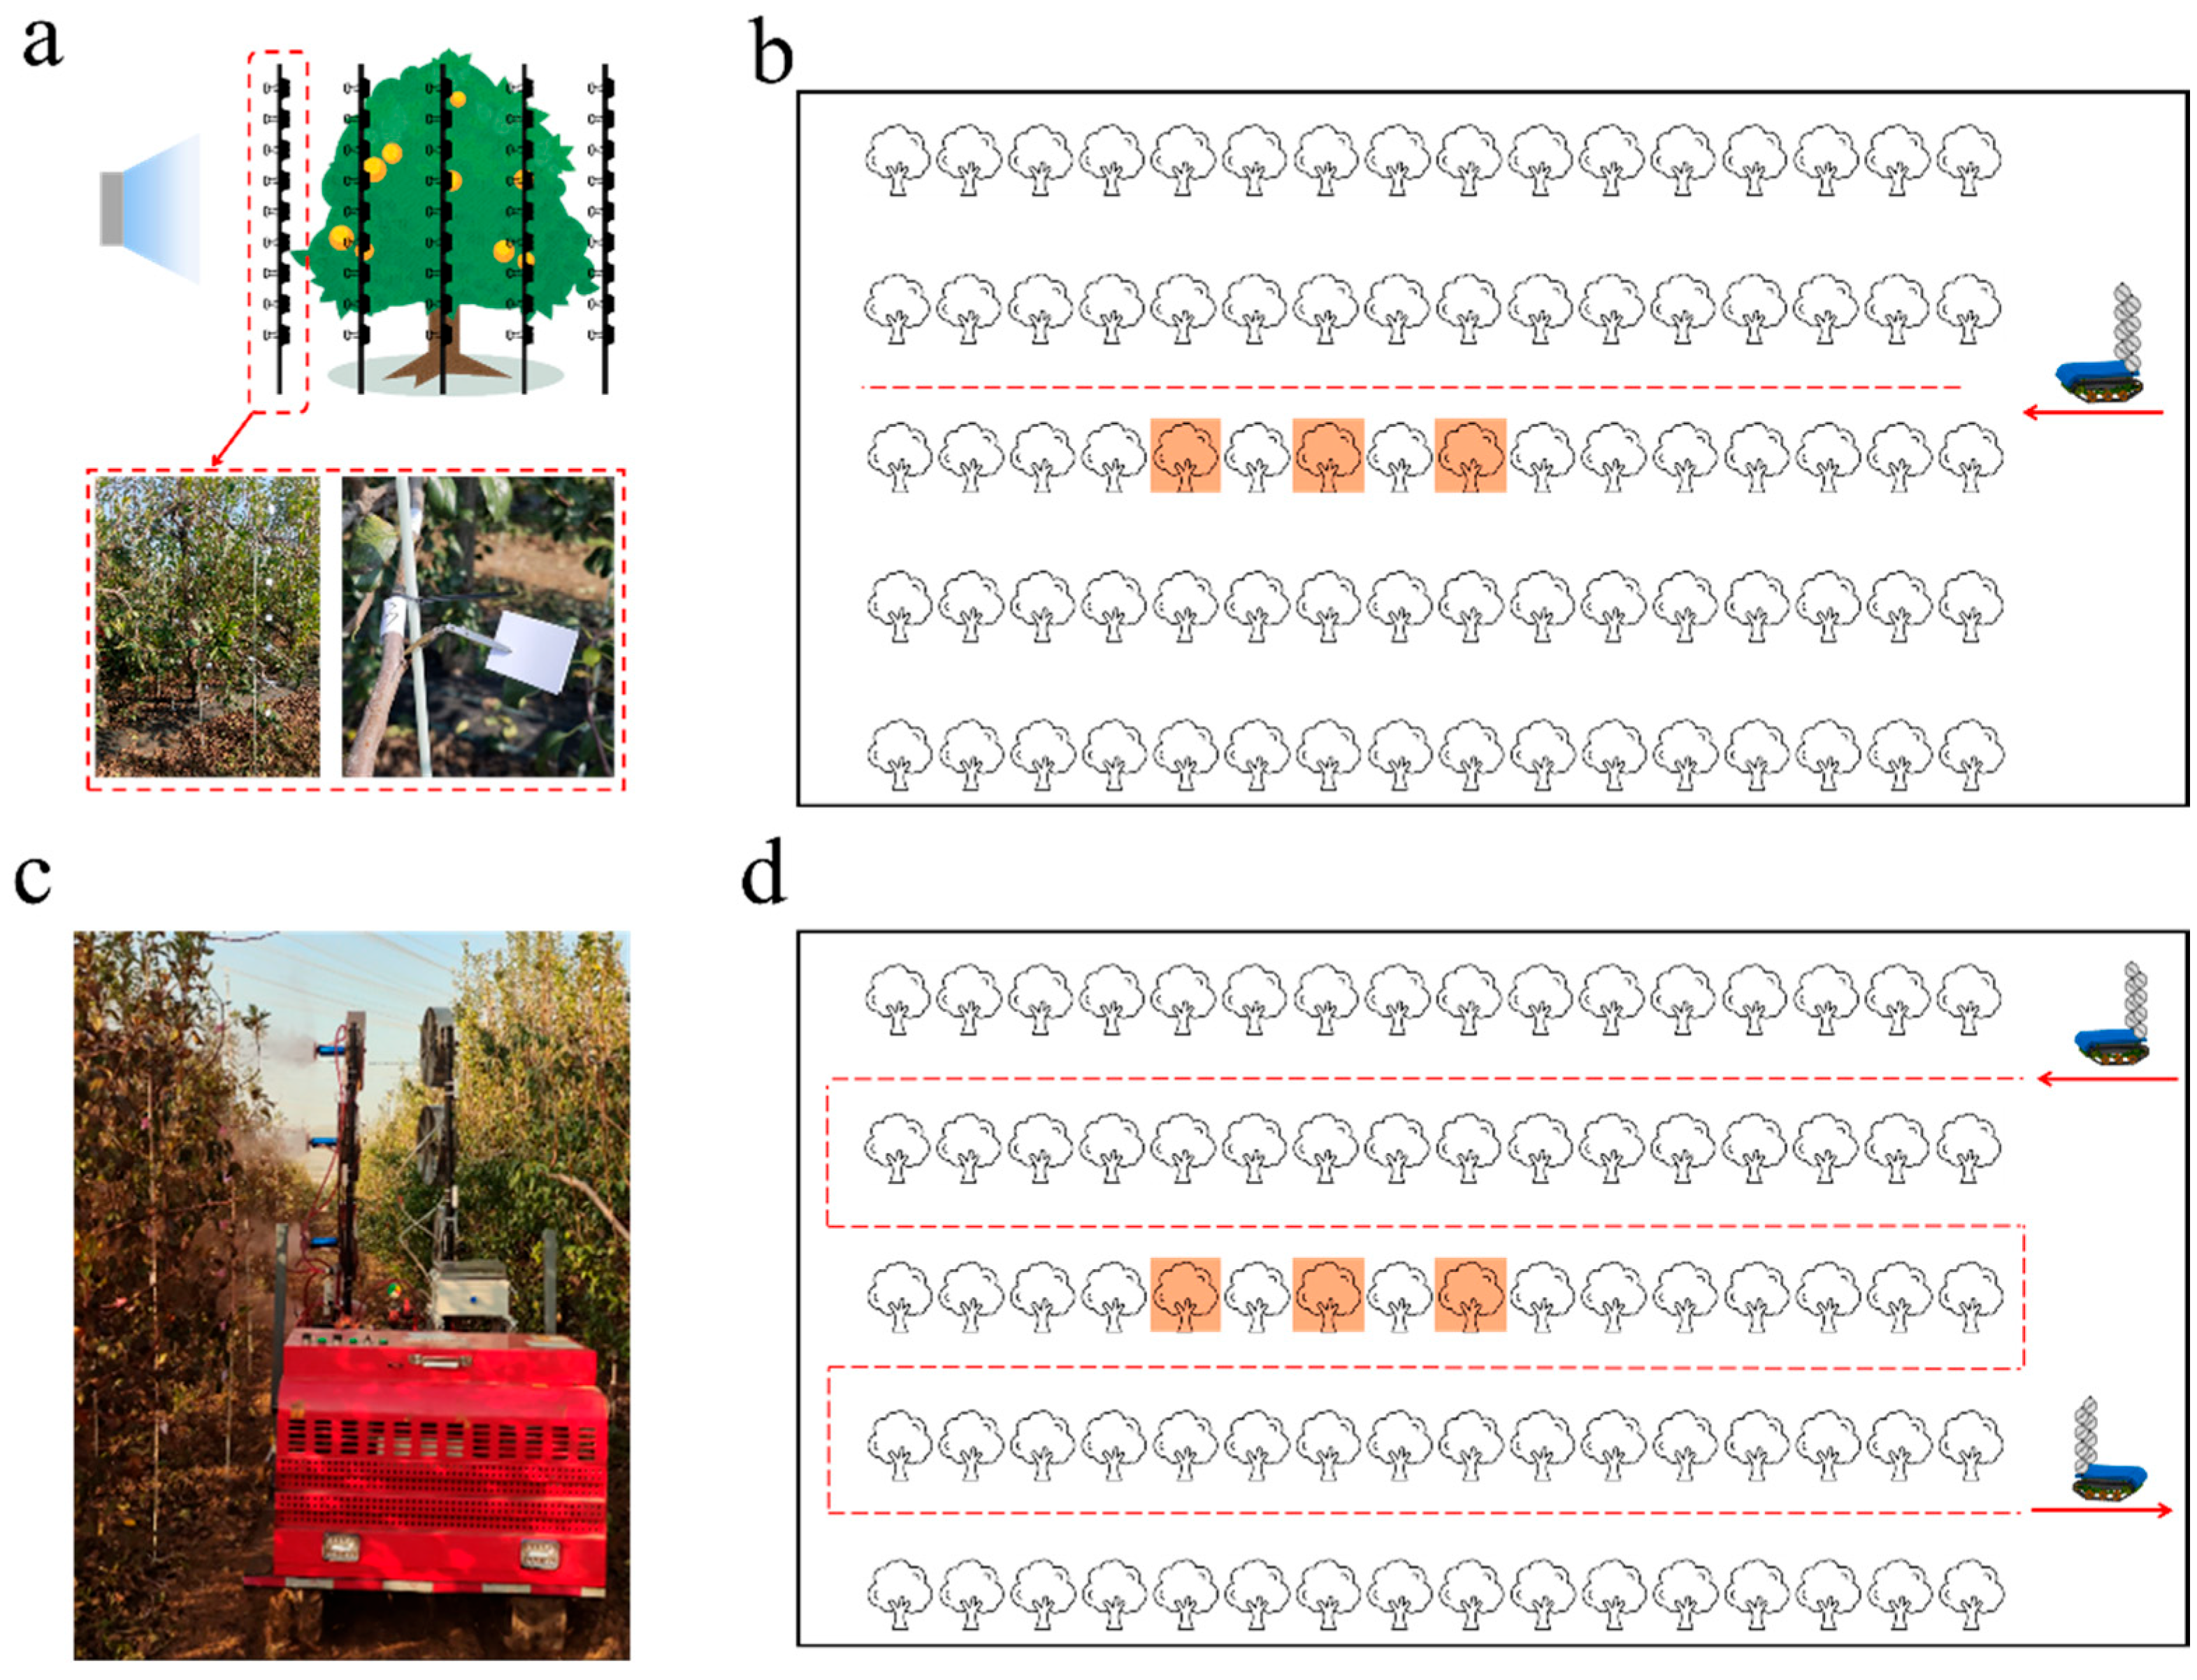
The experimental setup is illustrated in Figure 7a, where five PVC pipes are used as sample supports, maintaining the same relative positions as described in Section 2.2.2. Double-headed clips were mounted on the PVC pipes at 0.25 m intervals to hold sampling cards, with the lowest clip positioned 0.6 m above the ground. Two kromekote cards (40 mm × 50 mm) were fixed on each clip to represent the adaxial and abaxial leaf surfaces, respectively. An 8 g·L−1 carmine solution was used as a tracer.
Before testing, the sprayer was started, and the flow control valve was adjusted to allow only the second spray unit (from the bottom) to operate with water. The flow rate of the spray unit was set to 0.9 L·min−1. The sprayer was remotely controlled to move forward at a constant speed of 0.8 m·s−1 along the path shown in Figure 7b. After spraying, all kromekote cards were collected and mounted on blue A4 paper for scanning at 600 dpi. Tests were conducted under three outlet air velocities (4 m·s−1, 8 m·s−1, and 11 m·s−1) and two canopy density levels (normal FAVD and low FAVD), with three replicates for each condition.

2.2.4. Comparison of Deposition Between Centrifugal and Hydraulic Spray Systems

This section presents a comparative analysis of the deposition characteristics of the two spray systems when all spray units on one side were operated simultaneously. The experimental setup for sample collection remained identical to that described in Section 2.2.3. Prior to testing, the sprayer was activated, and the flow control valve was adjusted to supply water only to the four nozzles on one side. For the hydraulic nozzle system, the pressure was set to 400 kPa, corresponding to a flow rate of 0.9 L·min−1 per spray unit (3.6 L·min−1 of total system). For the centrifugal nozzle system, two flow rate levels were tested: 3.6 L·min−1 (equivalent to the hydraulic system) and 2.6 L·min−1 (representing a 30% reduction in application volume). The treatment settings for the deposition evaluation of these two spray systems are shown in Table 1. The outlet air velocity for all four spray units was set to 8 m·s−1. The sprayer was then remotely controlled to move forward at a constant speed of 0.8 m·s−1 along the path shown in Figure 7d. After spraying, all kromekote cards were collected and mounted on blue A4 paper for scanning at 600 dpi. Each treatment was conducted with three replications.

3. Results

3.1. Evaluation Result of Vertical Deposition Distribution

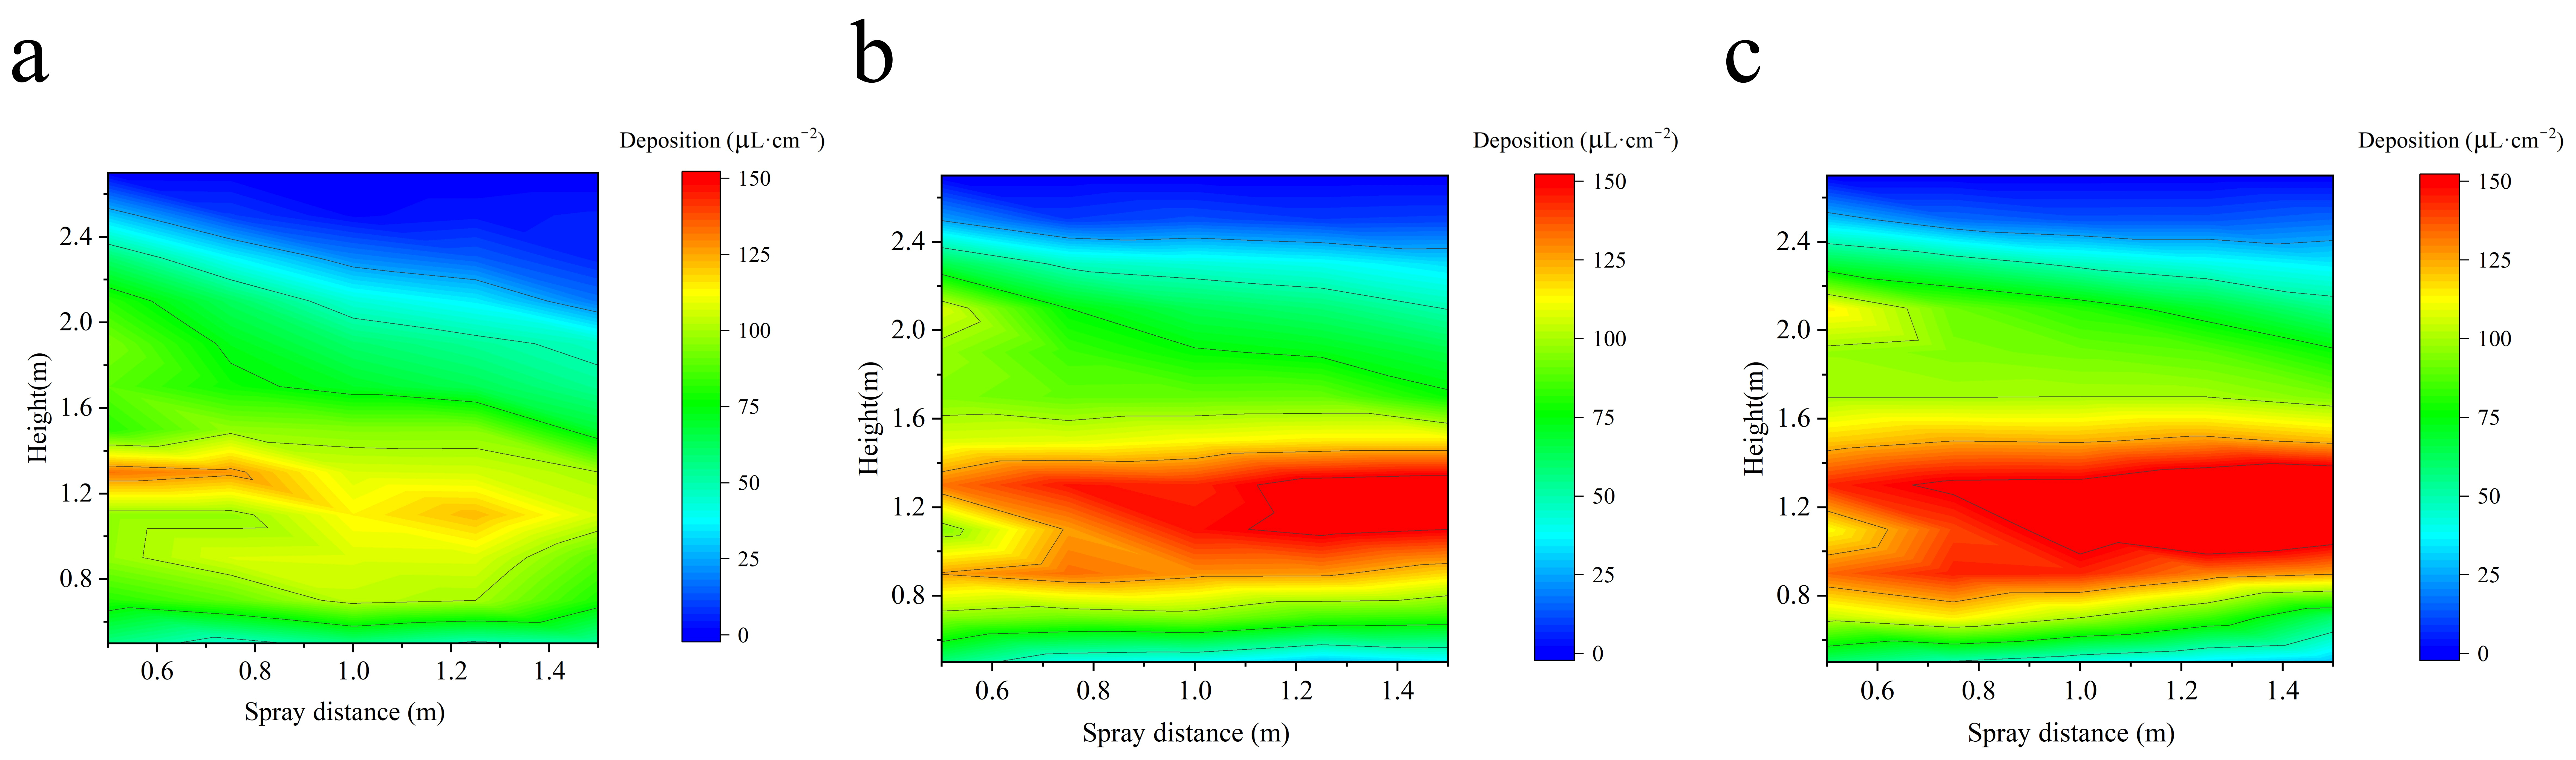
Figure 8 illustrates the vertical droplet distribution patterns under different outlet air velocities. At a constant droplet transport distance, the distribution for all three air velocities exhibits a normal distribution, characterized by higher droplet density at the center of the spray system and lower density towards the edges. For instance, at an outlet air velocity of 8 m·s−1 and a transport distance of 1.0 m, the deposition values at heights of 0.5 m, 0.9 m, 1.3 m, 1.7 m, 2.1 m, and 2.5 m were 37.8 µL·cm−2, 128.0 µL·cm−2, 143.8 µL·cm−2, 90.3 µL·cm−2, 63.8 µL·cm−2, and 12.3 µL·cm−2, respectively. Additionally, as the droplet transport distance increased, the coverage area of the spray plume decreased. This phenomenon was particularly pronounced at lower air velocities. Specifically, at an outlet air velocity of 4 m·s−1 and a height of 2.5 m, the deposition values at spray distances of 0.5 m, 0.75 m, 1.0 m, 1.25 m, and 1.5 m were 29.8 µL·cm−2, 9.5 µL·cm−2, 1.8 µL·cm−2, 3.75 µL·cm−2, and 5 µL·cm−2, respectively. This phenomenon highlights the critical role of air-assist energy in sustaining droplet momentum. When the airflow velocity falls below a certain threshold, droplets rapidly lose kinetic energy, resulting in limited horizontal coverage and a narrower effective spray swath.

3.2. FAVD of Pear Tree Canopies

Through measurement and analysis, data on average leaf area and leaf count were obtained through measurement and analysis (Table 2). The results indicate that, owing to the use of the same pear cultivar, the average single leaf area was relatively consistent across zones, ranging from 41 to 45 cm2, with no significant differences observed. However, leaf numbers differed markedly between density zones: the normal leaf density zone contained 860–1070 leaves, while the low leaf density zone had a significantly reduced count of 380–430 leaves, representing only 35–45% of that in the normal-density zone. The FAVD values, calculated based on Equations (1) and (2), are presented in Table 1. The average FAVD was 3.3 m2·m−3 in the normal-density zone and 1.4 m2·m−3 in the low-density zone, showing a clear distinction between the two canopy density conditions.

3.3. Airflow Distribution Within Pear Tree Canopies

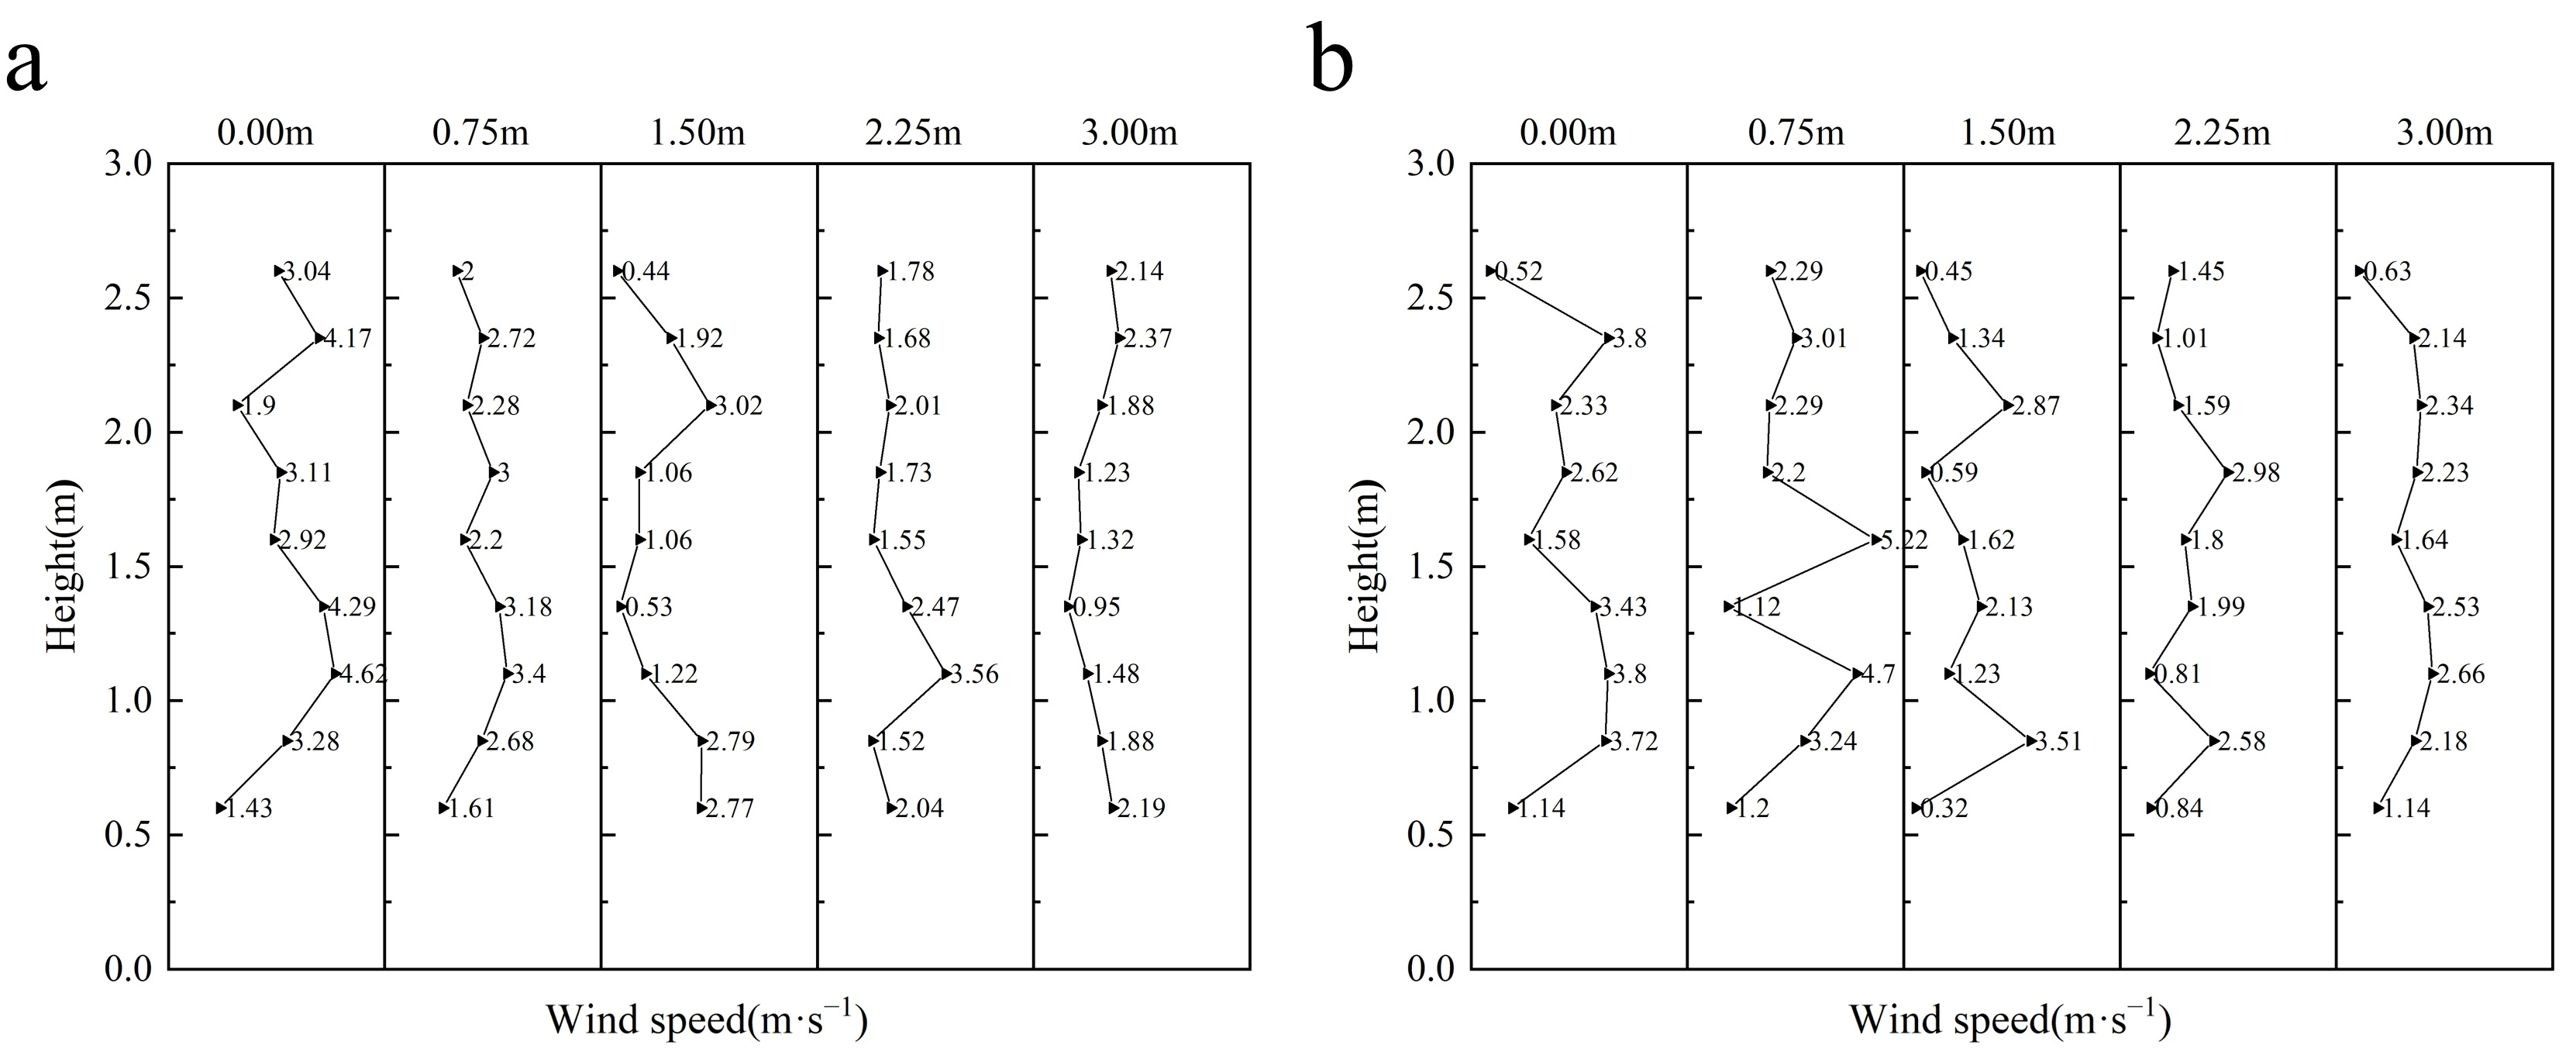
The airflow distribution at different positions within the canopy is shown in Figure 9. Under the normal FAVD condition (3.3 m2·m−3), the airflow exhibited a distinct gradient: the 0 m position, being unobstructed by the canopy, recorded the maximum velocity of 4.62 m·s−1. As the measurement points moved inward, the airflow velocity gradually decreased, reaching its minimum at the 1.5 m position, where most measurement points showed velocities below 1.5 m·s−1, with a minimum value of 0.53 m·s−1.
Under the low FAVD condition (1.4 m2·m−3), the airflow velocity at the 0 m position was similar to that under the normal FAVD condition. However, significantly higher velocities were observed at the 0.75 m and 1.5 m positions. The maximum velocity at 0.75 m reached 5.2 m·s−1, while most measurement points at 1.5 m exceeded 2.0 m·s−1.
Furthermore, the airflow attenuation to the canopy center was calculated based on the average velocities at the 0 m and 1.5 m positions. The attenuation rates were 46.3% and 23.8% under the normal (3.3 m2·m−3) and low (1.4 m2·m−3) FAVD conditions, respectively. This difference is attributable to the higher canopy resistance under denser conditions, where greater leaf area density increases airflow–leaf interactions and energy dissipation, whereas the sparser canopy allows better airflow penetration.

3.4. Deposition Distribution Characteristics of a Single Centrifugal Spray Unit Within the Canopy

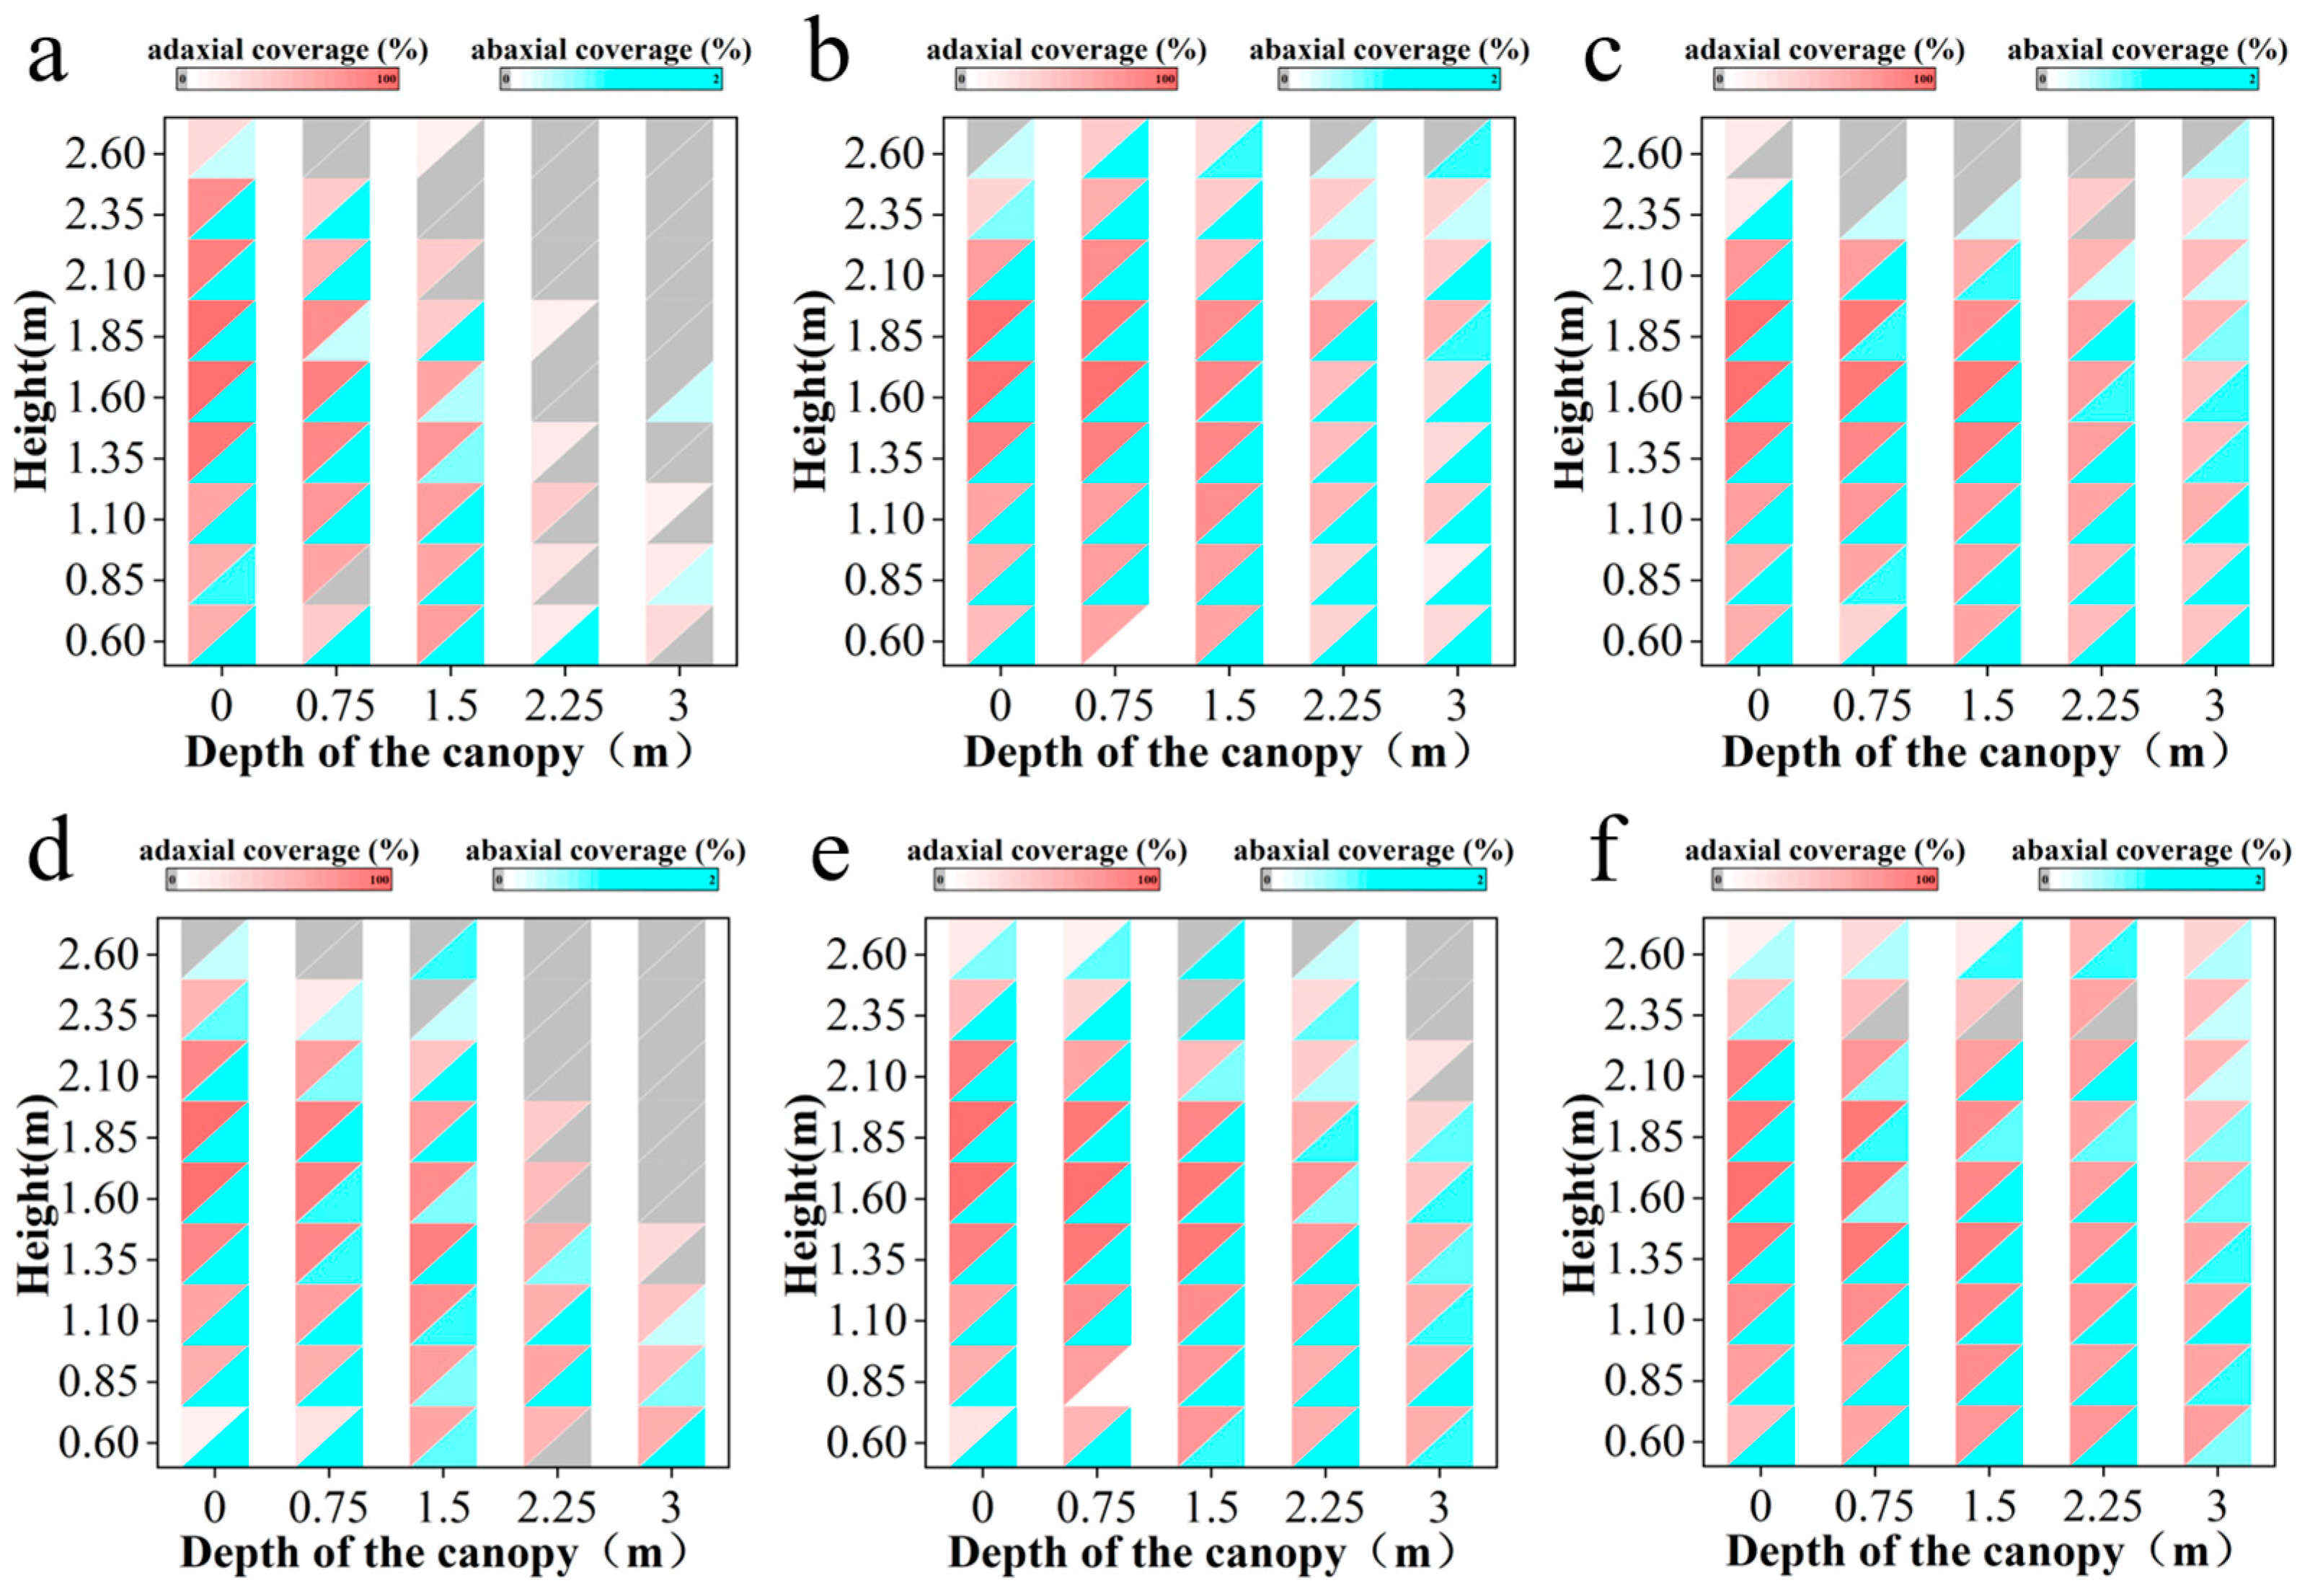
Under the FAVD of 3.3 m2·m−3, the coverage rates for the three outlet air velocities are shown in Figure 10a–c. On the adaxial leaf surfaces, at 4 m·s−1, droplet deposition exhibited a significant downward shift as the spray distance increased. Specifically, at the 0 m position, effective coverage was observed across the vertical range of 0.6–2.6 m. However, as measurements moved inward through the canopy, the coverage gradually shifted downward. At the 2.25 m and 3 m positions, droplet densities above 1.6 m height were all below 0.5 droplets·cm−2. Taking the position with the highest coverage on each sampling pipe as the spray center, the centers for five pipes (at the positions of 0.0 m, 0.75 m, 1.5 m, 2.25 m, and 3.0 m) were at 1.6 m, 1.6 m, 1.35 m, 1.1 m, and 0.6 m height, respectively. When the outlet air velocity increased to 8 m·s−1, the spray centers for the sampling pipes were 1.6 m, 1.6 m, 1.6 m, 1.85 m, and 1.85 m height, respectively. At 11 m·s−1, the corresponding centers were 1.6 m, 1.85 m, 1.6 m, 1.35 m, and 1.1 m height. Notably, the 8 m·s−1 outlet velocity resulted in the widest vertical coverage, with effective deposition detected throughout the 0.6–2.6 m range.
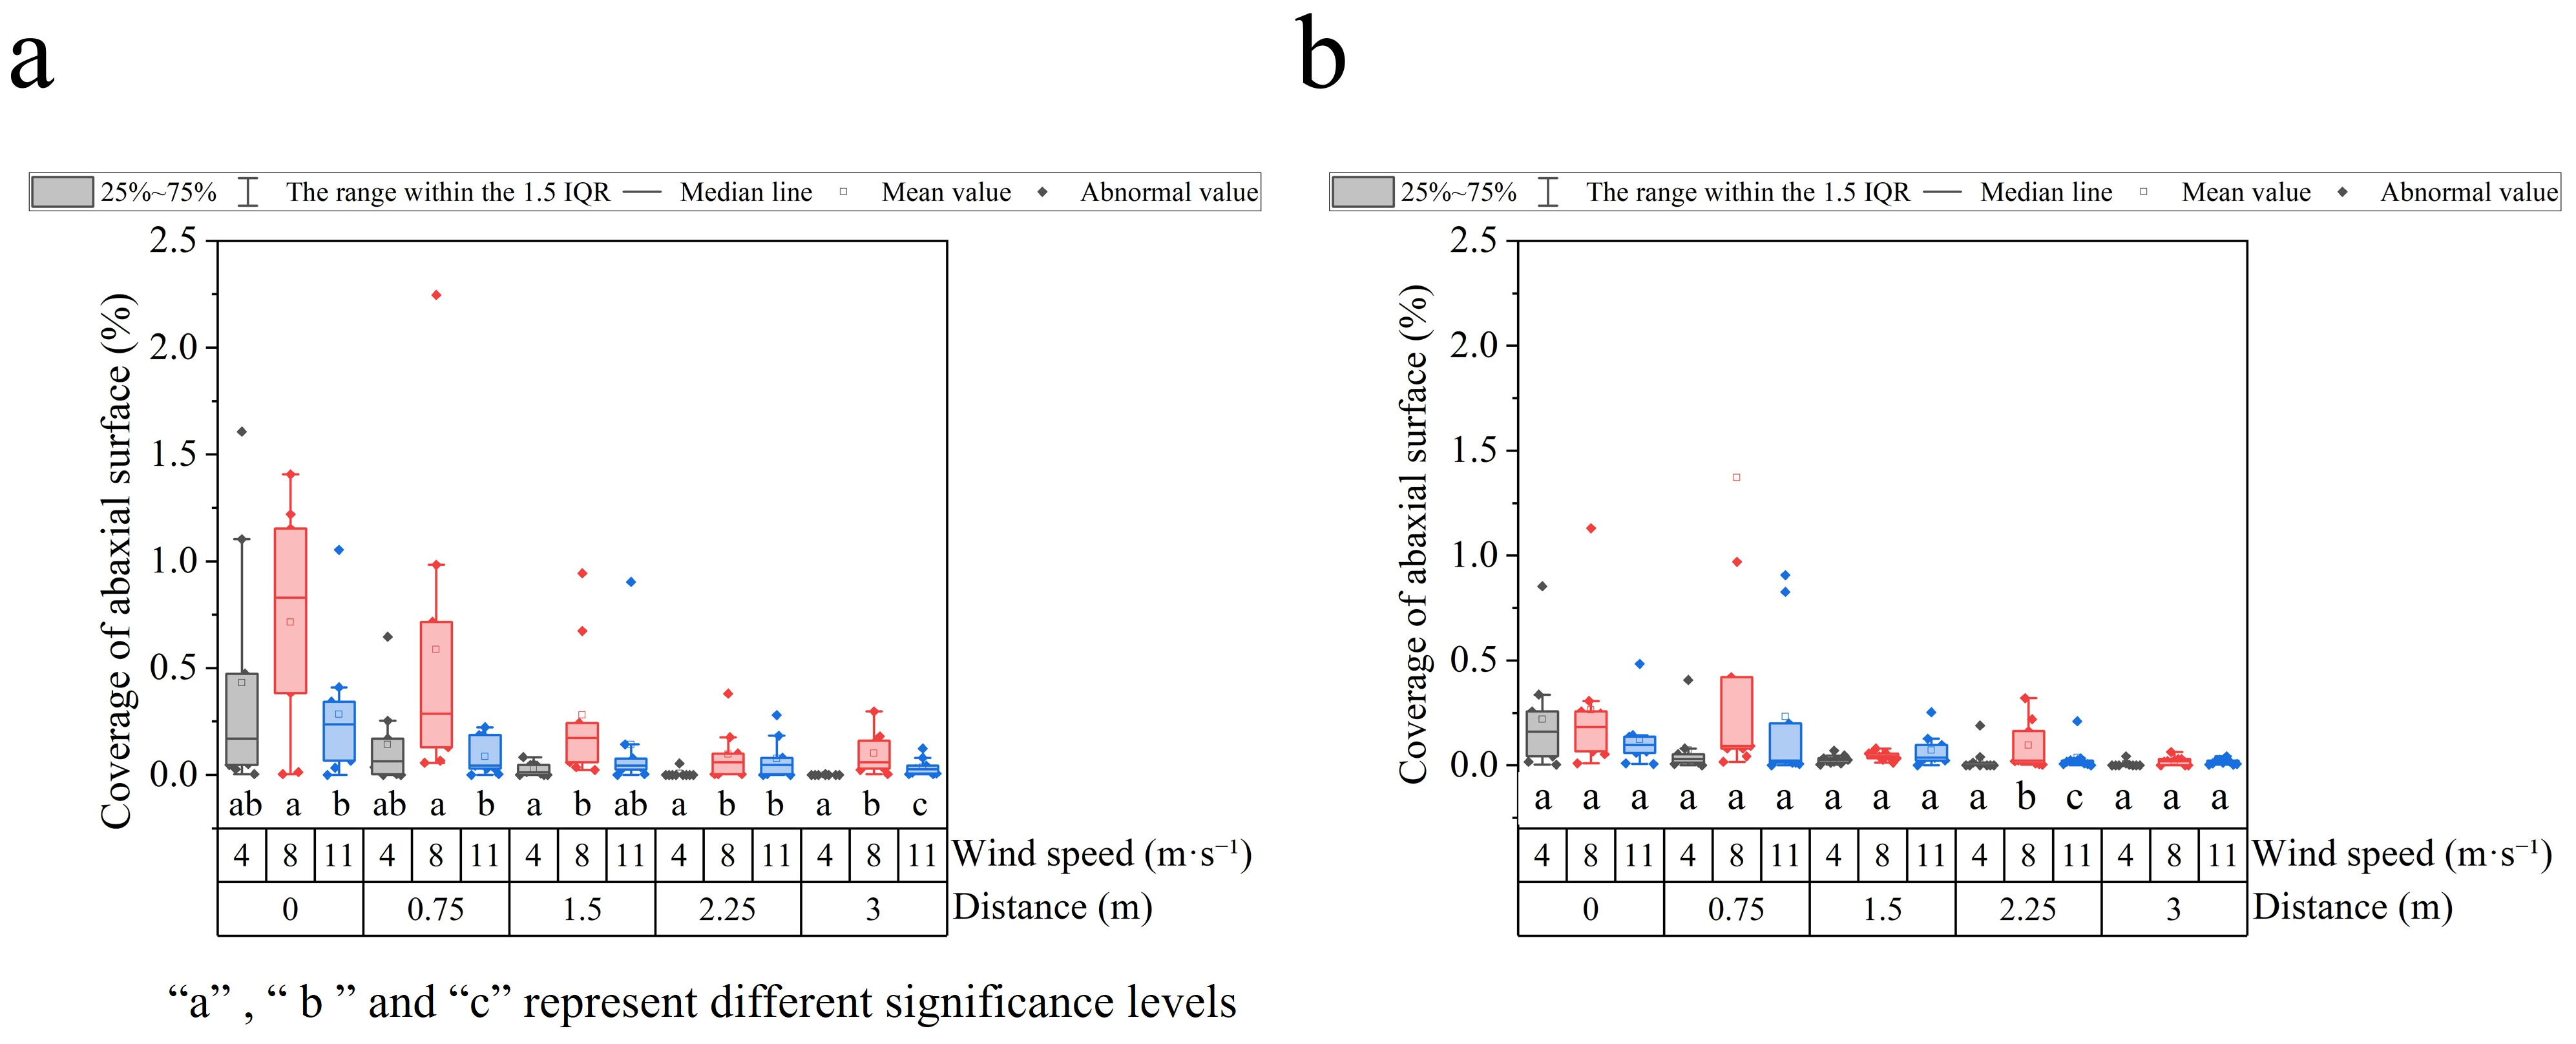
On the abaxial leaf surfaces, droplets primarily deposited at the proximal spray positions (0 m and 0.75 m). The average coverage at position of 0 m for 4, 8, and 11 m·s−1 outlet velocities were 0.43%, 0.71%, and 0.37%, respectively. While at position of 0.75 m, they were 0.14%, 0.59%, and 0.09%. In the distal spray regions (1.5 m, 2.25 m, and 3 m), the average coverage was below 0.1%.
Under the low FAVD condition (1.4 m2·m−3), coverage rates for the three air velocities are shown in Figure 10d–f. For adaxial surfaces at 4 m·s−1, droplet deposition showed a marked downward shift, similar to that observed in the normal-density canopy. Specifically, at the 2.25 m and 3 m positions, droplet densities above 1.6 m height were below 0.5 droplets·cm−2. The spray centers for five pipes were 1.6 m, 1.85 m, 1.35 m, 0.85 m, and 0.6 m, respectively. At 8 m·s−1, the centers were 1.6 m, 1.6 m, 1.35 m, 1.6 m, and 1.1 m, and at 11 m·s−1, they were 1.6 m, 1.6 m, 1.35 m, 1.1 m, and 0.6 m.
For abaxial surfaces, similar to the normal density canopy, droplets mainly deposited in the proximal spray zone. The average coverage rates at position of 0 m for 4, 8, and 11 m·s−1 were 0.22%, 0.26%, and 0.12%, respectively, and at position of 0.75 m, they were 0.07%, 0.26%, and 0.23%. In the distal spray regions, the average coverage remained below 0.1% for all outlet air velocities.
In summary, the three air velocities yielded distinctly different vertical patterns: 4 m·s−1 caused progressive downward spray-center shift due to insufficient momentum; 11 m·s−1 caused premature deposition on upper foliage before deeper penetration; and 8 m·s−1 maintained the center near 1.6 m with the widest coverage (0.6–2.6 m) even at distal positions. The velocity effect was clearest on abaxial surfaces at 0.75 m, where 8 m·s−1 achieved 0.59% coverage—four times that of 4 m·s−1 and six times that of 11 m·s−1—confirming its optimal balance between droplet transport and momentum control. Overall, higher velocities (8 and 11 m·s−1) produced more stable spray centers and broader coverage than 4 m·s−1, with 8 m·s−1 performing best. Under denser canopies, the spray center shifted downward with depth due to foliage-induced airflow attenuation; this shift was less pronounced in sparse canopies, where better airflow penetration allowed more consistent distribution. Abaxial deposition remained confined to the proximal zone (<0.75 m), with distal coverage below 0.1% across all conditions.
A significance analysis of abaxial leaf surface coverage under different outlet air velocities was conducted, and the results are shown in Figure 11. Under the FAVD of 3.3 m2·m−3 (Figure 11a), significant differences in abaxial coverage were generally observed between different air velocities. In the proximal spray zone (position of 0.0 m and 0.75 m), coverage at 8 m·s−1 differed significantly from that at 11 m·s−1. At the 1.5 m and 2.25 m positions, significant differences were found between 4 m·s−1 and 8 m·s−1. Furthermore, at the 3.0 m position, coverage under all three air velocity conditions differed significantly from each other. In contrast, under the FAVD of 1.4 m2·m−3 (Figure 11b), significant differences in coverage between air velocities were only observed at the 2.25 m position.
In essence, canopy density modulates the responsiveness of abaxial deposition to air velocity changes: significant velocity effects were widespread in the dense canopy but limited to the distal zone in the sparse canopy, indicating that denser canopies demand more careful velocity optimization for adequate undersurface coverage.

3.5. Deposition Result of Centrifugal and Hydraulic Spray Systems

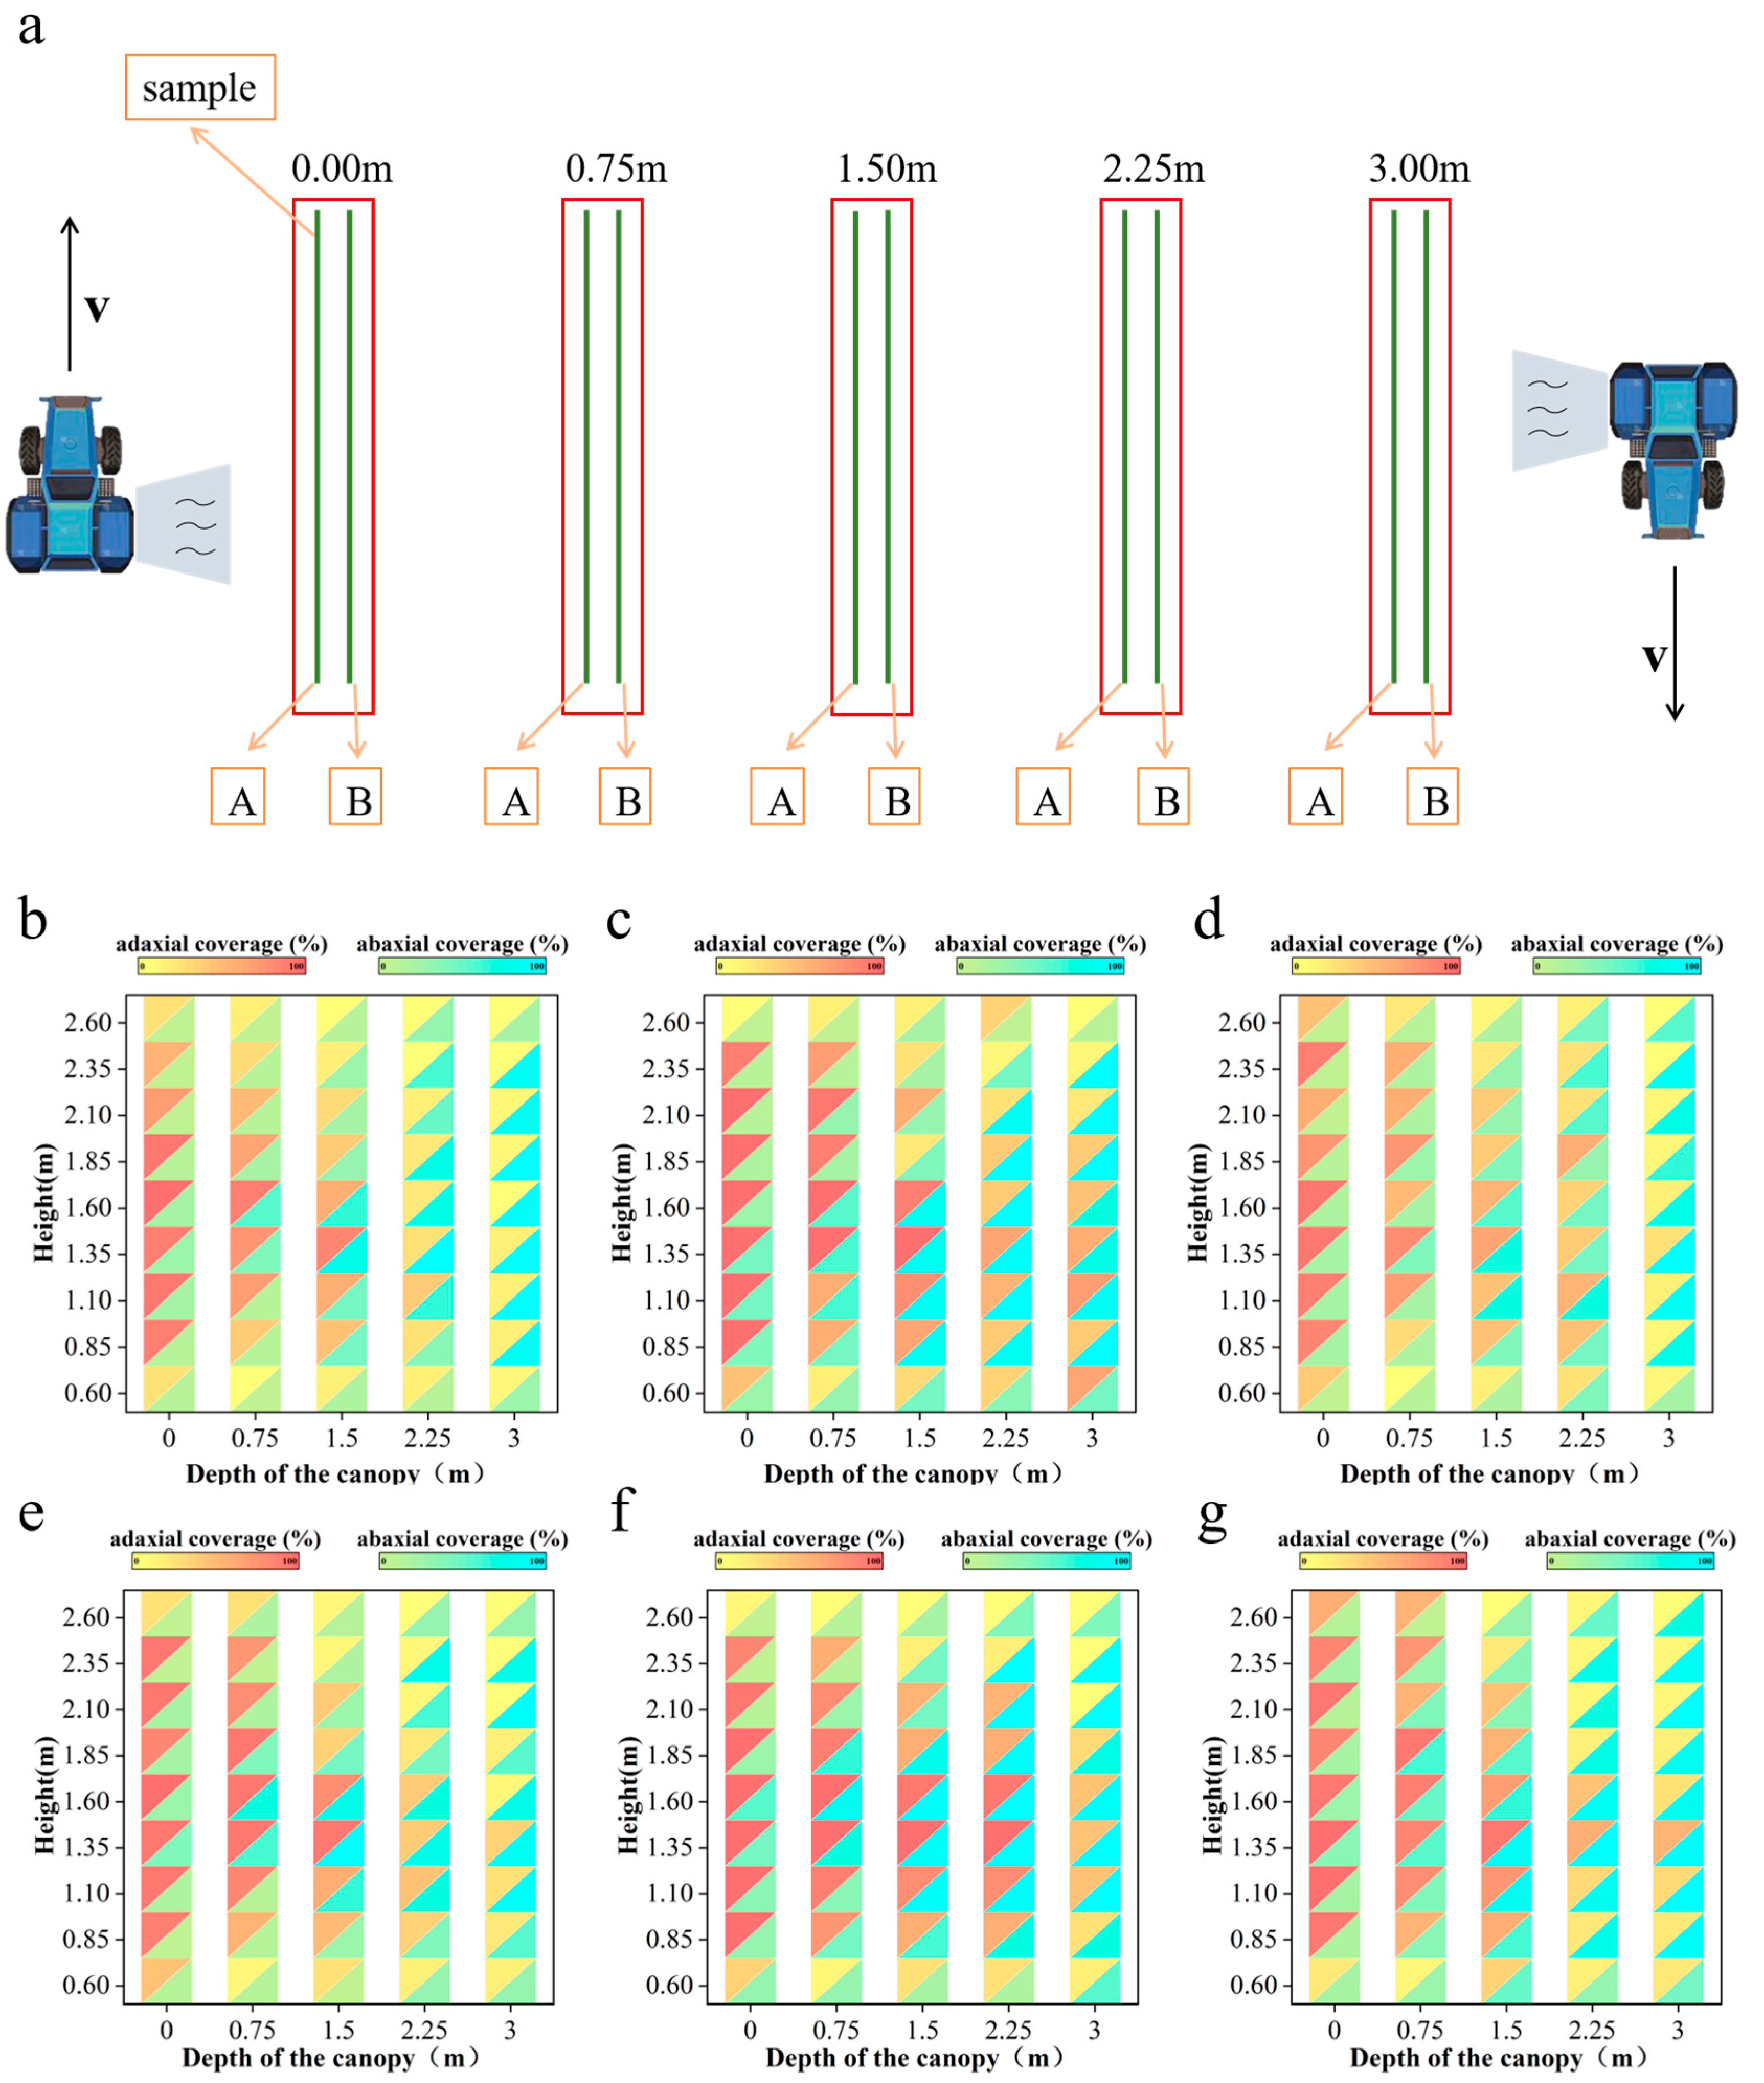
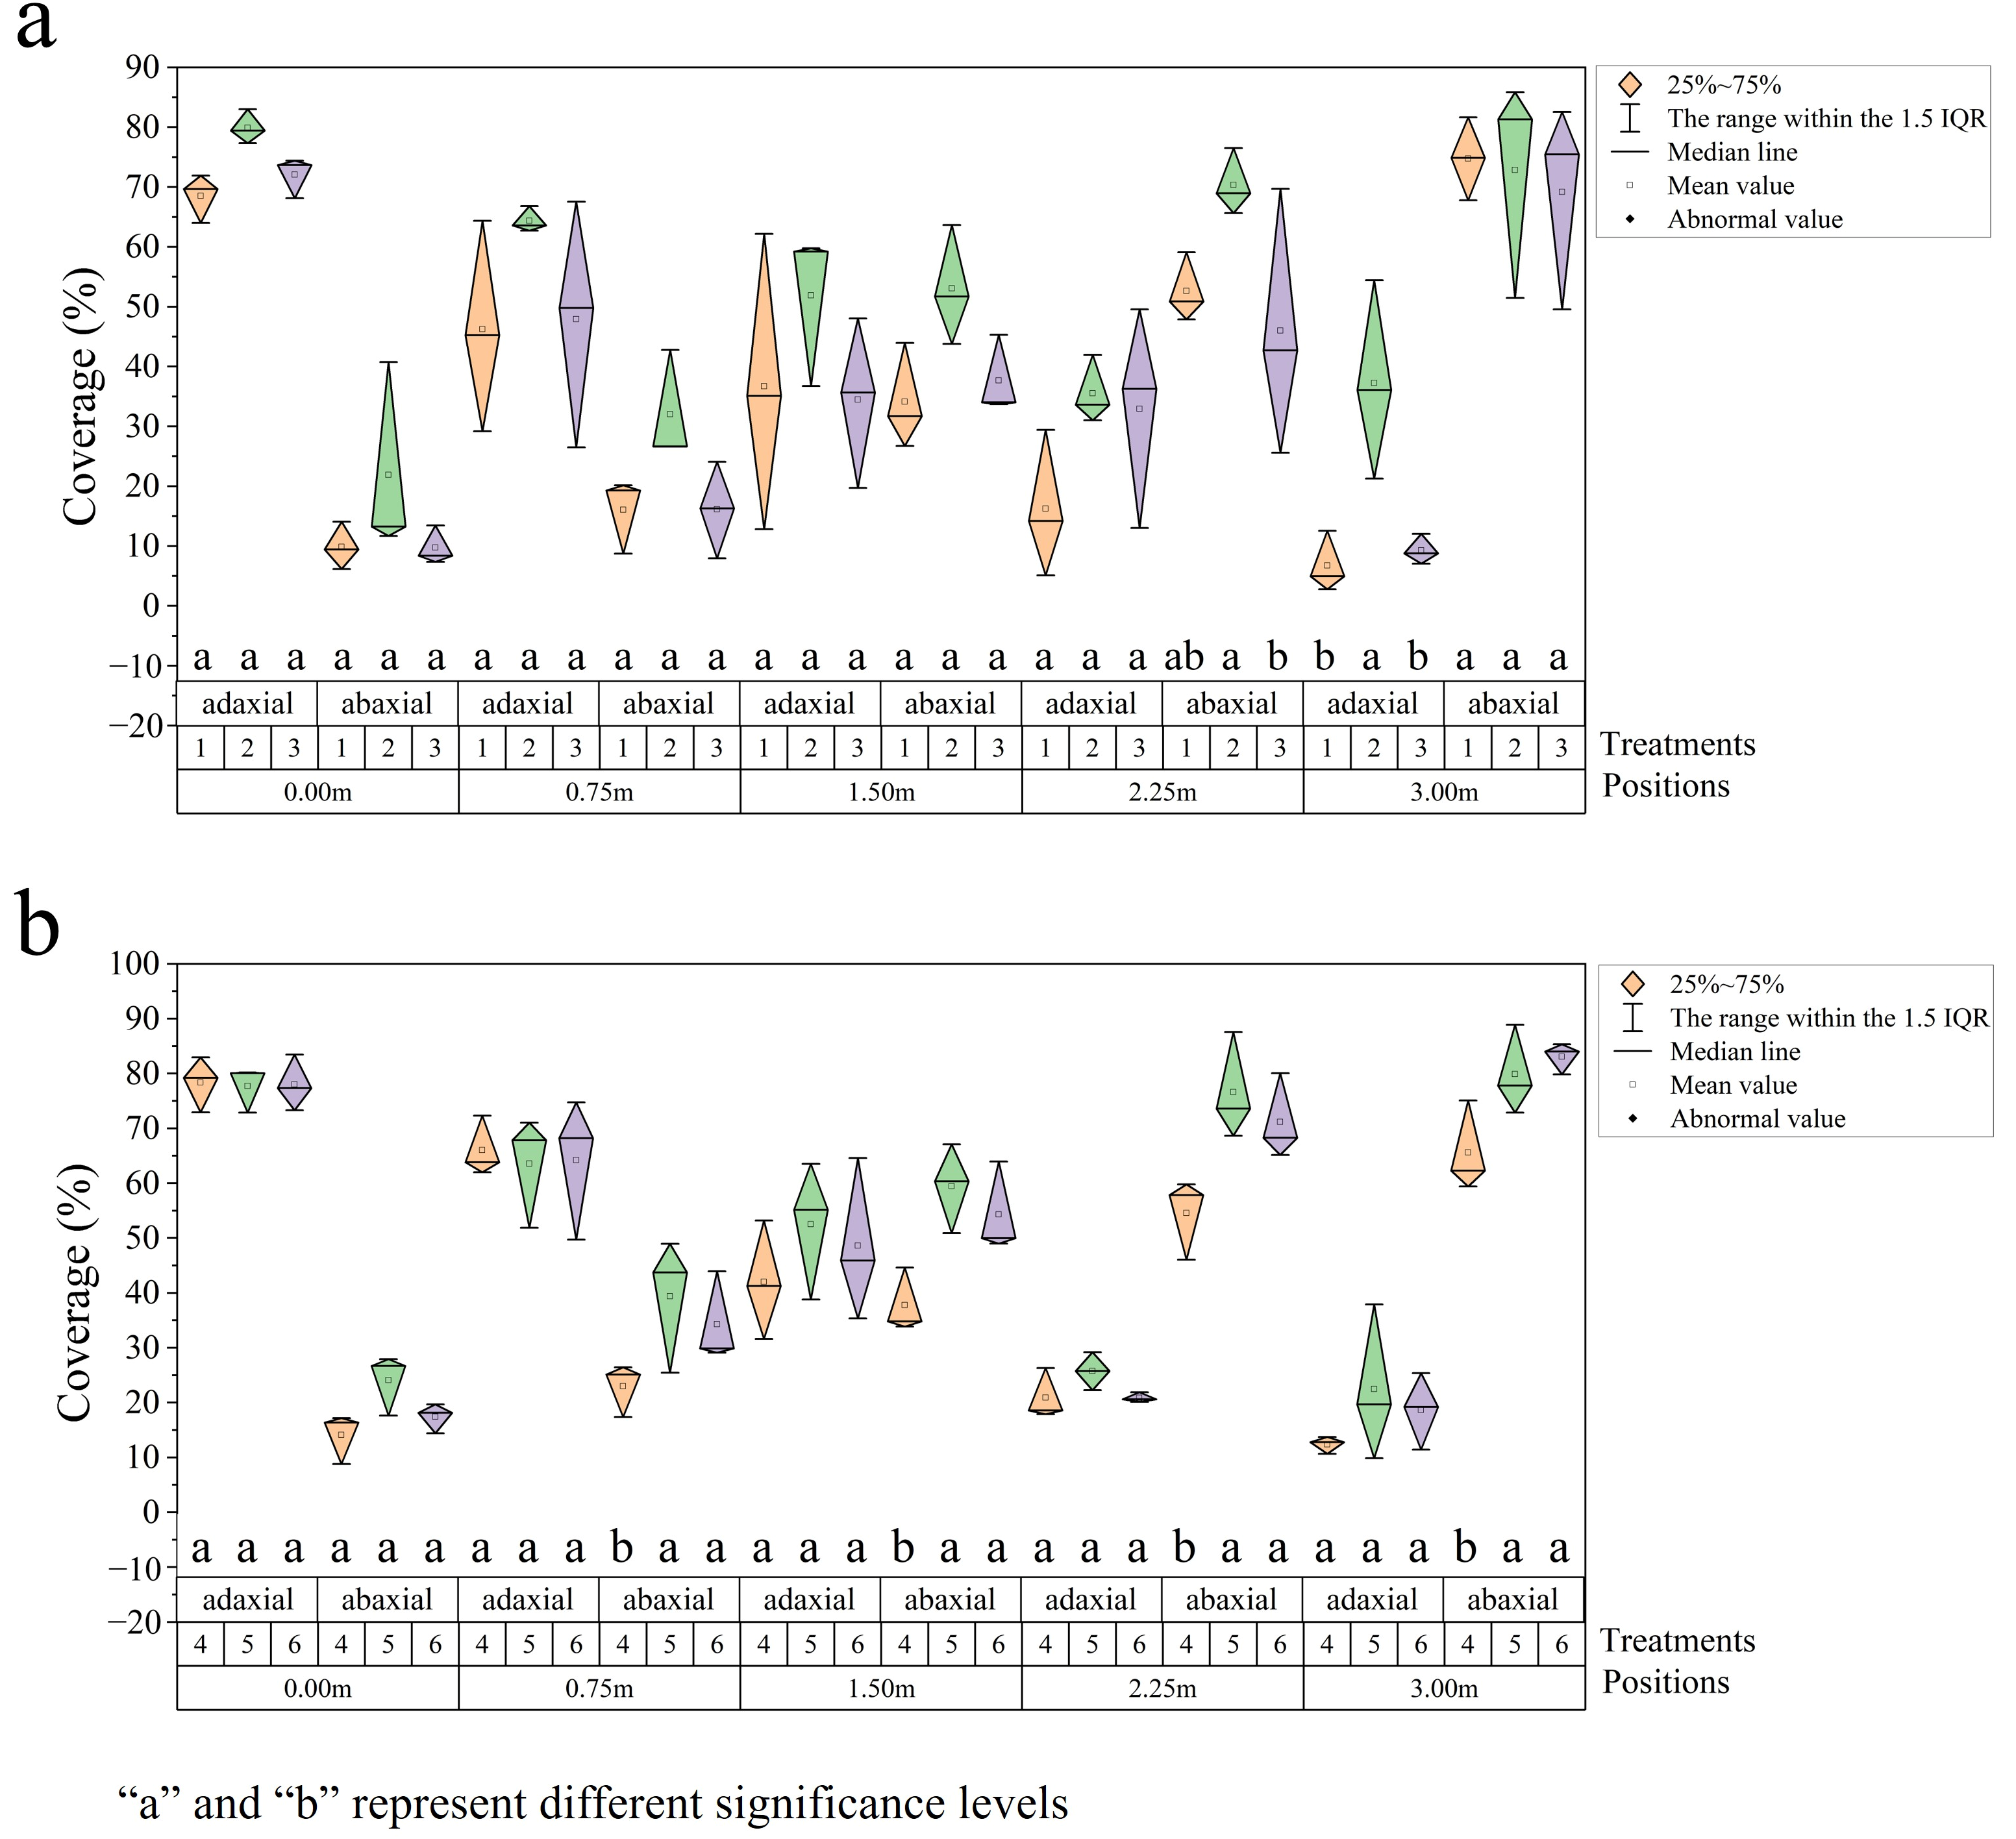
Under the FAVD of 3.3 m2·m−3, coverages for three treatments are shown in Figure 12b–d. To facilitate description and understanding, the sample orientation is defined relative to the airflow direction during spraying from the side near the pipe at 0 m. The windward side is designated as Surface A, and the leeward side as Surface B (Figure 12a). When the centrifugal nozzle operated at a flow rate of 2.6 L·min−1, the average coverage values on Surface A at positions 0–3 m were 68.5%, 46.3%, 36.7%, 16.2%, and 6.8%, respectively. The corresponding values on Surface B were 9.9%, 16.0%, 34.1%, 52.3%, and 74.9%. The data indicate that coverage on the outer canopy abaxial leaf surfaces (Surface A at 0 m and 0.75 m and Surface B at 2.25 m and 3 m) was significantly lower than in other areas. This phenomenon is likely attributable to a marked decrease in the number of droplets penetrating from the opposite side at these locations, with the droplets reaching the leaf undersides through direct flow deflection being insufficient to offset this deficit. The pattern was also observed in the other two treatments; therefore, deposition in these regions is the focus of further analysis.
Table 3 presents the coverage and droplet density at these four key positions in the outer canopy. The parameters of the six treatments are described in Table 1. The centrifugal nozzle at the reduced flow rate of 2.6 L·min−1 (treatment 1) showed coverages comparable to the hydraulic nozzle (treatment 3) at some positions but delivered notably higher droplet densities. When its flow rate was increased to 3.6 L·min−1 (treatment 2), the centrifugal nozzle achieved a substantial increase in coverage across all key positions.
Under the FAVD of 1.4 m2·m−3, coverages for three treatments are shown in Figure 12e–g. Similar to the normal-density condition, coverage on the outer canopy samples was notably lower than in other areas. The centrifugal nozzle at 3.6 L·min−1 (treatment 5) generally provided higher coverage than both its reduced-rate counterpart (treatment 4) and the hydraulic nozzle (treatment 6), while maintaining competitive droplet densities.
A significant analysis of the average coverage at different positions was conducted (p < 0.05); the results are shown in Figure 13. Under the FAVD of 3.3 m2·m−3, the centrifugal nozzle at 3.6 L·min−1 achieved significantly higher coverage on the abaxial surface at 2.25 m compared to the hydraulic nozzle. Additionally, on the adaxial surface at 3 m, the centrifugal nozzle at 3.6 L·min−1 significantly outperformed other two treatments.
Under the low FAVD of 1.4 m2·m−3, more significant differences were observed between treatment 4 and the other two treatments. At the abaxial surfaces of the 1.5 m, 2.25 m, and 3 m positions, the coverage under treatment 4 was significantly different from treatment 5 and treatment 6. Furthermore, the abaxial coverage under treatment 4 was significantly lower than treatment 5.

4. Discussion

This study developed a centrifugal air-assisted spraying system and implemented it on an orchard sprayer. Similar to conventional multi-unit orchard sprayers, droplet downward drift was also observed in this system. As the distance increased from 0.5 m to 1.5 m, droplets concentrated at lower positions. Particularly at an outlet air velocity of 4 m·s−1, almost no droplet deposition was detected above 2.0 m height at a distance of 1.5 m. This indicates a weakened coupling between the airflow and droplets, with droplet motion at this height becoming dominated by gravity. The coupling mechanism between particles and flow fields has been studied by many researchers. The Stokes number is commonly used to describe this coupling relationship—the smaller the Stokes number, the stronger the coupling between particles and the flow field. In the context of this study, the degree of coupling between the airflow and droplets is negatively correlated with air velocity and droplet size: higher air velocity and smaller droplet size result in stronger coupling [29]. Therefore, under low outlet air velocities, droplets tend to concentrate downward. To counteract this trend, adjusting the inclination angle of the spray units is an effective approach. Based on the results presented in Section 3.1, the adapted spray system exhibited a vertical spray pattern that followed a normal distribution, resembling that of conventional systems. This pattern aligns well with the spindle-shaped architecture of pear tree canopies [30], confirming that the adapted system preserves adequate vertical coverage.
In air-assisted spraying, airflow within the canopy is a critical factor that cannot be overlooked, as deposition is influenced by the interaction between leaves and airflow. In this study, the airflow gradually attenuated with increasing canopy depth, which can be attributed to two main factors: natural airflow decay and obstruction by canopy [6,31,32]. Research by Zhang et al. [30] demonstrated that foliage density significantly affects airflow attenuation within the canopy, a finding consistent with the results of this study: the airflow attenuation rate under the FAVD of 1.4 m2·m−3 was significantly lower than that under 3.3 m2·m−3. Furthermore, unlike uniform canopy models used in indoor studies, fruit tree canopies exhibit a clustered distribution with significant spatial variability in leaf density, resulting in a heterogeneous structural characteristic [33,34]. Consequently, substantial variations in airflow velocity were observed at different heights within the same canopy depth. Taking the airflow field under the FAVD of 3.3 m2·m−3 as an example, the airflow at the 2.25 m and 3 m positions displayed a “weaker in the middle, stronger on both sides” distribution pattern. This indicates that as airflow penetrates deeper into the canopy, it tends to diffuse toward areas with lower foliage density.
In recent years, pesticide application in orchards has increasingly focused on the abaxial leaf surface due to its susceptibility to pest and disease infestation. In this study, each tree was sprayed twice, once from each side. Therefore, deposition on the abaxial leaf surfaces came from two sources. These include direct, airflow-driven deposition from the same-side spray and penetration-deposition from the opposite-side spray. In the field application described in Section 2.2.3, where only unilateral spraying was performed, abaxial surface deposition relied more heavily on airflow-driven mechanisms. The results indicate that airflow-driven deposition was most prominent in the outer canopy regions (0 m and 0.75 m positions). As airflow penetrated deeper into the canopy, its diminished intensity reduced droplet transport to inner abaxial surfaces. However, higher velocity does not always improve outcomes due to a fundamental trade-off: insufficient velocity causes under-penetration, while excessive velocity promotes droplet escape and drift. These observations suggest an optimal air velocity window that balances canopy coverage with drift control, consistent with air-assisted spraying fluid dynamics. Research by Shi and Cheng [29] suggests that particles with greater inertia are more susceptible to centrifugal effects, causing them to deviate from vortex centers. In the context of this study, when outlet air velocity increased, droplet inertia also increased, potentially weakening the airflow-driven deposition effect. This is supported by the results in Section 3.4, where abaxial deposition in the outer canopy was lower at 11 m·s−1 than at 8 m·s−1. Future investigations using CFD simulations are needed to systematically quantify the relationship between airflow intensity and deposition, and to reveal the underlying mechanisms of droplet–canopy interactions.
Additionally, data showed higher airflow-driven deposition at the canopy density of 3.3 m2·m−3 than at 1.4 m2·m−3. This phenomenon occurs because denser canopies present greater airflow resistance, which promotes the formation of low-pressure zones and vortices [35,36]. These conditions subsequently favor droplet deposition via airflow-driven processes. For different types of fruit trees, the results may vary due to differences in canopy structure. For crops such as peaches and cherries, which typically have more open canopies, we expect better droplet penetration under the same conditions. In this case, the advantages of the centrifugal nozzle over the hydraulic nozzle may be diminished. Conversely, for crops with denser canopies like citrus, the centrifugal nozzle may have a greater advantage in droplet deposition and will also require higher air-assisted energy. Therefore, after further optimization of the sprayer, we will also conduct trials in other orchard crops.
In the comparative tests between the two spray system types, the centrifugal system operating at a 30% reduced application rate achieved the same coverage but higher droplet density than the hydraulic nozzle at the standard rate. This high coverage with fine droplets results from their large numbers per unit spray volume and better leaf spreading, reflecting uniform distribution rather than high mass per area. Furthermore, the deposition advantage of the centrifugal system on the abaxial leaf surfaces was more pronounced under higher canopy density conditions. This is because the centrifugal system improves abaxial leaf deposition through airflow deflection and low droplet inertia. Uncharged droplets follow the airflow, which bends around leaf edges; finer droplets with lower inertia better track these deflected streamlines to reach abaxial surfaces, whereas larger droplets resist deflection and deposit on windward surfaces. This underscores the importance of air-assist energy and fine droplets for abaxial coverage. This conclusion is consistent with our previous findings in UAV-based spraying, where droplets of 40 μm achieved significantly higher deposition on abaxial leaf surfaces than those of 100 μm [28]. However, it is important to note that smaller droplets have a higher drift potential [37,38]. Therefore, future research must include a dedicated drift evaluation to assess and mitigate the associated risks.
Energy consumption is an important practical consideration. In this study, the hydraulic nozzles required a diaphragm pump consuming approximately 600 W, while each centrifugal atomizer consumed 235 W. Including the auxiliary airflow fan, the total power consumption was approximately 1.6 kW for the hydraulic system and 2.8 kW for the centrifugal system. Based on typical operating parameters (2.5 km/h), this corresponds to an estimated energy consumption of 1.6 kWh·ha−1 and 2.8 kWh·ha−1, respectively. The centrifugal system thus achieves better deposition performance at the cost of approximately 75% higher energy consumption. However, this trade-off is justified by its improved canopy penetration and abaxial coverage, which can enhance biological control efficacy and reduce pesticide waste. The choice between systems should therefore be guided by specific orchard canopy conditions. Given that the energy difference is primarily attributable to nozzle design, future work will focus on optimizing the centrifugal nozzle to reduce its power consumption.
In conclusion, centrifugal nozzles may hold significant potential for efficient agriculture, owing to their narrow droplet size spectrum and low-pressure operation, which minimize drift while improving target deposition efficiency.

5. Conclusions

This study integrated centrifugal nozzles into a centrifugal air-assisted spray system, developing a novel centrifugal air-assisted spraying system. Experimental results demonstrated that the fine droplets generated by this system exhibited excellent adaptability within pear tree canopies. At an outlet air velocity of 8 m·s−1, the system achieved optimal droplet distribution and higher coverage on the abaxial leaf surfaces in the outer canopy regions. The centrifugal system consistently outperformed the hydraulic system in terms of abaxial deposition, with higher coverage observed at sampling positions in the proximal and middle canopy zones. Even when the application volume was reduced by 30%, the centrifugal system maintained higher droplet density than the hydraulic system, confirming its potential for pesticide reduction. However, the smaller drops generated by the centrifugal system raise questions about increased off-target droplet movement via wind currents. Therefore, future work should systematically evaluate drift potential under varying wind speeds and directions. This spray system provides an effective technical solution for achieving high-efficiency pest control and reducing pesticide usage while maintaining efficacy in orchard applications.

Author Contributions

Conceptualization, J.S. and S.X.; methodology, S.X.; software, Y.L.; validation, Z.G. and P.Q.; formal analysis, S.X. and Z.G.; investigation, S.X.; resources, J.S.; data curation, S.X.; writing—original draft preparation, S.X.; writing—review and editing, S.X. and Z.G.; visualization, S.X.; supervision, J.S.; funding acquisition, J.S. All authors have read and agreed to the published version of the manuscript.

Funding

This research was supported by Zhejiang Provincial Natural Science Foundation for Young Scientists (Grant No. LQN26C140001), and Ningbo Top Discipline of Biological Engineering (DZS2025012).

Data Availability Statement

The data that support the findings of this study are available from the corresponding author upon reasonable request.

Conflicts of Interest

The authors declare no competing interests.

References

  1. Chen, Y.; Ozkan, H.E.; Zhu, H.; Derksen, R.C.; Krause, C.R. Spray Deposition Inside Tree Canopies from a Newly Developed Variable-rate Air-assisted Sprayer. Trans. ASABE 2013, 56, 1263–1272. [Google Scholar]
  2. Gil, E.; Ortega, P.; Salas, B. Development of a methodology to select the optimal application technologies in apple crop-EU Project OPTIMA-H2020. Asp. Appl. Biol. 2020, 144, 67–75. [Google Scholar]
  3. An, Q.; Li, D.; Wu, Y.; Pan, C. Deposition and Distribution of Myclobutanil and Tebuconazole in a Semidwarf Apple Orchard by Hand-Held Gun and Air-Assisted Sprayer Application. Pest Manag. Sci. 2020, 76, 4123–4130. [Google Scholar] [CrossRef] [PubMed]
  4. Grella, M.; Marucco, P.; Zwertvaegher, I.; Gioelli, F.; Bozzer, C.; Biglia, A.; Manzone, M.; Caffini, A.; Fountas, S.; Nuyttens, D.; et al. The Effect of Fan Setting, Air-Conveyor Orientation and Nozzle Configuration on Airblast Sprayer Efficiency: Insights Relevant to Trellised Vineyards. Crop Prot. 2022, 155, 105921. [Google Scholar] [CrossRef]
  5. Miranda-Fuentes, A.; Rodriguez-Lizana, A.; Cuenca, A.; Gonzalez-Sanchez, E.J.; Blanco-Roldan, G.L.; Gil-Ribes, J.A. Improving Plant Protection Product Applications in Traditional and Intensive Olive Orchards through the Development of New Prototype Air-Assisted Sprayers. Crop Prot. 2017, 94, 44–58. [Google Scholar] [CrossRef]
  6. Qiu, W.; Li, X.; Li, C.; Ding, W.; Lv, X.; Liu, Y. Design and Test of a Novel Crawler-Type Multi-Channel Air-Assisted Orchard Sprayer. Int. J. Agric. Biol. Eng. 2020, 13, 60–67. [Google Scholar] [CrossRef]
  7. Li, Z.; Wang, X.; Li, C.; Lan, H.; He, Y.; Tang, Z.; Tang, Y. Performance Analysis and Testing of a Multi-Duct Orchard Sprayer. Agronomy 2023, 13, 1815. [Google Scholar] [CrossRef]
  8. Li, T.; Qi, P.; Wang, Z.; Xu, S.; Huang, Z.; Han, L.; He, X. Evaluation of the Effects of Airflow Distribution Patterns on Deposit Coverage and Spray Penetration in Multi-Unit Air-Assisted Sprayer. Agronomy 2022, 12, 944. [Google Scholar] [CrossRef]
  9. Blanco, M.N.; Fenske, R.A.; Kasner, E.J.; Yost, M.G.; Seto, E.; Austin, E. Real Time Monitoring of Spray Drift from Three Different Orchard Sprayers. Chemosphere 2019, 222, 46–55. [Google Scholar] [CrossRef] [PubMed]
  10. Hoch, H.C.; Staples, R.C.; Whitehead, B.; Comeau, J.; Wolf, E.D. Signaling for Growth Orientation and Cell Differentiation by Surface Topography in Uromyces. Science 1987, 235, 1659–1662. [Google Scholar] [CrossRef] [PubMed]
  11. Underwood, W.; Melotto, M.; He, S.Y. Role of Plant Stomata in Bacterial Invasion. Cell. Microbiol. 2007, 9, 1621–1629. [Google Scholar] [CrossRef] [PubMed]
  12. Guimarães, R.L.; Stotz, H.U. Oxalate Production by Sclerotinia Sclerotiorum Deregulates Guard Cells during Infection. Plant Physiol. 2004, 136, 3703–3711. [Google Scholar] [CrossRef] [PubMed]
  13. Zhu, Y.-G.; Xiong, C.; Wei, Z.; Chen, Q.-L.; Ma, B.; Zhou, S.-Y.-D.; Tan, J.; Zhang, L.-M.; Cui, H.-L.; Duan, G.-L. Impacts of Global Change on the Phyllosphere Microbiome. New Phytol. 2022, 234, 1977–1986. [Google Scholar] [CrossRef] [PubMed]
  14. Abdelbagi, H.A.; Adams, A.J. Influence of Droplet Size, Air-Assistance and Electrostatic Charge upon the Distribution of Ultra-Low-Volume Sprays on Tomatoes. Crop Prot. 1987, 6, 226–233. [Google Scholar] [CrossRef]
  15. Maski, D.; Durairaj, D. Abaxial Deposition and Biological Efficacy of Electrostatically Charged Spray. In Proceedings of the ASABE Annual International Meeting, Portland, OR, USA, 9–12 July 2006. [Google Scholar]
  16. Maski, D.; Durairaj, D. Effects of Charging Voltage, Application Speed, Target Height, and Orientation upon Charged Spray Deposition on Leaf Abaxial and Adaxial Surfaces. Crop Prot. 2010, 29, 134–141. [Google Scholar] [CrossRef]
  17. Gan-Mor, S.; Ronen, B.; Ohaliav, K. The Effect of Air Velocity and Proximity on the Charging of Sprays from Conventional Hydraulic Nozzles. Biosyst. Eng. 2014, 121, 200–208. [Google Scholar] [CrossRef]
  18. Zhang, L.; Wang, J.; Fan, Y.; Wang, Y. Coacervate-Enhanced Deposition of Sprayed Pesticide on Hydrophobic/Superhydrophobic Abaxial Leaf Surfaces. Adv. Sci. 2023, 10, 2300270. [Google Scholar] [CrossRef] [PubMed]
  19. Kemal, A.; Ali, B. Determining effects of induction electrode geometry on charging efficiency of droplets in pesticide electrostatic spraying applications. Smart Agric. Technol. 2023, 4, 100190. [Google Scholar] [CrossRef]
  20. Dario, G.; Precipito, L.M.B.; Oliveira, J.V.D.; Lucilhia, L.V.D.S.; de Oliveira, R.B. Application Techniques of Pesticides in Greenhouse Tomato Crops. Hortic. Bras. 2020, 38, 146–152. [Google Scholar] [CrossRef]
  21. Xu, S.; Feng, Y.; Han, L.; Ran, X.; Zhong, Y.; Jin, Y.; Song, J. Evaluation of the Wind Field and Deposition Effect of a Novel Air-Assisted Strawberry Sprayer. Agriculture 2023, 13, 230. [Google Scholar] [CrossRef]
  22. Prokop, M.; Veverka, K. Influence of Droplet Spectra on the Efficiency of Contact Fungicides and Mixtures of Contact and Systemic Fungicides. Plant Prot. Sci. 2006, 42, 26–33. [Google Scholar] [CrossRef]
  23. Liu, Q.; Shan, C.; Zhang, H.; Song, C.; Lan, Y. Evaluation of Liquid Atomization and Spray Drift Reduction of Hydraulic Nozzles with Four Spray Adjuvant Solutions. Agriculture 2023, 13, 236. [Google Scholar] [CrossRef]
  24. Yu, J.; Xu, X.; Duan, J.; Jiang, Y.; Yuan, H.; Liang, H.; Jing, S.; Yang, Z. Effect of Operational Parameters on Droplet Deposition Characteristics Using an Unmanned Aerial Vehicle for Banana Canopy. Front. Plant Sci. 2025, 15, 1491397. [Google Scholar] [CrossRef] [PubMed]
  25. Wang, G.; Han, Y.; Li, X.; Andaloro, J.; Chen, P.; Hoffmann, W.C.; Han, X.; Chen, S.; Lan, Y. Field Evaluation of Spray Drift and Environmental Impact Using an Agricultural Unmanned Aerial Vehicle (UAV) Sprayer. Sci. Total Environ. 2020, 737, 139793. [Google Scholar] [CrossRef] [PubMed]
  26. Hu, H.; Kaizu, Y.; Huang, J.; Furuhashi, K.; Zhang, H.; Xiao, X.; Li, M.; Imou, K. Design and Performance Test of a Novel UAV Air-Assisted Electrostatic Centrifugal Spraying System. Int. J. Agric. Biol. Eng. 2022, 15, 34–40. [Google Scholar] [CrossRef]
  27. Zhu, Z.; Yang, M.; Li, Y.; Wongsuk, S.; Zhao, C.; Xu, L.; Zhang, Y.; He, X.; Wang, C. Optimization Design and Atomization Performance of a Multi-Disc Centrifugal Nozzle for Unmanned Aerial Vehicle Sprayer. Agronomy 2024, 14, 2914. [Google Scholar] [CrossRef]
  28. Xu, S.; Jin, Y.; Zhong, Y.; Luo, L.; Song, J. Evaluation of Spraying Characteristics of a New Multiple Centrifugal Nozzle Applied to UAV. Comput. Electron. Agric. 2025, 237, 110712. [Google Scholar] [CrossRef]
  29. Shi, Y.; Cheng, Y. Numerical Simulation of Particle Flow around the Impulsive Monopile. Ocean. Eng. 2024, 292, 116621. [Google Scholar] [CrossRef]
  30. Zhang, C.; Zhou, H.; Xu, L.; Ru, Y.; Ju, H.; Chen, Q. Wind Tunnel Study of the Changes in Drag and Morphology of Three Fruit Tree Species during Air-Assisted Spraying. Biosyst. Eng. 2022, 218, 153–162. [Google Scholar] [CrossRef]
  31. Shi, R.; Sun, H.; Qiu, W.; Lv, X.; Ahmad, F.; Gu, J.; Yu, H.; Zhang, Z. Analysing Airflow Velocity in the Canopy to Improve Droplet Deposition for Air-Assisted Spraying: A Case Study on Pears. Agronomy 2022, 12, 2424. [Google Scholar] [CrossRef]
  32. Feng, F.; Dou, H.; Zhai, C.; Zhang, Y.; Zou, W.; Hao, J. Design and Experiment of Orchard Air-Assisted Sprayer with Airflow Graded Control. Agronomy 2025, 15, 95. [Google Scholar] [CrossRef]
  33. Calders, K.; Armston, J.; Newnham, G.; Herold, M.; Goodwin, N. Implications of Sensor Configuration and Topography on Vertical Plant Profiles Derived from Terrestrial LiDAR. Agric. For. Meteorol. 2014, 194, 104–117. [Google Scholar] [CrossRef]
  34. Kaasalainen, S.; Krooks, A.; Liski, J.; Raumonen, P.; Kaartinen, H.; Kaasalainen, M.; Puttonen, E.; Anttila, K.; Makipaa, R. Change Detection of Tree Biomass with Terrestrial Laser Scanning and Quantitative Structure Modelling. Remote Sens. 2014, 6, 3906–3922. [Google Scholar] [CrossRef]
  35. Saltara, F.; D’Agostini Neto, A.; Lopez, J.I.H. 3D CFD Simulation of Vortex-Induced Vibration of Cylinder. Int. J. Offshore Polar Eng. 2011, 21, 192–197. [Google Scholar]
  36. Sayeed-Bin-Asad, S.M.; Lundstroem, T.S.; Andersson, A.G. Study the Flow behind a Semi-Circular Step Cylinder (Laser Doppler Velocimetry (LDV) and Computational Fluid Dynamics (CFD)). Energies 2017, 10, 332. [Google Scholar] [CrossRef]
  37. Chen, S.; Lan, Y.; Zhou, Z.; Ouyang, F.; Wang, G.; Huang, X.; Deng, X.; Cheng, S. Effect of Droplet Size Parameters on Droplet Deposition and Drift of Aerial Spraying by Using Plant Protection UAV. Agronomy 2020, 10, 195. [Google Scholar] [CrossRef]
  38. Lan, X.; Wang, J.; Chen, P.; Liang, Q.; Zhang, L.; Ma, C. Risk Assessment of Environmental and Bystander Exposure from Agricultural Unmanned Aerial Vehicle Sprayers in Golden Coconut Plantations: Effects of Droplet Size and Spray Volume. Ecotoxicol. Environ. Saf. 2024, 282, 116675. [Google Scholar] [CrossRef] [PubMed]
Figure 1. The modified orchard air-assisted sprayer: one side was equipped with four centrifugal air-assisted spraying units; the other side was fitted with four conventional hydraulic spray units.
Agronomy 16 01251 g001
Figure 2. Schematic diagram of the control and distribution system for the air-assisted sprayer. (a) schematic diagram of electrical control and distribution; (b) schematic diagram of waterway control and distribution.
Agronomy 16 01251 g002
Figure 3. Schematic diagram of the vertical deposition distribution test of the centrifugal spray system. (a) Structure chart of the vertical patternator. (b) The angle of spray unit; (c) field test of the vertical deposition distribution.
Agronomy 16 01251 g003
Figure 4. The experimental pear orchard at the Tianping Lake Base of the Shandong Institute of Pomology (Tai’an, China).
Agronomy 16 01251 g004
Figure 5. Measurement of canopy FAVD. (a) The distribution of the counting points within the canopy. (b) The leaves enclosed within the white frame were counted to calculate FAVD.
Agronomy 16 01251 g005
Figure 6. Schematic of wind field measurement within the canopy.
Agronomy 16 01251 g006
Figure 7. The sample arrangement method and the field operation of centrifugal air-assisted spray system. (a) Schematic of the kromekote card layout. (b) Application route of the sprayer during deposition testing of a single centrifugal spray unit. (c) Field photograph of the sprayer during application. (d) Application route of the sprayer during the deposition comparison test between centrifugal and hydraulic spray systems.
Agronomy 16 01251 g007
Figure 8. Vertical droplet distribution under three different outlet air velocities. (a) The outlet air velocity is 4 m·s−1. (b) The outlet air velocity is 8 m·s−1. (c) The outlet air velocity is 11 m·s−1.
Agronomy 16 01251 g008
Figure 9. Airflow distribution within canopies under two leaf density conditions. (a) The leaf density is 3.3 m2·m−3. (b) The leaf density is 1.4 m2·m−3.
Agronomy 16 01251 g009
Figure 10. Droplet deposition distribution in the canopy from a single centrifugal nozzle. The segmented heatmaps illustrate droplet deposition on both adaxial and abaxial leaf surfaces at different canopy positions. In the figure, red represents deposition on adaxial surfaces, while blue represents deposition on abaxial surfaces. The horizontal axis denotes the sampling position relative to canopy depth, and the vertical axis indicates the sampling height above the ground. (a) The deposition characteristics of 4 m·s−1 outlet velocity under the leaf density of 3.3 m2·m−3. (b) The deposition characteristics of 8 m·s−1 outlet velocity under the leaf density of 3.3 m2·m−3. (c) The deposition characteristics of 11 m·s−1 outlet velocity under the leaf density of 3.3 m2·m−3. (d) The deposition characteristics of 4 m·s−1 outlet velocity under the leaf density of 1.4 m2·m−3. (e) The deposition characteristics of 8 m·s−1 outlet velocity under the leaf density of 1.4 m2·m−3. (f) The deposition characteristics of 11 m·s−1 outlet velocity under the leaf density of 1.4 m2·m−3.
Agronomy 16 01251 g010
Figure 11. Coverage and significance on abaxial leaf surfaces at different outlet air velocities. (a) The FAVD is 3.3 m2·m−3. (b) The FAVD is 1.4 m2·m−3.
Agronomy 16 01251 g011
Figure 12. Deposition characteristics of different treatments under two FAVD conditions. The segmented heatmaps illustrate droplet deposition on both adaxial and abaxial leaf surfaces at different canopy positions. In the figure, yellow-red colors represent deposition on adaxial surfaces, while gren-blue colors represent deposition on abaxial surfaces. The horizontal axis denotes the sampling position relative to canopy depth, and the vertical axis indicates the sampling height above the ground. (a) The definition of the sample orientation. (b) Deposition characteristics of the centrifugal nozzle at 2.6 L·min−1 under a FAVD of 3.3 m2·m−3 (treatment 1). (c) Deposition characteristics of the centrifugal nozzle at 3.6 L·min−1 under a FAVD of 3.3 m2·m−3 (treatment 2). (d) Deposition characteristics of the hydraulic nozzle at 3.6 L·min−1 under a FAVD of 3.3 m2·m−3 (treatment 3). (e) Deposition characteristics of the centrifugal nozzle at 2.6 L·min−1 under a FAVD of 1.4 m2·m−3 (treatment 4). (f) Deposition characteristics of the centrifugal nozzle at 3.6 L·min−1 under a FAVD of 1.4 m2·m−3 (treatment 5). (g) Deposition characteristics of the hydraulic nozzle at 3.6 L·min−1 under a FAVD of 3.3 m2·m−3 (treatment 6).
Agronomy 16 01251 g012
Figure 13. Average coverage at different positions. (a) Average coverage under the FAVD of 3.3 m2·m−3. (b) Average coverage under the FAVD of 1.4 m2·m−3. (Treatment 1 represents the centrifugal nozzle at 2.6 L·min−1 under a FAVD of 3.3 m2·m−3. Treatment 2 represents the centrifugal nozzle at 3.6 L·min−1 under a FAVD of 3.3 m2·m−3. Treatment 3 represents the hydraulic nozzle at 3.6 L·min−1 under a FAVD of 3.3 m2·m−3. Treatment 4 represents the centrifugal nozzle at 2.6 L·min−1 under a FAVD of 1.4 m2·m−3. Treatment 5 represents the centrifugal nozzle at 3.6 L·min−1 under a FAVD of 1.4 m2·m−3. Treatment 6 represents the hydraulic nozzle at 3.6 L·min−1 under a FAVD of 1.4 m2·m−3).
Agronomy 16 01251 g013
Table 1. Treatment settings for the deposition evaluation of two spray systems.
TreatmentsSpray SystemPressure (kPa)Flow Rate per Nozzle
(L·min−1)
Total Flow Rate
(L·min−1)
FAVD
(m2·m−3)
1centrifugal/0.652.63.3
2centrifugal/0.93.63.3
3hydraulic4000.93.63.3
4centrifugal/0.652.61.4
5centrifugal/0.93.61.4
6hydraulic4000.93.61.4
Table 2. Average leaf area, leaf number, and, as would be expected, FAVD in different leaf density zones.
TreesTree 1Tree 2Tree 3FVAD (m2·m−3)
ParametersLeaf Area (cm2)Leaf AmountLeaf Area (cm2)Leaf AmountLeaf Area (cm2)Leaf Amount
Normal leaf density44.386641.996342.410633.3
Low leaf density43.938741.341442.14271.4
Table 3. Coverage and droplet density at four key positions under different treatments.
TreatmentsSurface B at 0.0 mSurface B at 0.75 mSurface A at 2.25 mSurface A at 3.0 m
Coverage
(%)
Droplet Density
(Droplets·cm−2)
Coverage
(%)
Droplet Density
(Droplets·cm−2)
Coverage
(%)
Droplet Density
(Droplets·cm−2)
Coverage
(%)
Droplet Density
(Droplets·cm−2)
19.9 (6.7)177.6 (52.3)16.0 (16.1)166.8 (34.0)6.8 (3.7)114.4 (49.1)16.2 (10.2)168.5 (64.1)
221.9 (15.6)148.5 (48.5)32.0 (20.4)135.6 (67.3)36.6 (21.9)151.3 (45.4)35.5 (14.7)108.8 (26.8)
39.8 (6.0)119.1 (40.8)16.1 (9.0)135.3 (18.3)9.3 (6.2)138.1 (72.0)33.0 (14.4)84.0 (21.6)
414.1 (11.2)128.2 (63.6)23.0 (23.6)124.8 (51.4)20.9 (14.5)170.8 (53.5)12.4 (9.5)147.9 (56.5)
524.1 (16.0)161.6 (54.5)39.4 (24.9)114.8 (56.2)52.5 (32.5)120.7 (50.1)22.5 (16.9)124.4 (82.5)
617.4 (6.5)156.3 (32.7)34.3 (15.2)101.3 (28.7)20.9 (17.9)142.4 (43.7)18.7 (14.4)134.6 (36.8)
The standard deviation is indicated in parentheses.
Disclaimer/Publisher’s Note: The statements, opinions and data contained in all publications are solely those of the individual author(s) and contributor(s) and not of MDPI and/or the editor(s). MDPI and/or the editor(s) disclaim responsibility for any injury to people or property resulting from any ideas, methods, instructions or products referred to in the content.