Article

Evolution of Climate–Agriculture Research from 1990 to 2025: A Large-Scale Bibliometric and Semantic Mapping Analysis


by
Estrella Alcalá-Espinosa
* and
Adolfo Peña-Acevedo
Department of Rural Engineering, Civil Constructions and Engineering Projects, Higher Technical School of Agricultural and Forestry Engineering (ETSIAM), University of Cordoba, Rabanales University Campus, 14071 Cordoba, Spain
*
Author to whom correspondence should be addressed.
Agronomy 2026, 16(13), 1223; https://doi.org/10.3390/agronomy16131223
Submission received: 12 May 2026 / Revised: 18 June 2026 / Accepted: 22 June 2026 / Published: 24 June 2026

Abstract

Climate change is reshaping agricultural systems by altering temperature and rainfall regimes, increasing the frequency of extreme events, and intensifying risks to crop productivity, water use, and farm decision-making. As climate–agriculture research expands rapidly, it becomes increasingly difficult to identify consolidated knowledge domains, emerging priorities, and evidence gaps. This study maps the structure and evolution of this literature using 219,261 Scopus-indexed documents selected from 290,560 records published between 1990 and 2025. A text-mining workflow combined BERTopic-based semantic modeling with supervised thematic classification into 18 macro-themes, while annual shares, z-scores, and document-level primary–secondary co-framing were used to assess temporal salience and cross-theme coupling. The results show sustained growth in research output, with 53.67% of publications produced between 2016 and 2025, and strong geographical concentration in the United States and China, which together account for 41.98% of the corpus. Hydrology and water management, crop production, impact assessment, and atmospheric processes remain central pillars, while socio-economic vulnerability, food security, sustainability, biotechnology, and greenhouse gas mitigation have gained prominence. The resulting evidence map provides a reproducible overview of the climate–agriculture knowledge landscape and can support research prioritization and policy design for climate-resilient agrifood systems.

1. Introduction

Climate change represents one of the most pressing socio-ecological threats affecting human and natural systems, with documented and projected impacts across ecosystems, economies, and societies [1,2]. According to the Sixth Assessment Report of the Intergovernmental Panel on Climate Change (IPCC), an estimated 3.3 to 3.6 billion people already live in contexts highly vulnerable to climate change, facing combined risks to health, infrastructure, livelihoods, and access to food and water [2,3,4].
Primary production systems, including crops, livestock, forestry, fisheries, and aquaculture, are directly affected by changes in temperature and precipitation patterns, altered seasonality, and the increasing frequency of extreme events such as droughts, floods, and heatwaves [5,6]. These biophysical changes are closely linked to socio-economic outcomes, as agriculture supports income and employment for a significant portion of the global population [7], and is fundamental to food security, nutrition, and rural development [8,9]. International bodies, including FAO and IPCC, have accordingly called for coordinated action across the agri-food system, integrating adaptation and mitigation strategies while protecting livelihoods and improving water and land management [10].
Academic interest in the climate–agriculture nexus has intensified alongside the increasing urgency of the climate crisis. Over the past three decades, scientific output addressing climate change and agriculture has expanded substantially across the broader climate sciences [11]. Multiple bibliometric studies have documented this expansion, particularly since the mid-2000s [4,12]. These studies have mapped key topics, including climate impacts on crop yields, greenhouse gas emissions from land use, climate-smart agriculture, and food security. Researchers have frequently employed co-occurrence networks and visualization tools, including VOSviewer and bibliometrix, to analyze patterns among authors, countries, and keywords [7,12,13,14,15]. Nevertheless, significant analytical gaps remain, limiting the capacity to draw synthesis-level conclusions from the expanding body of work.
These analytical gaps take three forms. Many studies focus on specific crops, technologies, regions, or policy concepts, providing detailed insights but impeding the development of a comprehensive, cross-sectoral understanding of climate change and agriculture [4,7,12]. Moreover, most analyses rely on descriptive statistics, trend lines, and network-based co-occurrence maps, which, while useful for visualizing collaboration and keyword prominence, are less effective at uncovering latent thematic structures or tracking their evolution in a statistically robust manner [7,12]. Additionally, most co-occurrence evidence in prior bibliometric work is keyword-based, which maps term prominence but does not directly quantify how document-level thematic frames are combined. This limitation restricts the ability to observe which agronomic problems, technologies, and socio-economic perspectives are jointly addressed within the same publications. A document-level co-framing measure is therefore required to complement latent thematic extraction and temporal saliency indicators. The absence of a coherent theoretical framework further impedes the formulation of unified strategies for policymakers and practitioners. For example, policy misalignment may occur when local governance does not recognize the integrated nature of climate–agriculture challenges, resulting in suboptimal resource allocation that neither mitigates impacts nor supports adaptation [16]. A third limitation concerns the rapid increase in publication volume, which introduces methodological challenges, as aggregated metrics by topic and year can obscure subtle shifts in thematic focus, complicating temporal analysis. To address this, relative shares and normalized intensities are necessary to distinguish between expansion and genuine thematic reorientation [17]. Without addressing these gaps, important thematic shifts, such as a growing focus on social vulnerability or a reconfiguration of mitigation strategies, risk going unnoticed in aggregated metrics. Closing these gaps is necessary for translating the evidence base into effective climate–agriculture policy guidance.
We address these limitations through a text-based science-mapping approach grounded in Natural Language Processing (NLP) [11]. Topic modeling and semantic methods provide computational tools for analyzing large document collections, enabling the identification of regularities in term usage and thematic patterns that support corpus-level annotation and longitudinal tracking [18]. Within this framework, the objective is to describe how scientific literature organizes and connects technologies, risks, and solutions over time.
Specifically, this article uses a pipeline based on BERTopic [19], a neural topic modeling framework that combines contextual document embeddings from BERT [20] with UMAP dimensionality reduction [21], HDBSCAN density-based clustering [22], and c-TF-IDF topic representations. BERTopic was preferred over classical methods such as Latent Dirichlet Allocation (LDA) [23] and Latent Semantic Analysis (LSA) [24] because it leverages contextualized language model embeddings rather than bag-of-words representations, producing more coherent and semantically meaningful topics, particularly in large, heterogeneous scientific corpora [25]. Scientific domain-specific embeddings (SPECTER, [26]) further enhance semantic fidelity for bibliometric applications. To track change over time, we use normalized indicators such as annual thematic shares and z-scores to highlight which themes are over- or under-represented compared to their historical baseline [27,28].
Building on these developments, this article presents a global semantic map of climate–agriculture research from 1990 to 2025, drawing on Scopus as the primary bibliometric data source, a curated, high-quality multidisciplinary database widely used for large-scale science mapping [29]. The analysis proceeds in three stages: characterization of long-term publication growth and geographic structure; extraction of thematic organization using BERTopic, complemented by supervised thematic aggregation into 18 interpretable macro-themes; and assessment of temporal dynamics using normalized indicators that separate field-wide expansion from shifts in thematic attention [7,27]. The objective is to map the connections between climate and agriculture across domains and to quantify how research priorities shift over time, accounting for overall growth.
Two research questions guide the analysis: (1) What are the principal publication trends in climate–agriculture research from 1990 to 2025? (2) How does the relative prominence of research themes change over time when controlling for overall growth, and which themes become more or less central within the scientific agenda?

2. Materials and Methods

2.1. Data Collection

This study is based on bibliographic records retrieved from Scopus, a multidisciplinary database that indexes peer-reviewed journals and conference proceedings and is widely used for large-scale bibliometric and science-mapping analyses [17,29]. Scopus provides broad interdisciplinary coverage, rigorous quality controls, and structured metadata, all essential for reproducible large-scale bibliometric studies.
Records were programmatically retrieved via the Elsevier Scopus API using a reproducible Python 3.11.0 pipeline (Python Software Foundation, Wilmington, DE, USA). The pipeline operationalizes a structured Boolean query that intersects an agriculture block with a set of climate-related blocks, applied year by year. Full query syntax, term lists, and parameter settings are reported in the Supplementary Materials (Table S1) to ensure exact reproducibility.
The temporal window spans 1990 to 2025. This start year captures the early consolidation of climate change as a distinct research domain. It aligns with the publication of the IPCC First Assessment Report while also covering the major phases of international climate governance, including the UNFCCC (1992), the Kyoto Protocol (1997), and the Paris Agreement (2015) [7,12,30,31,32].
The agriculture component (TERM AGRI) comprises approximately fifty terms and phrases capturing production domains (e.g., “crops”, “livestock”, “horticulture”, “forestry”, “fisheries”, “aquaculture”), management practices (e.g., “crop yield”, “soil health”, “irrigation management”), value-chain concepts (e.g., “food processing”, “agri-food chain”), and cross-cutting notions (e.g., “climate-smart agriculture”, “sustainable agriculture”). The guiding principle was to balance recall and thematic precision.
The climate component (CLIMATE BLOCKS) is structured as five query blocks to maintain broad coverage while keeping query execution manageable. These blocks target: (i) climate change, adaptation, mitigation, and greenhouse gas emissions; (ii) general climate and meteorology; (iii) thermal extremes and heat stress; (iv) hydrological extremes (drought, floods, waterlogging); and (v) agroclimatic indices and related variables, including precipitation, evapotranspiration, soil moisture, and drought indices such as the Standardized Precipitation Index (SPI) and the Standardized Precipitation Evapotranspiration Index (SPEI).
In Scopus, both components were searched in titles, abstracts, and author keywords (TITLE-ABS-KEY), combined with the logical operator AND, and filtered by publication year. We included original research and reviews; conference papers and book chapters indexed by Scopus were retained to capture emerging technical strands. Subject areas were restricted to “Agricultural and Biological Sciences” and “Environmental Science” to reduce homonyms from unrelated disciplines. The analytical scope was limited to English-language records to support a stable, high-signal semantic space for topic modeling. This language filter, while methodologically justified for embedding-based topic modeling, introduces a geographic coverage bias: it systematically under-represents scientific output from regions where research is published primarily in other languages, including sub-Saharan Africa and parts of Latin America. This limitation is explicitly acknowledged and is discussed in Section 4 in relation to geographic patterns [29].
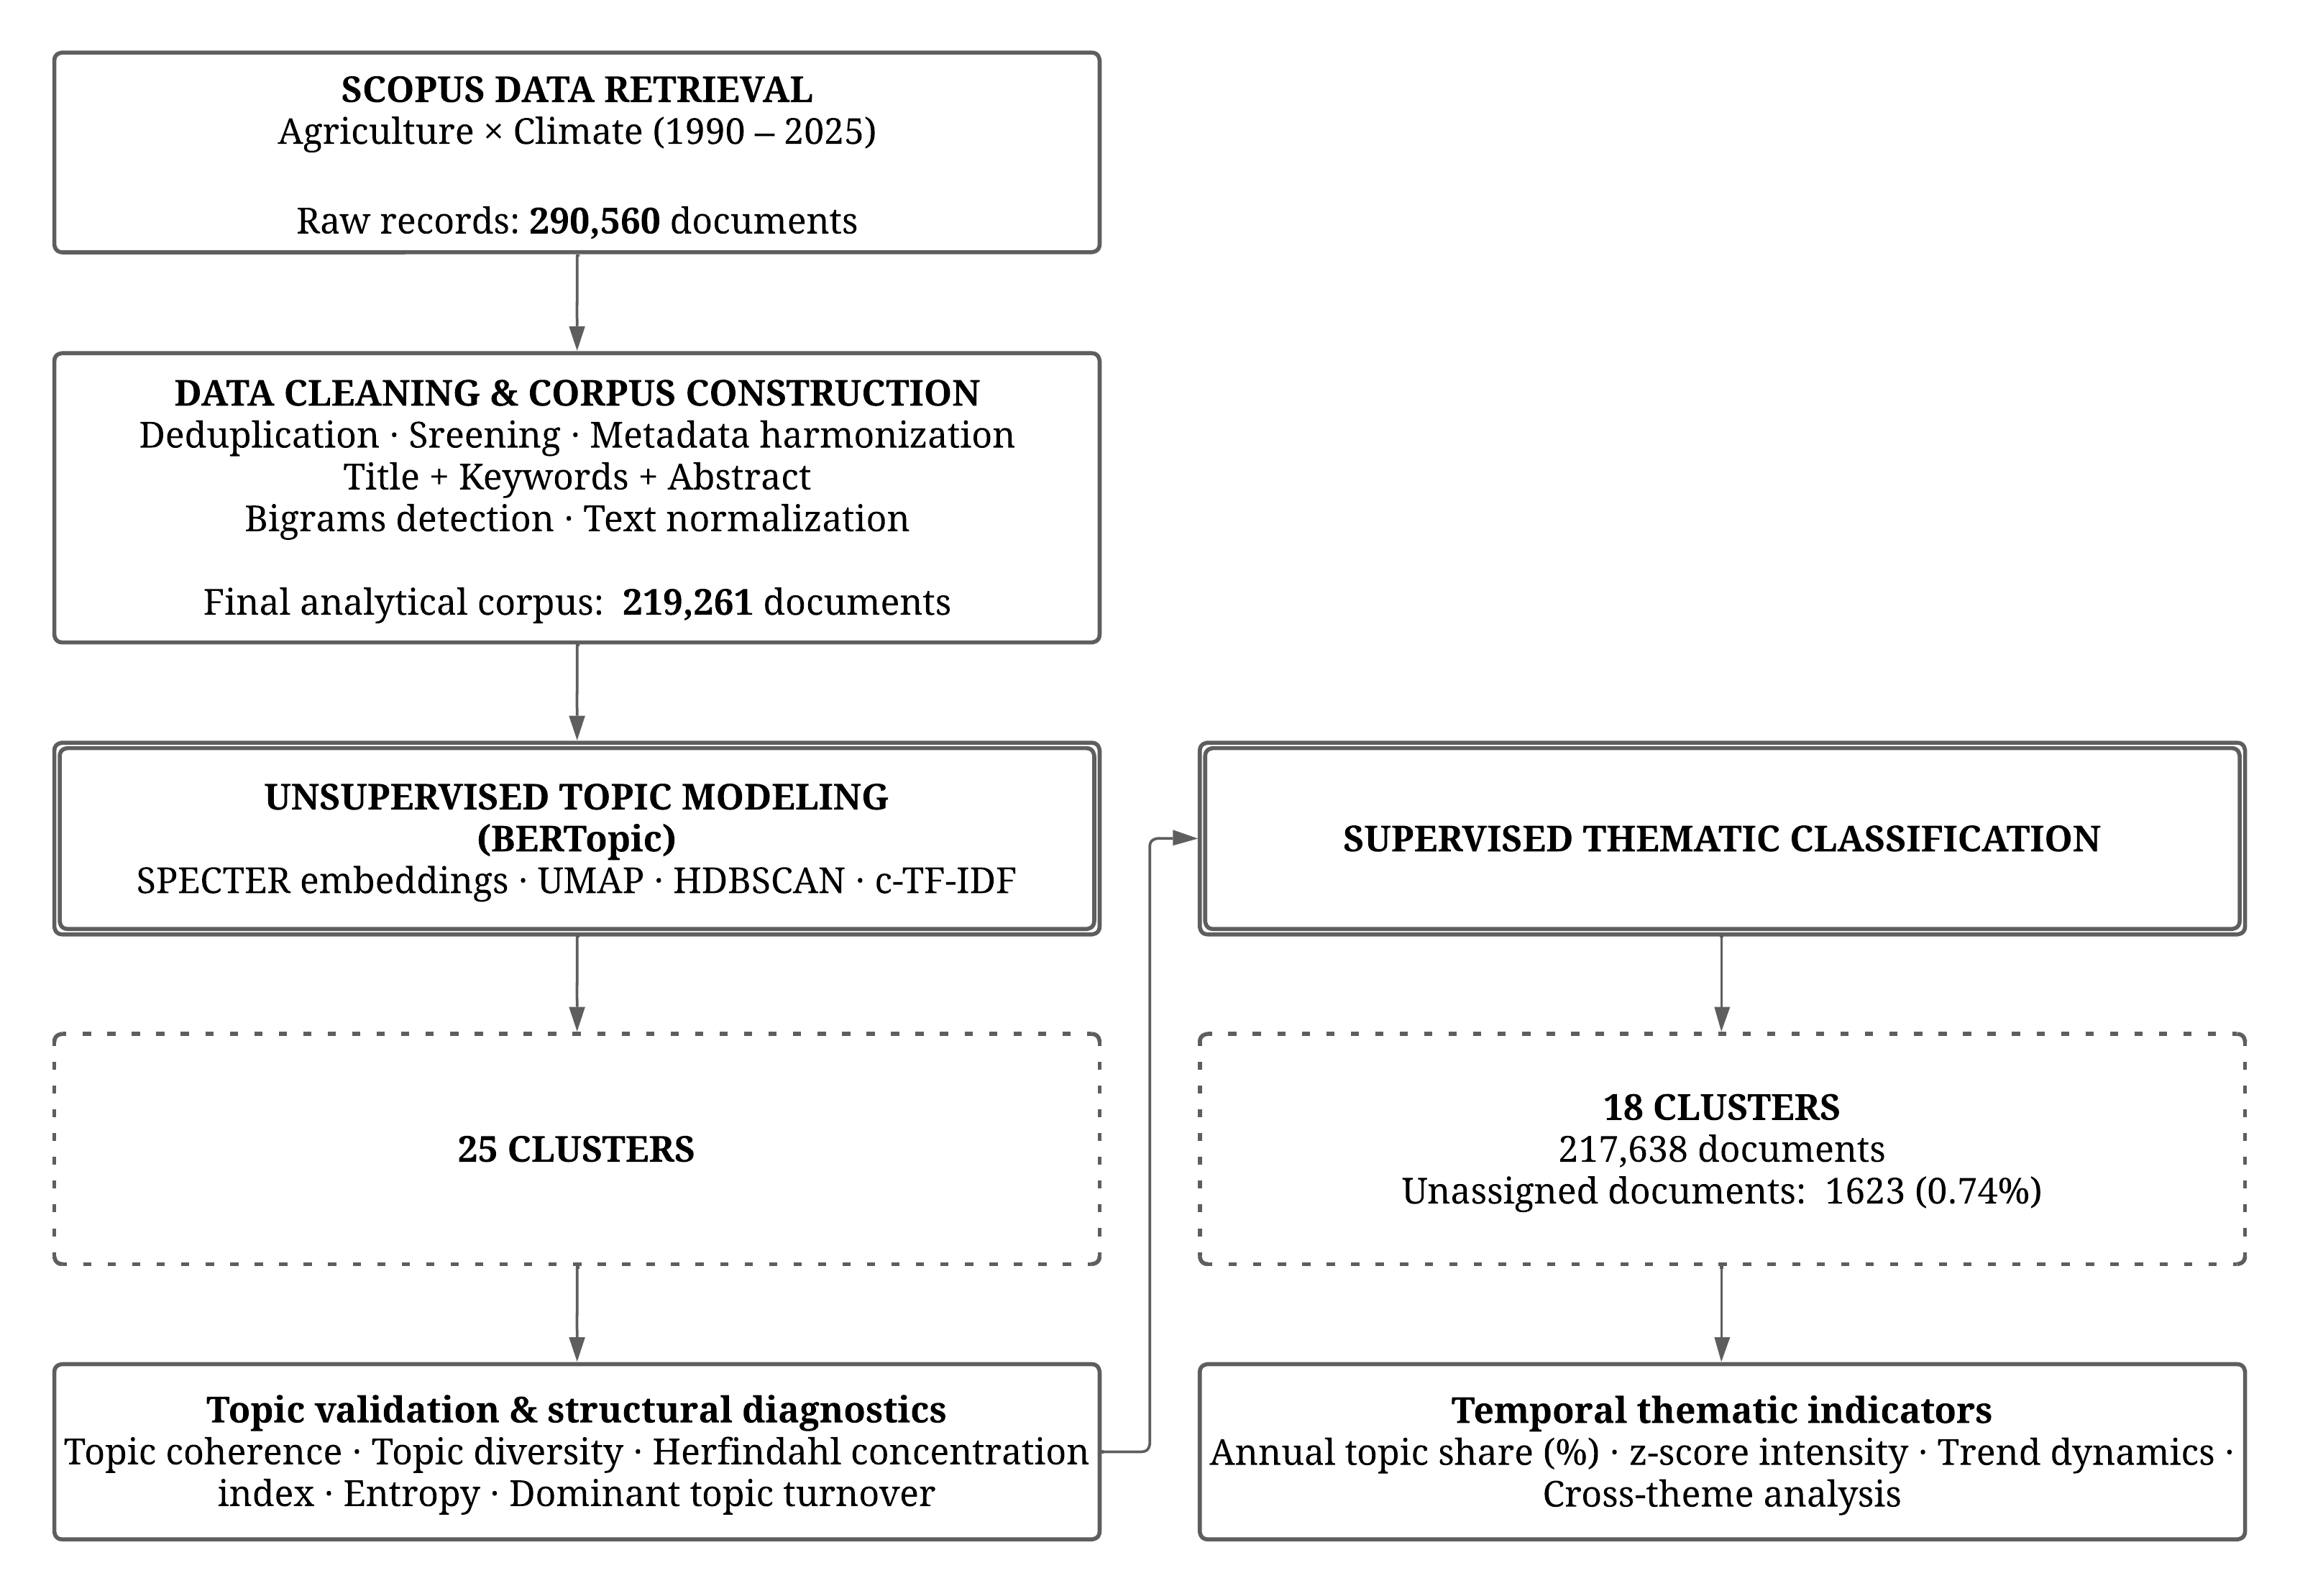
Data retrieval was conducted on 8 January 2026, with records filtered to publication years 1990–2025. Scopus is a dynamic database, and records may be indexed retrospectively; consequently, a small share of 2025 publications may not yet have been indexed at the retrieval date. This late-indexing effect is typical in large-scale bibliometric studies and is estimated to affect less than 5% of annual output for the most recent year [29]. Raw records totaled 290,560 documents before deduplication and quality filtering (Figure 1).
For each record, we retained the following fields: document type, publication year, title, authors, author-affiliated countries, author keywords, abstract, source title, DOI, Scopus ID, EID, and the permanent Scopus link.
Duplicates were removed using a hierarchical identifier strategy. DOI was used as the primary key when available; otherwise, Scopus ID and EID were used. When no persistent identifier was available, a synthetic identifier was generated by hashing normalized publication year, first author, and title, with records sharing the same key being collapsed into a single entry. This procedure was applied to the combined set of records retrieved across yearly climate-block queries, thereby removing duplicate entries produced by query overlap or repeated indexing metadata. For semantic modeling, we required a textual signal from the abstract and/or author keywords. Records lacking both abstract and author keywords were excluded from the text-based pipeline. After deduplication and text-availability filtering, the final analytical corpus used for semantic modeling comprised 219,261 documents.

2.2. Text Preprocessing

Text preprocessing followed a standardized NLP pipeline for corpus normalization [33]. Text was lowercased and cleaned by removing non-alphabetic characters, except those needed to preserve multi-word expressions [34]. Tokenization was followed by whitespace normalization, with removal of unit tokens and domain-generic terms to reduce noise.
An unsupervised bigram detector based on Pointwise Mutual Information (Gensim Phrases; min_count = 25; threshold = 12) was applied to fuse recurrent multi-word expressions into single tokens (e.g., water_use_efficiency, food_security), improving semantic coherence in downstream modeling [35,36]. A composite stopword list combining the default English stopwords from scikit-learn with additional high-frequency, low-information tokens was applied. Processed document texts, combining title, abstract, and author keywords, were used as input for BERTopic document embedding.

2.3. BERTopic Topic Modeling and Clustering

Unsupervised thematic structure was extracted using BERTopic [19], a neural topic modeling framework integrating four sequential components: (i) document embedding using contextual language models; (ii) dimensionality reduction; (iii) density-based clustering; and (iv) topic representation via c-TF-IDF.
BERTopic was selected over classical methods such as LDA [23] and LSA [24] for methodological reasons relevant to large scientific corpora. LDA relies on a predefined number of topics and Dirichlet priors, which may force heterogeneous or boundary documents into topics that are not semantically stable. LSA is based on truncated Singular Value Decomposition of TF-IDF matrices and captures linear associations, but is limited when semantic similarity depends on contextual usage. BERTopic, by contrast, leverages transformer-based document embeddings and density-based clustering, enabling the identification of coherent high-density thematic regions while allowing heterogeneous documents to remain unassigned when they do not form stable clusters [25].
Each document was represented by concatenating title, abstract, and keywords (when available). Text was lowercased and cleaned by removing non-alphabetic characters, unit tokens (e.g., ha, kg, ppm), and missing-value artifacts. In addition to standard English stopwords, a domain-specific stopword list was added to reduce the influence of generic scientific terms (e.g., “results”, “method”, “study”). After preprocessing, bigram detection was performed using a statistical phrase model (Gensim Phrases) with min_count = 25 and threshold = 12, and detected bigrams were merged into single tokens to improve the stability and interpretability of topic representations.
Document-level embeddings were generated using SPECTER [26], a scientific-domain pre-trained transformer model based on BERT [20] trained using citation-informed contrastive learning on scientific documents. SPECTER embeddings are particularly well-suited to bibliometric applications because they encode document-level semantic similarity grounded in scientific relevance, outperforming general-purpose language models on scientific information retrieval tasks [26]. Each document was represented as a 768-dimensional normalized embedding vector (L2 normalization applied before dimensionality reduction).
Dimensionality reduction was performed using UMAP [21] and clustering was performed using HDBSCAN [22] within the BERTopic pipeline. Hyperparameters were selected to yield broad, interpretable themes in a large and heterogeneous corpus while controlling the proportion of unclustered documents inherent to density-based clustering; the full configuration is reported in Table S2.
Topic representations were generated using c-TF-IDF [19] estimated from a CountVectorizer and ClassTfidfTransformer configured to emphasize topic-distinctive vocabulary while suppressing globally frequent terms (Table S2).
To mitigate the conservative behavior of density-based clustering and reduce the proportion of unassigned documents, an outlier reassignment step was applied after initial model fitting. Specifically, documents labeled as outliers (−1) were reassigned using BERTopic’s reduce_outliers procedure (Table S2), and the model was then updated with the revised topic assignments.
Finally, an automatic topic reduction step was applied to merge semantically similar topics using nr_topics = 25. This reduction yields an interpretable set of topics suitable for subsequent analyses (e.g., temporal topic dynamics) while retaining the outlier class (−1) for documents that remain insufficiently similar to any topic after reassignment (Table S3).

2.4. Supervised Thematic Assignment and Evaluation

To facilitate longitudinal analysis, a set of 18 thematic clusters was defined to reflect the major domains within the climate–agriculture literature: Crop Production, Hydrology & Water Management, Irrigation, Livestock Systems, Forestry, Oceanography, Fisheries & Aquaculture, Soil & Carbon Sequestration, Atmosphere, GHG & Net-Zero Strategies, Wildfire, Energy & Renewable Sources, Technology & Modeling, Economics & Markets, Sustainability, Socio-Economic Vulnerability, Food Industry, and Biotechnology (Table S4). This taxonomy aligns with the systemic frameworks utilized by major global assessments. Rather than treating agriculture in isolation, these clusters encompass the broader “Food Systems” and “AFOLU” (Agriculture, Forestry, and Other Land Use) paradigms established by the IPCC’s Sixth Assessment Report [37]. Furthermore, domains such as Socio-Economic Vulnerability, Technology & Modeling, and Soil & Carbon Sequestration reflect the strategic pillars of the FAO’s Climate-Smart Agriculture approach [37] and the core themes of the IPCC Special Report on Climate Change and Land [37], ensuring our clusters capture the full spectrum of biophysical impacts, mitigation strategies, and socio-economic dimensions currently driving global scientific discourse.
Supervised assignment was implemented in a TF-IDF vector space. Each theme was represented by a curated seed lexicon of characteristic terms developed through a systematic review of scientific literature. Seed vocabulary was projected into the TF-IDF space alongside the document corpus, yielding one thematic vector per theme. For each document, the cosine similarity between the document vector and each thematic vector was computed. Documents were assigned to the theme with the highest similarity score, provided that the score exceeded a conservative threshold (SIM_THRESHOLD = 0.1). Documents falling below the threshold were retained as a residual set labeled “Other” and excluded from thematic time-series analyses.
Of the 219,261 documents in the analytical corpus, 217,638 (99.26%) were assigned to one of the 18 supervised macro-themes, with 1623 documents (0.74%) remaining unassigned.
To aid interpretation, several contemporary subfields are subsumed within these macro-themes rather than treated as separate categories: digital and precision agriculture (encompassing remote and proximal sensors, drones, the Internet of Things, artificial intelligence, and big-data analytics) is captured primarily within the Tech & Modeling theme, whereas bioenergy and renewable-energy research is captured within the Energy & Renewable Sources theme. Integrated and multi-component systems are distributed across the relevant production themes according to their dominant framing.
Thematic coherence was evaluated by using three complementary metrics for each supervised theme (Table 1). Purity quantifies the concentration of each supervised macro-theme within the unsupervised BERTopic partition and is computed as the maximum share of documents in the macro-theme that fall into any single BERTopic topic. Values closer to 1 indicate tighter alignment between supervised and unsupervised clustering; Entropy (Shannon) measures the dispersion of documents across BERTopic clusters and is computed on the BERTopic topic share distribution within each macro-theme. Lower values indicate more thematically focused macro-themes, and the mean cosine distance to centroid (1—cosine similarity) is computed as the average cosine distance of all documents within each macro-theme to the theme centroid (the mean SPECTER embedding vector), used here to quantify within-theme embedding compactness in the SPECTER space. Lower values indicate more compact and semantically cohesive macro-themes. Because purity is defined as a maximum within-theme share, themes that are inherently cross-cutting are expected to exhibit lower purity and higher entropy.
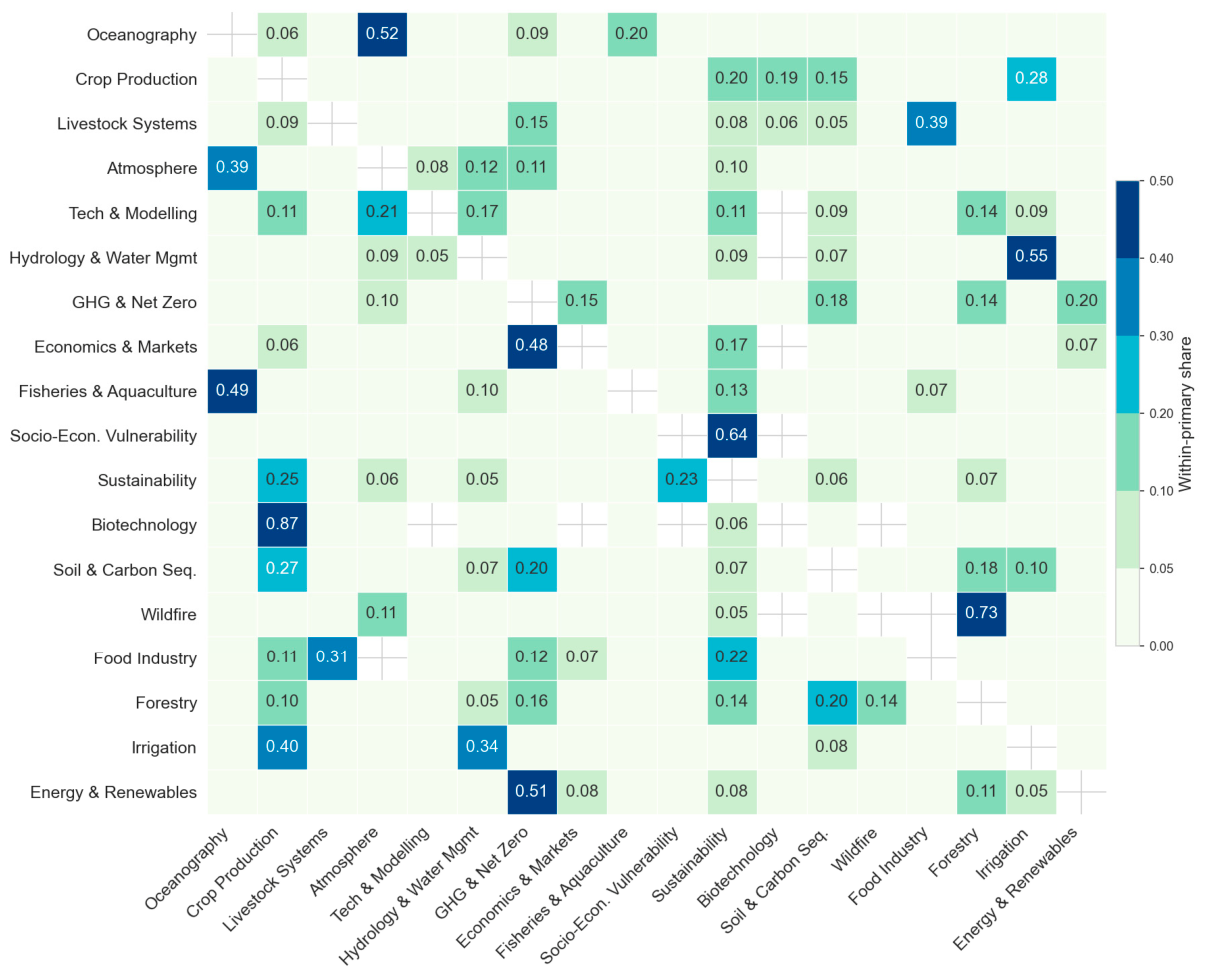
To quantify cross-theme co-framing beyond single-label assignment, each document was assigned both a primary (highest cosine similarity) and a secondary (second-highest cosine similarity) thematic alignment. A secondary assignment was retained only when both: (i) the secondary similarity exceeded a minimum association threshold (SECONDARY_THRESHOLD = 0.08), and (ii) the ratio of secondary to primary similarity exceeded a conservative criterion (SECONDARY/PRIMARY ≥ 0.85), reducing spurious secondary links. Under these criteria, 54.3% of analytically assigned documents received a valid secondary theme. Cross-theme associations were summarized into a directed primary–secondary co-occurrence matrix C, where Cij counts documents whose primary theme is i and secondary theme is j. The within-primary share matrix S is defined as follows:
S i , j =   C i , j k C i , k
enabling comparisons across themes with different base volumes.

2.5. Temporal Indicators and Analysis

To identify structural changes in publication dynamics, annual publication counts were log-transformed to stabilize variance:
z t = ln ( N t + 1 )
Structural breaks in the time series were identified by minimizing the Bayesian Information Criterion (BIC) across candidate models, allowing for up to five breakpoints to capture fine-grained shifts. For each identified segment, the Compound Annual Growth Rate (CAGR) was calculated as follows:
C A G R = N e n d N s t a r t 1 n     1  
where Nstart and Nend represent the smoothed publication counts at the beginning and end of the segment, respectively, and n denotes the duration of the segment in years.
To disentangle aggregate field growth from structural shifts in thematic attention, two complementary annual indicators were computed for each theme c in year y. The Annual Share (Equation (4)) quantifies the relative prevalence of a topic within a given year:
S y , c = N y , c i = 1 C N y , i 100
where Ny,c is the number of documents assigned to theme c in year y. The Standardized Intensity (Equation (5) assesses the fluctuation in a theme relative to its own historical baseline:
Z y , c = S y , c μ c σ c
where μc and σc denote the mean and standard deviation, respectively, of the share Sy, covering the observation period (1990–2025).

2.6. Spatial Scale Inference

To characterize the geographical granularity of research, a two-stage spatial-scale assignment pipeline was implemented. First, a rule-based heuristic classifier assigned each document to one of seven spatial scale categories: Global/Continental, National, Regional, Local/Farm/Basin, Lab/Micro/Genetic, Multi-scale, or Unspecified. The classification algorithm analyzed titles, abstracts, and keywords using a hierarchical dictionary of scale-specific markers (Table S5). Multi-scale was assigned when markers from two or more spatial-scale families, or explicit multi-scale expressions, were detected within the same document. The Unspecified category captures documents whose spatial scope is either not defined or cannot be reliably inferred from the available text. Second, to reduce the number of Unspecified cases, we applied a conservative recovery step. A multinomial logistic regression model trained on documents with unambiguous rule-based labels was used to predict labels for Unspecified documents from SBERT embeddings (sentence-transformers/all-MiniLM-L6-v2). Predictions were accepted only when the maximum class probability was ≥0.55; otherwise, documents remained Unspecified. To assess the reliability of the combined rule-based and ML pipeline, we conducted an automated robustness check against an independent, strict high-confidence proxy on an enlarged stratified sample (n = 1400; 200 documents per predicted class). Within the subset receiving high-confidence proxy labels (n = 335; coverage = 23.9%), the combined pipeline achieved an overall agreement rate of 0.713 (weighted-F1 = 0.816; macro-F1 = 0.593). Per-class F1 was high for the five well-defined scales (0.73 to 0.97; precision 0.88 to 1.00), whereas the intrinsically ambiguous Multi-scale category was over-assigned and therefore weak; because the macro-average weights all classes equally, it is depressed by this single category.
The full confusion matrix and per-class metrics are reported in Table S9. A sensitivity analysis of the acceptance threshold (examined across 0.45 to 0.70) confirmed that the 0.55 cut-off balances coverage against accuracy. Because the machine learning step only refines the Unspecified subset and the spatial-scale distribution rests primarily on the rule-based classifier, residual misclassification has a limited effect on the reported patterns.

2.7. Computational Framework and Reproducibility

All analyses were implemented in Python 3.11.0, integrating standard libraries for text vectorization (scikit-learn), neural embedding (sentence-transformers; SPECTER model; allenai-specter), manifold learning (umap-learn), clustering (hdbscan), and BERTopic-specific modeling (bertopic). To support transparency and open science principles, the codebase and non-sensitive aggregated datasets are maintained in a version-controlled repository and are available for validation upon request.
Note on the use of AI tools: During the preparation of this manuscript, the authors used ChatGPT-5.5 (OpenAI, San Francisco, CA, USA) solely for English-language editing and proofreading. The tool was not used to design this study, collect or analyze data, interpret the results, or generate scientific content. The authors reviewed and edited all AI-assisted output and take full responsibility for the content of this publication.

3. Results

3.1. Publication Growth and Geographic Concentration

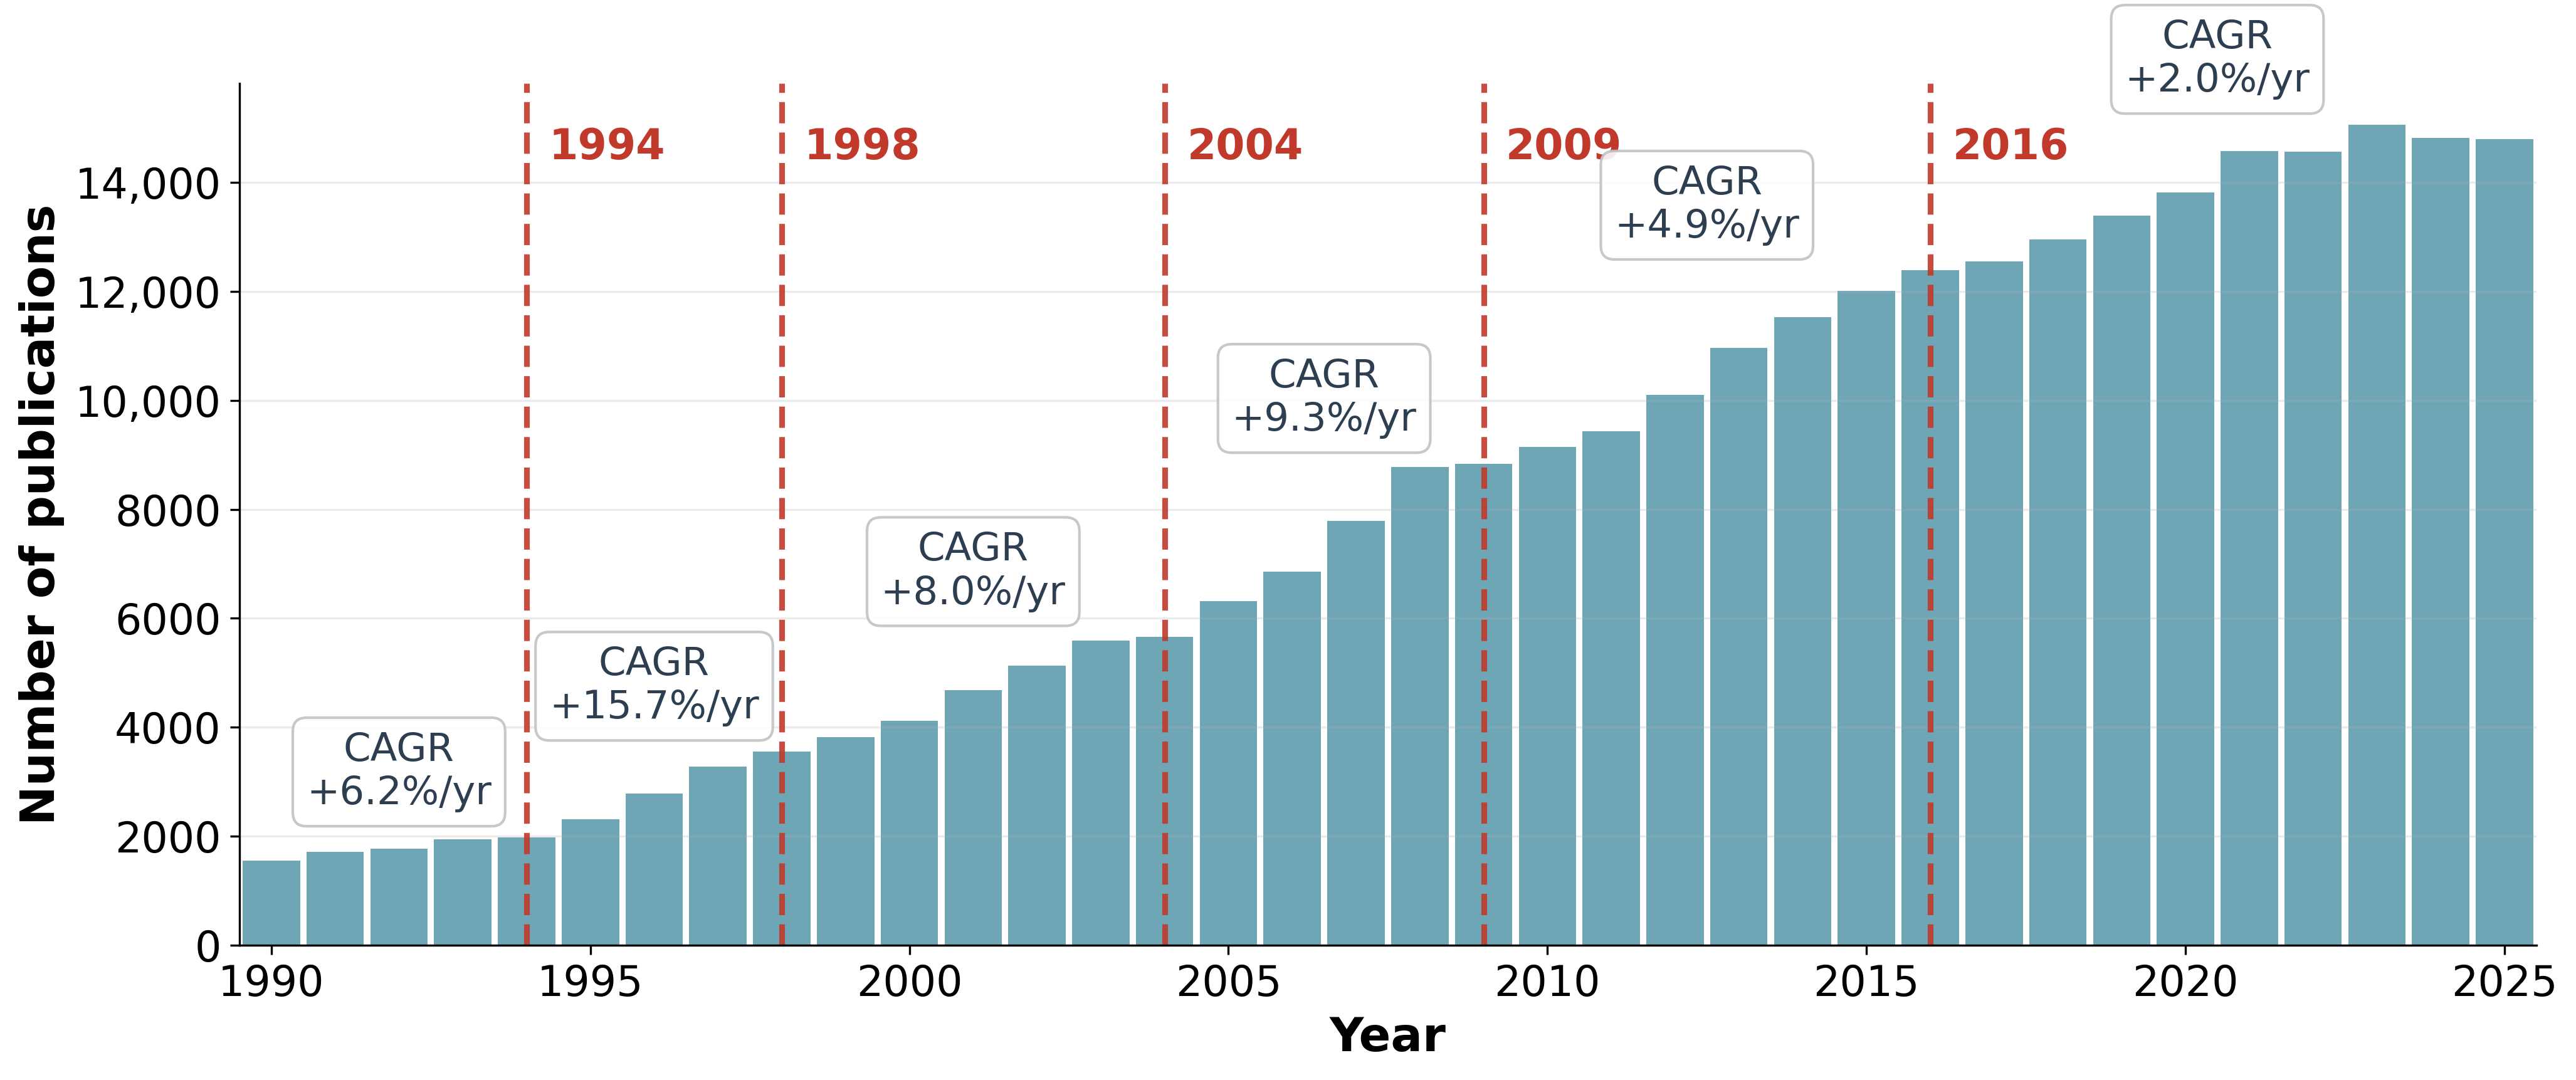
An analysis of 219,261 documents from Scopus demonstrates sustained and rapid growth in climate–agriculture research. A segmented trend analysis of annual publication counts identifies five structural breakpoints (1994, 1998, 2004, 2009, and 2016) that delineate six distinct growth phases. The trajectory begins with an initial emergence (1990–1994; CAGR = 6.2%/year), followed by an explosive expansion phase (1994–1998; 15.7%/year). Growth remains robust through the early 2000s (1998–2004; 8.0%/year) and accelerates again before the end of the decade (2004–2009; 9.3%/year). The post-2009 period marks a gradual deceleration (2009–2016; 4.9%/year), culminating in a high-volume steady state after 2016 (2016–2025; 2.0%/year). This plateau, producing over 12,000 papers annually, is consistent with a transition from an expanding niche to a mature, institutionalized research domain (Figure 2). More than half of all publications (53.67%) were produced between 2016 and 2025.
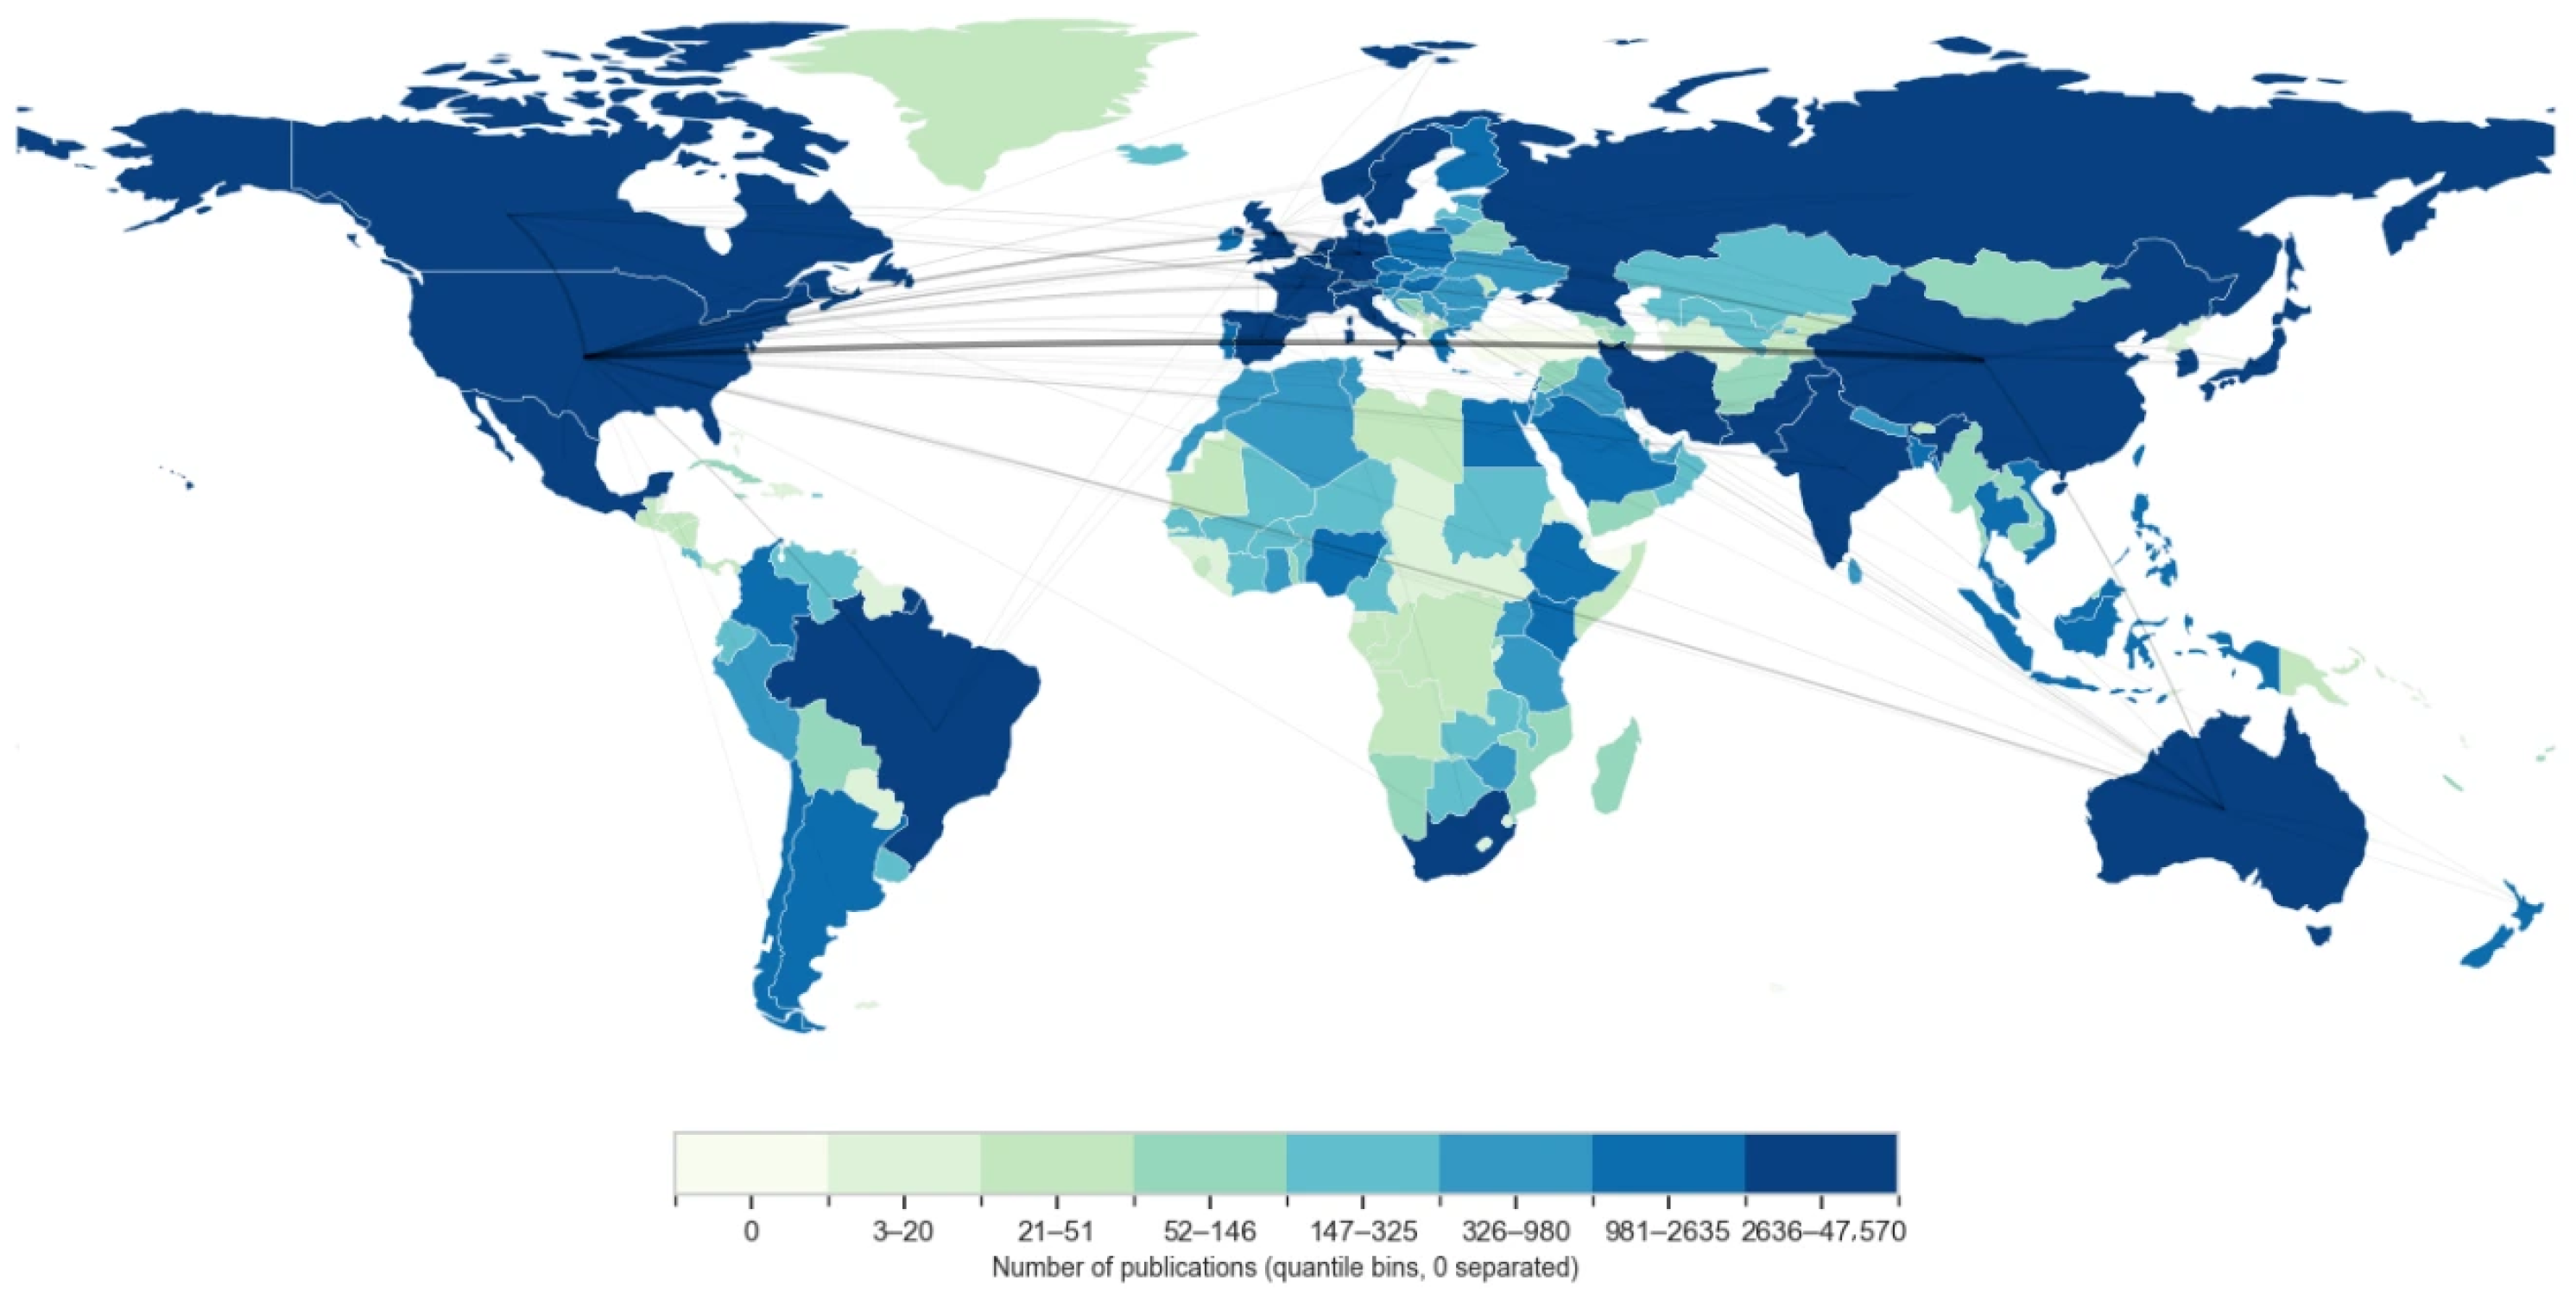
Despite overall global growth, the research output remains highly concentrated. The United States and China collectively account for 41.98% of all documents (Figure 3), followed by India, the United Kingdom, Australia, Brazil, Germany, Canada, Italy, and Spain [7]. This concentration underscores persistent disparities in global research capacity and funding [38]. Notably, Latin American countries, particularly Brazil, Mexico, Argentina, and Colombia, contribute modestly to the global output. Brazil’s position in the top ten demonstrates an emerging regional scientific capacity in climate–agriculture research. In contrast, sub-Saharan African countries remain markedly underrepresented, despite constituting some of the regions most exposed and vulnerable to climate change impacts on agricultural systems [1,2].
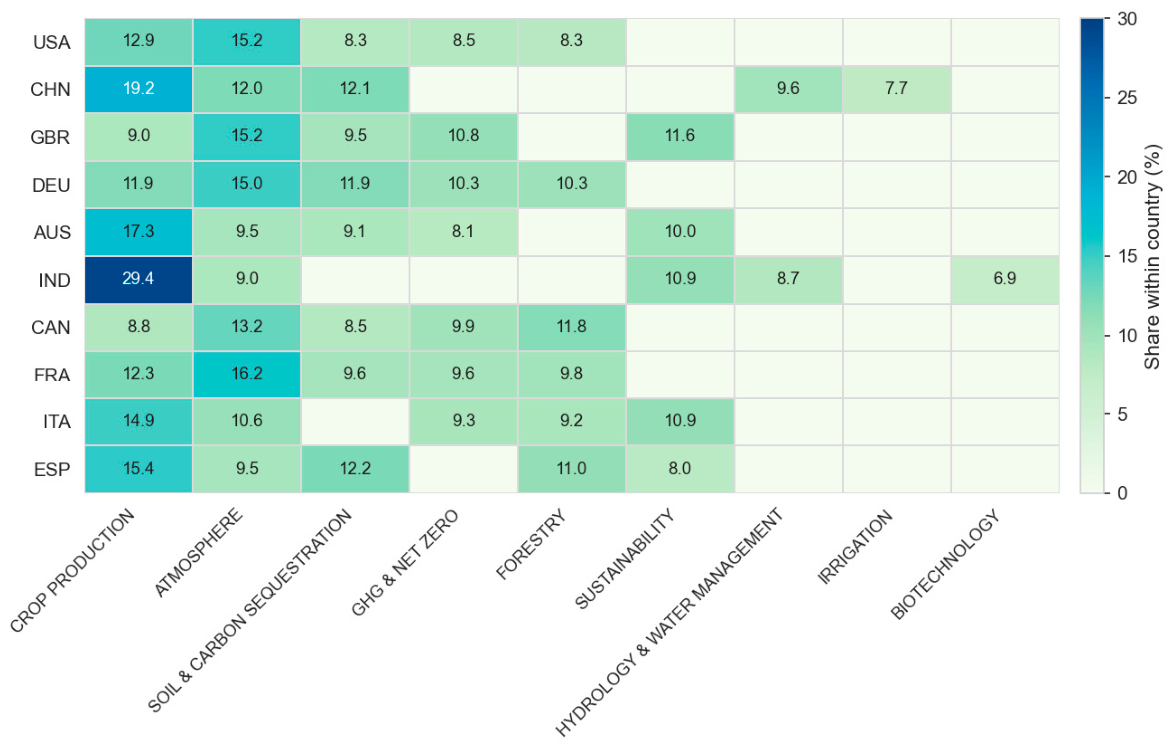
Beyond output volume, the thematic composition of the top producers reveals clear national research priorities (Figure 4). Oceanography and Hydrology & Water Management constitute the dominant cross-cutting themes across the United States (20.4%), France (21.9%), Germany (19.8%), and Canada (20%). China and India exhibit specialization in food security and modernization, with Crop Production ranking as the primary research focus (11.5% and 15.8%, respectively), strongly supported by Technology & Modeling and Biotechnology. In contrast, the United Kingdom and Canada distinguish themselves by positioning GHG & Net-Zero within their top five priorities (7.9% and 8.1%), reflecting a stronger policy-driven agenda. Environmental constraints appear to drive thematic specialization in water-scarce regions: both Australia and Spain prioritize Hydrology & Water Management as their leading domain (11.1% and 10.2%), whereas Italy presents a unique primary orientation toward Livestock Systems (10.0%).

3.2. Unsupervised Thematic Structure from BERTopic

The BERTopic pipeline, configured with nr_topics = 25 (plus outlier class −1), produced 25 substantive topics from the analytical corpus (Table S3), with 156,333 documents (71.3%) assigned to specific topics and 62,928 documents (28.7%) classified as outliers (noise ratio = 0.287). This outlier proportion reflects the HDBSCAN parameterization selected through a constrained grid search targeting a predefined outlier ratio on a random subsample and is consistent with density-based topic discovery on large, heterogeneous scientific corpora [19].
The 25 BERTopic topics span a range of agronomic and boundary subfields. The largest topic (Topic 1, n = 36,347) is characterized by drought, yield, wheat, tolerance, crop, rice, plant, drought stress, maize, and genes, capturing crop drought responses and agronomic productivity research. Topic 2 (n = 32,610) is centered on hydrological and land–water interactions, with leading terms drought, land, river, groundwater, irrigation, flood, rainfall, basin, vegetation, and moisture. Topic 3 (n = 19,310) covers forest ecosystems and land-use systems, including tree, drought, ecosystem, forests, ecosystem services, grazing, pine, and biodiversity. Topics spanning smaller volumes include greenhouse gas emissions and biogeochemical processes, soil biogeochemical dynamics, marine and fisheries systems, food security and agricultural adaptation, and livestock heat stress.
The BERTopic analysis also reveals boundary topics with limited direct relevance to the core agri-climate domain: renewable energy and supply-chain systems (Topic 11), materials and engineering processes (Topics 14 and 19), petroleum and reservoir engineering (Topic 17), electrochemical energy systems (Topic 18), and industrial carbon capture technologies (Topic 20). These peripheral clusters arise because the Boolean search query retrieves documents that mention agriculture- or climate-related terms but address other primary research questions, confirming that scope filtering through supervised thematic classification is necessary to isolate the agronomically relevant signal.

3.3. Supervised Thematic Clusters and Validation

To enhance interpretability and enable systematic diachronic reconstruction, the BERTopic topics were synthesized into an 18-theme standardized taxonomy [39]. These thematic clusters are: Crop Production, Hydrology & Water Management, Irrigation, Livestock Systems, Forestry, Oceanography, Fisheries & Aquaculture, Soil & Carbon Sequestration (soil properties [40]), Atmosphere, GHG & Net-Zero strategies, Wildfire, Energy & Renewable Sources, Technology & Modeling, Economics & Markets, Sustainability, Socio-Economic Vulnerability, Food Industry and Biotechnology. Theme labels were assigned by inspecting the most representative terms (Table S4) and a sample of high-similarity documents per theme, ensuring that each label reflects the dominant semantic content and minimizes overlap with adjacent themes.
The supervised assignment labels each document according to its closest thematic profile in the latent space, using conservative thresholds to avoid forcing ambiguous papers into a single category. Documents that do not show a clear affinity are retained as a residual set and excluded from thematic time series, ensuring that temporal patterns reflect comparable thematic signals.
A robustness check for thematic coherence is provided in Table 1. These diagnostics are used to distinguish domain-specific topics from cross-cutting ones. Themes with relatively specialized vocabularies (e.g., Forestry; Soil & Carbon Sequestration; Energy & Renewable Sources) show more compact semantic profiles, consistent with well-established terminology and narrower conceptual boundaries. In contrast, broad agronomic domains that naturally intersect multiple processes, scales, and methods (e.g., Hydrology & Water Management; Crop Production; Technology & Modeling; Sustainability) distribute across several unsupervised regions. This dispersion is expected in applied climate–agriculture research: for example, water-related work spans river-flood dynamics, groundwater and storage, irrigation practice, drought monitoring, and water-quality studies, which rarely appear in isolation. Similarly, GHG & Net-Zero is anchored in mitigation and accounting language (emissions, carbon footprint, life-cycle assessment) but also connects to soil carbon processes and farm-level management contexts, leading to partial overlap with adjacent themes.
The mean cosine distance values are relatively low across all 18 themes (range: 0.174–0.479; Table 1), indicating that documents grouped by the seed-based taxonomy remain relatively compact in the SPECTER embedding space. Importantly, this compactness coexists with substantial heterogeneity in how themes map onto the unsupervised BERTopic landscape. Purity and entropy vary in ways that reflect the breadth of each macro-theme: more cohesive themes such as Economics & Markets (purity = 0.533; entropy = 2.876; distance = 0.174) and Irrigation (0.480; 2.172; 0.386) show comparatively tighter concentration, whereas broader and more cross-cutting domains, including Technology & Modeling (0.327; 3.663; 0.219), Crop Production (0.311; 3.630; 0.178), and Hydrology & Water Management (0.249; 3.506; 0.283), exhibit higher entropy and lower purity, consistent with their spanning multiple latent topics. This dispersion is not a failure of the taxonomy but an expected property of applied climate–agriculture research, where problem framings and methods frequently co-occur across subfields (e.g., wildfire impacts may be discussed through soil carbon, hydrology, and risk vocabularies). Table 1 supports the intended use of the supervised taxonomy as an interpretable lens for tracking major research lines over time while acknowledging that several agronomically central themes function as integrative bridges across thematic clusters.
Beyond these integrative themes, an inspection of the top representative terms (Table S4) reveals that “drought” functions as the most ubiquitous stressor in the corpus. It appears as a top-ranking descriptor in 11 out of the 18 supervised clusters, spanning biophysical domains (Crop Production, Forestry, Wildfire, Hydrology, Irrigation, Atmosphere, Soil) and technical and socio-economic ones (Biotechnology, Technology & Modeling, Economics, Food Industry). However, temporal frequency analysis reveals a recent divergence in stressor prioritization. While “drought” maintained dominance as the primary stressor keyword for three decades, “heat stress” exhibits a steeper acceleration in the most recent phase, surpassing “drought” in absolute annual publication volume from 2021 onwards (Figure S1).

3.4. Temporal Evolution of Thematic Clusters

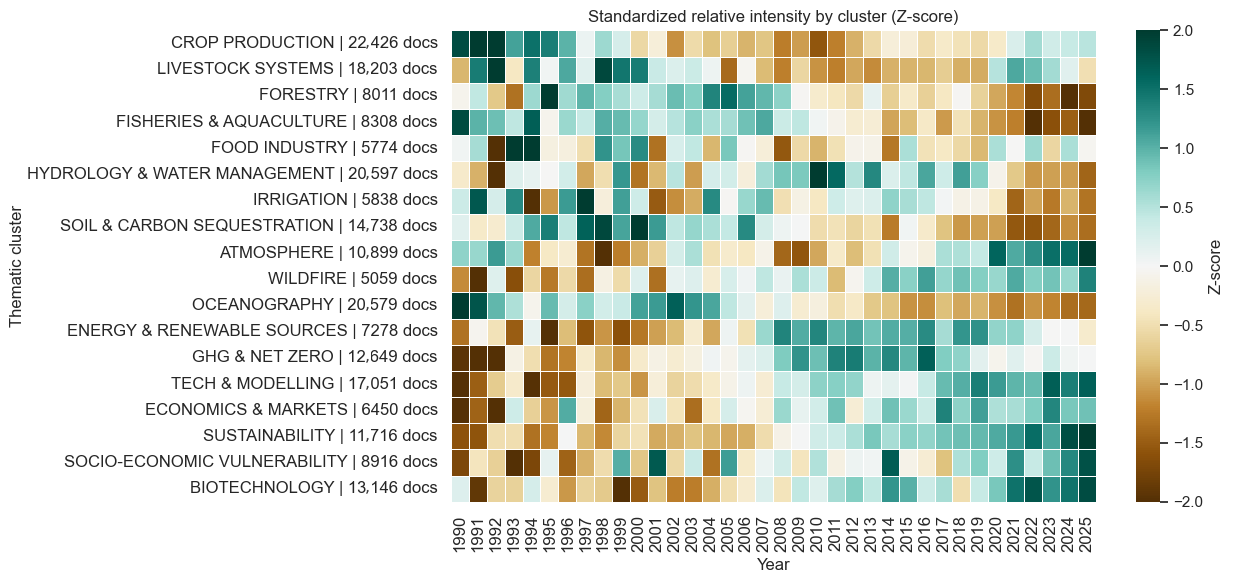
To decouple aggregate publication growth from structural shifts in thematic saliency, we prioritize the analysis of standardized Z-scores (Equation (5); Figure 5). The individual annual trajectory of each theme is further illustrated in Figure S2, which presents the annual share (%) of each macro-theme as separate area plots, enabling direct comparison of absolute and relative evolution across the 18 supervised clusters.
Biotechnology has experienced pronounced intensification since 2009 (Z > 1 in the last 5 years). This structural break aligns with the genomic revolution in agriculture, initially driven by the cost reduction in Next-Generation Sequencing (NGS) and the completion of major crop reference genomes (e.g., maize in 2009, soybean in 2010), and later accelerated by the diffusion of gene-editing tools like CRISPR-Cas9 [34]. This trajectory reflects a strategic pivot in adaptation research: shifting from agronomic management toward the engineering of intrinsic biological resilience (e.g., drought-tolerant traits) [41].
The Socio-Economic Vulnerability cluster has evolved from sporadic, stochastic signals (1999–2001–2003–2005) into a consolidated research pillar since 2010 (Z > 0). The intra-cluster decomposition (Table S8) includes food security and sustainable agriculture, climate policy/governance, public health and nutrition, rural livelihoods and migration (including fisheries-linked vulnerability), and a modeling/downscaling stream, indicating a consolidation of vulnerability research around welfare and governance framings alongside biophysical risk.
The trajectory of the Sustainability cluster differs structurally from niche domains. Rather than forming a distinct, isolated silo, our semantic metrics reveal a pattern of “disciplinary diffusion.” The cluster exhibits high entropy (3.353) and lower purity (0.290), indicating that sustainability-related terms are not confined to a single topic but are increasingly co-occurring across diverse fields, from sustainability to economic analysis or atmosphere-related topics. For example, terms like “resilience” and “policy” act as semantic bridges, appearing prominently in the Sustainability cluster while simultaneously structuring the Socio-Economic Vulnerability and Economics & Markets domains. Similarly, the term “environmental” links narratives to technical sectors such as Energy and Fisheries. This diffusion solidified into a structural pillar post-2015 (Z > 0).
Conversely, Technology & Modeling shows a late-stage intensification: underrepresented signals in the 1990s–early 2000s, sustained growth from 2008, and strong overrepresentation in 2017–2025 (Z consistently >1). The semantic core of this cluster is organized around drought/soil-moisture monitoring via remote sensing with machine learning forecasting, networked sensing, and optimization/control streams (Table S7), consistent with an increasing methodological scaffold for climate–agriculture research.
The GHG & Net-Zero theme shows pronounced intensification from 2008 to 2016, followed by a plateau and relative attenuation in the early 2020s. Its vocabulary is dominated by emission accounting and mitigation quantification (e.g., life-cycle assessment, carbon dioxide, methane, soil organic carbon; Table S4).
The Oceanography cluster exhibits a distinct early-phase prominence (1990–2005), showing sustained positive deviations (Z > 0). Its vocabulary is dominated by terms related to physical processes, such as “surface”, “layer”, “heat”, “boundary layer”, “atmospheric”, and “variability”. This vocabulary indicates a focus on the ocean as a macro-climatic driver rather than a food production system. After the mid-2000s, the cluster displays a marked trend of relative attenuation as other thematic domains expand.
In contrast, the Hydrology & Water Management cluster accelerates in the later period and is anchored in basin- and system-scale water constraints and hazards, with recurrent vocabulary on drought and water stress, river and flood dynamics, groundwater systems, and water-quality assessment (e.g., drought, flood/flooding, river/river basin, runoff/streamflow, groundwater/aquifer, and water quality). This separation highlights a cross-scale water research space in which basin-scale hazards and system constraints are analytically distinct from farm-level irrigation management yet remain conceptually connected through drought and water-limitation framing.
Hydrology & Water Management emerges as a high-volume, structurally central theme organized around a coherent set of water-system problems rather than a single disciplinary niche. Irrigation is treated as a separate cluster and is not included in this broad cluster. This combination indicates that the cluster functions as an integrative domain where basin-scale dynamics, water security, and risk assessment intersect with agronomically relevant notions of plant–water constraint.
The intra-cluster decomposition reveals a multi-component internal architecture (Table S6). A prominent component captures plant–water stress and water status framings, structured around drought and water stress language (water potential, uptake, root growth, leaf, soil), reflecting the consistent use of physiological constructs to translate hydrological pressure into crop-relevant response. Closely related, an “efficiency” component operationalizes water limitation through measurable traits and exchange processes, using terms such as water-use efficiency, photosynthesis, gas exchange, and carbon isotope ratios, suggesting that efficiency is often treated as a quantifiable mediator of climate–water impacts in agronomic studies.
A second block consolidates system-level management and environmental governance concerns. Water-quality subthemes combine surface-water and groundwater-quality terminology with pollution and land-use signals, alongside recurring assessment and monitoring language, consistent with literature focused on contamination, nutrient load pressures, and diagnostic evaluation of water bodies. Complementary subthemes emphasize basin-scale resource framing and allocation questions, including river basin and water resource language, drought co-framing, and water-harvesting terminology, which together suggest attention to resource planning and resilience strategies at the catchment or regional scale. Groundwater-specific subthemes further focus on aquifers, recharge, and groundwater flow, highlighting depletion and recharge dynamics as a recurring research frontier. Urban supply and demand also appear as a distinct stream, combining water supply, demand, infrastructure, and resilience vocabulary, underscoring that the cluster encompasses multi-sector water systems rather than being confined to agriculture alone.
Hydrological hazards remain a persistent and clearly differentiated pillar within the cluster. Flood-risk work is expressed through assessment, vulnerability, mapping, forecasting, and disaster-related terms. At the same time, river and floodplain subthemes are structured around flow, channel, and floodplain dynamics, as well as infrastructure markers such as dams. Runoff and watershed modeling forms another distinct stream, frequently linked to land-use change and erosion, and including modeling tool signatures (e.g., SWAT), consistent with catchment process modeling and scenario assessment. Finally, a lake and wetland subtheme captures water-level and eutrophication signals, indicating that standing-water systems and wetlands contribute a specific ecological–hydrological research line within the broader hydrology theme. A smaller peripheral subtheme contains treatment and membrane-related terminology, reflecting interdisciplinary overlap with water treatment and environmental engineering.
Irrigation, in contrast, constitutes a separate thematic cluster with its own operational vocabulary centered on irrigation water, evapotranspiration, crop productivity and yield, and water productivity. This separation clarifies the internal structure of water-related research: Hydrology & Water Management captures basin- and system-scale hazards and constraints, whereas Irrigation captures field-level water application and performance-oriented decision-making.
In contrast, the Technology theme captures documents in which digital methods are the primary analytical contribution rather than an applied measurement layer within a water-management framework.
Within the Crop Production macro-theme, the internal structure is overwhelmingly dominated by drought-related yield and stress language, anchored in staples (rice, wheat, maize) and recurrent impact terms (drought, yield, heat stress, nitrogen). Alongside this agronomic backbone, a distinct thermal-engineering strand is also visible, characterized by thermal-stress vocabulary and modeling terms (e.g., finite element, composite, coating), suggesting a boundary sub-theme in which heat-stress framing is expressed through engineering/structural or controlled-environment problem settings rather than field agronomy. A smaller, coherent salinity branch further indicates that the crop-focused literature differentiates into stress-specific pathways without displacing the dominant drought-yield agenda.
Wildfire differs from most themes in that its relative-intensity trajectory is dominated by episodic peaks rather than gradual accumulation (z-scores; Figure 5). Three major surges are visible: a pronounced increase in 2003, a second sequence of elevated intensity from 2005 to 2010, and further amplification from 2014 to 2025. The cluster’s semantic core is dominated by risk- and impact-oriented vocabulary (e.g., risk, vulnerability, distribution, health), indicating that wildfire-related literature is primarily structured around hazard characterization and impact framing rather than around a single biophysical mechanism.
The residual stratum (Cluster −1) analyzed here corresponds to the 62,928 BERTopic outlier documents (28.7% of the analytical corpus)—not to the 1623 supervised-residual “Other” records, which are too few to yield a stable thematic pattern. This BERTopic outlier set was subjected to a secondary unsupervised decomposition to detect latent signals. Far from being stochastic noise, this analysis of unclassified heterogeneous records revealed a coherent semantic structure focused on the urban–environment interface. The dominant terms include “urban”, “heat island” (and “urban heat island”), “runoff”, “basin”, and “quality”. The explicit presence of geographical markers like “China” suggests a strong spatial correlation with regions undergoing rapid urbanization. This indicates that a subset of the literature is moving beyond traditional rural boundaries to address the interactions between agricultural catchments and expanding urban centers, specifically regarding thermal regulation and water quality.
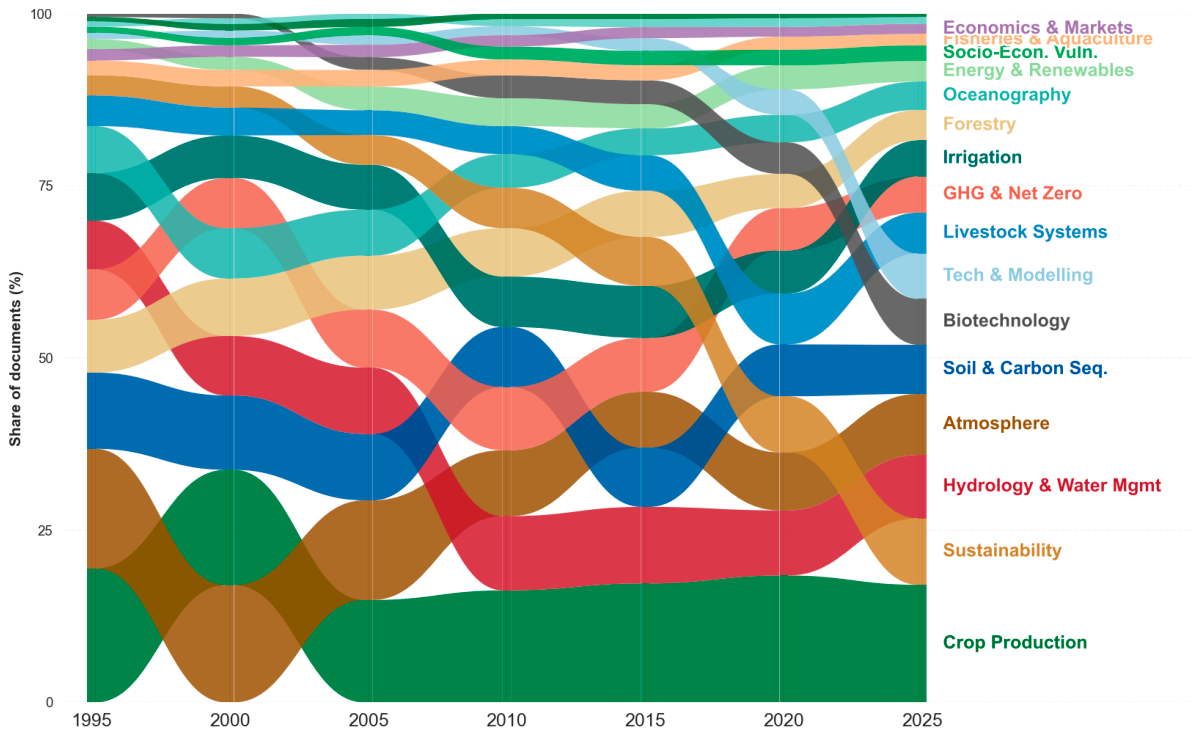
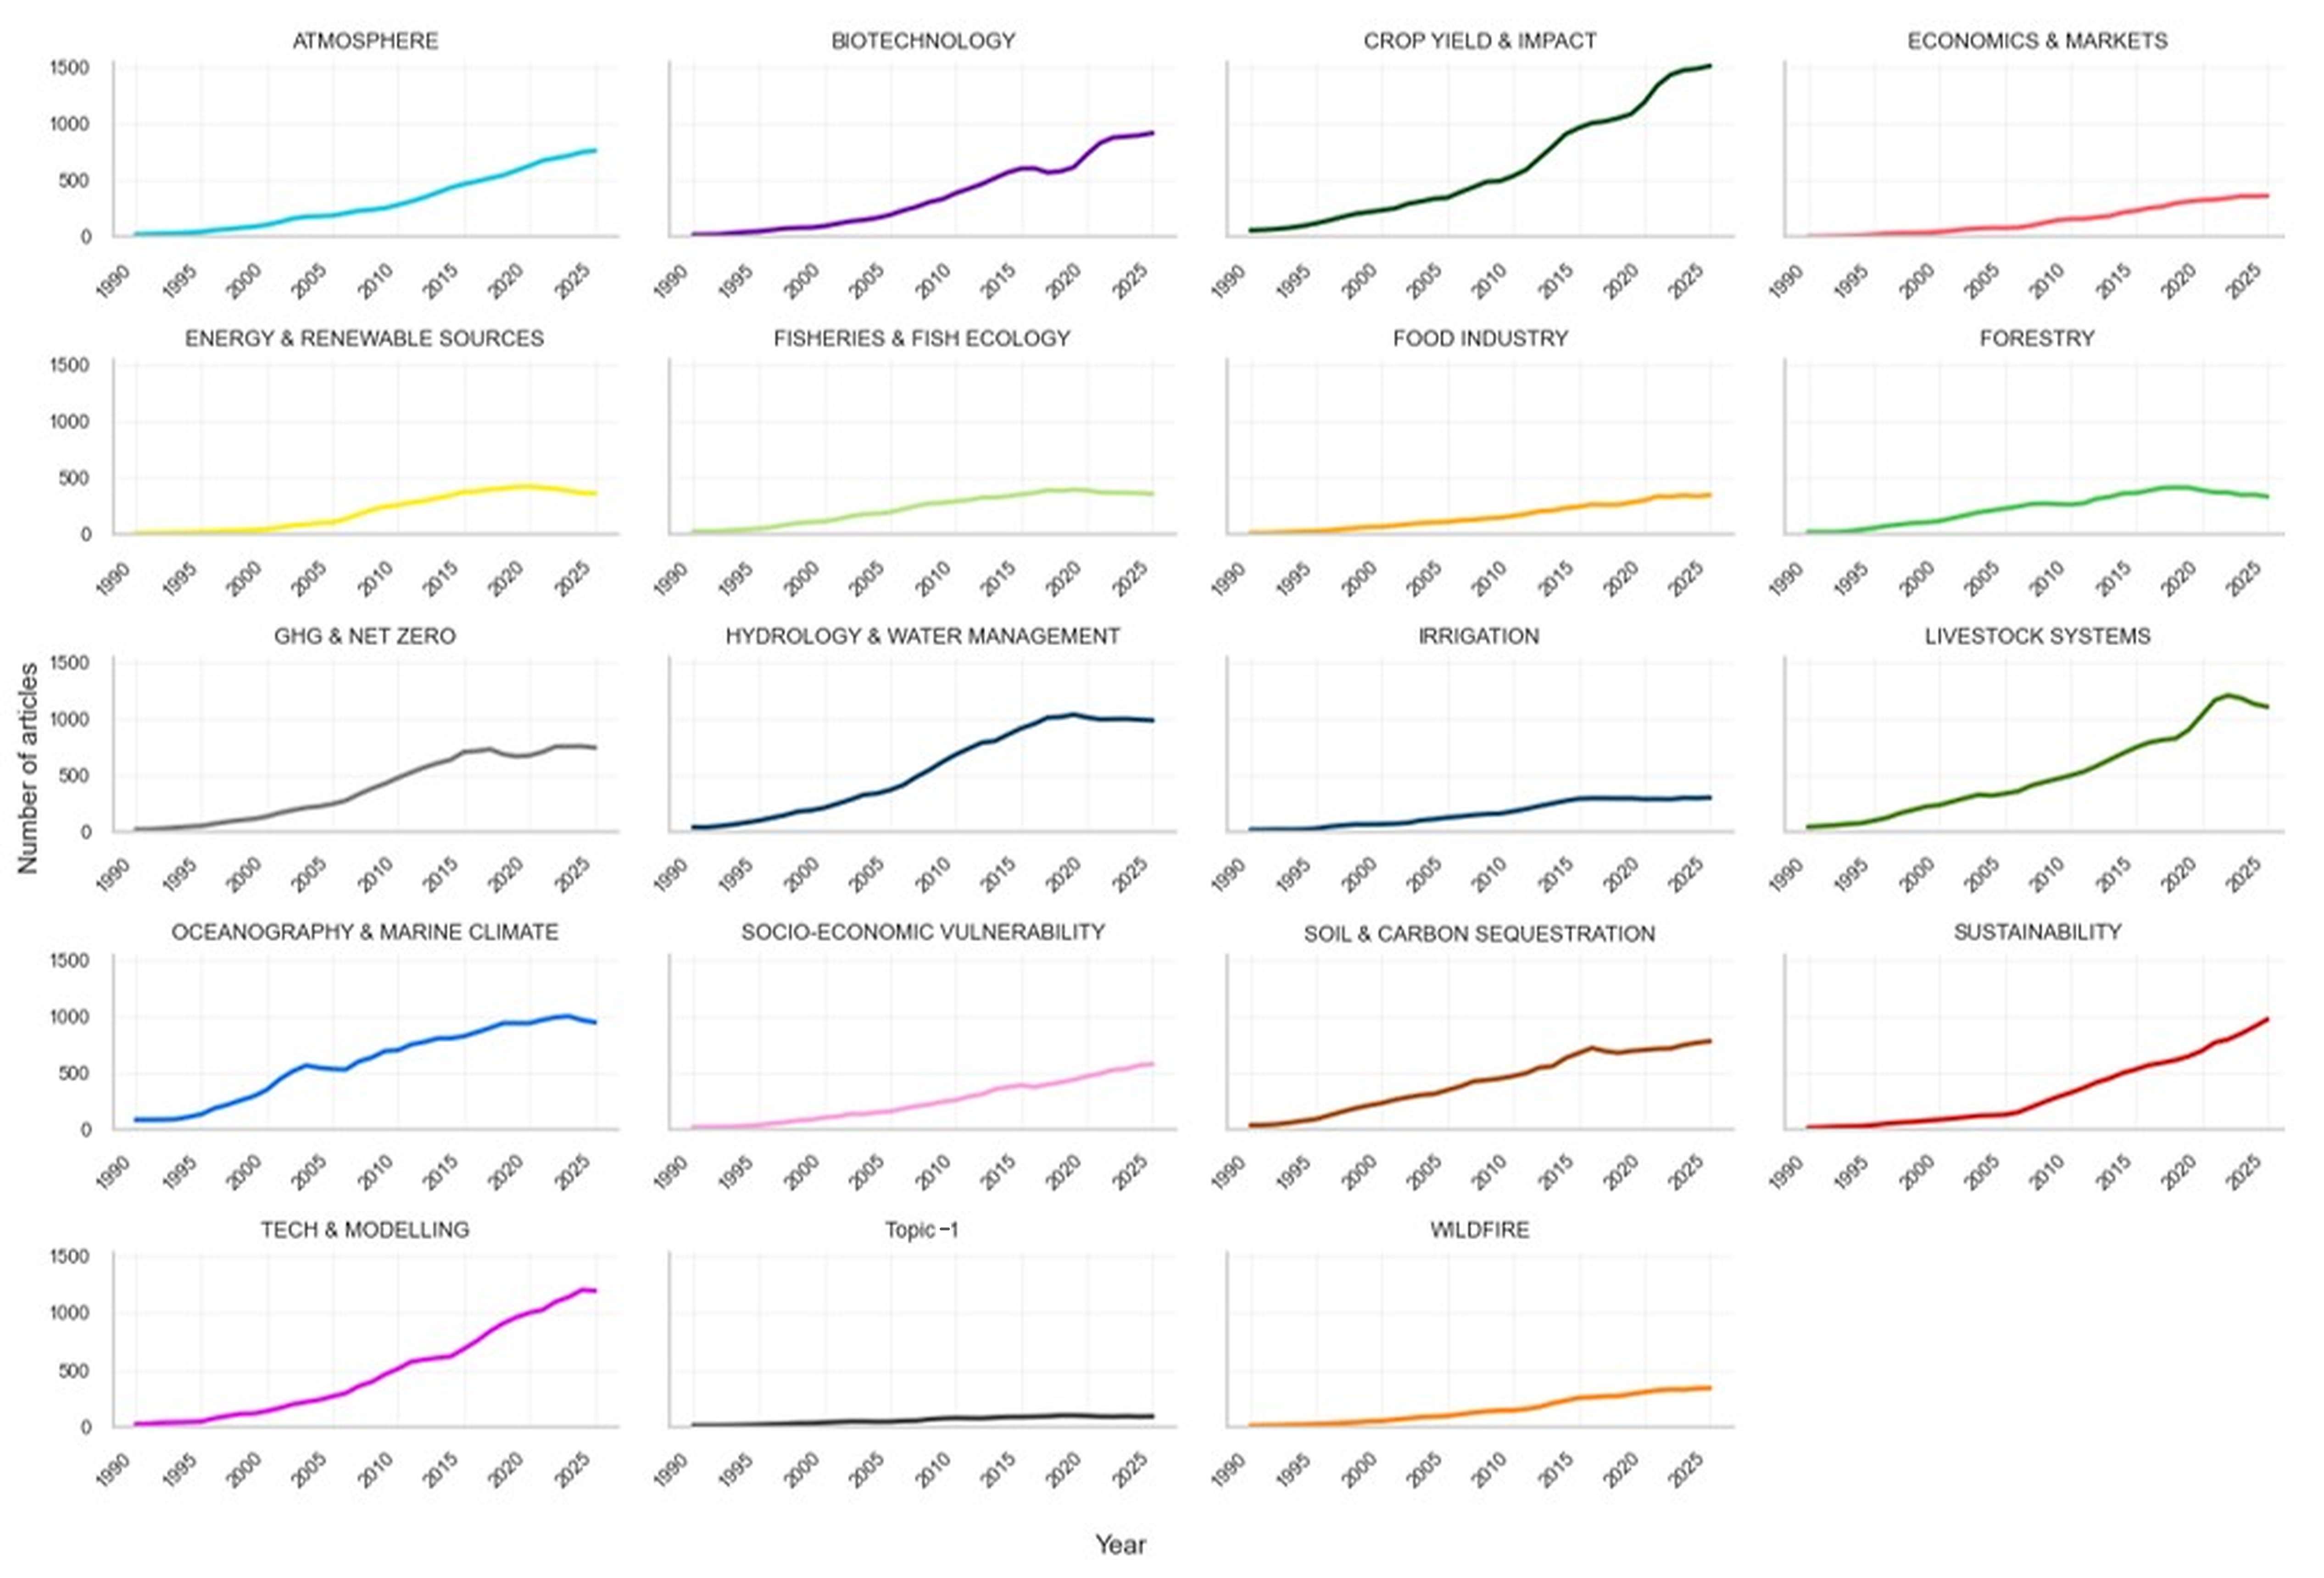
The stacked area evolution plot (Figure 6) shows incremental rebalancing rather than wholesale thematic replacement. Established pillars such as hydrology-oriented work remain a high-volume core domain, although its relative intensity attenuates in the early 2020s. At the same time, the field broadens by progressively adding layers that were previously peripheral, including sustainability framing, net-zero mitigation narratives, and social and economic vulnerability. The compositional view highlights that apparent declines in the share of some early-dominant clusters can coincide with growth in absolute volume, reflecting diversification of research agendas rather than displacement. Figure 7 complements this compositional view by presenting absolute publication trajectories, confirming that early foundational domains continue to grow in absolute terms even as newer, fast-accelerating fields increase their relative saliency.

3.5. Cross-Theme Co-Framing: Primary–Secondary Coupling Structure

Cross-theme co-framing, as within-primary shares under the conservative secondary-assignment criteria (SECONDARY_THRESHOLD = 0.08; SECONDARY/PRIMARY ≥ 0.85; coverage = 54.3% of analytically assigned documents), results in a coupling structure that is not dominated by a small set of isolated bridges (Figure 8). Instead, the heatmap shows that cross-theme combinations are broadly distributed across many primary themes, with numerous non-zero secondary links per row. This indicates that a substantial portion of the literature articulates climate–agriculture problems through multi-thematic frames rather than relying on strictly single-theme narratives.
In within-primary terms (Figure 8), the strongest directed couplings are Oceanography → Atmosphere (0.492), Atmosphere → Oceanography (0.481), and Socio-Economic Vulnerability → Economics & Markets (0.451). Two additional high-share couplings highlight a strong biophysical-intervention interface: Biotechnology → Crop Production (0.362) and its reverse Crop Production → Biotechnology (0.238). Overall, the directed co-framing patterns point to a layered, interconnected agenda rather than a set of isolated research silos.
Three additional patterns are particularly informative for the climate–agriculture intersection. Sustainability shows a systematic coupling with Socio-Economic Vulnerability, indicating that sustainability is frequently operationalized through distributional, livelihood, and equity-related lenses rather than being treated as an isolated normative label. The temporal co-occurrence landscape of Socio-Economic Vulnerability (Figure S7) reveals a trajectory of specialization and consolidation. In the early period, the cluster displayed a diffuse association pattern, exhibiting low-intensity links distributed across a wide range of biophysical sectors (including Livestock, Oceanography, and Food Industry). Over time, these peripheral connections have attenuated, while the core links to Atmosphere, Sustainability, and Economics & Markets have selectively intensified (reaching within-primary shares of 0.06–0.16).
Energy & Renewable Sources is repeatedly coupled with Technology & Modeling as a secondary framework, consistent with an implementation-oriented strand in which decarbonization and energy-system questions are mediated by modeling, sensing, and data-driven methods. Finally, Energy & Renewable Sources also couples with GHG & Net-Zero as a secondary frame, reinforcing that the energy theme often appears embedded in emission accounting, mitigation targets, and net-zero framing rather than as a stand-alone technical domain.
A particularly intense coupling connects mitigation with economic analysis. GHG & Net-Zero exhibits its strongest association with Economics & Markets (0.367), significantly outranking linkages with biophysical clusters. The reverse relationship is also robust, as Economics & Markets frequently recruits GHG & Net-Zero as a secondary frame within the analyzed documents (0.189).
A structural asymmetry characterizes the livestock sector. When GHG & Net-Zero serve as the primary frame, Livestock Systems appear as a prominent secondary topic (0.125), indicating that the mitigation literature heavily scrutinizes animal production as a key source of emissions. However, the reverse coupling is less intense: within the Livestock Systems cluster, the co-framing with GHG & Net-Zero drops to 0.072. Crucially, this mitigation signal is effectively balanced with adaptation concerns, as evidenced by its link to Atmosphere (0.066), which captures heat-stress research. This suggests that the livestock literature distributes its focus between the external pressure to decarbonize and the internal biological challenge of thermal adaptation.
Because the primary–secondary construction is intentionally conservative, some substantively plausible linkages may appear attenuated when competing secondary frames systematically outrank them. For instance, wildfire-related work is frequently co-framed through Atmosphere, GHG & Net-Zero, or Technology & Modeling (smoke and air-quality processes, fire emission accounting, remote sensing of burned area and severity), which can displace Forestry to third or fourth position even when the forest context is present.

3.6. Spatial Scale of Research

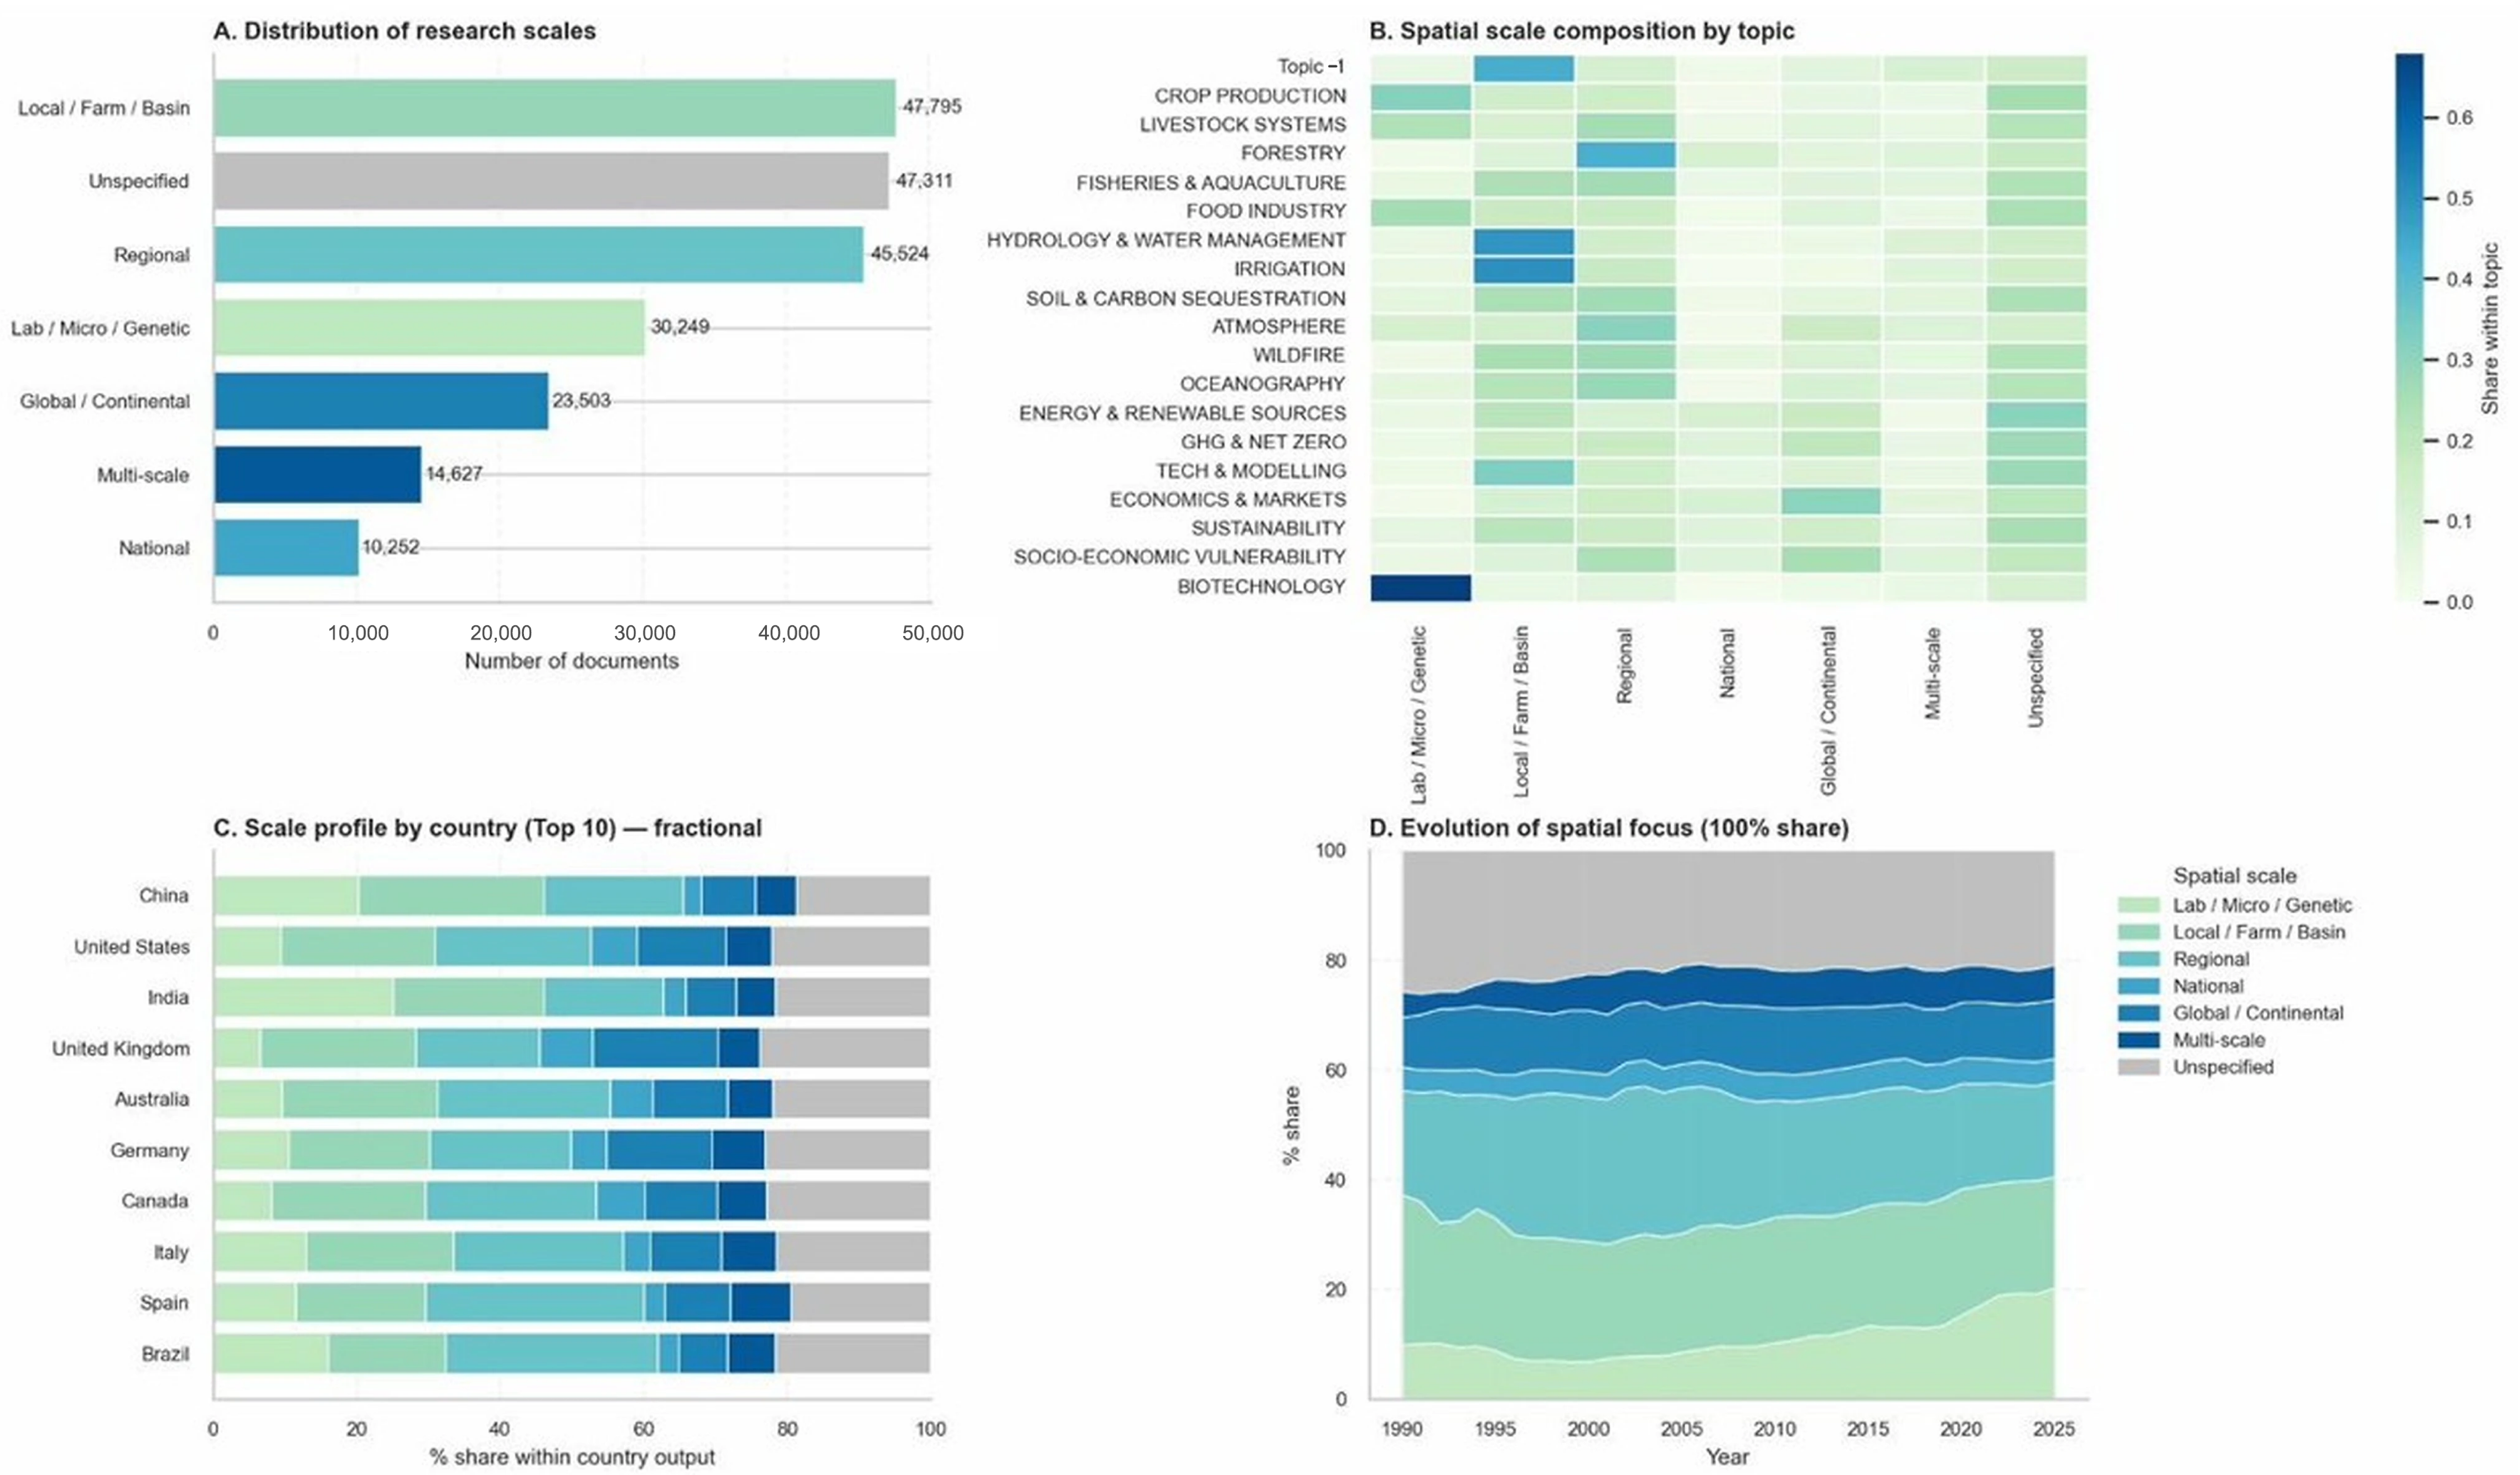
The analysis of spatial scales (Figure 9, Panel A) indicates that the Local/Farm/Basin scale accounts for the largest volume of classified documents (47,795), followed by the Regional (45,524), Lab/Micro/Genetic (30,249), Global/Continental (23,503), and National (10,252) scales. Multi-scale studies account for 14,627 documents. As the validation indicates that this boundary category is over-assigned (Table S9), the multi-scale count should be interpreted as an upper bound. Documents classified as Unspecified amount to 47,311. Many documents in this category are likely theoretical, methodological, or review contributions whose spatial scope is either explicitly global-generic or deliberately unspecified, rather than representing a gap in the classification pipeline.
Regarding the thematic distribution (Figure 9, Panel B), the Biotechnology, Crop Production, Livestock Systems, and Food Industry clusters display the highest concentration of documents at the Lab/Micro scale. Hydrology & Water Management, Irrigation, Technology & Modeling, and Soil & Carbon Sequestration predominantly comprise documents on the Local/Farm/Basin scale. In contrast, the GHG & Net-Zero, Economics & Markets, and Socio-Economic Vulnerability clusters show the highest shares of global-scale documents.
In terms of geographic profiles (Figure 9, Panel C), China and India exhibit the highest proportions of output at the Lab/Micro scales among the top ten producers. The United Kingdom, Germany, and the United States present higher proportions of documents classified at the Global and Regional scales compared to the Asian producers.

4. Discussion

The results presented here reflect the structure and evolution of the published climate–agriculture research agenda over three and a half decades. Publication growth is non-uniform, and thematic attention is unevenly distributed, with implications for how evidence maps onto adaptation and mitigation priorities [7]. In this context, growth regime analysis (CAGR) characterizes changes in publication volume, while normalized indicators such as z-scores and log-relative indices capture shifts in relative thematic attention after accounting for overall corpus expansion.

4.1. Policy Milestones and Growth Regimes

The publication trajectory displays six distinct growth regimes separated by breakpoints in 1994, 1998, 2004, 2009, and 2016 (Figure 2). Rather than a steady, uniform expansion, this step-wise evolution aligns with expanded research funding for climate and agriculture initiatives and the influence of major reports, including successive IPCC assessment cycles and associated national and international programs, which emphasized the urgent need for adaptation and mitigation [11,42]. Recent assessments (including AR6) reinforced urgency within the mature, post-2016 regime, but the structural breaks themselves map more directly onto earlier policy cycles that formalized mitigation and adaptation architectures [39,43].
The earliest phase (1990–1994) exhibits moderate growth, corresponding to the preparatory scientific groundwork following the IPCC’s First Assessment Report (1990) and the drafting of the United Nations Framework Convention on Climate Change (UNFCCC). The first structural break in 1994 aligns with the official entry into force of the UNFCCC (March 1994). This triggered an explosive expansion phase (1994–1998), the highest growth rate in the series, reflecting an immediate influx of institutional mandates to characterize biophysical impacts as nations prepared for the first binding emission discussions and for the development of national reporting and research infrastructures under the Convention.
The subsequent 1998 breakpoint coincides with the immediate aftermath of the adoption of the Kyoto Protocol (December 1997). The ensuing period (1998–2004) represents the complex negotiation and ratification phase of the Protocol (e.g., the Marrakesh Accords), during which the research agenda rapidly incorporated greenhouse gas emission accounting, sectoral emission inventories, and early mitigation strategies. While growth remained strong (+8.0%/yr), the agenda also broadened beyond emission accounting into operational monitoring, sectoral vulnerability, and early adaptation framings, consistent with the consolidation of reporting standards and implementation rules during the Kyoto ratification cycle.
This upward trajectory accelerated again following the 2004 breakpoint (2004–2009). This phase captures the actual entry into force of the Kyoto Protocol (February 2005) and the launch of the European Union Emissions Trading System (EU ETS), which effectively created the first major carbon market. This period also encompasses the release of the IPCC Fourth Assessment Report (2007), drastically increasing the political urgency leading up to the 2009 Copenhagen Summit (COP15) [44]. The higher CAGR in 2004–2009 (+9.3%/yr) is consistent with this convergence of implementation (Kyoto operationalization, EU ETS) and agenda-setting (AR4, COP momentum), which together expanded both mitigation-oriented research and applied sectoral assessment.
Following the 2009 breakpoint, the growth rate drops to a lower but still robust regime (2009–2016). This phase retains robust expansion (+4.9%/yr) but signals maturation: the field moves from rapid agenda formation toward consolidation of sectoral adaptation and risk frameworks, alongside the mainstreaming of climate services, monitoring, and impact modeling. It also anticipates the policy transition toward an NDC-based regime, formalized in 2015. Finally, the 2016 breakpoint marks a structural shift into the current high-volume steady state (2016–2025). This milestone is consistent with the entry into force of the Paris Agreement (November 2016) and the operationalization of the UN 2030 Agenda (adopted in 2015 and implemented through subsequent national strategies and reporting cycles) [45].
In bibliometrics, these early growth phases are often interpreted through the lens of Price’s expansion dynamics, in which emerging research areas exhibit steep exponential increases that later stabilize as paradigms, infrastructures, and funding architectures consolidate [46]. While the temporal alignment between structural breaks and policy milestones does not demonstrate strict causality, it strongly supports the interpretation that the scientific agenda systematically responds to global policy cycles in which mitigation, adaptation, and sustainable development frameworks become progressively codified and operationalized [39,47].
The post-2016 regime does not signal declining activity but a deceleration in growth rate (+2.0%/yr) amid sustained high output. This pattern is consistent with a transition from an emerging niche to an institutionalized priority, in which climate–agriculture research becomes embedded across multiple disciplines and expands primarily through internal differentiation (specialization, methodological refinement, and thematic diversification) rather than continued rapid entry of new work streams. In this mature phase, growth is expressed less as exponential scaling and more as recombination of established themes under Paris-era implementation cycles and the diffusion of net-zero and NDC frameworks.

4.2. From Growth Regimes to Thematic Reconfiguration

Read chronologically, the thematic trajectory can be summarized in four broad periods that complement the data-driven breakpoints identified. The early period (1990–2000) is dominated by the assessment of climatic impacts on agricultural productivity. The 2001–2010 decade is marked by the consolidation of food-security concerns and the quantification of greenhouse gas emissions (CO2, CH4 and N2O). During 2011–2020, the field broadened toward sustainability framings and the first wave of digital agriculture. Finally, the 2021–2025 period is characterized by climate resilience, the uptake of artificial intelligence in agriculture, and the emergence of re-generative agriculture approaches. These periods are descriptive rather than mutually exclusive and map onto the segmented growth regimes (breakpoints in 1994, 1998, 2004, 2009 and 2016) discussed above.
This transition to a mature, high-volume regime is accompanied not only by specialization but also by structured cross-theme integration. The directed primary–secondary co-framing patterns show that a substantial share of publications combines a dominant thematic anchor with a recurrent secondary frame across many rows of the matrix, indicating that differentiation in mature stages occurs through modular recombination of themes rather than the formation of isolated subfields. Thematic growth after 2016 is thus expressed as a more interconnected agenda, where climate–agriculture questions are increasingly articulated through coupled physical, management, and socio-economic frames.
A central reconfiguration in the corpus is the transition from documenting climate impacts to developing intervention-oriented adaptation strategies [48]. The early decades primarily focused on characterizing effects on yields and production conditions, often through process-based modeling, empirical assessments, and identification of yield gaps. Over time, research has increasingly shifted toward designing interventions that modify the production system itself. The emergence of the biotechnology cluster after 2009 signals this shift, indicating a growing emphasis on biological adaptation pathways, such as stress tolerance and resilience traits, rather than on management adjustments alone [49]. This trend aligns with the diffusion of genome-enabled breeding pipelines, omics-informed trait discovery, and the scaling of high-throughput phenotyping platforms, collectively moving the research frontier from impact documentation toward engineering and selecting stress-resilient phenotypes [50,51]. It also reflects concerns that conventional yield gains may plateau under climate stress, thereby increasing the impetus to invest in genetic and molecular innovation to sustain productivity trajectories [52].
This intervention turn is also visible in cross-theme coupling. Biotechnology and Crop Production form a near-symmetric pair, indicating a two-way interface between impact diagnosis and intervention design: yield-impact work frequently invokes biotechnology as a secondary frame, while biotechnology papers often remain anchored in productivity and yield impacts as the dominant problem definition. This bidirectional coupling is consistent with a research agenda that links climate-impact assessment directly to biological innovation pathways.
The Technology & Modeling cluster follows a late-emerging, upward trajectory rather than an early peak followed by decline. In the 1990s and much of the early 2000s, its relative intensity remained mostly below the cluster’s long-run mean, suggesting that modeling and computational methods were present but had not yet emerged as a distinctive thematic signature within the corpus. From the late 2000s onward, the cluster shifts into sustained positive intensity, with the strongest values concentrated in the most recent period. This pattern is consistent with a methodological consolidation in which modeling becomes a central organizing layer of climate–agriculture research, increasingly framed around prediction, forecasting, and decision support. In this setting, the rise is not simply a matter of “more technology,” but of technology becoming a primary framing, with data-driven methods (including machine learning) gaining salience alongside process-based simulation. Importantly, this intensification can coexist with diffusion across domains: modeling may be widely used, but the heatmap indicates that it is increasingly explicit as a thematic anchor rather than merely an instrumental background.
The co-framing structure supports this diffusion interpretation: Energy & Renewable Sources frequently carries Technology & Modeling and GHG & Net-Zero as secondary frames, suggesting that energy-related work in the climate–agriculture domain is often mediated by modeling/analytics stacks and embedded within emission and net-zero accounting narratives rather than operating as a stand-alone theme. This is consistent with a methodological layer that has become infrastructure-like and therefore appears across multiple substantive topics.
This interpretation is reinforced by the internal composition of the two core production-facing macro-themes. Within Crop, the dominant language remains centered on drought-related yield impacts and stress physiology in major cereals (drought, yield, heat stress; rice, wheat, maize), indicating that impact quantification and stress-oriented agronomy continue to function as the empirical backbone of the field even as new intervention pathways (e.g., biotechnology) expand. At the same time, the Technology theme is dominated by modeling, prediction, and machine learning vocabulary, while controlled-environment and evapotranspiration/productivity estimation appear as secondary, more applied strands. Together, these signals are consistent with a mature regime in which methodological layers become both more sophisticated and more widely embedded rather than replaced.
The recurrence of “stress” across diverse biological clusters (Crop Production, Livestock, Biotechnology, Atmosphere) reveals a shared physiological epistemology. Whether referring to “thermal stress” in livestock or “abiotic stress” in genomic research, the lexicon indicates that the scientific community operationalizes climate change not merely as a meteorological hazard, but as a biological limit. The semantic coupling of “stress” with terms like “tolerance” and “gene” (Cluster 17) further underscores the paradigm shift toward engineering biological resilience against physical constraints.
This physiological focus creates a distinct framing asymmetry regarding the sector’s role in climate change. While the global mitigation agenda (captured by the GHG cluster) explicitly targets livestock as a high-priority emission sector (co-occurrence 0.125), the livestock literature itself does not reciprocate with the same singular intensity. Instead, it adopts a “dual burden” approach, balancing the responsibility of mitigation (0.072) with the immediate biophysical imperative of adaptation (0.066). Unlike the mitigation-centric view, which defines the animal primarily as a source of carbon, the livestock sciences operationalize climate change as a compound challenge where animal survival (thermal stress) and emission reduction must be addressed simultaneously.
A second primary reconfiguration concerns greenhouse gas framing. Earlier literature emphasized agriculture as a source of emissions, focusing on methane and nitrous oxide, inventories, and mitigation opportunities. More recent discourse increasingly foregrounds soil carbon, storage, cycling, and sequestration, indicating a broader narrative in which land management is positioned not only as a mitigation domain but also as a potential contributor to net-zero strategies through enhanced sinks [53]. This pattern is consistent with the mainstreaming of negative-emission concepts and the expanded relevance of land-based carbon pathways in net-zero policy discussions [54,55]. The implication for the research agenda is a shift from focusing on reducing emission flows to also managing carbon stocks in soils and biomass [4]. While this does not demonstrate deployment at scale, it documents a precise reframing of the scientific problem space and the coupling between agricultural management, climate targets, and accounting frameworks [56].
The structural fusion between agronomy and climate policy is reflected in the lexical overlap between the Soil (Cluster 7) and GHG (Cluster 12) domains. The terms “soil organic” and “carbon” act as dual-purpose tokens, anchoring both the study of soil properties and the discourse on global emissions. This semantic bridge supports the interpretation of a “Soil Carbon Turn”: it suggests that soil organic matter is no longer viewed solely as a fertility indicator for farmers but is increasingly framed in the literature as a planetary carbon sink for climate mitigation strategies.
Complementarily, the secondary-frame patterns indicate that decarbonization and net-zero logic serve as a recurrent interpretive layer across adjacent domains (e.g., energy), reinforcing the view that mitigation accounting functions as an organizing frame that cuts across multiple substantive themes rather than remaining confined to a dedicated emission cluster. However, the most dominant frame for greenhouse mitigation is not biophysical but economic. The intense co-occurrence between GHG & Net Zero and Economics & Markets (0.367), the highest within this cluster, suggests that emission-related research is closely linked to economic questions of abatement costs, carbon pricing, and market efficiency [57]. This suggests that in the agricultural research agenda, “net zero” is operationally defined as an economic optimization challenge as much as a technical one [58].
Moreover, the GHG and Net-Zero intensification aligns with the Kyoto Protocol (1997, entered into force in 2005), the Copenhagen Accord (2009), and the Paris Agreement (2015, entered into force in 2016) [42,59,60]. Recent data indicate a stabilization of this theme, as mitigation research increasingly integrates into broader circular-economy and land-use carbon-accounting frameworks [7,61,62]. However, the semantic structure of this cluster reveals a critical evolution beyond simple monitoring. While terms like “methane”, “carbon dioxide”, and “greenhouse gas emissions” reflect the foundational focus on inventorying non-CO2 gases from livestock and rice systems, the high prevalence of “soil organic”, “soil organic carbon”, “cycle”, and “storage” indicates a structural reorientation. This co-occurrence suggests that the research frontier has moved from merely quantifying the problem (emission accounting) to characterizing the solution: leveraging the soil carbon cycle as a sink. The emergence of terms like “low” (associated with low-carbon pathways) and “control” further points to a shift toward active mitigation management rather than passive observation.
This shift from observation to management is echoed in the trajectory of the Oceanography cluster. Its early dominance (1990–2005) and subsequent relative decline reflect a fundamental epistemological shift in the corpus. The initial focus on physical climate drivers (e.g., “boundary layer”, “heat”, “surface”) indicates that the foundational phase was primarily concerned with characterizing the macro-climatic system. However, as the field matured, this focus gave way to applied terrestrial concerns. The structural transition explains the simultaneous rise in Crop Production and Hydrology, marking a pivot from analyzing the “climate machine” to managing its consequences on land-based resources.
A third reconfiguration is the increasing prominence of local production constraints, particularly freshwater, and the concurrent rise in social and economic vulnerability framing [63]. Water has become a major organizing problem through the late 2000s and 2010s, expressed in two adjacent clusters (Hydrology & Water Management and Irrigation). Both show relative attenuation in the early 2020s as other themes intensify [64,65]. This pivot aligns with the view that water, not just temperature, is a critical binding constraint on agricultural production under climate variability, driving attention to water-use efficiency, irrigation scheduling, deficit irrigation strategies, and demand-side optimization. It also reflects an evolution from studying the climate system as a global physical driver toward managing climate impacts as locally binding constraints in production landscapes.
Within Hydrology, this shift is not only visible at the macro-theme level but also in the dominance of drought monitoring and operational water-management language (remote-sensing-enabled monitoring, groundwater and water quality, irrigation and efficiency), which suggests that water is increasingly framed as a managed production input rather than a background physical condition.
Semantic analysis identifies “drought” as the field’s central node, appearing as a top-ranking term in 11 out of 18 clusters. This structural ubiquity suggests that water scarcity functions as the primary integrating force of the discipline, connecting physical hazards (Wildfire), physiological bottlenecks (Crop Production), and financial liabilities (Economics). However, the recent surge in “heat stress” (which, in our corpus, increases sharply and becomes comparable to “drought” in frequency after 2021) signals a critical evolution in the research agenda. While water scarcity remains the structural backbone of the discipline, thermal stress has emerged as the most rapidly expanding frontier after 2020. This implies a shift from a fundamentally hydro-centric paradigm toward a compound-stress framework, where the biological thermal limits of crops and livestock are becoming as binding as water availability.
In parallel, the emergence of social and economic vulnerability after 2010 suggests a substantive social turn. Research increasingly couples biophysical impacts with social dimensions such as inequality, institutions, gender, and access to resources, broadening the framing from yield security to livelihood security. This evolution mirrors changes in climate risk frameworks where vulnerability is conceptualized as a condition shaped by exposure, sensitivity, and adaptive capacity rather than a residual outcome after physical impacts are estimated [2]. This “social turn” within the agricultural corpus is consistent with broader bibliometric evaluations of adaptation science, which show that as the field matures, it systematically diversifies from purely natural sciences to integrate social sciences, equity, and institutional governance [39,43]. In practical terms, the co-presence of technical adaptation themes and vulnerability themes in our semantic network supports this interpretation of maturation: it suggests a growing scientific consensus that technical solutions alone are insufficient when institutional and socio-political barriers dictate who can actually benefit from innovations [1,66].
Moreover, the shift from scattered linkages toward a consolidated focus suggests that vulnerability constructs have evolved from a diffuse background notion into a more structured research pillar. In our semantic structure, this pillar is consistently articulated through a recurrent triad linking physical hazards (Atmosphere), economic transmission mechanisms (Economics & Markets), and normative resilience framings (Sustainability). The concept has matured from a descriptive tag into an independent research pillar that consistently frames climate risk as the intersection of weather shocks, economic capacity, and long-term development goals.
The directed couplings also clarify how this social turn is operationalized: Socio-Economic Vulnerability is strongly paired with Economics & Markets, indicating that vulnerability is frequently framed through market mechanisms, prices, and channels of economic stress transmission. In addition, Sustainability shows systematic coupling with Socio-Economic Vulnerability, suggesting that sustainability is often articulated through distributional and livelihood lenses rather than as an abstract normative label. Specifically, the term “environmental” links sustainability narratives with technical sectors like Energy and Fisheries, illustrating how sustainability themes integrate with production and resource-conservation strategies. This diffusion solidified into a structural pillar post 2015, synchronizing with the global adoption of the UN 2030 Agenda in September 2015. This is consistent with a transition toward sustainability as a transversal framing that increasingly cuts across multiple thematic domains in the climate–agriculture nexus [67] and becomes especially salient within the mature, post-2016 high-volume regime (Figure 2).
Since 2010, research has moved beyond simple economic impact assessments (e.g., cost–benefit analyses of yield loss) toward multidimensional frameworks that address land tenure, gender equity, and adaptive capacity [68]. This consolidation aligns closely with the post-2015 global policy landscape, specifically the adoption of the UN Sustainable Development Goals (SDGs), which effectively mandated integrating poverty reduction (SDG 1) and gender equality (SDG 5) into climate action research [69].
Wildfire differs from most themes in that its relative-intensity trajectory is episodic, characterized by sharp peaks rather than gradual accumulation. Several peaks align with widely documented windows of compound hot–dry extremes and high-salience fire activity across regions. The 2003 European heatwave coincided with anomalous fire seasons in parts of southern Europe, reinforcing research frames centered on risk, vulnerability, exposure, and health impacts, which align with the cluster’s dominant vocabulary [70,71]. A second elevation during 2005–2010 is consistent with major drought-fire episodes reported in the Amazon (2005) and with subsequent extreme fire seasons and heat events that triggered substantial attention to loss estimation, early warning, and smoke-related impacts (including the 2010 Russian heatwave–wildfire episode, frequently referenced in the compound-extreme literature) [72].
Later peaks are also plausibly connected to globally visible crises such as the 2015 Southeast Asian haze event and the 2019–2020 Australian “Black Summer”, both of which generated strong health- and risk-oriented research outputs [73,74]. Finally, recent European fire seasons with exceptionally high burned areas (e.g., EU totals surpassing 1 million hectares in 2025) provide an additional contextual anchor for the sustained late-period elevation in the wildfire signal. Taken together and consistent with the peak-dominated z-score trajectory reported in Section 3.4, the pattern suggests that wildfire-related research attention is particularly responsive to extreme-event windows, in which hazard characterization and impact framing become immediate scientific priorities.

4.3. Geographic Concentration and Epistemic Asymmetries

Despite the global relevance of climate–agriculture challenges, the production of scientific output is highly concentrated. The United States and China dominate publication volume, while many highly exposed regions, including parts of sub-Saharan Africa and small island contexts, contribute relatively few papers. This imbalance raises questions about the representativeness of research agendas and the extent to which the literature captures locally specific constraints and adaptation options [39,75].
Two contrasting cases illustrate the stakes of these asymmetries. Brazil has emerged as the leading scientific contributor from the Global South, ranking among the top-producing countries and reflecting sustained national investment in tropical and large-scale agricultural research. By contrast, Sub-Saharan Africa remains markedly underrepresented despite being one of the regions most exposed to climate change and most dependent on rain-fed smallholder agriculture. Narrowing this gap will require deliberate measures, including South–South research cooperation, targeted international funding, investment in local data infrastructure, and capacity-building programs that strengthen regional authorship rather than peripheral participation.
Furthermore, our supervised clustering analysis reveals a distinct divergence in regional priorities that goes beyond a simple “Global North—South” dichotomy. While Oceanography and Hydrology remain foundational in Western agendas (USA, France), a structural split emerges between mitigation-focused and production-focused economies. The distinct prioritization of GHG & Net Zero themes in the United Kingdom and Canada reflects a research landscape heavily influenced by mitigation policy frameworks and emission reduction targets. In contrast, the leading Asian economies (China and India) exhibit a clearly “productivity” orientation, where Crop Production, Biotechnology, and Technology & Modeling dominate the agenda [76].
This suggests that for emerging powers, climate adaptation is operationalized primarily through technological intensification and yield stability (a technological approach) rather than the emission-centric focus of parts of the West [77]. Meanwhile, in water-scarce regions like Spain and Australia, the dominance of Hydrology signals an existential focus on resource scarcity. Consequently, global thematic aggregates may mask meaningful regional emphases and policy-relevant variation in research priorities.
The expansion of biotechnology raises questions about differential access since the institutional and financial prerequisites for genomic pipelines and high-throughput phenotyping are unevenly distributed. Regions with constrained research infrastructure risk falling further behind, particularly where smallholder systems predominate. Technology-transfer mechanisms and capacity-building programs, including regional breeding networks and open access data platforms, may reduce this asymmetry, though their effectiveness depends on aligned policy and investment conditions.

4.4. Thematic Gaps and Future Opportunities

Several gaps emerge from the mapped structure of attention.
Although vulnerability-oriented research has increased, there remains an opportunity to translate vulnerability constructs into operational design requirements for technologies and policies, including access, data, and service governance, as well as institutional delivery mechanisms.
The prominence of hydrology and efficiency themes suggests that cross-scale water governance and institutional performance remain critical areas where synthesis and comparative metrics could be further developed, complementing the predominantly technical optimization focus [78,79].
The reactive pattern in wildfire-related attention suggests the value of more prospective approaches that standardize metrics and support preparedness, early warning, and scenario planning rather than primarily ex post analysis.
Finally, the semantic decomposition of the residual stratum (Cluster −1) reveals an emerging frontier: the urbanization of agricultural climate risks. Far from being stochastic noise, this unclassified segment contains a coherent latent structure that explicitly links “urban heat islands”, “surface runoff”, and “water quality” with “China”. This geographical specificity coincides with the unique pressure of China’s rapid urbanization on its hydrological systems, where high-intensity agriculture competes spatially with expanding impervious surfaces [80]. The presence of terms such as “runoff” and “basin” likely captures the scientific literature on China’s “Sponge City Program” (SCP), in which agricultural lands at the peri-urban interface are increasingly repurposed as ecological buffers for urban flood management and water purification [81]. This signals a paradigm shift, with adaptation research moving beyond the traditional rural/urban divide to analyze how microclimates (heat islands) and urban hydrological engineering directly alter agricultural production conditions in the hinterland [82].

4.5. Systems Lens: Interfaces and Coupling Pathways

From a system perspective, the three recurrent interfaces identified (water–crop, biotechnology–production, and vulnerability–economy–sustainability) suggest that the climate–agriculture knowledge base is organized as a modular system rather than a set of isolated silos. The practical implication for research design is that cross-cutting studies targeting these interfaces are likely to generate disproportionate evidence value: a study simultaneously addressing irrigation efficiency (Hydrology) and stress-tolerant varieties (Biotechnology) addresses both modules of the water–crop interface and would contribute to both the impact-diagnosis and the intervention-design layers. Similarly, programs coupling food-security assessment (Socio-Economic Vulnerability) with economic modeling of abatement costs (Economics & Markets) directly target the most densely coupled interface in the corpus. Research programs targeting these interface boundaries, rather than remaining within single thematic clusters, are likely to generate evidence with broader applicability across adaptation and mitigation domains (Figure 8).

4.6. Contribution and Limitations

The analytical pipeline presented here offers a reproducible procedure for mapping large disciplinary corpora by integrating unsupervised semantic structuring with domain-driven supervised macro-themes. The approach employs the BERTopic neural topic modeling framework, combining SPECTER transformer-based document embeddings, UMAP dimensionality reduction, and HDBSCAN density-based clustering to identify clusters in a computationally efficient and interpretable latent space, while supervised assignment establishes a transparent link between data-driven clusters and domain-relevant categories. The application of normalized temporal indicators, including z-scores and log-relative indices, enables the separation of absolute publication growth from relative shifts in thematic attention, thereby supporting the interpretation of structural reorientation rather than mere volume expansion.
Several limitations should be acknowledged. Reliance on Scopus can introduce coverage bias, particularly for non-English and regional outlets, thereby affecting both geographic patterns and thematic visibility. Parameter choices in preprocessing, dimensionality reduction, and clustering influence the number and boundaries of the discovered themes, and thematic overlap is expected in integrative concepts such as sustainability, technology, and vulnerability, which can produce lower cluster purity and higher entropy in classification outputs. Country attribution also depends on the counting method. Complete counting is standard and suitable for descriptive mapping, but it can outweigh internationally coauthored papers in multi-country outputs; fractional counting provides an alternative sensitivity check. Finally, bibliometric signals alone cannot establish causal drivers. Policy alignments and methodological transitions should be interpreted as shifts in scientific attention and framing, ideally complemented by qualitative reading, citation context analysis, and expert interpretation. Future work can address these limitations through multi-database replication, multilingual extensions, sensitivity analyses across modeling parameters, and complementary qualitative synthesis to validate and contextualize the mapped patterns.

5. Conclusions

This study characterized the structure and evolution of climate–agriculture research and quantified how research priorities have shifted over time. Drawing on 219,261 Scopus-indexed documents published between 1990 and 2025, it reconstructs the field into 18 coherent macro-themes, traces their temporal evolution, and characterizes the geographic and spatial-scale distribution of the evidence base.
The findings indicate an overall acceleration in scientific output, a pronounced geographic concentration, and dominant themes centered on hydrology, crop impacts, and biotechnology. Normalized indicators reveal a structural reorientation toward biotechnology and GHG & Net-Zero strategies, alongside a critical “social turn” focused on vulnerability and sustainability.
These trends are not self-correcting. The persistence of thematic silos, in which genomic innovation and social vulnerability remain largely separate research clusters, signals a risk of maladaptation. A practical implication for funders is to encourage and prioritize research designs that explicitly couple biophysical innovations (such as drought-tolerant genetics or irrigation efficiency) with Socio-Economic Vulnerability assessments, for example, through interdisciplinary calls, evaluation criteria that reward integrated framings, and support for mixed-method evidence synthesis. Policy-facing programs would similarly benefit from supporting integrated socio-ecological research agendas that increase the likelihood that scientific breakthroughs translate into equitable livelihood security for vulnerable regions.
The geographic asymmetries documented above affect how reliably the accumulated evidence base can inform adaptation guidance. The concentration of output in the United States and China means that the accumulated knowledge base disproportionately reflects the constraints, technologies, and institutional contexts of high-input agricultural systems. Regions such as sub-Saharan Africa and parts of Latin America, which face the greatest exposure and adaptive capacity deficits, remain systematically underrepresented. This epistemic gap risks skewing adaptation recommendations toward solutions that are feasible in resource-rich contexts but not readily transferable to smallholder-dominated, resource-constrained systems. Correcting this imbalance requires greater geographic diversification in research funding alongside investment in capacity building, South–South knowledge exchange, and sustained monitoring of whether regional representativeness improves in subsequent output cycles.
Large-scale bibliometric analyses of the climate–agriculture domain benefit substantially from neural topic modeling approaches. The BERTopic framework, by leveraging scientific document embeddings and density-based clustering, produces thematically coherent and interpretable topic structures that reveal both dominant research pillars and emerging frontiers with greater precision than classical keyword co-occurrence methods. The replicable pipeline described here—from API-based data collection through unsupervised topic modeling and supervised thematic aggregation to normalized temporal indicators—represents a transferable procedure for evidence synthesis in other multidisciplinary domains. Future work should replicate the analysis with additional databases, extend coverage to non-English scientific output from underrepresented regions, and test the sensitivity of thematic boundaries to alternative modeling parameter choices.

Supplementary Materials

The following supporting information can be downloaded at: https://www.mdpi.com/article/10.3390/agronomy16131223/s1. Table S1: Query terms for TERM AGRI and CLIMATE BLOCKS within the Scopus TITLE-ABS-KEY field; Table S2: BERTopic hyperparameter configuration used to estimate the unsupervised thematic structure; Table S3: Unsupervised thematic structure from BERTopic; Table S4: Top terms per supervised cluster; Table S5: Keyword dictionary and heuristic rules for spatial scale classification; Table S6: Internal subthemes within the Hydrology & Water Management cluster; Table S7: Internal subthemes within the Technology & Modeling cluster; Table S8: Internal subthemes within the Socio-Economic Vulnerability cluster; Table S9: Confusion matrix of the spatial-scale recovery pipeline against the strict automated proxy labels; Figure S1: Temporal evolution of the top 10 most frequent keywords in the corpus, excluding the generic term “climate change”; Figure S2: Temporal evolution of thematic research output in climate–agriculture studies; Figure S3: Relative thematic composition of climate–agriculture research over time; Figure S4: Directed thematic co-occurrence matrix; Figure S5: Intra-cluster thematic structure of Hydrology & Water Management; Figure S6: Intra-cluster thematic structure of Technology & Modeling; Figure S7: Intra-cluster thematic structure of Socio-Economic Vulnerability; Figure S8: Temporal evolution of secondary thematic co-occurrence for Socio-Economic Vulnerability.

Author Contributions

Conceptualization, E.A.-E. and A.P.-A.; Methodology, E.A.-E.; Software, E.A.-E.; Validation, E.A.-E.; Formal analysis, E.A.-E.; Investigation, E.A.-E.; Data curation, E.A.-E.; Writing- original draft preparation, E.A.-E.; Writing—review and editing, E.A.-E. and A.P.-A.; Visualization, E.A.-E.; Supervision, A.P.-A.; Project administration, A.P.-A.; Funding acquisition, A.P.-A. All authors have read and agreed to the published version of the manuscript.

Funding

This research is part of the ENIA International Chair in Agriculture, University of Córdoba, funded by the Secretary of State for Digitalization and Artificial Intelligence and by the European Union—Next Generation EU (TSI-100921-2023-3), within the Recovery, Transformation and Resilience Plan. Additional support was provided by the CARCAVA project, funded by the Ministry of University, Research, and Innovation of the Government of Andalucía (ProyExcel_00700).

Data Availability Statement

Scopus records are subject to licensing restrictions. Aggregated outputs supporting the findings are available from the corresponding author upon reasonable request.

Conflicts of Interest

The authors declare no conflicts of interest.

Abbreviations

The following abbreviations are used in this manuscript:
AFOLUAgriculture, Forestry and Other Land Use
APIApplication Programming Interface
BERTBidirectional Encoder Representations from Transformers
BERTopicBERT-based topic modeling framework
BICBayesian Information Criterion
CAGRCompound Annual Growth Rate
c-TF-IDFClass-based Term Frequency–Inverse Document Frequency
EIDElectronic Identifier
FAOFood and Agriculture Organization of the United Nations
GHGGreenhouse Gas
HDBSCANHierarchical Density-Based Spatial Clustering of Applications with Noise
IPCCIntergovernmental Panel on Climate Change
LDALatent Dirichlet Allocation
LSALatent Semantic Analysis
NDCNationally Determined Contribution
NGSNext-Generation Sequencing
NLPNatural Language Processing
SPECTERScientific Paper Embeddings using Citation-informed TransformERs
SPEIStandardized Precipitation Evapotranspiration Index
SPIStandardized Precipitation Index
TF-IDFTerm Frequency–Inverse Document Frequency
UMAPUniform Manifold Approximation and Projection
UNFCCCUnited Nations Framework Convention on Climate Change
VPDVapor Pressure Deficit

References

  1. Ali, A.; Erenstein, O. Assessing farmer use of climate change adaptation practices and impacts on food security and poverty in Pakistan. Clim. Risk Manag. 2017, 16, 183–194. [Google Scholar] [CrossRef]
  2. IPCC. Climate Change 2023: Synthesis Report. Contribution of Working Groups I, II and III to the Sixth Assessment Report of the Intergovernmental Panel on Climate Change; Core Writing Team, Lee, H., Romero, J., Eds.; IPCC: Geneva, Switzerland, 2023. [Google Scholar] [CrossRef]
  3. European Migration Network. Displacement and Migration Related to Disasters, Climate Change and Environmental Degradation: EMN Inform; Directorate-General for Migration and Home Affairs: Brussels, Belgium, 2023. [Google Scholar]
  4. Román-Vázquez, J.; Carbonell-Bojollo, R.M.; Veroz-González, Ó.; Piletti, L.M.M.d.S.; Márquez-García, F.; Cabeza-Ramírez, L.J.; González-Sánchez, E.J. Global trends in conservation agriculture and climate change research: A bibliometric analysis. Agronomy 2025, 15, 249. [Google Scholar] [CrossRef]
  5. Jiménez-Donaire, M.d.P.; Giráldez, J.V.; Vanwalleghem, T. Impact of climate change on agricultural droughts in Spain. Water 2020, 12, 3214. [Google Scholar] [CrossRef]
  6. Campbell-Lendrum, D.; Neville, T.; Schweizer, C.; Neira, M. Climate change and health: Three grand challenges. Nat. Med. 2023, 29, 1631–1638. [Google Scholar] [CrossRef] [PubMed]
  7. Li, C.; Yao, H.; Li, Z.; Wu, F.; Liu, B.; Wu, Y.; Chun, K.P.; Octavianti, T.; Cui, X.; Xu, Y. A bibliometric analysis of global research on climate change and agriculture from 1985 to 2023. Agronomy 2024, 14, 2729. [Google Scholar] [CrossRef]
  8. FAO. World Food and Agriculture—Statistical Yearbook 2024; Food and Agriculture Organization of the United Nations (FAO): Rome, Italy, 2024. [Google Scholar]
  9. FAO. Agrifood Sector Faces Growing Threat from Climate Change-Induced Loss and Damage. Available online: https://www.fao.org/newsroom/detail/fao-report-agrifood-sector-faces-growing-threat-from-climate-change-induced-loss-and-damage/en (accessed on 16 January 2026).
  10. United States Environmental Protection Agency. Climate Change Impacts on Agriculture and Food Supply. Available online: https://www.epa.gov/climateimpacts/climate-change-impacts-agriculture-and-food-supply (accessed on 10 December 2025).
  11. Callaghan, M.; Schleussner, C.-F.; Nath, S.; Lejeune, Q.; Knutson, T.R.; Reichstein, M.; Hansen, G.; Theokritoff, E.; Andrijevic, M.; Brecha, R.J.; et al. Machine-learning-based evidence and attribution mapping of 100,000 climate impact studies. Nat. Clim. Change 2021, 11, 966–972. [Google Scholar] [CrossRef]
  12. Wu, Y.; Meng, S.; Liu, C.; Gao, W.; Liang, X.-Z. A bibliometric analysis of research for climate impact on agriculture. Front. Sustain. Food Syst. 2023, 7, 1191305. [Google Scholar] [CrossRef]
  13. Aria, M.; Cuccurullo, C. bibliometrix: An R-tool for comprehensive science mapping analysis. J. Informetr. 2017, 11, 959–975. [Google Scholar] [CrossRef]
  14. Linnenluecke, M.K.; Marrone, M.; Singh, A.K. Conducting systematic literature reviews and bibliometric analyses. Aust. J. Manag. 2019, 45, 175–194. [Google Scholar] [CrossRef]
  15. Van Eck, N.J.; Waltman, L. Software survey: VOSviewer, a computer program for bibliometric mapping. Scientometrics 2010, 84, 523–538. [Google Scholar] [CrossRef] [PubMed]
  16. FAO. National Policy Coherence for Climate-Smart Agriculture. Available online: https://www.fao.org/climate-smart-agriculture-sourcebook/enabling-frameworks/module-c3-policy/chapter-c3-4/en/ (accessed on 16 January 2026).
  17. Chimi, P.M.; Nkoué, B.B.; Kamdem, M.E.K.; Pokam, E.Y.N.; Ngamsou, K.A.; Yonga, G.; Osso, D.B.; Mala, W.A. Trends in agricultural sustainability research: A 40-year bibliometric review. Discov. Environ. 2025, 3, 1–15. [Google Scholar] [CrossRef]
  18. Stammbach, D.; Zouhar, V.; Hoyle, A.; Sachan, M.; Ash, E. Revisiting Automated Topic Model Evaluation with Large Language Models. In Proceedings of the 2023 Conference on Empirical Methods in Natural Language Processing, Singapore, 6–10 December 2023; pp. 9348–9357. [Google Scholar] [CrossRef]
  19. Grootendorst, M. BERTopic: Neural topic modeling with a class-based TF-IDF procedure. arXiv. 2022. Available online: http://arxiv.org/abs/2203.05794 (accessed on 12 May 2026).
  20. Devlin, J.; Chang, M.-W.; Lee, K.; Toutanova, K. BERT: Pre-Training of Deep Bidirectional Transformers for Language Understanding. In Proceedings of the 2019 Conference of the North American Chapter of the Association for Computational Linguistics: Human Language Technologies, Volume 1 (Long and Short Papers), Minneapolis, MN, USA, 2–7 June 2019; pp. 4171–4186. [Google Scholar]
  21. McInnes, L.; Healy, J.; Saul, N.; Großberger, L. UMAP: Uniform Manifold Approximation and Projection. J. Open Source Softw. 2018, 3, 861. [Google Scholar] [CrossRef]
  22. McInnes, L.; Healy, J.; Astels, S. hdbscan: Hierarchical density based clustering. J. Open Source Softw. 2017, 2, 205. [Google Scholar] [CrossRef]
  23. Blei, D.M.; Ng, A.Y.; Jordan, M.I. Latent dirichlet allocation. J. Mach. Learn. Res. 2003, 3, 993–1022. [Google Scholar]
  24. Deerwester, S.; Dumais, S.T.; Furnas, G.W.; Landauer, T.K.; Harshman, R. Indexing by latent semantic analysis. J. Am. Soc. Inf. Sci. 1990, 41, 391–407. [Google Scholar] [CrossRef]
  25. Abdelrazek, A.; Eid, Y.; Gawish, E.; Medhat, W.; Hassan, A. Topic modeling algorithms and applications: A survey. Inf. Syst. 2022, 112, 102131. [Google Scholar] [CrossRef]
  26. Rousseau, R.; Yang, L. Reflections on the activity index and related indicators. J. Inf. 2012, 6, 413–421. [Google Scholar] [CrossRef]
  27. Shiu, S.-H.; Lehti-Shiu, M.D. Assessing the evolution of research topics in a biological field using plant science as an example. PLoS Biol. 2024, 22, e3002612. [Google Scholar] [CrossRef] [PubMed]
  28. Baas, J.; Schotten, M.; Plume, A.; Côté, G.; Karimi, R. Scopus as a curated, high-quality bibliometric data source for academic research in quantitative science studies. Quant. Sci. Stud. 2020, 1, 377–386. [Google Scholar] [CrossRef]
  29. Bodansky, D. The legal character of the Paris agreement. Rev. Eur. Comp. Int. Environ. Law 2016, 25, 142–150. [Google Scholar] [CrossRef]
  30. Gupta, J. A history of international climate change policy. WIREs Clim. Change 2010, 1, 636–653. [Google Scholar] [CrossRef]
  31. United Nations. The Paris Agreement, 2016. Available online: https://unfccc.int/sites/default/files/resource/parisagreement_publication.pdf (accessed on 8 January 2026).
  32. Samiee, S.; Chabowski, B.R. Knowledge structure in international marketing: A multi-method bibliometric analysis. J. Acad. Mark. Sci. 2011, 40, 364–386. [Google Scholar] [CrossRef]
  33. Jelodar, H.; Wang, Y.; Yuan, C.; Feng, X. Latent Dirichlet Allocation (LDA) and topic modeling: Models, applications, a survey. Multimed. Tools Appl. 2019, 78, 15169–15211. [Google Scholar]
  34. Mikolov, T.; Chen, K.; Corrado, G.; Dean, J. Efficient estimation of word representations in vector space. arXiv 2013. [Google Scholar] [CrossRef]
  35. Rehurek, R.; Sojka, P. Software Framework for Topic Modelling with Large Corpora. In Proceedings of the LREC 2010 Workshop New Challenges for NLP Frameworks, Valletta, Malta, 22 May 2010; pp. 46–50. [Google Scholar]
  36. Cohan, A.; Feldman, S.; Beltagy, I.; Downey, D.; Weld, D.S. SPECTER: Document-Level Representation Learning Using Citation-Informed Transformers. In Proceedings of the 58th Annual Meeting of the Association for Computational Linguistics, Online, 5–10 July 2020; pp. 2270–2282. [Google Scholar]
  37. Intergovernmental Panel on Climate Change. Climate Change and Land; Cambridge University Press: Cambridge, UK, 2022. [Google Scholar] [CrossRef]
  38. Petersen, O.H. Inequality of research funding between different countries and regions is a serious problem for global science. Function 2021, 2, zqab060. [Google Scholar] [CrossRef] [PubMed]
  39. Nalau, J.; Verrall, B. Mapping the evolution and current trends in climate change adaptation science. Clim. Risk Manag. 2021, 32, 100290. [Google Scholar] [CrossRef]
  40. Panagos, P.; Broothaerts, N.; Ballabio, C.; Orgiazzi, A.; De Rosa, D.; Borrelli, P.; Liakos, L.; Vieira, D.; Van Eynde, E.; Navarro, C.A.; et al. How the EU soil observatory is providing solid science for healthy soils. Eur. J. Soil Sci. 2024, 75, e13507. [Google Scholar] [CrossRef]
  41. Hamdan, M.F.; Karlson, C.K.S.; Teoh, E.Y.; Lau, S.-E.; Tan, B.C. Genome editing for sustainable crop improvement and mitigation of biotic and abiotic stresses. Plants 2022, 11, 2625. [Google Scholar] [CrossRef] [PubMed]
  42. Haunschild, R.; Bornmann, L.; Marx, W. Climate change research in view of bibliometrics. PLoS ONE 2016, 11, e0160393. [Google Scholar] [CrossRef] [PubMed]
  43. Sietsma, A.J.; Ford, J.D.; Callaghan, M.W.; Minx, J.C. Progress in climate change adaptation research. Environ. Res. Lett. 2021, 16, 054038. [Google Scholar] [CrossRef]
  44. UN Climate Change News. Emission Reductions Under the Kyoto Protocol Pave the Way for Increased Ambition. Available online: https://unfccc.int/news/emission-reductions-under-the-kyoto-protocol-pave-the-way-for-increased-ambition (accessed on 19 January 2026).
  45. Council of the European Union. Paris Agreement: EU Submits Statement of Intent to the UNFCCC on the Post-2030 NDC; Council of the European Union: Brussels, Belgium, 2025.
  46. Price, D.J.D.S. Little Science, Big Science, 2nd ed.; Columbia University Press: New York, NY, USA, 1963. [Google Scholar] [CrossRef]
  47. Fernández-Lobato, L.; Ruiz-Carrasco, B.; Tostado-Véliz, M.; Jurado, F.; Vera, D. Environmental impact of the most representative Spanish olive oil farming systems: A life cycle assessment study. J. Clean. Prod. 2024, 442, 141169. [Google Scholar] [CrossRef]
  48. Vallury, S.; Nelson, D.R.; Cook, N.J. Rethinking adaptation interventions in agricultural systems for sustainability. Curr. Opin. Environ. Sustain. 2025, 77, 101571. [Google Scholar] [CrossRef]
  49. Srivastava, A.K.; Riaz, A.; Jiang, J.; Li, X.; Uzair, M.; Mishra, P.; Zeb, A.; Zhang, J.; Singh, R.P.; Luo, L.; et al. Advancing climate-resilient sorghum: The synergistic role of plant biotechnology and microbial interactions. Rice 2025, 18, 41. [Google Scholar] [CrossRef] [PubMed]
  50. Varshney, R.K.; Bohra, A.; Roorkiwal, M.; Barmukh, R.; Cowling, W.A.; Chitikineni, A.; Lam, H.-M.; Hickey, L.T.; Croser, J.S.; Bayer, P.E.; et al. Fast-forward breeding for a food-secure world. Trends Genet. 2021, 37, 1124–1136. [Google Scholar] [CrossRef] [PubMed]
  51. Hickey, L.T.; Hafeez, A.N.; Robinson, H.; Jackson, S.A.; Leal-Bertioli, S.C.M.; Tester, M.; Gao, C.; Godwin, I.D.; Hayes, B.J.; Wulff, B.B.H. Breeding crops to feed 10 billion. Nat. Biotechnol. 2019, 37, 744–754. [Google Scholar] [CrossRef] [PubMed]
  52. Ray, D.K.; Ramankutty, N.; Mueller, N.D.; West, P.C.; Foley, J.A. Recent patterns of crop yield growth and stagnation. Nat. Commun. 2012, 3, 1293. [Google Scholar] [CrossRef] [PubMed]
  53. Vejendla, L.C.; Janaki, P.; Parameswari, E.; Suganthy, M.; Krishnan, R.; Meena, S. Harnessing regenerative agriculture for climate change mitigation: A comprehensive review and meta-analysis. Discov. Agric. 2025, 3, 180. [Google Scholar] [CrossRef]
  54. Minx, J.C.; Lamb, W.F.; Callaghan, M.W.; Fuss, S.; Hilaire, J.; Creutzig, F.; Amann, T.; Beringer, T.; Garcia, W.d.O.; Hartmann, J.; et al. Negative emissions—Part 1: Research landscape and synthesis. Environ. Res. Lett. 2018, 13, 063001. [Google Scholar] [CrossRef]
  55. Amelung, W.; Bossio, D.; de Vries, W.; Kögel-Knabner, I.; Lehmann, J.; Amundson, R.; Bol, R.; Collins, C.; Lal, R.; Leifeld, J.; et al. Towards a global-scale soil climate mitigation strategy. Nat. Commun. 2020, 11, 1–10. [Google Scholar] [CrossRef] [PubMed]
  56. Khaqan, K.; Fest, B.; Harrison, T.; Sandhu, H. Carbon farming and agriculture: A bibliometric analysis. Discov. Agric. 2025, 3, 1–19. [Google Scholar] [CrossRef]
  57. Perez, D.I.; Fellmann, T.; Witzke, H.P.; Weiss, F.; Hristov, J.; Himics, M.; Barreiro, H.J.; Gomez, B.M.; Leip, A. Economic Assessment of GHG Mitigation Policy Options for EU Agriculture; Publications Office of the European Union: Luxembourg, 2025. [Google Scholar] [CrossRef]
  58. Wreford, A.; Moran, D.; Adger, N. Climate Change and Agriculture: Impacts, Adaptation and Mitigation; OECD: Paris, France, 2010. [Google Scholar] [CrossRef]
  59. Bodansky, D. The Art and Craft of International Environmental Law; Harvard University Press: Cambridge, MA, USA, 2010; Available online: https://digitalcommons.law.uga.edu/fac_artchop/532 (accessed on 13 January 2026).
  60. IPCC. Mitigation and development pathways in the near to mid-term. In Climate Change 2022–Mitigation of Climate Change: Working Group III Contribution to the Sixth Assessment Report of the Intergovernmental Panel on Climate Change; Cambridge University Press: Cambridge, UK, 2023; pp. 409–502. [Google Scholar] [CrossRef]
  61. Hu, J.; Dong, J.; Xu, D.; Yang, Q.; Liang, J.; Li, N.; Wang, H. Trends in Global Agricultural Carbon Emission Research: A Bibliometric Analysis. Agronomy 2024, 14, 2617. [Google Scholar] [CrossRef]
  62. Li, X.; Hu, S.; Jiang, L.; Han, B.; Li, J.; Wei, X. Bibliometric analysis of the research (2000–2020) on land-use carbon emissions based on CiteSpace. Land 2023, 12, 165. [Google Scholar] [CrossRef]
  63. Shah, T.M.; Tasawwar, S.; Otterpohl, R. Agroecology for food and water security in times of climate consciousness: A bibliometric analysis of peer-reviewed literature published from 1990 to 2020. Sustainability 2021, 13, 5064. [Google Scholar] [CrossRef]
  64. Biswas, A.; Sarkar, S.; Das, S.; Dutta, S.; Choudhury, M.R.; Giri, A.; Bera, B.; Bag, K.; Mukherjee, B.; Banerjee, K.; et al. Water scarcity: A global hindrance to sustainable development and agricultural production—A critical review of the impacts and adaptation strategies. Camb. Prism. Water 2025, 3, e4. [Google Scholar] [CrossRef]
  65. Boros, A.; Gordos, B.; Tőzsér, D. A bibliometric analysis-based literature review of the relationship between sustainable water management and green innovations in the agricultural sector. Heliyon 2024, 10, e33364. [Google Scholar] [CrossRef] [PubMed]
  66. Estoque, R.C.; Ishtiaque, A.; Parajuli, J.; Athukorala, D.; Rabby, Y.W.; Ooba, M. Has the IPCC’s revised vulnerability concept been well adopted? AMBIO 2022, 52, 376–389. [Google Scholar] [CrossRef] [PubMed]
  67. Fonseca, L.M.; Domingues, J.P.; Dima, A.M. Mapping the sustainable development goals relationships. Sustainability 2020, 12, 3359. [Google Scholar] [CrossRef]
  68. Lima, C.O.; Bonetti, J. Bibliometric analysis of the scientific production on coastal communities’ social vulnerability to climate change and to the impact of extreme events. Nat. Hazards 2020, 102, 1589–1610. [Google Scholar] [CrossRef]
  69. Camara, S.B.; Zucatto, L.C.; Brandão, J.B.; Boscardin, M. Mapping of scientific production around the sustainable development goals—SDGS and food production. Cienc. Rural. 2025, 55, e20230134. [Google Scholar] [CrossRef]
  70. Carmo, M.; Ferreira, J.; Mendes, M.; Silva, Á.; Silva, P.; Alves, D.; Reis, L.; Novo, I.; Viegas, D.X. The climatology of extreme wildfires in Portugal, 1980–2018: Contributions to forecasting and preparedness. Int. J. Clim. 2021, 42, 3123–3146. [Google Scholar] [CrossRef]
  71. Cunningham, C.X.; Williamson, G.J.; Bowman, D.M.J.S. Increasing frequency and intensity of the most extreme wildfires on Earth. Nat. Ecol. Evol. 2024, 8, 1420–1425. [Google Scholar] [CrossRef] [PubMed]
  72. Marengo, J.; Nobre, C.; Tomasella, J.; Cardoso, M.; Oyama, M. Hydro-climatic and ecological behaviour of the drought of Amazonia in 2005. Philos. Trans. R. Soc. B Biol. Sci. 2008, 363, 1773–1778. [Google Scholar] [CrossRef] [PubMed]
  73. Sánchez-Benítez, A.; García-Herrera, R.; Barriopedro, D.; Sousa, P.M.; Trigo, R.M. June 2017: The earliest European summer mega-heatwave of reanalysis period. Geophys. Res. Lett. 2018, 45, 1955–1962. [Google Scholar] [CrossRef]
  74. European Commission. Europe Faces Worst Wildfire Year on Record as Fire Seasons Grow Longer and More Destructive; Directorate-General for European Civil Protection and Humanitarian Aid Operations (ECHO): Brussels, Belgium, 2025. [Google Scholar]
  75. Zhai, H.; Liu, M.; Zhang, X.; Li, X.; Hu, B.; Li, H.; Gao, S.; Wei, Y.; Sun, W. Science mapping of root ecology: A bibliometric review covering 2015–2024. Ann. Bot. 2025, 136, 943–960. [Google Scholar] [CrossRef] [PubMed]
  76. Contreras, R.; Puertas, R.; Martinez-Gomez, V. Bibliometric analysis of emerging trends and future prospects in sustainable agriculture. Discov. Sustain. 2025, 6, 951. [Google Scholar] [CrossRef]
  77. Nightingale, A.J.; Eriksen, S.; Taylor, M.; Forsyth, T.; Pelling, M.; Newsham, A.; Boyd, E.; Brown, K.; Harvey, B.; Jones, L.; et al. Beyond technical fixes: Climate solutions and the great derangement. Clim. Dev. 2019, 12, 343–352. [Google Scholar] [CrossRef]
  78. Apio, A.T.; Thiam, D.R.; Dinar, A. A meta-analysis of water institutions and their performance: Implications for water resource management. Water Resour. Manag. 2024, 39, 907–938. [Google Scholar] [CrossRef]
  79. Syam, R.; Wisadirana, D.; Susilo, E.; Nurhadi, I. Lake and water governance research trajectories in stakeholder engagement and participation. Int. J. Sustain. Dev. Plan. 2025, 20, 4891–4902. [Google Scholar] [CrossRef]
  80. Li, C.; Chen, L.; Liu, D.; Wei, J.; He, J.; Duan, X. The hidden risk in China’s cropland conversion from the perspective of slope. Catena 2021, 206, 105536. [Google Scholar] [CrossRef]
  81. Chan, F.K.S.; Griffiths, J.A.; Higgitt, D.; Xu, S.; Zhu, F.; Tang, Y.-T.; Xu, Y.; Thorne, C.R. “Sponge City” in China—A breakthrough of planning and flood risk management in the urban context. Land Use Policy 2018, 76, 772–778. [Google Scholar] [CrossRef]
  82. Ren, G.; Zhou, Y.; Chu, Z.; Zhou, J.; Zhang, A.; Guo, J.; Liu, X. Urbanization effects on observed surface air temperature trends in North China. J. Clim. 2008, 21, 1333–1348. [Google Scholar] [CrossRef]
Figure 1. Analytical workflow from data retrieval to BERTopic-based unsupervised topic modeling and supervised thematic classification.
Agronomy 16 01223 g001
Figure 2. Annual publication trend chart of climate–agriculture documents indexed in Scopus (1990–2025).
Agronomy 16 01223 g002
Figure 3. Global distribution of climate–agriculture research outputs and international co-authorship links (1990–2025). Lines represent international co-authorship links between countries; line width is proportional to the number of co-authored documents.
Agronomy 16 01223 g003
Figure 4. Thematic priorities of the top ten producing countries (share of documents, %).
Agronomy 16 01223 g004
Figure 5. Standardized relative intensity (z-score) of macro-themes over time (positive values indicate above-average relative attention).
Agronomy 16 01223 g005
Figure 6. Evolution of macro-theme composition as a share of annual publications (stacked area chart).
Agronomy 16 01223 g006
Figure 7. Cluster-specific publication trajectories (1990–2025).
Agronomy 16 01223 g007
Figure 8. Cross-theme co-framing (primary vs. secondary): within-primary shares of retained secondary themes (binned heatmap).
Agronomy 16 01223 g008
Figure 9. Multi-dimensional analysis of spatial scales in climate–agriculture research (1990–2025): distribution of research scales (A), spatial scale composition by thematic cluster (B), national scale profiles for top 10 producers (C), and temporal evolution of spatial focus (D).
Agronomy 16 01223 g009
Table 1. Cluster quality metrics for the supervised thematic structure.
Thematic ClustersNo. DocumentsPurityEntropyMean Cosine Distance to Centroid
Forestry80110.5781.8510.465
Soil & Carbon Sequestration14,7380.5362.3950.376
Economics & Markets64500.5332.8760.174
Food Industry57740.4872.4990.387
Irrigation58380.4802.1720.386
Energy & Renewable Sources72780.4662.0060.479
Fisheries & Aquaculture83080.3763.2520.222
Biotechnology13,1460.3523.2880.269
GHG & Net-Zero12,6490.3482.8540.284
Wildfire50590.3292.9300.333
Technology & Modeling17,0510.3273.6630.219
Crop Production22,4260.3113.6300.178
Oceanography20,5790.2933.1510.253
Sustainability11,7160.2903.3530.217
Socio-Economic Vulnerability89160.2633.1360.302
Livestock Systems18,2030.2503.2980.214
Hydrology & Water Management20,5970.2493.5060.283
Atmosphere10,8990.2393.5150.208
Disclaimer/Publisher’s Note: The statements, opinions and data contained in all publications are solely those of the individual author(s) and contributor(s) and not of MDPI and/or the editor(s). MDPI and/or the editor(s) disclaim responsibility for any injury to people or property resulting from any ideas, methods, instructions or products referred to in the content.