Article

Sulfur Supply Modulates Selenium Biofortification, Yield, and Nutritional Quality in Leafy Greens Grown in an Indoor Vertical Farm

by
Aysenur Bayrak
1,2 and
Umit Baris Kutman
1,*
1
Institute of Biotechnology, Gebze Technical University, Gebze 41400, Kocaeli, Turkey
2
Plant Factory, Maltepe 34846, Istanbul, Turkey
*
Author to whom correspondence should be addressed.
Agronomy 2026, 16(12), 1193; https://doi.org/10.3390/agronomy16121193
Submission received: 1 May 2026 / Revised: 9 June 2026 / Accepted: 14 June 2026 / Published: 18 June 2026
(This article belongs to the Section Horticultural and Floricultural Crops)

Abstract

Selenium (Se) is essential for human health, but its dietary intake remains insufficient in many regions, increasing interest in biofortification strategies. Indoor hydroponic systems offer a controlled and resource-efficient approach for producing Se-enriched leafy greens. Sulfur (S), an essential macronutrient for plants, affects Se uptake and metabolism due to their chemical similarity. In this study, we investigated the effects of Se supplementation (2 µM Na2SeO4) under two S levels (0.65 and 1.3 mM, supplied as MgSO4) on Se accumulation, yield, and nutritional quality in lettuce, rocket, and basil grown in an indoor nutrient film technique (NFT) system. High S supply increased biomass in lettuce and basil by 16% and 25%, respectively, while rocket remained unaffected. The effect of Se on biomass depended on S status and species. Under low S conditions, Se increased lettuce biomass but reduced basil biomass, whereas no significant effects were observed under high S. Sulfur strongly reduced Se accumulation in all species, leading to lower contributions to the recommended daily allowance (RDA). Under low S conditions, Se-biofortified lettuce, rocket, and basil provided 111%, 179%, and 37% of the RDA per serving, respectively, whereas these values decreased to 56%, 64%, and 20% under high S. Sulfur and Se treatments also influenced macro- and micro-nutrient composition in a species-dependent manner. Se supplementation consistently reduced total phenolic content and antioxidant capacity (DPPH and FRAP) across all species. Total ascorbic acid was affected only in rocket, with the highest levels observed under high S without Se. These findings highlight a clear antagonistic interaction between S and Se in hydroponic systems and demonstrate the need to optimize S supply to balance yield and Se biofortification without compromising nutritional quality in leafy greens grown in indoor systems.

1. Introduction

The demand for sustainable and resource-efficient food production systems has increased due to population growth, climate variability, and the scarcity of fertile arable land [1,2]. Controlled environment agriculture (CEA), including hydroponics and vertical farming, is considered a promising approach to address these challenges [3,4,5]. Among hydroponic systems, the nutrient film technique (NFT) is widely used due to its efficient use of water and nutrients and its suitability for urban and space-limited environments [6,7].
Leafy greens are well suited for indoor production systems because of their short growth cycle, compact size, and adaptability to controlled conditions [8,9]. They are considered nutrient-dense foods, providing essential minerals, vitamins, and bioactive compounds such as flavonoids, carotenoids, and glucosinolates, which are associated with various health benefits [10,11,12,13,14]. A healthy diet’s staple food and leafy greens, can have wildly different nutritional profiles based on which nutrients are available in the root zone. Soil or hydroponic solution concentrations can be controlled to intentionally elevate certain minerals in vegetable leaves [15].
Biofortification has gained increasing attention as a strategy to address micronutrient deficiencies and improve the nutritional quality of crops [16]. Selenium (Se) is an essential micronutrient for humans, as it is a component of selenoproteins such as selenocysteine and selenomethionine [17,18]. It plays important roles in immune function, fertility, thyroid regulation, and antioxidant defense [19,20,21,22]. However, dietary Se intake remains insufficient in many regions, largely due to low Se availability in soils [23].
Hydroponic systems offer advantages for Se biofortification compared to soil-based or foliar approaches, as they allow precise control of nutrient supply and avoid variability associated with soil properties such as pH and redox conditions [24,25]. In addition, continuous nutrient delivery in hydroponics enables efficient Se uptake at relatively low concentrations [26]. Leafy greens are particularly suitable for Se biofortification due to their capacity to accumulate Se in edible tissues [18]. However, accumulation capacity varies depending on genus, species, and even ecotypes within a species [23]. While lettuce (Lactuca sativa L.) and basil (Ocimum basilicum L.) exhibit moderate, non-accumulator profiles, rocket (Diplotaxis tenuifolia), a member of the Brassicaceae family, is known for its high Se accumulation capacity [27]. This is partly related to its high sulfur (S) content and the uptake of Se via sulfate transporters [16,23].
Sulfur is an essential element for plant growth, being a component of amino acids, vitamins, and cofactors, and playing a role in the synthesis of secondary metabolites such as glucosinolates [28,29,30]. Due to their chemical similarity, S and Se share common uptake and assimilation pathways in plants [31,32]. As a result, their interaction can be either synergistic or antagonistic, influencing nutrient uptake, metabolism, and the accumulation of bioactive compounds [31,33]. These interactions may also affect plant growth and the nutritional quality of crops [30,34,35].
However, the interaction between S supply and Se biofortification under indoor NFT conditions remains insufficiently understood, particularly across different leafy green species. Indoor hydroponic methods eliminate soil matrix interferences, enabling exact root-zone ionic interaction studies. Furthermore, under the accelerated growth dynamics of controlled environment agriculture (CEA), the precise thresholds of S-Se cross-talk require deeper investigation. We hypothesized that increasing S supply would reduce Se accumulation in edible tissues through competition between sulfate and selenate uptake pathways, while the resulting effects on yield and nutritional quality would differ among leafy green species due to differences in their S metabolism. Therefore, the aim of this study was to investigate the individual and combined effects of Se supplementation and S supply on growth, Se accumulation, mineral composition, nitrate concentration, antioxidant capacity, and ascorbic acid content in lettuce, rocket, and basil grown in an indoor NFT system.

2. Materials and Methods

2.1. Plant Material, Growth Environments and Conditions

The experiment was conducted using three leafy green species: Lollo bionda-type lettuce (Lactuca sativa L. cv. Levistro Rz), Genovese-type basil (Ocimum basilicum), and wild rocket (Diplotaxis tenuifolia). Seeds were sown in cocopeat and germinated for three days in a germination chamber. After germination, seedlings were transferred to an indoor vertical nutrient film technique (NFT) system located at the Gebze Technical University (GTU) campus. The system was fully isolated from external environmental conditions. Environmental parameters were precisely controlled and optimized for each species. Lettuce and rocket were cultivated under 24 °C/20 °C (day/night) temperature, 70% relative humidity, an 18/6 h photoperiod, and a photosynthetic photon flux density (PPFD) of 220 µmol m−2 s−1 using an LED spectrum of R88/B12/FR6 (Signify Philips, Eindhoven, Netherlands). CO2 levels were maintained at 800–900 ppm. Basil plants were grown under a separate regime with 28 °C/24 °C (day/night) temperature, 80% relative humidity, a 16/8 h photoperiod, and 260 µmol m−2 s−1 PPFD, while maintaining the same light spectrum and CO2 conditions as lettuce and rocket. Harvesting was performed 28 days after transfer to the NFT system for lettuce and basil, and 21 days after transfer for rocket.

2.2. Experimental Design and Treatments

The experiment was conducted as a 2 × 2 factorial design with two selenium (Se) levels (0 and 2 µM) and two sulfur (S) levels (0.65 mM, low S; 1.3 mM, high S) applied via the nutrient solution. Sodium selenate (Na2SeO4) and magnesium sulfate monohydrate (MgSO4·H2O) were used as Se and S sources, respectively. During the first 10 days after germination, no Se was applied. After this period, plants were transferred to separate NFT shelves and S and Se treatments were initiated. All plants were irrigated continuously with a nutrient solution containing 9.3 mM Ca(NO3)2·4H2O, 2.7 mM KNO3, 0.7 mM KH2PO4, 0.3 mM KCl, 50 µM Fe-EDTA, 5 µM ZnSO4·7H2O, 5 µM MnSO4·H2O, 1 µM CuSO4·5H2O, 20 µM H3BO3, and 0.5 µM (NH4)6Mo7O24·4H2O. Electrical conductivity (EC) was maintained at 1.45 dS m−1 under low S conditions and 1.55 dS m−1 under high S conditions. The pH of the nutrient solution was automatically regulated and maintained at 5.8 using nitric acid throughout the experimental period. Each treatment consisted of five biological replicates (n = 5).

2.3. Digestion and Mineral Analysis

Sample digestion for elemental analysis was carried out according to Ceylan et al. (2016) [36]. Dried and finely ground plant samples (0.2 g) were digested with 5 mL of 65% nitric acid (HNO3) and 2 mL of 30% hydrogen peroxide (H2O2) using a microwave digestion system (Mars Express; CEM Corp., Matthews, NC, USA). After digestion, the volume was adjusted to 20 mL with ultrapure water and the solutions were filtered. The concentrations of selected macronutrients (Ca, K, Mg, P, and S) and micronutrients (Cu, Fe, Mn, Se, and Zn) were determined using inductively coupled plasma optical emission spectrometry (ICP-OES; Agilent 5800 VDV, Agilent Technologies, Santa Clara, CA, USA). Selenium concentrations were determined separately using ICP-OES equipped with a hydride generation system.

2.4. Concentrations of Chlorophyll and Total Carotenoids

Chlorophyll and carotenoid contents were determined according to Lichtenthaler (1987) [37]. Fresh-frozen plant samples were extracted at a ratio of 1:5 (g fresh weight/mL solvent) using 80% (v/v) acetone and homogenized with a mechanical homogenizer. Extracts were centrifuged at 7500 rpm for 15 min and then at 12,000 rpm for an additional 15 min at 4 °C. The supernatants were used for spectrophotometric analysis. Absorbance was measured at 470 nm, 646.8 nm and 663.2 nm, and chlorophyll a, chlorophyll b, and total carotenoid concentrations were calculated using standard equations:
Ca = 12.25 × A 663.2 − 2.79 × A 646.8
Cb = 21.5 ×A 646.8 − 5.1 × A 663.2
Cx + c = (1000 A 470 − 1.82 × Ca − 85.02 × Cb)/198

2.5. Nitrate Analysis

Nitrate concentration was determined colorimetrically according to Cataldo et al. (1975) [38]. Briefly, 0.1 g of finely ground dry plant material was extracted with 10 mL of deionized water at 70 °C for 30 min, followed by centrifugation at 4600 rpm for 15 min. The supernatant was reacted with salicylic acid in concentrated H2SO4, followed by addition of NaOH. After cooling, absorbance was measured at 410 nm. Calibration was performed using KNO3 standards treated under identical conditions.

2.6. Total Vitamin C Concentration

Total ascorbic acid was determined following the method of Gillespie et al. (2007) [39]. Plant samples were extracted with 5% (w/v) metaphosphoric acid at a ratio of 1:5 (g fresh weight/mL solvent). For total ascorbic acid determination, dehydroascorbic acid was reduced to ascorbic acid using dithiothreitol (DTT), followed by stabilization with N-ethylmaleimide (NEM). Color development was achieved using FeCl3 and 2,2′-dipyridyl reagents, and absorbance was measured at 525 nm.

2.7. Total Phenolic Content and Antioxidant Capacity

Plant samples were extracted using 70% (v/v) methanol at a ratio of 1:5 (g fresh weight/mL solvent). The extracts were vortexed, centrifuged at 7500 rpm for 15 min at 4 °C, and the supernatants were used for analysis.

2.7.1. Total Phenolic Content (TPC)

Total phenolic content was determined using the Folin–Ciocalteu method [40]. Briefly, 0.1 mL of extract was mixed with 0.4 mL of 10% Na2CO3, 0.4 mL of 0.5 N Folin–Ciocalteu reagent, and 0.6 mL of distilled water. After 30 min of incubation in the dark at room temperature, absorbance was measured at 760 nm. Results were expressed as gallic acid equivalents (GAE).

2.7.2. DPPH Radical Scavenging Activity

The DPPH assay was carried out according to Brand-Williams et al. (1995) [41]. A 100 µM DPPH solution in methanol was mixed with the sample or Trolox standard. After incubation in the dark at room temperature for 120 min, absorbance was measured at 515 nm. Results were expressed as Trolox equivalents.

2.7.3. Ferric-Reducing Antioxidant Power (FRAP) Assay

The FRAP assay was performed according to Benzie and Strain (1996) [42]. The FRAP reagent was prepared by mixing acetate buffer (300 mM, pH 3.6), TPTZ (10 mM), and FeCl3·6H2O (20 mM) in a 10:1:1 ratio. The reaction mixture was incubated at 37 °C for 30 min, and absorbance was measured at 593 nm. Results were expressed as Trolox equivalents.

2.8. Statistical Analysis

JMP software (Version 18) was used for statistical analysis. Two-way analysis of variance (ANOVA) was used to determine the overall significance of the effects of the treatments and their interactions on the reported traits at 95% confidence. Tukey’s honestly significant difference (HSD) test (p < 0.05) was used for pairwise comparisons of means.

3. Results

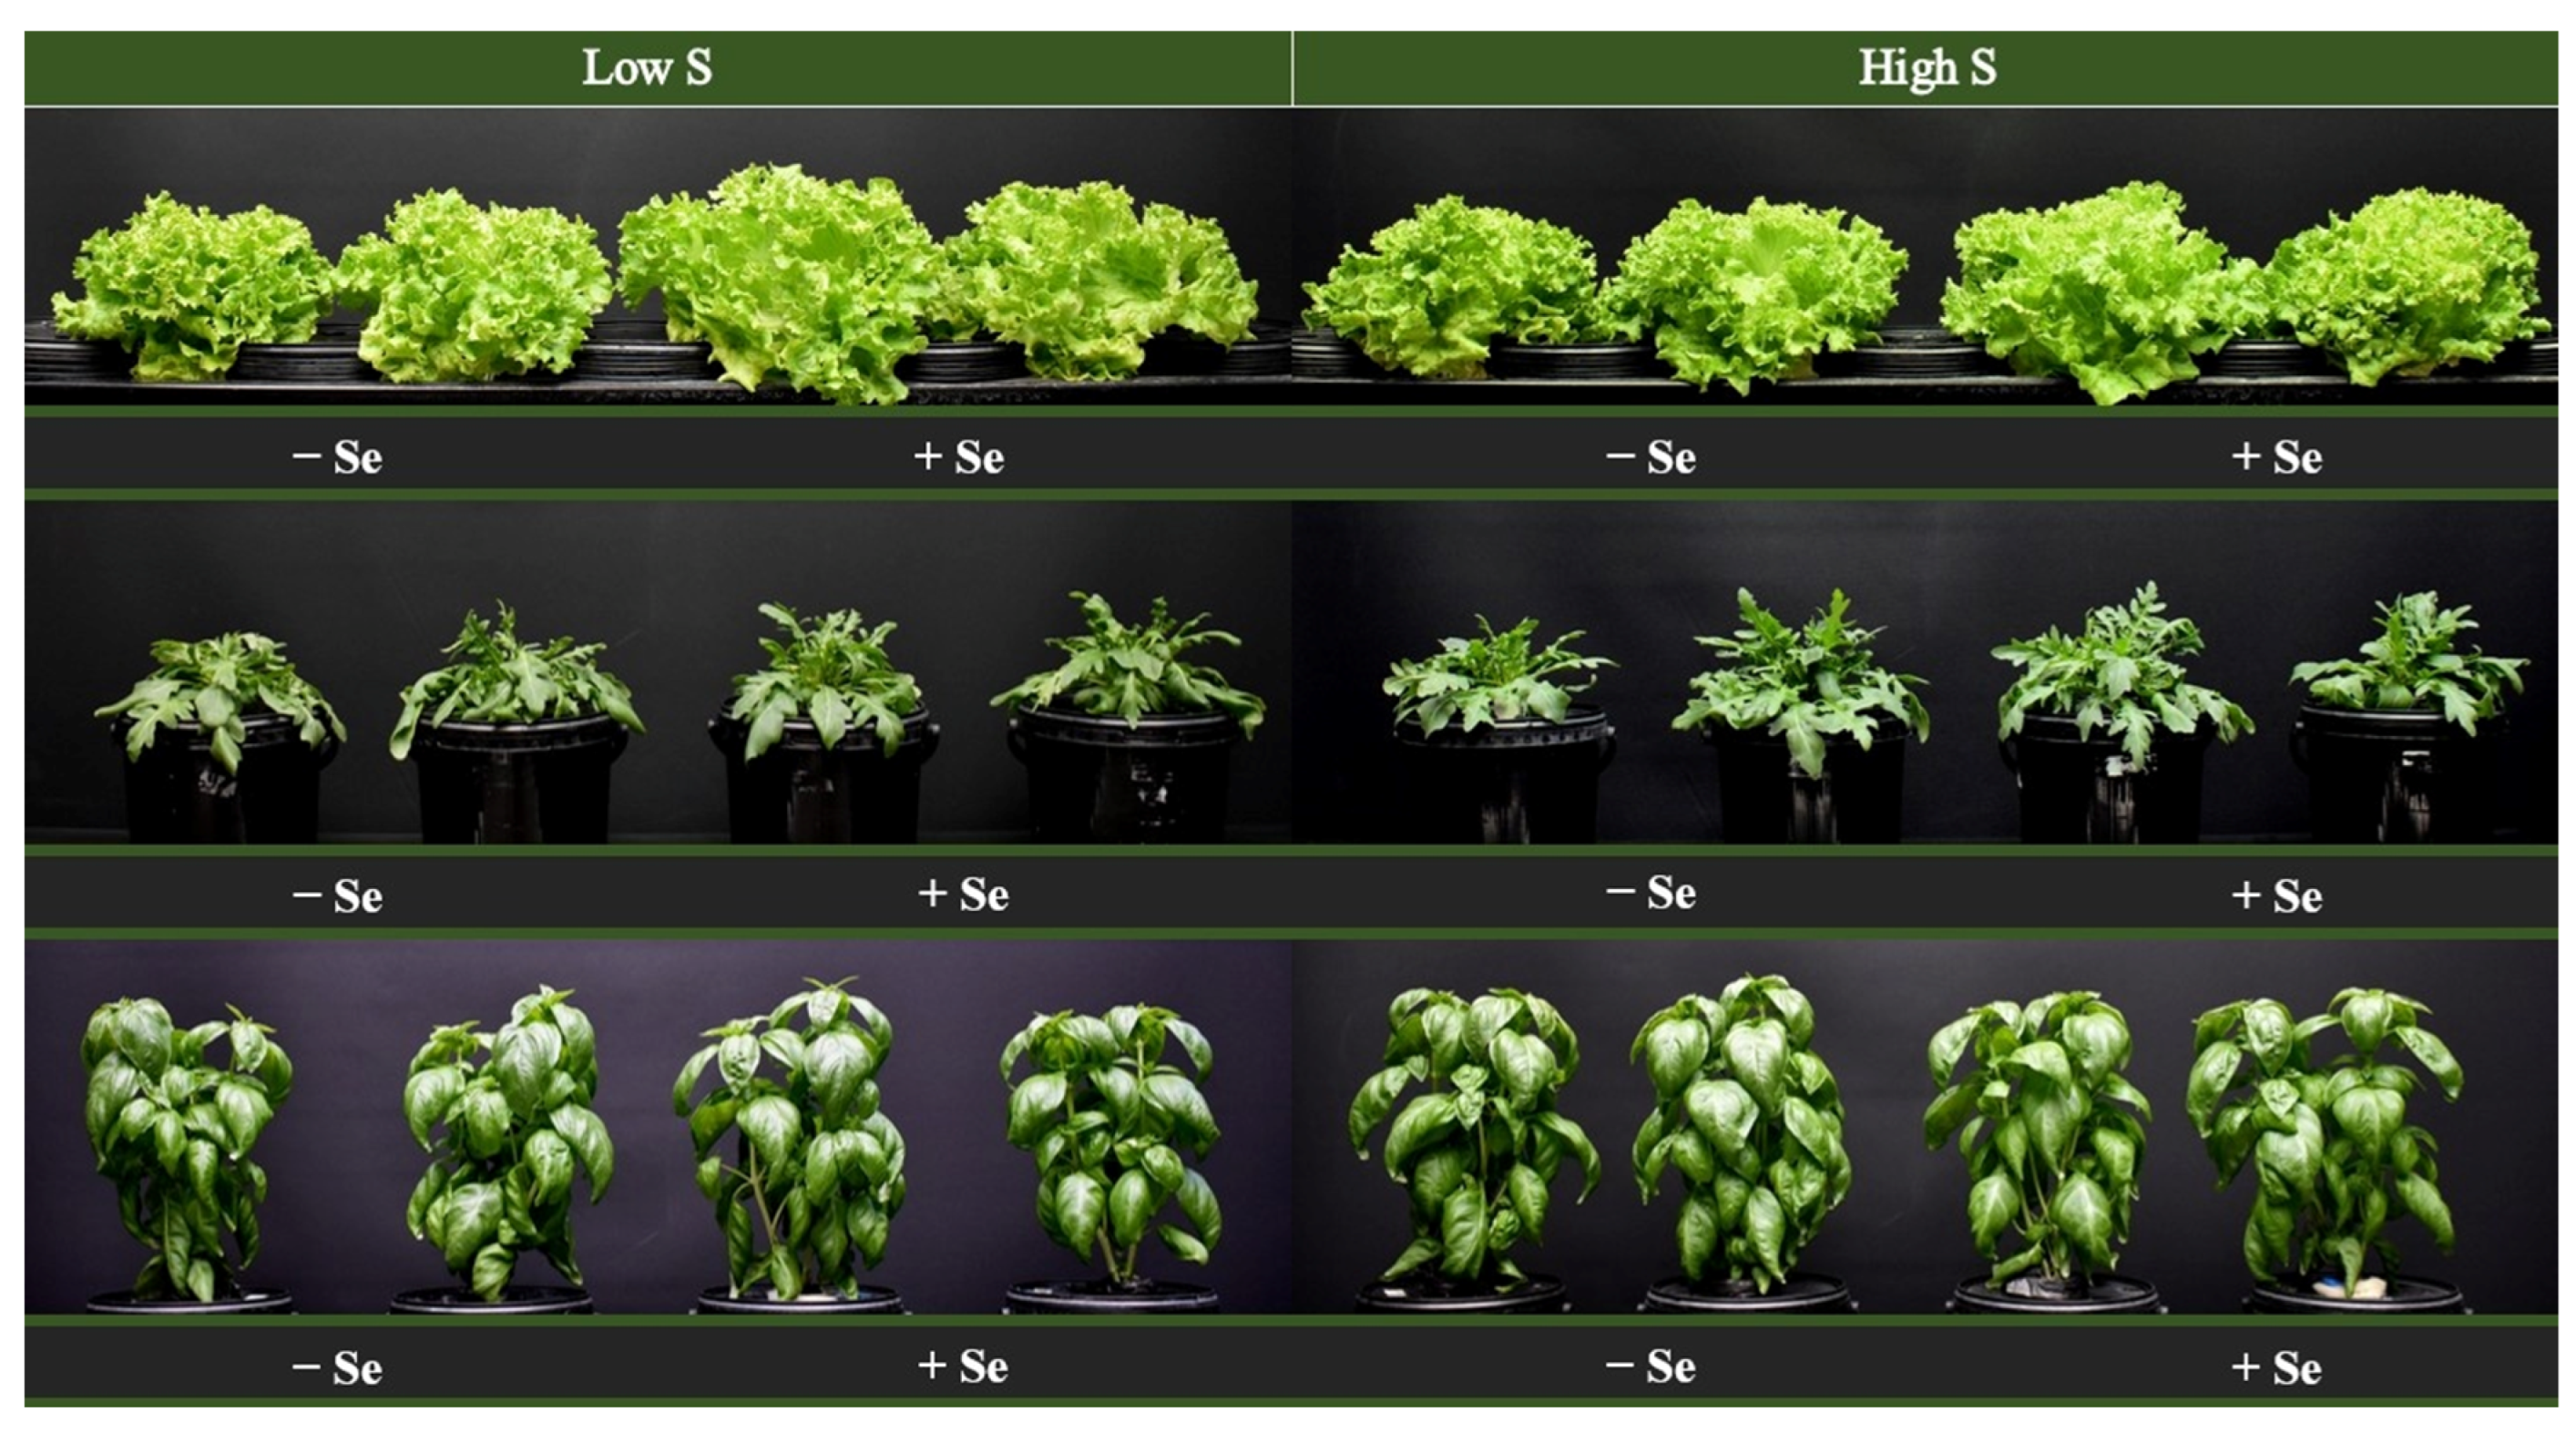
Figure 1 illustrates the shoot morphology of leafy greens grown in an indoor vertical NFT (nutrient film technique) system, comparing Se-treated and untreated plants under low and high S regimes. The statistical significance of the main and interactive effects of S and Se on growth parameters is summarized in Table 1, while mean values are presented in Table 2. Shoot fresh weight (FW) in lettuce and basil was significantly affected by S, Se, and their interaction, whereas rocket FW was not affected by any treatment (Table 1 and Table 2). High S increased shoot FW in lettuce and basil by 16% and 25%, respectively. Shoot FW responses to Se depended on S status and species. Under high S conditions, Se had no effect on shoot FW, whereas under low S conditions it increased FW in lettuce by 13% but decreased it in basil by 14%. Shoot dry weight (DW) responses to S and Se are also presented in Table 1 and Table 2. In lettuce, shoot DW was affected only by S, with higher values under high S conditions. In rocket, shoot DW was influenced by both S and the S × Se interaction, with high S reducing DW regardless of Se level, while Se increased DW under low S but decreased it under high S. In basil, both S and Se had significant effects on shoot DW, with high S increasing DW and Se decreasing it under both S conditions.
The effects of S and Se on dry matter ratio (DMR) and root DW are presented in Table 1 and Table 2. In lettuce, DMR was significantly affected by Se and the S × Se interaction. Se reduced DMR under low S conditions from 4.80% to 4.25%, whereas no significant effect was observed under high S. In rocket, both S and Se, as well as their interaction, significantly influenced DMR, with Se increasing DMR under low S but having no effect under high S. In basil, although ANOVA indicated a significant S × Se interaction, post hoc comparisons did not reveal significant differences among treatments. Root DW responses also varied among species. In lettuce, Se had a significant main effect according to ANOVA; however, this effect was not supported by post hoc comparisons. In rocket, both Se and the S × Se interaction significantly affected root DW, with Se increasing root DW under both S levels and the increase being more pronounced under high S. In basil, both S and Se had significant main effects, with 36% higher root DW observed under high S conditions and a 17% lower root DW under Se application.
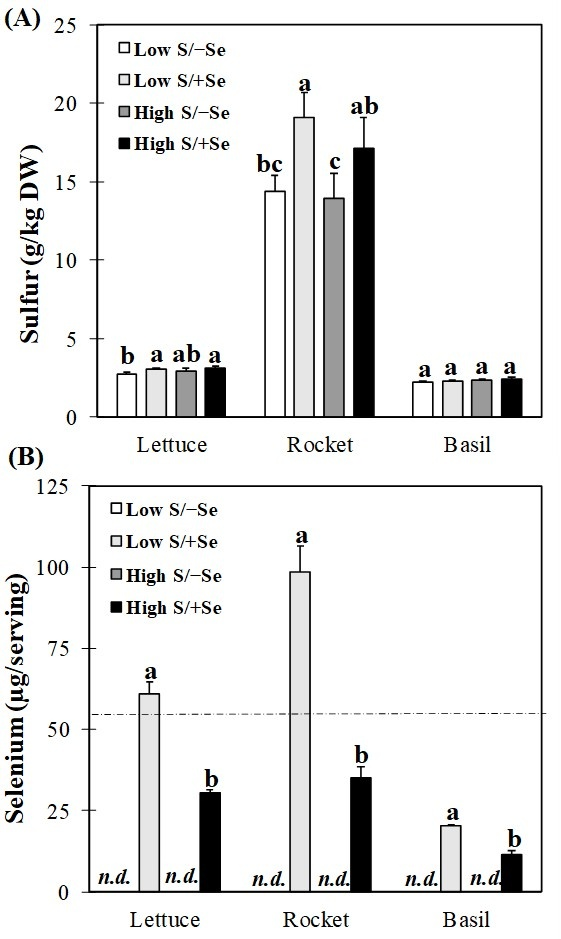
Shoot S concentration and Se content per serving for all species are presented in Figure 2, with statistical significance summarized in Table 1. Shoot S concentrations varied among species, with rocket showing the highest values. In lettuce, both S and Se significantly affected shoot S concentration, with higher values observed under high S supply. In rocket, only Se had a significant effect on shoot S concentration, whereas S had no effect. In basil, although ANOVA indicated a significant effect of S, post hoc comparisons did not reveal clear differences among treatments. Se content per serving was detected only in Se-treated plants. According to ANOVA, shoot Se content in all three species was significantly affected by S, Se, and their interaction. Se application resulted in substantial Se accumulation in all species, with rocket showing the highest content, reaching up to 100 µg per 20 g FW (equivalent to one serving portion). High S supply significantly reduced shoot Se content in all species, with reductions of up to approximately 50%. Under low S conditions, one serving of lettuce and rocket exceeded the recommended daily allowance (RDA), while basil remained below this threshold. Under high S conditions, Se content in all species was reduced, resulting in RDA contributions below or closer to the recommended level.
Macronutrient concentrations in lettuce, rocket, and basil are given in Table 3. In lettuce, shoot Ca concentration was significantly affected by S and the S × Se interaction, with higher Ca values observed under high S, particularly in the absence of Se. Shoot K and Mg concentrations were significantly affected by S, Se, and their interaction, whereas P concentration was affected only by the interaction. High S reduced K concentration by 17%, while Se increased it by 11% under low S but had no effect under high S. Mg concentration increased by 71% under high S, while Se reduced Mg concentration by 11% under high S but had no effect under low S. The highest P concentration (8.83 g/kg DW) was observed under low S with Se application. In rocket, shoot Ca concentration was not affected by S or Se treatments. However, S significantly affected K, Mg, and P concentrations, with high S increasing Mg (20%) but reducing P (12%). Although ANOVA indicated a reduction in K under high S, post hoc comparisons did not confirm significant differences. Se significantly affected only P concentration, with 7% lower values observed under Se application. In basil, shoot Ca concentration was affected only by Se, with 9% higher values observed under Se application. Shoot K concentration was significantly affected by S, Se, and their interaction, resulting in a 13% reduction in K under low S, but a 9% increase under high S. Mg concentration increased by 26% under high S, while P concentration was highest under low S without Se application, reaching up to 8.09 g/kg DW.
Micronutrient concentrations are summarized in Table 4. In lettuce, shoot Cu concentration was not affected by S or Se treatments. Shoot Fe concentration was significantly affected by S, Se, and their interaction, with the highest values observed under high S without Se application, reaching up 191 mg/kg DW. Shoot Mn concentration was significantly reduced by both S and Se, while shoot Zn concentration was affected only by Se, with 10% lower values observed under Se application. In rocket, both S and Se significantly affected Cu, Fe, and Mn concentrations, with high S increasing these elements (by 22–40%), while Se reduced Cu and Fe (16%, 33%, respectively) but increased Mn (18%). Shoot Zn concentration was affected only by S, with 44% lower values observed under high S. In basil, shoot Cu and Fe concentrations were significantly affected by S, Se, and their interaction. High S resulted in 5% higher Cu concentration regardless of Se, whereas Se reduced Cu from 11.7 to 10.5 mg/kg DW under low S conditions. Shoot Fe concentration was highest under low S with Se application, reaching up 120 mg/kg DW. Shoot Mn concentration was affected by both S and Se, with the lowest values observed under high S without Se. Shoot Zn concentration was influenced by the S × Se interaction, with Se reducing Zn by 20% under low S but increasing it by 18% under high S.
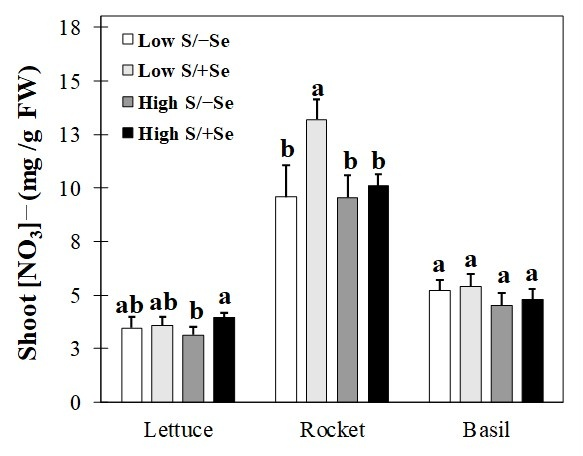
Figure 3 presents shoot nitrate concentrations in lettuce, rocket, and basil under different S and Se treatments. In lettuce, nitrate concentration was significantly affected only by Se, with higher values observed under Se application. In rocket, nitrate concentration was influenced by both S and Se, with the highest values observed under low S with Se application. In basil, ANOVA indicated a significant effect of S; however, post hoc comparisons did not reveal significant differences among treatments.
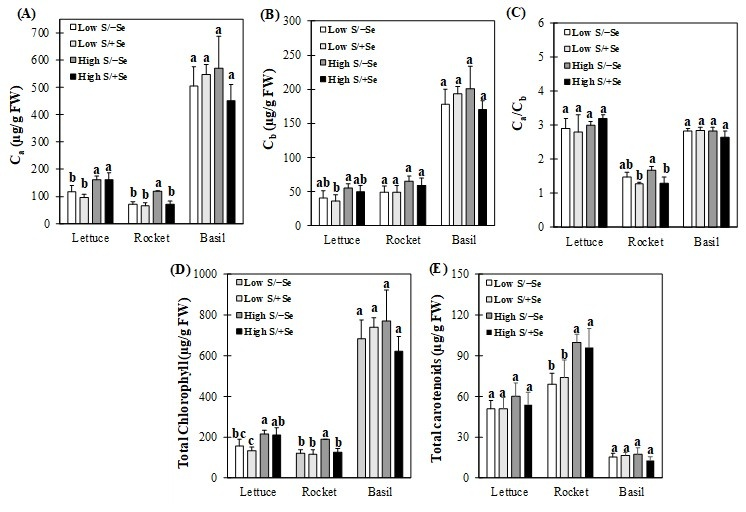
Figure 4 summarizes chlorophyll a and chlorophyll b concentrations, their ratio, total chlorophyll, and total carotenoid contents in lettuce, rocket, and basil under different S and Se treatments. In lettuce, S significantly increased chlorophyll a, chlorophyll b, and total chlorophyll concentrations (by 33%, 27%, and 32%, respectively), while Se had no significant effect on these parameters, and neither S nor Se affected the chlorophyll a/b ratio or total carotenoid concentration. In rocket, chlorophyll a, chlorophyll a/b ratio, and total chlorophyll were significantly influenced by S, Se, and their interaction, with the highest values observed under high S without Se application, while total carotenoid concentration showed a significant 27% increase under high S application. In basil, no significant effects of S or Se were observed on chlorophyll a, chlorophyll b, chlorophyll a/b ratio, total chlorophyll, or total carotenoid concentrations (Table 1 and Figure 4).
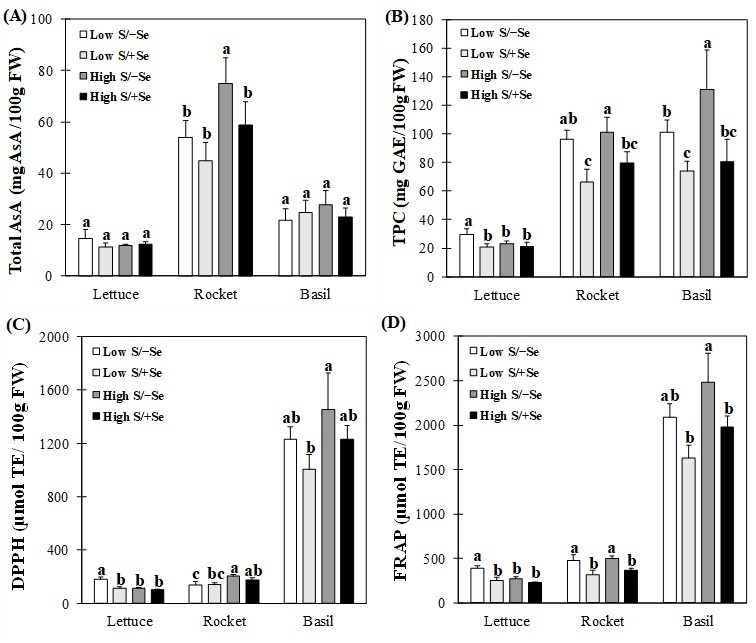
Figure 5 shows total ascorbic acid (AsA), total phenolic content (TPC), and antioxidant capacity measured by DPPH and FRAP assays in lettuce, rocket, and basil under different S and Se treatments. In lettuce and basil, total AsA concentration was not significantly affected by S or Se. In rocket, both S and Se had significant effects on AsA, with the highest levels observed under high S without Se application. In lettuce, DPPH and FRAP values were strongly correlated (R2 = 0.95), and both were also strongly correlated with TPC (R2 = 0.90), with higher values observed under low S without Se application. In rocket, the correlation between DPPH and FRAP (R2 = 0.65) and between DPPH and TPC (R2 = 0.64) was moderate, whereas FRAP and TPC were strongly correlated (R2 = 0.95), and antioxidant capacity was higher under high S while Se reduced TPC and FRAP values. In basil, DPPH and TPC showed a weaker correlation (R2 = 0.57), whereas FRAP was strongly correlated with both DPPH (R2 = 0.95) and TPC (R2 = 0.81), with high S increasing antioxidant capacity and Se reducing it.

4. Discussion

The study aims to develop selenium-enriched functional vegetables in an indoor NFT system, thereby improving productivity and quality, while also investigating the impact of S concentrations in the nutrient solution on this enrichment process. The results demonstrated that plant growth responses, including shoot FW and DW, DMR, and root DW, to Se treatment at different S levels differed among species (Table 1 and Table 2). Se treatment had a significant effect on the fresh biomass of lettuce and basil under low S conditions, promoting growth in lettuce while reducing it in basil, whereas no significant effects were observed under high S conditions. Plant species may react differently to trace element treatments due to differences in tolerance mechanisms. As reported by Puccinelli et al. (2022), the application of the same dose of Se did not alter fresh biomass in lettuce but significantly inhibited the growth of basil [44]. The toxic effect could be attributed to Se disrupting S metabolism, leading to impaired protein synthesis and photosynthesis [31,45]. The treatment that showed yield loss in basil was also the one with the highest Se accumulation, which supports the toxic effect of Se. S treatments had a significant main effect resulting in an increase in the fresh weight of lettuce and basil; arugula biomass was unaffected. The observed yield improvement in lettuce and basil with high S supplementation may be attributed more to Mg than to S itself. In this experiment, where MgSO4 was used as the S source, the additional S treatments also implied an additional supply of Mg. Although a statistically significant increase was observed in shoot S concentration under high S treatment, this increase was limited (Figure 2A). However, the responsive increase in Mg concentration far exceeded the S accumulation level (Table 3). Mg is an essential nutrient for crop growth and development, including photosynthesis and carbohydrate accumulation [46,47]. It has been reported that Mg fertilization boosts vegetable yields [48].
Rocket, like other Brassicaceae species, is an S-rich plant characterized by a high concentration of S-containing secondary metabolites [49,50]. In this investigation, the S accumulation capacity in rocket was notably higher than in the other leafy greens (Figure 2A). Unexpectedly, elevated root-zone sulfate availability did not trigger further accumulation in rocket tissue. This could be explained by the fact that sulfate transporters may have already reached their maximal capacity under the low S environment, and additional sulfate does not further increase tissue accumulation [51]. In lettuce and rocket, Se application resulted in increased tissue S concentrations, consistent with previous studies (Figure 2A) [52,53,54]. Boldrin et al. (2016) reported that selenate treatment simulated S deficiency by activating specific sulfate transporters, resulting in higher S accumulation [55]. Figure 2B illustrates the Se concentrations present in one serving of leafy greens. Rocket accumulated remarkably high levels of Se, parallel to its high S accumulation capacity, which aligns with its classification as a Se-accumulator plant [27]. Our findings confirm this physiological trait, as rocket exhibited the highest Se levels among the tested leafy greens. The notable suppression of Se accumulation reported under high S conditions is mostly due to competitive inhibition at the root plasma membrane, where sulfate and selenate share common transport routes [56,57]. High S availability likely saturates sulfate transporters, thereby limiting selenate uptake and reducing Se accumulation in plant tissues. These physiological interactions highlight the necessity of balancing S and Se supply in nutrient solution formulations for biofortification. Saeed also reported a similar study in 2023 [58], in which foliar Se was applied at levels of 0, 0.5, and 2 µM Na2SeO4 to spinach plants fertilized with 0, 1 mM, and 2 mM S, showing that higher Se uptake occurred under low S conditions. In a two-year soil-based study with Brassica napus, Liu et al. (2017) demonstrated that S supplementation reduces Se concentrations in seeds regardless of the form of Se [59].
Given that the primary goal of Se biofortification was to meet an adult’s recommended dietary allowance (RDA), which is established at 55 µg [43], our findings demonstrate that the nutritional contribution per serving is heavily modulated by the background S status. Under low S conditions, a single serving of lettuce and arugula successfully met or exceeded this daily requirement, whereas basil fell below the target threshold. High S availability further suppressed Se accumulation, reducing the contributions of lettuce and arugula to below the target limit and further decreasing the contribution of basil. Because Se toxicity can occur when consumption surpasses the tolerated upper limits, which is established at 400 µg [43], regulating the S supply in hydroponic formulations offers a vital species-specific agronomic technique to maintain Se accumulation within a safe threshold [54].
Evaluating the macroelement profiles revealed a clear cation antagonism across all species, where higher MgSO4 induced increase in tissue Mg levels concurrently reduced K concentrations (Table 2 and Table 3), primarily due to enhanced availability of Mg2+ in the root zone and its passive, concentration-dependent uptake by plant roots [60], which simultaneously triggered a corresponding decline in tissue K levels. In the root environment, Mg and K may compete as cations, leading to antagonistic interactions. Elevated Mg levels may hinder K uptake by competing for non-specific transporters and channels, disrupting electrochemical gradients required for K+ uptake, and altering membrane selectivity [60,61,62]. In lettuce, S and Se had interactive effects on Ca, K, Mg, and P concentrations. Under low S conditions, Se application increased these element concentrations, whereas under high S conditions, Ca, K, and Mg decreased, while K remained unchanged. In agreement with our findings, Abdalla et al. (2021) reported that foliar Se treatment increased P, K, and Ca accumulation in lettuce under 0.5 mM MgSO4 supply, which is comparable to the low S treatment (0.65 mM MgSO4) used in this study [63]. In a subsequent study, Abdullah et al. (2022) also observed increased P and Ca concentrations in lettuce under foliar Se application at 1 mM K2SO4 supply [30]. In rocket, Ca levels were not affected by any treatment, whereas tissue P levels were markedly reduced by high MgSO4 supplementation, possibly due to interference of Mg2+ with phosphate transport systems at the membrane level [64]. P accumulation in rocket was also significantly reduced as a main effect of Se application. In contrast, Tallarita et al. (2025) reported increased Ca, K, Mg, and P concentrations in soil-grown rocket under 0.26 mM Se supply [65]. Spyrou (2025) observed reduced P concentrations in ice plant and dandelion following Se application, which is consistent with our findings [66]. This reduction is likely due to shared transport pathways between Se and P, resulting in competitive inhibition during root uptake [67]. In basil, Se supplementation exerted a dual effect on K and P concentrations depending on S availability, decreasing them under low S conditions but increasing them under high S conditions. Conversely, Ca accumulation was promoted by Se across both S treatments. Our findings support previous studies [44,68,69,70], indicating that Se exposure does not produce a uniform response in macronutrient content but rather species- and cultivar-specific effects.
The micronutrient composition of the leafy greens indicated that S and Se enrichment influenced Cu, Fe, Mn, and Zn levels (Table 4). While treatments had no effect on Cu in lettuce, they significantly affected Cu in rocket and basil. Both species showed reduced Cu concentrations under 2 µM Se at low S (0.65 mM MgSO4), whereas this effect was not significant under high S conditions. Under high S supply, Cu concentration decreased in rocket but increased in basil. Previous studies report inconsistent effects of Se on Cu accumulation, depending on plant species and Se form. Na2SeO4 application has been shown to reduce Cu concentration, whereas Na2SeO3 increases Cu accumulation in lettuce [69]. Similarly, Silva et al. (2018, 2019) reported reduced Cu uptake with selenate in hydroponically grown lettuce [71,72]. Puccinelli et al. (2022) observed reduced Cu in basil but increased levels in lettuce, while Spyrou et al. (2025) reported increased Cu in purslane and dandelion but no effect in ice plant under Se application [44,66]. Abdalla et al. (2022) demonstrated that Cu concentrations vary depending on the S:Se ratio [30]. Our findings reveal species-dependent response effects of Se on Fe homeostasis between the studied species, where Se exposure suppressed Fe accumulation in lettuce and rocket but exerted a strong synergistic effect on basil under low S status. Previous studies have shown that Se affects Fe accumulation in a species-dependent manner [44,72,73]. Reduced Fe accumulation in hydroponically grown lettuce has also been reported [71,72]. In contrast, Se enrichment increased Fe in basil and coriander but reduced it in tatsoi [73], while no effect was observed in wild lettuce genotypes [66]. In this study, Mn levels decreased under high MgSO4 supply across all species, possibly due to antagonistic effects of S and Mg on Mn homeostasis [61]. The response of Mn to Se was species-dependent, decreasing in lettuce but increasing in rocket. In rocket and basil, Mn levels were lowest under high S without Se application. Although statistical grouping was not distinct, numerical trends suggested that Se reduced Zn accumulation in lettuce and rocket under both S levels. In contrast, basil showed a clear S × Se interaction, with reduced Zn under low S and increased Zn under high S conditions. Previous studies have also reported species-, dose-, and form-dependent effects of Se on Zn accumulation [44,65,66,73,74].
Previous studies have mostly shown that Se supplementation reduces nitrate accumulation by enhancing nitrate efflux from roots and limiting transport to shoots and stimulating key nitrogen assimilation enzymes including nitrate reductase (NR), nitrite reductase (NiR), glutamine synthase (GS) and glutamate synthase (GOGAT) [75,76]. Numerous studies have reported reduced nitrate concentrations in Se-enriched leafy greens, including lettuce [70,75,76,77,78] and basil, tatsoi, corn salad, and coriander [73,79,80]. In contrast, other studies have found no effect of Se on nitrate accumulation [81,82,83]. Species- and dose-dependent responses have also been reported. Puccinelli et al. (2022) observed that high Se (3 mg/L) reduced nitrate levels in mature lettuce but had no effect on basil or lettuce seedlings [44]. Spyrou (2025) reported no effect in purslane, a decrease in ice plant, and an increase in dandelion under 2 and 4 µM Se [66]. Puccinelli et al. (2024) reported no significant effect but observed a numerical increase [84]. In the present study, Se treatment significantly increased nitrate levels in lettuce and rocket, while no effect was observed in basil (Figure 3). This may be explained by a low-dose stimulatory effect of Se, acting as a signaling molecule to enhance nitrate uptake. The fact that this increase occurred in lettuce and rocket but not in basil suggests a possible interaction with S metabolism. This interpretation is supported by the observation that Se-induced increases in S concentration were detected in lettuce and rocket but not in basil (Figure 2A), suggesting that enhanced S uptake may influence nitrate uptake and contribute to N:S balance regulation [52,54]. Basil may respond differently due to species-specific nutrient acquisition mechanisms.
In this study, no significant changes in photosynthetic pigment profiles were observed in lettuce and basil, consistent with previous studies demonstrating that low-dose Se enrichment generally does not alter photosynthetic pigments [84,85,86,87]; however, under high S conditions, Se application significantly reduced these pigment levels in rocket (Figure 4). The significant enhancement of photosynthetic pigments under elevated S supply in lettuce and rocket, regardless of Se, levels may be associated with increased Mg availability, as Mg is a central component of the chlorophyll molecule and supports pigment accumulation [88].
Se biofortification not only increases Se concentration in plants but can also influence secondary metabolites such as vitamins, amino acids, and phenolics [18,30,34,80]. In this study, total ascorbic acid, total phenolic content (TPC), and antioxidant activity (DPPH and FRAP) were evaluated. While many studies report increased antioxidant levels with Se application [53,89,90,91], our findings did not follow this trend. Se treatment had no significant effect on total ascorbic acid in lettuce and basil and significantly reduced it in rocket (Figure 5A). TPC, DPPH, and FRAP values were also significantly reduced by Se treatment in all three species (Figure 5B–D). This discrepancy may be explained by the relatively low Se concentration used in nutrient solution, which may be below the threshold required to stimulate antioxidant responses. Puccinelli et al. (2022) demonstrated that antioxidant responses to Se are dose-dependent [44]. In that study, 1 mg/L Se for lettuce and 2 mg/L for basil had no effect on phenolics or antioxidant capacity, whereas 3 mg/L significantly increased these parameters. Similarly, Skrypnik et al. (2019) reported that 2 µM Se caused only minor changes in antioxidant activity in basil, whereas higher concentrations (5–10 µM) significantly increased DPPH, ABTS, and FRAP values [92]. Other studies have also shown no effect of Se biofortification on phenolics or antioxidant activity [84,93,94]. The relatively low Se concentration used in this study was selected to align with human RDA targets; however, such low doses remain underexplored in the literature. While S-Se antagonism in soil is well known, the most important novelty of this study is the investigation of these ionic interactions in an indoor NFT system without the interference effect of soil. Specifically, the applied low Se concentration (2 μM) failed to increase antioxidant capacity; this result is inconsistent with much of the previous literature, where higher doses generally trigger upregulation. This inconsistency highlights the need for further analysis of the specific dose–response threshold of Se. Furthermore, this lack of increase may be closely related to the stable, low-stress conditions of the indoor NFT environment. In the absence of environmental stressors (such as temperature fluctuations or drought), production of reactive oxygen species (ROS) remains minimal, the low-dose Se signal may be insufficient to trigger further upregulation of antioxidant enzyme systems. To better understand this dose–environment interaction and broaden its practical applicability, studies on low-dose Se application in open-field or semi-controlled environments are also required.
Furthermore, a negative correlation between nitrate accumulation and antioxidant capacity under Se treatment was observed in this study. While previous studies have generally reported that reduced nitrate levels are associated with increased antioxidant synthesis [95], the present findings indicate the opposite trend, where Se-induced increases in nitrate were associated with reduced antioxidant capacity, highlighting the distinct metabolic regulation and marginal contribution of our study in controlled hydroponic systems.
It should also be noted, however, that because MgSO4 served as the primary S source, the growth promotion observed under elevated S supply, together with other responses including tissue Se accumulation, may have resulted from the combined effects of S and Mg rather than from S alone. Future studies using factorial combinations of Mg-free S sources and S-free Mg sources are therefore needed to disentangle the individual contributions of these nutrients to growth, quality, and Se biofortification.

5. Conclusions

This study demonstrates that S supply is a key regulator of Se biofortification and associated nutritional traits in leafy greens grown in an indoor NFT system. Increased sulfate supply enhanced biomass in lettuce and basil; however, it simultaneously reduced Se accumulation in all species, thereby lowering their contribution to dietary Se intake. For plants with high S and Se accumulation capacities, such as rocket, a higher S concentration in the nutrient solution (1.3 mM) may be advisable to limit excessive and potentially toxic Se accumulation. In contrast, for species such as basil and lettuce, which have lower baseline Se accumulation capacities, a lower root-zone S concentration (0.65 mM) may support efficient Se uptake and help preserve their functional contribution to dietary Se intake, although possible counterion effects such as those of Mg in this study must also be taken into account. Clear species-specific responses were observed in growth, Se accumulation, antioxidant capacity, and mineral composition. Notably, in contrast to many reports of enhanced antioxidant activity with Se enrichment, Se applied at levels aligned with human RDA targets reduced antioxidant capacity (TPC, DPPH, FRAP) under fully controlled indoor conditions. These findings suggest that Se biofortification of leafy greens in soilless systems may not necessarily maximize overall nutritional quality, and that precise management of macronutrient supply, particularly S, is critical for achieving the greatest nutritional benefits.

Author Contributions

Conceptualization, A.B. and U.B.K.; methodology, A.B. and U.B.K.; validation, A.B. and U.B.K.; formal analysis, A.B.; investigation, A.B.; data curation, A.B.; writing—original draft preparation, A.B.; writing—review and editing, U.B.K.; visualization, A.B. and U.B.K.; supervision, U.B.K.; project administration, U.B.K.; funding acquisition, U.B.K. All authors have read and agreed to the published version of the manuscript.

Funding

This study was part of the PhD thesis of the first author, who received a PhD scholarship in the priority field of ‘Sustainable Agriculture’ from the Council of Higher Education (100/2000 CoHE PhD Scholarship Program).

Data Availability Statement

The original contributions presented in this study are included in the article. Further inquiries can be directed to the corresponding author.

Acknowledgments

The authors gratefully acknowledge Plant Factory Bitki ve Gıda Sistemleri A.S. for providing the lettuce seeds and helping with the technical maintenance of the vertical farm prototype at the Institute of Biotechnology at Gebze Technical University.

Conflicts of Interest

Author Aysenur Bayrak was employed by the company Plant Factory. The remaining authors declare that the research was conducted in the absence of any commercial or financial relationships that could be construed as a potential conflict of interest.

Abbreviations

The following abbreviations are used in this manuscript:
RDARecommended daily allowance
CEAControlled environment agriculture
NFTNutrient film technique
FWFresh weight
DWDry weight
DMRDry matter ratio
AsAAscorbic acid
TPCTotal phenolic content
GAEGallic acid equivalent
DPPH2,2-diphenyl-1-picrylhydrazyl
FRAPFerric-reducing antioxidant power
Trolox(±)-6-Hydroxy-2,5,7,8-tetramethylchromane-2-carboxylic acid
TETrolox equivalent
YOKCouncil of Higher Education

References

  1. Benke, K.; Tomkins, B. Future Food Production Systems: Vertical Farming and Controlled-Environment Agriculture. Sustainability 2017, 9, 13. [Google Scholar] [CrossRef]
  2. Panotra, N.; Belagalla, N.; Mohanty, L.K.; Ramesha, N.M.; Tiwari, A.K.; Abhishek, G.; Pandey, S.K. Vertical Farming: Addressing the Challenges of 21st Century Agriculture through Innovation. Int. J. Environ. Clim. Change 2024, 14, 664–691. [Google Scholar] [CrossRef]
  3. Kozai, T.; Ohyama, K.; Chun, C. Commercialized Closed Systems with Artificial Lighting for Plant Production. Acta Hortic. 2006, 711, 61–70. [Google Scholar] [CrossRef]
  4. Kozai, T. Sustainable Plant Factory: Closed Plant Production Systems with Artificial Light for High Resource Use Efficiencies and Quality Produce. Acta Hortic. 2013, 1004, 27–40. [Google Scholar] [CrossRef]
  5. Graamans, L.; Baeza, E.; van den Dobbelsteen, A.; Tsafaras, I.; Stanghellini, C. Plant Factories versus Greenhouses: Comparison of Resource Use Efficiency. Agric. Syst. 2018, 160, 31–43. [Google Scholar] [CrossRef]
  6. Hosseini, H.; Mozafari, V.; Roosta, H.R.; Shirani, H.; van de Vlasakker, P.C.H.; Farhangi, M. Nutrient Use in Vertical Farming: Optimal Electrical Conductivity of Nutrient Solution for Growth of Lettuce and Basil in Hydroponic Cultivation. Horticulturae 2021, 7, 283. [Google Scholar] [CrossRef]
  7. Palmitessa, O.D.; Signore, A.; Santamaria, P. Advancements and Future Perspectives in Nutrient Film Technique Hydroponic System: A Comprehensive Review and Bibliometric Analysis. Front. Plant Sci. 2024, 15, 1504792. [Google Scholar] [CrossRef] [PubMed]
  8. Kozai, T. Plant Factory in Japan—Current Situation and Perspectives. Chron. Hortic. 2013, 53, 8–11. [Google Scholar]
  9. Kozai, T.; Niu, G.; Takagaki, M. Plant Factory: An Indoor Vertical Farming System for Efficient Quality Food Production, 2nd ed.; Academic Press: Cambridge, MA, USA, 2020. [Google Scholar]
  10. Slavin, J.L.; Lloyd, B. Health Benefits of Fruits and Vegetables. Adv. Nutr. 2012, 3, 506–516. [Google Scholar] [CrossRef] [PubMed]
  11. Kumar, S.; Pandey, A.K. Chemistry and Biological Activities of Flavonoids: An Overview. Sci. World J. 2013, 2013, 162750. [Google Scholar] [CrossRef] [PubMed]
  12. Natesh, H.N.; Abbey, L.; Asiedu, S.K. An Overview of Nutritional and Antinutritional Factors in Green Leafy Vegetables. Hortic. Int. J. 2017, 1, 58–65. [Google Scholar] [CrossRef]
  13. Aslam, T.; Maqsood, M.; Jamshaid, I.; Ashraf, K.; Zaidi, F.; Khalid, S.; Shah, F.U.H.; Noureen, S.; Maria. Health Benefits and Therapeutic Importance of Green Leafy Vegetables (GLVs). Eur. Acad. Res. 2020, 8, 4213–4229. [Google Scholar]
  14. Blom-Zandstra, M. Nitrate accumulation in vegetables and its relationship to quality. Ann. Appl. Biol. 1989, 115, 553–561. [Google Scholar] [CrossRef]
  15. Buturi, C.V.; Mauro, R.P.; Fogliano, V.; Leonardi, C.; Giuffrida, F. Mineral Biofortification of Vegetables as a Tool to Improve Human Diet. Foods 2021, 10, 223. [Google Scholar] [CrossRef] [PubMed]
  16. White, P.J.; Broadley, M.R. Biofortification of crops with seven mineral elements often lacking in human diets–iron, zinc, copper, calcium, magnesium, selenium and iodine. New Phytol. 2009, 182, 49–84. [Google Scholar] [CrossRef] [PubMed]
  17. Rayman, M.P. Selenium and Human Health. Lancet 2012, 379, 1256–1268. [Google Scholar] [CrossRef] [PubMed]
  18. Malagoli, M.; Schiavon, M.; Dall’Acqua, S.; Pilon-Smits, E.A.H. Effects of selenium biofortification on crop nutritional quality. Front. Plant Sci. 2015, 6, 280. [Google Scholar] [CrossRef] [PubMed]
  19. Lyons, G. Biofortification of Cereals with Foliar Selenium and Iodine Could Reduce Hypothyroidism. Front. Plant Sci. 2018, 9, 730. [Google Scholar] [CrossRef] [PubMed]
  20. Zhou, X.; Yang, J.; Kronzucker, H.J.; Shi, W. Selenium Biofortification and Interaction with Other Elements in Plants: A Review. Front. Plant Sci. 2020, 11, 586421. [Google Scholar] [CrossRef] [PubMed]
  21. Berger, M.M.; Shenkin, A.; Schweinlin, A.; Amrein, K.; Augsburger, M.; Biesalski, H.-K.; Bischoff, S.C.; Casaer, M.P.; Gundogan, K.; Lepp, H.-L.; et al. ESPEN micronutrient guideline. Clin. Nutr. 2022, 41, 1357–1424. [Google Scholar] [CrossRef] [PubMed]
  22. Oztekin, Y.; Buyuktuncer, Z. Agronomic biofortification of plants with iodine and selenium: A potential solution for iodine and selenium deficiencies. Biol. Trace Elem. Res. 2025, 203, 2899–2910. [Google Scholar] [CrossRef] [PubMed]
  23. Schiavon, M.; Pilon-Smits, E.A.H. Selenium Biofortification and Phytoremediation Phytotechnologies: A Review. J. Environ. Qual. 2020, 49, 10–19. [Google Scholar] [CrossRef]
  24. Eich-Greatorex, S.; Sogn, T.A.; Øgaard, A.F.; Aasen, I. Plant Availability of Inorganic and Organic Selenium Fertiliser as Influenced by Soil Organic Matter Content and pH. Nutr. Cycl. Agroecosystems 2007, 79, 221–231. [Google Scholar] [CrossRef]
  25. Winkel, L.; Vriens, B.; Jones, G.D.; Schneider, L.S.; Pilon-Smits, E.A.H.; Bañuelos, G.S. Selenium Cycling across Soil–Plant–Atmosphere Interfaces: A Critical Review. Nutrients 2015, 7, 4199–4239. [Google Scholar] [CrossRef] [PubMed]
  26. Nascimento, A.P.; Guilherme, L.R.G.; da Cunha, K.P.V.; Nogueira, T.A.R.; da Silva, Y.J.A.B.; de Oliveira, C.H.S. Biofortification of Rocket (Eruca sativa) with Selenium Using the Nutrient Film Technique. J. Soil Sci. Plant Nutr. 2022, 8, 1088. [Google Scholar] [CrossRef]
  27. Zafeiriou, I.; Gasparatos, D.; Kalloniati, C.; Karyotis, T.; Koutsos, T.M. Selenium uptake by rocket plants (Eruca sativa) grown in a calcareous soil as affected by Se species, Se rate, and a seaweed extract-based biostimulant application. Crop Pasture Sci. 2022, 73, 850–861. [Google Scholar] [CrossRef]
  28. Kopriva, S.; Calderwood, A.; Weckopp, S.C.; Koprivova, A. Plant Sulfur and Big Data. Plant Cell Physiol. 2015, 56, 2015–2023. [Google Scholar] [CrossRef]
  29. Capaldi, F.R.; Gratão, P.L.; Reis, A.R.; Lima, L.W.; Azevedo, R.A. Sulfur Metabolism and Stress Defense Responses in Plants. Trop. Plant Biol. 2015, 8, 60–73. [Google Scholar] [CrossRef]
  30. Abdalla, M.A.; Lentz, C.; Mühling, K.H. Crosstalk between Selenium and Sulfur Is Associated with Changes in Primary Metabolism in Lettuce Plants Grown under Se and S Enrichment. Plants 2022, 11, 927. [Google Scholar] [CrossRef] [PubMed]
  31. Gupta, M.; Gupta, S. An Overview of Selenium Uptake, Metabolism, and Toxicity in Plants. Front. Plant Sci. 2017, 7, 2074. [Google Scholar] [CrossRef] [PubMed]
  32. White, P.J. Selenium metabolism in plants. Biochim. Biophys. Acta (BBA)-Gen. Subj. 2018, 1862, 2333–2342. [Google Scholar] [CrossRef] [PubMed]
  33. Sors, T.G.; Ellis, D.R.; Na, G.N.; Lahner, B.; Lee, S.; Leustek, T.; Pickering, I.J.; Salt, D.E. Analysis of Sulfur and Selenium Assimilation in Arabidopsis thaliana Mutants. Plant Physiol. 2005, 138, 409–420. [Google Scholar] [CrossRef]
  34. Djanaguiraman, M.; Prasad, P.V.; Seppanen, M. Selenium Protects Sorghum Leaves from Oxidative Damage under High Temperature Stress by Enhancing Antioxidant Defense System. Plant Physiol. Biochem. 2010, 48, 999–1007. [Google Scholar] [CrossRef] [PubMed]
  35. D’Amato, R.; Regni, L.; Falcinelli, B.; Mattioli, S.; Benincasa, P.; Dal Bosco, A.; Pacheco, P.; Proietti, P.; Troni, E.; Santi, C.; et al. Current Knowledge on Selenium Biofortification to Improve the Nutraceutical Profile of Food: A Comprehensive Review. J. Agric. Food Chem. 2020, 68, 4075–4097. [Google Scholar] [CrossRef] [PubMed]
  36. Ceylan, Y.; Kutman, U.B.; Mengutay, M.; Cakmak, I. Magnesium Applications to Growth Medium and Foliage Affect the Starch Distribution, Increase the Grain Size and Improve the Seed Germination in Wheat. Plant Soil 2016, 406, 145–156. [Google Scholar] [CrossRef]
  37. Lichtenthaler, H.K. Chlorophylls and carotenoids, the pigments of photosynthetic biomembranes. Methods Enzymol. 1987, 148, 350–382. [Google Scholar] [CrossRef]
  38. Cataldo, D.A.; Haroon, M.; Schrader, L.E.; Youngs, V.L. Rapid Colorimetric Determination of Nitrate in Plant Tissue by Nitration of Salicylic Acid. Commun. Soil Sci. Plant Anal. 1975, 6, 71–80. [Google Scholar] [CrossRef]
  39. Gillespie, K.M.; Ainsworth, E.A. Measurement of reduced, oxidized and total ascorbate content in plants. Nat. Protoc. 2007, 2, 871–874. [Google Scholar] [CrossRef] [PubMed]
  40. Singleton, V.L.; Orthofer, R.; Lamuela-Raventós, R.M. Analysis of total phenols and other oxidation substrates and antioxidants by means of folin-ciocalteu reagent. Methods Enzymol. 1999, 299, 152–178. [Google Scholar] [CrossRef]
  41. Brand-Williams, W.; Cuvelier, M.E.; Berset, C. Use of a free radical method to evaluate antioxidant activity. LWT 1995, 28, 25–30. [Google Scholar] [CrossRef]
  42. Benzie, I.; Strain, J. The Ferric Reducing Ability of Plasma (FRAP) as a Measure of Antioxidant Power the FRAP Assay. Anal. Biochem. 1996, 239, 70–76. [Google Scholar] [CrossRef] [PubMed]
  43. Institute of Medicine (US) Panel on Dietary Antioxidants and Related Compounds. Dietary Reference Intakes for Vitamin C, Vitamin E, Selenium, and Carotenoids; Chapter 7; National Academies Press: Washington, DC, USA, 2000. Available online: https://www.ncbi.nlm.nih.gov/books/NBK225470/ (accessed on 13 May 2025).
  44. Puccinelli, M.; Malorgio, F.; Pintimalli, L.; Rosellini, I.; Pezzarossa, B. Biofortification of Lettuce and Basil Seedlings to Produce Selenium Enriched Leafy Vegetables. Horticulturae 2022, 8, 801. [Google Scholar] [CrossRef]
  45. Mengel, K.; Kirkby, E.A. Principles of Plant Nutrition; International Potash Institute: Zug, Switzerland, 1987; 687p. [Google Scholar]
  46. Cakmak, I.; Hengeler, C.; Marschner, H. Changes in phloem export of sucrose in leaves in response to phosphorus, potassium and magnesium deficiency in bean plants. J. Exp. Bot. 1994, 45, 1251–1257. [Google Scholar] [CrossRef]
  47. Farhat, N.; Elkhouni, A.; Zorrig, W.; Smaoui, A.; Abdelly, C.; Rabhi, M. Effects of Magnesium Deficiency on Photosynthesis and Carbohydrate Partitioning. Acta Physiol. Plant. 2016, 38, 145. [Google Scholar] [CrossRef]
  48. Wang, M. Magnesium Fertilization Improves Crop Yield in Most Production Systems: A Meta-Analysis. Agronomy 2020, 10, 1324. [Google Scholar] [CrossRef] [PubMed]
  49. Schiavon, M.; Pilon-Smits, E.A.H. Exploring the importance of sulfate transporters and ATP sulfurylases for selenium hyperaccumulation—A comparison of Stanleya pinnata and Brassica juncea (Brassicaceae). Front. Plant Sci. 2015, 6, 2. [Google Scholar] [CrossRef] [PubMed]
  50. White, P.J. Selenium accumulation by plants. Ann. Bot. 2015, 117, 217–235. [Google Scholar] [CrossRef] [PubMed]
  51. Hawkesford, M.J. Plant Responses to Sulphur Deficiency and the Genetic Manipulation of Sulphate Transporters to Improve S-Utilization Efficiency. J. Exp. Bot. 2000, 51, 131–138. [Google Scholar] [PubMed]
  52. White, P.J.; Bowen, H.C.; Parmar, S.; Fritz, M.; Spracklen, W.P.; Spiby, R.E.; Meacham, M.C.; Mead, A.; Harriman, M.; Trueman, L.J.; et al. Interactions between selenium and sulphur nutrition in Arabidopsis thaliana. J. Exp. Bot. 2004, 55, 1927–1937. [Google Scholar] [CrossRef] [PubMed]
  53. Ramos, S.J.; Faquin, V.; Guilherme, L.R.G.; Castro, E.M.; Ávila, F.W.; Carvalho, G.S.; Bastos, C.E.A.; Oliveira, C. Selenium biofortification and antioxidant activity in lettuce plants fed with selenate and selenite. Plant Soil Environ. 2011, 57, 584–588. [Google Scholar] [CrossRef]
  54. Tian, M.; Gu, L.; Liu, Y.; Wang, Q.; Zhang, Y.; Zhang, W.; Chen, Y.; Wang, X. Selenium-Induced Toxicity Is Counteracted by Sulfur in Broccoli (Brassica oleracea L. var. italica). Front. Plant Sci. 2017, 8, 1425. [Google Scholar] [CrossRef] [PubMed]
  55. Boldrin, P.F.; de Figueiredo, M.A.; Guilherme, L.R.G.; Caires, E.F.; Gozzo, F.C.; Carvalho, R.F.; Faquin, V.; Li, L. Selenium promotes sulfur accumulation and plant growth in wheat (Triticum aestivum). Physiol. Plant. 2016, 158, 80–91. [Google Scholar] [CrossRef] [PubMed]
  56. Sors, T.G.; Ellis, D.R.; Salt, D.E. Selenium uptake, translocation, assimilation and metabolic fate in plants. Photosynth. Res. 2005, 86, 373–389. [Google Scholar] [CrossRef] [PubMed]
  57. Zhu, Y.G.; Pilon-Smits, E.A.H.; Zhao, F.J.; Williams, P.N.; Meharg, A.A. Selenium in higher plants: Understanding mechanisms for biofortification and phytoremediation. Trends Plant Sci. 2009, 14, 436–442. [Google Scholar] [CrossRef] [PubMed]
  58. Saeed, K.; Nisa, F.K.; Abdalla, M.A.; Mühling, K.H. The Interplay of Sulfur and Selenium Enabling Variations in Micronutrient Accumulation in Red Spinach. Int. J. Mol. Sci. 2023, 24, 12766. [Google Scholar] [CrossRef] [PubMed]
  59. Liu, X.; Yang, Y.; Deng, X.; Li, M.; Zhang, W.; Zhao, Z. Effects of sulfur and sulfate on selenium uptake and quality of seeds in rapeseed (Brassica napus L.) treated with selenite and selenate. Environ. Exp. Bot. 2017, 135, 13–20. [Google Scholar] [CrossRef]
  60. Marschner, H. Marschner’s Mineral Nutrition of Higher Plants, 3rd ed.; Chapter 6; Academic Press: London, UK, 2012. [Google Scholar]
  61. Fageria, N.K. Nutrient interactions in crop plants. J. Plant Nutr. 2001, 24, 1269–1290. [Google Scholar] [CrossRef]
  62. Hasanuzzaman, M.; Hossain, M.A.; Fujita, M. Selenium-induced up-regulation of antioxidant defense and methylglyoxal detoxification systems confers tolerance to drought stress in rapeseed seedlings. Biol. Trace Elem. Res. 2011, 143, 1704–1721. [Google Scholar] [CrossRef] [PubMed]
  63. Abdalla, M.A.; Wick, J.E.; Famuyide, I.M.; McGaw, L.J.; Mühling, K.H. Selenium Enrichment of Green and Red Lettuce and the Induction of Radical Scavenging Potential. Horticulturae 2021, 7, 488. [Google Scholar] [CrossRef]
  64. Raghothama, K.G. Molecular Regulation of Phosphate Acquisition in Plants. In Plant Nutrition—Molecular Biology and Genetics; Gissel-Nielsen, G., Jensen, A., Eds.; Springer: Dordrecht, The Netherlands, 1999; pp. 95–103. [Google Scholar] [CrossRef]
  65. Tallarita, A.V.; Golubkina, N.; De Pascale, S.; Sękara, A.; Pokluda, R.; Murariu, O.C.; Cozzolino, E.; Cenvinzo, V.; Caruso, G. Effects of Selenium/Iodine Foliar Application and Seasonal Conditions on Yield and Quality of Perennial Wall Rocket. Horticulturae 2025, 11, 211. [Google Scholar] [CrossRef]
  66. Spyrou, G.P.; Ntanasi, T.; Karavidas, I.; Marka, S.; Giannothanasis, E.; Vultaggio, L.; Gohari, G.; Sabatino, L.; Ntatsi, G. Enhancing Nutritional and Functional Properties of Hydroponically Grown Underutilised Leafy Greens Through Selenium Biofortification. Plants 2025, 14, 2716. [Google Scholar] [CrossRef] [PubMed]
  67. Cheng, H.; Chang, S.; Shi, X.; Chen, Y.; Cong, X.; Cheng, S.; Li, L. Molecular Mechanisms of the Effects of Sodium Selenite on the Growth, Nutritional Quality, and Species of Organic Selenium in Dandelions. Horticulturae 2024, 10, 209. [Google Scholar] [CrossRef]
  68. Wu, L.; Huang, Z.Z. Selenium assimilation and nutrient element uptake in white clover and tall fescue under the influence of sulphate concentration and selenium tolerance of the plants. J. Exp. Bot. 1992, 43, 549–555. [Google Scholar] [CrossRef]
  69. Rios, J.J.; Blasco, B.; Leyva, R.; Sanchez-Rodriguez, E.; Rubio-Wilhelmi, M.M.; Romero, L. Nutritional balance changes in lettuce plant grown under different doses and forms of selenium. J. Plant Nutr. 2013, 36, 1344–1354. [Google Scholar] [CrossRef]
  70. Pannico, A.; El-Nakhel, C.; Kyriacou, M.C.; Giordano, M.; Stazi, S.R.; de Pascale, S.; Rouphael, Y. Combating Micronutrient Deficiency and Enhancing Food Functional Quality Through Selenium Fortification of Select Lettuce Genotypes Grown in a Closed Soilless System. Front. Plant Sci. 2019, 10, 1495. [Google Scholar] [CrossRef] [PubMed]
  71. Silva, E.D.N.D.; Cidade, M.; Heerdt, G.; Ribessi, R.L.; Morgon, N.H.; Cadore, S. Effect of selenite and selenate application on mineral composition of lettuce plants cultivated under hydroponic conditions: Nutritional balance overview using a multifaceted study. J. Braz. Chem. Soc. 2018, 29, 371–379. [Google Scholar] [CrossRef]
  72. do Nascimento da Silva, E.; Cadore, S. Bioavailability assessment of copper, iron, manganese, molybdenum, selenium, and zinc from selenium-enriched lettuce. J. Food Sci. 2019, 84, 2840–2846. [Google Scholar] [CrossRef] [PubMed]
  73. Pannico, A.; El-Nakhel, C.; Graziani, G.; Kyriacou, M.C.; Giordano, M.; Soteriou, G.A.; Zarrelli, A.; Ritieni, A.; de Pascale, S.; Rouphael, Y. Selenium Biofortification Impacts the Nutritive Value, Polyphenolic Content, and Bioactive Constitution of Variable Microgreens Genotypes. Antioxidants 2020, 9, 272. [Google Scholar] [CrossRef] [PubMed]
  74. Buttarelli, M.S.; Céccoli, G.; Trod, B.S.; Stoffel, M.M.; Simonutti, M.; Bouzo, C.A.; Muñoz, F.F. Enhancing nutritional and functional properties of broccoli leaves through selenium biofortification: Potential for sustainable agriculture and bioactive compound valorization. Agronomy 2025, 15, 389. [Google Scholar] [CrossRef]
  75. Lei, B.; Yang, Q.C.; Wang, J.; Cheng, R.L.; Li, K.; Liu, W.; Zhang, Y.; Fang, H.; Tong, Y. The positive function of selenium supplementation on reducing nitrate accumulation in hydroponic lettuce (Lactuca sativa L.). J. Am. Soc. Hortic. Sci. 2018, 143, 3–9. [Google Scholar] [CrossRef]
  76. Rios, J.J.; Blasco, B.; Rosales, M.A.; Sanchez-Rodriguez, E.; Leyva, R.; Cervilla, L.M.; Romero, L.; Ruiz, J.M. Response of nitrogen metabolism in lettuce plants subjected to different doses and forms of selenium. J. Sci. Food Agric. 2010, 90, 1914–1919. [Google Scholar] [CrossRef] [PubMed]
  77. Bian, Z.-H.; Lei, B.; Cheng, R.-F.; Wang, Y.; Li, T.; Yang, Q.-C. Selenium Distribution and Nitrate Metabolism in Hydroponic Lettuce (Lactuca sativa L.): Effects of Selenium Forms and Light Spectra. J. Integr. Agric. 2020, 19, 133–144. [Google Scholar] [CrossRef]
  78. Puccinelli, M.; Landi, M.; Maggini, R.; Pardossi, A.; Incrocci, L. Iodine Biofortification of Sweet Basil and Lettuce Grown in Two Hydroponic Systems. Sci. Hortic. 2021, 276, 109783. [Google Scholar] [CrossRef]
  79. Tomasi, N.; Pinton, R.; Gottardi, S.; Mimmo, T.; Scampicchio, M.; Cesco, S. Selenium Fortification of Hydroponically Grown Corn Salad (Valerianella locusta). Crop Pasture Sci. 2015, 66, 1128–1136. [Google Scholar] [CrossRef]
  80. Puccinelli, M.; Pezzarossa, B.; Rosellini, I.; Malorgio, F. Selenium Enrichment Enhances the Quality and Shelf Life of Basil Leaves. Plants 2020, 9, 801. [Google Scholar] [CrossRef] [PubMed]
  81. Ferrarese, M.; Sourestani, M.; Quattrini, E.; Schiavi, M.; Ferrante, A. Biofortification of Spinach Plants Applying Selenium in the Nutrient Solution of Floating System. Veg. Crops Res. Bull. 2012, 76, 127–136. [Google Scholar] [CrossRef]
  82. Hernández-Castro, E.; Trejo-Téllez, L.I.; Gómez-Merino, F.C.; Rodríguez-Mendoza, M.N.; Sánchez-García, P.; Robledo-Paz, A. Bioaccumulation of Iron, Selenium, Nitrate, and Proteins in Chard Shoots. J. Soil Sci. Plant Nutr. 2015, 15, 694–710. [Google Scholar] [CrossRef]
  83. Puccinelli, M.; Malorgio, F.; Maggini, R.; Rosellini, I.; Pezzarossa, B. Biofortification of Ocimum basilicum L. Plants with Selenium. Acta Hortic. 2019, 1242, 663–670. [Google Scholar] [CrossRef]
  84. Puccinelli, M.; De Padova, A.; Vernieri, P.; Carmassi, G.; Incrocci, L. Response of Aeroponically Cultivated Baby-Leaf Lettuce (Lactuca sativa L.) Plants with Different Zinc, Copper, Iodine, and Selenium Concentrations. Horticulturae 2024, 10, 726. [Google Scholar] [CrossRef]
  85. Malorgio, F.; Diaz, K.E.; Ferrante, A.; Mensuali-Sodi, A.; Pezzarossa, B. Effects of selenium addition on minimally processed leafy vegetables grown in a floating system. J. Sci. Food Agric. 2009, 89, 2243–2251. [Google Scholar] [CrossRef]
  86. Hawrylak-Nowak, B.; Matraszek, R.; Pogorzelec, M. The dual effects of two inorganic selenium forms on the growth, selected physiological parameters and macronutrients accumulation in cucumber plants. Acta Physiol. Plant. 2015, 37, 41. [Google Scholar] [CrossRef]
  87. Profico, C.M.; Hassanpour, M.; Hazrati, S.; Ertani, A.; Mollaei, S.; Nicola, S. Sodium Selenate Biofortification of Basil (Ocimum basilicum L.) and Peppermint (Mentha × piperita L.) Plants Grown in a Floating System under Salinity Stress. J. Agric. Food Res. 2025, 21, 101842. [Google Scholar] [CrossRef]
  88. Mengutay, M.; Ceylan, Y.; Kutman, U.B.; Cakmak, I. Adequate magnesium nutrition mitigates adverse effects of heat stress on maize and wheat. Plant Soil 2013, 368, 57–72. [Google Scholar] [CrossRef]
  89. Lanza, M.G.D.B.; dos Reis, A.R. Roles of Selenium in Mineral Plant Nutrition: ROS Scavenging Responses against Abiotic Stresses. Plant Physiol. Biochem. 2021, 164, 27–43. [Google Scholar] [CrossRef] [PubMed]
  90. Skrypnik, L.; Styran, T.; Savina, T.; Golubkina, N. Effect of Selenium Application and Growth Stage at Harvest on Hydrophilic and Lipophilic Antioxidants in Lamb’s Lettuce (Valerianella locusta L. Laterr.). Plants 2021, 10, 2733. [Google Scholar] [CrossRef] [PubMed]
  91. Huang, S.; Ying, Z.; Chen, J.; Yang, Y.; Zhang, J.; Yang, L.; Liu, M. Effect of Selenium Application on Growth, Antioxidative Capacity, and Nutritional Quality in Purple Lettuce Seedlings. Agronomy 2023, 13, 1664. [Google Scholar] [CrossRef]
  92. Skrypnik, L.; Novikova, A.; Tokupova, E. Improvement of Phenolic Compounds, Essential Oil Content and Antioxidant Properties of Sweet Basil (Ocimum basilicum L.) Depending on Type and Concentration of Selenium Application. Plants 2019, 8, 458. [Google Scholar] [CrossRef] [PubMed]
  93. Smoleń, S.; Baranski, R.; Ledwozyw-Smoleń, I.; Skoczylas, Ł.; Sady, W. Combined Biofortification of Carrot with Iodine and Selenium. Food Chem. 2019, 300, 125202. [Google Scholar] [CrossRef] [PubMed]
  94. Puccinelli, M.; Rosellini, I.; Malorgio, F.; Pardossi, A.; Pezzarossa, B. Hydroponic Production of Selenium-Enriched Baby Leaves of Swiss Chard (Beta vulgaris Var. cicla) and Its Wild Ancestor Sea Beet (Beta vulgaris Ssp. maritima). Horticulturae 2023, 9, 909. [Google Scholar] [CrossRef]
  95. Di Mola, I.; Cozzolino, E.; Ottaiano, L.; Nocerino, S.; Rouphael, Y.; Colla, G.; El-Nakhel, C.; Mori, M. Nitrogen Use and Uptake Efficiency and Crop Performance of Baby Spinach (Spinacia oleracea L.) and Lamb’s Lettuce (Valerianella locusta L.) Grown under Variable Sub-Optimal N Regimes Combined with Plant-Based Biostimulant Application. Agronomy 2020, 10, 278. [Google Scholar] [CrossRef]
Figure 1. Shoot growth of different leafy greens (lettuce, rocket, and basil) grown in an indoor vertical NFT system under two selenium (Se) levels (0 and 2 µM) and two sulfur (S) levels (low: 0.65 mM; high: 1.3 mM).
Agronomy 16 01193 g001
Figure 2. Shoot sulfur (S) concentrations (A) and selenium (Se) contents (B) (μg per serving) in lettuce, rocket, and basil grown in an indoor vertical NFT system under two selenium (Se) levels (0 and 2 µM) and two sulfur (S) levels (low: 0.65 mM; high: 1.3 mM). MgSO4·H2O and Na2SeO4 were used as S and Se sources, respectively. Serving sizes were standardized as 100 g for lettuce and 20 g for both rocket and basil. The dashed line represents the recommended daily allowance (RDA) for selenium, which is set at 55 µg [43]. Data are expressed as means ± standard deviations (n = 5). Different letters indicate significant differences among treatments according to Tukey’s HSD test (p < 0.05). Statistical comparisons were performed within each plant species separately. n.d.: not detected.
Agronomy 16 01193 g002
Figure 3. Shoot nitrate concentration in lettuce, rocket, and basil grown in an indoor vertical NFT system under two selenium (Se) levels (0 and 2 µM) and two sulfur (S) levels (low: 0.65 mM; high: 1.3 mM). MgSO4·H2O and Na2SeO4 were used as S and Se sources, respectively. Different letters indicate significant differences among treatments according to Tukey’s HSD test (p < 0.05). Statistical comparisons were performed within each plant species separately.
Agronomy 16 01193 g003
Figure 4. Chlorophyll a (Ca) (A), chlorophyll b (Cb) (B), Ca/Cb ratio (C), total chlorophyll (D), and total carotenoid contents (μg/g FW) (E) in lettuce, rocket, and basil grown in an indoor vertical NFT system under two selenium (Se) levels (0 and 2 µM) and two sulfur (S) levels (low: 0.65 mM; high: 1.3 mM). MgSO4·H2O and Na2SeO4 were used as S and Se sources, respectively. Data are presented as means ± standard deviations (n = 5). Different letters indicate statistically significant differences among treatments based on Tukey’s HSD test (p < 0.05). Statistical comparisons were performed within each plant species separately.
Agronomy 16 01193 g004
Figure 5. Total AsA (A), TPC (B), DPPH (C), and FRAP (D) in lettuce, rocket, and basil grown in an indoor vertical NFT system under two selenium (Se) levels (0 and 2 µM) and two sulfur (S) levels (low: 0.65 mM; high: 1.3 mM). MgSO4·H2O and Na2SeO4 were used as S and Se sources, respectively. Data are expressed as means ± standard deviations (n = 5). Different letters indicate significant differences among treatments according to Tukey’s HSD test (p < 0.05). Statistical comparisons were performed within each plant species separately.
Agronomy 16 01193 g005
Table 1. F value probabilities of two-way analysis of variance (ANOVA) of the effects of sulfur (S), selenium (Se), and their interaction (S × Se) on morphological traits, mineral composition, and biochemical parameters of leafy greens (lettuce, rocket and basil) grown in an indoor vertical NFT system. DF (degrees of freedom).
Source of VariationDFShoot FW (g/Plant)Shoot DW (g/Plant)Dry Matter Ratio (%)
LettuceRocketBasilLettuce RocketBasilLettuce RocketBasil
S1 <0.0001 0.4781<0.0001<0.00010.0283<0.00010.15430.03660.6161
Se10.01540.20550.00240.72640.90060.01060.04330.02580.7195
S × Se10.00280.08150.30880.78370.00030.33420.02570.00380.0056
Source of VariationDFRoot DW (g/plant)Shoot S (g/kg)Shoot Se (µg/serving)
Lettuce RocketBasilLettuce RocketBasilLettuce RocketBasil
S10.25350.3336<0.00010.04410.11180.0236<0.0001<0.0001<0.0001
Se10.02790.00160.00330.0015<0.00010.2499<0.0001<0.0001<0.0001
S × Se10.86960.02690.67380.11170.28800.8617<0.0001<0.0001<0.0001
Source of VariationDFShoot Ca (g/kg)Shoot K (g/kg)Shoot Mg (g/kg)
Lettuce RocketBasilLettuce RocketBasilLettuce RocketBasil
S10.00680.43230.0893<0.00010.0132<0.0001<0.0001<0.0001<0.0001
Se10.55250.49750.00600.01980.42150.03610.03100.95260.4056
S × Se10.00740.49700.82570.00760.5935<0.00010.00050.80110.0240
Source of VariationDFShoot P (g/kg)Shoot Cu (mg/kg)Shoot Fe (mg/kg)
Lettuce RocketBasilLettuce RocketBasilLettuce RocketBasil
S10.16550.00270.00600.73100.0163<0.0001<0.00010.0171<0.0001
Se10.69750.02450.08960.24690.03280.0409<0.00010.0004<0.0001
S × Se10.00070.1502<0.00010.37720.18050.04490.00020.4841<0.0001
Source of VariationDFShoot Mn (mg/kg)Shoot Zn (mg/kg)Shoot Nitrate (mg/g FW)
Lettuce RocketBasilLettuce RocketBasilLettuce Rocket Basil 
 S10.0195<0.00010.00010.4061<0.00010.17790.86530.00670.0149
Se1<0.00010.01230.11870.04660.16460.34550.01960.00090.4410
S × Se10.37550.61970.00040.84380.4155<0.00010.06170.00780.8683
Source of VariationDFChlorophyll a (µg/g FW)Chlorophyll b (µg/g FW)Ca/Cb
Lettuce RocketBasilLettuce RocketBasilLettuce RocketBasil
S10.00010.00020.65310.00550.00760.98570.13670.11000.0697
Se10.32700.00010.27340.30840.45290.40570.65360.00060.1304
S × Se10.34080.00150.03190.95930.58060.03420.27390.16010.0866
Source of VariationDFTotal Chlorophyll (µg/g) FW)Carotenoids (µg/g FW)Total AsA (mg AsA/100 g) FW)
Lettuce RocketBasilLettuce RocketBasilLettuce RocketBasil
S10.00030.00070.72770.15480.00010.55620.36340.00070.3635
Se10.30970.00180.29760.52270.97220.32120.21220.00720.7102
S × Se10.48210.00620.03180.46150.34670.07530.09310.37800.0879
Source of VariationDFTPC (mg GAE/100 g FW)DPPH (µmol TE/100 g FW)FRAP (µmol TE/100 g FW)
Lettuce RocketBasilLettuce RocketBasilLettuce RocketBasil
S10.08730.04790.01010.0001<0.00010.03330.00020.09780.0072
Se10.0023<0.00010.0043<0.00010.13730.0348<0.0001<0.00010.0013
S × Se10.00570.34640.03920.00180.03180.99170.00300.45600.8640
Table 2. Shoot fresh weight (FW), shoot dry weight (DW), dry matter ratio (%), and root dry weight (DW) of lettuce, rocket, and basil grown in an indoor vertical NFT system under two selenium (Se) levels (0 and 2 µM) and two sulfur (S) levels (low: 0.65 mM; high: 1.3 mM). 1 MgSO4·H2O and 2 Na2SeO4 were used as S and Se sources, respectively. Data are presented as means ± standard deviations (n = 5). Different letters indicate statistically significant differences among treatments based on Tukey’s HSD test (p < 0.05). Statistical comparisons were performed within each plant species separately.
PlantS 1 LevelSe 2 LevelShoot FW (g/Plant)Shoot DW (g/Plant)Dry Matter Ratio (%)Root DW
(mg/Plant)
LettuceLow200±17 b9.65±0.55 a4.86±0.48 b590±52 a
+226±13 a9.62±0.72 a4.25±0.17 a525±14 a
High250±13 a11.83±0.62 b4.73±0.18 ab629±76 a
+244±14 a11.63±0.86 b4.76±0.21 ab554±81 a
RocketLow10.31±0.75 a0.85±0.05 bc8.23±0.68 b85±10 b
+10.68±2.39 a1.05±0.18 a9.93±0.58 a93±11 ab
High11.08±0.81 a0.95±0.04 ab8.55±0.46 b77±14 b
+8.91±1.54 a0.73±0.07 c8.28±0.83 b113±14 a
BasilLow50.0±2.5 b4.04±0.22 bc8.10±0.24 a697±71 bc
+43.0±2.9 c3.75±0.24 c8.74±0.50 a577±50 c
High60.2±3.3 a5.17±0.45 a8.58±0.41 a945±115 a
+56.3±4.5 a4.55±0.44 ab8.08±0.40 a791±103 ab
Table 3. Selected macronutrient (Ca, K, Mg, P) concentrations in lettuce, rocket, and basil grown in an indoor vertical NFT system under two selenium (Se) levels (0 and 2 µM) and two sulfur (S) levels (low: 0.65 mM; high: 1.3 mM). 1 MgSO4·H2O and 2 Na2SeO4 were used as S and Se sources, respectively. Data are presented as means ± standard deviations (n = 5). Different letters indicate statistically significant differences among treatments based on Tukey’s HSD test at p < 0.05. Statistical comparisons were performed within each plant species separately.
PlantS 1 LevelSe 2 Level[Ca] (g/kg)[K] (g/kg)[Mg] (g/kg)[P] (g/kg)
LettuceLow19.9±2.2 b69.4±3.5 b2.83±0.25 c7.77±0.66 b
+21.6±0.6 ab77.0±1.7 a3.00±0.06 c8.83±0.43 a
High24.1±1.6 a60.9±3.4 c5.27±0.23 a8.40±0.43 ab
+21.6±1.0 ab60.3±3.0 c4.71±0.14 b7.53±0.49 b
RocketLow41.3±2.7 a81.6±3.0 a4.10±0.23 b11.1±0.10 a
+43.1±3.8 a82.0±2.2 a4.13±0.31 b10.0±0.16 ab
High41.1±1.5 a76.8±4.6 a5.16±0.27 a9.6±0.16 b
+41.1±3.1 a78.8±2.8 a5.12±0.31 a9.3±0.20 b 
BasilLow24.4±1.3 ab57.1±1.2 a2.37±0.06 b8.09±0.57 a
+26.4±2.2 a49.4±2.0 b2.48±0.23 b6.31±0.60 bc
High23.0±1.2 b45.5±2.2 c3.17±0.16 a6.01±0.49 c
+25.3±1.1 ab49.7±1.4 b2.94±0.10 a6.98±0.26 b
Table 4. Selected micronutrient (Cu, Fe, Mn, Zn) concentrations in lettuce, rocket, and basil grown in an indoor vertical NFT system under two selenium (Se) levels (0 and 2 µM) and two sulfur (S) levels (low: 0.65 mM; high: 1.3 mM). 1 MgSO4·H2O and 2 Na2SeO4 were used as S and Se sources, respectively. Data are presented as means ± standard deviations (n = 5). Different letters indicate statistically significant differences among treatments based on Tukey’s HSD test at p < 0.05. Statistical comparisons were performed within each plant species separately.
PlantS 1 LevelSe 2 Level[Cu] (mg/kg)[Fe] (mg/kg)[Mn] (mg/kg)[Zn] (mg/kg)
LettuceLow11.5±1.5 a127±11 b119±8 a102±11 a
+12.6±1.2 a108±6 b93±5 b94±6 a
High11.8±0.9 a191±21 a112±13 a106±10 a
+12.0±1.0 a115±5 b80±3 b97±4 a
RocketLow17.7±2.7 a141±29 a32±1 ab260±14 a
+13.7±1.3 ab92±20 b38±5 a230±32 ab
High13.3±2.6 b110±19 ab23±2 c174±24 bc
+12.3±2.7 b74±5 b27±5 bc166±40 c
BasilLow11.7±0.6 b79±6 b55±5 a110±8 a
+10.5±0.8 c120±14 a49±7 a88±10 b
High13.9±0.6 a76±4 b35±3 b87±3 b
+13.9±0.3 a74±3 b48±3 a103±4 a
Disclaimer/Publisher’s Note: The statements, opinions and data contained in all publications are solely those of the individual author(s) and contributor(s) and not of MDPI and/or the editor(s). MDPI and/or the editor(s) disclaim responsibility for any injury to people or property resulting from any ideas, methods, instructions or products referred to in the content.