1. Introduction
As a globally paramount dual-purpose crop for food and feed, as well as a primary feedstock for bioenergy, maize occupies a central position in safeguarding global food security [
1,
2]. However, with the widespread adoption of high-density planting systems and the exacerbation of global climate change, maize is confronting increasingly severe biotic stress challenges (such as pests and diseases including the fall armyworm, spider mites, and leaf spot) during its mid-to-late growth stages [
3]. Therefore, exploring precision pest management technologies suitable for high-density planting conditions has become an urgent necessity to achieve stable and high maize yields.
In recent years, plant protection unmanned aerial vehicles (UAVs) have emerged as an essential tool for overcoming the plant protection challenges associated with tall-stalk crops, owing to their high operational efficiency, flexibility, and superior adaptability to complex terrains [
4,
5,
6]. To enhance the pesticide application efficacy of UAVs, researchers worldwide have conducted extensive studies focusing on two primary dimensions: the optimization of operational parameters and the application of novel formulations.
Regarding the regulatory mechanisms of spray application volume, field trials conducted by Wang et al. [
7] in wheat demonstrated that varying application volumes directly determine droplet deposition and distribution characteristics, as well as the control efficacy against pests and diseases. Their findings provided essential data support for the field-scale popularization of low-volume spraying technologies. Building upon this, Shan et al. [
8] further quantified the volume threshold for the control of the fall armyworm (
Spodoptera frugiperda) in maize, pointing out that excessive spray application did not yield significant efficacy enhancements, but rather needlessly increased operational costs. By precisely optimizing the spray application volume, it is feasible to significantly reduce the consumption of water and pesticide resources while ensuring ideal control efficacy. In terms of droplet size and its environmental adaptability, research has primarily focused on striking a balance between drift and deposition. Heidary et al. [
9] noted that spray characteristics (particularly droplet size distribution) are critical factors influencing the drift potential of spray liquids, with fine droplets being highly susceptible to off-target drift under complex field airflows. Spraying experiments in rice fields by Chen et al. [
10] revealed that the droplet spectra generated by different nozzle models exerted a significant impact on deposition performance; selecting an appropriate droplet size can effectively enhance the deposition rate of the spray liquid on target crops and mitigate runoff. Furthermore, a comparative study by Wang et al. [
11] found that, compared to conventional high-volume spraying, UAV-based low-volume spraying necessitates more precise parameter matching to prevent spray runoff or evaporation caused by inappropriate droplet sizes. Therefore, specifically for high-density maize canopies, optimizing the synergistic match between droplet size and application volume is the key to resolving the persistent challenge of insufficient deposition on the middle and lower canopy layers.
In the realm of pesticide formulation innovation and the application of nanotechnology, nano-pesticides are increasingly regarded as a breakthrough for reducing pesticide usage while enhancing efficacy, owing to their unique interfacial properties [
12,
13]. A review by Sun et al. [
14] indicated that nano-carriers can significantly reduce the surface tension of the spray liquid, enhancing its wettability and adhesion on crop leaves—particularly those with hydrophobic surfaces—thereby mitigating spray runoff [
15]. Furthermore, research conducted by Yang et al. [
16] demonstrated that, compared to conventional formulations, novel nano-dispersions can effectively prolong the persistence and improve the bioavailability of active ingredients. Moreover, Zhou et al. [
17] emphasized that integrating nano-formulations with precision application technologies represents a critical pathway for constructing sustainable integrated pest management (IPM) systems in the future. This suggests that leveraging the exceptional interfacial transport properties of nano-pesticides holds the promise of compensating for the inherent deficiencies of UAV low-volume spraying in terms of penetration and deposition within complex canopies.
However, although research on individual factors is relatively well-established, there remains a paucity of in-depth studies on the systematic synergy among spray application volume, droplet size, and nano-pesticides, particularly in the specific context of high-density maize cultivation. Currently, parameter optimization in plant protection is predominantly confined to the physical dimension (e.g., application volume and droplet size), overlooking the micro-regulatory effects of chemical formulations (such as nano-formulations) on droplet deposition behavior.
Therefore, focusing on high-density maize, this study conducted a full-factorial field experiment utilizing a DJI T50 plant protection unmanned aerial vehicle (UAV). Varying gradients of spray volume (15.0, 22.5, and 30.0 L/ha), droplet size (100, 200, and 300 μm), and nano-pesticide dosage (recommended dosage, 30% reduction, and 50% reduction) were established. The study systematically analyzed the effects of these factors on droplet deposition density, coverage, and penetration across different maize canopy layers (upper, middle, and lower), while synchronously evaluating the field control efficacy against major maize pests and diseases. Ultimately, this research aims to elucidate the synergistic mechanisms between key spray parameters and the reduced application of nano-pesticides, and to identify the optimal combination of operational parameters. The findings will provide crucial data support and a theoretical foundation for achieving “pesticide reduction with efficiency enhancement” in maize production and the scientific application of plant protection UAVs.
2. Materials and Methods
2.1. Experimental Site
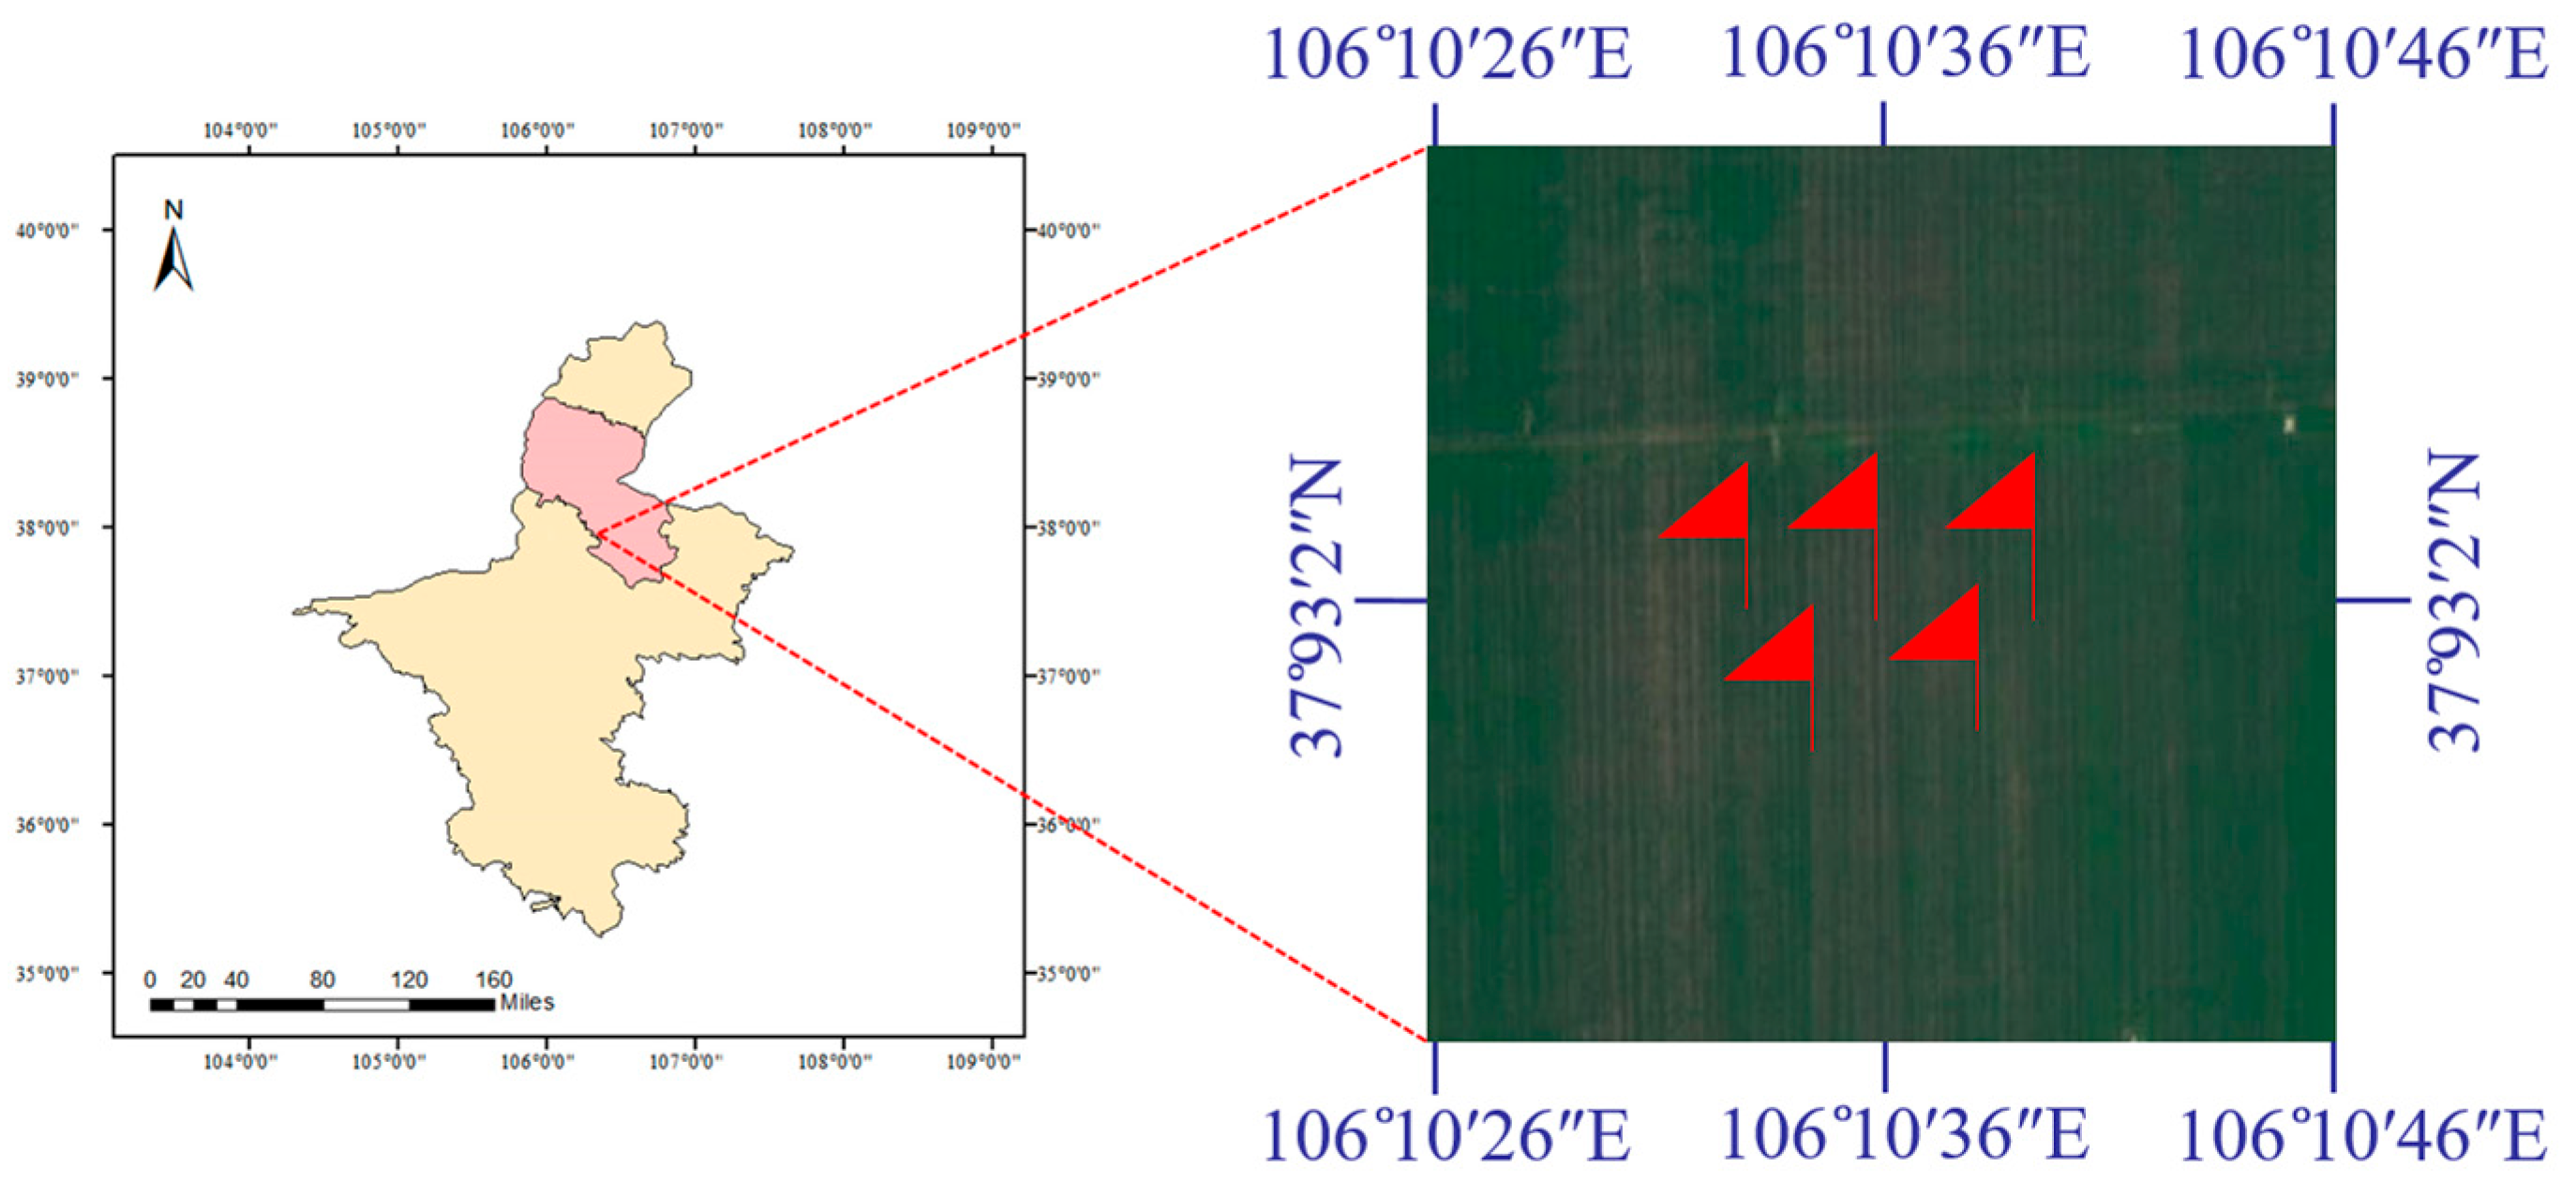
The field experiment was conducted on 1 August 2024 at an unmanned farm base of Ningxia Green Pioneer Agricultural Technology Co., Ltd., located in Lingwu City, Ningxia Hui Autonomous Region, China (106.343582° E, 37.933986° N). The specific geographical location and the spatial layout of the experimental site are explicitly illustrated in
Figure 1. The experimental field was managed under uniform planting conditions, including soil type, fertilization regime, maize cultivar, row spacing, and planting density, in accordance with local recommended agricultural practices.
Maize cultivar ‘Ningdan 31’ was used in this study. At the time of the experiment, plant height ranged from 2.4 to 2.6 m. The crop was planted in a wide–narrow row pattern, with row spacings of 35 cm and 55 cm and a plant spacing of 16 cm, resulting in a planting density of approximately 82,500 plants ha−1 (equivalent to 5500 plants mu−1). Mechanical sowing was conducted in April 2024. During the experiment, maize plants had progressed beyond the milk stage.
2.2. Experimental Materials
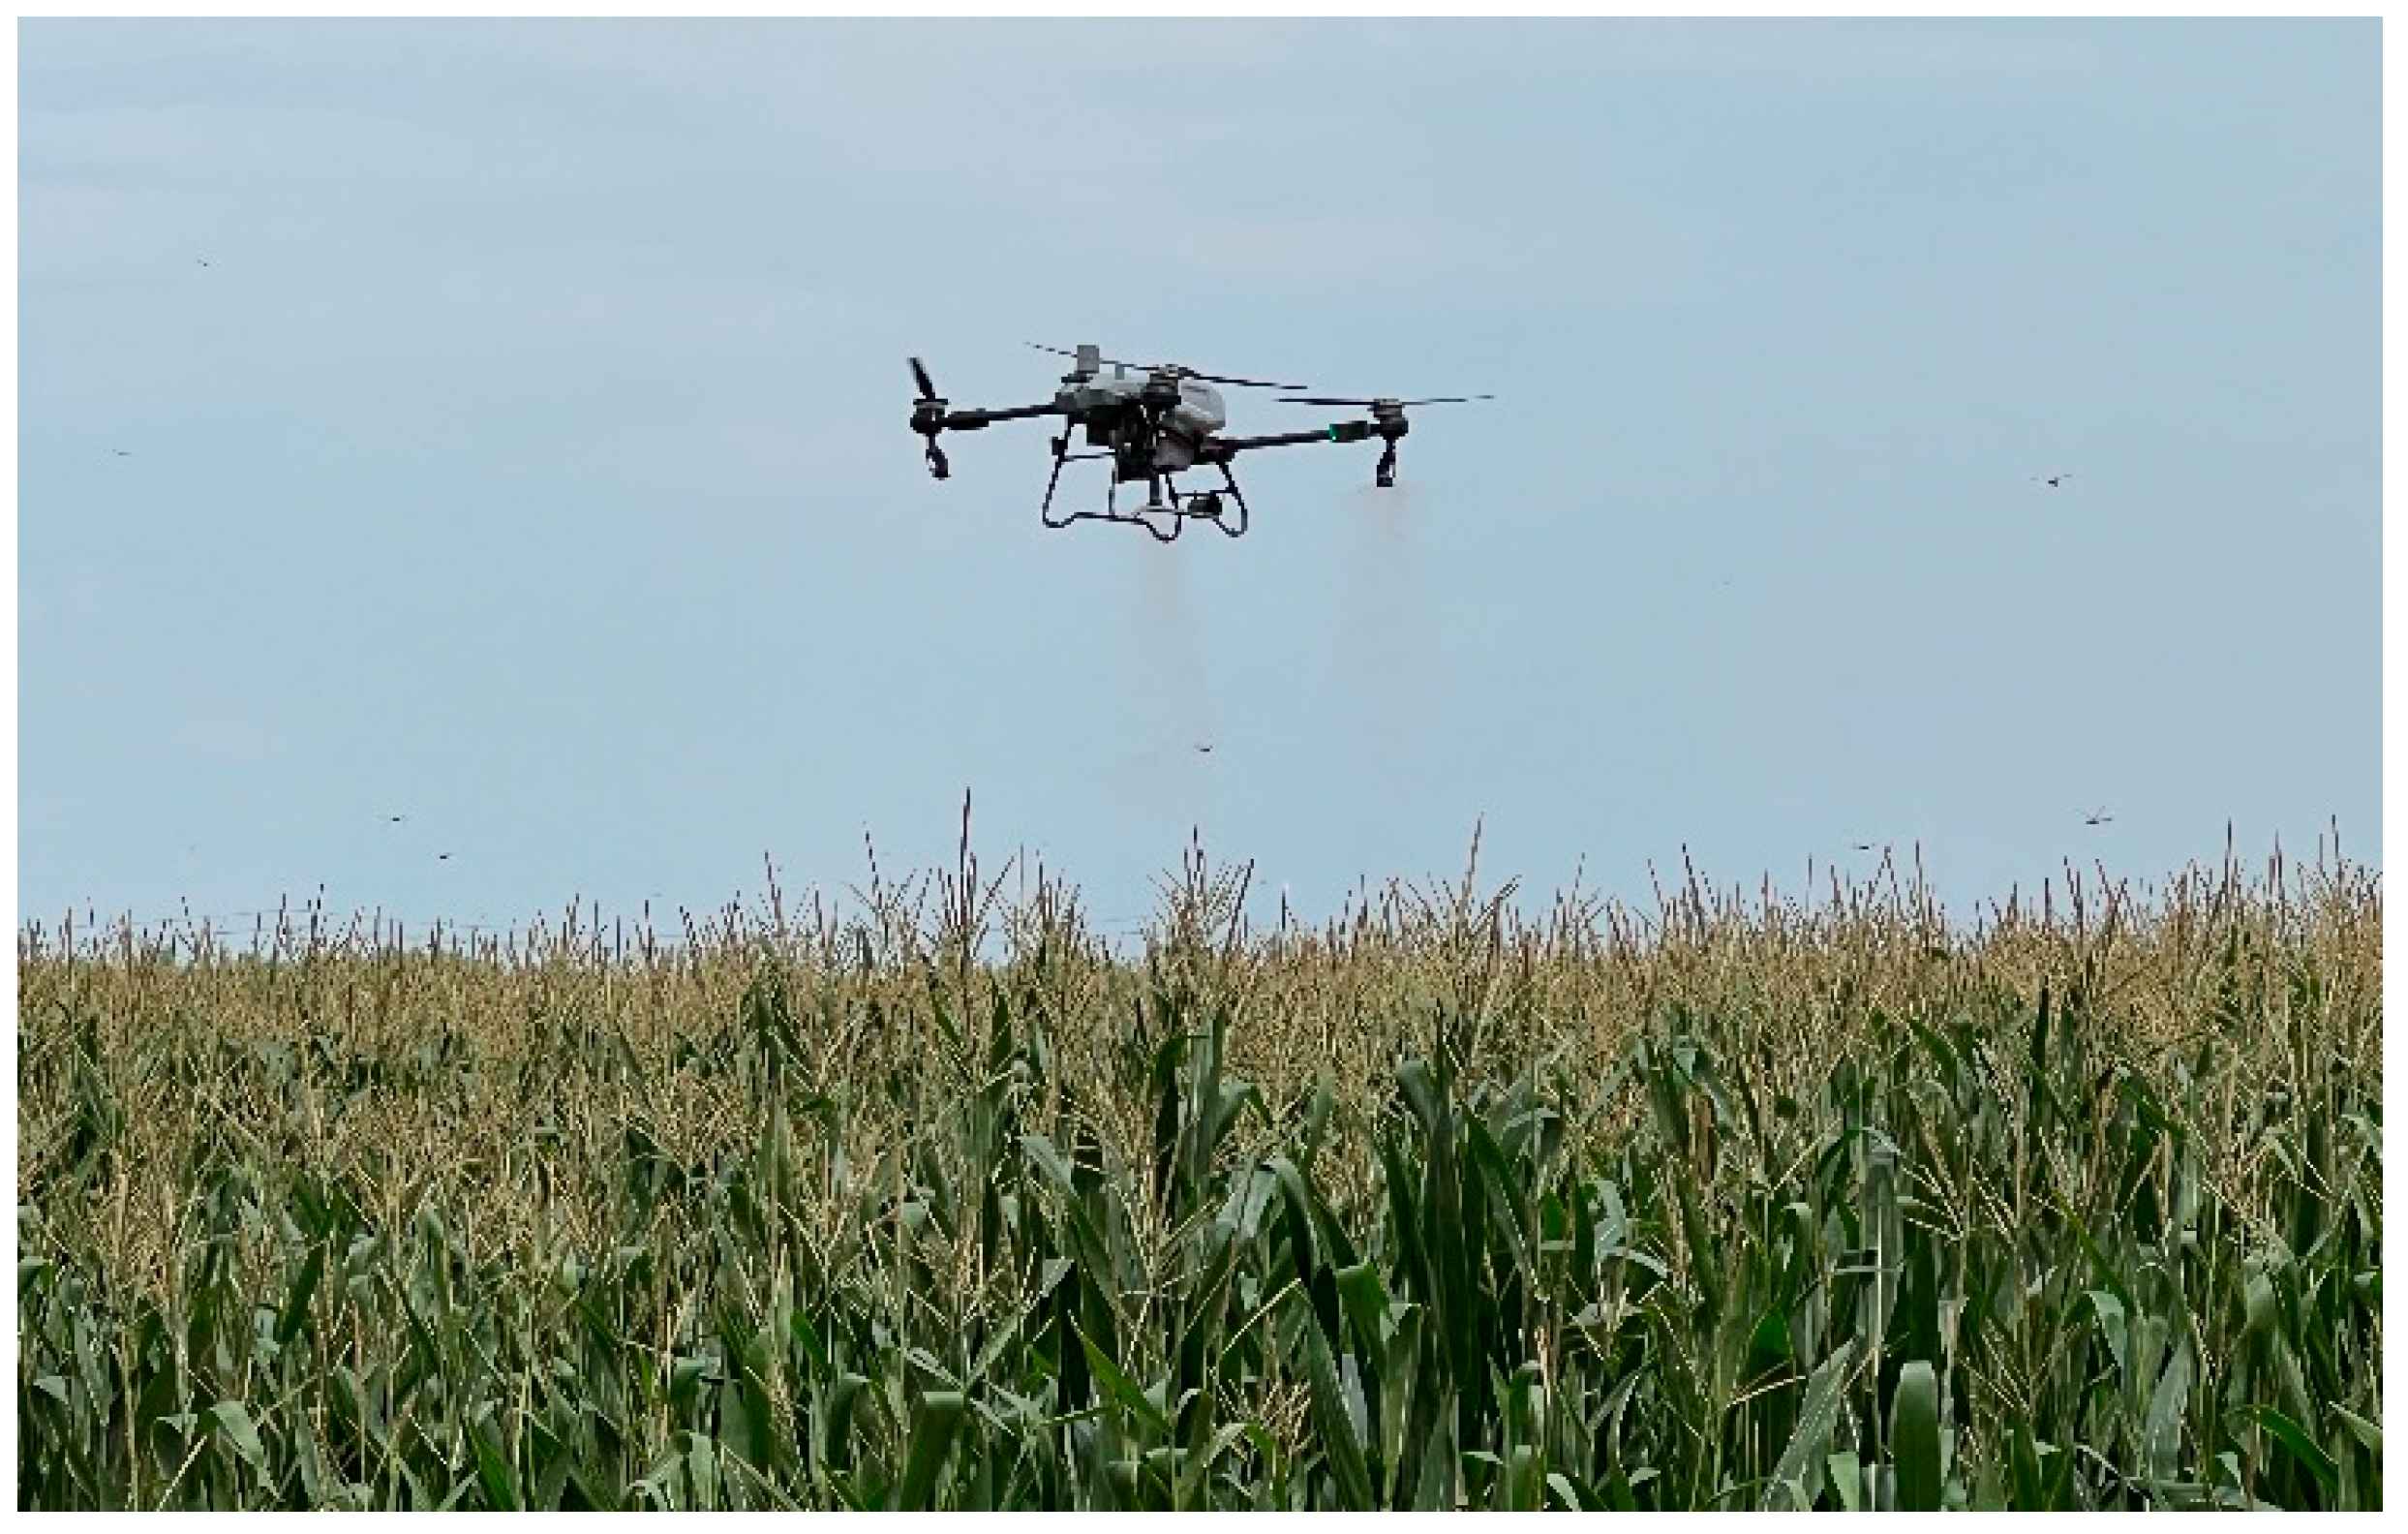
In the field spraying experiment, a DJI T50 plant protection unmanned aerial vehicle (UAV) (Shenzhen DJI Sciences and Technologies Ltd., Shenzhen, China) was employed to conduct the spraying operations. The actual field spray operation utilizing this specific UAV over the maize canopy is depicted in
Figure 2, providing a visual representation of the application scenario. As one of the most widely utilized models by agricultural aviation companies, its spraying system comprises a pesticide tank, an electromagnetic flowmeter, diaphragm pumps, and centrifugal nozzles. It is important to note that, unlike traditional hydraulic nozzles, where droplet size is fundamentally coupled with fluid pressure and flow rate, the DJI T50 utilizes dual-atomization centrifugal rotary nozzles. In this system, the droplet size is determined by the rotational speed of the atomizing disk, which can be precisely and independently adjusted via the smart remote controller. Meanwhile, the volume flow rate is independently regulated by the diaphragm pumps and electromagnetic flowmeters. This decoupled mechanical design allows the droplet sizes to be accurately set to 100, 200, and 300 μm, entirely independent of the varying volume flow rates. The T50 UAV is powered by a lithium battery, which supports approximately 15 min of continuous field spraying operations per full charge. Furthermore, the aircraft features a fully autonomous flight mode and integrates Real-Time Kinematic (RTK) technology, enabling navigation and positioning with centimeter-level accuracy. The detailed technical specifications of the DJI T50 UAV are presented in
Table 1.
The experimental pesticides evaluated in this study were trifloxystrobin–tebuconazole and emamectin benzoate–chlorfenapyr, which were manufactured by Nanjing Sense Biotechnology Co., Ltd. (Nanjing, China).
It should be noted that the different formulations (EC and SC) of the nano-pesticides were not designed as independent experimental variables for comparative analysis. Rather, they represent the specific commercial formulations of the active ingredients required to achieve comprehensive control of the target maize pests and diseases in the field trials (
Table 2).
2.3. Experimental Design
To investigate the effects of spray application volume (15.0, 22.5, and 30.0 L/ha), droplet size (100, 200, and 300 μm), and pesticide dosage (recommended rate, 30% reduction, and 50% reduction) on droplet deposition characteristics and pest control efficacy, a two-phase field experimental design was employed. Phase I (Deposition Assessment) focused on physical spray parameters, utilizing a two-factor, three-level design (spray volume and droplet size) to evaluate the deposition characteristics of 9 treatment combinations. In Phase II (Efficacy Evaluation), to further explore the biological expression of nano-pesticides under the previously evaluated physical spray conditions, the chemical formulation factor was integrated, expanding the study into a three-factor, three-level design (incorporating three pesticide dosage levels). It is important to clarify that in the context of this UAV ultra-low volume application, “pesticide dosage” strictly refers to the absolute amount of the commercial pesticide formulation applied per unit area (e.g., mL·ha
−1 or g·ha
−1), rather than its dilution concentration in the tank mix. Therefore, the 30% and 50% dosage reductions indicate a proportional decrease in the absolute amount of the pesticide applied per hectare relative to the manufacturer’s recommended baseline. This phase aimed to systematically evaluate the field control efficacy across all 27 treatment combinations under the synergistic interaction of the three factors. This phased approach was designed to first clarify the influence of physical parameters on canopy penetration before verifying the biological expression of nano-pesticides under reduced-dosage conditions (
Table 3). During the experiments, the operational parameters of the plant protection UAV were set to a flight speed of 5 m/s, a spray swath width of 5 m, and a flight height of 3 m, which were selected based on standard commercial practices commonly used by local aerial plant protection service providers. The varying spray volumes (15.0, 22.5, and 30.0 L·ha
−1) were achieved exclusively by precisely adjusting the liquid flow rate of the diaphragm pumps via the UAV’s intelligent control system.
Meteorological conditions were monitored using an NK-5500 weather station. The air temperature ranged from 30.5 to 34.2 °C, relative humidity from 53.6% to 65.6%, and wind speed from 0 to 0.6 m/s. These environmental conditions remained relatively stable and met the operational requirements for plant protection UAVs.
2.4. Deposition Measurement
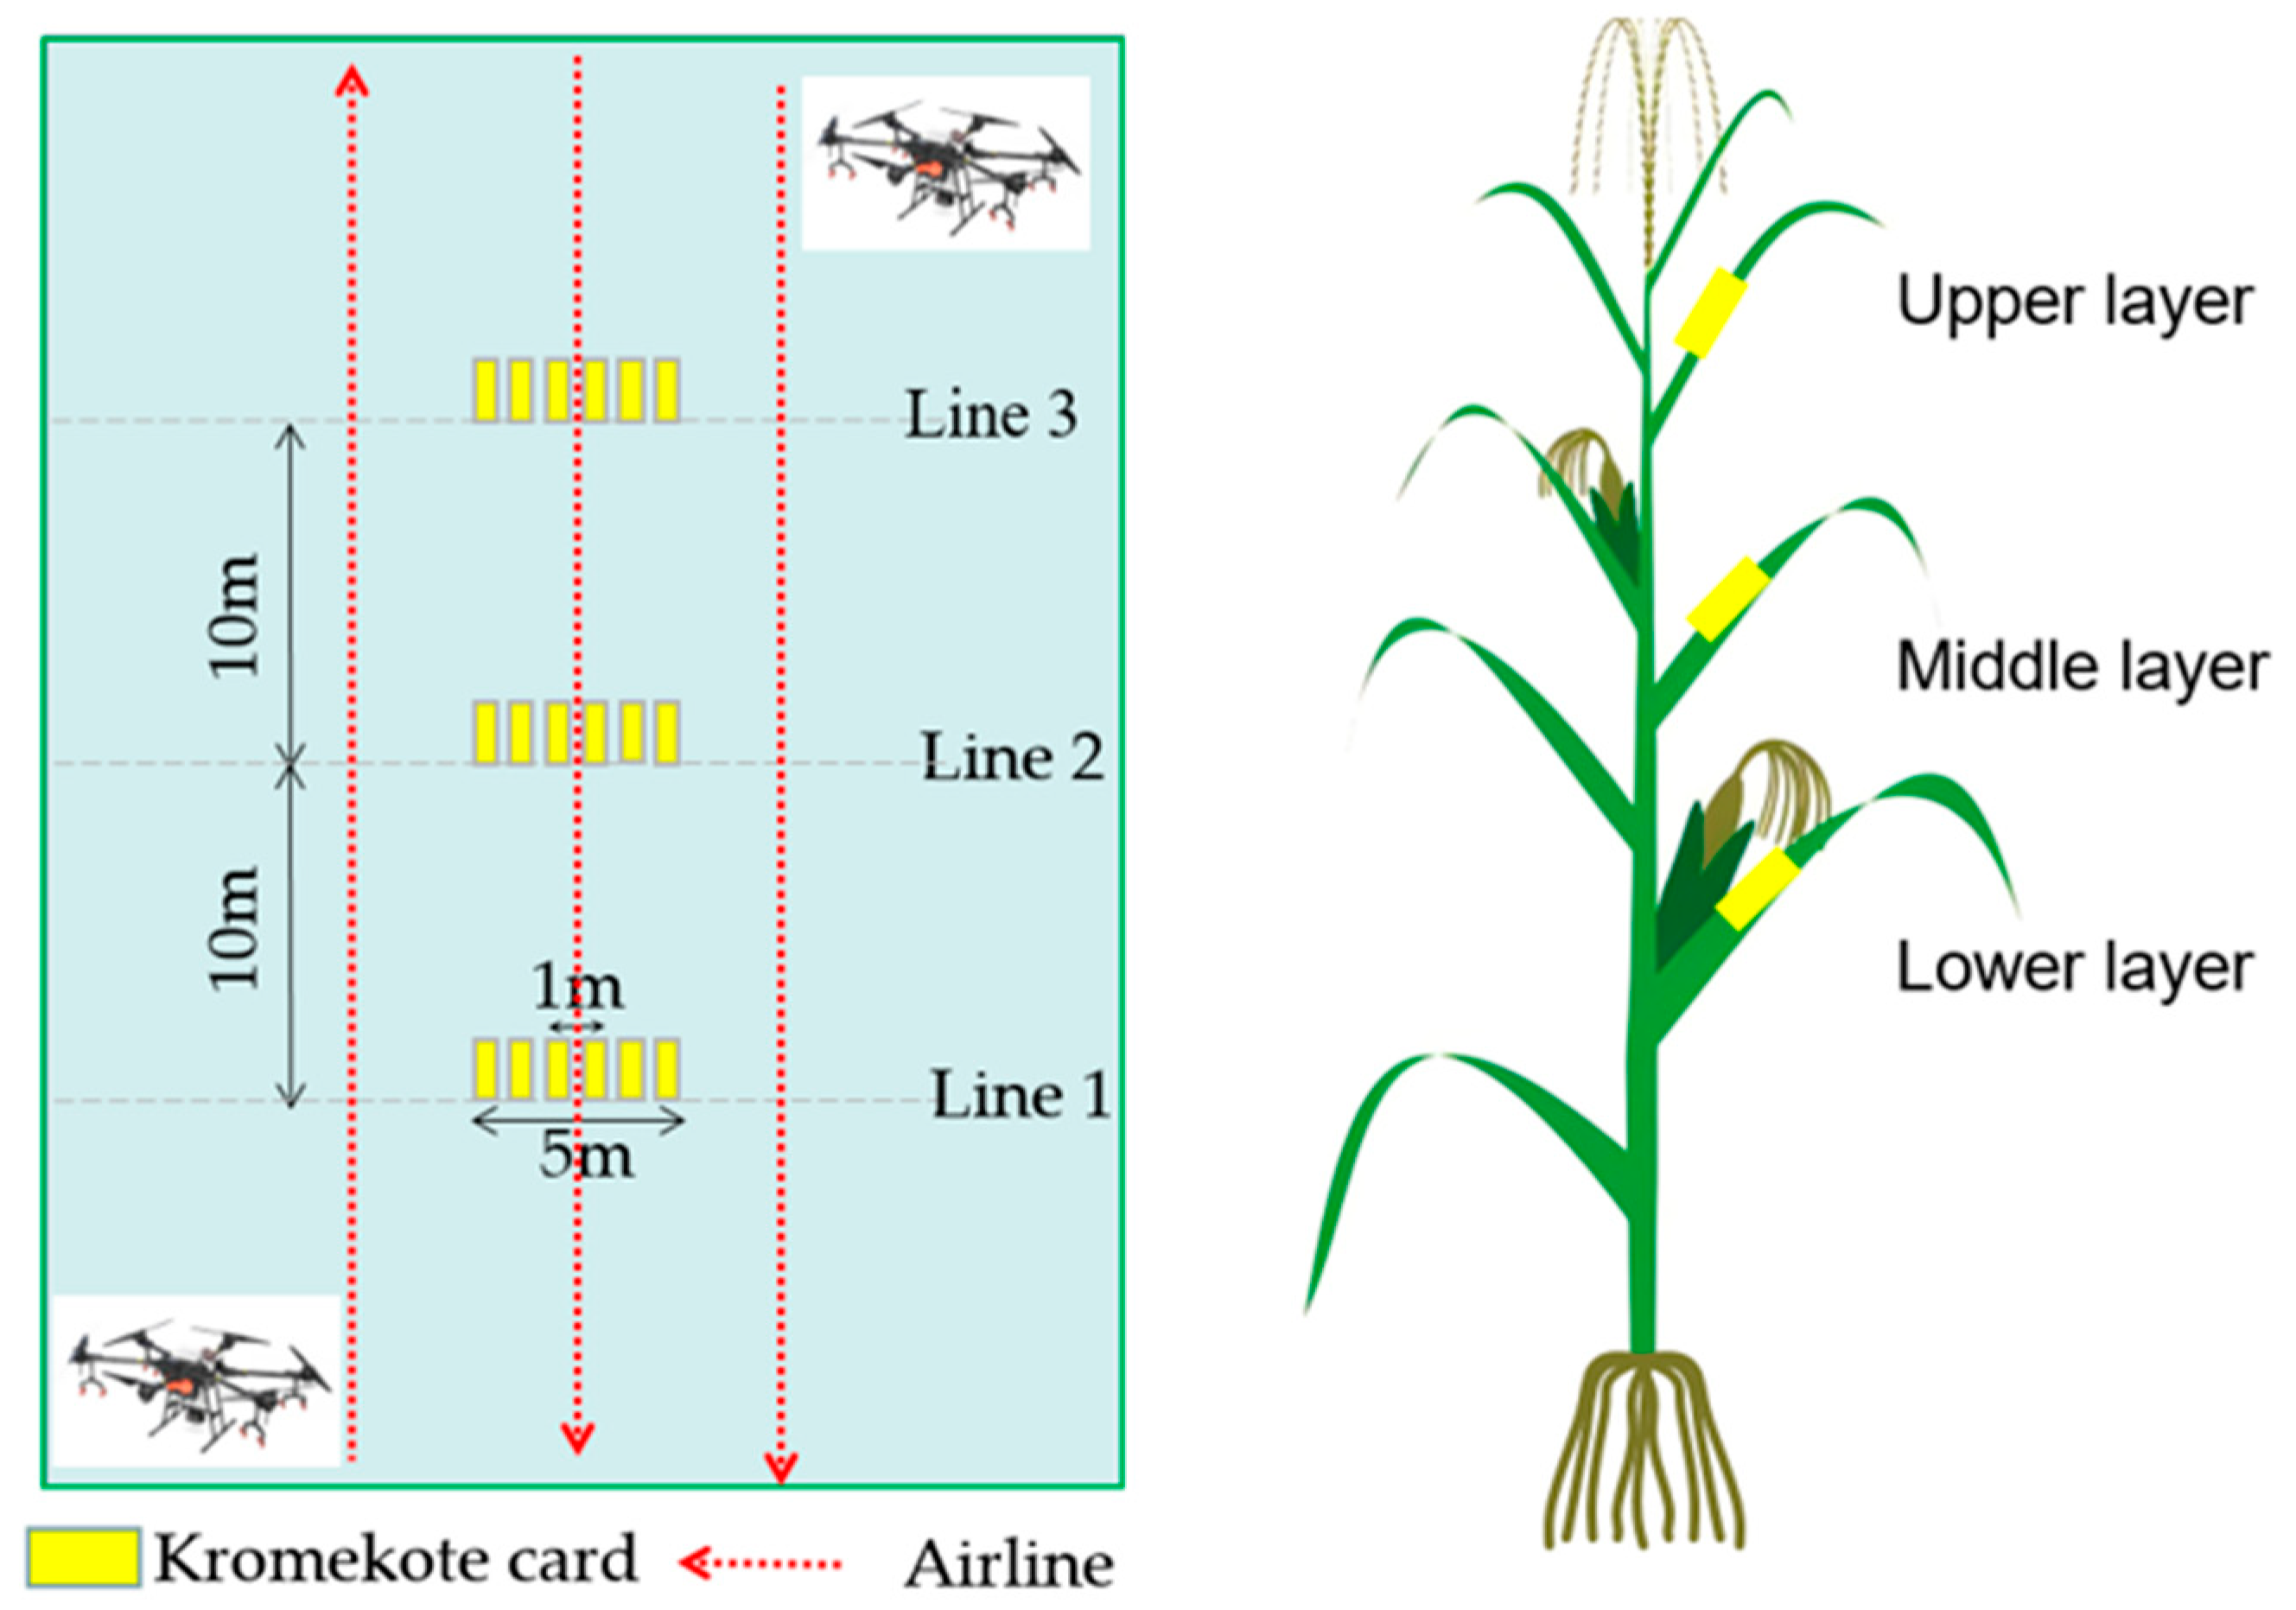
Prior to the experiments, an Allura Red tracer was added to the spray liquid at a concentration of 5 g/L to prepare the solutions, and droplet deposition was subsequently evaluated for the different treatments. The experimental layout consisted of three sampling belts (A, B, and C). Six sampling points were established along each belt at 1 m intervals, spanning a total length of 5 m, which precisely corresponds to a single effective swath width of the plant protection UAV. At each sampling point, sampling cards were positioned at three distinct canopy layers (upper, middle, and lower). During the operation, the UAV executed three parallel flight lines, and droplet deposition was specifically measured from the central flight line to ensure data accuracy. Based on the Phase I experimental design, droplet deposition measurements were systematically conducted for the 9 physical parameter treatment combinations. This targeted approach was specifically designed to isolate and elucidate the core effects of spray volume and droplet size on canopy penetration prior to the comprehensive efficacy evaluation in Phase II. A schematic diagram of the UAV deposition sampling layout is illustrated in
Figure 3.
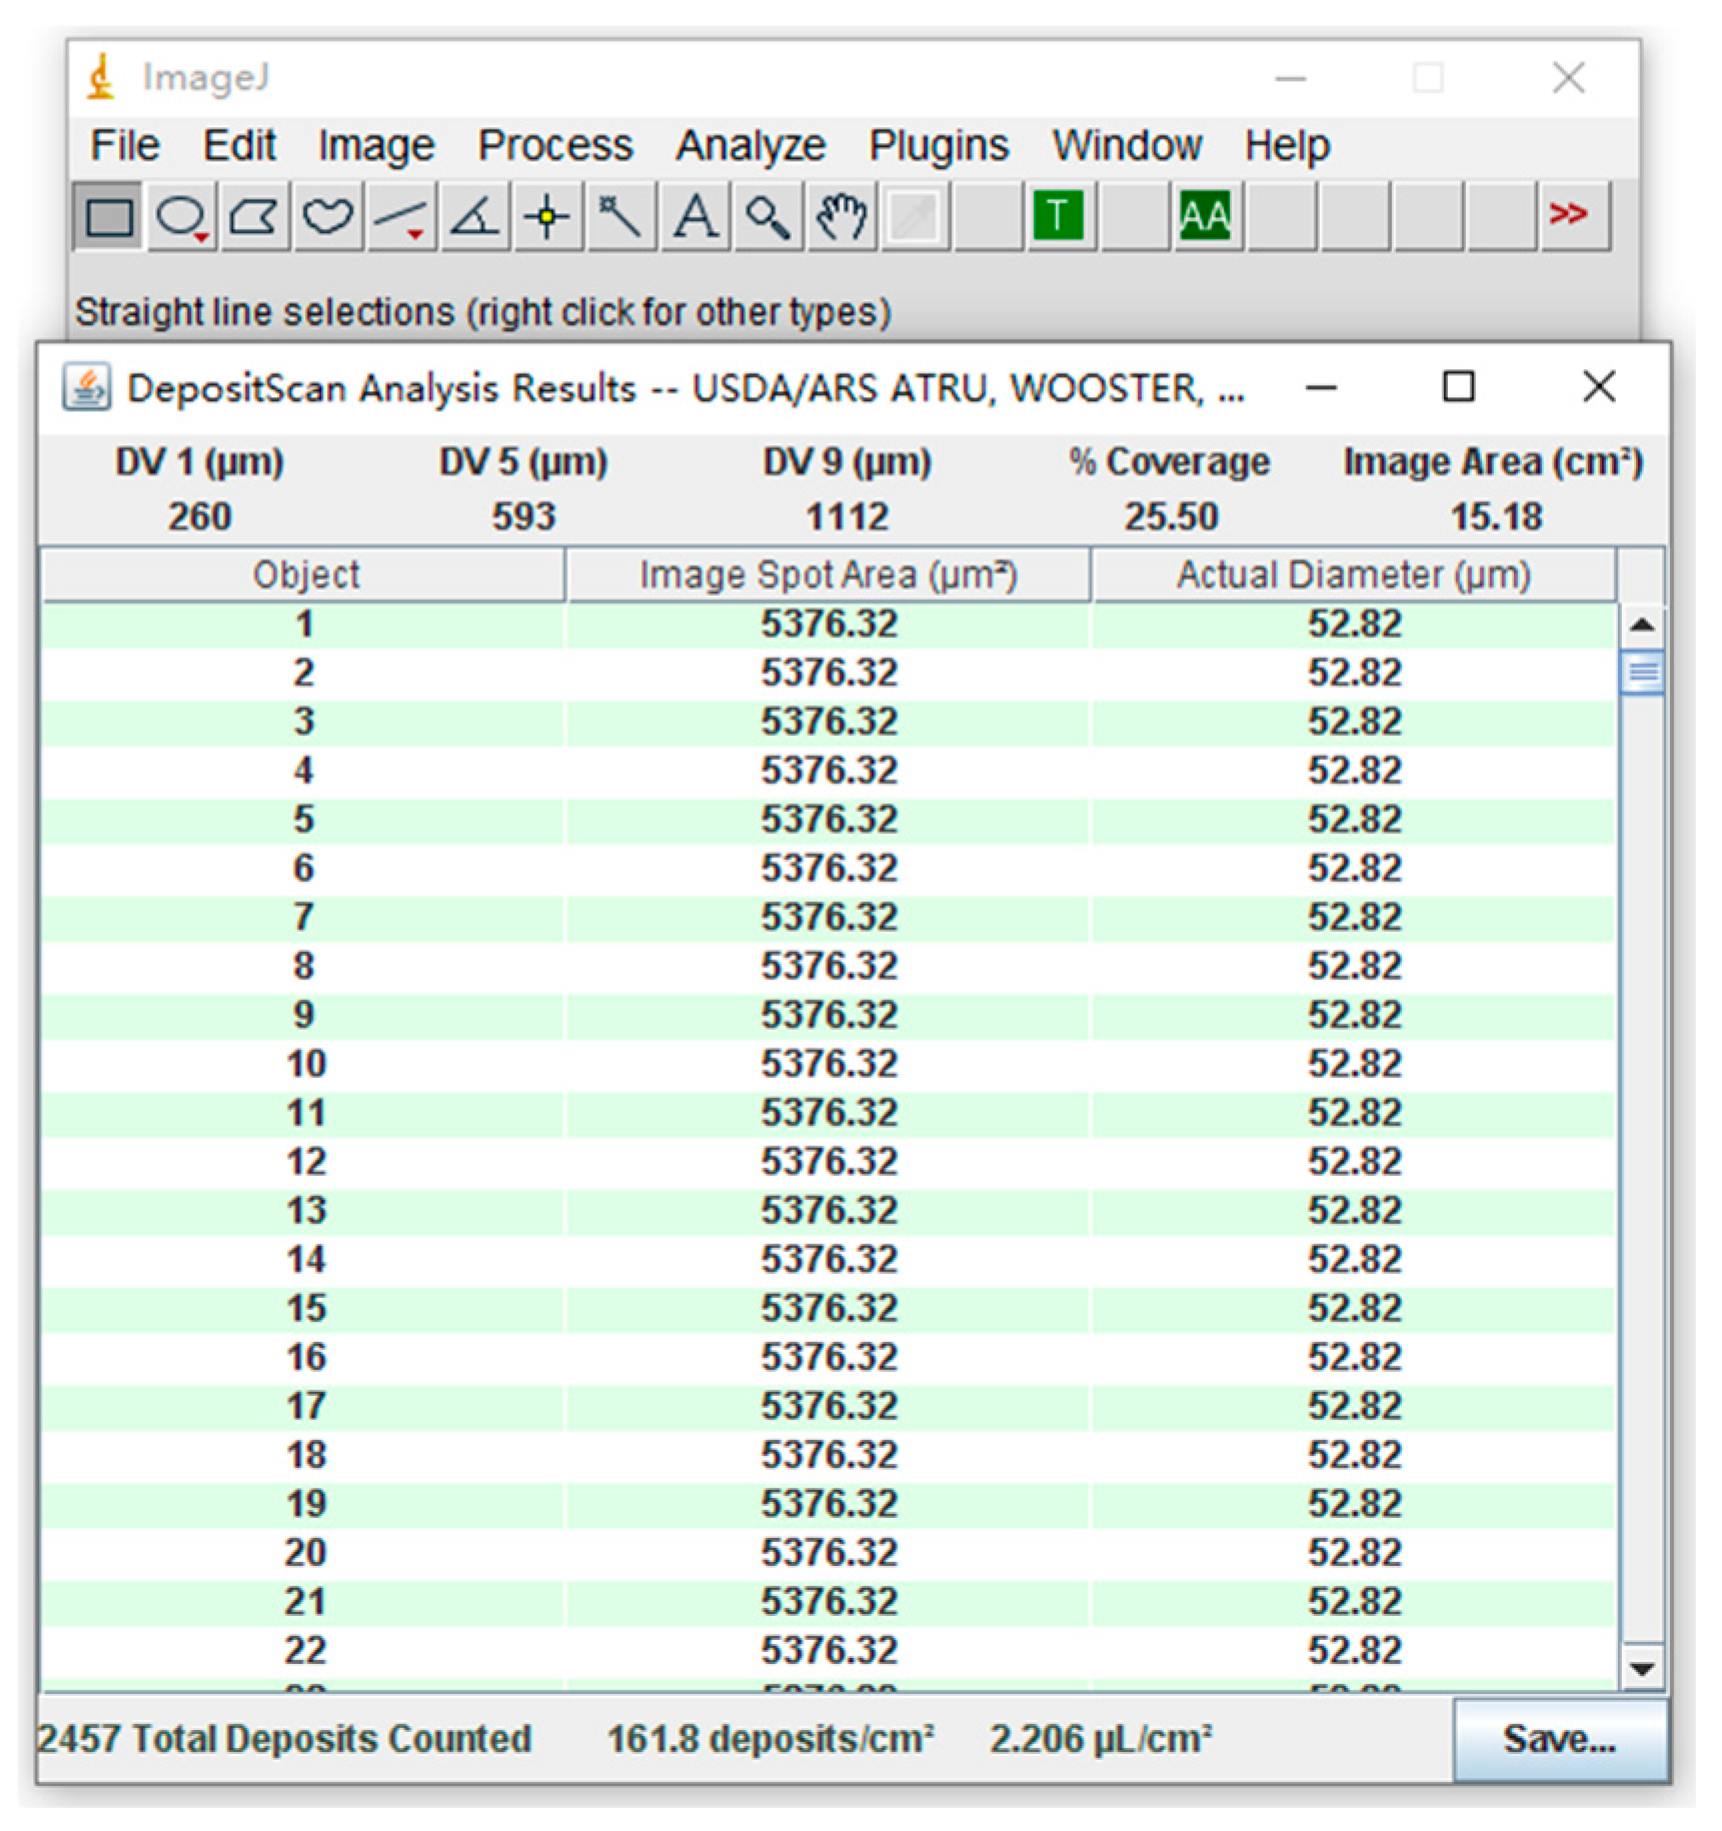
Following each spray application, the water-sensitive papers at each sampling point were collected after approximately 30 s, appropriately labeled, and placed into ziplock bags to be returned to the laboratory for data analysis. The collected papers were scanned at a resolution of 600 dpi using a CanoScan LiDE300 scanner (Canon Inc., Tokyo, Japan). The scanned images were subsequently processed using DepositScan software (USDA, Wooster, OH, USA) to obtain the droplet density and coverage (
Figure 4).
2.5. Control Efficacy
The assessment of control efficacy in this experiment focused primarily on damage caused by lepidopteran pests in maize. Surveys were conducted before UAV spraying and at 1, 3, 7, and 10 days after application to determine pest damage incidence and the number of live insects. Lepidopteran pest damage was assessed using a five-point diagonal sampling method, with 20 plants bearing the main ear evaluated at each sampling point. Pest damage incidence and control efficacy were subsequently calculated. The calculation formulas are shown in Equations (1) and (2).
where
is the damage rate (%), and
is the number of damaged plants per sampling point;
is the control efficacy (%),
is the damage rate of the untreated control, and
is the damage rate of the treatment.
2.6. Data Analysis
Experimental data were processed and analyzed using SPSS 19.0 software. Analysis of variance (ANOVA) was performed at a 95% confidence level, and differences were considered statistically significant when
p < 0.05. Microsoft Excel was used to calculate the coefficient of variation (CV) among the upper, middle, and lower canopy layers. The CV was used to represent the penetration of droplets, with higher CV values indicating poorer droplet penetration. The calculation formula is as follows:
where
is the standard deviation of coverage or droplet density;
is the value of coverage or droplet density at each sampling point;
is the mean coverage or droplet density; and
is the number of sampling points.
2.7. Measurement of Contact Angle
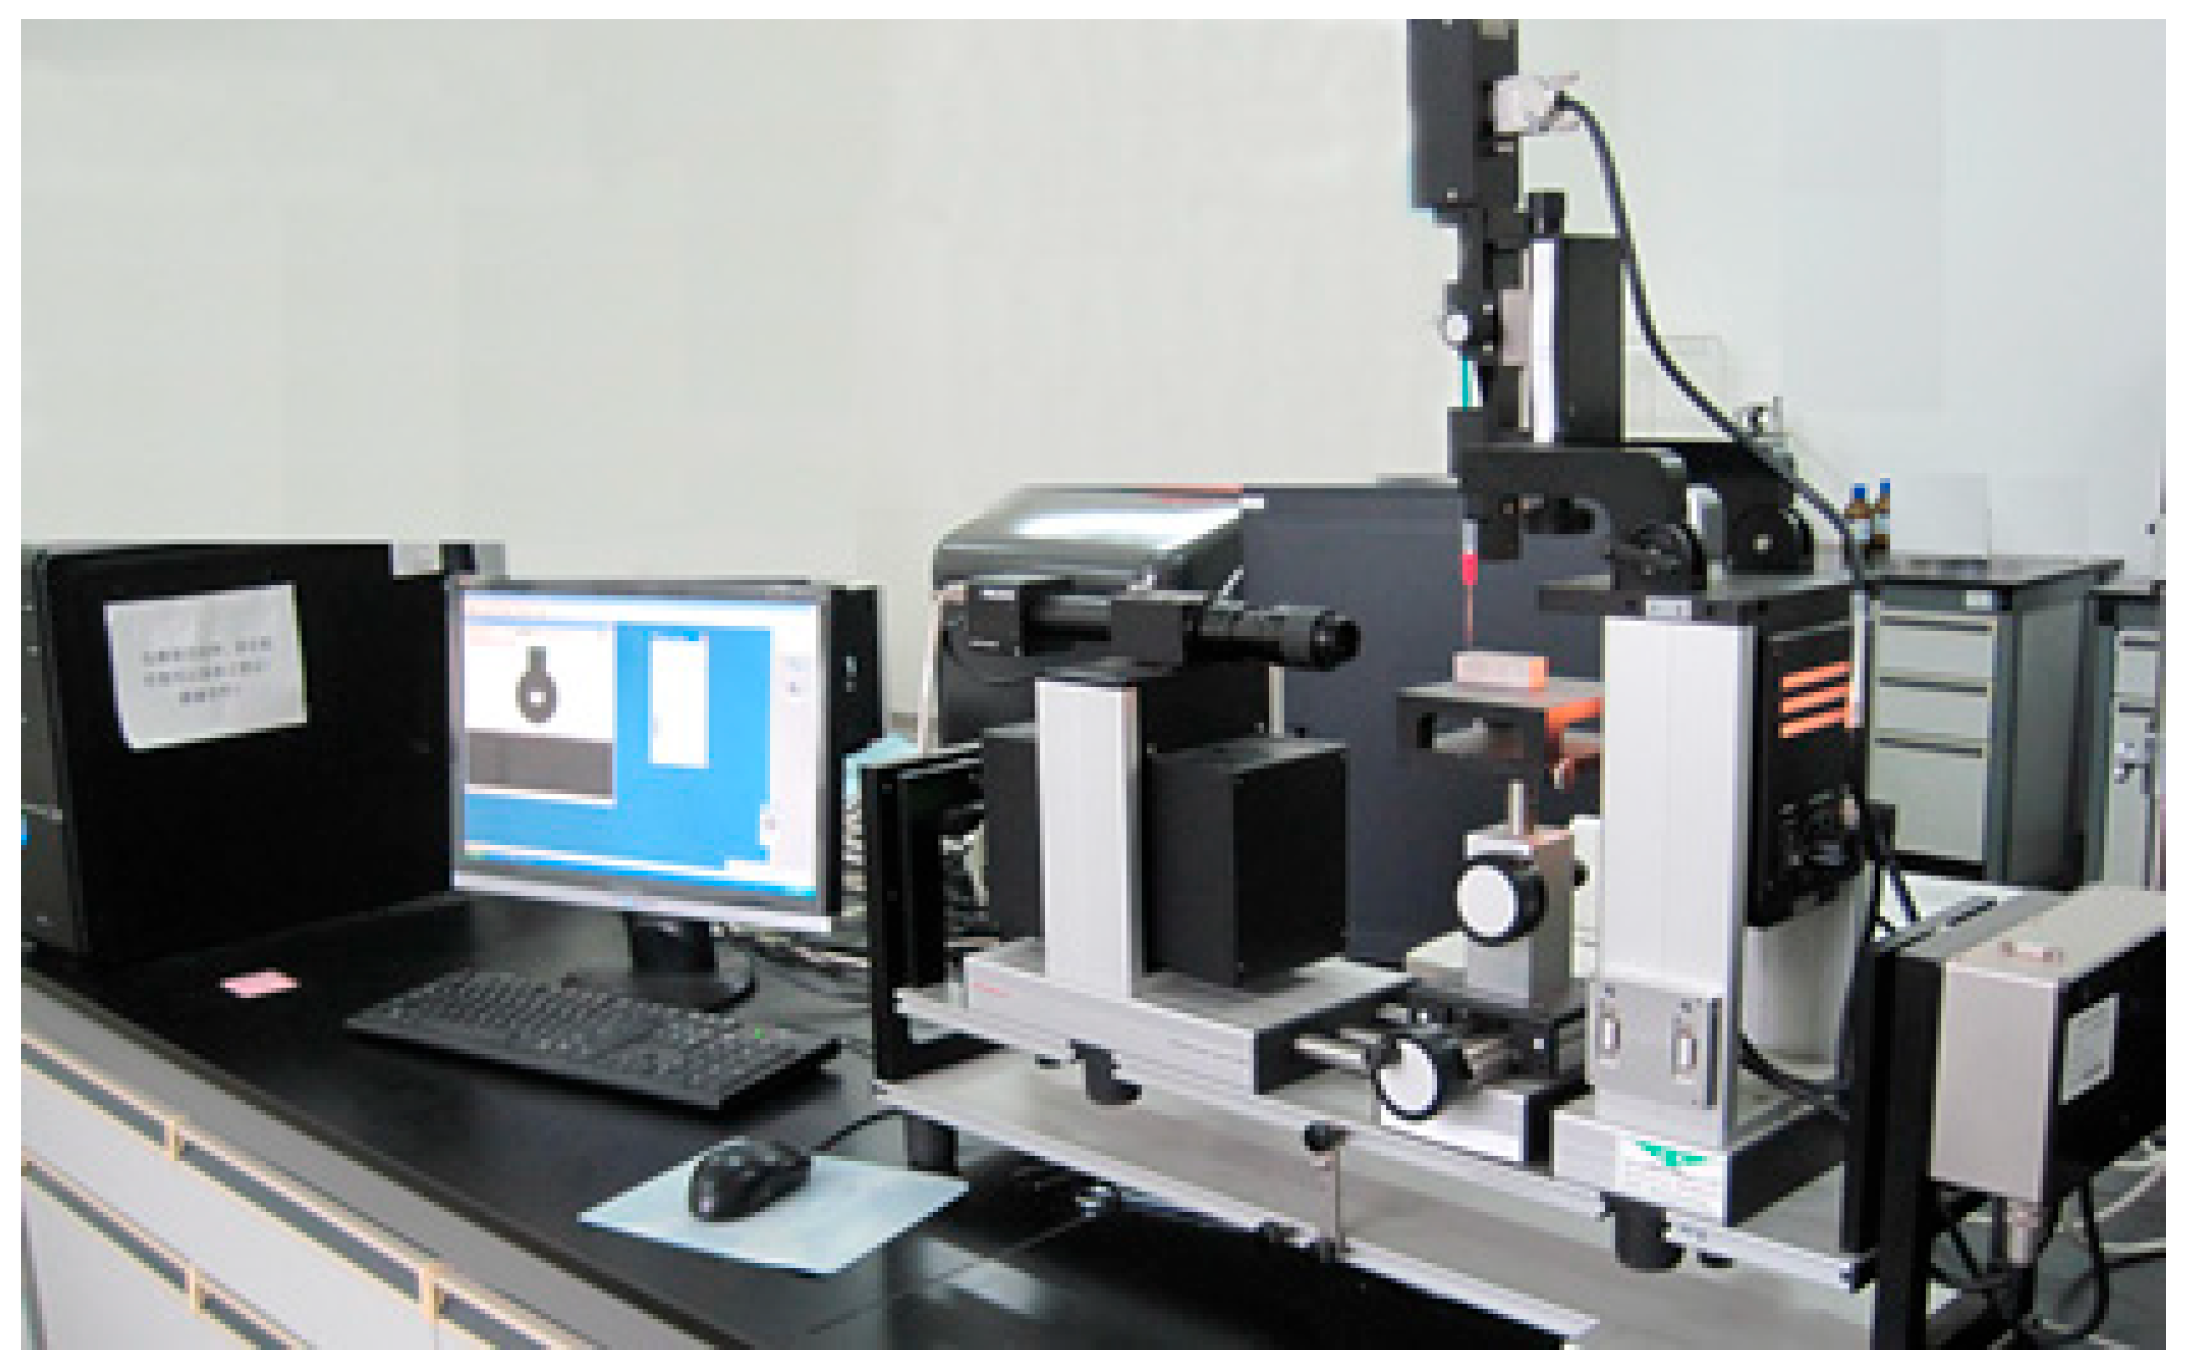
To evaluate the wetting dynamics of the pesticide solutions on the target crop interface, the dynamic contact angle on maize leaves was measured using an OCA 20 video-based optical contact angle measuring instrument (
Figure 5). The experimental procedure was scientifically conducted step-by-step as follows:
- (1)
Sample Preparation: Fresh, healthy maize leaf segments were carefully collected from the middle section of the plant, cleared of surface dust, and securely fixed flat onto a clean glass slide on the instrument’s sample stage.
- (2)
Droplet Dispensing: A standard droplet volume of 4 μL of the target pesticide solution was precisely dispensed onto the horizontal leaf surface using an automated electronic syringe via the sessile drop method.
- (3)
Image Acquisition: A high-speed digital camera dynamically captured the profiles of the droplet on the leaf interface over time. The temporal evolution was recorded from 0 to 120 s at 10 s intervals.
- (4)
Baseline Fitting: The contact angle values were calculated and extracted via the instrument’s integrated software using circle/ellipse fitting algorithms based on automated baseline calibration.
To ensure scientific rigor, measurements for each pesticide solution were performed in triplicate (three independent replicates).
2.8. Measurement of Droplet Wetting Performance
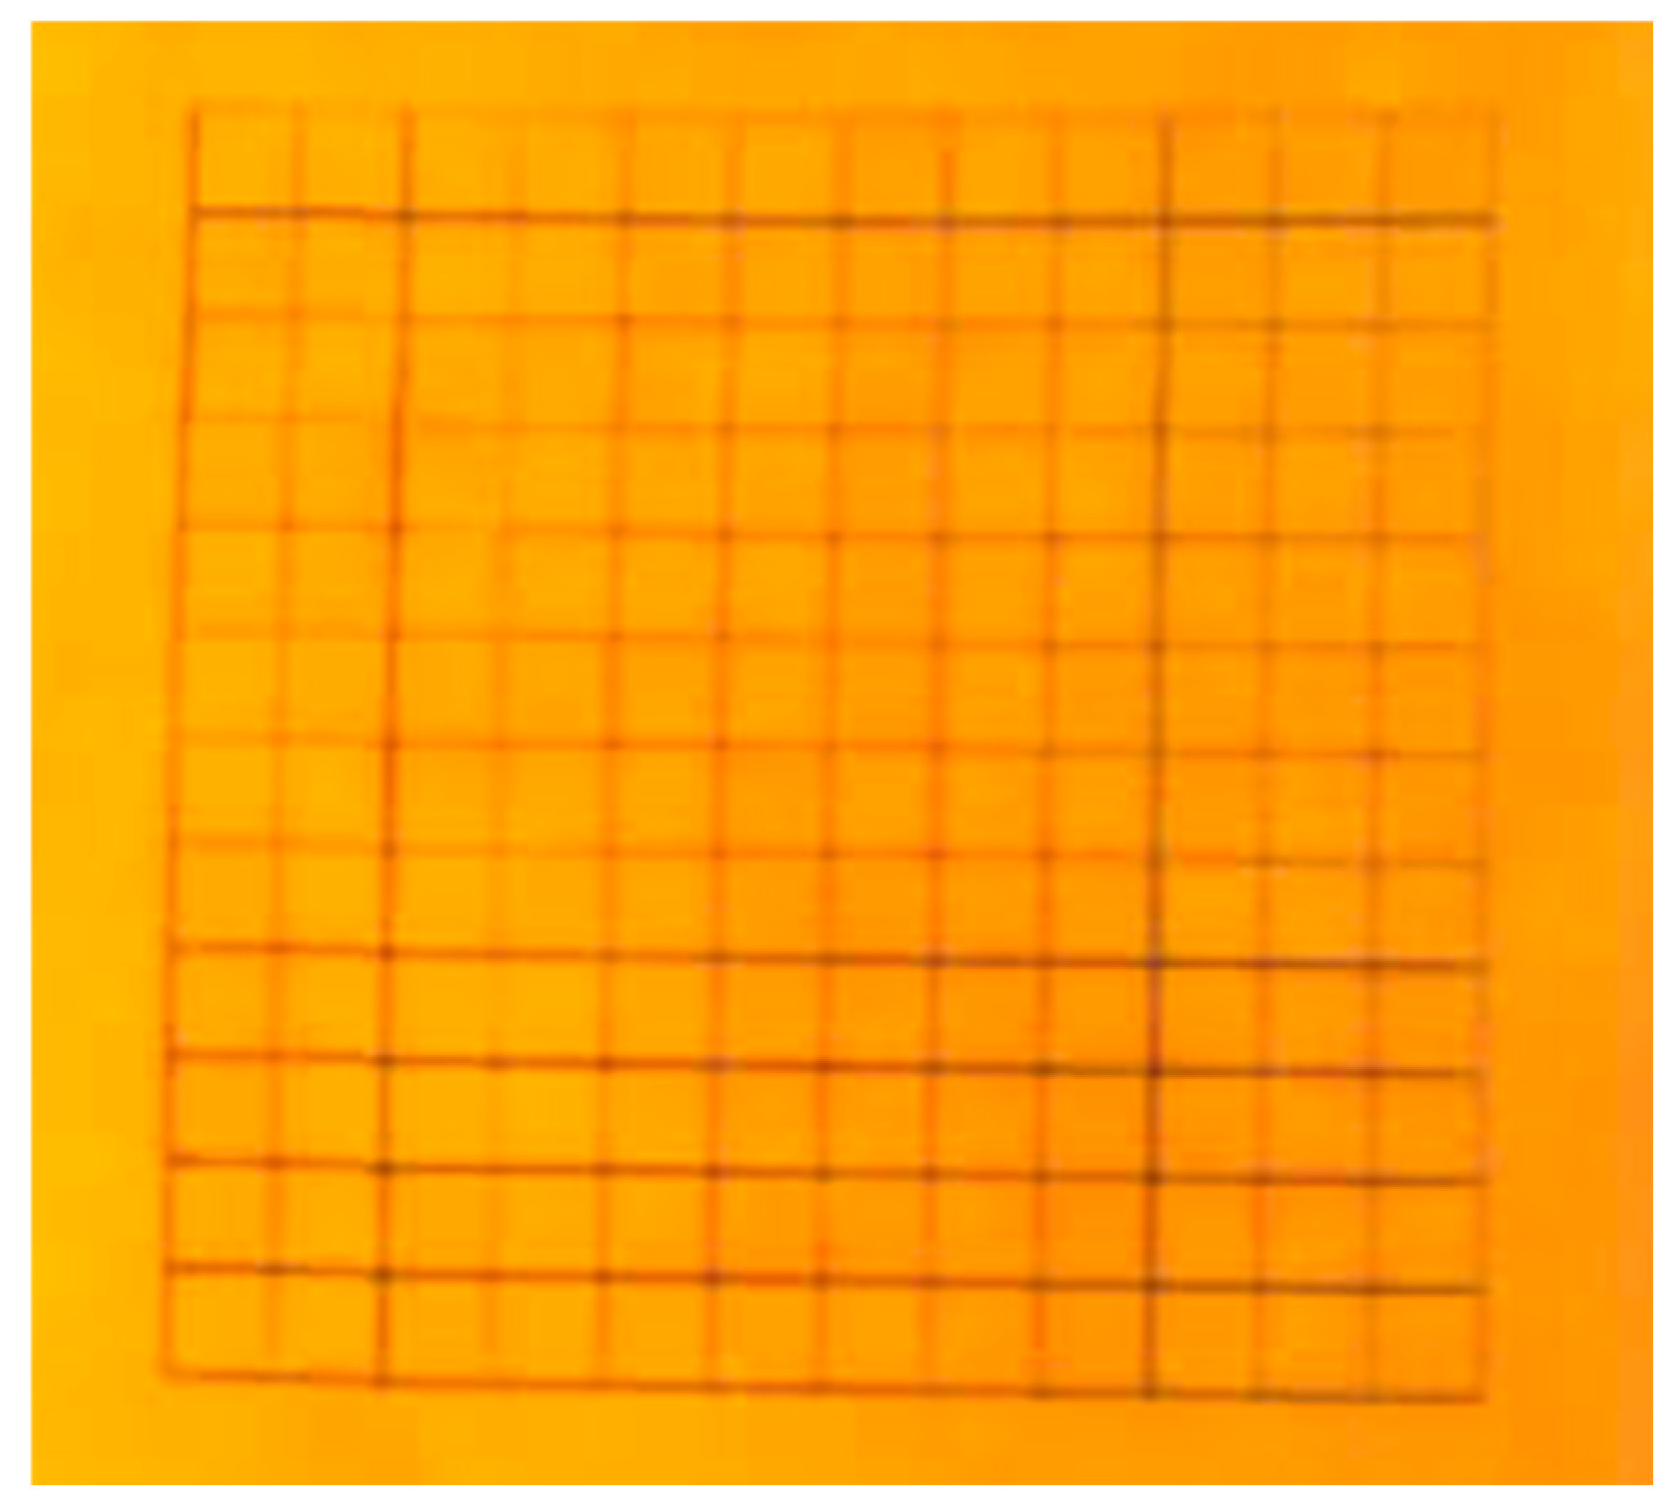
To characterize the interfacial spreading capability of the pesticide formulations and clarify the mechanism by which nano-pesticides maximize target coverage under ultra-low volume spray conditions, the wetting performance was assessed using specialized liquid wettability test cards (
Figure 6, Institute of Plant Protection, Chinese Academy of Sciences). A standard droplet volume of 20 μL was precisely dispensed onto the horizontal test card. The ultimate wetted area was then quantified based on the number of effective grid squares covered after surface spreading had ceased completely. This measurement serves to evaluate how the formulation’s wetting properties theoretically compensate for reduced water carrier volumes.
2.9. Measurement of Solution Viscosity
To investigate the fundamental fluid physical properties that govern liquid flow behavior and droplet atomization within the UAV spraying system, the dynamic viscosity of the pesticide solutions was determined utilizing an NDJ-5S rotational viscometer. Fluid viscosity directly influences the shear-induced breakup of the liquid sheet on the centrifugal rotary disk, thereby dictating the final droplet size distribution. To maintain strict thermal consistency with the ambient environmental conditions of the field trials, all viscosity measurements were conducted using a thermostatic water bath precisely calibrated to a constant temperature of 31 °C.
3. Results
3.1. Effects of Spray Volume and Droplet Size on Droplet Density
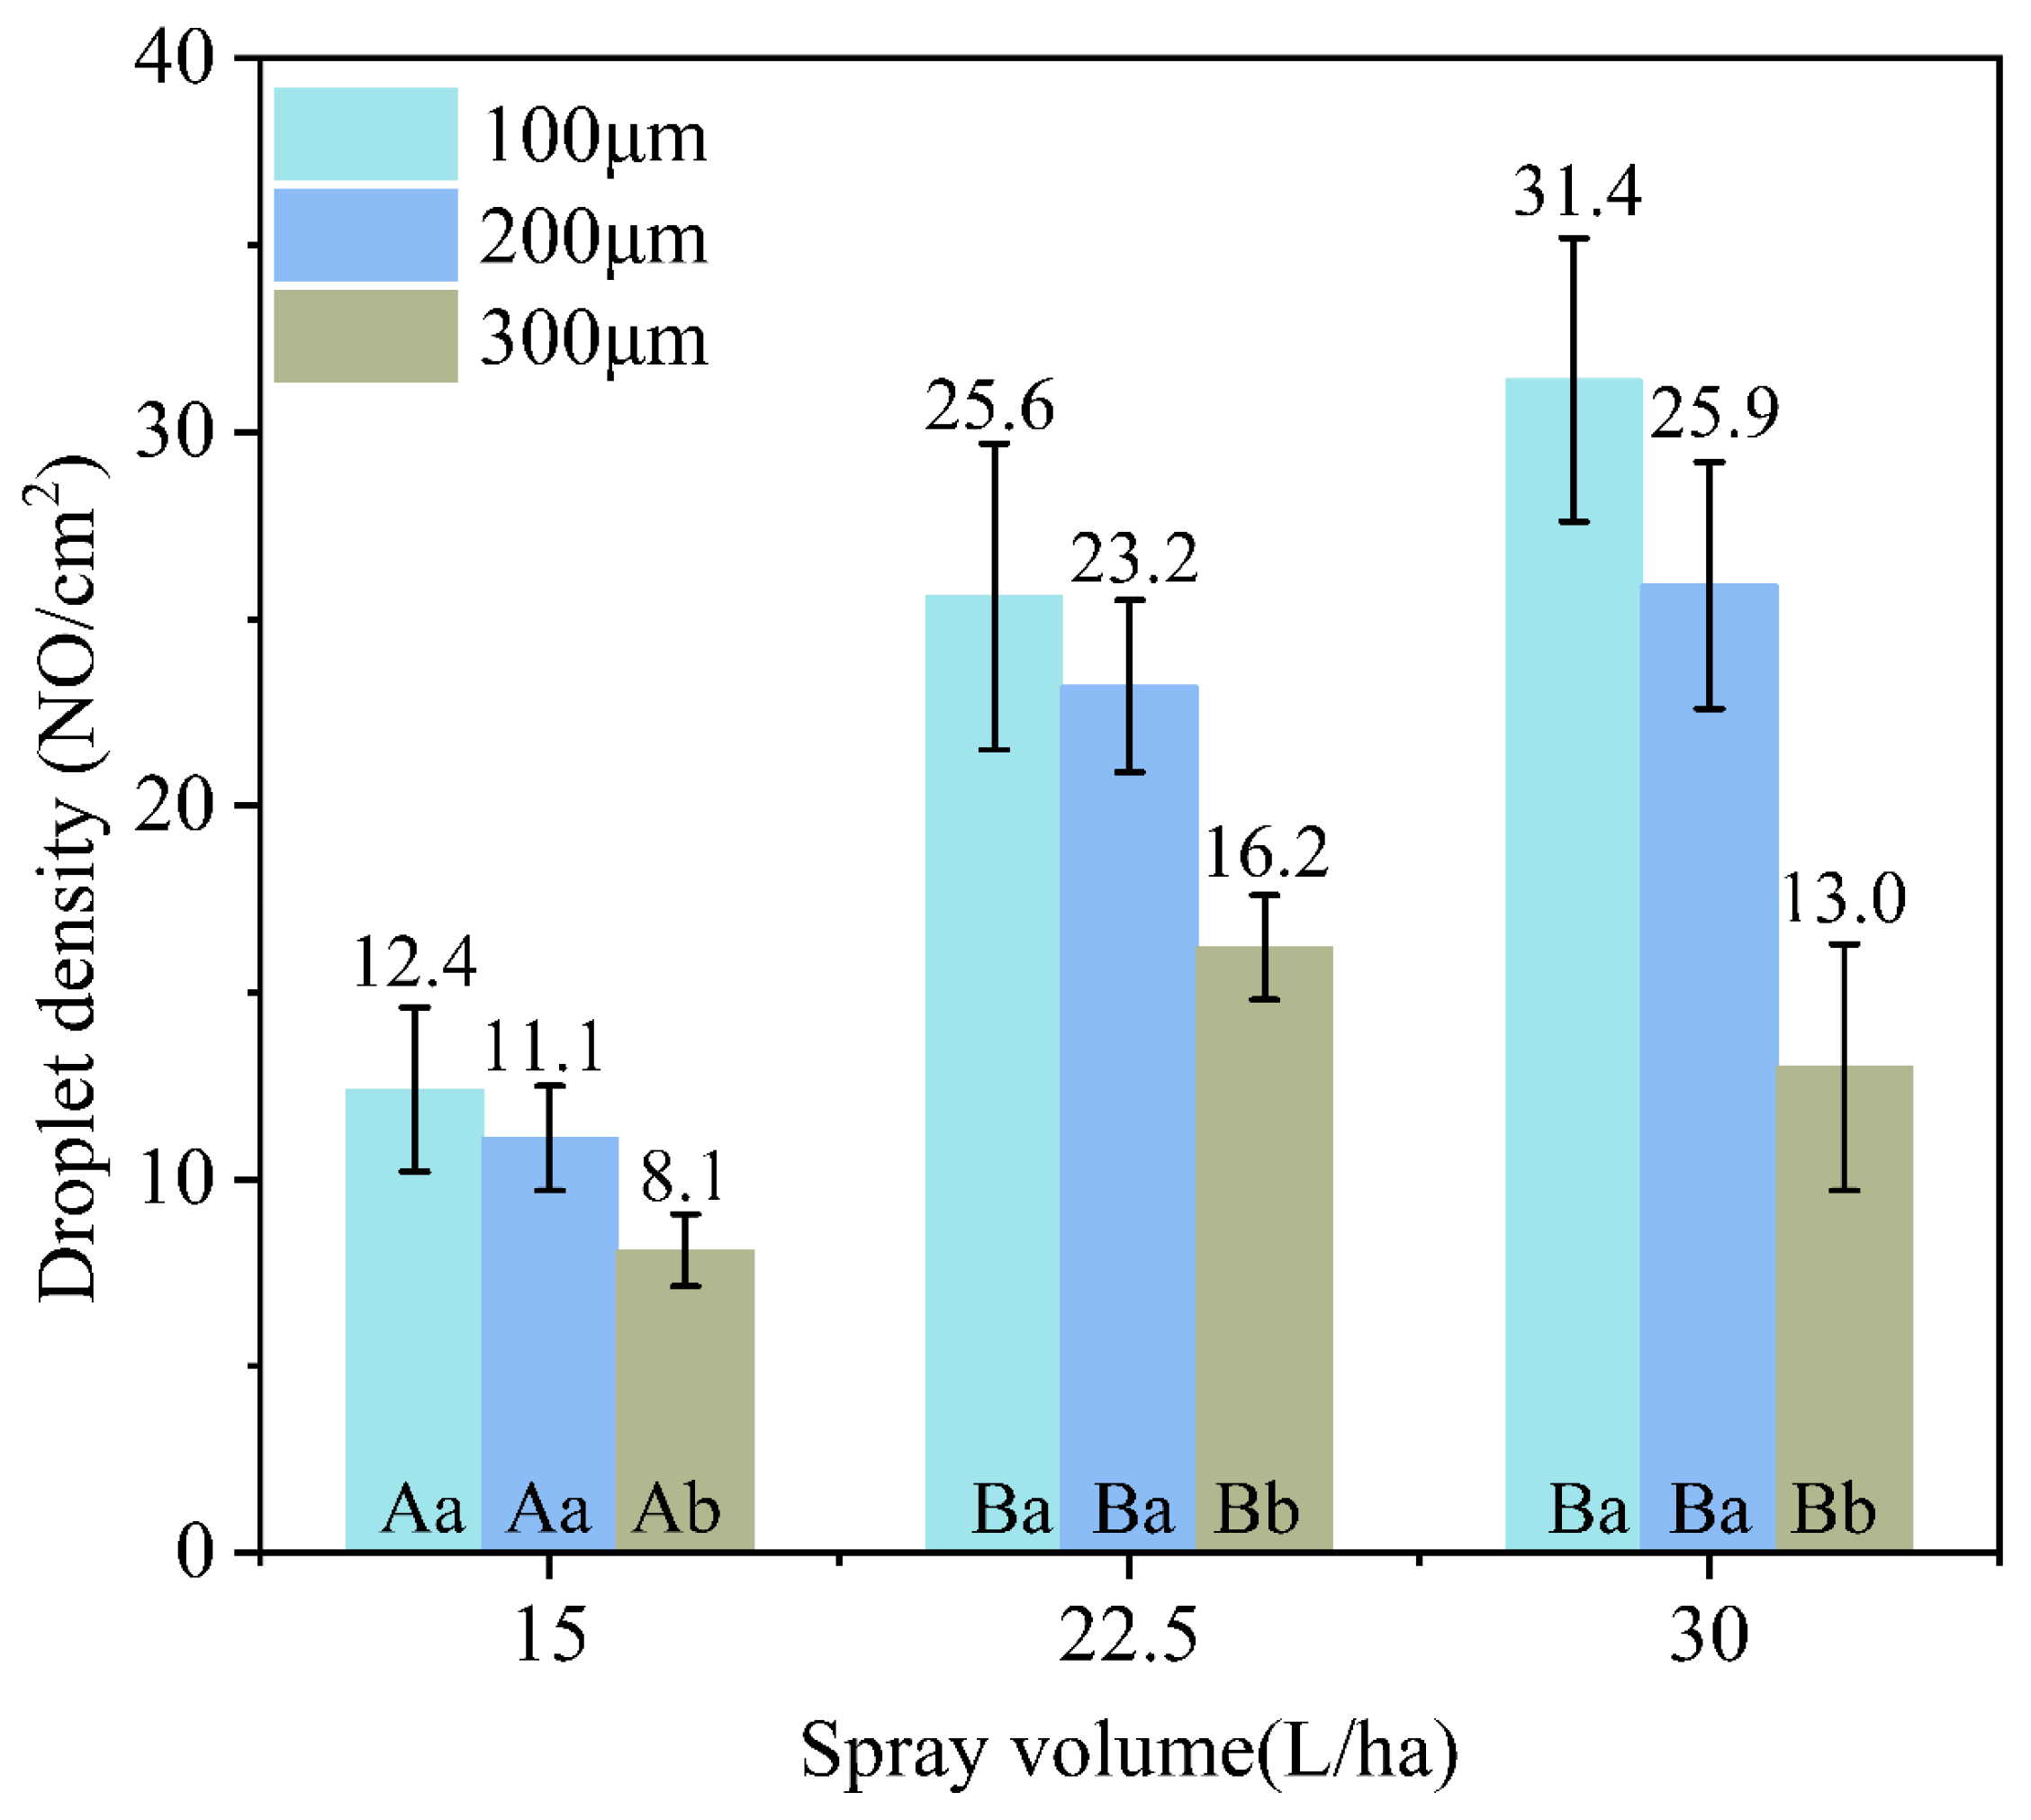
Figure 7 shows the effects of spray volume and droplet size on droplet density. Under a given droplet size, the droplet density of 100 μm and 200 μm droplets increased with increasing spray volume (e.g., for the optimal 200 μm droplets, the deposition density increased quantitatively by 109.0% when the spray volume was raised from 15.0 to 22.5 L·ha
−1); however, no significant differences were observed between the 22.5 and 30.0 L·ha
−1 treatments. For 300 μm droplets, the highest droplet density was observed at a spray volume of 22.5 L·ha
−1. Although increasing the spray volume generally enhanced droplet density, excessively high spray volumes may cause droplet overlap during application, resulting in a decrease in density.
Under a fixed spray volume, droplet density decreased as droplet size increased, while no significant differences were detected between 100 μm and 200 μm droplets (for instance, at 22.5 L·ha−1, the density of 200 μm droplets was 43.2% higher than that of 300 μm droplets). Overall, reducing droplet size and spray volume can improve droplet deposition density; however, excessively small droplets are prone to drift and evaporation. Physically, an increase in spray volume enhances the total mass flow and initial momentum of the droplet cloud, while the centrifugal breakup mechanism determines the initial droplet count. Driven by the UAV’s downward airflow, the 200 μm droplets achieve an optimal physical balance, possessing sufficient kinetic energy to resist drift while maintaining a high deposition density.
Table 4 presents the droplet deposition density on different canopy layers of maize under varying spray volumes and droplet sizes. The results show that when the droplet size was 100 μm or 200 μm, significant differences in droplet density were observed among the three spray volumes across all maize canopy layers, with the highest deposition density occurring in the upper canopy. When the droplet size was 300 μm, significant differences between the middle and lower canopy layers were observed only under the spray volume of 30.0 L·ha
−1.
Under the same spray volume, droplet density across all canopy layers exhibited a decreasing trend with increasing droplet size. Notably, under the treatment of 22.5 L·ha−1 spray volume combined with a 300 μm droplet size, the droplet density in the lower canopy was higher than that in the middle canopy. This phenomenon may be attributed to the canopy structure, as the sampling cards placed in the middle layer were partially shielded by maize leaves, resulting in reduced droplet interception and lower droplet density.
3.2. Effects of Spray Volume and Droplet Size on Droplet Coverage
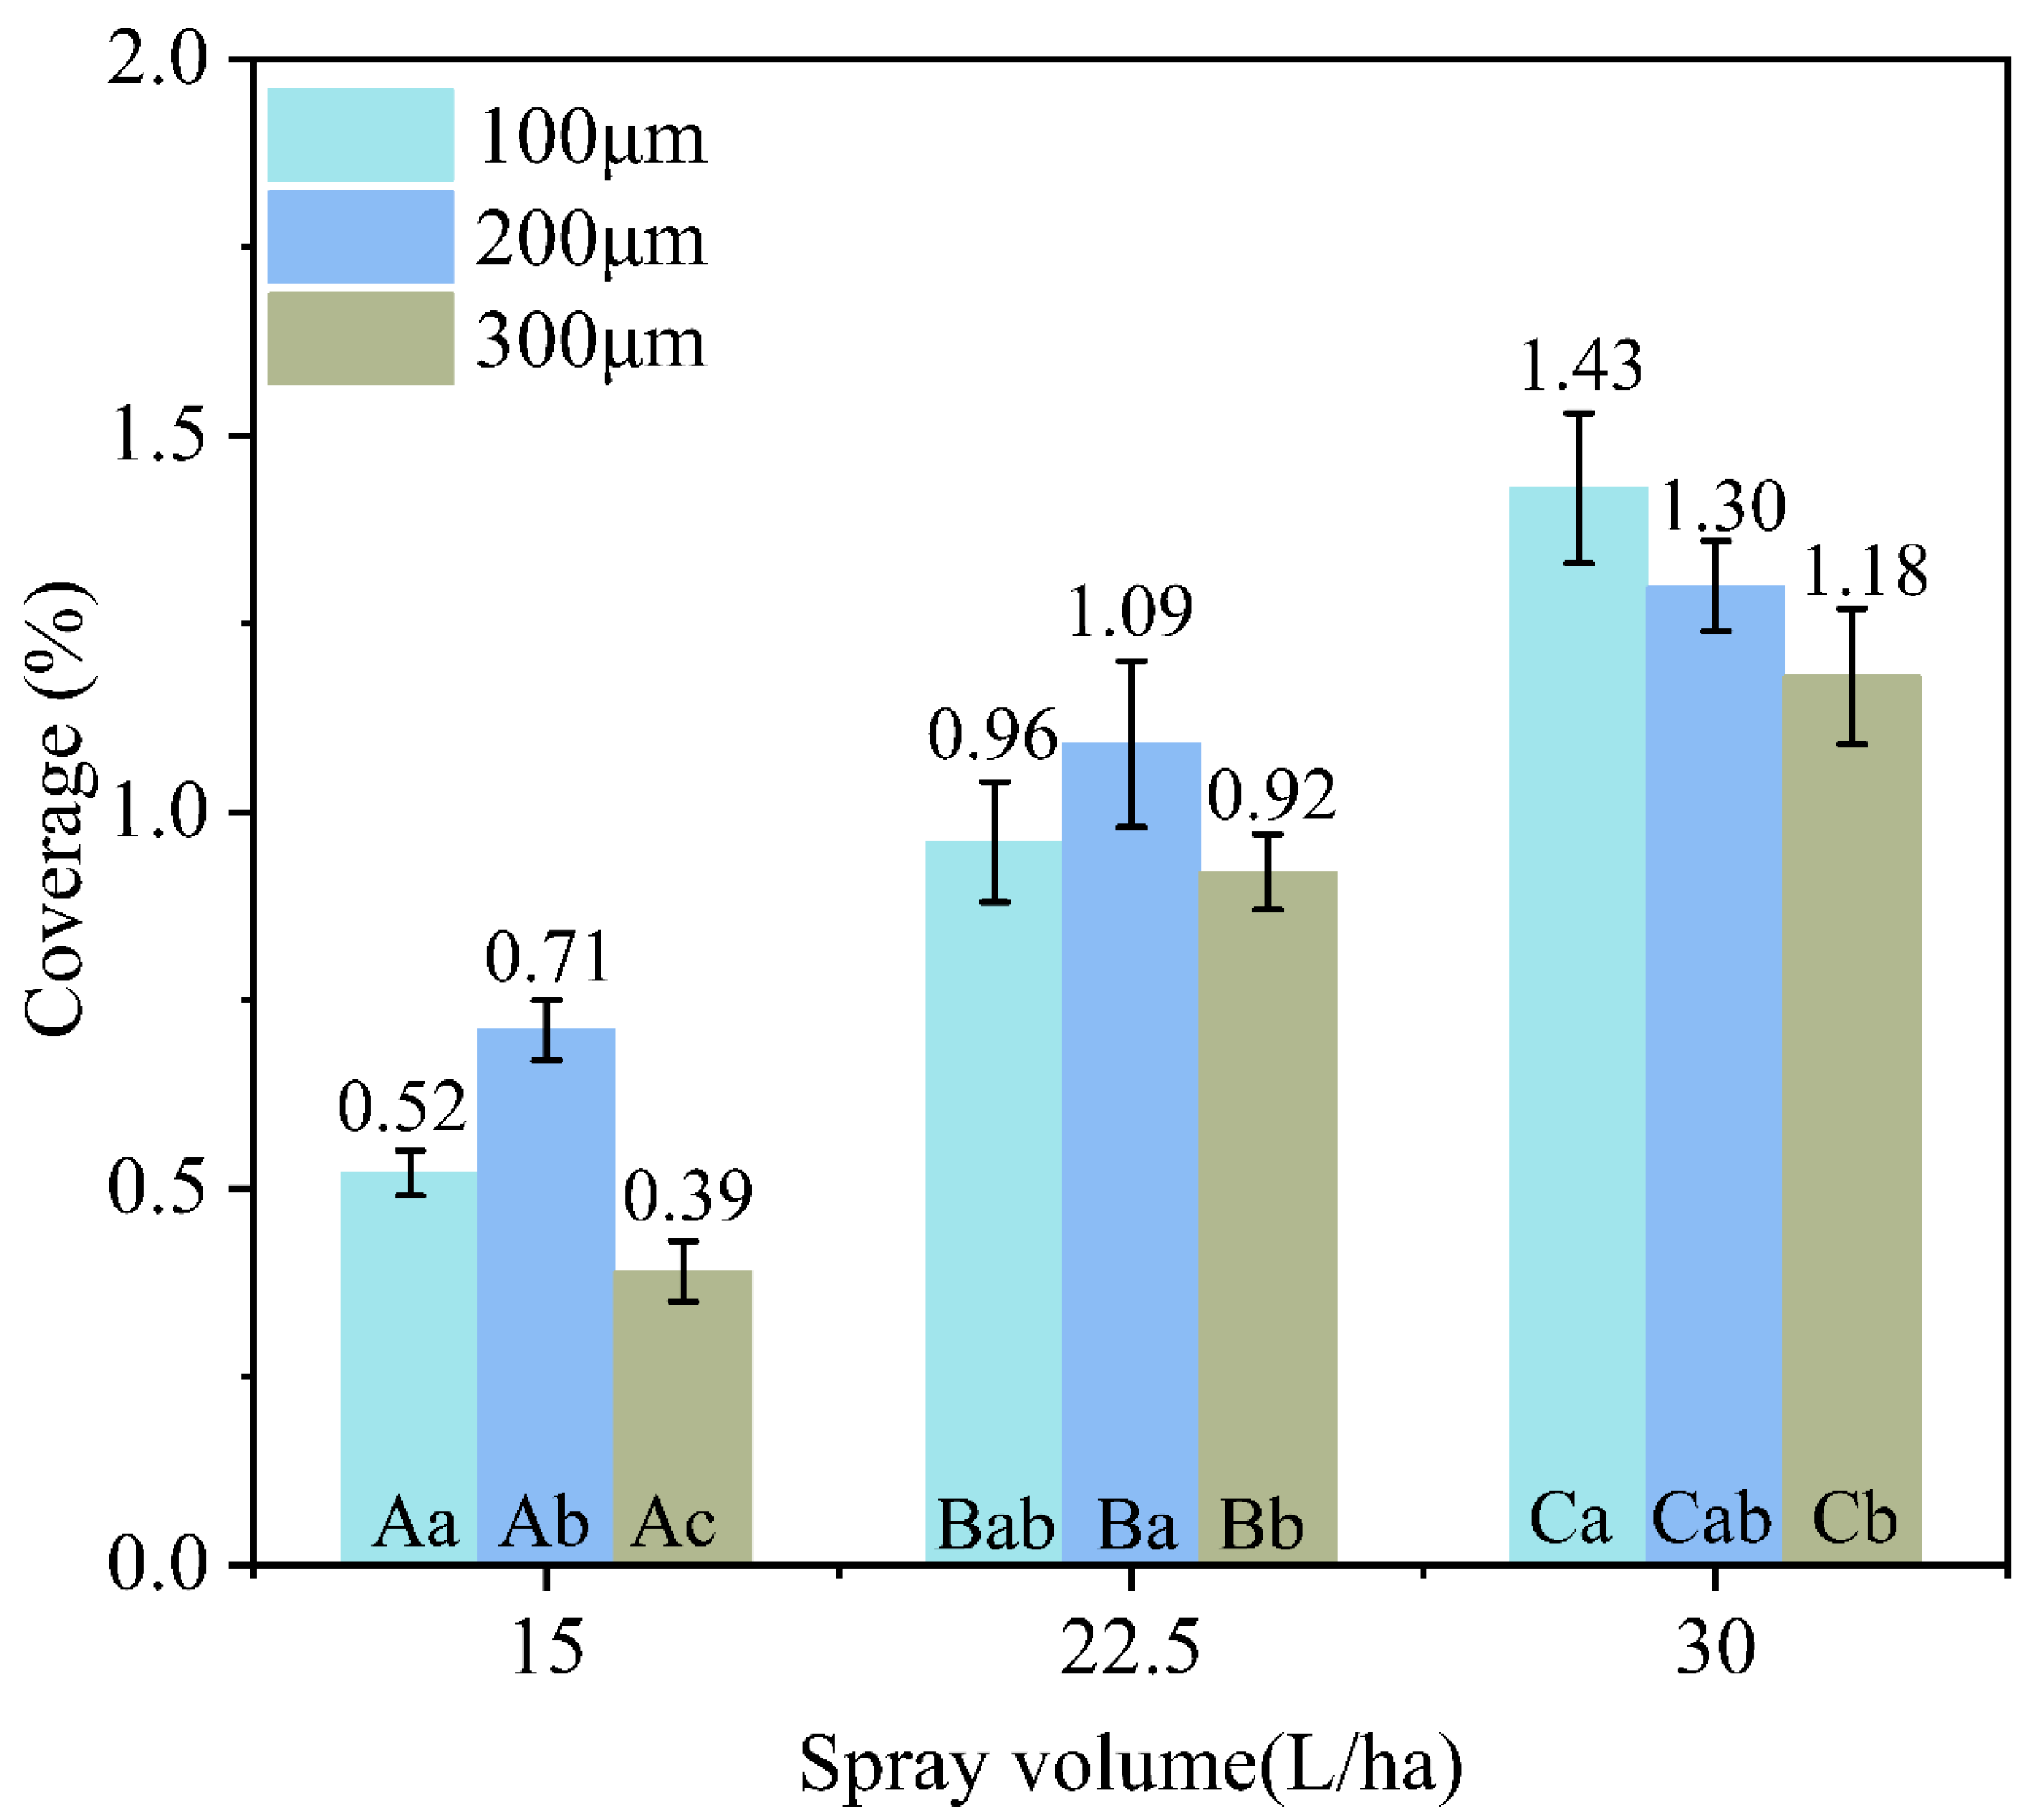
Figure 8 illustrates the effects of spray volume and droplet size on droplet coverage. As shown in the figure, different treatments exerted varying influences on droplet coverage. Under the spray volume of 15.0 L·ha
−1, significant differences in coverage were observed among different droplet sizes, with droplets of 200 μm exhibiting the highest coverage. Under spray volumes of 22.5 and 30.0 L·ha
−1, no significant differences in coverage were detected between adjacent droplet sizes.
At a given droplet size, droplet coverage increased with increasing spray volume, and droplets with a size of 300 μm consistently exhibited the lowest coverage. Droplets of 200 μm achieved the highest coverage under spray volumes of 15.0 and 22.5 L·ha−1, and under the 15.0 L·ha−1 treatment, the coverage was significantly higher than that of the other droplet sizes (e.g., increasing quantitatively by 82.1% and 36.5% compared to the 300 μm and 100 μm treatments, respectively). Mechanistically, this phenomenon is governed by geometric constraints and impact dynamics. At a constant spray volume, total droplet quantity is inversely proportional to the cube of the droplet diameter, meaning 300 μm treatments generate drastically fewer droplets than 200 μm treatments, leading to a sparser distribution. Furthermore, larger 300 μm droplets possess higher mass and kinetic energy, making them more prone to bouncing or rolling off the hydrophobic maize leaves upon impact. In contrast, 200 μm droplets strike an optimal physical balance, maximizing effective adhesion and surface coverage.
Table 5 shows the effects of spray volume and droplet size on droplet coverage. As indicated in the table, significant differences in droplet coverage were observed among treatments across all maize canopy layers. Under a given droplet size, droplet coverage in each canopy layer increased with increasing spray volume.
Under the spray volume of 15.0 L·ha−1, droplets with a size of 200 μm exhibited superior coverage. This may be attributed to the fact that 100 μm droplets are more prone to drift and evaporation during application, whereas 300 μm droplets tend to cause uneven distribution and poor canopy penetration. Consequently, the coverage in all canopy layers under these treatments was lower than that achieved with 200 μm droplets.
Under spray volumes of 22.5 and 30.0 L·ha−1, the 200 μm droplet treatment resulted in higher coverage in the lower canopy compared with other droplet sizes, which is of particular importance for effective pest and disease control in the lower parts of maize plants.
3.3. Effects of Spray Volume and Droplet Size on Droplet Penetration
Table 6 presents the effects of spray volume and droplet size on the penetration of droplet density and droplet coverage. As shown in the table, the coefficients of variation (CV) for droplet density and droplet coverage ranged from 27.3% to 42.7% and from 27.6% to 57.1%, respectively. Mechanistically, while CV is traditionally employed to assess horizontal deposition uniformity, in the context of dense three-dimensional maize canopies, the vertical CV across different layers serves as a highly reliable indicator of downward penetration. It specifically characterizes the spatial deposition gradient from the upper to the lower canopy. A high vertical CV indicates a steep gradient where droplets are predominantly intercepted by the upper leaves (signifying poor penetration), whereas a significantly lower CV demonstrates that droplets have successfully bypassed the upper foliage barrier and are distributed evenly into the middle and lower layers.
For droplet density, the treatment with a droplet size of 200 μm and a spray volume of 30.0 L·ha−1 exhibited the best penetration performance, followed by the treatment with a droplet size of 200 μm and a spray volume of 22.5 L·ha−1, which had a CV of 28.8%. For droplet coverage, the optimal penetration was achieved with the 200 μm droplet size combined with a spray volume of 22.5 L·ha−1, resulting in a CV of 27.6%. These results are generally consistent with the observed trends in droplet density and droplet coverage.
3.4. Effects of Spray Volume and Droplet Size on Pest and Disease Control Efficacy
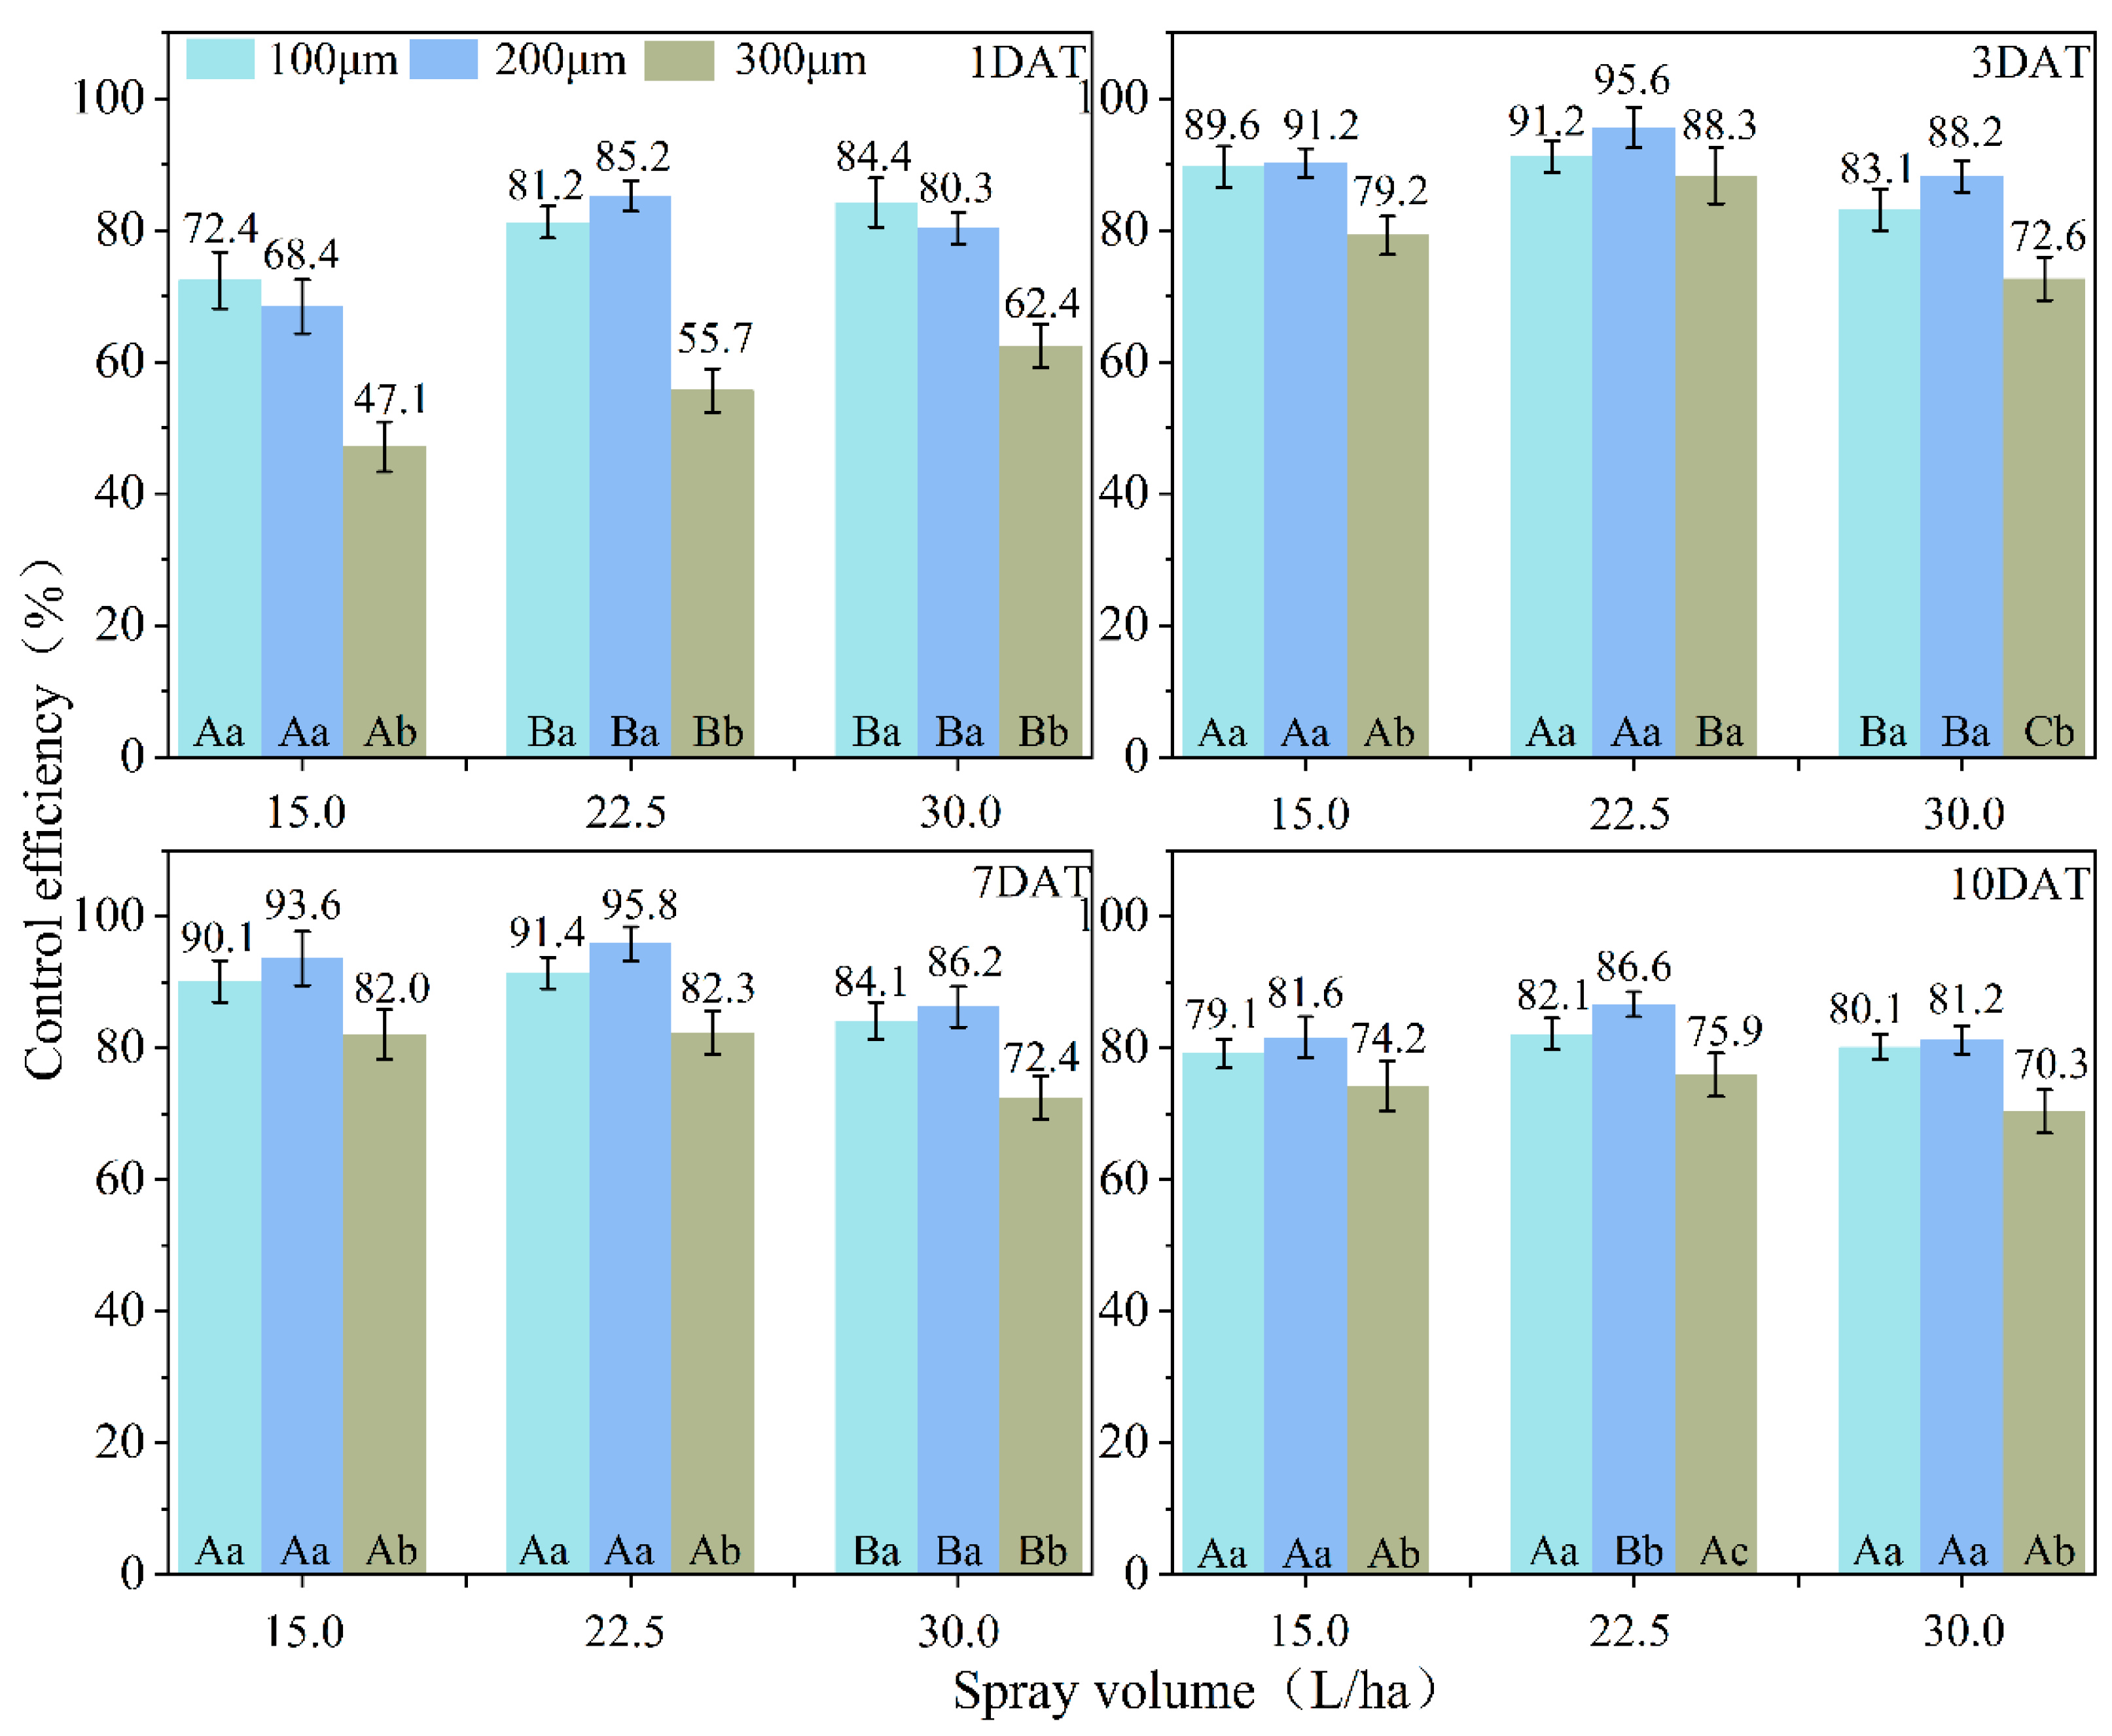
Figure 9 illustrates the effects of spray volume and droplet size on pest and disease control efficacy. Different combinations of spray volume and droplet size resulted in varying levels of control efficacy against maize pests and diseases. As shown in the figure, no significant differences in control efficacy were observed between droplet sizes of 100 μm and 200 μm across the four post-application assessment periods, except for the treatment with a spray volume of 22.5 L·ha
−1 and a droplet size of 200 μm at 10 days after application.
Treatments with a droplet size of 300 μm exhibited significantly lower control efficacy compared with the smaller droplet sizes (for instance, at 7 days after application under 22.5 L·ha−1, the efficacy of 300 μm droplets was 82.3%, which is quantitatively 14.1% lower relative to the 95.8% achieved by 200 μm droplets). Among all treatments, the combination of a spray volume of 22.5 L·ha−1 and a droplet size of 200 μm achieved the highest control efficacy, reaching a maximum of 95.8% at 7 days after application (representing a quantitative relative improvement of 16.4% compared to the 300 μm treatment at the same volume).
Overall, higher control efficacy was observed at 3 and 7 days after application, while a decline was noted at 10 days after application; however, the minimum efficacy remained at 86.6%. Increasing spray volume generally enhanced pest and disease control efficacy, particularly in treatments with droplet sizes of 100 μm and 200 μm. In contrast, treatments with a droplet size of 300 μm showed reduced control efficacy, which can be attributed to decreased droplet density, coverage, and canopy penetration associated with larger droplets, ultimately leading to lower pest and disease suppression.
3.5. Effects of Spray Volume and Pesticide Application Rate on Pest and Disease Control Efficacy
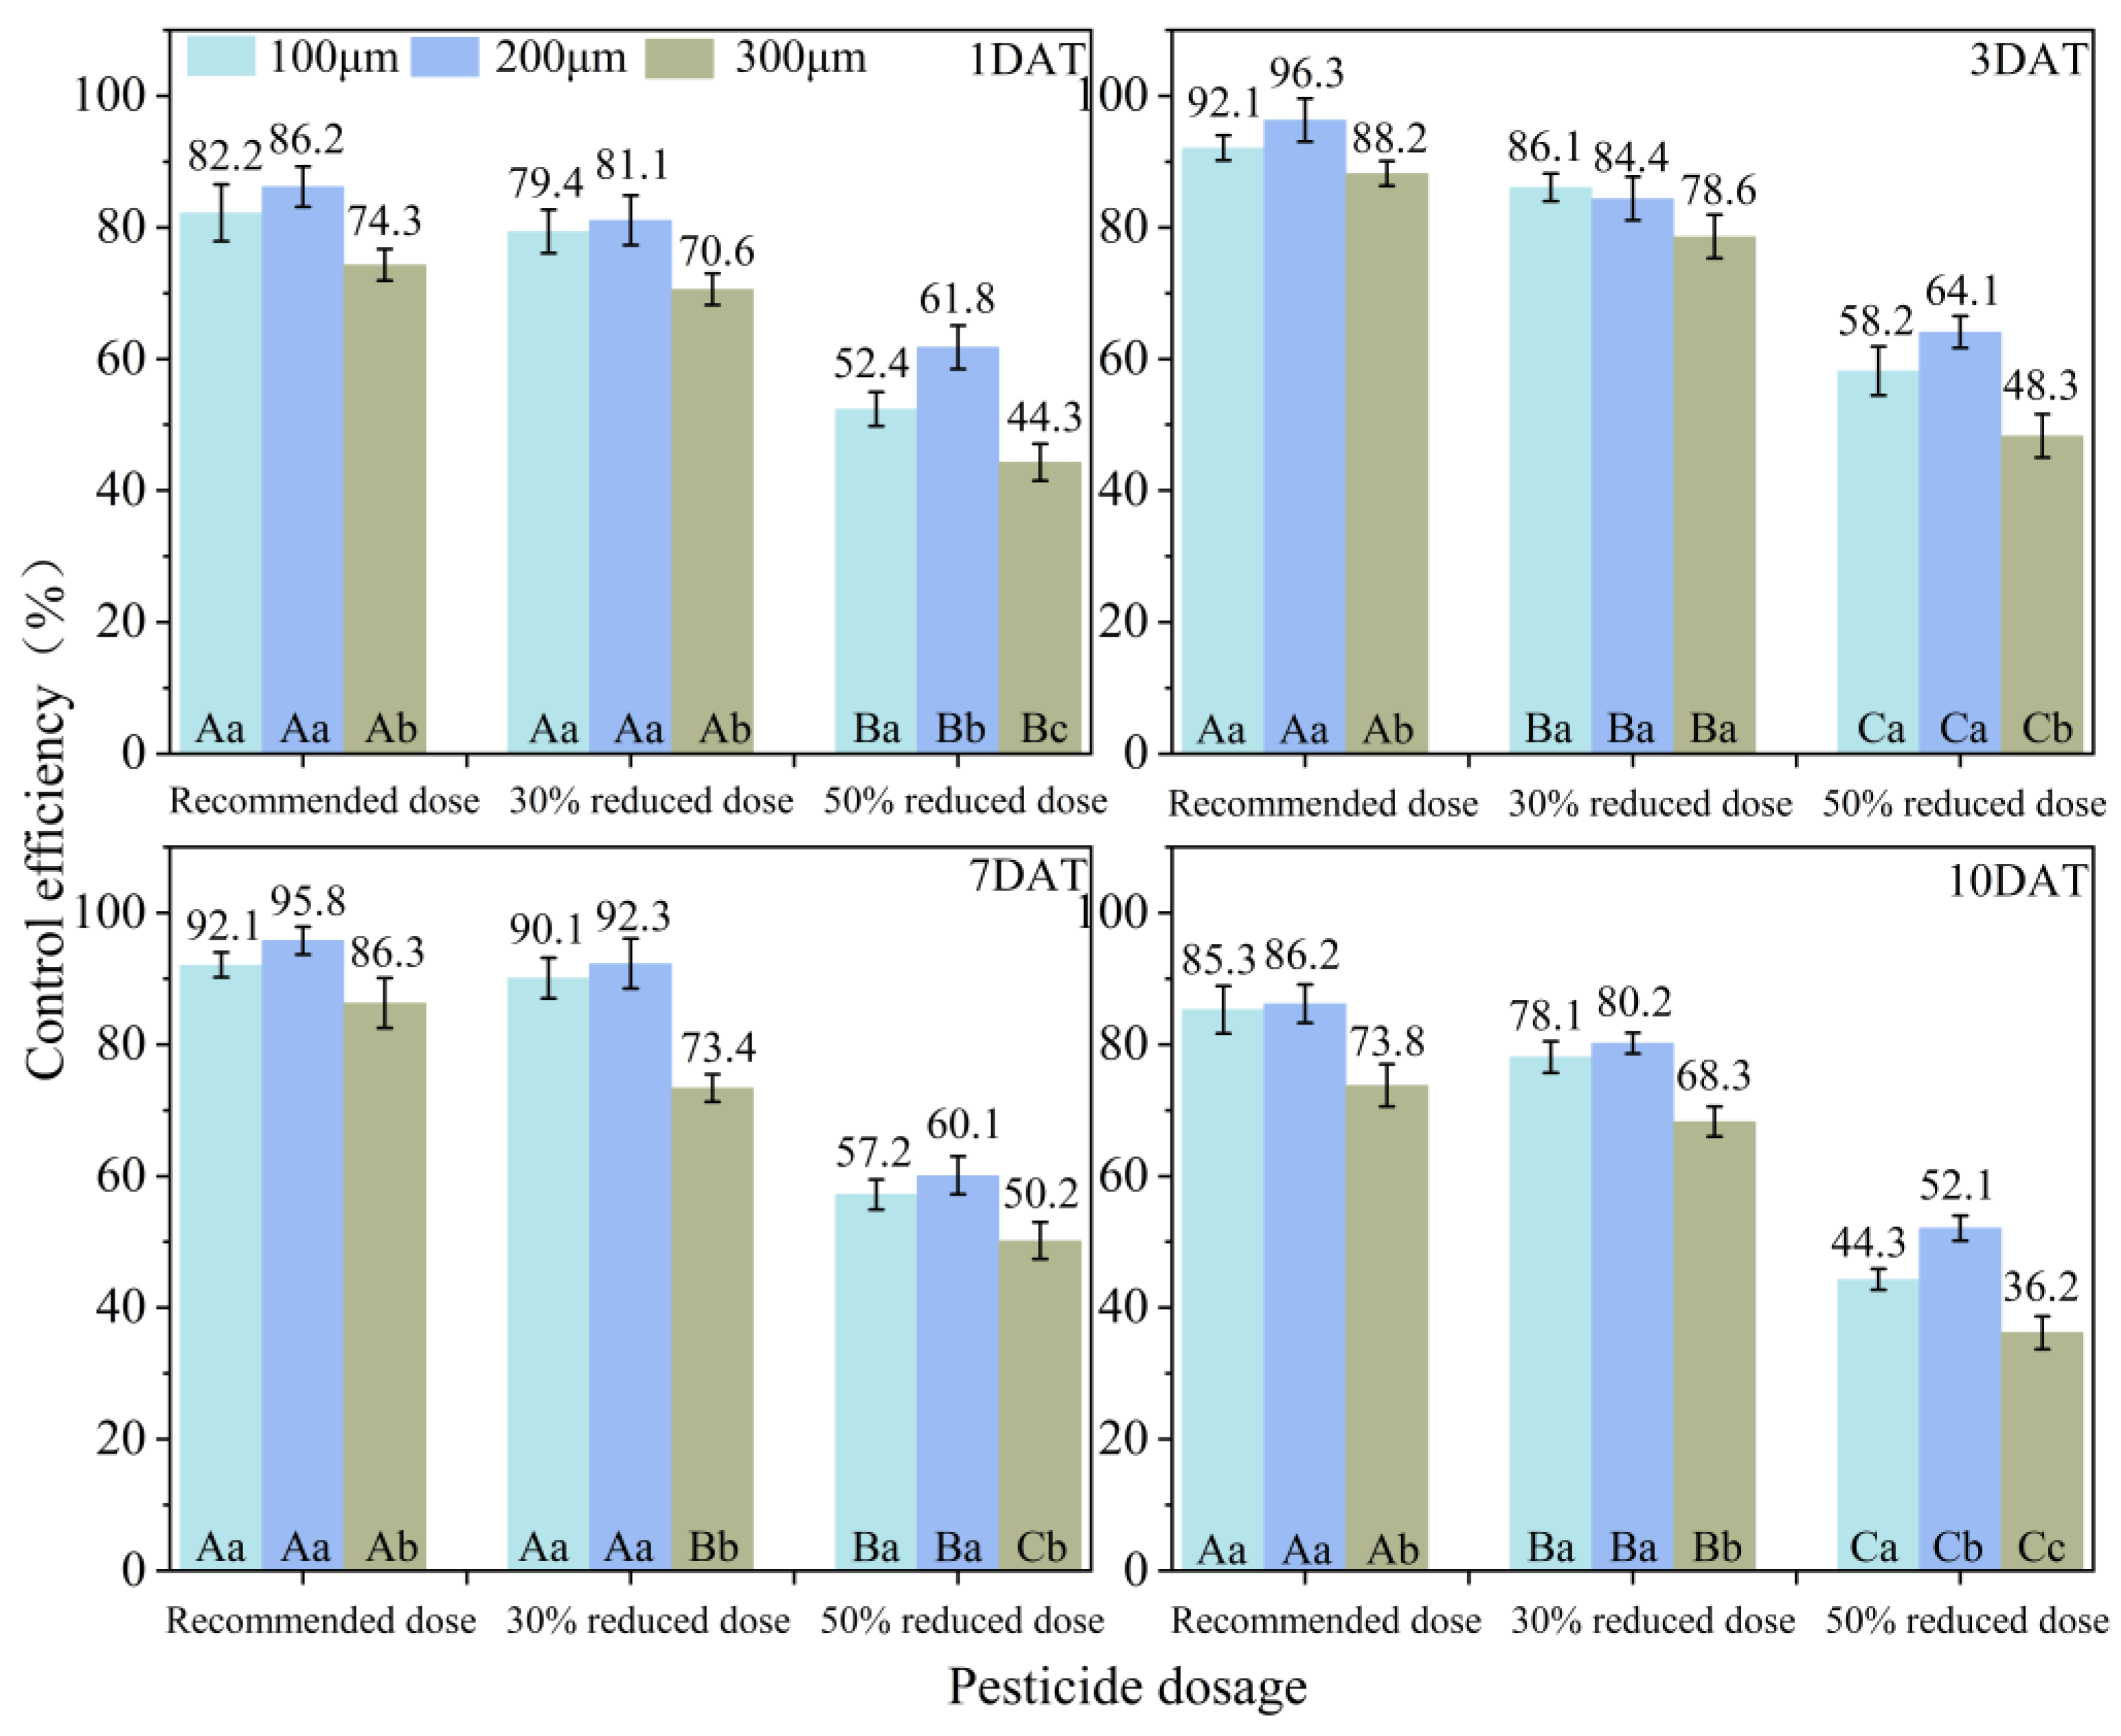
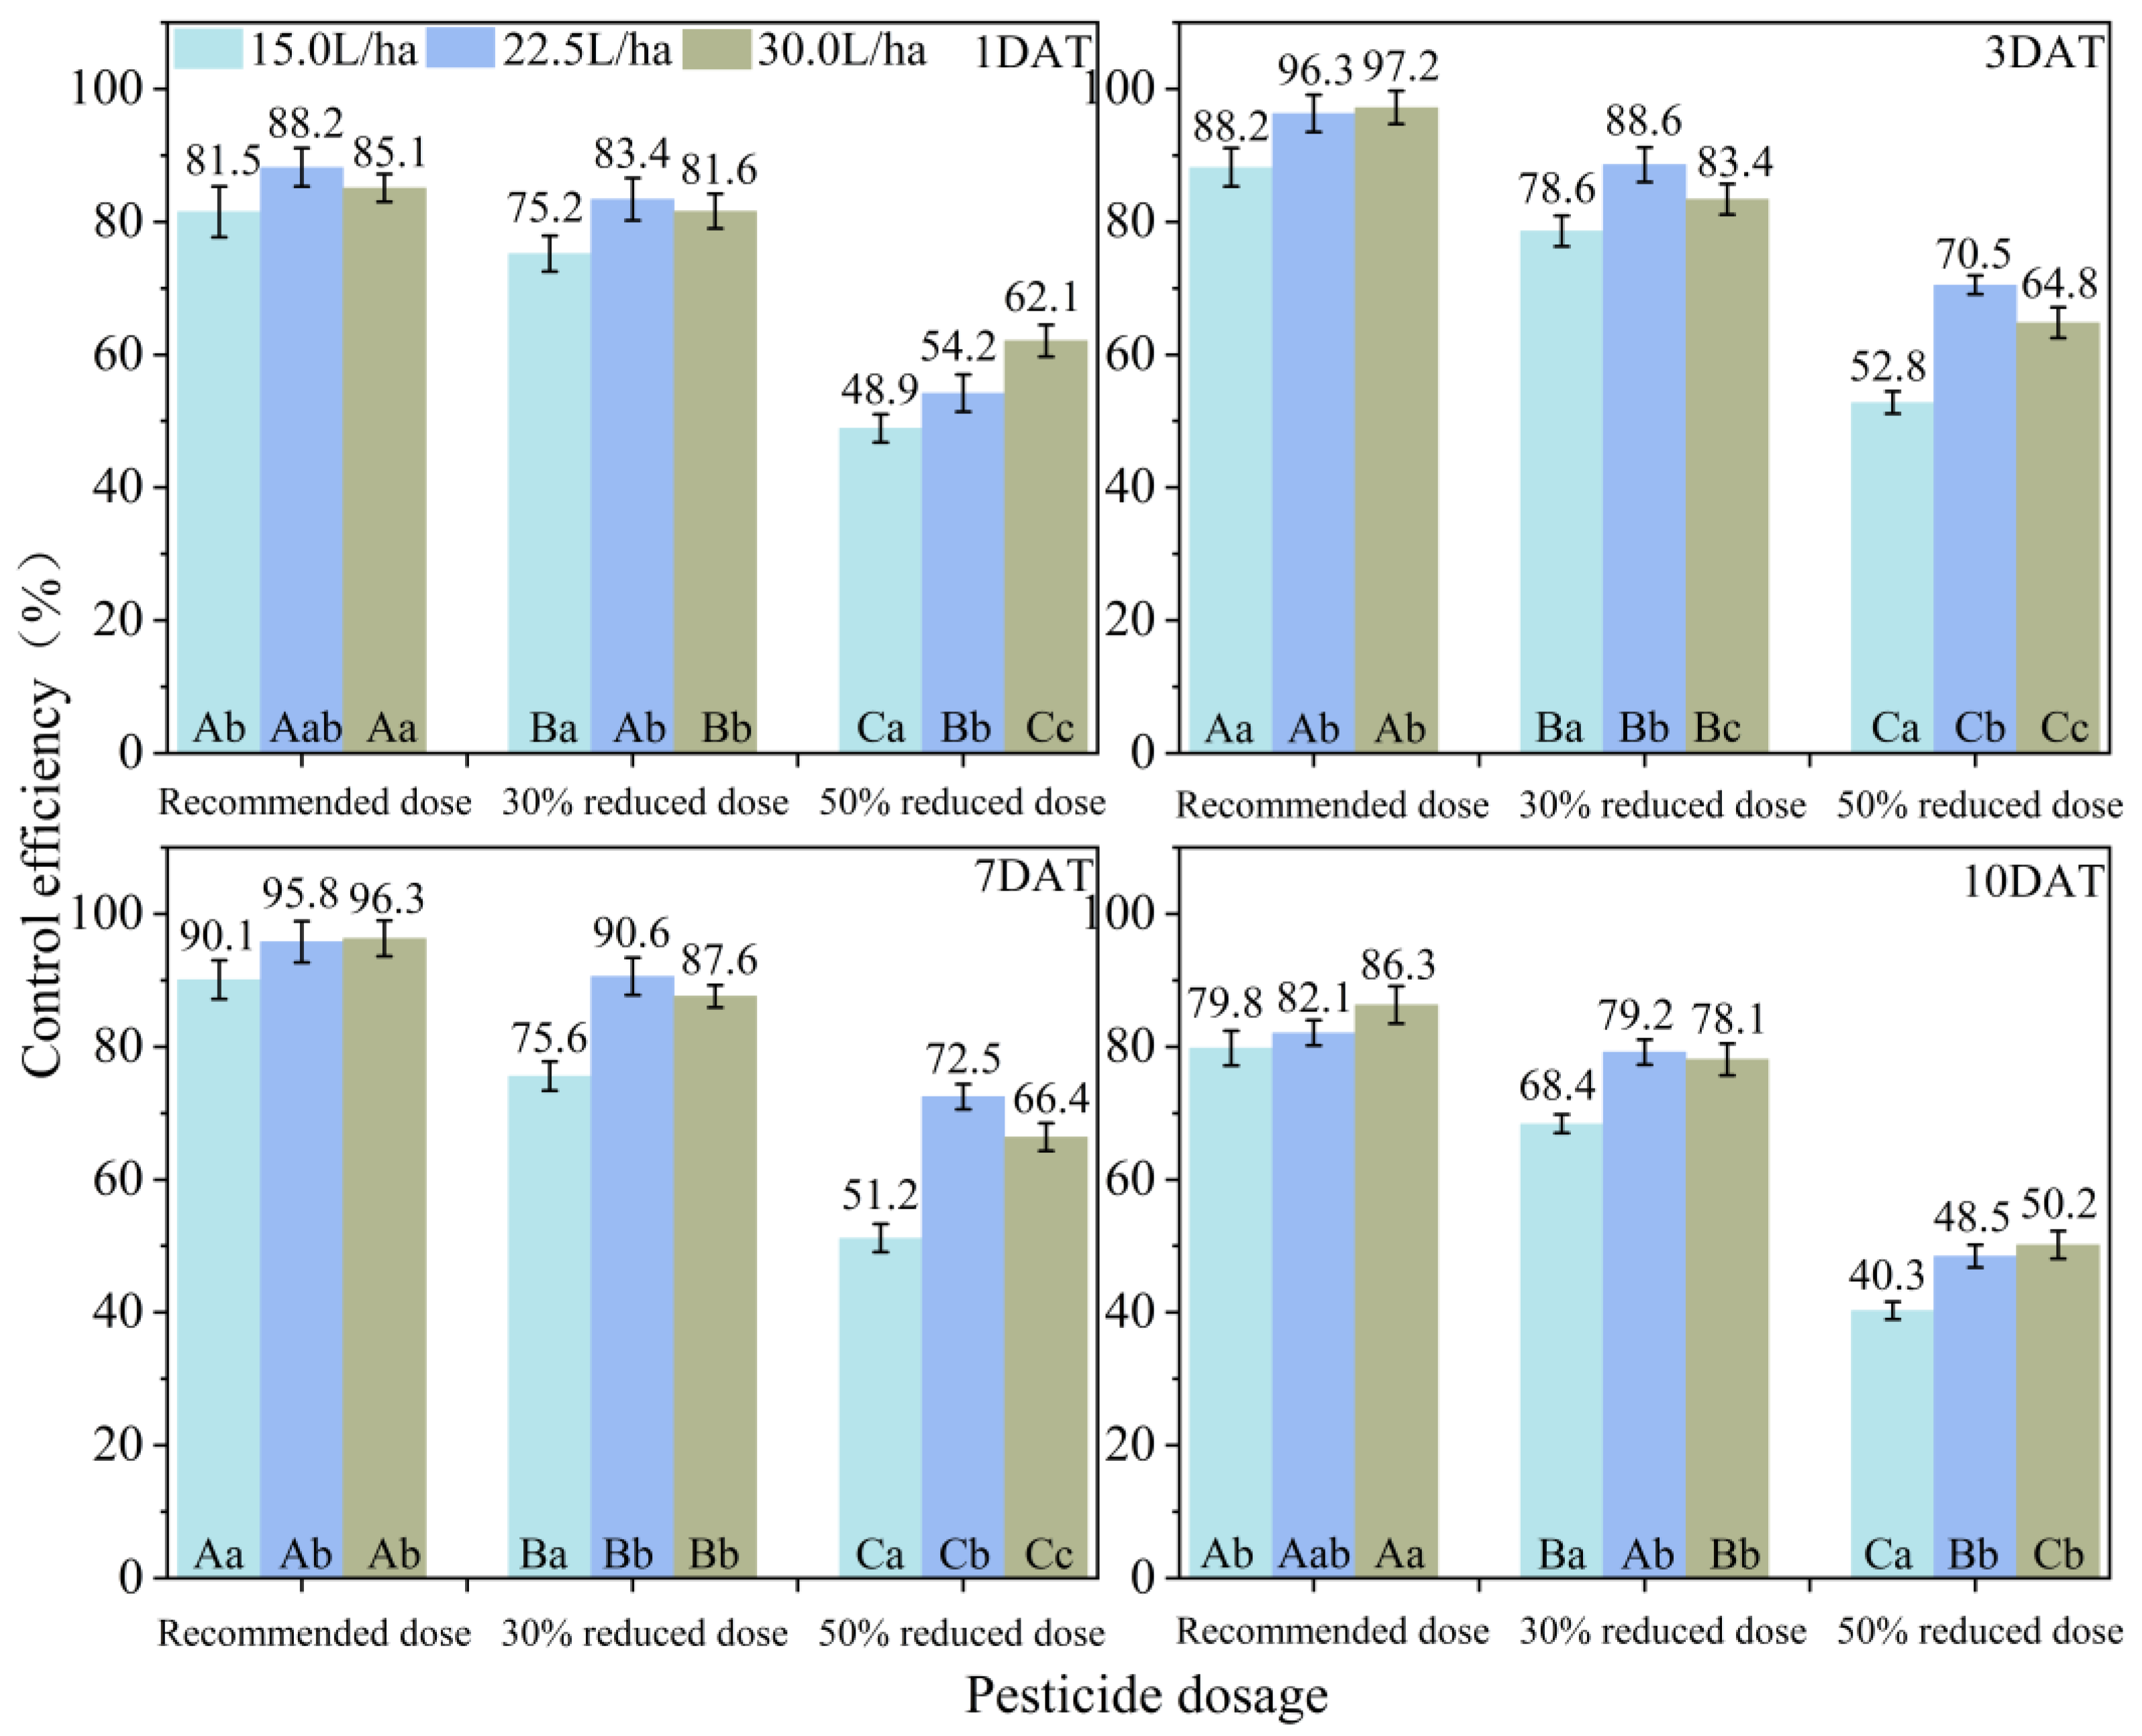
Figure 10 illustrates the effects of spray volume and pesticide application rate on pest and disease control efficacy. As shown in the figure, spray volume and pesticide application rate exerted different influences on control efficacy. Higher control efficacy was generally observed on the 3rd and 7th days after application, whereas a decline in efficacy occurred on the 10th day after application.
With respect to spray volume, control efficacy increased with increasing spray volume; however, for most treatments, no significant differences were observed between the spray volumes of 22.5 and 30.0 L·ha−1 in terms of pest and disease control. The reduction in pesticide application rate had a significant impact on control efficacy. Application at the recommended dose resulted in relatively high control efficacy. A 30% reduction in pesticide application slightly decreased control efficacy, but the difference compared with the recommended dose was not substantial, and effective pest control could still be achieved. In contrast, the 50% reduction treatment exhibited the lowest control efficacy, with a maximum value of 72.5%, which was insufficient to provide effective control of maize pests and diseases.
3.6. Effects of Droplet Size and Pesticide Application Rate on Pest and Disease Control Efficacy
Figure 11 illustrates the effects of droplet size and pesticide application rate on the control efficacy of maize pests and diseases. As shown in the figure, both pesticide dose reduction and droplet size significantly influenced pest and disease control efficacy. Among all treatments, the lowest control efficacy was observed at 1 day and 10 days after application, indicating that a second spray application should be conducted around 10 days after the initial treatment.
The effects of reduced pesticide application rates were generally consistent with those reported in
Section 3.5. Treatments with a 50% reduction in pesticide dosage exhibited the poorest control efficacy. Among all droplet size treatments, droplets with a diameter of 200 μm generally achieved higher control efficacy. However, no significant differences were observed between the 200 μm and 100 μm droplet treatments.
Notably, droplet deposition tests showed that the 100 μm droplets resulted in higher droplet density and coverage than the 200 μm droplets. This discrepancy may be attributed to the pubescent structure of maize leaves, which may promote faster evaporation of smaller droplets (100 μm), thereby reducing their effective persistence and ultimately leading to lower pest and disease control efficacy.
3.7. Changes in Contact Angles of Different Pesticide Solutions on Maize Leaves
To provide a microscopic mechanistic explanation for the macroscopic field efficacy observed in the UAV application trials (Part 1), laboratory experiments were conducted to evaluate the dynamic wetting behaviors of six representative pesticide solutions, including conventional and nano-pesticide formulations. By systematically comparing the contact angles and spreading characteristics of these solutions in the laboratory, this section aims to demonstrate the superior interfacial properties of nano-pesticides. These microscopic advantages theoretically elucidate how the specific nano-formulations applied in the field could effectively compensate for the reduced spray volume and dosage, thereby securing the high control efficacy reported earlier.
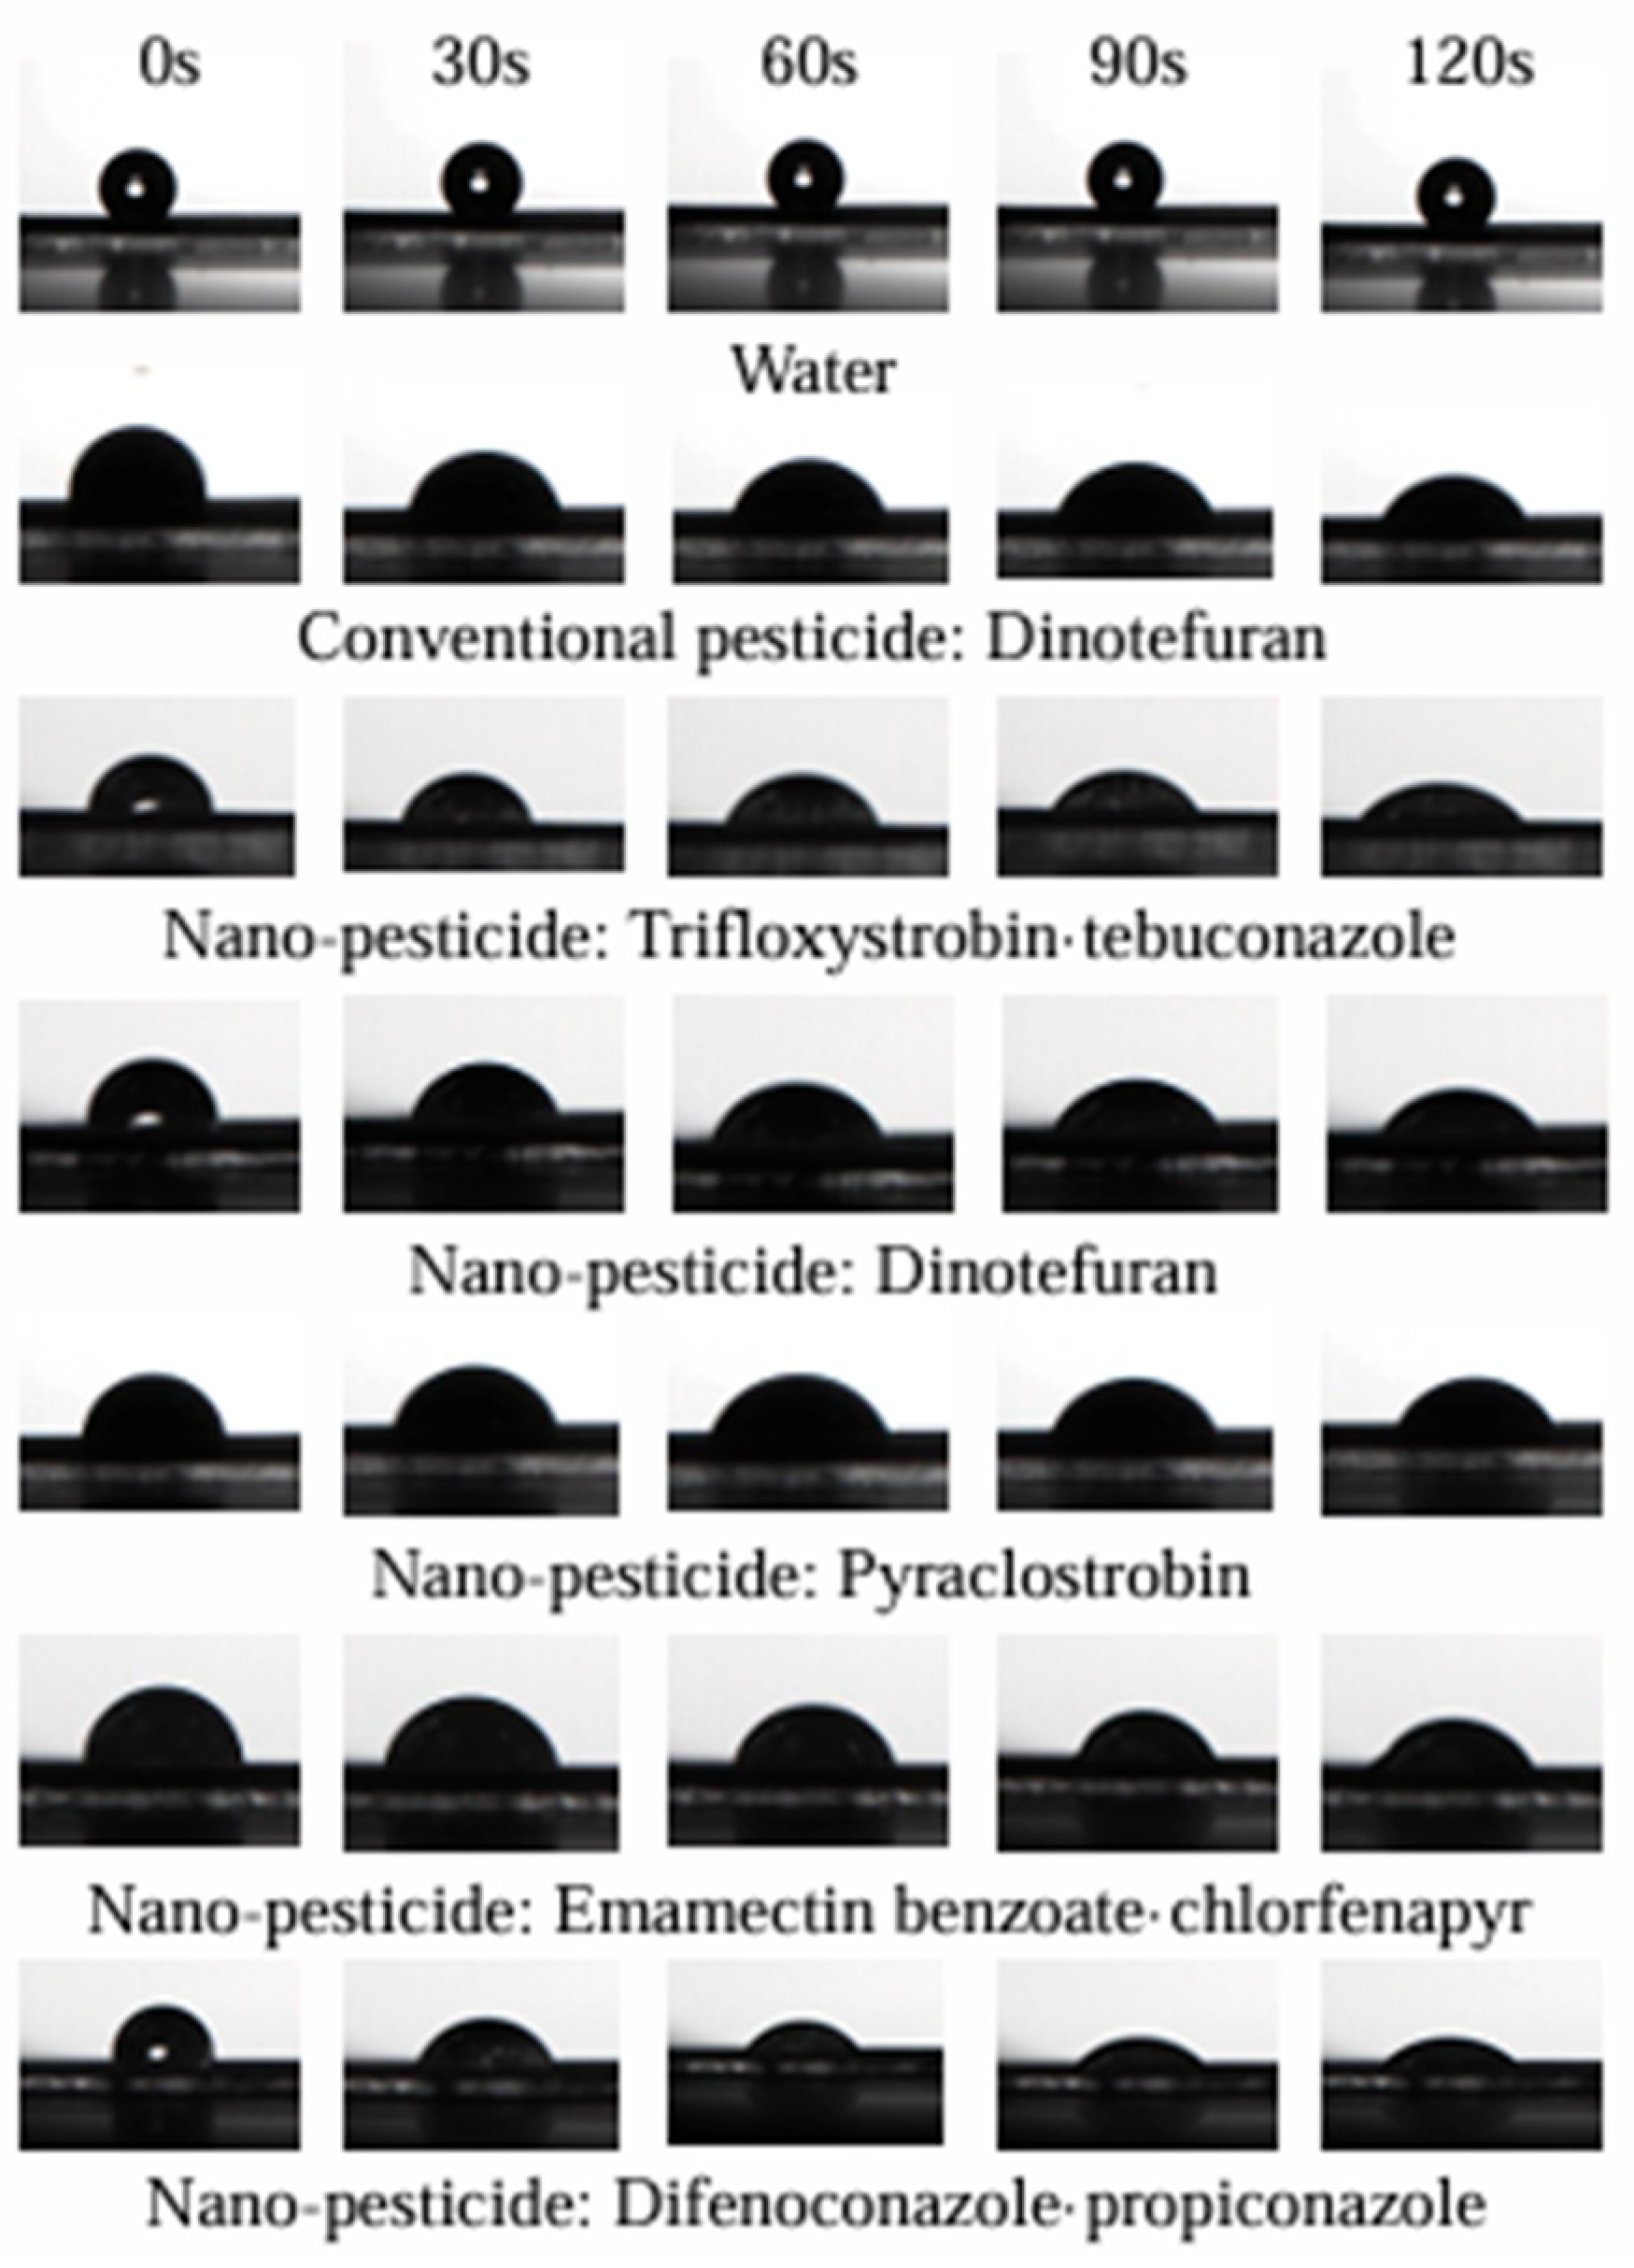
Table 7 summarizes the measured contact angles of various solutions on maize leaves, illustrating a progressive decline in contact angle over time for all tested formulations. For the pure water control, the contact angle ranged from 112.78° to 108.21°, representing a marginal reduction rate of only 3.81%. Among all tested solutions, only conventional Dinotefuran and Difenoconazole–Propiconazole exhibited initial contact angles (at 0 s) exceeding 90°. Notably, the contact angle of Difenoconazole–Propiconazole plummeted to 28.24° by 120 s, a reduction of 50.16% relative to conventional Dinotefuran. Within the nano-pesticide group, with the exception of Difenoconazole–Propiconazole, all formulations displayed initial contact angles below 90°, suggesting that these solutions effectively achieved a hydrophilic state on the maize leaf surfaces upon contact. Trifloxystrobin–Tebuconazole maintained relatively low contact angles at both 0 and 120 s, although its overall reduction rate was limited to 38.49%. Across the spectrum of pesticide solutions, Pyraclostrobin exhibited the minimum reduction rate of 26.30%, whereas Difenoconazole–Propiconazole showed the maximum reduction rate of 54.48%. The ultimate contact angles of the pesticide droplets were generally consistent with the magnitude of their surface tensions. Notably, while surface tension measurements revealed no significant differences between nano-Dinotefuran and Pyraclostrobin, their contact angles at 120 s differed significantly; this discrepancy is likely attributable to differences in formulation viscosity.
Figure 12 provides a visual representation of the contact angles for different solutions on maize leaves, with the observed trends aligning with the numerical data presented in
Table 7.
3.8. Effects of Different Solutions on Wetting Performance and Viscosity
Table 8 illustrates the effects of various solutions on the wetting performance and viscosity of droplets. The data reveal that different formulations exerted distinct influences on both wetting area and viscosity. In the wetting area tests, water, conventional Dinotefuran, and nano-pesticide Pyraclostrobin all exhibited a wetting area of 1. These were followed by nano-pesticides Dinotefuran and Emamectin benzoate–chlorfenapyr, while Trifloxystrobin–tebuconazole and Difenoconazole–propiconazole demonstrated the optimal wetting performance. Regarding viscosity, the values for different solutions ranged between 0.96 and 1.96 cP. Specifically, water recorded the lowest viscosity, whereas the nano-pesticide Pyraclostrobin displayed the highest value, representing a 104.17% increase compared to water. Notably, nano-pesticides consistently exhibited higher viscosity than conventional formulations, a phenomenon primarily attributable to their specific chemical compositions. While the wetting area of a droplet is fundamentally governed by surface tension—where lower tension typically facilitates wetting and spreading—conventional Dinotefuran and nano-pesticide Pyraclostrobin yielded identical wetting areas despite a significant difference in their surface tensions. This discrepancy is explained by the critical role of viscosity, which influences the spreading dynamics of droplets, ultimately resulting in equivalent wetting areas in these instances.
4. Discussion
This study investigated the effects of varying spray volumes, droplet sizes, and nano-pesticide dosages on droplet deposition characteristics across different layers of a high-density maize canopy, as well as their control efficacy against pests and diseases. At spray volumes of 15.0 and 22.5 L/ha, droplet density and coverage exhibited a vertical distribution pattern within the maize canopy, peaking in the upper layer and progressively decreasing toward the middle and lower layers. This indicates that the closed crop canopy exerted a strong interception effect on the droplets, thereby capturing the highest deposition. This observation is consistent with the findings of Lefrancq et al. [
18] regarding spray deposition distribution in crop canopies. Significance analysis revealed no significant differences in droplet density and coverage between the spray volumes of 22.5 and 30.0 L/ha. This primarily occurred because, once the spray volume reached a certain threshold, the droplets easily overlapped on the water-sensitive papers (or leaves), consequently preventing any further significant increase in the observed density and coverage [
19,
20]. Furthermore, research by Berger-Neto et al. [
21] corroborated that an excessively high application volume causes the majority of droplets to flow to the ground rather than to deposit effectively on the crop surface. This provides a sound explanation for why the deposition metrics did not improve under the high-volume treatment in our study. Regarding droplet size, treatments with 100 μm and 200 μm droplets resulted in significantly higher droplet density and coverage compared to the 300 μm treatment. Fine droplets generally possess superior penetrability and can be driven into the middle and lower canopy layers by the UAV downwash airflow. In contrast, coarse droplets are more prone to being intercepted by the upper canopy or lost to bouncing and spray runoff [
22].
The experimental results indicated that spray volume, droplet size, and pesticide dosage exerted distinct effects on the control efficacy against maize pests and diseases. The optimal control efficacy was achieved at a spray volume of 22.5 L/ha and a droplet size of 200 μm. Although deposition evaluations revealed that the droplet density of the 100 μm treatment was slightly higher than that of the 200 μm treatment, there was no significant difference in their final control efficacies. In fact, each deposited droplet possesses a specific biological control range, and higher droplet density and coverage do not necessarily translate to improved control efficacy [
23,
24]. Wang et al. [
11] reached similar conclusions in their experiments evaluating the spray parameters of plant protection UAVs. Regarding nano-pesticide dosage, this study found no significant difference in control efficacy between a 30% dosage reduction and the recommended dosage. Crop leaf surfaces typically feature specific microstructures that hinder the adhesion of conventional spray liquids [
25]. However, nano-pesticide carriers can significantly modify the interfacial physicochemical properties of the liquid [
26]. Consistent with this, our microscopic characterization confirmed that the nano-pesticide significantly reduced the contact angle on hydrophobic maize leaves, dramatically enhancing interfacial spreading and adhesion. Research by Gitsopoulos et al. [
27] demonstrated that enhancing the interfacial properties of the spray liquid can significantly increase its retention and diffusion on leaves. From a nanochemical perspective, the incorporated nanoparticles and specialized surfactants dynamically alter the surface energy of the liquid–air interface. During the physical process of droplet impact, these nanoscale components induce a ‘micro-pinning effect’ at the three-phase contact line, effectively dissipating kinetic energy and suppressing droplet rebound and splash on the hydrophobic maize leaf surface [
28]. It is precisely this excellent microscopic wetting mechanism that effectively compensates for the limitations of low-volume spraying in terms of physical deposition quantity, fundamentally explaining why the nano-pesticide maintained robust field control efficacy even under a 30% dosage reduction in this experiment. However, when the dosage reduction reached 50%, the control efficacy dropped drastically below 72.5%, which aligns with the conclusion of Gimenes et al. [
29] that absorption and control efficacy are severely compromised once the effective concentration of the spray liquid falls below a critical threshold.
The experimental results indicated that spray volume, droplet size, and pesticide dosage exerted distinct effects on the control efficacy against maize pests and diseases. The optimal control efficacy was achieved at a spray volume of 22.5 L/ha and a droplet size of 200 μm, reaching a remarkable peak of 95.8%. This exceptional performance warrants a deeper mechanistic discussion, as it represents a strong physical–chemical synergy. Physically, this optimized UAV parameter combination ensured deep canopy penetration, precisely delivering the active ingredients to the hidden microhabitats of pests. Chemically, the applied nano-pesticide formulation exhibited superior interfacial wetting behavior (as evidenced by a 54.48% reduction in the final contact angle), maximizing droplet adhesion and retention on hydrophobic maize leaves. This dual enhancement—maximizing both the UAV’s delivery efficiency and the formulation’s adhesion efficiency—provides a solid mechanistic basis for this high control rate.
In terms of overall control efficacy, all treatments maintained a high level of efficacy at 3 and 7 days after application (DAA); however, a pronounced decline in control efficacy was observed by 10 DAA. This highlights the inherent limitations regarding the persistence of a single low-volume application by plant protection UAVs. In summary, an appropriate synergy of physical parameters (22.5 L/ha and 200 μm) effectively balances droplet deposition and penetration within the closed canopy, while the incorporation of nano-pesticides successfully secures robust control efficacy even with a 30% dosage reduction. This study confirms the feasibility of this parameter combination for precision plant protection in maize. However, a key limitation is that these specific parameters are closely associated with the downwash airflow characteristics of the heavy-duty DJI T50 UAV. Therefore, future research should validate these findings across different UAV platforms and crop architectures, as well as further investigate the role of various anti-evaporation adjuvants in extending the duration of efficacy, with the aim of providing comprehensive decision-making support for full-cycle pest management in field crops.
5. Conclusions
This experiment studied the effects of varying spray volumes, droplet sizes, and nano-pesticide dosages on droplet deposition characteristics and the control efficacy against pests and diseases in high-density maize during the mid-to-late growth stages. The results showed a significant difference in droplet deposition among the different spray volumes and droplet size treatments. Droplet density and coverage within the closed canopy exhibited a vertical distribution pattern, peaking in the upper layer. There were no significant differences in droplet deposition between the spray volumes of 22.5 and 30.0 L ha−1. Treatments with 100 μm and 200 μm droplets resulted in significantly higher deposition metrics and canopy penetration than the 300 μm treatment. Significant differences also existed in the control efficacy among the varying parameter combinations. The UAV spray treatment with an application volume of 22.5 L ha−1 and a droplet size of 200 μm achieved the optimal control efficacy. Although 100 μm droplets yielded slightly higher droplet density, their final control effect showed no significant difference compared to 200 μm droplets. Furthermore, the nano-pesticide treatment with a 30% dosage reduction showed no significant difference in control efficacy compared to the recommended dosage, whereas a 50% reduction led to a drastic decline in efficacy to below 72.5%. Fundamentally, these results demonstrate a successful multidisciplinary integration of physics (UAV droplet delivery), chemistry (nano-pesticide interfacial adhesion), and biology (pest mortality). By synergizing targeted physical deposition with enhanced chemical wetting, robust biological control was secured even at a reduced dosage. Considering the operational effectiveness of the plant protection UAV, droplet deposition quality, and actual disease control efficacy, it is recommended to use a spray volume of 22.5 L ha−1, a droplet size of 200 μm, and a 30% reduction in nano-pesticide dosage for field operations. This study proved the feasibility of utilizing this optimized multi-parameter combination to control maize pests and diseases, providing core technological support for precision application and pesticide reduction with efficiency enhancement in high-density maize cultivation.



 and
and