Article

Integrated Assessment of Bio-Based Phosphorus Fertilizers as an Alternative to Mineral Fertilizers


by
Nieves Nunez-Romero
1,*,
Barbara J. Cade-Menun
2,
Ana M. García-López
1,
Jose Manuel Quintero
1 and
Antonio Delgado
1,*
1
Department of Agronomy, University of Seville, 41013 Sevilla, Spain
2
Agriculture and Agri-Food Canada, Swift Current Research and Development Centre, Swift Current, SK S9H 3X2, Canada
*
Authors to whom correspondence should be addressed.
Agronomy 2026, 16(11), 1058; https://doi.org/10.3390/agronomy16111058
Submission received: 8 April 2026 / Revised: 20 May 2026 / Accepted: 25 May 2026 / Published: 27 May 2026

Abstract

Sustainable phosphorus (P) management in agriculture requires a circular economy approach through the use of so-called bio-based fertilizers (BBFs). The properties of BBFs vary widely depending on raw materials and production processes. However, it is still unknown how these properties, and particularly the dominant P compounds determine not only the efficiency of BBFs in supplying P to crops, but also their effects on soil functioning and crop quality. This study aimed to evaluate the efficiency of a representative set of BBFs, and relate this efficiency to their composition and dominant P compounds. To this end, 14 BBFs were studied: four from water purification (struvite, vivianite, and sewage sludge with and without composting), four composts (municipal solid waste (MSW), vineyard residues, and two using olive husks), three vermicomposts (two homemade and one commercial), fish meal, digestate, and a commercial organic fertilizer. Phosphorus forms in BBFs were determined using 31P nuclear magnetic resonance spectroscopy (P-NMR). The BBFs were compared to a single superphosphate (SSP) in a pot experiment growing wheat in two different alkaline soils, one rich in iron (Fe) oxides and one rich in carbonates. The effects on critical elements in grain [magnesium, Fe, zinc (Zn), manganese, and copper] and enzyme activities related to soil functioning and P cycling were also assessed. The dominant P compound in the BBFs was orthophosphate (73.8–89.5% of the total P in the NaOH–EDTA extracts). The MSW had the highest polyphosphate content (4.1%), a complex inorganic P compound. The organic P content ranged from 9.2% (fish meal) to 25.5% (Moge). Sewage sludge and composted sludge contributed high levels of phosphonates (4.1 and 5.6% of extracted P). The most abundant organic P compound class was inositol hexakisphosphates (IHPs), and myo-IHP (phytate) was the dominant IHP stereoisomer (1.2–6.4%) followed by D-chiro-IHP and scyllo-IHP. Plant dry matter and grain yield with most BBFs were not significantly different from that of SSP in both soils, likely due to the high concentrations of phosphate in relatively soluble forms in most of the BBFs. Vivianite and sewage sludge resulted in significantly higher grain yield than SSP (43% and 40%, respectively) in the carbonate-rich soil, likely due to progressive phosphate dissolution, which decreased the precipitation rate of insoluble calcium (Ca) phosphates. The highest P recoveries were obtained with horse manure vermicompost (65% and 15% higher than SSP in the Fe oxide-rich and in the carbonate-rich soil, respectively), partially attributed to the decreased precipitation rate of insoluble Ca phosphates with the added organic matter. Some BBFs increased micronutrient concentrations in grains and most decreased the P-to-Zn ratio relative to SSP. Overall, phosphatase and β-glucosidase activities increased with carbon-rich BBFs. Most of the studied BBFs could effectively replace fertilizers from non-renewable sources, in some cases with better crop P recoveries. Furthermore, some BBFs could provide additional benefits to grain quality, in terms of micronutrient supply for humans, and soil functioning.

1. Introduction

Phosphorus (P) is an essential element for plants; therefore, an adequate P supply is necessary to meet crop requirements, guaranteeing agricultural production [1]. Mineral P fertilizers are produced from phosphate rock, a finite and strategic mineral resource produced only in certain countries and unidirectionally imported to others [2,3]. Furthermore, the concentration of rock phosphate reserves in some regions makes its supply and price sensitive to geopolitical issues [4,5]. At the same time, non-sustainable fertilization, with an excessive fertilizer supply relative to crop needs, causes high P loss from agricultural land, leading to environmental impacts such as the eutrophication of waterbodies [6]. The inefficient use at a societal scale exacerbates P losses, mainly from food processing and low P absorption from animal and human diets, which explains why a significant fraction of the P in food ultimately accumulates in manure and wastewater [7,8].
Human activity produces significant quantities of P-containing waste, the treatment of which is costly and may have serious environmental impacts [9,10]. The EU-28 (28 EU Member States) estimated that 86 million tons of bio-waste were generated in 2017, 34% of which was municipal solid waste [11,12,13]. The use of sewage sludge and compost as fertilizers is a common practice for nutrient recycling [14], with composting proven effective in reducing pathogen content [15]. However, even when complying with regulatory limits, repeated applications can elevate metal concentrations, necessitating an assessment of their mobility and bioavailability across plant-soil systems [16,17]. Additionally, PFAS, antimicrobials, and persistent organic pollutants must also be considered [17]. Valorizing waste for fertilizer production using a circular economy approach would provide societal benefits: less dependence on non-renewable resources for food production, as well as a decreased environmental impact of waste disposal [7,18,19]. The new EU fertilizer directive [20] promotes the use of by-products as fertilizers. The term bio-based fertilizers (BBFs) refers to materials or products derived from biomaterials (of plant, animal, or microbial origin, often waste, residues, or side streams from agriculture, industry, or society) with a nutrient content available to plants that makes them suitable for use as fertilizer [21,22]. Not all BBFs are organic products; some processes, such as pyrolysis or struvite or vivianite precipitation in wastewater treatment, remove organic carbon (C), thus increasing nutrient concentration per kg of BBF [23,24]. The use of these fertilizers is incipient, and new methods and optimization of current technologies are required to obtain safe BBFs that are acceptable for farmers. The fertilization efficiency of recycled P fertilizers, which can be defined as the proportion of applied P used by crops or the yield per unit of applied P, has been evaluated in several studies [12,25,26,27,28,29]. However, it is necessary to test a wide range of products from representative raw materials and production processes under different soil and crop conditions and study their properties and P compounds to explain their efficiency as P fertilizers. This will provide the necessary knowledge base to understand the efficiency of BBFs and formulate practical recommendations in the selection of the best BBFs depending on environmental conditions and crops. In addition to determining P compounds in BBFs, understanding P bioavailability in BBFs is crucial for effective P recycling and fertilizer management [30]. This availability depends on the P compounds present in BBFs and their transformations and binding when applied to soil [21,31].
The most efficient technique for identifying and quantifying P compounds in fertilizers is 31P nuclear magnetic resonance spectroscopy (P-NMR). This spectral technique detects inorganic forms of P (orthophosphate, pyro-, and polyphosphates) and organic forms, i.e., those where P is bound to C either directly (phosphonates) or indirectly via ester bonds (orthophosphate monoesters and diesters). Stereoisomers of inositol hexakisphosphate (IHP) are the most abundant orthophosphate monoesters and major organic P forms in organic fertilizers [32], and myo-IHP (phytate), a P storage compound in plants, is the most abundant of these stereoisomers in soils and organic fertilizers. Organic P compounds are not directly available to plants and must be mineralized to release phosphate (the only P form taken up by plants) in the soil. However, this mineralization can be constrained when organic P compounds are strongly bound to the solid phase as is often the case for phytate and DNA [32]. In addition to P, BBFs may supply other important elements. Half of the world’s population, which bases its diet on cereal consumption, has nutritional deficiencies in micronutrients, particularly iron (Fe) and zinc (Zn) [33,34]. Phosphate and Zn can both be adsorbed on Fe oxides; therefore, phosphate fertilization can decrease Zn availability to plants by enhanced co-adsorption of both elements on Fe oxides, and this Zn adsorption at basic pH is almost irreversible [33]. In addition to hindering Fe absorption by plants, excessive P levels in soils with basic pH can decrease the release of Fe from soil due to the phosphate adsorption on Fe oxides, thus increasing deficiency problems [34]. In addition, P fertilization can increase the phytate-to-micronutrient ratio in grains, worsening digestibility of these nutrients [35,36]. However, some BBFs can increase the grain quality of cereals by increasing the micronutrient content and decreasing the P-to-micronutrient ratio [30]. Appropriate fertilization can improve the necessary balance between yield and quality for human nutrition, i.e., quality improvement should not be detrimental to crop yields. In addition, it is important to assess how alternative fertilizers affect soil functioning, with a particular focus on nutrient cycling capacity, as this may enhance the use by plants of residual fertilizer P and other soil P forms [37]. Any assessment of alternative fertilizer use should consider the crop, the type of fertilizer, soil characteristics, application rate, and climatic conditions.
This study assessed the fertilizer efficiency of 14 different BBFs obtained from various raw materials and production processes as alternatives to mineral P fertilizers, explaining their efficiency in terms of their properties, composition, and P compounds as determined by P-NMR. The potential benefits on the concentrations of micronutrients and P-to-Zn ratio in grains were assessed as crucial aspects affecting grain quality. Finally, the potential impact on enzyme activities related to general soil functioning and P cycling was evaluated as a relevant aspect in the sustainable management of crop nutrition. We hypothesized that (1) the studied BBFs could meet the P requirements of crops while providing yields similar to those of conventional mineral fertilizers, due not only to their content in P compounds that are readily available or are progressively released and used by crops, but also because they can affect P dynamics in the soil; and (2) some BBFs could improve grain micronutrient concentration through the application of these nutrients and by affecting their dynamics in soil.

2. Materials and Methods

2.1. BBFs Characterization

The tested fertilizers included four by-products obtained from wastewater treatment plants [struvite, vivianite, and sewage sludge with (sludge) and without composting (SS compost)]; four composts from different raw materials [municipal solid waste (MSW), vineyard waste (vineyard), and two types of olive husk compost, one traditional (OH compost) and one treated with microorganisms (OHM compost)]; digestate from a biogas plant derived from cattle manure; three vermicomposts (two homemade, one each from horse manure (manure VC) and pruning residues (pruning VC), and the commercial product “Max”); fish meal; and the commercial fertilizer “Moge” (Table 1). “Max” is a sanitized and stabilized organic amendment obtained from organic materials through double aerobic digestion with the intervention of earthworms (FACTOR HUMUS, S.L., Madrid, Spain). Moge is an organic fertilizer from composted plant remains, suitable for organic farming (SUBSEAGRO, S.L., Seville, Spain).
The BBFs were selected to encompass the most relevant P side streams that account for major P losses on a societal scale and with the greatest potential impact on circular economy approaches to nutrient use [4]: urban wastes (wastewater and solid waste), agricultural residues (vineyard, pruning residues, manure) and agri-food residues relevant in Mediterranean countries (olive husk). The BBF application rate to pots in the greenhouse study was set at 50 mg P kg−1 soil; this in turn resulted in the application of different masses of other nutrients and micronutrients with each BBF (Table S1).
After drying the BBFs at 37 °C, pH and EC were measured in a 1:5 (v/v) BBF: water ratio, according to UNE-EN 13037 [38] and UNE-EN 13038 [39]. Total C, N, and sulphur (S) concentrations were analyzed using an elemental autoanalyzer (CNS-Trumac by LECO, Saint Joseph, MI, USA). Metal concentrations were determined by atomic absorption spectrometry (AAS; Thermo ICE 3500, Thermo Finigan, Madrid, Spain) after calcination in muffle furnace at 550 °C for 8 h followed by dissolution of the ashes in 1 M HCl [40].

2.2. Phosphorus Compounds in Bio-Based Fertilizers

To characterize P compounds in the organic BBFs (excluding struvite and vivianite), P was extracted with a modification of the Cade-Menun and Preston method [41], using 1 g of BBF with 25 mL of 0.25 M NaOH + 0.05 M Na–EDTA in 50-mL polyethylene flasks at 25 °C for 6 h on a reciprocating shaker. After extraction, suspensions were centrifuged at 1500× g for 20 min. A 1-mL aliquot was removed and diluted to 10 mL with deionized water to determine the concentrations of P, Fe, copper (Cu) and manganese (Mn) in each sample by inductively-coupled plasma optical emission spectroscopy (ICP-OES; Varian 720-ES). This was used to estimate the spin-lattice relaxation time constant (T1 value) for each sample, using the ratio of concentrations of P to paramagnetic elements (P/(Fe + Mn + Cu)) in the extracts, and equations in the literature [42]. We included Cu because many BBFs have a high concentration of this paramagnetic ion. Recovery delays were set to at least four times the estimated T1 value (4 to 10 s). The remaining supernatants were frozen (48 h, −80 °C) and lyophilized.
For each sample, 0.4 g of the lyophilized extract was dissolved in 0.9 mL D2O and 0.6 mL each of deionized H2O, the NaOH–EDTA extracting solution, and 10 M NaOH. After occasional vortex mixing for 10 min, samples were centrifuged at 1500× g for 20 min and the supernatant was transferred to NMR tubes for immediate analysis. Solution P-NMR spectra were collected on a 500 MHz Bruker Avance NMR spectrometer (Bruker Corporation, Billerica, MA, USA) with a 10-mm broadband probe at the NMR central service, CITIUS, University of Seville, Spain. The NMR acquisition parameters were 202.50 MHz frequency, 90° pulse, 2.75 s acquisition time, no proton decoupling, and 5050 scans for each sample (8 h). Fish meal samples were doped with Fe–EDTA to reduce relaxation time.
Spectra were processed with 7 and 2 Hz line-broadening using NUTS software (2000 edition; Acorn NMR, Livermore, CA, USA). The P-NMR analysis was performed without replicated measurements. The P forms were identified by their chemical shifts, after standardizing the orthophosphate peak in each sample to 6 ppm [42]. Peak assignments were based on previous references and were confirmed by spiking experiments, in which known P forms (glucose-6-P, D-α glycerol P, α and β-glycerol-P disodium, β-nicotinamide and phytic acid sodium salt, α-D galactose phosphate dipotassium salt pentahydrate, L-α-phosphatidylcholine, and myo-inositol 1 HP) were added to prepared NMR samples after analysis and re-analyzed [42,43,44].
During P-NMR analysis, RNA degrades to nucleotides and phospholipids degrade to β- and α-glycerophosphate; when present in spectra, areas of these peaks were grouped with orthophosphate diesters [45,46,47].

2.3. Soil Collection

Two agricultural soils developed under the Mediterranean climate with an average annual temperature of 11.8–26.5 °C, and an average annual rainfall of 560 mm over a 20-year period were used in this study (Table 2). Soils were collected from the surface horizon (0–20 cm) of an olive grove in the Guadalquivir Valley (south Spain; 37°20′4.61″ N; 6°6′35.83″ W) and (37°21′06.7″ N; 6°10′15.9″ W), air-dried at room temperature, homogenized, ground, and sieved (8 mm). Soils were classified as Alfisols and Inceptisols [48]. The selected Alfisol is a red-colored soil with a significant content of hematite as dominant Fe oxide and low content of carbonates and can be considered rich in Fe oxides (Fe-soil) [49]. The second is a Ca carbonate-rich soil (Ca-soil). Both soils had a basic pH (above 8) and differed widely in terms of clay content (25% in the Fe-soil and 7% in the Ca-soil) and carbonate content (43% and 7% in the Ca-soil and Fe-soil, respectively). These soils were selected to consider different processes involved in P dynamics in soil, adsorption on Fe-oxides, or precipitation with Ca and sorption on carbonates.
Soil pH and electrical conductivity (EC) were measured in soil:water ratios of 1:2.5 and 1:5 (w/v), respectively. The total CaCO3 equivalent (CCE) was determined by the calcimeter method [50]. Dichromate oxidation was used to determine organic matter [51], and the total N concentration was determined by the Dumas method [52]. Soil test P concentration was analyzed using the Olsen P method [53], followed by colorimetric analysis [54].

2.4. Experimental Design, Greenhouse Experiment

A pot experiment was conducted in a greenhouse following a randomized block design with two soils and five replicates per fertilizer treatment for each soil. Treatments included 14 BBFs applied at a rate of 50 mg P kg−1 soil, which was considered the reference rate for pot experiments [19]. Non-fertilized and fertilized controls with single superphosphate (SSP) at 50 mg P kg−1 were also included as fertilizer treatments. Before application, all fertilizers were ground to 2 mm so that particle size/presentation did not influence the results.
Durum wheat (Triticum turgidum subsp. durum (Desf.) Husn. cv. Almicar) was used for the greenhouse experiment. Seeds were pre-germinated in petri dishes at 8 °C in the dark, and then six seedlings were transplanted to each pot 15 days after germination and grown for 104 additional days until harvest. Each 5-L PVC pot (25 cm diameter; 20 cm height) contained 1.9 kg of soil mixed with 1/3 perlite (in volume) to avoid soil compaction and root asphyxia. Soil water content was maintained at 70% of field capacity, and plants were fertigated with a P-free Hoagland-type nutrient solution containing (all concentrations in mmol L−1): MgSO4 (2), Ca(NO3)2 (5), KNO3 (5), KCl (0.05), Fe-EDDHA (0.02), H3BO3 (0.024), MnCl2 (0.0023), CuSO4 (0.0005), ZnSO4 (0.002), and H2MoO4 (0.0005).

2.5. Plant Analysis and Efficiency Index

After harvest, the straw, grain and glume were separated, dried at 65 °C for 48 h to constant weight in a forced-air oven, and milled (<1 mm) for chemical analysis. A homogenous 0.25-g aliquot was calcinated in porcelain crucibles in a muffle furnace at 550 °C for 8 h. The ashes were dissolved in 10 mL of 1 M HCl and heated at 100 °C for 15 min. The P concentration in the resulting solution was determined colorimetrically [54]. In the same solution, Mg, Fe, Mn, Cu and Zn concentrations were determined by AAS. To assess the total recovery of nutrients, certified plant material (tomato leaf; standard reference material 1573a, National Institute of Standard and Technology, USA) [xx] was analyzed in parallel, with 84–101% recovery of nutrients.
The mineral P replacement value (MPRV) was calculated according to Ayeyemi [7] using Equation (1). This is the efficiency of BBF, estimated as apparent P recovery (the P taken up by the crop from fertilizer) relative to that of the mineral fertilizer, i.e., the percentage of mineral soluble fertilizer that can be replaced with the same amount of alternative fertilizer:
MPRV = (Pi − Pc)/(Pm − Pc) × 100
Pi = total P uptake of the fertilized treatment i (mg P pot−1); Pc = total P uptake of the control (P zero) treatment (OP), and Pm = total P uptake of the mineral fertilizer treatment (SSP) at the same rate as BBFs, 50 mg kg−1. The MPRV represents the kg of SSP that are equivalent to the application of 100 kg of a given BBF in terms of P recovery by crops. In fact, it represents the ratio of the apparent recovery from a given BBF [(Pi − Pc)/Prate × 100] to that from SSP [(Pm − Pc)/(Prate × 100]. The apparent P recovery is an estimate of the amount of P taken up by crop from the applied fertilizer.

2.6. Enzymatic Activity in Soil

At anthesis, fresh soils were collected from each pot and used to assay potential enzymatic activities. Phosphatase activity was determined by measuring the p-nitrophenol (p-NPP) release rate during soil incubation with p-nitrophenyl phosphate disodium for 60 min at 37 °C at pH 5.5 (acid phosphatase) and at pH 9.0 (alkaline phosphatase) [55]. β-Glucosidase activity was determined by measuring the p-NPP release rate during soil incubation with p-nitrophenyl-β-D-glucopyranoside for 60 min at 37 °C and pH 6 [56].

2.7. Statistical Analyses

The effect of the fertilization factor on each studied variable was assessed by analysis of variance (ANOVA), in which the fertilization treatment was considered a fixed factor and the block a random factor, using the general linear model procedure in Statgraphics Centurion XVIII, Warrenton, VA, USA [57]. For each parameter, normality and homoscedasticity were checked according to the Shapiro–Wilk and Levene tests, respectively; with the exception of one variable, these criteria were met in all cases and no transformations were required. Where the data were not normally distributed (alkaline phosphatase activity in Fe-soil), a nonparametric one-way ANOVA Kruskal–Wallis test was used. When the soil was considered as a factor in the analysis, a bimodal distribution was observed in the variables, which could not be solved with a transformation, and the effects of soils or the interaction between soil and fertilizer could not be assessed. Given the different starting condition of the soil with respect to the initial available P, the analyses were performed independently for each soil to ensure normality. When the fertilizer factor was significant, means for each treatment were compared with the LSD test (α < 0.05).

3. Results

3.1. BBFs Characterization Results

The nutrient supply from each BBF was determined not only by nutrient concentrations, but also by the product application rate required to achieve the target P application rate. Given their higher P concentrations, struvite and vivianite (125 and 105 g P kg−1) were comparable alternatives to SSP in terms of fertilizer application. In contrast, OH and OHM compost and Moge had much lower P concentrations (1.8, 1.7 and 1.8 g P kg−1, respectively), and thus required much higher BBF application rates (Table 1 and Table S1).
Vivianite had the highest Fe concentrations (172.2 g Fe kg−1; Table 1). However, when the BBF application rate was considered, sludge emerges as the primary contributor of Fe (0.33 mg pot−1; Table S1), alongside OH compost, manure, and pruning VC (0.25, 0.22, and 0.22 mg pot−1, respectively; Table S1). In terms of Mn supply, vivianite had the highest concentration of the BBFs (2761.9 mg Mn kg−1; Table 1) but with differences in BBF application rates, many composts and digestates supplied much more Mn per pot (Table S1). Sludge had the highest Zn content (1144.1 mg kg−1) but digestate and MSW delivered the highest Zn supply (11.53 and 8.81, respectively vs. 6.60 mg pot−1). The highest Cu concentrations were observed in sludge (207.7 mg kg−1) and SS compost (104.5 mg kg−1) but the rates per pot were less (1.20 and 1.11 mg pot−1, respectively) than OH and OHM compost (3.04 and 4.53 mg pot−1).

3.2. Phosphorus Forms in Bio-Based Fertilizers

The P recovery with NaOH–EDTA extraction ranged from 46.6% to 100% (Table 3). Digestate, MSW, and OHM compost had the lowest P recoveries, all below 55%. In contrast, the other fertilizers showed a high P recovery, exceeding 70%, with sludge, OH compost and fish meal exceeding 90% P recovery. There were no clear patterns in BBF properties with respect to P recovery; BBFs with high and low P recoveries all varied widely with respect to pH and concentrations of C and other elements (Table 2).
Example P-NMR spectra are shown in Figure S1, while chemical shifts of peaks in spectra for various P compounds are shown in Table S2. Orthophosphate was the most abundant compound in all BBFs, ranging from 73.8% of total P in the NaOH–EDTA extracts in Moge to 89.5% in fish meal (Table 3). Pyrophosphate was 3.4% of extracted P in the sewage sludge, 1.6 to 1.1% in MSW, digestate and vineyard compost, and <1% of extracted P in other samples except OH compost and fish meal, where they were not detected. Polyphosphates were 2.5% and 2.1% of extracted P in MSW and OHM compost samples, were not detected in sludge, Moge and digestate, and were 1.3% or lower in the other BBFs.
The highest organic P contents in the NaOH–EDTA extracts (>20% of total P) were found in Moge fertilizer and the manure VC and pruning VC. In contrast, organic P compounds were <10% of extracted P in SS compost and fish meal BBFs. The most abundant organic P compound class was inositol hexakisphosphate (IHP) stereoisomers, which were present in all the BBFs except sludge and fish meal and represented 8.2% of extracted P in the fertilizer Moge. Overall, myo-IHP was the dominant IHP stereoisomer (1.2–6.4% of extracted P). Pruning VC had the highest myo-IHP concentration (229.0 mg kg−1; Table S3). The chiro-IHP stereoisomer was observed in seven of the BBFs (1.3–2.1% of extracted P) and was more abundant than myo-IHP in Max (4.2 vs. 2.8% of extracted P). None of the IHP stereoisomers appear in fish meal. However, BBF had a pronounced peak at 5.028 ppm, identified as myo-inositol 1 hydrogen phosphate (myo-1P) [43], a peak detected in most BBFs in this study (Table S1).
The scyllo-IHP stereoisomer was measured only in the two VCs (Table 3). Peaks from 6 to 7 ppm that could not be assigned to specific P compounds were grouped in the Monoester 1 category, which represented up to 3.3% of total P (OH compost, 48.4 mg kg−1). No peaks in this region were detected in sewage sludge, OHM compost and fish meal. Unassigned peaks between 3.5 and 6 ppm were grouped into the Monoester 2 category, which represented up to 8.8% of extracted P (Moge, 122.9 mg kg−1). All BBFs had peaks in the Monoester 2 category (Table 3 and Table S2). The broad background peak detected in other studies [58,59] would be included in this category if present but was not specifically quantified in this study. Sludge, SS compost, and fish meal had the lowest total orthophosphate monoester percentages (4.2%, 4.7%, and 4.5%, respectively) but the highest proportions of extracted P in the orthophosphate diester region (4.7%, 4.8%, and 4.8%, respectively).

3.3. Effect of Fertilizers on Crop Yields and Elemental Concentrations

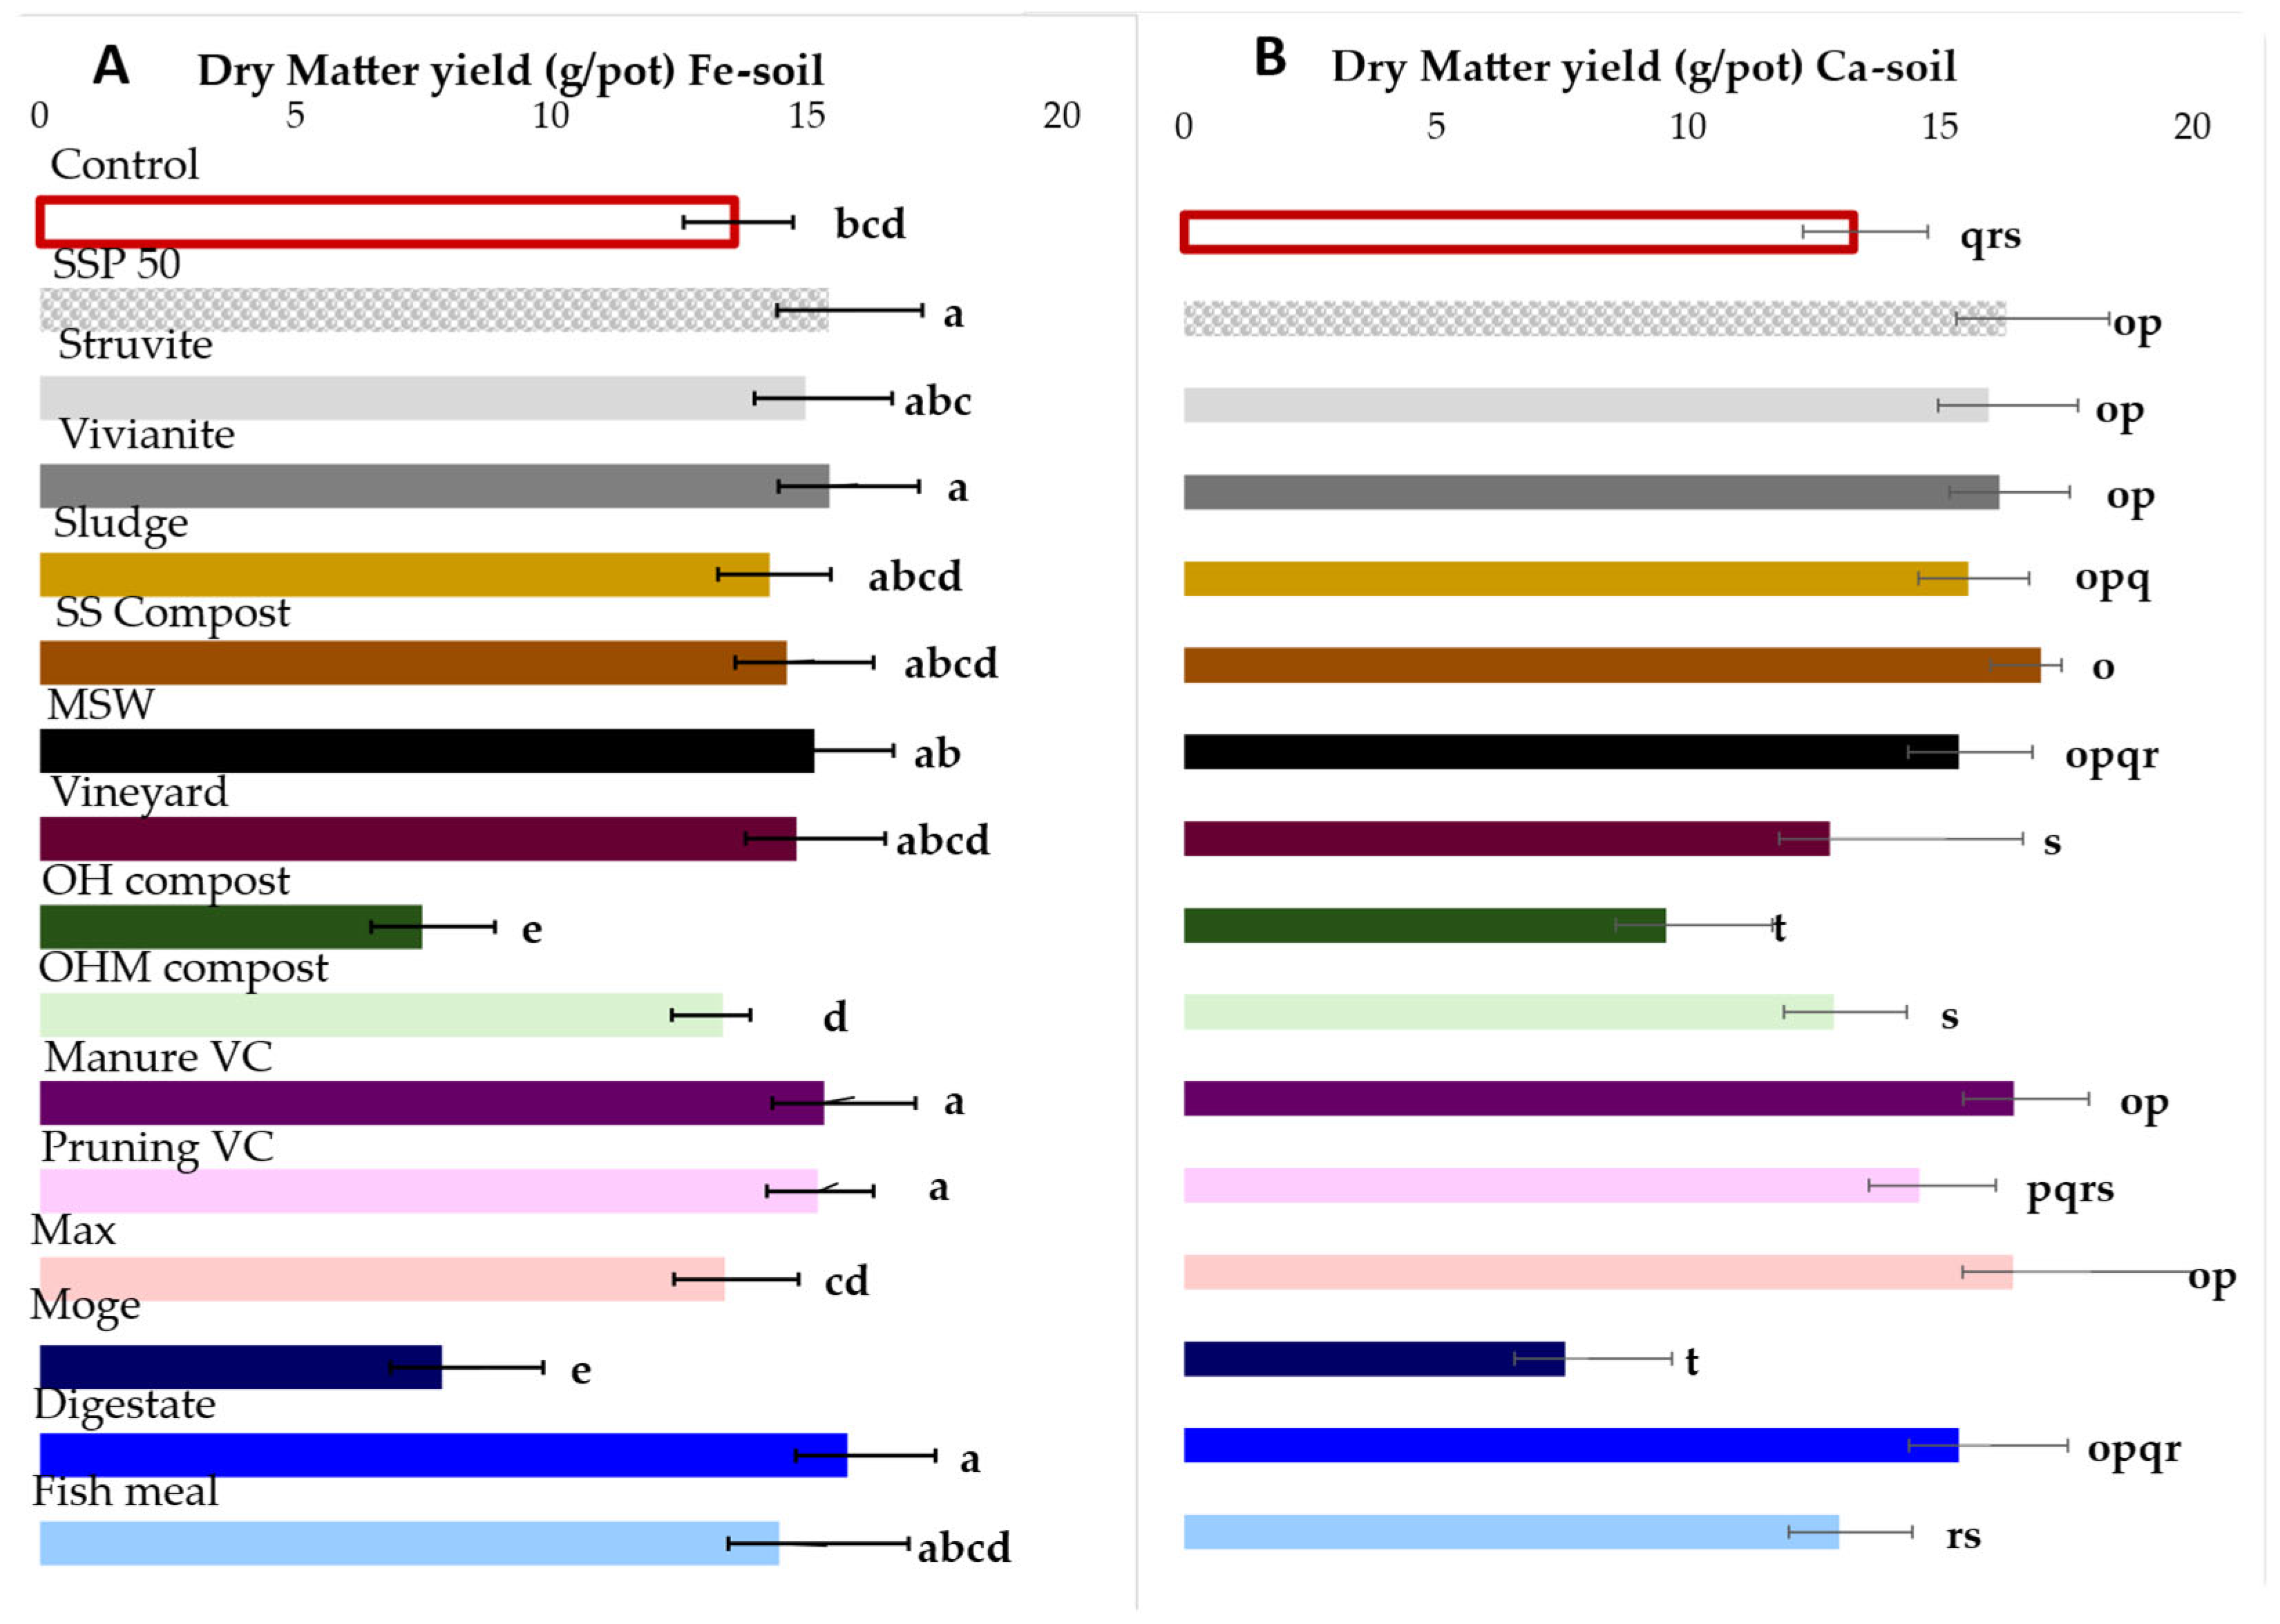
In the Fe-soil, SSP, vivianite, the two VCs and digestate were the only treatments that resulted in significantly higher wheat DM yields than the non-fertilized control (15.4, 15.5, 15.3 and 15.3 vs. 13.6 g pot−1; Figure 1A). In contrast, wheat DM yields were significantly lower than the unfertilized control for the OH compost (7.5 g pot−1) and Moge (7.9 g pot−1) fertilizers and were lower than the SSP fertilizer treatment. There were no significant differences among the other BBFs, with DM yields around 15.5 g pot−1; Figure 1. In the Ca-soil, DM yields were significantly lower than SSP (16.3 g pot−1) in OH compost (9.6 g pot−1), Moge (7.6 g pot−1) and fish meal (13.0 g pot−1). The highest DM yields in this soil were achieved with compost sludge (17.0 g pot−1), struvite (16.0 g pot−1), vivianite (16.2 g pot−1), manure VC (16.5 g pot−1) and Max (16.5 g pot−1), all of which had comparable DM yields to SSP and significantly greater DM yields than the unfertilized control (13.3 g pot−1; Figure 1B).
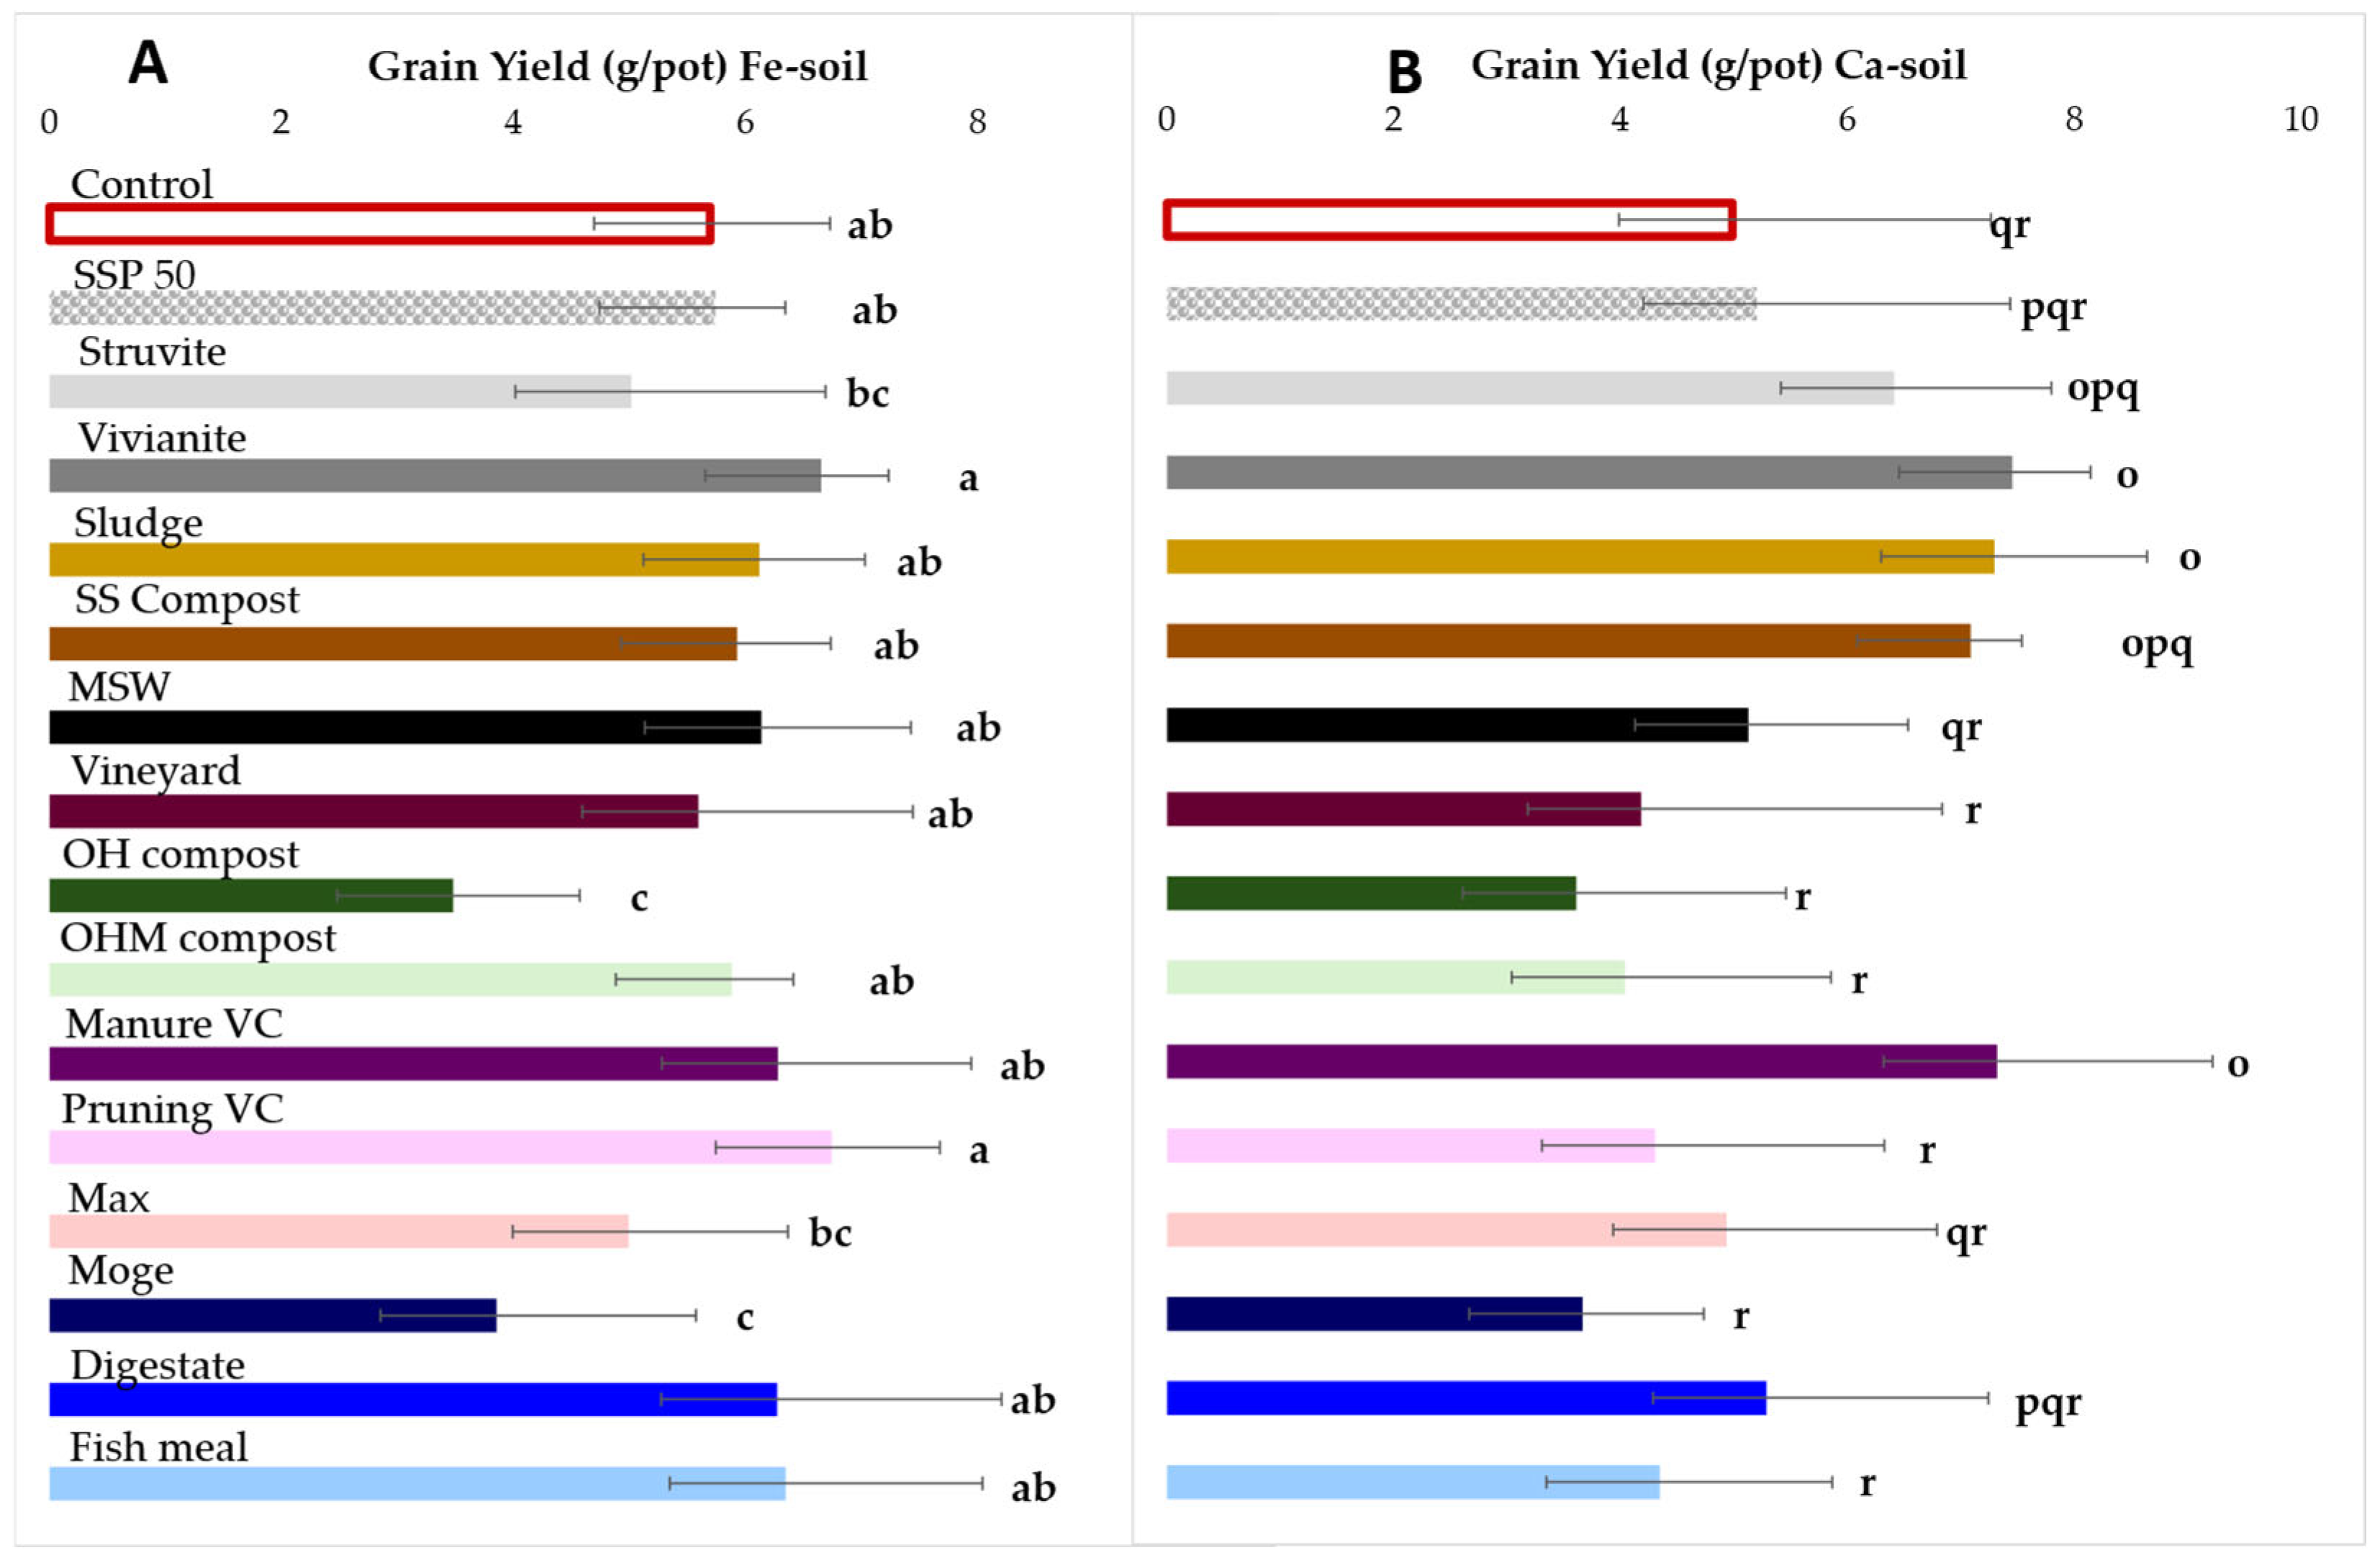
In the Fe-soil, vivianite and pruning VC had the highest grain yields (6.7 g pot−1 in both cases), but these were not significantly different from SSP (5.7 g pot−1) or from the majority of other BBFs (Figure 2A). The OH compost and Moge fertilizers had the lowest grain yields in this soil, significantly lower than the unfertilized control (3.5 and 3.6 vs. 5.7 g pot−1, respectively). In the Ca-soil, vivianite, sludge, and manure VC increased grain yield (7.5, 7.3 and 7.3 g pot−1, respectively) compared with SSP (5.2 g pot−1), with no significant differences in grain yields among the other treatments (Figure 2B).
Peaks in the orthophosphate diester region were divided into DNA and other diesters (Other di) which were peaks other than DNA in the diester region. In addition, the phospholipid degradation compounds α- and β-glycerophosphate, present in all but the SS compost, were included with the orthophosphate diesters in Table 3 and Table S2. Peaks for mononucleotides (Nucl) from RNA degradation were also detected in most staples (Table S1) but represented a very low proportion of extracted P and were not included in Table 3 and Table S2. Peaks for DNA were not detected in SS compost, OH and OHM compost, Moge and digestate, and represented 0.4–1.7% of extracted P in other samples. Other diesters, which include phospholipids and lipoteichoic acid, were not detected in compost sludge, OH compost and Max fertilizer, and were from 0.3 to 1.4% of extracted P in other samples. Phosphonates were detected in all but the Max fertilizer, representing up to 5.6% of the extracted P (SS compost, 816 mg kg−1). Phosphonate peaks were grouped together and were not assigned to specific compounds.
In the Fe-soil, grain P concentration was greatest with OH compost (4.56 mg kg−1), surpassing SSP (3.63 mg kg−1). The lowest grain P concentrations occurred with the MSW (2.72 mg kg−1). In the Ca-soil, grain P concentrations were lowest with vivianite and the non-fertilized control (3.63 and 3.86 mg kg−1, respectively), and highest with fish meal (5.62 mg kg−1; Table 4).
No significant differences were observed in grain Mg concentration in the Fe-soil, with an average of 63.7 mg kg−1. In the Ca-soil, the highest grain Mg concentrations occurred with fish meal (96.9 mg kg−1), pruning VC (89.5 mg kg−1) and vineyard (86.2 mg kg−1), while the lowest was with vivianite (64.7 mg kg−1). In Fe-soil, the sewage sludge treatment had the highest grain Fe concentration (18.5 mg kg−1) and digestate the lowest (11.0 mg kg−1), while in the Ca-soil, grain Fe concentrations were highest with pruning VC (21.1 mg kg−1) and lowest with Moge (11.1 mg kg−1). In the Fe-soil, grain Mn concentration was highest with Moge (20.2 mg kg−1) while in the Ca-soil, it was highest with pruning VC (22.4 mg kg−1). The lowest Mn concentrations were observed with digestate in both soils (~8 mg kg−1; Table 4).
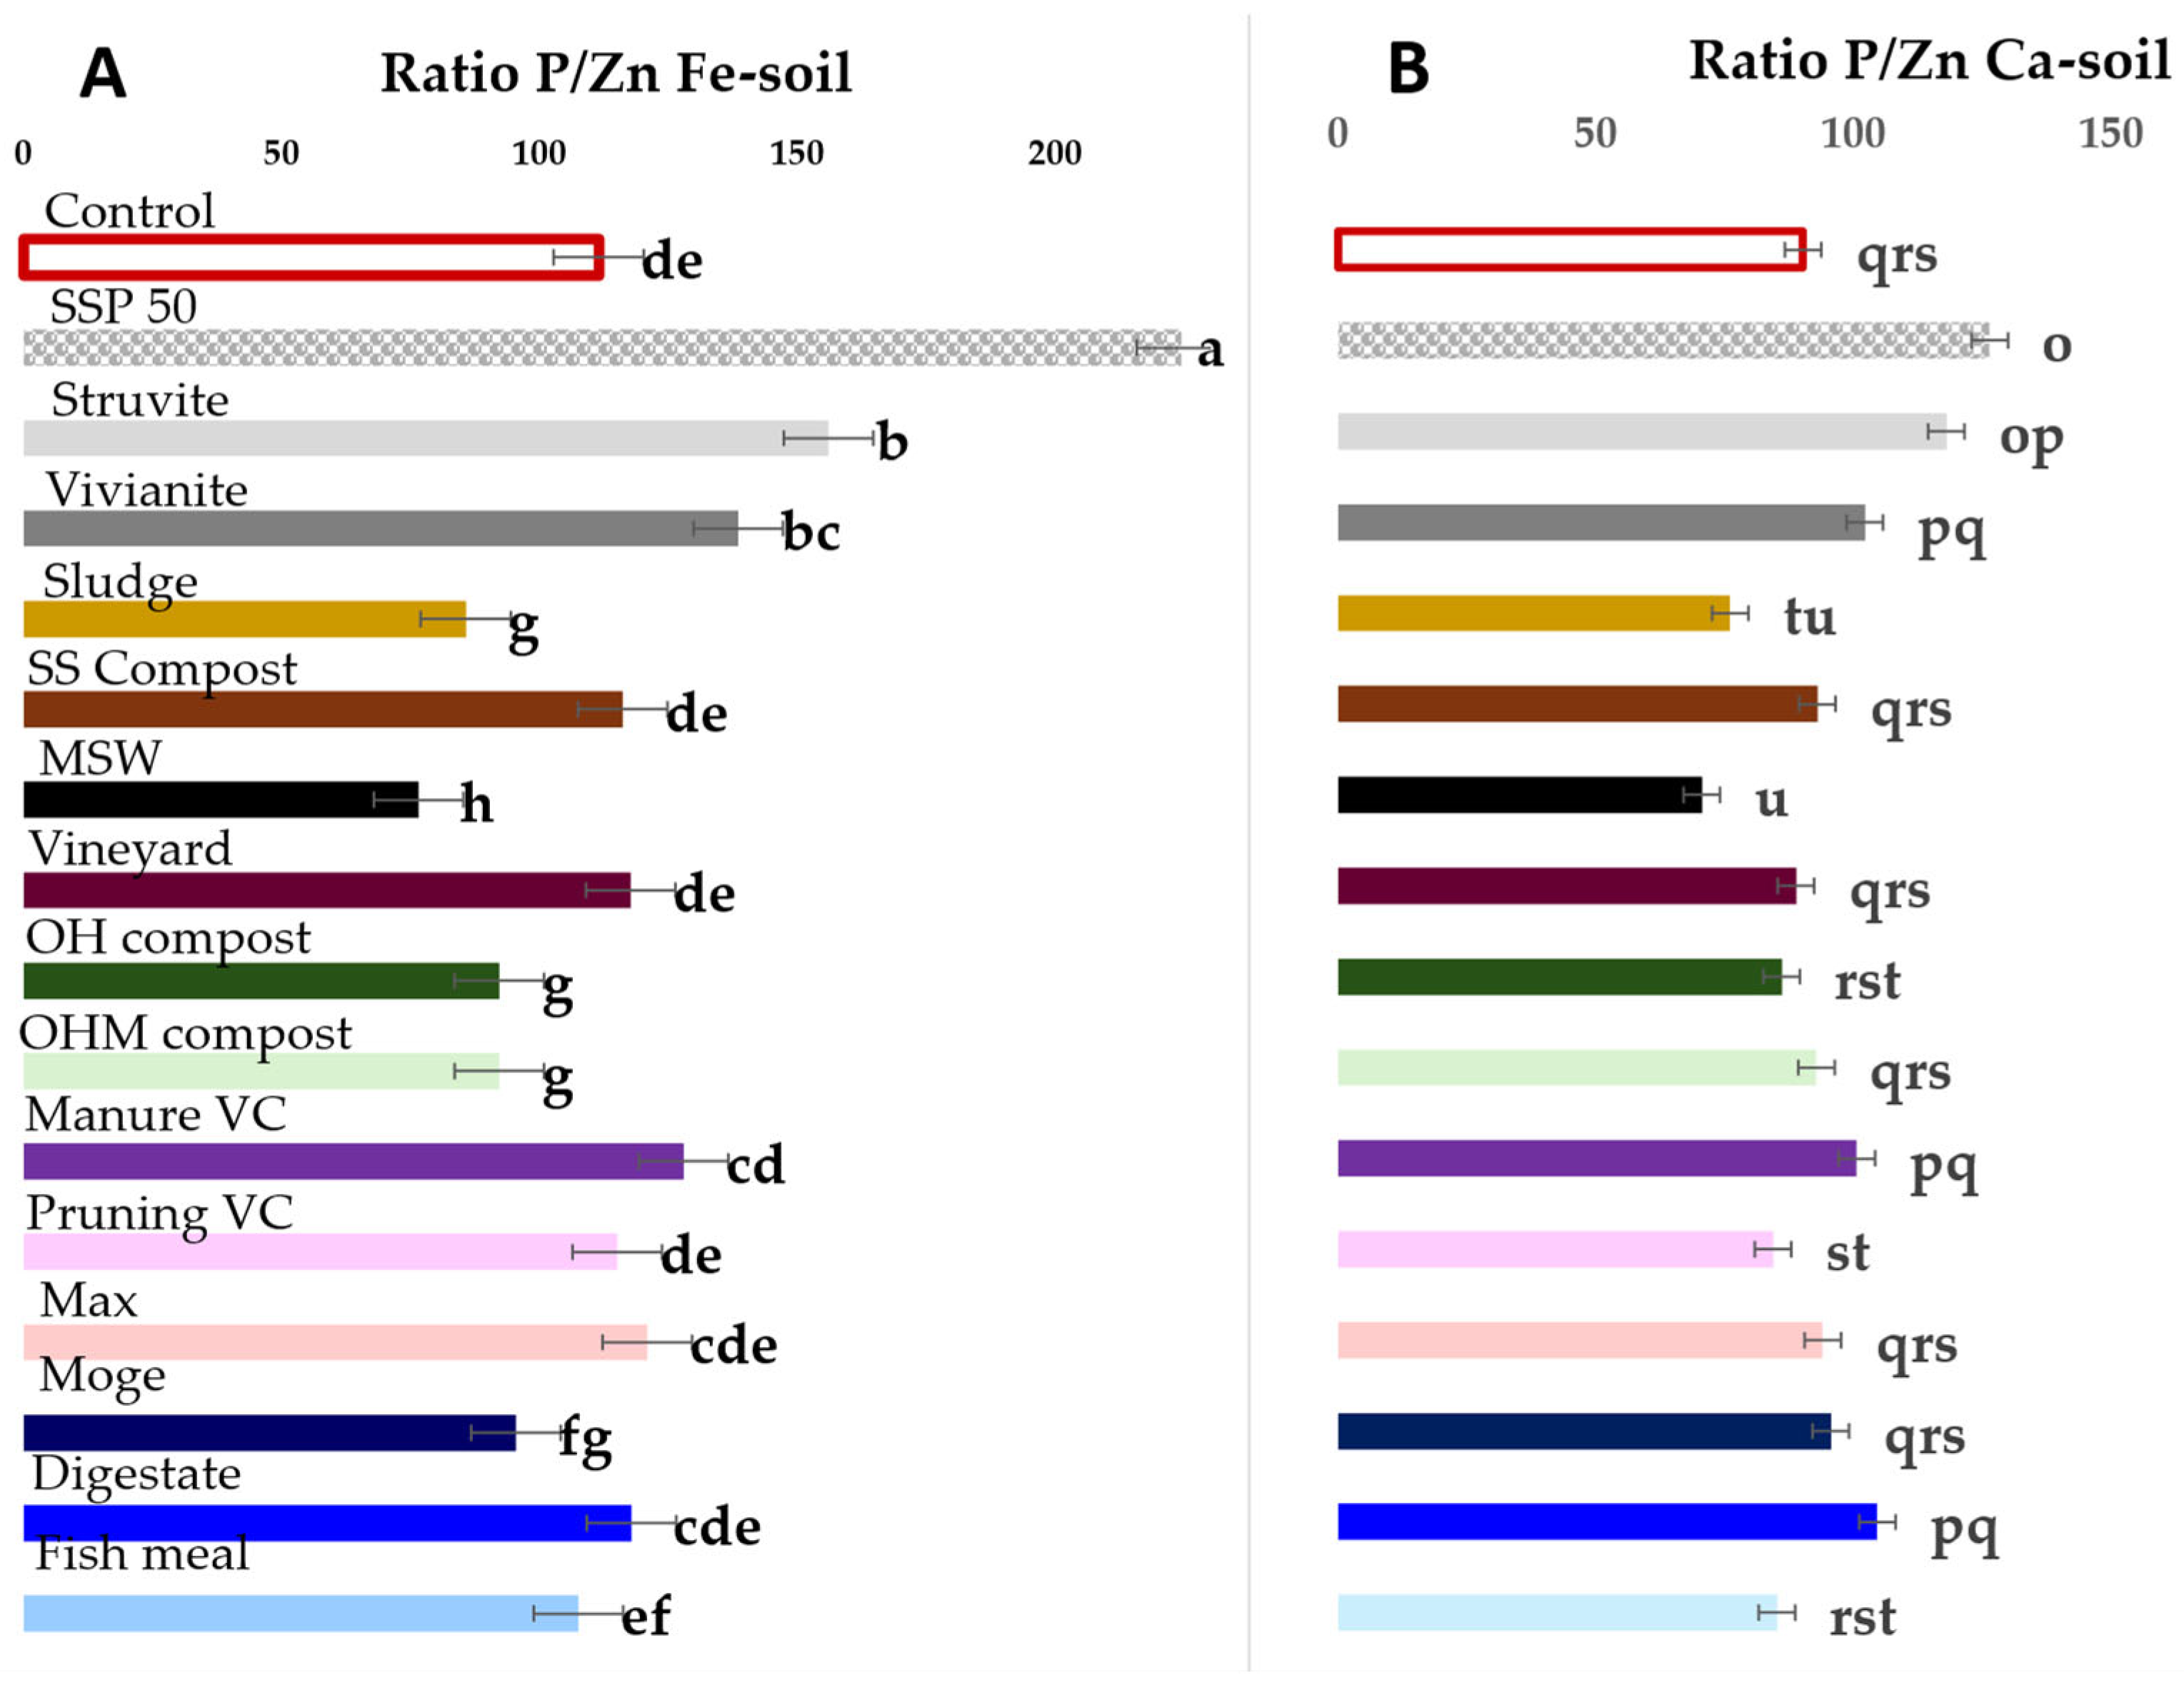
In the Fe-soil, the highest grain Zn concentration was in the OH compost treatment (49.5 mg kg−1), while the lowest was with SSP (16.6 mg kg−1). Fish meal had the highest grain Zn concentration in the Ca-soil (67.5 mg kg−1), while digestate and vivianite were the lowest (≤40 mg kg−1). Overall, the P/Zn ratio was higher with SSP than with BBFs in both soils (Figure 3). In the Fe-soil, the P/Zn ratios in grain were highest with struvite and vivianite (118 and 102) than with other BBFs, but were significantly lower than with SSP. The lowest P/Zn ratio was with MSW (71). In the Ca-soil, only fertilization with struvite produced a P/Zn ratio that was not significantly different from SSP (118 vs. 126); all the other BBFs produced significantly lower P/Zn ratios than SSP.
The highest grain Cu concentrations were observed with the application of sludge in both soils (8.9 and 10.5 mg kg−1 in Fe-soil and Ca-soil, respectively), while the lowest grain Cu concentrations were observed with Max and OHM compost in both soils (Table 4). In straw, the highest Cu concentrations in both soils were promoted by struvite (14.6 and 19.8 mg kg−1 in the Fe-soil and the Ca-soil, respectively).

3.4. Efficiency of Bio-Based Fertilizers Relative to Mineral Soluble Fertilizer

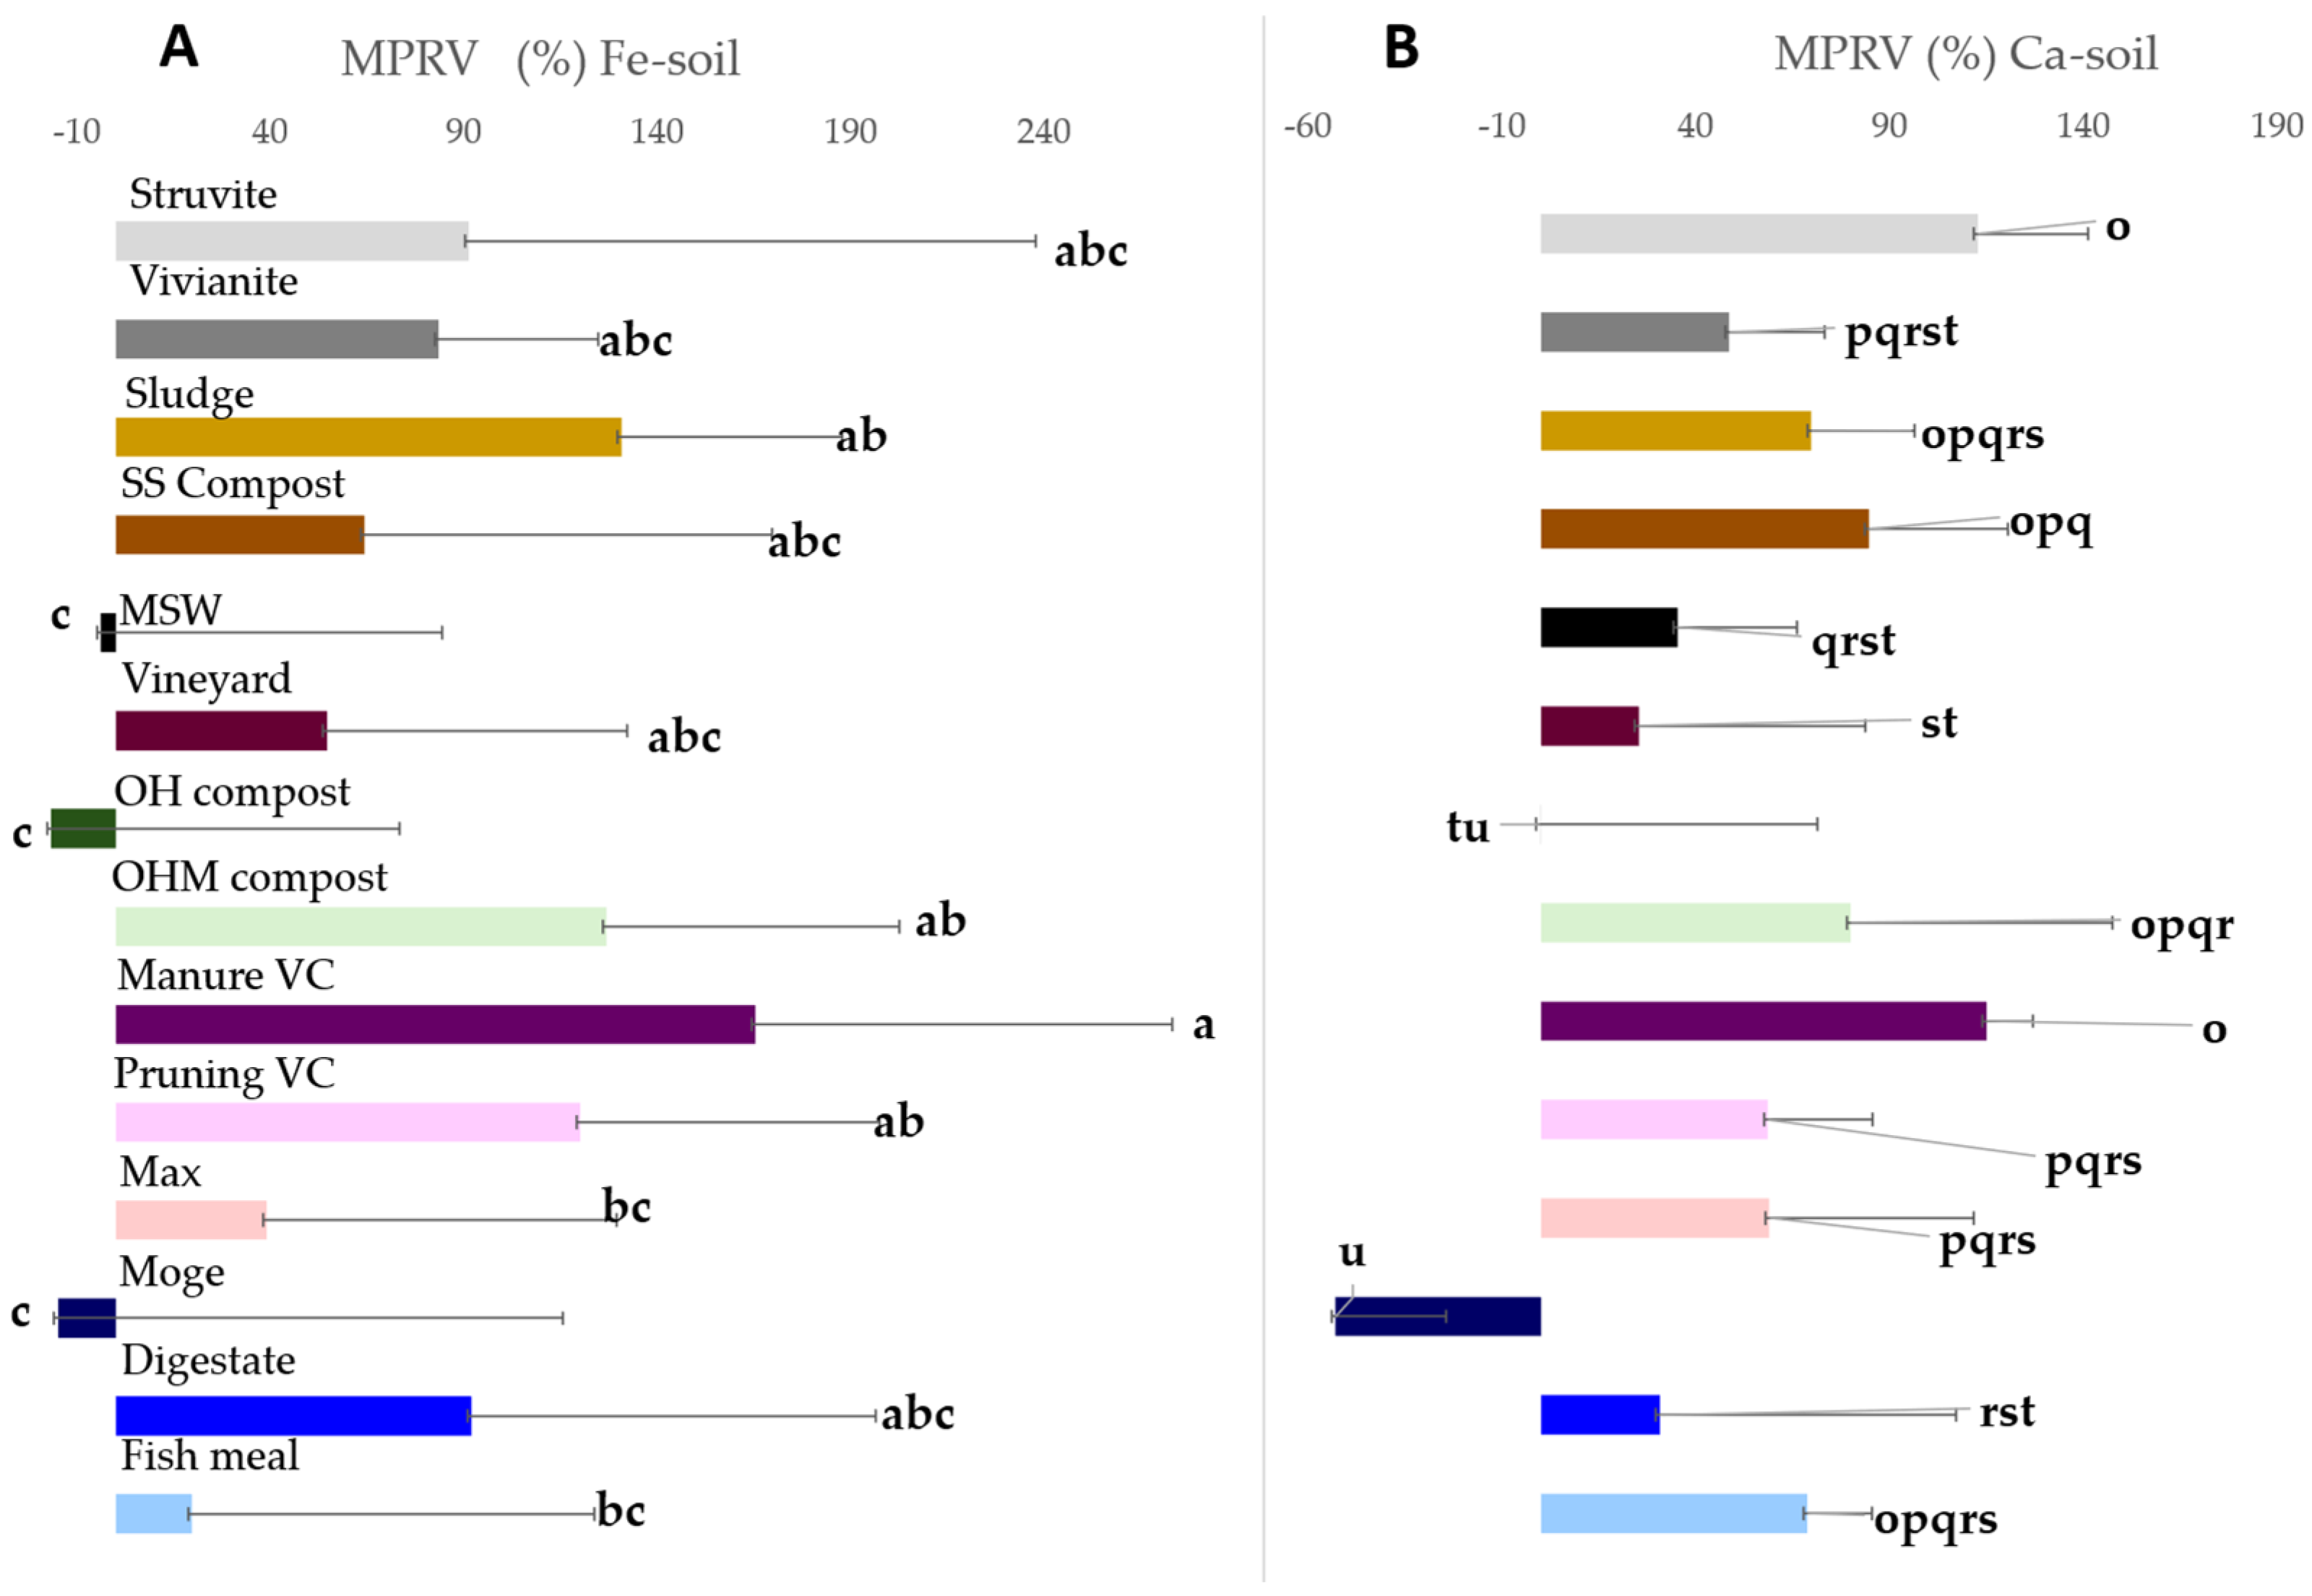
Some BBFs showed MPRV above 100%, although this depended on the soil, and variability was high for most treatments (Figure 4A,B). Manure VC had a MPRV of 165% in the Fe-soil (Figure 4A), which decreased in the Ca-soil to 115% (Figure 4B). Other C-rich BBFs, such as OHM compost, pruning VC and digestate (Table S1), produced MPRVs close to or even higher than 100% in the Fe oxide-rich soil. The MPRVs of these products decreased in the Ca-soil, but were still reasonably high in the OHM compost and in the pruning VC. Struvite resulted in MPRVs of 113% and 91% in the Ca-soil and the Fe-soil, respectively. Conversely, vivianite and sewage sludge led to higher MPRVs in the Fe-soil (84% and 113%, respectively) than in the Ca-soil (49% and 70%, respectively). The MPRV of compost sludge was lower than that of sewage sludge (64% in the Fe-soil, 85% in the Ca-soil). In the Fe-soil, the MPRVs of digestate and fish meal were 92% and 69%; these were 31% and 20% in the Ca-soil. The lowest MPRVs in both soils were observed with MSW, OH compost and Moge (with values between −53% and 35%).

3.5. Effect of Fertilizers on Soil Potential Enzyme Activities

Overall, BBFs increased potential soil enzyme activities relative to mineral fertilizer, particularly when organic C was supplied with the fertilizer (Table 5 and Table S1). In the Fe-soil, the highest acid phosphatase activities were observed with the application of OH compost (141.9 p-NPP) and fish meal (109.6 p-NPP). The highest acid phosphatase activities were observed in the Ca-soil with the pruning VC (124.5 p-NPP) and fish meal (144.6 p-NPP).
In both soils, alkaline phosphatase activities were greater than acid phosphatase activities, which is commonly observed in alkaline soils. In the Fe-soil, alkaline phosphatase activities were significantly higher than SSP (96.6 p-NPP) with OH compost (272.3 p-NPP) and fish meal (314.3 p-NPP) treatments. In the Ca-soil, the highest alkaline phosphatase activities were in the Moge treatment (239.1 p-NPP), and the lowest for the other commercial BBF Max (104.2 p-NPP, Table 5).
In the Fe-soil, the highest β-glucosidase activity was observed with Moge (76.7 p-NPP), but high values were also observed with OH compost (70.2 p-NPP), VCs (72.2 and 71.1 p-NPP), digestate (69.3 p-NPP), and fish meal (69.9 p-NPP), all of which were greater than SSP (61.3 p-NPP). The trend was similar in the Ca-soil, where OH compost (62.0 p-NPP), VCs (65.8 and 62.3 p-NPP), and Moge (66.5 p-NPP) led to the highest β-glucosidase activities, significantly higher than SSP (47.3 p-NPP; Table 5).

4. Discussion

4.1. Phosphorus Forms in BBFs

Analysis with P-NMR provides important structural and molecular information from BBFs crucial for P recycling and fertilizer management [60]. Previous studies have used P-NMR to analyze manure and sludge [59,60,61,62,63,64,65], compost sludge [59] and MSW [60] and digestates [66,67]. Very few studies have used P-NMR to analyze compost (backyard compost) [68] or manure VC [37], and there are no published studies using P-NMR to analyze fish meal, vineyard compost, OH compost, or pruning VC.
The percentage of inorganic P compounds in the BBFs ranged from 74.5% to 90.8%, primarily as orthophosphate—the P form (phosphate) directly assimilable by plants. Similar results were found for cattle manure and wheat straw compost [60], backyard composts [68], digestates [60,66,67,69], sewage sludge [59,61,65,70,71] and SS compost [59]. It is important to note, though, that this does not represent all of the phosphate in the original BBF samples, especially those with low P recoveries (MSW, OHM compost; Table 3), because other studies have shown that the P not extracted by NaOH–EDTA is likely in recalcitrant phosphate compounds such as apatite [72].
Polyphosphate content was generally <3% in most BBFs with notable exceptions in MSW (4.1%) and sludge (3.4%, all in the form of pyrophosphate). However, this may be lower than the proportion of polyphosphates in the original samples; degradation of polyphosphates after lyophilization of unneutralized NaOH–EDTA extracts has been reported [73,74], while other studies report increased proportions of pyrophosphate and polyphosphate from a two-step extraction protocol [64]. Anaerobic decomposition has been reported to degrade polyphosphates to orthophosphate [70], although other studies have reported sewage sludge polyphosphate contents of 10–14% [65,71]. Microbes often store phosphate as polyphosphates, and sewage treatment plants often use polyphosphate accumulating organisms for enhanced biological P removal [64]. Some studies of digestate, which has undergone anaerobic digestion, report no polyphosphates [60,67,75], while others report pyrophosphate in digestate at 1–2% of extracted P [69], consistent with our findings.
The proportion of organic P compounds in BBFs ranged from 9.2% (fish meal) to 25.5% (Moge), with similar results observed in the BBFs analyzed in previous studies [59,60,68,76]. The dominant IHP stereoisomer in the BBFs of this study was myo-IHP, followed by the IHP stereoisomers D-chiro-IHP (in 4e/2a and 2e/4a conformations) and scyllo-IHP. We detected myo-IHP in sludge, SS compost and MSW, consistent with previous studies [59,60,62,67,77]. The D-chiro-IHP stereoisomer was observed in seven of the BBFs. This stereoisomer was identified in aerobic sludge by Cosgrove [78] but was not present in the SS compost BBF in this study. The scyllo-IHP stereoisomer was detected in sludge, SS compost as [59], MSW, vineyard compost, OH compost, OHM compost, manure VC, pruning VC, Moge and digestate, but only quantifiable in VC. This is consistent with the suggested microbial origin of IHP stereoisomers other than myo-IHP, such as scyllo-IHP [79] and D-chiro-IHP [44].
The total monoester content ranged from 4.2 to 18.9%. The lowest values were for sludge (4.7%), SS compost (4.2%), and fish meal (4.7%). Annaheim et al. [59] found higher values in SS compost (19%) compared to this study. Moge and OH compost exhibited the highest percentages of monoester 2 (Moge: 8.8%, OH compost: 8.5%), and high activities of the studied enzymes (Table 5). Due to their low P content, these fertilizers were applied at the highest rates (Table 1). These high application rates may account for the high enzyme activities, either from the addition of substrates (e.g., non-IHP orthophosphate monoesters for acid and alkaline phosphatase) or from the addition of enzymes to the soils from the BBFs themselves, as these enzymes can retain some activity after drying [80]. High application rates also increased the mass of organic C applied with this BBF (Table S1). Organic C supply is known to increase β-glucosidase activity as a consequence of an increased microbial biomass [81,82] and consequently stimulates microbial P immobilization [83,84]. Further investigation is needed to understand enzyme activities related to the use of BBFs, and their role in P fertility.
Sludge, MSW and digestate exhibited the highest proportions of extracted P in the orthophosphate diester region (4.7, 4.8, 4.7%, respectively), compared to 0–2% for the other BBFs, and the digestate has the highest percentage of α- and β-glycerophosphates, which were orthophosphate diesters (phospholipids) in the original samples before P-NMR extraction and analysis. Orthophosphate diesters were not detected in the SS sludge BBF, as was reported in a previous study [59]. Ran [67] reported an increase in orthophosphate diesters during anaerobic digestion, but Smith [62] did not.
Phosphonates were found in all BBFs except the Max fertilizer, forming between 0.6% (fish meal) and 5.6% (SS compost) of extracted P. The compound class of phosphonates includes a range of different compounds, originating from various sources, both natural and synthetic [85,86]. Synthetic phosphonates include the herbicide glyphosate, but the chemical shifts of phosphonates in these BBFs were not consistent with that compound (Table S2 [44]). Naturally occurring phosphonates include a range of biogenic compounds produced by many organisms [85,86]. The chemical shifts of phosphonates in this study suggest they include a number of biogenic compounds [43]. Phosphonates have been widely reported in manure [59,63,87] particularly dairy manure, as they have been associated with rumen protozoa and are thought to protect protozoa from enzymatic degradation [87]. Other studies have reported phosphonates in sludge and SS compost [59,62]. With a direct C-P bond, phosphonates require different enzymes (phosphonatases) for hydrolysis and thus are thought to be very resistant to degradation [85,86]; their contribution to plant-available P as fertilizers is unknown.
It is important to note that only one sample of each BBF was analyzed by P-NMR, which prevented statistical comparisons of the P forms in the various BBFs. As such, differences among the BBFs should be interpreted cautiously. In addition, only one sample of each BBF was used for this study; however, the P forms in BBFs could vary depending on the source of materials used to produce the BBFs and the conditions under which they were produced [21,65,87]. Replicated sample analysis, and analysis of similar BBFs developed from a variety of sources, are recommended for future studies.

4.2. Efficiency of Bio-Based Fertilizers Yields Similar to Mineral Fertilizer

Some studied BBFs were as efficient, or even more efficient, than SSP in terms of crop P uptake. This confirms our hypothesis that BBFs from different agro-industrial and municipal wastes and by-products could meet crop needs while providing yields similar to those of conventional mineral fertilizers, thus applying circular economy strategies to nutrient-rich side streams. For most BBFs, this is because the majority of P in the BBFs was relatively soluble phosphate, based on high P recoveries during NaOH–EDTA extraction and high proportions and concentrations of orthophosphate in all BBFs (Table 3 and Table S3). However, the effect can vary depending on the soil and on the BBF.
When assessing MPRV, some products, such as the manure VC led to values well above 100%; in the case of the Fe-soil it was 165%, which means that the effect of 100 kg of this fertilizer is equivalent to 165 kg of SSP in terms of P recovery by crop. This reveals a much higher efficiency of manure VC than soluble mineral fertilizer. Other BBFs with high organic matter content, such as sludge, OHM, and pruning vermicompost also led to MPRV higher than 100% in the Fe-soil. Such a high MPRV cannot be explained only in terms of relatively soluble phosphate content because SSP is a soluble phosphate. Furthermore, OHM showed a very low recovery with the NaOH–EDTA extract; therefore, it can be assumed that recalcitrant phosphate represents an important fraction of the total P in this BBF. The progressive mineralization of organic forms that are not strongly bound to sorbent surfaces can contribute to P supply to crops [88]. A progressive release leading to low P concentrations in the soil solution maintained over long periods decreases the precipitation rate of insoluble phosphates, which is enhanced at high P concentration [89]. This progressive release may be closer to the development of the crop root system’s capacity to take up P and may result in greater P-use efficiency [90]. Both vermicompost and OHM exhibited relatively high IHP content, which can have higher affinity for sorbent surfaces than phosphate [91]. This preferential adsorption of IHP may provoke the release of phosphate to the soil solution where it is available for uptake in plants [92]. Furthermore, the organic matter supplied with these products can interfere with phosphate and IHP adsorption and precipitation, thus increasing the availability of applied P [93]. However, other organic BBFs, such as OH and Moge showed poor performance.
The better performance of vermicomposts, sewage sludge, and OHM in the Fe-soil may demonstrate that the competitive adsorption of organic matter and IHP on oxides in increasing P availability to plants is more relevant when these oxides are the main sorbent surfaces [92]. In addition, the Ca-soil had higher Olsen P and possibly greater saturation of sorbent surfaces by P compounds such as phosphate compared to the Fe-soil. This may contribute to higher phosphate concentration in the solution when fertilizer is supplied [94], which would favor the precipitation of Ca phosphates in this soil compared with the Fe-soil.
The BBFs obtained from wastewater showed excellent results. Although MPRVs ranged from 49% to 131%, the DM and grain yields were not significantly different from SSP. The good performance of struvite has been previously documented [95,96]. Hertzberger [97] reported a reduced efficiency in alkaline soils due to slow dissolution at high pH. However, our results demonstrate that struvite maintains high fertilization efficiency even in calcareous soils with pH values above 8, with a performance comparable to mineral fertilizer in agreement with the findings of Degryse [98]. This difference in the efficiency of struvite as a P fertilizer can be ascribed to improved dissolution due to the exudation of organic acids by roots [90], which can vary depending on the crop, management and soil conditions, such as nutrient deficiency [99]. Furthermore, root exudates indirectly affect nutrient availability to plants by fostering a resilient microbiota capable of increasing P mobilization from poorly soluble sources through acidification or organic anion release [100]. As previously mentioned, a progressive dissolution of struvite can lead to a decreased rate of insoluble Ca phosphate precipitation [97]. This could also explain the increased MPRV of struvite in the Ca-soil (113%) compared with the Fe-soil (91%). In this latter soil, Ca phosphate precipitation is not so favored and adsorption on Fe oxides may contribute more markedly to phosphate retention in the Fe-soil.
Vivianite showed higher fertilizer efficiency in this study than in previous studies [7,101]. Although its solubility is low under basic soil pH, a progressive dissolution mediated by root and microbial exudates likely contributes to its efficiency, as observed for struvite [90] resulting in low phosphate concentrations released over a longer time period rather than high concentrations released all at once [8]. Furthermore, different crops, management practices, and environmental conditions affect exudates, which in turn determine different efficiencies of vivianite as a P fertilizer. Sludge and SS compost also showed high fertilizer efficiency, in agreement with the results of Glaesner [58]. However, other authors observed poor efficiency with sludge because the dominant P forms in these products were Fe phosphates and P adsorbed on poorly crystalline Fe oxides [12,102,103,104].
The BBFs that performed poorly in both soils were Moge and OH compost. Regarding Moge, its high pH (9.7), the high K content (35.1 g kg−1) along with its application rate (34.8 g kg soil−1) may have influenced the low yields in both soils with this BBF. In these cases, the organic matter content does not appear to have positive effects on P dynamics and availability in soil. The high C/N in the OH compost (32.6) suggests that it was not as decomposed as the other BBFs in this study; this high C/N ratio could generate competition for N between the plant and soil microorganisms, which may explain the low agronomic results of OH compost.

4.3. Effect of Bio-Based Fertilizers on Grain Micronutrients and Soil Functioning Indicators

Overall, BBFs can affect micronutrient concentrations in wheat grains, although the effect varied depending on the soil.
Several factors can explain the effects on micronutrient concentrations. These include their supply with BBFs, in some cases significant, and properties of fertilizers, such as organic matter content, that could affect micronutrient dynamics in soil. In the Fe-soil, sludge promoted Fe biofortification, i.e., increased concentration in grains. This was attributed to the Fe supplied with the product and to complexation by organic matter [105]. However, digestate, which was also a C-rich product that supplied high amounts of Fe, led to the lowest Fe concentration in the grains. Thus, additional factors may affect the Fe accumulation in grains. Digestate has a highly alkaline pH (9.72), much higher than that of sludge (7.44). The stability of Fe complexes with organic matter decreases at alkaline pH, such as that for digestate. That could enhance Fe oxide precipitation or co-precipitation of complexes with Fe oxides [106], thus decreasing Fe availability to plants. The same effect may also explain the lowest Mn concentrations in grains in both soils from digestate. Additionally, the application of high amounts of one micronutrient, such as Zn with digestate, may inhibit the adsorption and translocation of others [91,107,108]. All of this could contribute to reducing Fe and Mn accumulation in grains with this BBF.
Fertilization with mineral P fertilizer tended to decrease Zn concentration in grain relative to non-fertilized control, revealing an antagonistic effect [102]. Interestingly, several BBFs (sludge, olive husk products, and Moge) increased Zn concentration in grains relative to SSP in the Fe oxide-rich soil. This suggests that there could be less risk of antagonism with these products and agrees with Sánchez-Rodríguez [103] who observed that the combined application of P and Zn has been shown to mitigate antagonism between these nutrients and improve their availability to plants in soils with low availability of both nutrients. In addition, sludge and OH compost increased Zn concentration relative to non-fertilized control, revealing a biofortification effect with a positive impact on grain quality. This effect was not observed in the Ca-soil, where Zn concentrations were higher. The positive effects of the abovementioned BBFs on Zn biofortification can be explained by the significant supply of this nutrient with these products (Table 2 and Table S1) and organic matter [30].
Overall, struvite and SSP led to the highest Cu concentration in grains, in both soils, whereas OHM compost tended to decrease Cu, even in straw, despite being the BBF providing the highest addition of Cu to pots. This has practical relevance in animal nutrition, where Cu is an essential element that is incorporated into high-production diets but also represents a toxic element that accumulates in the soil.
Except in the case of struvite in the Fe-soil, BBFs decreased the P/Zn ratio in both soils. This has important implications for the grain quality intended for human consumption and is attributed to the effect of BBFs on P and Zn accumulation in grains.
An important concern for using sludges is their high heavy metal content, such as Mn, Zn and Cu. However, our results reveal that when applied to soils with basic pH, the effect on edible parts of crops is in the same range as other fertilizers, which can be ascribed to a decreased solubility at increased pH [109] and adsorption on Fe oxides [110] and carbonates [111].

4.4. Practical Considerations

These results reveal the potential for replacing soluble mineral fertilizers based on a circular economy approach. The good results obtained with BBFs obtained from wastewater treatments are particularly relevant because P in wastewater accounts for approximately half of the P applied in the EU as mineral fertilizers. Thus, recycling this P is crucial for achieving a more sustainable use of P at a societal scale. Other products also showed good performance as P fertilizer, but with low nutrient concentration. Therefore, these BBFs can be considered for nutrient recycling at the farm scale, providing additional benefits on soil quality indicators such as biological activity and organic C content. In addition, some of the studied BBFs showed benefits in terms of grain quality compared with soluble mineral fertilizer. All this reveals that a holistic approach is necessary to assess the utility of BBFs as P fertilizers considering not only their efficiency as P fertilizers, but also other collateral benefits.

5. Conclusions

Struvite, sewage sludge, olive husk compost with microorganism, and manure vermicompost were efficient P sources, with MPRV ranging from 70% to 165% in both soils. The efficiency of manure VC in supplying P is noteworthy, showing higher P recoveries by crops than the soluble mineral fertilizer in both soils. Fertilizers obtained from wastewater purification, such as sewage sludge, struvite and vivianite, not only showed high efficiency in supplying P but also demonstrated that the recovery from the main P side stream is feasible for a more sustainable use of this resource on a societal scale.
The good performance of digestate under certain conditions (Fe oxide-rich soil) presents an opportunity to integrate P recovery and energy production from waste. Furthermore, BBFs may also increase micronutrient concentrations and decrease the P-to-Zn ratio, when compared with soluble mineral fertilizer, enhancing grain quality compared to soluble mineral fertilizer. The circular economy approach must take into account not only agronomic efficiency but also the economic and environmental cost of moving the waste to the re-circulation point. Thus, BBFs with a low P content (OH compost, Moge) or a high moisture content (digestate) make sense within a local circular economy. On the other hand, struvite and vivianite, with higher P concentrations, are good alternatives for commercialization and long-distance transport. However, to formulate solid practical recommendations, further research is needed on the effect of the different P forms in BBFs on the residual fertilizer value, contribution to P legacy, heavy metal load and transformations in soils, as well as evaluating the efficiency of these products under real field conditions with different pedoclimatic conditions.

Supplementary Materials

The following supporting information can be downloaded at: https://www.mdpi.com/article/10.3390/agronomy16111058/s1, Table S1. Masses (mg) of nutrients applied per pot in the biobased fertilizers (BBFs) in the greenhouse study (on a dry matter basis). Figure S1. Graphical solution 31P NMR spectra of Phosphorus forms in the extracts of sewage sludge, compost sludge, municipal solid waste, vineyard compost, olive husk compost, olive husk compost treatment with microorganism, horse manure vermicompost, pruning residues vermicompost, Max (commercial fertilizer), Moge (commercial fertilizer), digestate and fish meal, extracted in 0.25M NaOH-0.05M EDTA. Table S2. Chemical shifts of peaks detected in 31P nuclear magnetic resonance spectroscopy spectra. Table S3. Phosphorus compounds and general P categories determined by solution 31P NMR (nuclear magnetic resonance) spectroscopy in the 0.25 M NaOH + 0.05M Na-EDTA extracts of 12 Biobased fertilizers (BBF). The content is expressed as mg kg−1 BBF of total P in this extract.

Author Contributions

All authors contributed to the design of the experiment. Material preparation, data collection and analysis were performed by N.N.-R. The original draft of the manuscript was prepared by N.N.-R. and reviewed by A.M.G.-L. Subsequent versions of the manuscript were contributed by B.J.C.-M. and A.D. All authors have read and agreed to the published version of the manuscript.

Funding

This work was funded by the Spanish Ministry of Science, Innovation and University through the State Plan for Scientific, Technical and Innovation Research (PEICTi), Projects PID2023-149247OB-C21 and PID2020-118503RB-C2 and PRE2021-098673. Mrs. Nieves Núñez Romero was granted by the same Ministry with a predoctoral contract.

Data Availability Statement

The original contributions presented in this study are included in the article/Supplementary Material. Further inquiries can be directed to the corresponding authors: Nieves Nunez-Romero nnunez1@us.es; Antonio Delgado adelgado@us.es.

Acknowledgments

The authors would like to express their gratitude to the Agricultural Research Service of the University of Seville (SIA) for their technical support, particularly to Purificación Pajuelo Domínguez and Oliva Polvillo Polo. Special thanks are also extended to Encarnación Zafra Rodríguez from the Nuclear Magnetic Resonance Service (RMN) for her invaluable assistance. Additionally, the authors acknowledge Agriculture and Agri-Food Canada, specifically the Swift Current Research and Development Centre. Extensive thanks to the companies that have participated in the project: ALTER COMPOSTING S.L, BIOMASA PENINSULAR S.L., BIOVEC S.L., EMASESA S.A., FACTOR HUMUS S.L., FERTIBERIA S.A., SACYR S.A.; SUBSEAGRO, S.L.; USISA S.A. y VADOLIVO S.L.

Conflicts of Interest

The authors declare no conflicts of interest, and the funders had no role in the design of the study; in the collection, analyses, or interpretation of data; in the writing of the manuscript; or in the decision to publish the results.

Abbreviations

The following abbreviations are used in this manuscript:
BBFBiobased fertilizer
SSPSingle superphosphate
AASatomic absorption spectrometry
PyroPyrophosphate
Fe-soilIron oxide rich soil
Ca-soilCarbonate rich soil
ECElectrical conductivity
CCETotal CaCO3 equivalent
Fe-EDDHAEthylenediamine-N,N′-bis (2-hydroxyphenyl) acetic acid, ferric-sodium complex
p-NPPp-nitrophenol
MSWMunicipal solid waste
IHPInositol hexakisphosphate
DMDry matter
ICP-OESInductively-coupled plasma optical emission spectroscopy
MPVRMineral phosphorus replacement value

References

  1. Recena, R.; Díaz, I.; Delgado, A. Estimation of total plant available phosphorus in representative soils from Mediterranean areas. Geoderma 2017, 297, 10–18. [Google Scholar] [CrossRef]
  2. Ryan, J.; Ibrikci, H.; Delgado, A.; Torrent, J.; Sommer, R.; Rashid, A. Significance of phosphorus for agriculture and the environment in the West Asia and North Africa Region. Adv. Agron. 2012, 114, 91–153. [Google Scholar] [CrossRef]
  3. Barquet, K.; Järnberg, L.; Rosemarin, A.; Macura, B. Identifying barriers and opportunities for a circular phosphorus economy in the Baltic Sea region. Water Res. 2012, 171, 115433. [Google Scholar] [CrossRef]
  4. Van Dijk, K.C.; Lesschen, J.P.; Oenema, O. Phosphorus flows and balances of the European Union Member States. Sci. Total Environ. 2016, 542, 1078–1093. [Google Scholar] [CrossRef]
  5. Jastrzębska, M.; Kostrzewska, M.K.; Saeid, A.; Jastrzębski, W.P. Do new-generation recycled phosphorus fertilizers increase the content of potentially toxic elements in soil and plants? Minerals 2021, 11, 999. [Google Scholar] [CrossRef]
  6. Withers, P.J.A.; Vadas, P.A.; Uusitalo, R.; Forber, K.J.; Hart, M.; Foy, R.H.; Delgado, A.; Dougherty, W.; Lilja, H.; Burkitt, L.L.; et al. A global perspective on integrated strategies to manage soil phosphorus status for eutrophication control without limiting land productivity. J. Environ. Q. 2019, 48, 1234–1246. [Google Scholar] [CrossRef]
  7. Ayeyemi, T.; Recena, R.; García-López, A.M.; Delgado, A. Circular economy approach to enhance soil fertility based on recovering phosphorus from wastewater. Agronomy 2023, 13, 1513. [Google Scholar] [CrossRef]
  8. Ayeyemi, T.; Recena, R.; García-López, A.M.; Quintero, J.M.; Del Campillo, M.C.; Delgado, A. Efficiency of vivianite from water purification depending on its mixing with superphosphate and application method. Agronomy 2024, 14, 2639. [Google Scholar] [CrossRef]
  9. Saliu, T.D.; Oladoja, N.A. Nutrient recovery from wastewater and reuse in agriculture: A review. Environ. Chem. Lett. 2021, 19, 2299–2316. [Google Scholar] [CrossRef]
  10. Kamilya, T.; Gautam, R.K.; Muthukumaran, S.; Navaratna, D.; Mondal, S. Technical advances on current research trends and explore the future scope on nutrient recovery from waste-streams: A review and bibliometric analysis from 2000 to 2020. Environ. Sci. Pollut. Res. 2022, 29, 49632–49650. [Google Scholar] [CrossRef]
  11. European Environment Agency. Bio-Waste in Europe—Turning Challenges into Opportunities; EEA Report No 04/2020; EEA: Copenhagen, Denmark, 2020; Available online: https://circulareconomy.europa.eu/platform/sites/default/files/th-al-20-010-en-n_bio-waste_in_europe_-_18_06_20.pdf (accessed on 10 May 2026).
  12. Frick, H.; Bünemann, E.K.; Hernandez-Mora, A.; Eigner, H.; Geyer, S.; Duboc, O.; Santner, J.; Recena, R.; Delgado, A.; D’Oria, A.; et al. Bio-based fertilisers can replace conventional inorganic P fertilisers under European pedoclimatic conditions. Field Crops Res. 2025, 325, 109803. [Google Scholar] [CrossRef]
  13. Farsang, A.; Babcsányi, I.; Ladányi, Z.; Perei, K.; Bodor, A.; Csányi, K.T.; Barta, K. Evaluating the effects of sewage sludge compost applications on the microbial activity, the nutrient and heavy metal content of a Chernozem soil in a field survey. Arab. J. Geosci. 2020, 13, 982. [Google Scholar] [CrossRef]
  14. Zittel, R.; Da Silva, C.P.; Domingues, C.E.; Seremeta, D.C.H.; Da Cunha, K.M.; De Campos, S.X. Availability of nutrients, removal of nicotine, heavy metals and pathogens in compounds obtained from smuggled cigarette tobacco compost associated with industrial sewage sludge. Sci. Total Environ. 2020, 699, 134377. [Google Scholar] [CrossRef]
  15. Janaszek, A.; Kowalik, R. Analysis of Heavy Metal Contaminants and Mobility in Sewage sludge-soil Mixtures for Sustainable Agricultural Practices. Water 2023, 15, 3992. [Google Scholar] [CrossRef]
  16. Alvarenga, P.; Mourinha, C.; Farto, M.; Santos, T.; Palma, P.; Sengo, J.; Morais, M.-C.; Cunha-Queda, C. Sewage sludge, compost and other representative organic wastes as agricultural soil amendments: Benefits versus limiting factors. Waste Manag. 2015, 40, 44–52. [Google Scholar] [CrossRef]
  17. Urbaniak, M.; Baran, A.; Giebułtowicz, J.; Bednarek, A.; Serwecińska, L. The occurrence of heavy metals and antimicrobials in sewage sludge and their predicted risk to soil—Is there anything to fear? Sci. Total Environ. 2024, 912, 168856. [Google Scholar] [CrossRef]
  18. Stutter, M.I.; Shand, C.A.; George, T.S.; Blackwell, M.S.A.; Bol, R.; MacKay, R.L.; Richardson, A.E.; Condron, L.M.; Turner, B.L.; Haygarth, P.M. Recovering phosphorus from Soil: A root solution? Environ. Sci. Technol. 2012, 46, 1977–1978. [Google Scholar] [CrossRef]
  19. Nash, D.M.; Haygarth, P.M.; Turner, B.L.; Condron, L.M.; McDowell, R.W.; Richardson, A.E.; Watkins, M.; Heaven, M.W. Using organic phosphorus to sustain pasture productivity: A perspective. Geoderma 2014, 221–222, 11–19. [Google Scholar] [CrossRef]
  20. European Parliament and Council of the European Union. Regulation (EU) 2019/1009 of the European Parliament and of the Council of 5 June 2019. Laying down Rules on the Making Available on the Market of EU Fertilising Products and Amending Regulations (EC) No 1069/2009 and (EC) No 1107/2009 and Repealing Regulation (EC) No 2003/2003. Official Journal of the European Union. 2019. Available online: https://eur-lex.europa.eu/eli/reg/2019/1009/oj/eng (accessed on 10 May 2026).
  21. Hernández-Mora, A.; Duboc, O.; Lombi, E.; Bünemann, E.K.; Ylivainio, K.; Symanczik, S.; Delgado, A.; Abu Zahra, N.; Nikama, J.; Zuin, L.; et al. Fertilization efficiency of thirty marketed and experimental recycled phosphorus fertilizers. J. Clean. Prod. 2024, 467, 142957. [Google Scholar] [CrossRef]
  22. Wester-Larsen, L.; Müller-Stöver, D.S.; Salo, T.; Jensen, L.S. Potential ammonia volatilization from 39 different novel biobased fertilizers on the European market—A laboratory study using 5 European soils. J. Environ. Manag. 2022, 323, 116249. [Google Scholar] [CrossRef]
  23. Zhang, Z.; Li, B.; Wicaksana, F.; Yu, W.; Young, B. Comparison of struvite and K-struvite for Pb and Cr immobilisation in contaminated soil. J. Environ. Manag. 2023, 325, 116570. [Google Scholar] [CrossRef]
  24. Eshun, L.E.; García-López, A.M.; Recena, R.; Coker, V.; Shaw, S.; Lloyd, J.; Delgado, A. Assessing microbially mediated vivianite as a novel phosphorus and iron fertilizer. Chem. Biol. Technol. Agric. 2024, 11, 47. [Google Scholar] [CrossRef]
  25. Cabeza, R.; Steingrobe, B.; Römer, W.; Claassen, N. Effectiveness of recycled P products as P fertilizers, as evaluated in pot experiments. Nutr. Cycl. Agroecosyst. 2011, 91, 173–184. [Google Scholar] [CrossRef]
  26. Christiansen, N.H.; Sørensen, P.; Labouriau, R.; Christensen, B.T.; Rubæk, G.H. Characterizing phosphorus availability in waste products by chemical extractions and plant uptake. J. Plant Nutr. Soil Sci. 2020, 183, 416–428. [Google Scholar] [CrossRef]
  27. Vaneeckhaute, C.; Janda, J.; Vanrolleghem, P.A.; Tack, F.M.G.; Meers, E. Phosphorus use efficiency of bio-based fertilizers: Bioavailability and fractionation. Pedosphere 2016, 26, 310–325. [Google Scholar] [CrossRef]
  28. Duboc, O.; Santner, J.; Golestani Fard, A.; Zehetner, F.; Tacconi, J.; Wenzel, W.W. Predicting phosphorus availability from chemically diverse conventional and recycling fertilizers. Sci. Total Environ. 2017, 599–600, 1160–1170. [Google Scholar] [CrossRef]
  29. Schryer, A.; Magid, J.; Frossard, E.; Müller-Stöver, D. Fresh and residual plant uptake of recycled and mineral phosphorus fertilizers in a multi-year field experiment. Eur. J. Agron. 2026, 176, 128058. [Google Scholar] [CrossRef]
  30. Nieto-Cantero, J.; García-Lopez, A.M.; Recena, R.; Quintero, J.M.; Delgado, A. Beyond macronutrients supply: The effect of bio-based fertilizers on iron and zinc biofortification of crops. Agronomy 2025, 15, 1388. [Google Scholar] [CrossRef]
  31. Leytem, A.B.; Smith, D.R.; Applegate, T.J.; Thacker, P.A. The influence of manure phytic acid on phosphorus solubility in calcareous soils. Soil Sci. Soc. Am. J. 2006, 70, 1629–1638. [Google Scholar] [CrossRef]
  32. Cade-Menun, B.J. Characterizing phosphorus forms in cropland soils with solution 31P-NMR: Past studies and future research needs. Chem. Biol. Technol. Agric. 2017, 4, 19. [Google Scholar] [CrossRef]
  33. Stukenholtz, D.D.; Olsen, R.J.; Gogan, G.; Olson, R.A. On the mechanism of phosphorus-zinc interaction in corn nutrition. Soil Sci. Soc. Am. J. 1966, 30, 759–763. [Google Scholar] [CrossRef]
  34. Ryan, J.; Ibrikci, H.; Singh, M.; Matar, A.; Masri, S.; Rashid, A.; Pala, M. Response to residual and currently applied phosphorus in dryland cereal/legume rotations in three Syrian Mediterranean agroecosystems. Eur. J. Agron. 2008, 28, 126–137. [Google Scholar] [CrossRef]
  35. Moreno-Lora, A.; Delgado, A. Factors determining Zn availability and uptake by plants in soils developed under Mediterranean climate. Geoderma 2020, 376, 114509. [Google Scholar] [CrossRef]
  36. Recena, R.; García-López, A.M.; Delgado, A. Zinc uptake by plants as affected by fertilization with Zn sulfate; phosphorus availability, and soil properties. Agronomy 2021, 11, 390. [Google Scholar] [CrossRef]
  37. Nieto-Cantero, J.; García-López, A.M.; Recena, R.; Quintero, J.M.; Delgado, A. Recycling manure as vermicompost: Assessing phosphorus fertilizer efficiency and effects on soil health under different soil management. J. Soil Sci. Plant Nutr. 2025, 25, 5046–5061. [Google Scholar] [CrossRef]
  38. UNE-EN 13037:2012; Mejoradores del Suelo y Sustratos de Cultivo. Determinación del pH. Asociación Española de Normalización: Madrid, Spain, 2012.
  39. UNE-EN 13038:2012; Mejoradores del Suelo y Sustratos de Cultivo. Determinación de la Conductividad Eléctrica. Asociación Española de Normalización: Madrid, Spain, 2012.
  40. Ministerio de Agricultura, Pesca y Alimentación (MAPA). Protocolo de Validaciones para Análisis de Elementos Químicos. Laboratorio Arbitral Agroalimentario. 2022. Available online: https://www.mapa.gob.es/dam/mapa/contenido/alimentacion/temas/laboratorios-agroalimentarios/laboratorio-arbitral-agroalimentario--laa/protocolodevalidacionesparaanalisisdeelementosquimicos01-04-2022.pdf (accessed on 12 May 2026).
  41. Cade-Menun, B.J.; Preston, C.M. A comparison of soil extraction procedures for 31P NMR spectroscopy. Soil Sci. 1996, 161, 770–785. [Google Scholar] [CrossRef]
  42. Cade-Menun, B.; Liu, C.W. Solution phosphorus-31 nuclear magnetic resonance spectroscopy of soils from 2005 to 2013: A review of sample preparation and experimental parameters. Soil Sci. Soc. Am. J. 2014, 78, 19–37. [Google Scholar] [CrossRef]
  43. Cade-Menun, B.J. Improved peak identification in 31P-NMR spectra of environmental samples with a standardized method and peak library. Geoderma 2015, 257–258, 102–114. [Google Scholar] [CrossRef]
  44. Turner, B.L.; Cheesman, A.W.; Godage, H.Y.; Riley, A.M.; Potter, B.V.L. Determination of neo- and D-chiro -inositol hexakisphosphate in soils by solution31 P NMR spectroscopy. Environ. Sci. Technol. 2012, 46, 4994–5002. [Google Scholar] [CrossRef]
  45. Doolette, A.L.; Smernik, R.J.; Dougherty, W.J. Spiking improved solution phosphorus-31 nuclear magnetic resonance identification of soil phosphorus compounds. Soil Sci. Soc. Am. J. 2009, 73, 919–927. [Google Scholar] [CrossRef]
  46. Liu, J.; Yang, J.; Cade-Menun, B.J.; Liang, X.; Hu, Y.; Liu, C.W.; Zhao, Y.; Li, L.; Shi, J. Complementary phosphorus speciation in agricultural soils by sequential fractionation, solution31 P nuclear magnetic resonance, and phosphorus K-edge X-ray absorption near-edge structure spectroscopy. J. Environ. Q. 2013, 42, 1763–1770. [Google Scholar] [CrossRef]
  47. Schneider, K.D.; Cade-Menun, B.J.; Lynch, D.H.; Voroney, R.P. Soil phosphorus forms from organic and conventional forage fields. Soil Sci. Soc. Am. J. 2016, 80, 328–340. [Google Scholar] [CrossRef]
  48. Soil Survey Staff. Keys to Soil Taxonomy, 12th ed.; USDA Natural Resources Conservation Service: Washington, DC, USA, 2014. [Google Scholar]
  49. Torrent, J.; Schwertmann, U.; Schulze, D.G. Iron oxide mineralogy of some soils of two river terrace sequences in Spain. Geoderma 1980, 23, 191–208. [Google Scholar] [CrossRef]
  50. Drouineau, G. Dosage rapide du calcaire actif du sol; nouvelles données sur la séparation et la nature des fractions calcaires. Anal. Agron. 1942, 12, 441–450. [Google Scholar]
  51. Walkley, A.; Black, I.A. An examination of the Degtjareff method for determining soil organic matter, and a proposed modification of the chromic acid titration method. Soil Sci. 1934, 37, 29–38. [Google Scholar] [CrossRef]
  52. Dumas, J.B.A. Memoir on the laws governing the substitution of hydrogen by metals in organic compounds. Ann. Chem. Phys. 1831, 48, 198–238. [Google Scholar]
  53. Olsen, S.R.; Cole, C.V.; Watanabe, F.S. Estimation of Available Phosphorus in Soils by Extraction with Sodium Bicarbonate; USDA Circular No. 939; US Government Printing Office: Washington, DC, USA, 1954.
  54. Murphy, J.; Riley, J.P. A modified single solution method for the determination of phosphate in natural waters. Anal. Chim. Acta 1962, 27, 31–36. [Google Scholar] [CrossRef]
  55. Tabatabai, M.A.; Bremner, J.M. Use of p-nitrophenyl phosphate for assay of soil phosphatase activity. Soil Biol. Biochem. 1969, 1, 301–307. [Google Scholar] [CrossRef]
  56. Eivazi, F.; Tabatabai, M.A. Glucosidases and galactosidases in soils. Soil Biol. Biochem. 1988, 20, 601–606. [Google Scholar] [CrossRef]
  57. StatPoint Technologies, Inc. Statgraphics Centurion XVIII [Computer Software]; StatPoint Technologies, Inc.: Warrenton, VA, USA, 2018; Available online: https://www.statgraphics.com/centurion-19 (accessed on 10 February 2025).
  58. Glæsner, N.; Van Der Bom, F.; Bruun, S.; McLaren, T.; Larsen, F.H.; Magid, J. Phosphorus characterization and plant availability in soil profiles after long-term urban waste application. Geoderma 2019, 338, 136–144. [Google Scholar] [CrossRef]
  59. Annaheim, K.E.; Doolette, A.L.; Smernik, R.J.; Mayer, J.; Oberson, A.; Frossard, E.; Bünemann, E.K. Long-term addition of organic fertilizers has little effect on soil organic phosphorus as characterized by 31P NMR spectroscopy and enzyme additions. Geoderma 2015, 257–258, 67–77. [Google Scholar] [CrossRef]
  60. Ran, X.; Tejaswi Uppuluri, N.S.; Deng, Y.; Wang, S.; Ni, Z.; Hu, J.; Müller, J.; Dong, R.; Guo, J.; Oechsner, H. Phosphorus bioavailability and recycling potential in various organic Waste: Assessment by enzymatic hydrolysis and 31P NMR. Bioresour. Technol. 2025, 416, 131790. [Google Scholar] [CrossRef] [PubMed]
  61. Escudey, M.; Galindo, G.; Avendaño, K.; Borchardt, D.; Chang, A.C.; Briceño, M. Distribution of phosphorus forms in Chilean soils and sewage sludge by chemical fractionation and 31P-NMR. J. Chil. Chem. Soc. 2004, 49, 3. [Google Scholar] [CrossRef]
  62. Smith, M.T.E.; Cade-Menun, B.J.; Tibbett, M. Soil phosphorus dynamics and phytoavailability from sewage sludge at different stages in a treatment stream. Biol. Fertil. Soils 2006, 42, 186–197. [Google Scholar] [CrossRef]
  63. He, Z.; Cade-Menun, B.J.; Toor, G.S.; Fortuna, A.; Honeycutt, C.W.; Sims, J.T. Comparison of phosphorus forms in wet and dried animal manures by solution phosphorus-31 nuclear magnetic resonance spectroscopy and enzymatic hydrolysis. J. Environ. Q. 2007, 36, 1086–1095. [Google Scholar] [CrossRef]
  64. Staal, L.B.; Petersen, A.B.; Jørgensen, C.A.; Nielsen, U.G.; Nielsen, P.H.; Reitzel, K. Extraction and quantification of polyphosphates in activated sludge from wastewater treatment plants by 31P NMR spectroscopy. Water Res. 2019, 157, 346–355. [Google Scholar] [CrossRef]
  65. Wang, Q.; Nielsen, U.G. Characterization of the phosphorus speciation in dairy processing sludge by a multi-technique approach. J. Environ. Chem. Eng. 2025, 13, 118093. [Google Scholar] [CrossRef]
  66. Grigatti, M.; Petroli, A.; Ciavatta, C. Plant phosphorus efficiency from raw and composted agro- and bio-waste anaerobic digestates. J. Soil Sci. Plant Nutr. 2023, 23, 3586–3599. [Google Scholar] [CrossRef]
  67. Ran, X.; Uppuluri, N.S.T.; Deng, Y.; Zheng, Y.; Dong, R.; Müller, J.; Oechsner, H.; Li, B.; Guo, J. Comparison of phosphorus species in livestock manure and digestate by different detection techniques. Sci. Total Environ. 2023, 874, 162547. [Google Scholar] [CrossRef]
  68. Preston, C.M.; Cade-Menun, B.J.; Sayer, B.G. Characterization of Canadian backyard composts: Chemical and spectroscopic analyses. Compost Sci. Util. 1998, 6, 53–66. [Google Scholar] [CrossRef]
  69. Mazzini, S.; Borgonovo, G.; Scaglioni, L.; Bedussi, F.; D’Imporzano, G.; Tambone, F.; Adani, F. Phosphorus speciation during anaerobic digestion and subsequent solid/liquid separation. Sci. Total Environ. 2020, 734, 139284. [Google Scholar] [CrossRef]
  70. Wang, Q.; Raju, C.S.; Almind-Jørgensen, N.; Laustrup, M.; Reitzel, K.; Nielsen, U.G. Variation in phosphorus speciation of sewage sludge throughout three wastewater treatment plants: Determined by sequential extraction combined with microscopy, NMR spectroscopy, and powder x-ray diffraction. Environ. Sci. Technol. 2022, 56, 8975–8983. [Google Scholar] [CrossRef] [PubMed]
  71. Bahgat, N.T.; Wilfert, P.; Eustace, S.J.; Korving, L.; van Loosdrecht, M.C.M. Phosphorus speciation in EPS extracted from aerobic granular sludge. Water Res. 2024, 262, 122077. [Google Scholar] [CrossRef]
  72. Chen, S.; Cade-Menun, B.J.; Bainard, L.D.; St. Luce, M.; Hu, Y.; Chen, Q. The influence of long-term N and P fertilization on soil P forms and cycling in a wheat/fallow cropping system. Geoderma 2021, 404, 115274. [Google Scholar] [CrossRef]
  73. Cade-Menun, B.J.; Navaratnam, J.A.; Walbridge, M.R. Characterizing dissolved and particulate phosphorus in water with 31P nuclear magnetic resonance spectroscopy. Environ. Sci. Technol. 2006, 40, 7874–7880. [Google Scholar] [CrossRef] [PubMed]
  74. Hupfer, M.; Glöss, S.; Schmieder, P.; Grossart, H. Methods for detection and quantification of polyphosphate and polyphosphate accumulating microorganisms in aquatic sediments. Int. Rev. Hydrobiol. 2008, 93, 1–30. [Google Scholar] [CrossRef]
  75. Li, L.; Pang, H.; He, J.; Zhang, J. Characterization of phosphorus species distribution in waste activated sludge after anaerobic digestion and chemical precipitation with Fe3+ and Mg2+. Chem. Eng. J. 2019, 373, 1279–1285. [Google Scholar] [CrossRef]
  76. Li, G.; Li, H.; Leffelaar, P.A.; Shen, J.; Zhang, F. Characterization of phosphorus in animal manures collected from three (dairy, swine, and broiler) farms in China. PLoS ONE 2014, 9, e102698. [Google Scholar] [CrossRef]
  77. Turner, B.L.; Leytem, A.B. Phosphorus compounds in sequential extracts of animal manures: Chemical speciation and a novel fractionation procedure. Environ. Sci. Technol. 2004, 38, 6101–6108. [Google Scholar] [CrossRef]
  78. Cosgrove, D.J. Inositol polyphosphates in activated sludge. J. Environ. Q. 1973, 2, 483–485. [Google Scholar] [CrossRef]
  79. Turner, B.L.; Richardson, A.E. Identification of scyllo-inositol phosphates in soil by solution phosphorus-31 nuclear magnetic resonance spectroscopy. Soil Sci. Soc. Am. J. 2004, 68, 802–808. [Google Scholar] [CrossRef]
  80. Lane, J.M.; Delavaux, C.S.; Van Koppen, L.; Lu, P.; Cade-Menun, B.J.; Tremblay, J.; Bainard, L.D. Soil sample storage conditions impact extracellular enzyme activity and bacterial amplicon diversity metrics in a semi-arid ecosystem. Soil Biol. Biochem. 2022, 175, 108858. [Google Scholar] [CrossRef]
  81. Medina, A.; Vassilev, N.; Alguacil, M.M.; Roldán, A.; Azcón, R. Increased plant growth, nutrient uptake, and soil enzymatic activities in a desertified mediterranean soil amended with treated residues and inoculated with native mycorrhizal fungi and a plant growth-promoting yeast. Soil Sci. 2004, 169, 260–270. [Google Scholar] [CrossRef]
  82. Gallardo-Lara, F.; Azcón, M.; Polo, A. Phytoavailability and fractions of iron and manganese in calcareous soil amended with composted urban wastes. J. Environ. Sci. Health Part B 2006, 41, 1187–1201. [Google Scholar] [CrossRef]
  83. Oberson, A.; Joner, E.J. Microbial turnover of phosphorus in soil. In Organic Phosphorus in the Environment; Turner, B.L., Frossard, E., Baldwin, D.S., Eds.; CABI Publishing: Wallingford, UK, 2005; pp. 133–164. [Google Scholar] [CrossRef]
  84. Spohn, M.; Kuzyakov, Y. Phosphorus mineralization can be driven by microbial need for carbon. Soil Biol. Biochem. 2013, 61, 69–75. [Google Scholar] [CrossRef]
  85. Quinn, J.P.; Kulakova, A.N.; Cooley, N.A.; McGrath, J.W. New ways to break an old bond: The bacterial carbon–phosphorus hydrolases and their role in biogeochemical phosphorus cycling. Environ. Microbiol. 2007, 9, 2392–2400. [Google Scholar] [CrossRef]
  86. Chin, J.P.; McGrath, J.W.; Quinn, J.P. Microbial transformations in phosphonate biosynthesis and catabolism; and their importance in nutrient cycling. Cur. Opin. Chem. Biol. 2016, 31, 50–57. [Google Scholar] [CrossRef]
  87. Toor, G.S.; Cade-Menun, B.J.; Sims, J.T. Establishing a linkage between phosphorus forms in dairy diets, feces, and manures. J. Environ. Q. 2005, 34, 1380–1391. [Google Scholar] [CrossRef]
  88. Moro, H.; Park, H.-D.; Kunito, T. Organic Phosphorus Substantially Contributes to Crop Plant Nutrition in Soils with Low Phosphorus Availability. Agronomy 2021, 11, 903. [Google Scholar] [CrossRef]
  89. Afif, E.; Matar, A.; Torrent, J. Availability of phosphate applied to calcareous soils of West Asia and North Africa. Soil Sci. Soc. Am. J. 1993, 57, 756–760. [Google Scholar] [CrossRef]
  90. Talboys, P.J.; Heppell, J.; Roose, T.; Healey, J.R.; Jones, D.L.; Withers, P.J.A. Struvite: A slow-release fertiliser for sustainable phosphorus management? Plant Soil 2016, 401, 109–123. [Google Scholar] [CrossRef]
  91. Liu, X.; Han, R.; Cao, Y.; Turner, B.L.; Ma, L.Q. Enhancing phytate availability in soils and phytate-P acquisition by plants: A review. Environ. Sci. Technol. 2022, 56, 9196–9219. [Google Scholar] [CrossRef]
  92. García-López, A.; Delgado, A.; Plassard, C. Kinetics of phytate adsorption and response of phosphorus forms initially present in alkaline soils. Geoderma 2024, 443, 116800. [Google Scholar] [CrossRef]
  93. Hawkins, J.M.B.; Vermeiren, C.; Blackwell, M.S.A.; Darch, T.; Granger, S.J.; Dunham, S.J.; Hernandez-Allica, J.; Smolders, E.; McGrath, S. The effect of soil organic matter on long-term availability of phosphorus in soil: Evaluation in a biological P mining experiment. Geoderma 2022, 423, 115965. [Google Scholar] [CrossRef]
  94. Renneson, M.; Vandenberghe, C.; Dufey, J.; Marcoen, J.M.; Bock, L.; Colinet, G. Degree of phosphorus saturation in agricultural loamy soils with a near-neutral pH. Eur. J. Soil Sci. 2015, 66, 33–41. [Google Scholar] [CrossRef]
  95. Huygens, D.; Saveyn, H.G.M. Agronomic efficiency of selected phosphorus fertilisers derived from secondary raw materials for European agriculture. A meta-analysis. Agron. Sustain. Dev. 2018, 38, 52. [Google Scholar] [CrossRef]
  96. Kratz, S.; Vogel, C.; Adam, C. Agronomic performance of P recycling fertilizers and methods to predict it: A review. Nutr. Cycl. Agroecosyst. 2019, 115, 1–39. [Google Scholar] [CrossRef]
  97. Hertzberger, A.J.; Cusick, R.D.; Margenot, A.J. A review and meta-analysis of the agricultural potential of struvite as a phosphorus fertilizer. Soil Sci. Soc. Am. J. 2020, 84, 653–671. [Google Scholar] [CrossRef]
  98. Degryse, F.; Baird, R.; Da Silva, R.C.; McLaughlin, M.J. Dissolution rate and agronomic effectiveness of struvite fertilizers—Effect of soil pH, granulation and base excess. Plant Soil 2017, 410, 139–152. [Google Scholar] [CrossRef]
  99. Zambelli, A.; Nocito, F.F.; Araniti, F. Unveiling the Multifaceted Roles of Root Exudates: Chemical Interactions, Allelopathy, and Agricultural Applications. Agronomy 2025, 15, 845. [Google Scholar] [CrossRef]
  100. Afridi, M.S.; Kumar, A.; Javed, M.A.; Dubey, A.; De Medeiros, F.H.V.; Santoyo, G. Harnessing root exudates for plant microbiome engineering and stress resistance in plants. Microbiol. Res. 2024, 279, 127564. [Google Scholar] [CrossRef]
  101. Römer, W.; Samie, I.F. Phosphordüngewirkung eisenhaltiger klärschlämme. J. Plant Nutr. Soil Sci. 2002, 165, 83–91. [Google Scholar] [CrossRef]
  102. Zhang, Y.-Q.; Deng, Y.; Chen, R.-Y.; Cui, Z.-L.; Chen, X.-P.; Yost, R.; Zhang, F.-S.; Zou, C.-Q. The reduction in zinc concentration of wheat grain upon increased phosphorus-fertilization and its mitigation by foliar zinc application. Plant Soil 2012, 361, 143–152. [Google Scholar] [CrossRef]
  103. Sánchez-Rodríguez, A.R.; Rey, M.-D.; Nechate-Drif, H.; Castillejo, M.Á.; Jorrín-Novo, J.V.; Torrent, J.; Del Campillo, M.C.; Sacristán, D. Combining P and Zn fertilization to enhance yield and grain quality in maize grown on Mediterranean soils. Sci. Rep. 2021, 11, 7427. [Google Scholar] [CrossRef]
  104. Boguta, P.; D’Orazio, V.; Senesi, N.; Sokołowska, Z.; Szewczuk-Karpisz, K. Insight into the interaction mechanism of iron ions with soil humic acids. The effect of the pH and chemical properties of humic acids. J. Environ. Manag. 2019, 245, 367–374. [Google Scholar] [CrossRef]
  105. Hafez, M.; Zhang, Z.; Younis, M.; Abdelhamid, M.A.; Rashad, M. Enhancing micronutrient availability through humic substances and vermicompost while growing artichoke plants in calcareous soil: Insights from a two-year field study. Plants 2025, 14, 1224. [Google Scholar] [CrossRef]
  106. Gerke, J. Review Article: The effect of humic substances on phosphate and iron acquisition by higher plants: Qualitative and quantitative aspects. J. Plant Nutr. Soil Sci. 2021, 184, 329–338. [Google Scholar] [CrossRef]
  107. Bolan, N.; Sarmah, A.K.; Bordoloi, S.; Bolan, S.; Padhye, L.P.; Van Zwieten, L.; Sooriyakumar, P.; Khan, B.A.; Ahmad, M.; Solaiman, Z.M.; et al. Soil acidification and the liming potential of biochar. Environ. Pollut. 2023, 317, 120632. [Google Scholar] [CrossRef]
  108. Barzgar, Z.; Towfighi, H.; Fathi-Gerdelidani, A.; Shahbazi, K.; Heidari, A. Effect of different kind of humic and fulvic acids on the release of manganese from calcareous soils. Iran. J. Soil Water Res. 2024, 55, 1151–1165. [Google Scholar] [CrossRef]
  109. Król, A.; Mizerna, K.; Bożym, M. An assessment of pH-dependent release and mobility of heavy metals from metallurgical slag. J. Hazard. Mater. 2020, 384, 121502. [Google Scholar] [CrossRef]
  110. Spark, K.M.; Johnson, B.B.; Wells, J.D. Characterizing heavy-metal adsorption on oxides and oxyhydroxides. Eur. J. Soil Sci. 1995, 46, 621–631. [Google Scholar] [CrossRef]
  111. Madrid, L.; Diaz-Barrientos, E. Influence of carbonate on the reaction of heavy metals in soils. J. Soil Sci. 1992, 43, 709–721. [Google Scholar] [CrossRef]
Figure 1. Effect of P fertilizer treatments on plant dry matter (g pot−1) in the Fe oxide-rich soil (A) and in the Calcareous soil (B). Means and standard deviation (error bars) of the five replicates are shown (n = 5). Different letters indicate significant differences among means for each BBF in each soil according to LSD, p < 0.001. Control: unfertilized control; SSP 50: 50 mg of single superphosphate (SSP) per kilogram of soil; Sludge: sewage sludge; SS Compost: sewage sludge compost; MSW: municipal solid waste; Vineyard: vineyard compost; OH compost: olive husk compost; OHM: olive husk compost treatment with microorganisms; Manure VC: horse manure vermicompost; Pruning VC: pruning residues vermicompost.
Agronomy 16 01058 g001
Figure 2. Effect of P fertilizer treatments on grain yield (g pot−1) in the Fe oxide-rich soil (A) and in the Calcareous soil (B). Means and standard deviation (error bars) of the five replicates are shown (n = 5). Different letters indicate significant differences among means for each soil for each BBF according to LSD, p < 0.01. Control: unfertilized control; SSP 50: 50 mg of single superphosphate (SSP) per kilogram of soil; Sludge: sewage sludge; SS Compost: sewage sludge compost; MSW: municipal solid waste; Vineyard: vineyard compost; OH: olive husk compost; OHM: olive husk compost treatment with microorganisms; Manure VC: horse manure vermicompost; Pruning VC: pruning residues vermicompost.
Agronomy 16 01058 g002
Figure 3. Effect of the different P fertilizer treatments on the phosphorus-to-zinc ratio in the Fe oxide-rich soil (A) and in the Calcareous soil (B). Means and standard deviation (error bars) of the five replicates are shown (n = 5). Different letters indicate significant differences among means for each stage according to LSD, p < 0.001. Control: unfertilized control; SSP 50: 50 mg of single superphosphate (SSP) per kilogram of soil; Sludge: sewage sludge; SS Compost: sewage sludge compost; MSW: municipal solid waste; Vineyard: vineyard compost; OH: olive husk compost; OHM: olive husk compost treatment with microorganisms; Manure VC: horse manure vermicompost; Pruning VC: pruning residues vermicompost.
Agronomy 16 01058 g003
Figure 4. Effect of the different P fertilizer treatments on the mineral phosphorus replacement value (MPRV in %) in the Fe oxide-rich soil (A) and in the Calcareous soil (B). Means and standard deviation (error bars) of the five replicates are shown (n = 5). Different letters indicate significant differences among means for each soil for each BBF according to LSD, p < 0.05 Fe-soil; p < 0.001 Ca-soil. Control: unfertilized control; SSP 50: 50 mg of single superphosphate (SSP) per kilogram of soil; Sludge: sewage sludge; SS Compost: sewage sludge compost; MSW: municipal solid waste; Vineyard: vineyard compost; OH: olive husk compost; OHM: olive husk compost treatment with microorganisms; Manure VC: horse manure vermicompost; Pruning VC: pruning residues vermicompost.
Agronomy 16 01058 g004
Table 1. Applied rate per pot of biobased fertilizers (BBFs) to meet the targeted rate of 50 mg P kg−1 soil used in the greenhouse study, and various properties of the BBFs, including pH, electrical conductivity and total concentrations of different elements (on a dry matter basis).
BBFs
Applied Rate *
pHECC/NCNPCaMgKNaSFeMnZnCu
g kg−1 Soil µS cm−1 g kg−1mg kg−1
Struvite0.48.40.41.78550.0125.02152ndndnd0.1200.0<10<10
Vivianite0.56.215.7ndndnd105.046.02.05.45.5172.22761.9632.620.6
Sludge12.27.45.29.8120.212.316.7657.91.65.73.758.0455.51144.1207.7
SS Compost6.36.42.913.7203.014.88.9314.72.10.42.918.1597.2452.6104.5
MSW9.67.76.525.0410.016.45.61369.67.37.42.76.7131.4475.3136.3
Vineyard19.57.62.218.5398.421.64.0734.322.30.66.22.884.561.386.5
OH compost31.58.92.432.6471.814.51.8285.924.70.43.02.890.236.657.6
OHM Compost41.79.61.513.1234.317.91.7317.028.62.32.34.4143.896.680.9
Manure VC16.37.22.617.3270.115.64.1945.87.20.62.29.3297.9112.463.1
Pruning VC21.17.71.313.3221.116.64.11546.05.40.53.89.3317.4116.933.6
Max6.05.08.513.7193.014.19.0661452.10.63.88.3437.9221.8110.0
Moge34.89.79.414.4261.018.11.8132535.1nd2.70.823.220.717.9
Digestate23.89.72.110.6373.535.14.42012.228.79.610.42.9254.5520.563.2
Fish meal2.25.715.221.1336.616.024.4441.99.142.44.10.24.5117.34.5
EC: electrical conductivity; C: carbon; N: nitrogen; P: phosphorus; Ca: calcium; Mg: magnesium; K: potassium; Na: sodium; S: sulfur; Fe: iron; Mn: manganese; Zn: zinc; Cu: copper; nd: not determined; MSW: municipal solid waste; OH compost: olive husk compost; OHM compost: olive husk compost with microorganisms. * The fertilizer applied is expressed as g kg−1 fresh (undried, as appropriate) product, applied at 50 mg P kg−1 soil per pot. Sludge: sewage sludge; SS Compost: sewage sludge compost; MSW: municipal solid waste; Vineyard: vineyard compost; OH: olive husk compost; OHM: olive husk compost treatment with microorganisms; Manure VC: horse manure vermicompost; Pruning VC: pruning residues vermicompost.
Table 2. Properties before fertilizer addition of the iron (Fe) oxide-rich soil (Fe-soil) and calcareous soil (Ca-soil) used in the greenhouse study.
Texture
SandLoamClaySOCTotal NpHECCCEOlsen PCaMgNaKFeMnZnCu
g kg−1g kg−1 µS cm−1g kg−1mg kg−1cmolc kg−1mg kg−1
Fe-soil5901602507.00.88.2410970.59.411.40.70.60.095.112.70.615.6
Ca-soil560370708.70.98.22292437.522.25.10.60.60.114.413.91.427.5
SOC: soil organic carbon; Total N: total nitrogen; pH in water; EC: electrical conductivity; CCE: calcium carbonate equivalent; Ca, Mg, Na, and K refer to exchangeable cations (calcium, magnesium, sodium, and potassium) extracted with 1 M ammonium acetate at pH 7; in the calcareous soil; Fe, Mn, Zn, and Cu refer to DTPA extractable iron, manganese, zinc, and copper.
Table 3. Phosphorus compounds and general P categories determined by solution 31P-NMR spectroscopy in the 0.25 M NaOH + 0.05 M Na–EDTA extracts of 12 BBFs. The content is expressed as the percentage of extracted P, while P recovery is the percentage of BBF total P extracted by NaOH–EDTA.
Total
Inorganic P
Inorganic PTotal Organic POrganic PP Recovery Values (%)
BBFsOrthoPPyroPPolyPMonoesterMonoester 1Monoester 2DiesterPhosphonate
myo-IHPchiro-IHPscyllo-IHPmyo-1Pα-Glycβ-GlycDNAOther Di
Sludge86.583.13.4 13.5 4.00.71.31.714.1103.7
SS Compost90.288.80.70.79.81.2 1.21.8 5.676.2
MSW81.477.31.62.518.63.91.3 2.63.00.71.41.61.13.046.6
Vineyard86.784.61.11.013.31.81.8 1.23.60.61.21.11.01.069.6
OH compost82.681.9 0.717.42.0 3.38.50.30.7 2.6117.1
OHM compost80.377.50.72.119.74.02.0 6.10.71.3 1.43.549.1
Manure VC79.878.40.70.720.24.02.00.7 2.04.70.71.30.70.72.783.4
Pruning VC78.778.10.30.421.36.4 1.3 3.25.10.61.30.40.32.186.6
Max85.484.80.30.314.62.84.2 1.43.50.71.40.6 78.4
Moge74.573.80.7 25.56.31.9 1.98.81.22.0 0.72.784.1
Digestate84.783.31.4 15.31.81.8 1.23.61.22.4 1.22.155.1
Fish Meal90.889.5 1.39.2 1.3 3.20.61.61.00.90.693.3
OrthoP: orthophosphate; PyroP: pyrophosphate; PolyP: polyphosphate; Myo IHP: myo-inositol hexakisphosphate (IHP); chiro-IHP: chiro IHP 4e/2a + chiro IHP 2e/4; myo-1P: myo-inositol 1 dihydrogen phosphate; α and β glyc: α and β glycerophosphate; DNA: deoxyribonucleic acid; OthDi: diester regions 1 and 2, excluding DNA; Sludge: sewage sludge; SS Compost: sewage sludge compost; MSW: municipal solid waste; Vineyard: vineyard compost; OH: olive husk compost; OHM: olive husk compost treatment with microorganisms; Manure VC: horse manure vermicompost; Pruning VC: pruning residues vermicompost.
Table 4. Total content of phosphorus (P), magnesium (Mg), iron (Fe), manganese (Mn), zinc (Zn) and copper (Cu) (mg kg−1) in grain, and copper in straw, of wheat plants grown in both soils, Fe oxide-rich (Fe-soil) and calcareous (Ca-soil). Values are means (n = 5).
PMgFeMnZnCuCu
(mg kg−1) Grain(mg kg−1) Straw
Fe-SoilCa-SoilFe-SoilCa-SoilFe-SoilCa-SoilFe-SoilCa-SoilFe-SoilCa-SoilFe-SoilCa-SoilFe-SoilCa-Soil
Control2.91 de3.85 p54.070.5 qrs14.1 cde12.2 rs11.5 cdef14.6 opq26.4 cde43.4 op7.6 bcdef9.0 op8.1 ef12.7 rst
SSP 50 3.63 bcd4.94 op60.682.9 opqrs15.3 bcd17.5 opq13.9 bcd14.8 opq16.6 e40.6 op7.1 cdefg9.2 op14.2 ab17.4 op
Struvite3.71 abcd4.67 op68.484.1 opq15.0 bcde15.7 qrst14.6 abc16.2 opq25.2 cde40.4 op7.3 cdefg10.1 op14.6 a19.8 o
Vivianite3.18 cde3.63 p58.264.7 s15.1 bcd13.1 qrs9.6 efg9.5 pq23.1 de35.6 p6.9 efgh8.9 op9.2 abcd12.3 stu
Sludge4.15 ab4.03 op67.476.7 pqrs18.5 a16.3 opqr15.7 abc11.8 opq48.4 ab53.3 op8.9 a10.5 o12.3 abc15.5 pq
SS Compost3.62 cd4.14 op65.278.4 pqrs13.8 cde16.2 opqr10.5 defg10.8 pq32.3 abcde44.7 op8.2 abc10.5 o11.8 abcde15.0 pqr
MSW2.72 e4.14 op53.874.9 pqrs11.5 de16.3 opqr9.8 efg13.7 opq35.9 abcde59.2 op8.2 abc9.4 op9.6 cdef15.3 pqr
Vineyard3.20 cde4.82 op66.986.2 op13.2 cde15.7 pqrs11.6 bcd16.8 op32.2 abcde54.2 op7.4 bcdef9.4 op9.5 cdef11.8 stu
OH compost4.56 a4.88 op71.582.9 opqr11.9 de14.7 qrs18.3 ab16.0 opq49.5 a58.3 op8.4 ab9.1 op10.2 cdef13.0 qrst
OHM compost3.90 abc4.45 op64.074.6 opqr13.1 cde13.3 qrs13.9 bc13.1 opq42.8 abcd49.6 op7.0 defgh7.7 p7.4 f9.7 u
Manure VC4.10 ab4.61 p68.079.4 pqrs12.7 cde13.8 qrs11.9 cdef11.7 opq32.6 abcde46.5 op8.2 abcd10.3 op10.7 abcde16.1 pq
Pruning VC3.80 abcd4.94 o66.289.5 op12.8 cde21.1 o13.0 cde22.4 o34.0 abcde60.8 op8.1 abcd10.2 op10.4 bcdef14.5 pqr
Max3.84 abc4.88 op67.083.7 opqr16.2 abc17.9 opq10.4 cdef15.9 opq33.1 abcde52.5 op6.0 h8.5 op10.5 bcdef14.3 qrs
Moge4.13 ab4.23 p69.968.5 rs16.1 abc11.1 s20.2 a14.4 opq45.2 abc44.2 op8.0 abcde8.3 op8.7 def10.7 uv
Digestate3.46 bcde4.00 op59.670.2 qrs11.0 e13.7 qrs 8.0 g 8.1 q29.5 abcde40.0 p7.9 abcdef9.8 op10.9 abcde14.7 pqr
Fish Meal3.02 cde5.62 o56.296.9 o11.4 de20.1 op 9.1 fg15.5 opq28.3 bcde67.5 o6.2 gh9.2 op10.4 bcdef13.7 qrs
p < 0.01 p < 0.01 nsp < 0.01 p < 0.01 p < 0.05 p < 0.001 p < 0.01 p < 0.001 p < 0.01 p < 0.001 p < 0.01 p < 0.001 p < 0.01
Different letters indicate significant differences among means for each BBF (n = 5) according to LSD. Fe-soil: Fe oxide-rich soil; Ca-soil: calcareous soil. Control: unfertilized control; SSP 50: 50 mg of single superphosphate (SSP) per kilogram of soil; Sludge: sewage sludge; SS Compost: sewage sludge compost; MSW: municipal solid waste; Vineyard: vineyard compost; OH: olive husk compost; OHM: olive husk compost treatment with microorganisms; Manure VC: horse manure vermicompost; Pruning VC: pruning residues vermicompost.
Table 5. Effect of the different P fertilizer treatments on the acid phosphatase, alkaline phosphatase and β-Glucosidase potential activity (p-NPP), in the Fe oxide-rich soil and in the Calcareous soil. Means and standard deviation of the five replicates are shown (n = 5).
Acid PhosphataseAlkaline Phosphataseβ-Glucosidase
Fe-SoilCa-SoilFe-Soil *Ca-SoilFe-SoilCa-Soil
Control61.6 ± 7.8 efg73.6 ± 6.7 rsdtu104.5 ± 6.9 b124.9 ± 20.7 tu62.0 ± 1.9 ef50.0 ± 3.1 tu
SSP 5064.4 ± 6.0 efg3.5 ± 5.2 u96.6 ± 1.2 c142.1 ± 18.3 qrst61.3 ± 3.1 f47.3 ± 1.2 u
Struvite63.9 ± 12.8 fg67.1 ± 8.1 stu111.8 ± 9.9128.1 ± 6.3 stu65.1 ± 1.3 bcdef52.4 ± 1.5 stu
Vivianite68.6 ± 5.7 def116.3 ± 20.6 opq111.9 ± 6.2138.4 ± 18.9 qrst62.6 ± 0.8 def54.9 ± 2.0 stu
Sludge73.7 ± 11.3 cdef100.9 ± 13.4 pqr134.6 ± 24.1162.6 ± 13.7 opqrs68.2 ± 2.8 bcde55.2 ± 1.8 rst
SS Compost76.7 ± 6.8 cdef90.6 ± 8.1 qrstu112.0 ± 9.6121.4 ± 5.5 tu66.3 ± 2.8 bcdef57.7 ± 1.4 qrs
MSW91.2 ± 13.4 bcd65.8 ± 6.7 tu153.3 ± 12.1130.3 ± 9.0 rstu61.1 ± 1.7 f54.2 ± 3.6 stu
Vineyard 80.3 ± 9.6 cdef89.5 ± 5.8 qrstu131.3 ± 4.4161.8 ± 29.3 pqrst64.1 ± 2.8 def55.5 ± 2.2 qrst
OH compost141.9 ± 21.0 a95.2 ± 8.5 pqrst272.3 ± 26.9 a,d160.0 ± 8.4 opqrs70.2 ± 1.8 abcd62.0 ± 1.5 opqr
OHM Compost96.5 ± 8.9 bc87.8 ± 9.8 qrstu226.1 ± 17.0 d178.2 ± 35.7 opqr64.1 ± 1.8 cdef65.0 ± 3.0 op
Manure VC81.5 ± 6.4 bcdef112.4 ± 9.3 pq140.5 ± 8.2184.9 ± 9.5 op70.2 ± 2.0 abc65.8 ± 0.3 o
Pruning VC82.8 ± 6.7 bcde124.5 ± 10.7 op182.9 ± 26.7160.1 ± 10.5 opqrs71.1 ± 3.4 ab62.3 ± 2.7 opq
Max48.7 ± 4.4 g68.3 ± 8.1 stu116.4 ± 3.8104.2 ± 6.5 u66.7 ± 3.6 bcdef56.2 ± 2.2 qrst
Moge95.0 ± 8.9 bcd96.7 ± 11.4 pqrst232.0 ± 37.4239.1 ± 6.8 o76.7 ± 3.0 a66.5 ± 3.3 o
Digestate99.6 ± 17.1 bc102.2 ± 8.1 pqr180.2 ± 11.9178.4 ± 18.6 opq69.3 ± 4.0 bcd57.7 ± 3.5 qrs
Fish meal109.6 ± 7.8 ab144.6 ± 22.4 o314.3 ± 47.3 a,d131.5 ± 14.0 stu69.9 ± 2.5 abc58.3 ± 2.4 qrst
p < 0.001 p < 0.001 * p < 0.05 p < 0.001 p < 0.001 p < 0.001
Different letters indicate significant differences among means for each BBF (n = 5) according to LSD. Fe-soil: Fe oxide-rich soil; Ca-soil: calcareous soil. Control: unfertilized control; SSP 50: 50 mg of single superphosphate (SSP) per kilogram of soil; Sludge: sewage sludge; SS Compost: sewage sludge compost; MSW: municipal solid waste; Vineyard: vineyard compost; OH: olive husk compost; OHM: olive husk compost treatment with microorganisms; Manure VC: horse manure vermicompost; Pruning VC: pruning residues vermicompost. * Kruskal–Wallis.
Disclaimer/Publisher’s Note: The statements, opinions and data contained in all publications are solely those of the individual author(s) and contributor(s) and not of MDPI and/or the editor(s). MDPI and/or the editor(s) disclaim responsibility for any injury to people or property resulting from any ideas, methods, instructions or products referred to in the content.