Article

Stop and Smell the Grasses: Evolution of Scent Producing Genus Cymbopogon
by
Luciano Carlos da Maia
1,*,
Antonio Costa de Oliveira
1,
Camila Pegoraro
1,
Leticia Carvalho Benitez
2,
Cesar Valmor Rombaldi
3,
Luis Willian Pacheco Arge
4,
Gabriel Brandão das Chagas
1 and
Eugenia Jacira Bolacel Braga
5
1
Plant Genomics and Breeding Center, Department of Plant Sciences, Faculty of Agronomy “Eliseu Maciel”, Federal University of Pelotas, Capão do Leão 96160-000, RS, Brazil
2
Academic Unit of Exact Sciences and Nature, Federal University of Campina Grande, Cajazeiras Campus, Cajazeiras 58900-000, PB, Brazil
3
Department of Agroindustrial Science and Technology, Faculty of Agronomy “Eliseu Maciel”, Federal University of Pelotas, Capão do Leão 96160-000, RS, Brazil
4
Department of Agronomy and Plant Genetics, University of Minnesota, Saint Paul, MN 5518-60226, USA
5
Department of Botany, Biology Institute, Plant Physiology, Federal University of Pelotas, Pelotas 96010-900, RS, Brazil
*
Author to whom correspondence should be addressed.
Agronomy 2026, 16(10), 999; https://doi.org/10.3390/agronomy16100999
Submission received: 29 March 2026 / Revised: 5 May 2026 / Accepted: 11 May 2026 / Published: 19 May 2026

Abstract

The genus Cymbopogon comprises neocosmopolitan grasses widely used as medicinal plants and in the perfume, pharmaceutical and herbal product industries. Despite their economic relevance, these species are still considered orphan crops, with limited phytotechnical, genomic and evolutionary studies within the Poaceae family. In this study, we investigated the evolutionary relationships of Cymbopogon flexuosus and Cymbopogon winterianus, with a focus on differences in gene expression associated with the biosynthesis of secondary metabolites. De novo transcriptome assembly yielded 25,576 transcripts in C. flexuosus and 42,250 in C. winterianus. A total of 5318 and 8631 more informative differentially expressed transcripts (DETs) were identified in each mapping, among which 76 and 94 were associated with secondary metabolism pathways. When mapping the libraries against related species, the highest percentages of mapped reads per transcriptome and per gene (depth) were observed in Andropogon gerardi, Sorghum bicolor, Saccharum officinarum, Miscanthus sinensis, Miscanthus lutarioriparius and Zea mays. These results indicate A. gerardi, S. bicolor and Z. mays as the most promising genomic models for future studies within the genus Cymbopogon. Comparison of the expression of transcripts that are homologous to the precursor enzymes of terpenoids, phenylpropanoids, flavonoids and other secondary metabolites revealed a complex and non-linear interaction between the metabolic pathways in each species and it was not possible to predict the predominance of greater expression of a class of metabolites on a given species.

1. Introduction

In tropical, subtropical and temperate grasslands distributed worldwide, the dominant vegetation is composed of grasses, mainly species from the tribe Andropogoneae (subfamily Panicoideae), which includes approximately 98 genera and 1202 species [1]. This tribe holds significant ecological and economic importance, as it comprises some of the most extensively utilized species in agriculture, including maize, sugarcane, sorghum, Miscanthus and various forage grasses.
From an evolutionary perspective, recent studies indicate that the diversification of grasses began approximately 98–101 million years ago [2,3]. There is also evidence that, within the Andropogoneae tribe, a substantial number of allopolyploidization events have occurred over the past 10 million years, leading to the emergence of polyploid species in roughly one-third of all speciation events within the group [1,4].
The genus Cymbopogon was initially established by Sprengel in 1815 as one of the subgenera of Andropogon and is currently classified within the family Poaceae, subfamily Panicoideae, supertribe Andropogonodae and tribe Andropogoneae [5]. Currently this genus comprises 180 species, subspecies and botanical varieties originating from temperate and tropical regions of the old world and Oceania and currently cultivated in Africa, India, Australia, Europe, America and South Asia [6].
The International Plant Names Index (IPNI) portal reports the existence of 168 species in the genus Cymbopogon. Some authors report the occurrence of 52 species in Africa, 45 in India, six in Australia and South America, four in Europe and the remainder distributed across southern Asia [7]. The basic chromosome number in Cymbopogon is x = 10, with diploid (2n = 20), tetraploid (2n = 40) and hexaploid (2n = 60) species [8,9]. However, information about the origin of these larger genomes, whether by auto- or alloploidization events, is still needed.
Most representatives of this genus are commonly known as aromatic grasses and produce essential oils of significant economic importance in the food, fragrance, cosmetic and pharmaceutical industries, in addition to their use in traditional medicine as teas and/or infusions [10,11]. Due to variations in the chemical composition of their essential oils, certain species are more widely used and valued. These are typically grouped into three categories: lemongrass (Cymbopogon flexuosus (Nees ex Steud.) Wats. and C. citratus Stapf), citronella (C. winterianus (Jowitt) and C. nardus (L.) Rendle) and palmarosa (C. martinii (Roxb.) W. Watson). In Brazil, C. citratus (DC.) Stapf is not only referred to as “capim-limão” (lemongrass), but also as “capim-cidreira”, “erva-cidreira” and “capim-santo”.
Lemongrass is widely used in folk medicine for its diuretic, analgesic, antioxidant, hypocholesterolemic, antipyretic, antiplasmodic, digestive, sedative and especially calming properties [12]. Additional studies have reported its anti-inflammatory, antitumor, antioxidant and antimicrobial activities [13]. Citronella is commonly used as an insect repellent, insecticide, antifungal agent, bactericide, antiseptic, antispasmodic, diuretic, antioxidant, anti-inflammatory compound and in the formulation of perfumes and cosmetics [10,11,14,15,16]. Palmarosa primarily contains geraniol and geranyl acetate and is used as a flavoring agent in the food and fragrance industries, as well as in cosmetic and pharmaceutical products [17].
In lemongrass species in different studies with different accessions and/or cultivation environments, the main compounds identified were citral (neral and geranial) (54.80–76.46%), geranyl acetate (3.73–12%), geraniol (3.04–7.02%) and linalool (2.5–11%). In other cases, the predominant constituents included geranial (α-citral) (27–50%), neral (β-citral) (4.53–34.98%), linalool (2.5–11%) and myrcene (9–27%), among others [6,15]. In citronella, variations in chemical composition have been reported depending on the essential oil extraction method and the cultivation environment. However, in general, the most abundant components are citronellal (2.2–55.4%), geraniol (14.2–53.0%) and citronellol (8.2–16.4%), within a total of 37 compounds that accounted for approximately 96% of the total oil composition [14].
The characterization of genetic resources is a fundamental step in the planning of breeding strategies. However, some species, even with a known economic importance, are still neglected, being regarded as orphan species. In this context, the study of Cymbopogon species using modern transcriptomic tools will contribute to a better understanding of the species per se, the evolutionary aspects of the genus and the tribe Andropogoneae, in addition to generating relevant information from a molecular point of view regarding the genes involved in the biosynthesis of the essential oil components of these species.
The aim of this study was to evaluate the degree of conservation of expressed regions in Cymbopogon species (C. flexuosus and C. winterianus) and in related grasses. Additionally, we sought to integrate metabolomic data with transcript expression profiles associated with secondary metabolism, with the goal of elucidating the molecular mechanisms underlying essential oil biosynthesis in these species.

2. Materials and Methods

2.1. Plant Material, Sequencing and Construction of the De Novo Reference Transcriptome

Accessions of C. flexuosus (lemongrass) and C. winterianus (citronella) were cultivated in plots at the experimental field of the School of Agronomy “Eliseu Maciel” at the Federal University of Pelotas, located in Capão do Leão, Rio Grande do Sul, Brazil (31°48′ S, 52°24′ W, altitude 14 m) [18]. Samples from each species—comprising bulks of young leaves collected from two individual plants—were ground in liquid nitrogen. Total RNA was extracted using the Plant RNA Reagent PureLink® (Invitrogen™, Waltham, MA, USA) and assessed using a Bioanalyzer to determine RNA integrity number (RIN) values. Two samples per species (cf1, cf2, cw1 and cw2) were prepared using the TruSeq RNA Sample Preparation® Kit v2, 2 × 100 paired-end (Illumina™, San Diego, CA, USA) and sequenced on an Illumina HiSeq2500 V4 platform.
Initially, the libraries were processed with the SortMeRNA software v. 2.1, to remove reads corresponding to rRNA [19,20]. The quality analyses of the libraries were performed using the software FastQC v0.11.2, followed by trimming of low-quality reads using Trimmomatic v. r2013 [21] with the following parameters: PE, ILLUMINACLIP, SLIDINGWINDOW:4:25, LEADING:10, TRAILING:10 and MINLEN:90, according to [20].
The de novo assembly of reference transcriptomes for each species was performed using Trinity v. r2013 [22,23]. These transcriptomes were subsequently processed with CAP3 [24] to cluster contig sequences with partial overlaps [23], generating the final reference transcriptomes composed of contigs named to as non-redundant transcripts (nr-transcripts).
To select the most informative nr-transcripts, the raw reads from each species were separately back-mapped to their respective C. flexuosus and C. winterianus reference transcriptomes using Hisat2 v.2.1.0 [25], Samtools v.1.23.1 [26] and HTSeq-count v. 2.0.2 [27], as described by [28]. The edgeR package v.4 [27,29,30] was then used to convert raw counts into CPM (counts per million) values, retaining only nr-transcripts with CPM ≥ 1.

2.2. Identification of Homologous nr-Transcripts Between Lemongrass and Citronella

To identify homologous transcript sequences between the two species, FASTA files containing the nucleotide contigs of the nr-transcripts from lemongrass and citronella were mutually aligned against each other using BlastN v.2.14.0 [31] with an E-value threshold of 1 × 10−50 [32].
CPM values of homologous and species-specific nr-transcripts were used to assess the reproducibility between samples through principal component analysis (PCA), Pearson correlation and data distribution analysis, following the methodology adapted from [27]. The ggplot2 library v. 3.5.0 in R [30,33] was used to plot the graphs.

2.3. Differential Expressions, Functional Annotation and Gene Ontology (GO) Analysis

Differential expression of transcripts (DETs) analysis was performed independently for the reference transcriptomes of each species. DETs were estimated by calculating the ratio of CPM values between C. flexuosus and C. winterianus, which was transformed to Log2 fold change [Log2FC (CPMcf/CPMcw)] using the edgeR package in R [29,30]. Only nr-transcripts with p-value and false discovery rate (FDR) < 0.05 were considered differentially expressed transcripts (DETs) between the two species [27,28].
Frequency distribution, box plot and volcano plots were used for general view of the transcriptomes. The percentages of DETs most expressed in lemongrass (positive values) or citronella (negative values) of each mapping were plotted in a bar graph. All graphs were obtained using the ggplot2 library in R [30,33].
For functional annotation, a local protein database was constructed comprising 14,241,458 plant protein sequences with annotated functions. These sequences were retrieved from Phytozome [34], UniProt [35], the MSU Rice Genome Annotation Project [36], Miscanthus lutarioriparius [37], Bothriochloa decipiens [38], Dichanthelium oligosanthes [39] and Digitaria exilis [40]. Alignments between the nucleotide nr-transcripts and the local protein database were performed using DIAMOND v.2.1.19 [41] with the following parameters: blastx, sensitive and E-value 1 × 10⁻¹⁰.
In-house Perl and R scripts were used to integrate annotation results with the “goslim_plant.obo” file from The Gene Ontology Consortium [42]. The GO term counts for each category—molecular function (MF), cellular component (CC) and biological process (BP)—were obtained using TBtools v 2.475 [43] and the results visualized as bar plots generated with ggplot2 in R.

2.4. Comparative Reads Mapping Between Cymbopogon and Related Grasses

Nucleotide sequences of expressed regions (transcripts/CDSs) from species belonging to the tribes Andropogoneae (Andropogon gerardi v1.1, Bothriochloa decipiens, Miscanthus lutarioriparius, Miscanthus sinensis v7.1, Saccharum officinarum v2.1, Sorghum bicolor v3.1.1 and Zea mays V4), Paniceae (Dichanthelium oligosanthes, Digitaria exilis, Panicum hallii v3.2, Panicum virgatum v5.1, Setaria italica v2.21 and Setaria viridis v4.1), Triticeae (Hordeum vulgare r1 and Triticum aestivum cv. Chinese Spring v2.1), Brachypodieae (Brachypodium distachyon v3.2), Cynodonteae (Eleusine coracana v1.1), Oryzeae (Oryza sativa cv. Nipponbare v7) and an outgroup Eudicotyledon (Arabidopsis thaliana, Araport11), were used for this analysis. Most data were obtained from the Phytozome portal [34], while datasets for M. lutarioriparius [37], D. oligosanthes [39], D. exilis [40] and B. decipiens [38] were retrieved from the sources listed in Supplementary Table S1. For polyploid species, sequences were split by subgenome. For all species, only one transcript per locus/gene was retained.
The Hisat2 v.2.1.0, Samtools v.1.23.1 and HTSeq-count v.2.1.2 software were used for mapping and counting mapped reads, respectively. Only genes with a total read count between 10 and 10,000 mapped reads per locus per sample were retained. In each species, the percentages of mapped reads, number of mapped genes and total reads mapped per gene (depth) were calculated. To rank the similarities between Cymbopogon and the other species, an ordering value (sort index) was proposed, obtained by multiplying the average number of mapped transcripts, average percentage of mapped reads and average depth per transcript (index = [(avg number of mapped transcripts × avg % mapped reads) × avg transcript depth]/1000.

2.5. Chloroplast Genome Phylogeny of Cymbopogon and Related Species

For phylogenetic and molecular clock analyses, complete chloroplast genome sequences from several species were retrieved from the NCBI database. The dataset included Aegilops tauschii, Andropogon distachyos, A. gerardi, A. virgatus, Arabidopsis thaliana, Bothriochloa alta, B. decipiens, Brachypodium distachyon, two accessions of C. citratus, C. densiflorus, two accessions of C. flexuosus, C. martinii, C. obtectus, C. pospischilii, C. schoenanthus, C. winterianus, Dichanthelium dichotomum, D. acuminatum, D. exilis, Eleusine coracana, Hordeum vulgare, Miscanthus sinensis, M. lutarioriparius, Oryza sativa, Oryza rufipogon, Panicum virgatum, P. hallii, Sorghum bicolor, S. bicolor subsp. drummondii, S. halepense, Saccharum spontaneum, S. officinarum, Setaria italica, S. viridis, Triticum aestivum, Zea mays subsp. parviglumis and Z. mays (Supplementary Table S2).
Initially, these sequences were subjected to global alignment in the MAFFT v.7 software [44]. A phylogenetic tree was then constructed using RAxML v8.2.12 [45] with 1000 bootstrap replications (adapted from [46]). The analysis was performed using the maximum likelihood (ML) method with the substitution method being that of the general time reversible and rates among sites; gamma distributed with invariant sites (GTRGAMMAI) method, identified in the ModelTest-NG v0.1.7 software [47].
To estimate “divergence time”, the ML tree generated by RAxML was used in the RealTime method function [48] in the MEGA software v. 11 [49] using the same substitution model, adapted from [50]. In the calibrations, the divergence times between ‘Zea mays-Oryza sativa’ and ‘Sorghum bicolor-Zea mays’ with values of 49 and 17 mya, respectively, were used, considering “normal distribution” and standard deviation of 2 mya. Additionally, the genetic distance between the species was calculated through the “maximum composite likelihood-MCL” model with a bootstrap with 1000 replications, in the Mega v.11 program. The degree of association between the “index” value and “divergence time” was analyzed through a linear regression graph.

2.6. Phylogeny of Metabolic Genes in Cymbopogon and Related Species

To test the hypothesis that genes involved in the biosynthesis of secondary metabolites in the genus Cymbopogon are evolutionarily conserved and related to the phylogenetic history of grasses, four phylogenetic trees (scenarios 1, 2, 3 and 4) were constructed using the same methodology described previously. Amino acid sequences of enzymes described in KEGG for the evaluated biosynthetic pathways (Figure S1) were used to search for homologous sequences in A. gerardi, Arabidopsis thaliana, B. decipiens, B. distachyon, C. flexuosus, C. winterianus, D. exilis, D. oligosanthes, E. coracana, H. vulgare, M. lutarioriparius, M. sinensis, O. sativa, P. hallii, P. virgatum, S. bicolor, S. italica, S. officinarum, S. viridis, T. aestivum and Z. mays using tblastn [31] with an E-value threshold of 1 × 10⁻¹⁰.
For scenario 1, homologous transcripts of K19653 (geoA-geraniol dehydrogenase—EC:1.1.1.347), K12957 (ahr-alcohol/geraniol dehydrogenase—EC: 1.1.1.183), K17832 (geoB-geranial dehydrogenase—EC:1.2.1.86), K13774 (atuB-citronellol/citronellal dehydrogenase), K13775 (atuD-citronellol/citronellal dehydrogenase—atuG) and K11731 (atuD-citronellyl-CoA dehydrogenase—EC:1.3.99.-) were used, described in KEGG as responsible for the synthesis of trans-citral, neral, geranic acid, citronellal, citronellyl-COA and cis-geranyl-COA. For scenario 2, homologues of K20979 (GES-geranyl diphosphate diphosphatase—EC:3.1.7.11) were added. For scenario 3, homologues of K12467 (myrcene/ocimene synthase—EC:4.2.3.15), K15088 (S-limonene synthase—EC:4.2.3.16), K15096 (R-limonene synthase—EC:4.2.3.20), K15086 (3S-linalool synthase—EC:4.2.3.25) and K15087 (3R-linalool synthase—EC:4.2.3.26) were used, associated with the synthesis of secondary metabolites in many aromatic species. For scenario 4, homologues of K20979 were added.

2.7. KEGG Orthology Annotation and Metabolism Overview

To identify differences in secondary metabolism between C. flexuosus and C. winterianus, transcript annotation was performed based on sequence homology searches in the Kyoto Encyclopedia of Genes and Genomes (KEGG) database [51,52]. Amino acid sequences of the proteins annotated for each nr-transcript were saved in FASTA format and aligned against the KEGG Orthology database using the BlastKOALA tool [53]. The resulting alignments were then classified and grouped according to KEGG Orthology functional categories.
To facilitate this, a local database was constructed using in-house Perl and R scripts, integrating annotation data from eight KEGG Orthology categories manually downloaded from https://www.genome.jp.
In order to detail the patterns of expression differences of the DEGs mapped in the subcategories metabolism of terpenoids and polyketides and biosynthesis of other secondary metabolites, a sum of the Log2Fc(CPMcf/CPMcw) values of all the transcripts mapped in the same entry (enzymes) was performed.

2.8. Integration of Transcriptome and Metabolome Data of Secondary Metabolism

Additionally, qualitative and quantitative chromatographic data for essential oils of the same accessions [18] were compared with transcript expression profiles. Plants of C. flexuosus (PEL No. 26972) (lemon grass) and C. winterianus (PEL No. 26973) (citronella) were grown at the Federal University of Pelotas, Capão do Leão, Brazil. The essential oil (EO) was obtained from fresh leaf tissues by hydrodistillation using a Clevenger-type apparatus and separated from the water by decantation. The identification of the chemical components of the EO (qualitative analysis) was performed by an Agilent 6890 gas chromatograph coupled to an Agilent 5973 mass selective detector (GC/MS). The EO components were quantified by gas chromatography with flame ionization detection (GC/FID) on an Agilent 7890A. The percentage of chemical components was based on the normalization of the peak area.

3. Results

3.1. Plant Material, Sequencing and Construction of the De Novo Reference Transcriptome

To characterize gene expression patterns between Cymbopogon flexuosus (lemongrass) and C. winterianus (citronella), a reference-free de novo transcriptome assembly was performed. The initial assembly process generated 25,836 and 42,968 transcripts for C. flexuosus and C. winterianus, respectively, with N50 values of 691 bp and 858 bp (Table 1). After processing with CAP3, the final non-redundant transcript sets (nr-transcripts) consisted of 25,576 sequences for C. flexuosus and 42,250 for C. winterianus, with average transcript lengths of 528 bp and 597 bp, respectively.
In the back-mapping step, which evaluates read alignment consistency against the assembled nr-transcripts, 97.13% of C. flexuosus transcripts (24,841 contigs) and 76.72% of C. winterianus transcripts (32,418 contigs) were successfully mapped back mapped to their respective libraries. These results indicate a robust assembly, particularly for C. flexuosus. These final nr-transcript sets were used as the reference transcriptomes for subsequent analyses (Table 1).

3.2. Identification of Homologous nr-Transcripts Between Lemongrass and Citronella

A total of 15,005 homologous nr-transcripts were identified between the sets of 24,841 and 32,418 contigs from C. flexuosus and C. winterianus, respectively. Principal component analysis (PCA), based on the CPM expression of these nr-transcripts, revealed consistent clustering among biological replicates of the same species, indicating high intraspecific correlation. Additionally, a clear separation between species along the PC1 axis was observed, reflecting differences in their transcriptomic profiles (Figures S2 and S3). The frequency distribution of expression values also showed similar patterns within each species, further supporting the low level of intraspecific variability (Figure S4).

3.3. Differential Expressions, Functional Annotation and GO Analysis

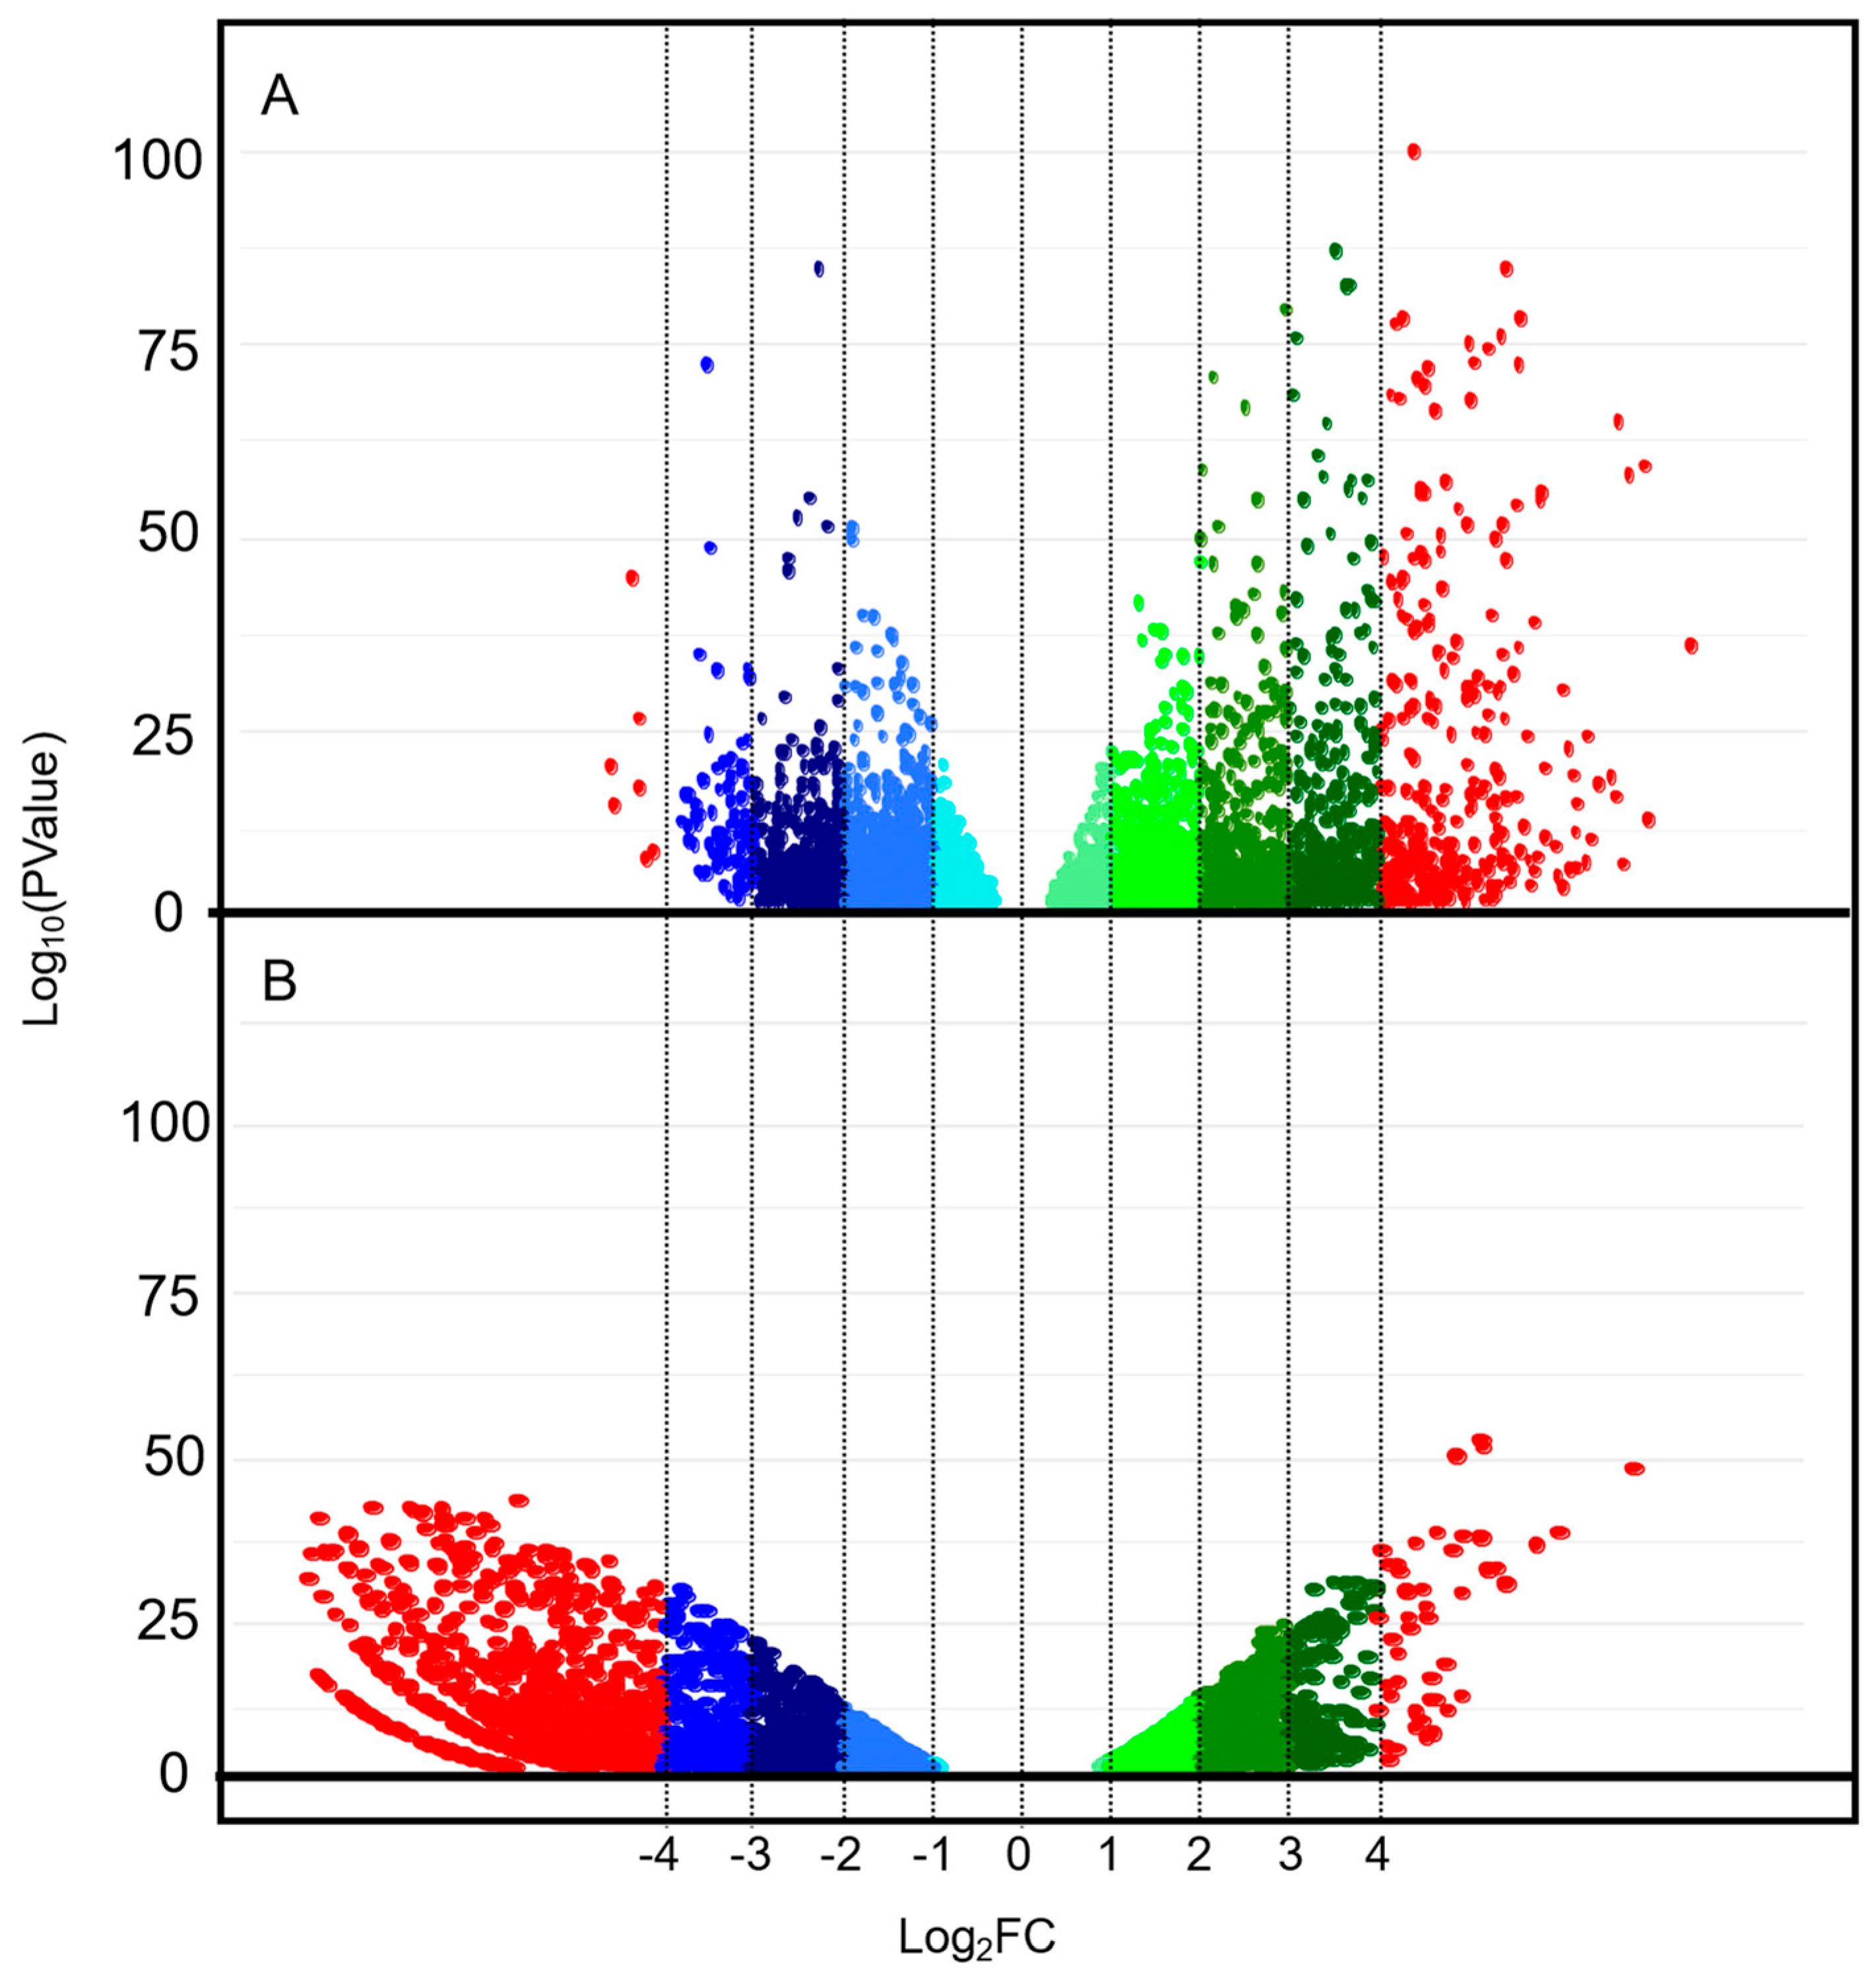
Raw expression quantification of nr-transcripts from Cymbopogon flexuosus and C. winterianus was based on count per million (CPM) values obtained from species-specific mappings. Differential expression analysis was conducted by calculating the log base 2 of the expression ratio between lemongrass and citronella [Log2FC (CPMcf/CPMcw)]. The distribution of Log2FC values was similar across both assemblies, but with a predominant trend toward negative values, indicating a greater number of transcripts more highly expressed in C. winterianus (Figure 1, Figures S5 and S6).
We identified 7421 (29.01%) and 10,255 (24.27%) differentially expressed transcripts (DETs) based on the C. flexuosus and C. winterianus assemblies, respectively (Table S3). In C. flexuosus, 3681 (14.8%) and 3740 (15.0%) DETs were down- and up-regulated, respectively (Figure 1 and Figure S6), while in C. winterianus, 5266 (16.24%) and 4989 (15.38%) were up- and down-regulated, respectively (Figure 1 and Figure S6). Considering only the most informative DETs (log2FC ≤ −1 or ≥1), 5318 and 8631 transcripts were identified for C. flexuosus and C. winterianus, respectively (Table S3).
In the functional annotation, similarities were found for 18,286 (73.6%) and 22,458 (69.3%) of the nr-transcripts of C. flexuosus and C. winterianus, respectively (Table 2). In both species, the number of alignments was predominant in A. gerardi (average of 28.05%), Saccharum sp. (19.5%), B. decipiens (11.9%), S. bicolor (10.4%), M. lutarioriparius (10%), M. sinensis (8%) and Zea sp. (4.7%), respectively, totaling ~93% of the alignments (Table 2). All species not belonging to the subfamily Panicoideae had less than 1% of the homologies.
Overall, gene ontology (GO) terms were assigned to 72.5% and 66.8% of the nr-transcripts from C. flexuosus and C. winterianus, respectively (Table S1). For the biological process category, the most abundant terms on average were cellular process (37.5%), metabolic process (35.9%), localization (9%), biological regulation (8.2%) and response to stimulus (5.6%) (Figure S7). In the molecular function category, predominant terms included binding (47.4%), catalytic activity (37.5%) and transporter activity (5%) (Figure S8). In the cellular component category, the most frequent terms were intracellular anatomical structure (24%), membrane (22.5%), organelle (19.5%) and cytoplasm (10.9%) (Figure S9).
When considering only the differentially expressed transcripts (DETs), GO terms were assigned to 5375 (72.4%) contigs from C. flexuosus and 6583 (64.2%) from C. winterianus (Table S1).

3.4. Comparative Reads Mapping Between Cymbopogon and Related Grasses

In the back-mapping step, Cymbopogon flexuosus and C. winterianus showed 78% and 74% of reads successfully mapped to their respective reference transcriptomes (Table 3). Among polyploid species (A. gerardi, S. officinarum, M. sinensis, M. lutarioriparius and P. virgatum), the highest mapping percentages were observed, ranging from 60% to 75%. In diploid species, only S. bicolor and Z. mays showed high mapping rates, with values between 68% and 70%, respectively (Table 3). These species also exhibited the highest average read depth, ranging from 200 to 266 reads per transcript. Based on the proposed ranking index (sort index), the species with the most conserved expressed regions relative to Cymbopogon were A. gerardi (3.80), S. bicolor (3.42) and Z. mays (3.23). In contrast, more distantly related species—O. sativa, H. vulgare, T. aestivum, B. distachyon and A. thaliana—presented the lowest sort index values (Table 3).
Interestingly, while species such as S. bicolor, Z. mays, A. gerardi and S. officinarum had the best results for percentage of mapped reads, read depth and sort index, the proportion of transcripts receiving mapped reads ranged from 61% to 67%. On the other hand, in species like S. viridis, D. oligosanthes, B. distachyon, B. decipiens and E. coracana—which had lower values for those metrics—the percentage of genes with mapped reads was higher, ranging from 71% to 83% (Table 3).

3.5. Chloroplast Genome Phylogeny of Cymbopogon and Related Species

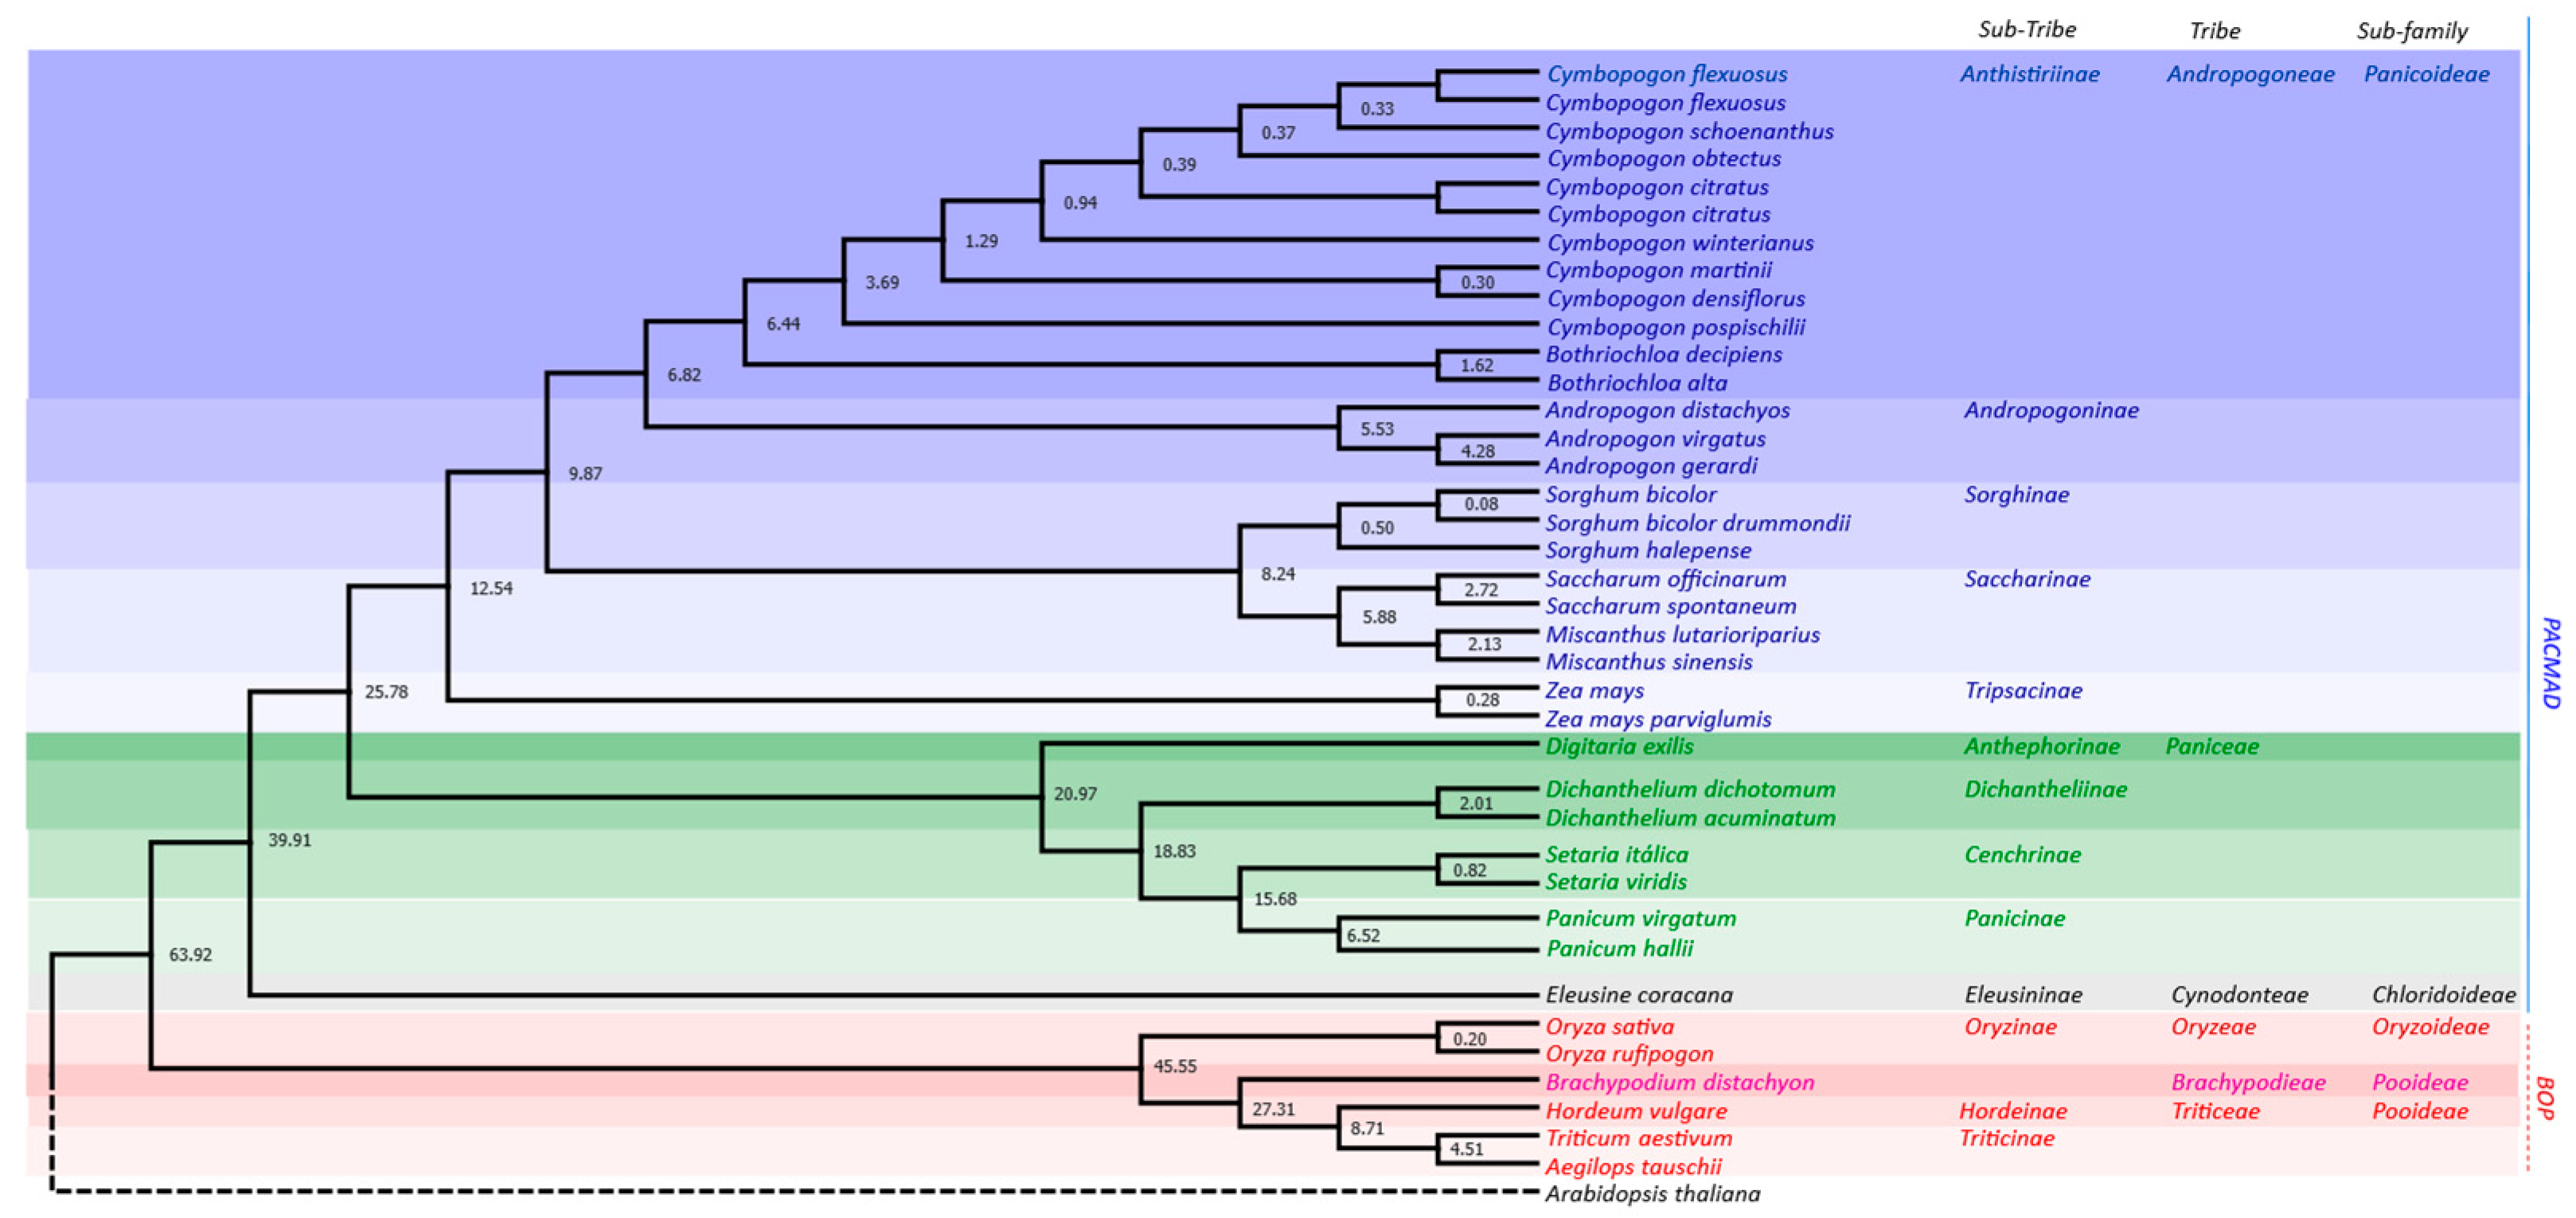
The complete chloroplast genomes of 41 species of the Poaceae family, including representatives of the genus Cymbopogon, were analyzed by phylogenetic inference using the RAxML and MEGA v.11 programs. The maximum likelihood tree (ML tree) was constructed with the statistical support of 1000 bootstrap replicates. The average size of the chloroplast genomes was 139.2 kb. The species of the genus Cymbopogon were grouped cohesively, with greater evolutionary proximity to each other, followed by the genera Bothriochloa andropogon, a branch containing Sorghum, Saccharum and Miscanthus and by the genus Zea, all belonging to the tribe Andropogoneae (Figure 2). The tree topology also showed the separation of the tribes Paniceae, Cynodonteae, Oryzae, Brachypodieae, Triticeae and the dicotyledonous species Arabdopsis thaliana, which appear progressively more distant from Andropogoneae, in accordance with previous phylogenetic records (Figure 2). In addition, the consistent formation of clades with the subtribes Anthistiriinae andropogoninae, Sorghinae, Saccharinae and Tripsacinae (Andropogoneae) and Hordeinae and Triticinae (Triticeae) was observed. Within the genus Cymbopogon, the lemongrass species (C. flexuosus and C. citratus) presented lower divergence time between each other than when compared with the citronela group (C. winterianus).

Correlation Between Sort Index, Genetic Distances and Divergence Time

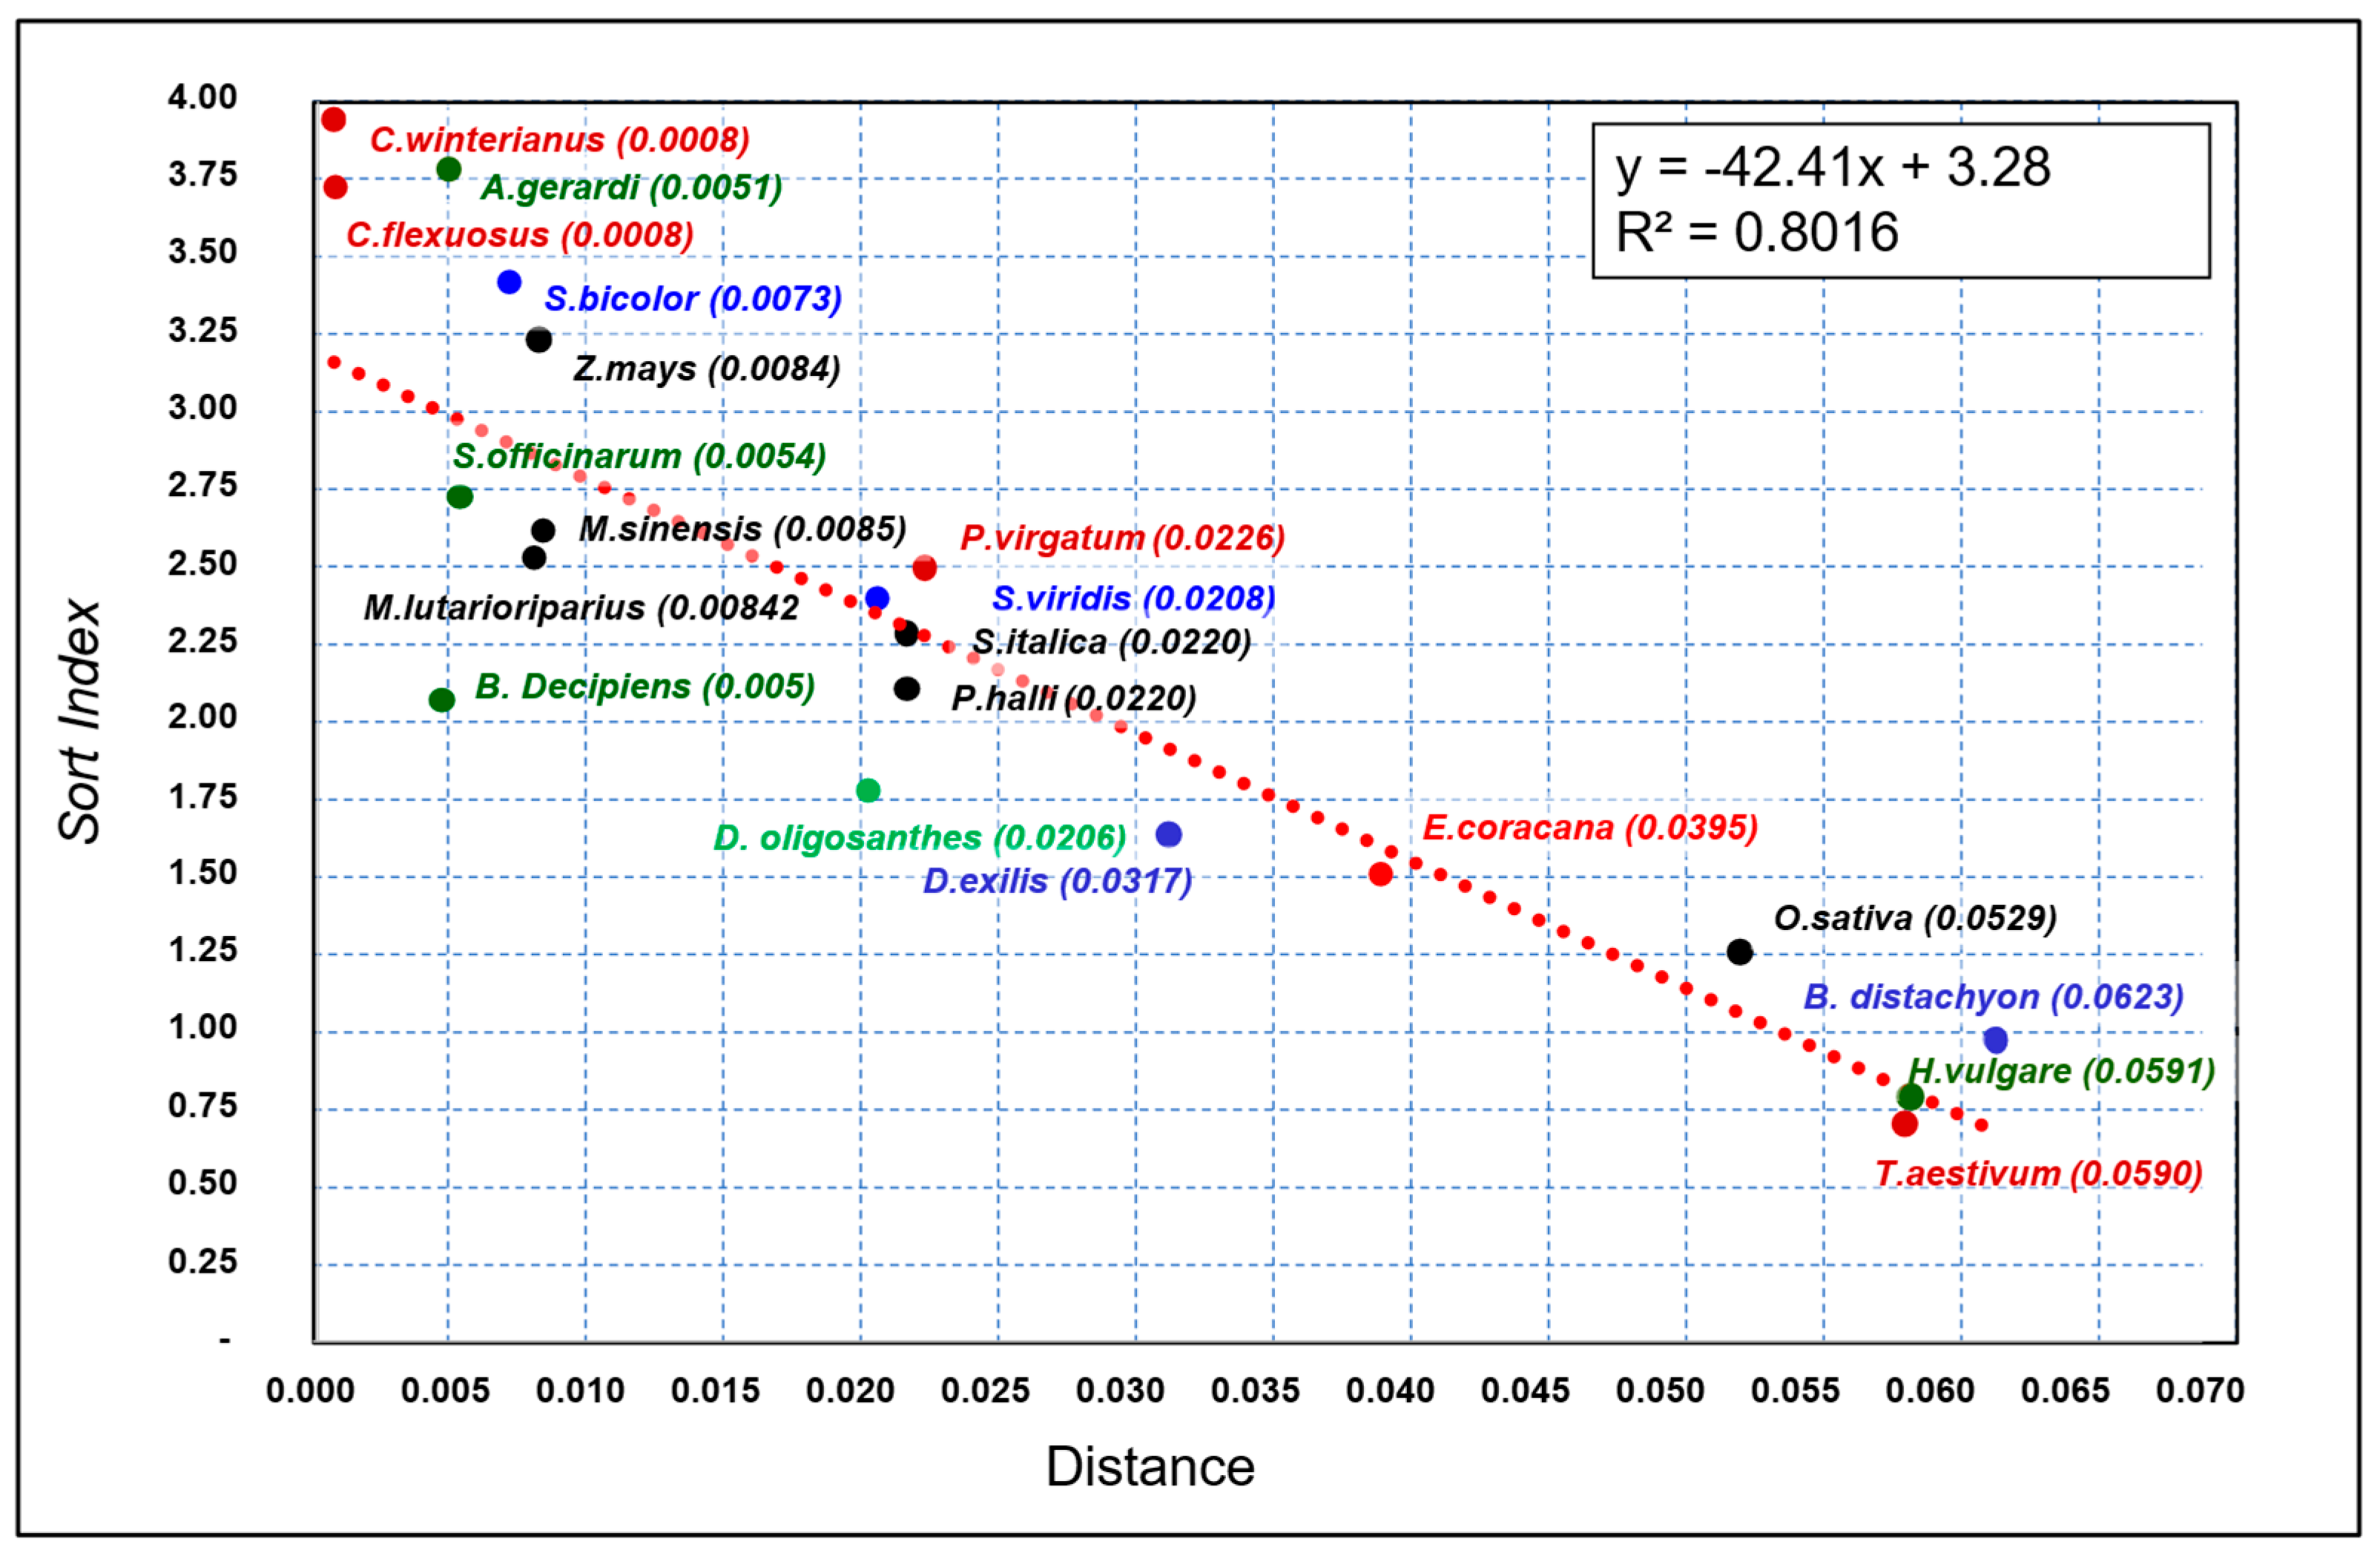
The regression analysis between the sort index values (Table 3) and MCL genetic distances revealed an adequate adjustment of R2 = 0.80, confirming that species that are further distant in the evolutionary tree from the genus Cymbopogon also present lower conservation between expressed regions (Figure 3). When evaluated separately, the correlations between genetic distance vs. mean depth and genetic distance vs. mean % mapped reads were −0.8919 and −0.9274, respectively. The Pearson correlation between the sort index value and divergence time also had a negative correlation value and high magnitude (r = −0.89) (Figure 3). These data reinforce the idea that phylogenetic proximity is directly associated with conservation in the patterns of transcribed regions, reflecting greater functional similarity between evolutionarily close species.

3.6. Phylogeny of Metabolic Genes in Cymbopogon and Related Species

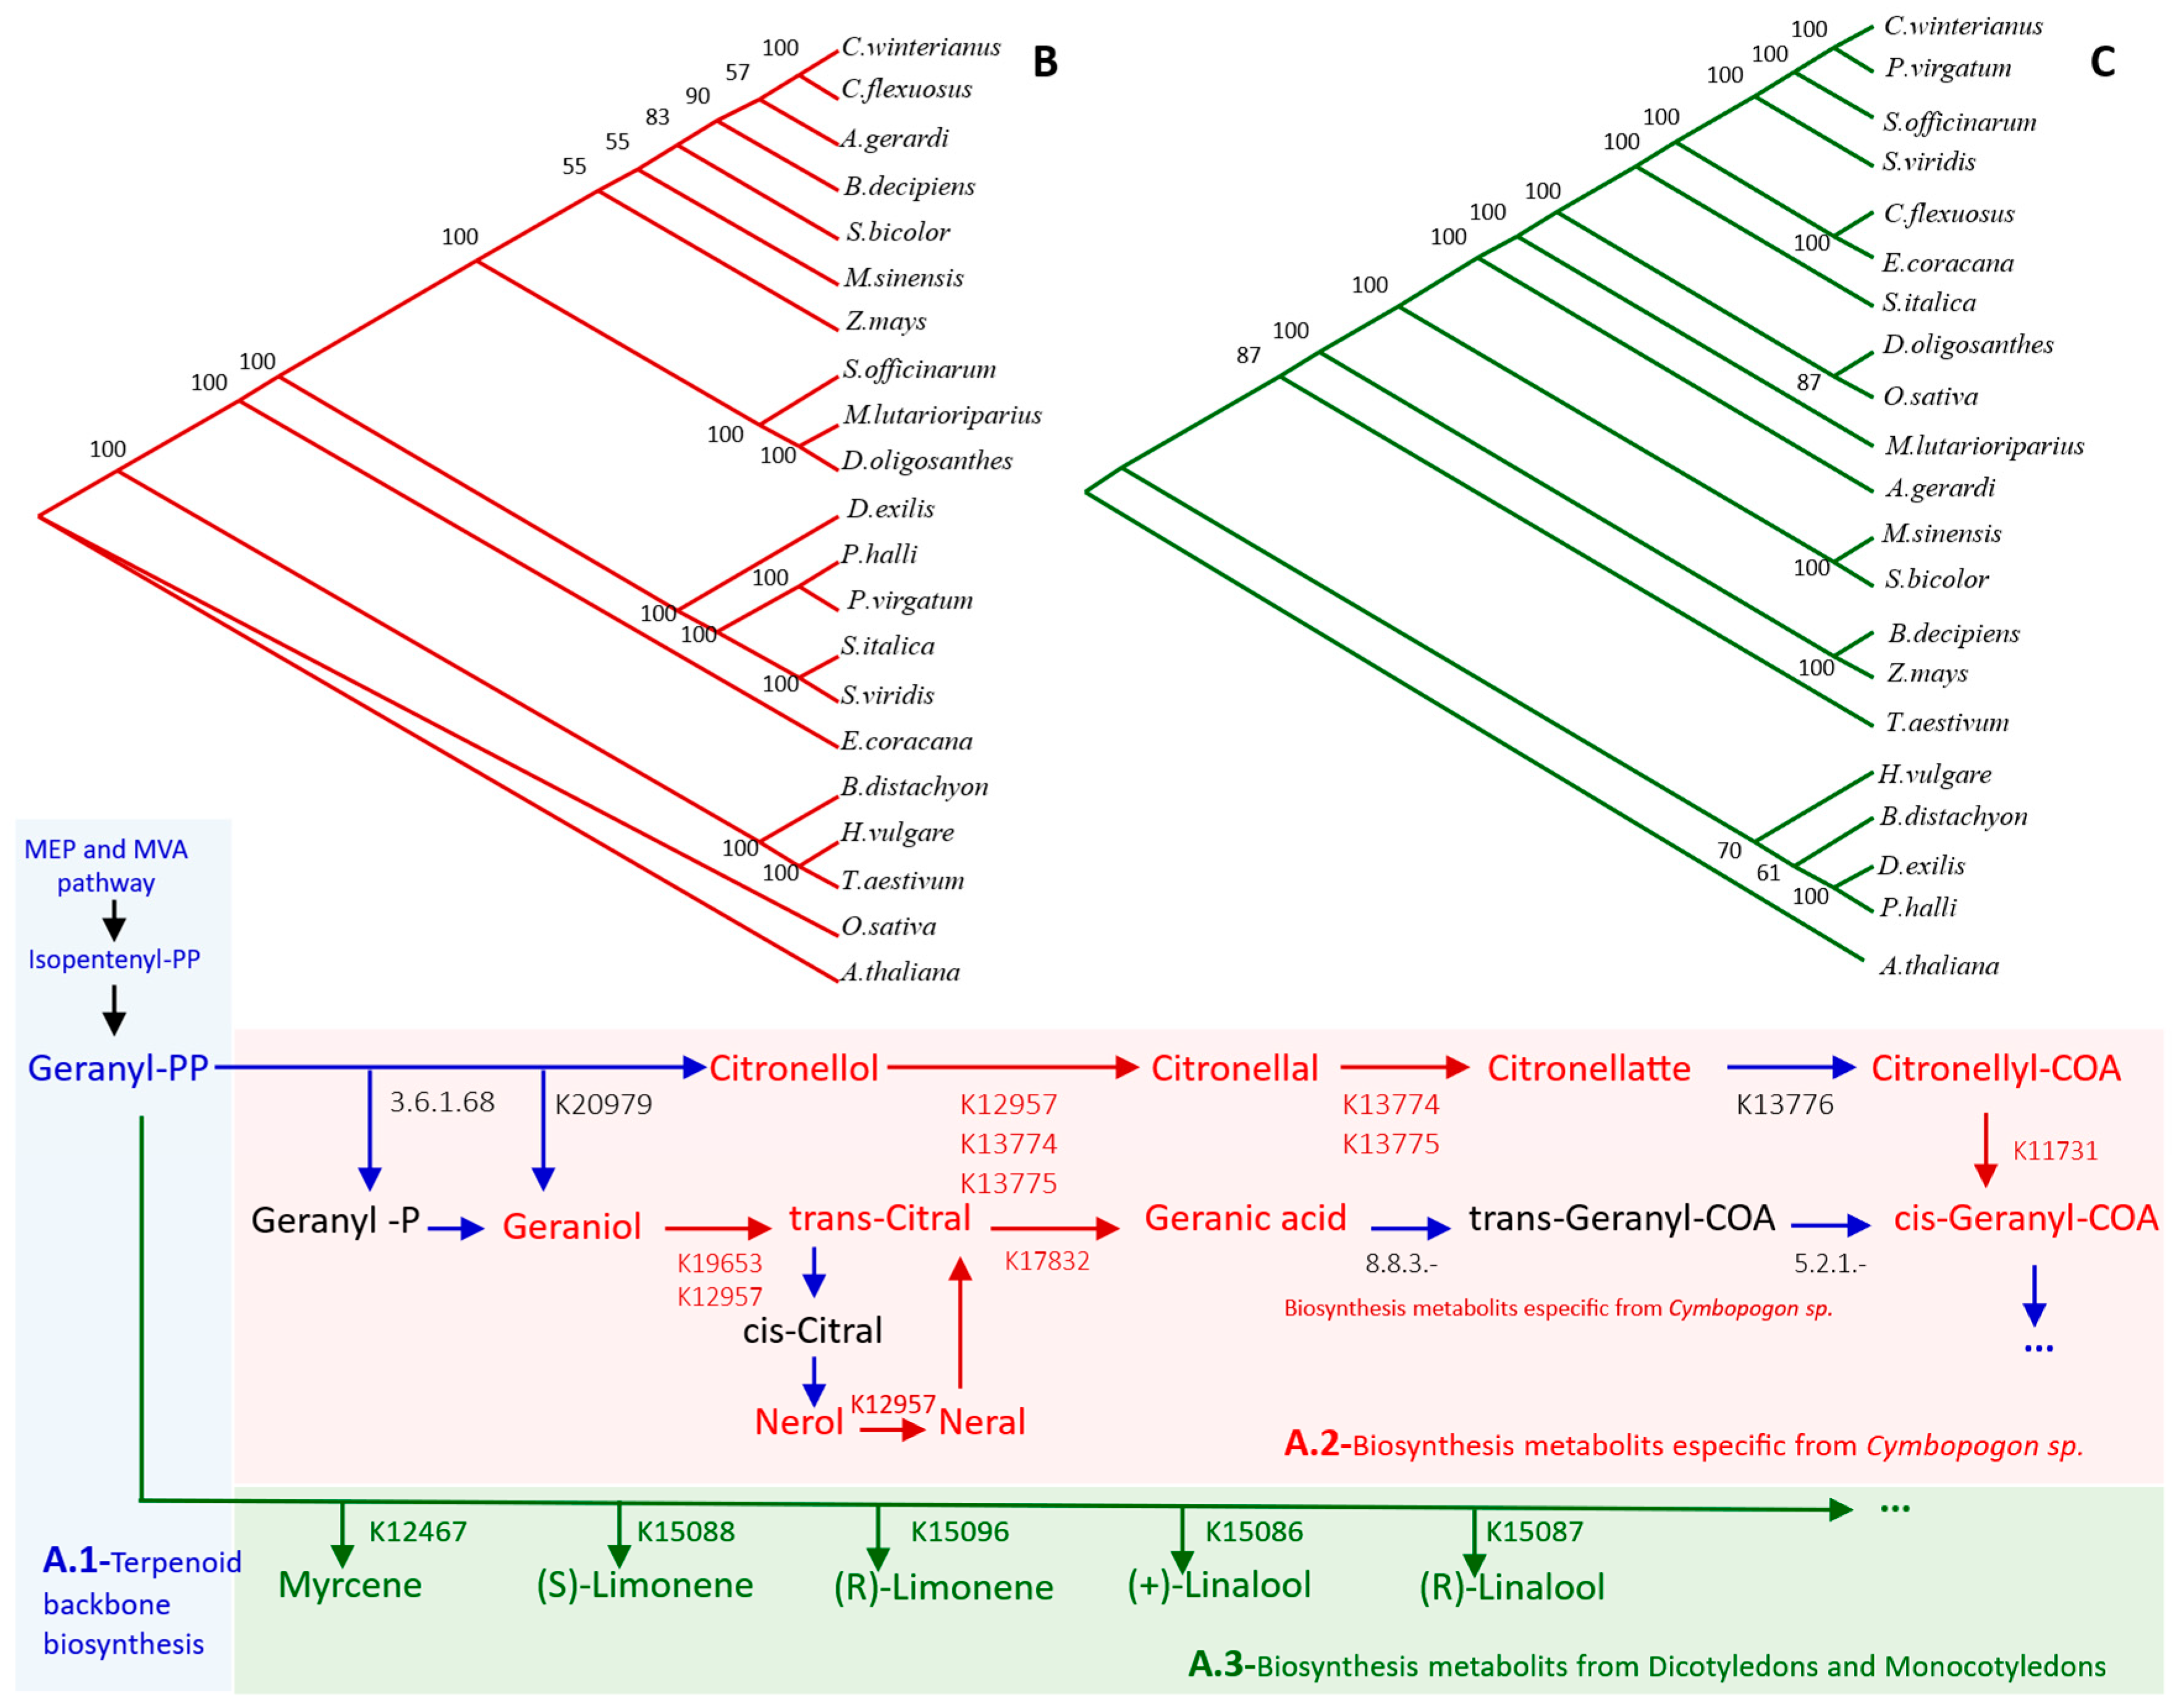
The phylogenetic tree of scenario 1 (Figure 4B), containing only sequences associated with the production of Cymbopogon metabolites, agrees with the results shown in the phylogenetic tree obtained through the analysis of chloroplasts (Figure 2). In scenario 2, the addition of sequences of the enzyme K20979 resulted in a phylogenetic tree with inconsistency in the proximity between species (Figure S10). In scenario 3 (Figure 4C), with sequences associated with the production of secondary metabolites in different aromatic plant species, and scenario 4 (Figure S11), with the addition of the K20979 sequence, the results obtained also showed a topology inconsistent with the expected proximity between species.
The presence of genes of the metabolic pathway for the synthesis of trans citral, neral, geranic acid, citronellal, citronellyl-COA and cis-geranyl-COA in the closest species shows synteny for this pathway. The presence of aroma in Cymbopogon species, therefore, does not appear to be due to the presence of new genes for the observed aromas, but rather an increase in expression resulting from a neofunctionalization following a segmental duplication event. The occurrence of mutations in the promoter region, generating divergences and altering the stoichiometry of the compounds produced, cannot be ruled out.

3.7. KEGG Orthology Annotation and Metabolism Overview

Among the nr-transcripts with homologous sequences identified via BLAST analysis (Table 2), 8548 (46.7%) from Cymbopogon flexuosus and 9584 (42.7%) from C. winterianus showed alignments with orthologous genes annotated in the KEGG database (Table S3). Considering only the differentially expressed transcripts (DETs) with Log2FC values ≤ −1 or ≥1, homologies were identified for 1517 sequences (28.5%) from C. flexuosus and 2063 (23.9%) from C. winterianus (Table S3). On average, the most represented functional categories were 09100—metabolism (27.5%), 09120—genetic information processing (16.5%) and 09180—BRITE hierarchies, the latter comprising 34% of annotated transcripts (Table S4).
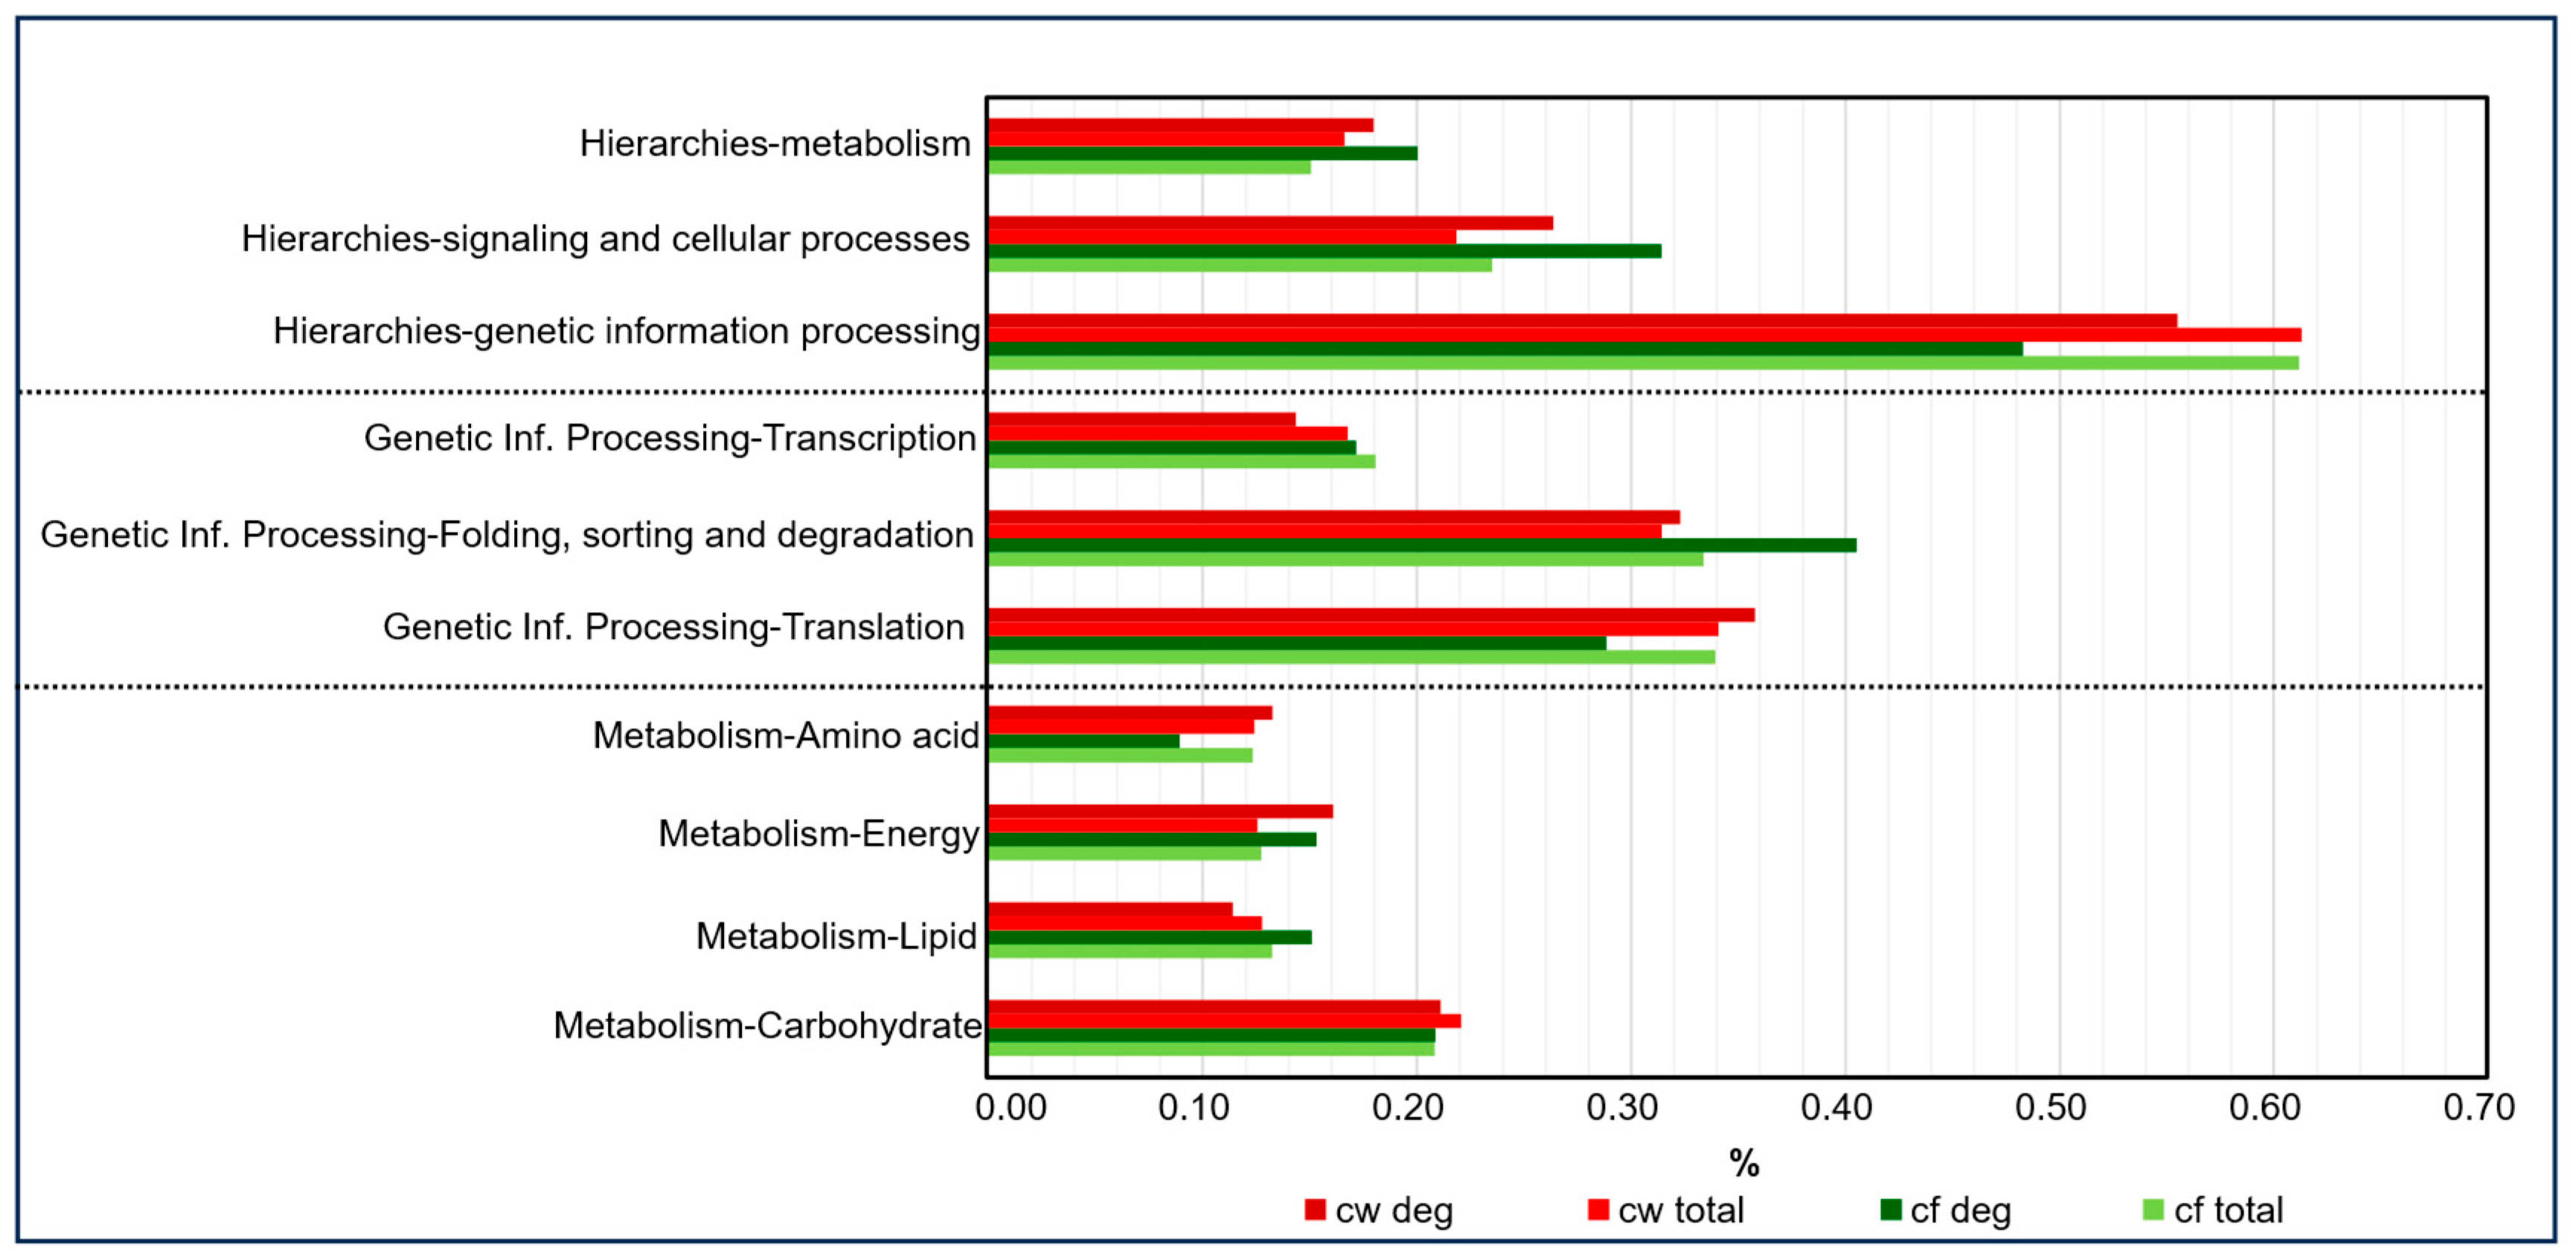
Of the total sequences mapped in “BRITE hierarchies”, the predominant functional groups were genetic information processing (55%), signaling and cellular process (26%) and metabolism (18%) (Figure 5). Among the most represented subcategories within metabolism, the following stand out: Carbohydrate metabolism (21.2%); energy metabolism (16.2%); amino acid metabolism (13.3%); and lipid metabolism (11.5%). In genetic information processing, the subcategories translation (35.8%); folding, sorting and degradation (32%); and transcription (14.4%) were the most abundant (Figure 5).

3.8. Integration of Transcriptome and Metabolome Data of Secondary Metabolism

In the metabolisms of secondary compounds described in KEGG as “metabolism of terpenoids and polyketides” and “biosynthesis of other secondary metabolites”, DETs represented 5% and 4.56% of the mapped transcripts in C. flexuosus and C. winterianus, respectively (Tables S5 and S6).
Metabolomic analysis identified 11 monoterpenoid and eight sesquiterpenoid compounds (Table S7). In C. flexuosus, the most abundant compounds were β-citral (neral), α-citral (geranial) and cis-verbenol. In C. winterianus (citronella), the major compounds were citronellal and cis-geraniol (nerol). Other compounds were found in smaller amounts but were species-specific, being detected only in C. flexuosus (camphene, β-caryophyllene and caryophyllene oxide) or in C. winterianus (linalool, citronellol, geranyl acetate, citronellyl acetate, germacrene D, α-muurolene, δ-cadinene, δ-cadinol and β-elemene). Limonene and γ-cadinene were found in both species (Table S7).
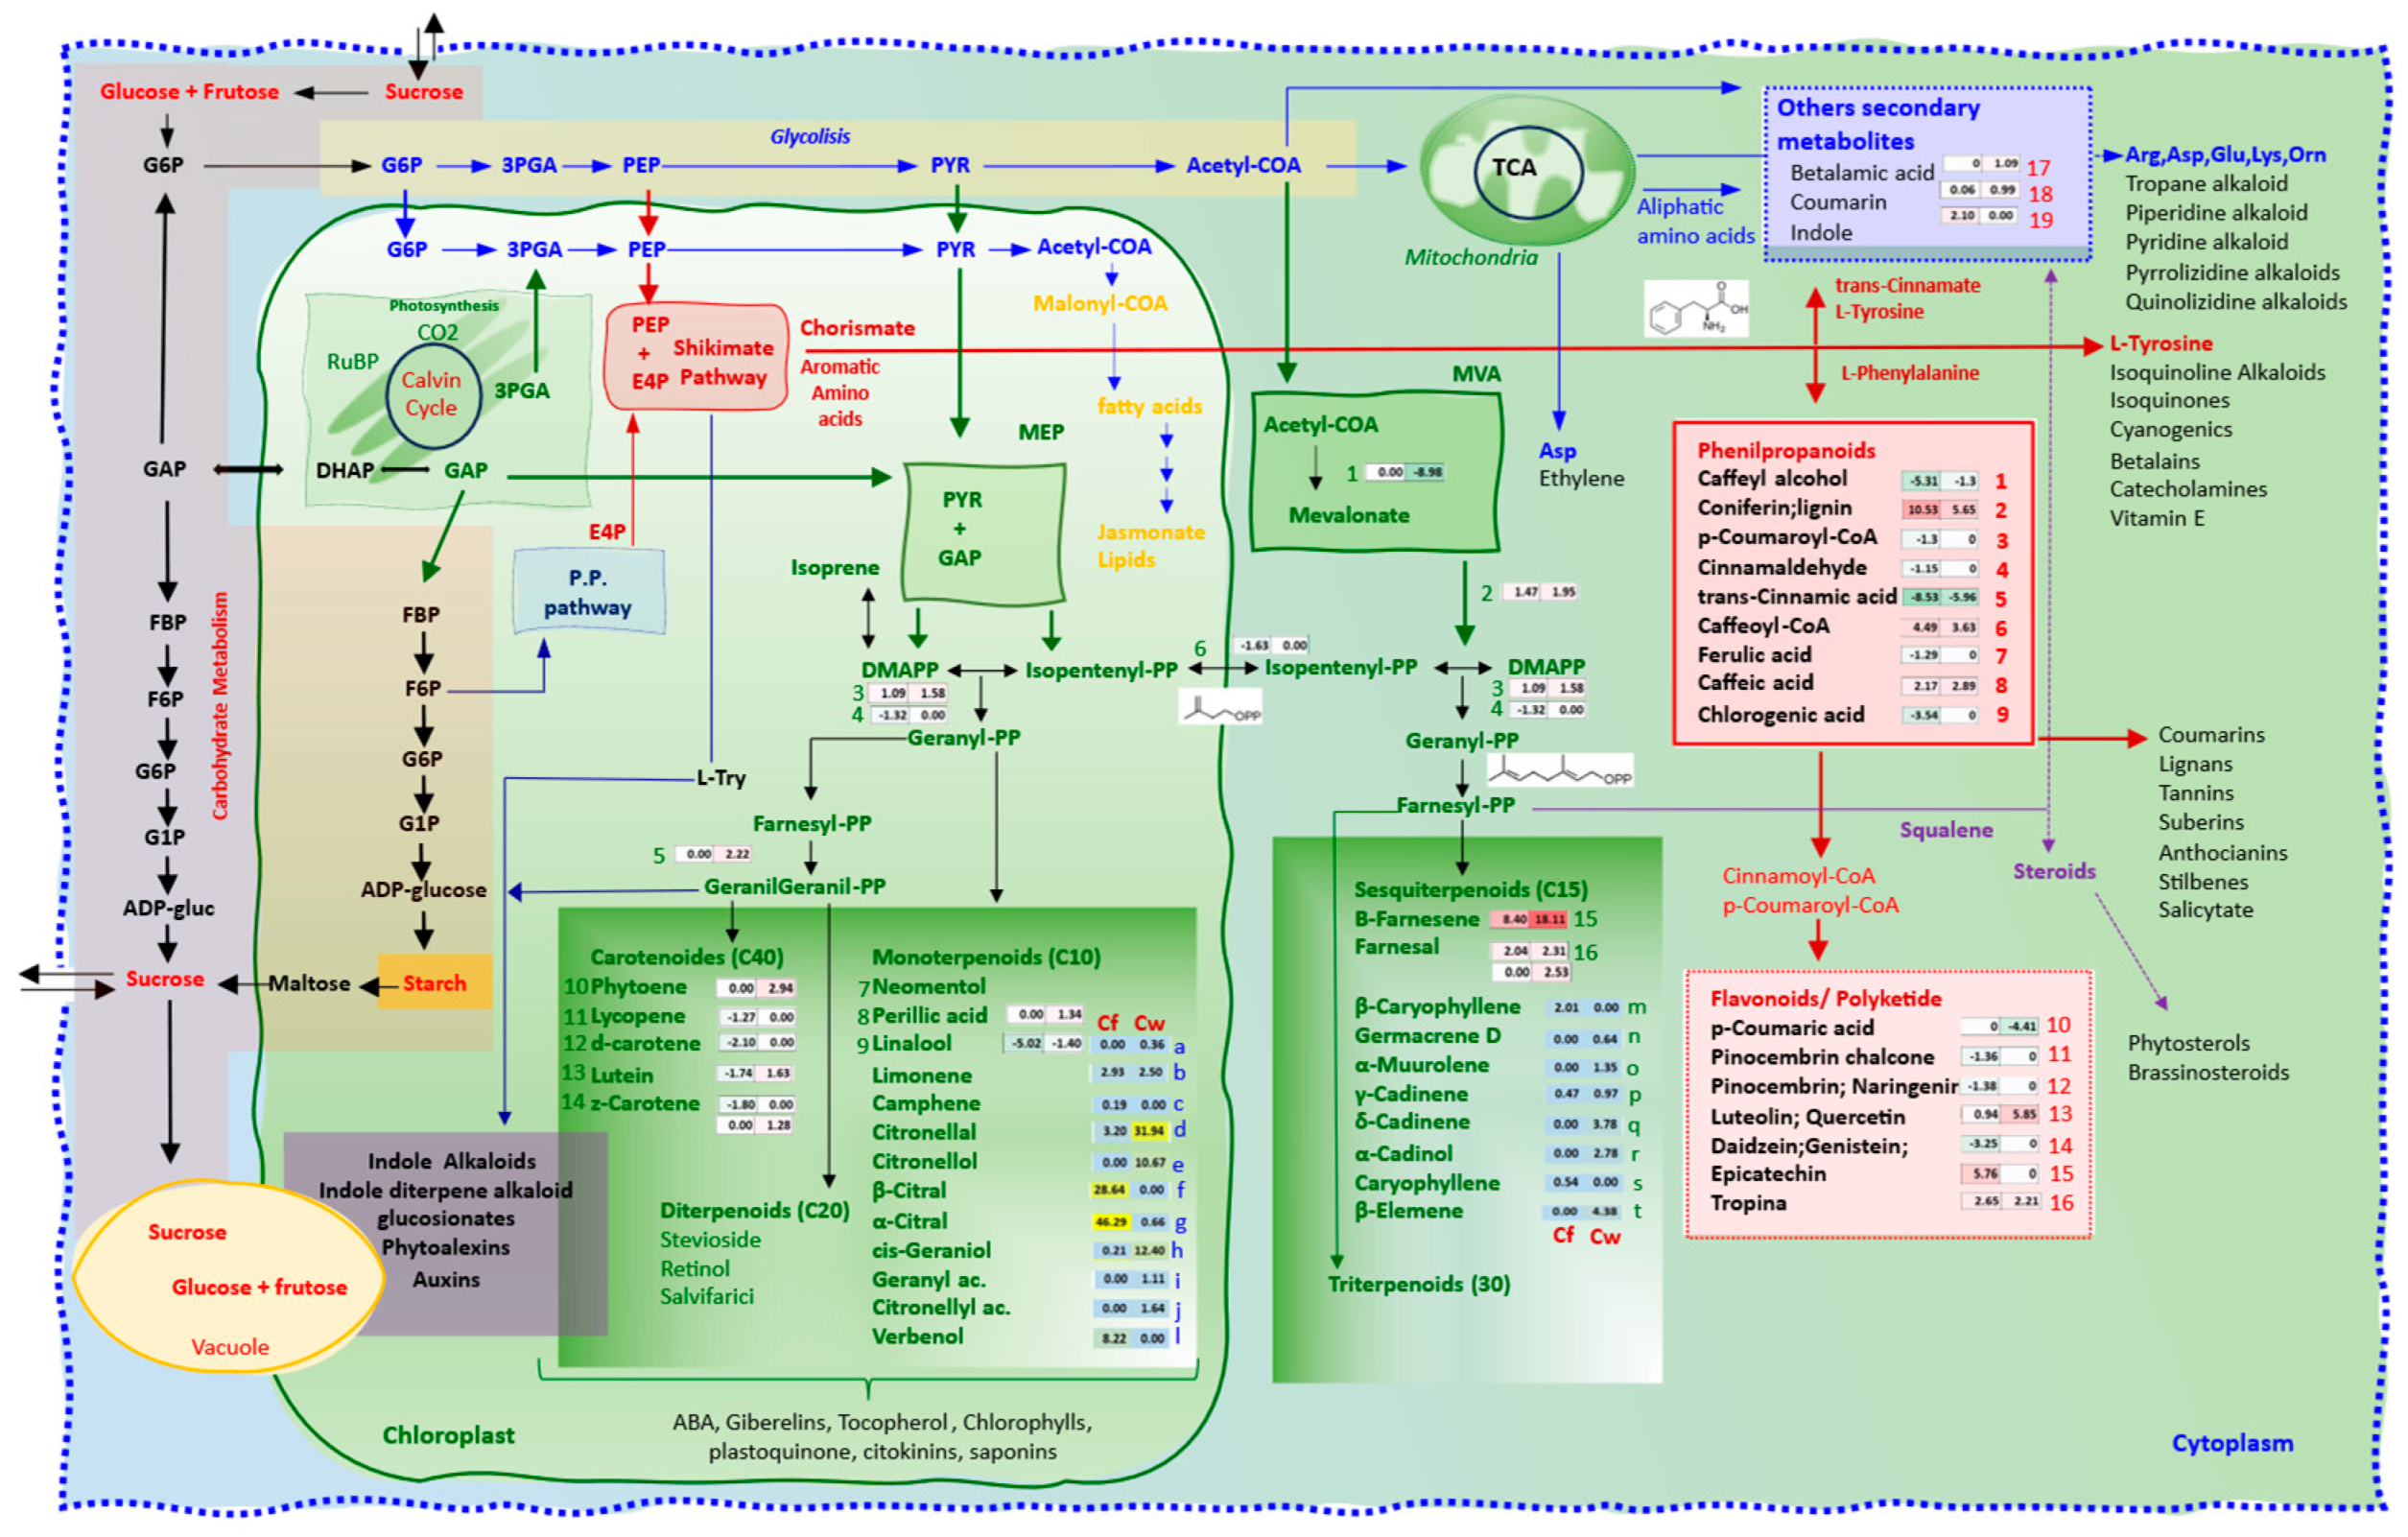
When filtering for transcripts with homologs associated with the biosynthesis of molecules with industrial, pharmaceutical, or agricultural applications within secondary metabolism, a total of 40 and 87 contigs were identified as mapped to the metabolism of terpenoids and polyketides (e.g., terpenoid backbone biosynthesis, monoterpenoid biosynthesis, carotenoid biosynthesis, limonene degradation, sesquiterpenoid, and triterpenoid biosynthesis) and to biosynthesis of other secondary metabolites (e.g., phenylpropanoid biosynthesis, flavonoid biosynthesis, flavonoid degradation, stilbenoid, diarylheptanoid and gingerol biosynthesis, tropane, piperidine and pyridine alkaloid biosynthesis, betalain biosynthesis, and biosynthesis of various plant secondary metabolites), respectively (Figure 6; Tables S8 and S9).
These contigs were associated with 16 KEGG entries (enzymes) in the metabolism of terpenoids and polyketides category and 19 entries in the biosynthesis of other secondary metabolites category.

3.8.1. Terpenoid Metabolism (MEP Pathway—Chloroplast)

The integration of the DETs results into the metabolic maps showed a complex and non-linear interaction between the various steps of the secondary metabolism pathways. In the metabolism of terpenoids, derived from the substrates pyruvate and GAP via the methylerythritol 4–phosphate pathway (MEP) in the chloroplast, transcripts homologous to genes encoding the enzymes EC:2.5.1.1 (geranyl-diphosphate synthase) and EC:2.5.1.10 (geranylgeranyl diphosphate synthase), which act in the synthesis of geranyl-PP and geranylgeranyl-PP, substrates for the production of monoterpenoids and tetraterpenoids (carotenoids), had greater expression in C. flexuosus (Figure 6 and Tables S8 and S9). Among monoterpenoids, contrasting expressions were observed for homologues of EC:1.1.1.208 (neomenthol dehydrogenase), while EC:1.2.1.3 (aldehyde dehydrogenase) and EC:4.2.3.25 (S-linalool synthase), respective precursors of perillic acid and linalool, had higher expression in C. flexuosus and C. winterianus, respectively.

3.8.2. Carotenoid Biosynthesis

Although C. flexuosus exhibited a higher expression of early-pathway genes EC:2.5.1.10 and EC:2.5.1.32 (involved in geranylgeranyl diphosphate and phytoene synthesis), C. winterianus showed higher expression of downstream genes such as EC:1.3.5.6 (zeta-carotene desaturase), EC:5.5.1.18 (lycopene epsilon-cyclase), EC:1.14.-.- (LUT5, beta-ring hydroxylase), and EC:1.3.5.5 (15-cis-phytoene desaturase), suggesting increased production of lycopene, δ-carotene, lutein, and other terminal carotenoids.

3.8.3. MVA Pathway—Sesquiterpenoids and Triterpenoids (Cytoplasm)

In the route of terpenoids produced in the cytoplasm, derived from the MVA pathway, although C. winterianus showed higher expression of transcripts associated with mevalonate (EC: 1.1.1.34-hydroxymethylglutaryl-CoA reductase) and farnesyl-PP (EC: 2.5.1.10-farnesyl diphosphate synthase), respective precursors of sesquiterpenoids and triterpenoids, homologs of the enzymes producing B-farnesene (EC: 4.2.3.49-acyclic sesquiterpene synthase) and farnesal (EC: 3.1.1.-prenylcysteine alpha-carboxyl methylesterase; EC: 3.4.24.84-STE24 endopeptidase) were more expressed in C. flexuosus, indicating greater flux to volatile sesquiterpenes.

3.8.4. Phenylpropanoids (Shikimate Pathway)

Among the phenylpropanoids derived from the Shikimate pathway, some of the identified transcripts had higher expression in C. winterianus, such as homologs of EC:1.1.1.195 (cinnamyl-alcohol dehydrogenase), EC:6.2.1.12 (coumarate-CoA ligase), EC:1.2.1.44 (cinnamoyl-CoA reductase), EC:4.3.1.24 (PAL-phenylalanine ammonia-lyase), EC:2.1.1.68 (caffeate O-methyltransferase), and EC:1.14.14.96 (5-O-(4-coumaroyl)-D-quinate 3′-monooxygenase), indicating potential for the production of p-coumaryl alcohol, p-coumaroyl-CoA, cinnamaldehyde, trans-cinnamic acid, ferulic acid and chlorogenic acid. On the other hand, C. flexuosus had higher expression of genes associated with EC:1.11.1.7 (peroxidase), EC:2.3.1.133 (shikimate O-hydroxycinnamoyltransferase), and EC:3.1.1.-(caffeoylshikimate esterase), related to the synthesis of coniferin, caffeoyl-CoA and caffeic acid.

3.8.5. Flavonoids (Phenolic Branch)

In flavonoid metabolism, which branches downstream from the phenylpropanoid pathway, C. winterianus exhibited higher expression of key genes such as EC:1.14.14.91 (CYP73A, trans-cinnamate 4-monooxygenase), EC:2.3.1.74 (chalcone synthase), EC:5.5.1.6 (chalcone isomerase) and EC:1.14.14.81 (flavonoid 3′,5′-hydroxylase), associated with the biosynthesis of p-coumaric acid, pinocembrin, butin, naringenin, eriodictyol, dihydrotricetin, luteolin, myricetin and quercetin, among others.
In contrast, C. flexuosus showed greater expression of EC:1.3.1.77 (anthocyanidin reductase), EC:3.2.1.21 (bglB, beta-glucosidase) and EC:1.1.1.206 (tropinone reductase I), associated with the biosynthesis of (−)-epiafzelechin, (−)-epicatechin, (−)-epigallocatechin, daidzein, genistein and tropine.

3.8.6. Other Secondary Metabolites

Finally, within the KEGG category “biosynthesis of various secondary metabolites”, derived from acetyl-CoA metabolism in glycolysis and aliphatic amino acids in the Krebs cycle, C. flexuosus showed higher expression of genes such as EC:1.13.11.-(4,5-DOPA dioxygenase extradiol), EC:3.2.1.21 (beta-glucosidase) and EC:4.1.2.8 (indole-3-glycerol-phosphate lyase), suggesting enhanced synthesis of betalamic acid, coumarin and indole.
While the metabolome results (Figure 6, Table 4, Tables S7 and S10) indicated a predominance of compounds identified in the monoterpenoids (with 11 compounds detected) and sesquiterpenoids (with eight compounds) pathways with higher production levels, the transcriptome results revealed expression of transcripts associated with other metabolites, mainly among phenylpropanoids and flavonoids.

4. Discussion

The genus Cymbopogon comprises part of an important group of medicinal grasses originating in the Old World and Oceania that became cosmopolitan due to human action (neocosmopolitan). Among these, there are diploid, tetraploid and hexaploid species, with a genome size of approximately 700 Mb in the diploid C. flexuosus [54].
With the advent of modern large-scale nucleotide sequencing technologies, it has become possible to use these tools to understand the structural and functional characteristics of the genomes and transcriptomes of any species.

4.1. Transcriptome Assembly and Data Quality

The use of the de novo assembly method is the current strategy for studying transcriptomes for those species that do not yet have a reference genome available. According to the authors of the Trinity package [22], a popular package for this analysis, it is capable of fully reconstructing a large fraction of the transcripts present in the analyzed data, with the sensitivity to differentiate isoforms originating from alternative splicing and/or alleles of duplicated genes. However, other authors have indicated that contig chimeras can be produced, in addition to the presence of different transcripts of the same gene, separated by the lack of an overlapping region [55].
In this study, after raw data cleaning and removal of low-quality reads, 15.13 and 18.95 million high-quality paired-end reads from C. flexuosus and C. winterianus, respectively, resulted in 25,836 and 42,968 contigs, with average transcript lengths of 526 and 592 bp (Table 1). Following Trinity assembly, redundancy was reduced using CAP3, yielding 25,576 and 42,250 non-redundant contigs (nr-transcripts) with average lengths of 528 and 597 bp, respectively (Table 1). These results are comparable to those reported in previous de novo transcriptome studies.
For example, transcriptomes from the leaves and roots of C. winterianus yielded 40,823 and 28,163 transcripts, with average lengths of 590 and 837 bp, respectively [16], 122,000 transcripts with an average length of 567 bp [3] and 92,937 transcripts with a mean of 635 bp in C. flexuosus [56]. Studies involving other Cymbopogon species—including hybrids such as C. khasianus × C. pendulus, C. nardus and C. pendulus—have reported 115,000 to 155,000 non-redundant transcripts with average sizes ranging from 867 to 1102 bp [57]. For other genera (e.g., Cicer arietinum, Sesamum indicum, Eucalyptus grandis, Epimedium sagittatum, Melitaea cinxia and Ipomoea batatas), transcript sizes range from 197 to 629 bp [16].
Both species in this study are described as diploids [9]. Thus, the difference in the number of transcripts demonstrated in this work can be attributed to intrinsic differences between species, as the high sensitivity of the RNAseq technique in showing differences in expressed genes according to differences between tissues, culture conditions and/or between genotypes is well described in the literature.
In de novo transcriptome studies, construction of the reference transcriptome and back-mapping of reads to the assembled reference are complementary and sequential steps. Even after redundancy reduction, chimeric sequences and other artifacts may persist. In this study, back-mapping of the read libraries of each species against their reference transcriptome, together with a CPM ≥ 1 filter, allowed us to accurately identify 24,841 (97.13%) and 32,418 (76.72%) sequences as being the best contigs to be considered as “putative genes” of C. flexuosus and C. winterianus, respectively (Table 1). These mapping rates are like those obtained in Melissa officinalis, where mapping efficiency ranged from 75.85% to 93.93% depending on the software used [58] and are higher than those reported for Hymenachne amplexicaulis, Rugoloa pilosa and Antaenanthia lanata (55.9–62.7%) [59].
Still in the initial stage, Pearson correlation values and PCA results (Figures S2 and S3, respectively) confirmed the experimental quality, as biological replicates clustered more closely with each other than with samples from the other species. Expression frequency distributions in CPM were predominantly concentrated between 0 and 25, indicating consistent mapping profiles regardless of the reference transcriptome used (Figure S4).
It is also important to clarify that a possible criticism of the results obtained in this study is the use of only two samples (replicates) per species. It is widely reported in the literature that the best results for RNAseq are obtained with three replicates per condition, but it is also known that the real impact of a low number of replicates is only to reduce the number of differentially expressed genes (DEGs) identified, not the quality of these results. This is because, with fewer replicates, the genes identified as DEGs are only those with large differences in expression. On the other hand, a larger number of replicates reduces variance values, making the methods more sensitive and allowing the identification of genes with smaller differences in expression [60,61,62]. To reduce experimental error within the limited number of possible samples in this study, each replicate was composed of the bulk of several young leaves from four plants (biological replicate) of each species. Finally, we believe that in this study, intended to provide an overview of the differences between the two species, and without the intention of identifying and validating markers for assisted selection, the number of repetitions used is not a limiting factor.

4.2. Homologous Transcripts Between Lemongrass and Citronella

Local alignment via BlastN between 24,841 and 32,418 contigs of C. flexuosus and C. winterianus resulted in 15,005 homologous sequences (e-value less than 1 × 10−50), indicating high conservation of 60.4% of nr-transcripts between the two species. On the other hand, 9836 (39.59%) and 17,418 (53.71%) of specific with low identity nr-transcripts were identified in C. flexuosus and C. winterianus, respectively. The use of restrictive e-values (less than 1 × 10−50) was based on other studies that showed that from this cutoff point only high-quality alignments are identified, consisting of true homologies with high conservation between sequences [63,64] and excluding the occurrence of false positive alignments [65]. In general, these results are in agreement with the percentages of homologies between transcripts of different species and between accessions of the same species described in the literature. For example, in different transcriptome studies, 31% homologies were found between transcripts of the species Spartina maritima and Spartina alterniflora [66] and 92% between two cultivars of Vicia faba [67].

4.3. Differential Expressions, Functional Annotation and Gene Ontology Analysis

Under equal cultivation conditions, absence of a stress factor and at the same vegetative stage, it is expected that the vast majority of transcripts do not present marked differences in expression between closely related species. Under these conditions, the small portion of differentially expressed genes are those responsible for the most striking differences per se between the species evaluated. This response pattern could be observed in this study, as, in relation to the total number of nr-transcripts, only 7421 (29.9%) and 10,255 (31.6%) had significant differences in expression in each mapping (Table S1).
The DET values, obtained through Log2FC[(CPMcf/CPMcw)], indicate whether a transcript (putative gene) was more highly expressed in C. flexuosus (positive values) or C. winterianus (negative values). Among DETs mapped to the reference transcriptomes of lemongrass and citronella, 3740 (50.4%) and 5266 (51.4%), respectively, showed higher expression in C. flexuosus, indicating that the pattern remained consistent regardless of the reference species (Figure 1B). These findings are consistent with previously reported values in comparative transcriptomic studies among C. martinii × C. flexuosus, C. martinii × C. pendulus, hybrid (C. nardus × C. jwarancusa) × C. flexuosus and C. pendulus × C. flexuosus, which reported 6866, 5913, 1068 and 30 DETs, respectively [68].
In general, in both mappings, the percentages of DETs by Log2FC intervals were quite similar, except for a higher occurrence of values lower than −4, due to the presence of many C. winterianus transcripts absent in C. flexuosus (Figure 1 and Figure S6). The results indicated that, even when the reads were mapped against different reference transcriptomes, the distribution pattern of Log2FC values was preserved (Figure S5).
The number of homologies between a transcriptome and a gene and/or protein database depends directly on the quality of the transcripts generated in the assembly and the sequences of other species deposited in the database being consulted. Transcriptomes containing large amounts of long sequences and few artifacts result in a high percentage of transcripts with annotation or functional prediction obtained via alignment. On the other hand, the number of alignments between any two species is dependent on the divergence time between them [23]. In this study, 18,286 (73.6%) and 22,458 (69.3%) transcripts had homologies predicted against the locally created protein database (Table 2).
These values are lower than the 92% and 82% reported in earlier studies using the NCBI-Nr protein database for C. winterianus and C. flexuosus [16,56], but closer to values reported for other plant species, such as Pisum sativum (50%) [23], Cirsium japonicum (65%) [69], Melissa officinalis (73.84%) [58] and Mentha arvensis (average 76%) [70]. One explanation for the relatively lower number of homologous transcripts in our study may be the presence of short sequences (<300 bp) [23] or non-coding RNAs and untranslated regions (UTRs), which are typically absent from protein databases [56]. These non-coding RNAs include snRNA, snoRNA, lncRNA and various types of small RNAs (e.g., miRNA, siRNA, circRNA), as well as rRNA and tRNA.
In this study, most homologies for both C. flexuosus and C. winterianus were found with Andropogon gerardii (28.1%), Saccharum officinarum (19.5%), Bothriochloa decipiens (11.9%), Sorghum bicolor (10.4%), Miscanthus lutarioriparius (10%), M. sinensis (8.1%), and Zea species (4.7%) (Table 2). These results contrast with previous reports for C. winterianus, which indicated the highest similarity to S. bicolor (44%), Z. mays (22%), Setaria italica (8%) and Oryza sativa (5%) [16] and the same ranking for C. martinii [71]. In C. flexuosus, results were reported similarity primarily with O. sativa (39.6%), S. bicolor (23.5%), Z. mays (4.36%), and S. italica (3.49%) [56]. Another pattern was observed for C. winterianus, C. khasianus × C. pendulus, C. nardus, and C. pendulus, where the highest respective homologies occurred with S. bicolor, Z. mays, S. italica, P. hallii, O. sativa and D. oligosanthes [57].
The marked discrepancy between the species with the highest number of homologies found in our study and the others cited may be due to the composition of the database used. The cited studies used the NCBI-nr database, which at the time of publication did not yet contain sequences of the species A. gerardi, B. decipiens, M. lutarioriparius, M. sinensis, P. virgatum, P. hallii, S. officinarum, S. italica, and S. viridis, as the annotations of these species were later made available in other databases. In the protocol created for this study, a total of 14,241,458 protein sequences from many grasses and dicotyledons downloaded from Phytozome [34], Uniprot [35], the MSU Rice Genome Annotation Project [36] and others [37,38,39] were used, including several species absent in the cited studies. This difference in the composition of the database allowed us to find the predominance in the number of homologies (Table 2) for species that have not yet been described in previous works, contributing to a better understanding of the evolutionary relationship between the genus Cymbopogon and other grasses.
In the final stages of transcriptome studies, the characterization of the molecular functions and/or metabolic pathways of transcripts is often done through the use of standardized vocabulary, such as that of gene ontology (GO) [72]. These annotations, categorized into three distinct aspects of each gene (molecular function, biological process and cellular component), allow comparisons of changes in the amount of transcripts in the GO categories between different individuals, tissues, and/or treatments. We identified GO annotations for 72.5% and 66.8% of the total nr-transcripts and for 72.4% and 64.2% of the DETs of C. flexuosus and C. winterianus, respectively (Table S1), agreeing with [72], who indicated values between 50 and 80% as typical of these studies. Other authors have published very varied results in these values, with GO annotations for 76% of C. flexuosus transcripts, 40.4% for C. winterianus, and 38.1% for C. martinii [16,71].
In this study, the most abundant GO terms were partially similar to results found in C. flexuosus for biological process (categories: metabolic process, response to stimulus, biological regulation and localization) (Figure S7), molecular function (categories: binding, catalytic activity and transporter activity) (Figure S8) and cellular component (categories: intracellular anatomical structure, membrane) (Figure S9) [56]. Our results indicate that, in general, there were no differences in the percentages of the most abundant GO terms in C. flexuosus and C. winterianus in the two mappings, either for total nr-transcripts or DEGs.

4.4. Comparative Reads Mapping Between Cymbopogon and Related Grasses

Here, we implemented a strategy to map the C. flexuosus and C. winterianus read libraries against multiple related species. The back-mapping of the libraries against their own reference transcriptomes resulted in 78% and 74% of reads mapped for C. flexuosus and C. winterianus, respectively (Table 3). Previous studies have reported similar back-mapping values, such as 85.9% for Panicum maximum [73], 76.47% for Poa pratensis [74], 93% for Panicum miliaceum [75], and values ranging from 77.85 to 90.32% for Trifolium pratense [76]. In transcriptomic mapping studies using a related species as reference, a wide range of mapping efficiency has been reported. For example, using the genome of Setaria italica, 86.5% of S. viridis reads were mapped [77] and for Sorghum sudanense, 88.8% of reads aligned to S. bicolor [78]. In rice, a respective 80.6–92% and 84% of reads from the wild species Oryza longistaminata and O. nivara were mapped to the O. sativa sp. japonica reference genome [79,80]. Another study using 50 genotypes from the indica and japonica subspecies reported mapping rates of between 77.66% and 83.88% [81].
Based on these reference values, the species most conserved in relation to the genus Cymbopogon were A. gerardi, S. bicolor, Z. mays, S. officinarum, M. sinensis and M. lutarioriparius, which received 73%, 70%, 68%, 62%, 61% and 60% of mapped reads, respectively (Table 3). It is noteworthy that A. gerardi, despite being a tetraploid species, exhibited the highest mapping percentages, with 75% of C. flexuosus reads and 72% of C. winterianus reads, followed by S. bicolor with 71% and 69%, respectively. This suggests that genome duplication in A. gerardi may be a more recent event and that the sequences have not yet undergone significant neofunctionalization or subfunctionalization. High read mapping percentages between related genomes indicate strong gene content conservation and are directly related to the divergence between species. On the other hand, these values tend to decrease in more distantly related species due to accumulated nucleotide polymorphisms, even when the protein products remain conserved.
Another auxiliary information in these analyses is the number of reads mapped to each gene (depth). Species with conserved gene content and number have very similar depth values, while species with differences in gene content or number, altered by polyploidy, tend to reduce these values. In this study, separate analyses were performed for each of the genomes of polyploid species, enabling comparison between all species regardless of ploidy. As with the percentage of mapped reads, the species with the highest depth values were A. gerardi, S. bicolor, S. officinarum, M. sinensis and M. lutarioriparius. Although corn was the second diploid species with the best value, the complexity of its genome and the fact that it is a degenerate autotetraploid make it difficult to compare the depth value with other diploids.
To reduce the complexity of the relationships between the different variables obtained, a value called index was suggested that unifies the relationship between the percentage of mapped reads, number of transcripts that received read mapping and depth transcript in a single value. The results of the ordering by index value converge to the same results discussed previously, indicating that the species with more conserved expressed regions in relation to Cymbopogon were A. gerardi, S. bicolor and Z. mays, with index values of 3.80, 3.42 and 3.23, respectively (Table 3). These results are corroborated by the fact that, in the most divergent species (O. sativa, H. vulgare, T. aestivum and B. distachyon) and the outgroup A. thaliana, these values were the lowest (Table 3).

4.5. Chloroplast Genome Phylogeny of Cymbopogon and Related Species

To confirm the evolutionary relationship observed in the expressed regions of C. flexuosus, C. winterianus, and the related species initially indicated with protein alignments (Table 2) and mapping of reads against related species (index value) (Table 3), phylogenetic analyses of 41 complete chloroplast genomes were obtained through robust methodology [45,46,48] (Figure 2).
In the phylogenetic tree with divergence time estimates, all species of the genus Cymbopogon were grouped closer to each other than to the other species, indicating consistency of the analysis (Figure 2). The results show that the genera Bothriochloa and Andropogon; a branch containing Miscanthus, Saccharum and Sorghum; and another branch containing the genus Zea, all belonging to the tribe Andropogoneae, were the closest to the genus Cymbopogon (Figure 2). The analysis also confirms the longer divergence time in relation to the tribes Paniceae (genera: Digitaria, Dichanthelium, Panicum and Setaria), Cynodonteae (Eleusine coracana), Oryzeae, Brachypodieae, and Triticeae. Few phylogeny studies including the genus Cymbopogon are found, therefore, phylogenetic data among other species used in this work can be used to validate our results.
Some authors indicated that the divergence between Bothriochloa alta in relation to Andropogon distachyos, a branch containing three species (Miscanthus, Saccharum and Sorghum) and Z. mays was approximately 9.11, 11.61 and 13.29 mya, respectively [82]. When comparing A. girardii with S. bicolor and Z. mays, 7 and 15 mya were observed, respectively [83]. Furthermore, in the comparison of B. decipiens with S. bicolor and Z. mays, 9.5 and 13.26 mya were observed, respectively [38]. The divergence between C. winterianus andropogon virginicus, a group containing three species (Miscanthus, Saccharum and Sorghum), and Z. mays possibly occurred around 11.1, 13.5, 17.3 mya, respectively [3].
Therefore, when corn is set as a reference, these data indicate that the divergence to C. winterianus, A. girardii, and B. decipiens was approximately 17.3, 15 and 13.26 mya, respectively, suggesting C. winterianus and A. girardii as the closest. The literature data diverge from those obtained in this study only for the genus Bothriochloa, which was allocated closer to Cymbopogon than the genus Andropogon in the tree (Figure 2). The lack of definition of the position of these genera in phylogenetic trees was also demonstrated by [84], who obtained trees with different topologies from the genes apo1, arodeh, dwarf8, floricaula, kn1, phyB, rep1, and waxy.
Historically, in phylogenetic studies, many inconsistencies have been observed between the topologies of trees inferred from cytoplasmic vs. nuclear sequences, commonly referred to as cytonuclear discordance [85]. The causes of these discordances have been attributed to both truly biological factors and methodological errors or artifacts of the analysis. Among the biological causes, the differences in results are primarily due to the fact that the genomes of plant cytoplasmic organelles are maternally inherited from an ancestor and do not undergo recombination. On the other hand, the nuclear genome, which initially shared a common origin, undergoes countless recombination events due to frequent cross-pollination between plants [85,86]. Furthermore, the nuclear genome can undergo large block mutations (inversions, translocations, deletions, duplications, and insertions) or polyploidy. Despite the different historical routes of the two genome types leading to different evolutionary rates and the absence of correlation between the trees, evolutionary analyses based on chloroplast data remain widely used and accepted. The results obtained in this study, especially the final understanding of the phylogenetic relationships among the genera Andropogon, Bothriochloa, and Cymbopogon, may be better resolved once complete genomes of the genus Cymbopogon become available.
As expected, all species of the tribe Andropogoneae were closer to the genus Cymbopogon and also to each other [3,82], while the most divergent tribes (Brachypodieae, Cynodonteae, Oryzeae, Paniceae, and Triticeae) and A. thaliana were allocated to the other end of the tree, indicating the robustness of the analyses. Although the difference in divergence time (in millions of years) and the evolutionary distance between B. decipiens (6.44 mya/0.0047) and A. gerardi (6.82 mya/0.0050), in relation to C. flexuosus, is small, when compared with the other species, the number of homologies found in B. decipiens (11.5%) was less than half of that found in A. gerardi (28.5%), indicating that the genome of this species has undergone major changes.
Regarding the other species, the order in the reduction of homology percentages agrees with the divergence time for S. officinarum, S. bicolor, M. lutarioriparius, M. sinensis, and Z. mays (Figure 2 and Figure 3). This set of evidence indicates A. gerardii, S. officinarum, S. bicolor, B. decipiens, M. lutarioriparius, M. sinensis, and Z. mays as the best species for homology search and annotation for the genus Cymbopogon. The relationship between the index order and genetic distances was evaluated by linear regression and obtained R2 = 0.80, equivalent to a high-magnitude negative Pearson correlation of −0.89, confirming that species with higher index values are those genetically closer (Figure 3).

4.6. Phylogeny of Metabolic Genes in Cymbopogon and Related Species

Additionally, the phylogenetic trees obtained using only sequences homologous to enzymes described in KEGG for the metabolism of specific compounds (citronellol, citronellal, trans-citral, neral and citronellatte) of the genus Cymbopogon (Figure 4B—scenario 1) indicated agreement with the topology of the tree obtained in the analysis of chloroplasts. On the other hand, the analysis using a set of enzyme sequences described in secondary metabolism (myrcene, limonene and linalool) of other aromatic plants (Figure 4C—scenario 3) generated results that disagree with the evolution of grasses. Although the set of sequences tested in scenario 1 preserved the same protein domain (Table S11), indicating that there is no major functional change in these genes, it is possible that small changes not yet noticeable may have generated specialization (neo-functionalization) of these genes within the genus Cymbopogon, resulting in the strong aroma.
The phylogenetic analysis of the Cymbopogon specific metabolism set (Figure S10—Scenario 2) indicates that a joint and convergent divergence of these genes occurred into the genus Cymbopogon and that, based on this metabolism, the closest species are A. gerardii, B. decipiens, and S. bicolor.
Although some studies indicate that the initial steps of phenylpropanoid metabolism originate from the horizontal transfer of the phenylalanine ammonia lyase (PAL) gene [87], most findings currently point to the gene originating in bryophytes [88]. However, there are no reports of horizontal gene transfer for terpene metabolism.
In fact, there is no consensus on the evolution and/or specialization of genes associated with this terpenoid metabolism. Some authors indicate that duplications of geranylgeranyl diphosphate synthase (GGPPS) genes in non-vascular plants initiated the functional divergence of the family, with independent parallel processes giving rise to GPPSs (either geranyl diphosphate synthases or GES-geranyl diphosphate diphosphatase) [89]. Furthermore, phylogenetic analyses of GES genes across different clades have shown that, even with substantial sequence divergence, all possess the necessary functional motifs, indicating convergent evolution [90]. Therefore, we believe that the patterns of allelic variation and functional specialization of these genes do not correlate with the phylogenetic divergence of species shown in other analyses.

4.7. KEGG Orthology Annotation and Metabolism Overview

The KEGG pathway database contains information on metabolites, enzymes and their encoding genes, as well as signaling and other molecular interactions/reactions, organized into metabolic and biosynthetic pathways. The BRITE hierarchies, on the other hand, constitute a hierarchical classification system of various biological objects, including enzymes and metabolites [52]. These data are organized in a generic manner, allowing evidence derived from model organisms to be extrapolated to other species by sequence comparison [52].
In this study, this tool was used to identify transcripts with orthologs in “metabolism of terpenoids and polyketides” and “biosynthesis of other secondary metabolites”, encoding enzymes involved in the production of secondary metabolites with potential applications in health, food and industry.
From the total of 18,286 (C. flexuosus) and 22,458 (C. winterianus) annotated nr-transcripts, 1517 (8.29%) and 2063 (9.19%) DETs, respectively, had orthologs assigned in KEGG (Table S3), partially agreeing with previously reported values of 10.6% and 5.6% for C. winterianus and C. martinii, respectively [16,71]. Among the KEGG categories with the highest number of alignments (metabolism, genetic information processing, and BRITE hierarchies) (Table S4), the abundance of DETs involved in carbohydrate metabolism, amino acid metabolism, lipid metabolism and energy metabolism is consistent with findings reported by [68]. A total of 76 (5.01%) and 94 (4.56%) DETs related specifically to secondary metabolism were identified in the mappings against C. flexuosus and C. winterianus, respectively (Table S5). These values are comparable to those reported in other studies, which described 5.8% and 2.72% for the leaves and roots of C. winterianus [16], 2.32% for C. martinii [71], and 4% in Mentha arvensis leaves [70].
The metabolic pathways with the highest number of DETs within the categories “metabolism of terpenoids and polyketides” (viz., terpenoid backbone biosynthesis [15%], carotenoid biosynthesis [10.6%], monoterpenoid biosynthesis [6.5%], etc.) and “biosynthesis of other secondary metabolites” (e.g., phenylpropanoid biosynthesis [18%], various plant secondary metabolite biosynthesis [14.4%], etc.) (Tables S5 and S6) were similar to those reported for the Cymbopogon genus [16,56,71] and for Melissa officinalis [58], and lower than the values observed in the Salvia guaranitica [91] and Ocimum species [92].

4.8. Integration of Transcriptome and Metabolome Data of Secondary Metabolism

The integration of expression data of transcripts homologous to enzymes associated with the synthesis of different secondary metabolites (Figure 6 and Tables S8 and S9) indicate that there is no linear pattern in the comparison between the two species. Furthermore, the metabolites detected in the metabolome (Figure 6 and Figure S7) were different from those indicated in the transcriptome. The absence of transcripts homologous to enzymes associated with the synthesis of the compounds present in the metabolome is possibly due to the fact that these reactions have not yet been annotated in the KEGG maps. Our second hypothesis is that the mismatch between the presence of molecules in the metabolome and the absence of expression of the enzymes involved in their metabolism is due to the fact that, given the high concentration of these metabolites in the tissues, most of the transcriptome is directed towards the synthesis of the other absent compounds. Other authors indicate that the fluctuation of transcription levels is faster than for protein levels, as the synthesis of these proteins is accompanied by alternative splicing events, post-transcriptional modifications, and translational regulation, directly influencing the levels of secondary metabolites [93,94].
Although the results indicate higher expression of chloroplast enzymes involved in the synthesis of geranyl diphosphate and geranylgeranyl diphosphate in Cymbopogon flexuosus, the monoterpenes (neomenthol, linalool) and carotenoids (lycopene, D-carotene, Z-carotene and lutein) derived from this pathway accumulated to a greater extent in C. winterianus (Figure 6). In the cytosol, although two enzymes of the mevalonate pathway showed higher expression in C. winterianus, the sesquiterpenoids β-farnesene and farnesal, synthesized downstream, were more abundant in C. flexuosus. No transcripts related to the metabolism of di- or triterpenoids were identified.
Various terpenoid-derived molecules have known industrial and pharmacological applications. The higher presence of neomenthol in C. winterianus is a promising indicator for further studies, as this menthol isomer is widely used in pharmaceuticals, cosmetics, pesticides and as a flavoring agent. Other molecules more abundant in C. winterianus, such as linalool, have antioxidant and anti-inflammatory properties [95] and lycopene has been reported for its antioxidant activity, cholesterol-lowering effect and anticancer potential in lung, colorectal and prostate cancers [96,97,98]. The carotenoids D-carotene and Z-carotene are precursors of lycopene and/or alpha-carotene (provitamin A), which have potential for prostate cancer treatment and protection against lung carcinoma [99]. Lutein is indicated for the prevention and treatment of eye diseases, skin irritation and for protecting the retina, with potential to reduce the risk of age-related macular degeneration [98,100,101].
Compounds more likely produced in C. flexuosus, such as perillic acid and phytoene, have been respectively reported to exhibit anticancer activity and serve as a precursor of vitamin A [102]. Among the sesquiterpenoids, synthesized downstream from geranyl-PP and farnesyl-PP in the cytosol, farnesal (2E,6E-farnesal) has antibacterial activity [103] and β-farnesene is a vitamin E precursor with uses in pharmaceuticals and cosmetics [104].
Our results indicate higher accumulation in C. winterianus of various phenylpropanoids, including caffeyl alcohol (p-coumaryl alcohol), trans-cinnamic acid, cinnamaldehyde, p-coumaroyl-CoA, ferulic acid, and chlorogenic acid. Caffeyl alcohol, a precursor of eugenol, is reported to have antioxidant, anti-inflammatory, anticancer, antimicrobial, antifungal, antiseptic, and anthelmintic properties [105,106,107]. Trans-cinnamic acid is a precursor of quinones and has potential to reduce stomatitis and oral infections and to inhibit the proliferation of colorectal and prostate cancer cells [96,108]. Cinnamaldehyde, widely used for its flavor and aroma, also exhibits antifungal, antioxidant, anti-inflammatory and anti-oral cancer activities [54,107]. Ferulic acid is known to inhibit the growth of prostate cancer cells [96,107,109], while chlorogenic acid has potential to inhibit the proliferation of colorectal (HT29) and prostate (PC3) cancer cells [96]. P-coumaroyl-CoA is a key precursor in the biosynthesis of flavonoids and coumarins [110]. Coumarins have a broad range of biological functions, including antibacterial, antiviral, antifungal, anti-inflammatory, anticancer and anticoagulant activities [111]. Coniferin is indicated for the treatment of rheumatoid arthritis [112] and caffeic acid has shown potential to inhibit cancer cell proliferation and to reduce insulin resistance in diabetic rats [96,109].
In the flavonoid pathway, C. winterianus showed higher expression of genes associated with the synthesis of daidzein, genistein, and naringenin, all with anti-inflammatory activity [113]; pinocembrin, reported to have antibacterial properties; and p-coumaric acid, known to inhibit the proliferation of colorectal and prostate cancer cells and to possess antioxidant, antibacterial, and antiviral activity [96,107]. In C. flexuosus, higher expression was observed for luteolin and quercetin, both known for their antimutagenic, antiviral and anti-inflammatory properties [97]; epiafzelechin and epicatechin, with anticancer potential [96,114]; and tropine, with reported use in treating insomnia [115].
Other compounds mapped in KEGG under “biosynthesis of various secondary metabolites”, and possibly more abundant in C. flexuosus, include betalamic acid, a substrate for betalain pigment synthesis; coumarin, with known antioxidant properties [20,106]; and indole, used in fragrances.
The metabolome data indicate that the values (quantification) of the identified molecules are consistent with the literature (Table 4 and Table S7). The identified molecules show the richness of the metabolites of the two species, with several molecules described as antioxidants (germacrene A, linalool, α-cadinol, β-elemene, nerol, citronellal, β-citrale and α-citral), anti-inflammatory potential (linalool, cis-verbenol, germacrene A, γ-cadinene, geranyl acetate, α-cadinol, β-elemene, β-caryophyllene, β-citral, α-citral, citronellal and citronellol), anti-bacterial (camphene, limonene, neral, geranial, citronellol, nerol and citronellal), anti-fungal (citronellol, limonene, geranyl acetate, nerol, citronellyl acetate, neral, geranial, germacrene A, linalool and citronellal), anti-cancer properties (caryophyllene oxide, β-caryophyllene, α-cadinol, β-elemene, geranyl acetate, neral, geranial, nerol, and camphene), insect repellent (germacrene D, limonene, citronellal, nerol, germacrene A, citronellyl acetate, cis-verbenol, and δ-cadinene), anti-microbial (β-caryophyllene, α-cadinol, β-elemene, and γ-cadinene), larvicidal (germacrene D and germacrene A), medication (camphene and β-caryophyllene), anti-trypanosomal (neral) and antibiotic (citronellol). In addition, most of these compounds are widely used as fragrances in perfumes and/or in cosmetic formulations, viz., citronellol, citronellal, citronellyl acetate, β-elemene, δ-cadinene, neral, geranial, nerol, linalool, cis-verbenol, and germacrene D (Table S10). Additionally, many of these compounds are widely used in the fragrance and cosmetic industries, viz., citronellol, citronellal, citronellyl acetate, β-elemene, δ-cadinene, neral, geranial, nerol, linalool, cis-verbenol, and germacrene D (Table S10).

5. Conclusions

In this work, de novo assembly and other analyses were performed to improve the understanding of the evolutionary aspects and metabolic differences between C. flexuosus and C. winterianus. We implemented a robust analysis to search for homologies between unknown transcripts and other grasses with available genomic information, as well as to compare the main expression differences associated with the production of secondary metabolites.
Our results indicate that, based on the expressed functional regions of these genomes, the genus is most similar to the species A. gerardi, S. bicolor, and Z. mays. Considering the limited amount of genomic information for these species, this study provided new insights for the choice of genome databases as reference for future sequencing studies.
An important finding from the results is that transcriptome analysis alone does not allow for the identification of certain classes of metabolites that are predominant in a species. This is possibly due to the complexity of secondary metabolism and the occurrence of several events between transcription, translation, and metabolite production. However, it was possible to observe the richness of active secondary metabolic pathways in both species.
Finally, considering the ease of cultivation resulting from the associated rusticity and C4 metabolism, it is possible to reaffirm the potential of these species as a genomic model for advances in the understanding of secondary metabolism and as a source of genes and/or alleles for genetic engineering and gene editing.

Supplementary Materials

The following supporting information can be downloaded at https://www.mdpi.com/article/10.3390/agronomy16100999/s1.

Author Contributions

Conceptualization/methodology/software/formal analysis: L.C.d.M.; investigation: L.C.d.M., A.C.d.O., C.P., C.V.R. and E.J.B.B.; writing: L.C.d.M., A.C.d.O., C.P., L.C.B., C.V.R., L.W.P.A., G.B.d.C. and E.J.B.B.; funding acquisition/project administration/supervision: L.C.d.M., A.C.d.O. and E.J.B.B. All authors have read and agreed to the published version of the manuscript.

Funding

Brazilian National Council for Scientific and Technological Development (CNPq), Coordenação de Aperfeiçoamento de Pessoal de Nível Superior (CAPES), and the Fundação de Amparo à Pesquisa do Estado do RS (FAPERGS).

Data Availability Statement

Raw RNA-seq reads, contigs and gene expression results from this study have been submitted to the NCBI Gene Expression Omnibus (http://www.ncbi.nlm.nih.gov/geo) under accession n. GSE306450 (accessed on 30 August 2025).

Acknowledgments

Funding for this work came from the Brazilian National Council for Scientific and Technological Development (CNPq). The authors also gratefully acknowledge CNPq for the research productivity fellowships granted to L.C.d.M., A.C.d.O., C.P., C.V.R. and E.J.B.B. Additionally, the authors wish to thank to Coordenação de Aperfeiçoamento de Pessoal de Nível Superior (CAPES). The authors wish to thank CPMA-DAGRO-UNICAMP, especially Glyn Mara Figueira, for providing seedlings of the species. The authors would like to thank the DOE Joint Genome Institute and Jeremy Schmutz for prepublication access to the genome of Andropogon gerardi in Phytozome.

Conflicts of Interest

The authors declare no conflicts of interest.

References

  1. Welker, C.A.D.; McKain, M.R.; Estep, M.C.; Pasquet, R.S.; Chipabika, G.; Pallangyo, B.; Kellogg, E.A. Phylogenomics Enables Biogeographic Analysis and a New Subtribal Classification of Andropogoneae (Poaceae—Panicoideae). J. Syst. Evol. 2020, 58, 1003–1030. [Google Scholar] [CrossRef]
  2. Gallaher, T.J.; Peterson, P.M.; Soreng, R.J.; Zuloaga, F.O.; Li, D.Z.; Clark, L.G.; Tyrrell, C.D.; Welker, C.A.D.; Kellogg, E.A.; Teisher, J.K. Grasses through Space and Time: An Overview of the Biogeographical and Macroevolutionary History of Poaceae. J. Syst. Evol. 2022, 60, 522–569. [Google Scholar] [CrossRef]
  3. Huang, W.; Zhang, L.; Columbus, J.T.; Hu, Y.; Zhao, Y.; Tang, L.; Guo, Z.; Chen, W.; McKain, M.; Bartlett, M.; et al. A Well-Supported Nuclear Phylogeny of Poaceae and Implications for the Evolution of C4 Photosynthesis. Mol. Plant 2022, 15, 755–777. [Google Scholar] [CrossRef] [PubMed]
  4. Estep, M.C.; McKain, M.R.; Diaz, D.V.; Zhong, J.; Hodge, J.G.; Hodkinson, T.R.; Layton, D.J.; Malcomber, S.T.; Pasquet, R.; Kellogg, E.A. Allopolyploidy, Diversification, and the Miocene Grassland Expansion. Proc. Natl. Acad. Sci. USA 2014, 111, 15149–15154. [Google Scholar] [CrossRef]
  5. Bertea, C.; Maffei, M.E. The Genus Cymbopogon: Botany, Including Anatomy, Physiology, Biochemistry and Molecular Biology. In Essential Oil-Bearing Grasses: The Genus Cymbopogon; CRC Press: Boca Raton, FL, USA, 2009; pp. 1–24. [Google Scholar]
  6. Mwithiga, G.; Maina, S.; Muturi, P.; Gitari, J. Lemongrass (Cymbopogon flexuosus) Agronomic Traits, Oil Yield and Oil Quality under Different Agro-Ecological Zones. J. Agric. Food Res. 2022, 10, 100422. [Google Scholar] [CrossRef]
  7. Jagadeeshan, V.; Murthy, A.; Saraswathi, T. A Report on the Genome Size and Ploidy Status of Wild Genotypes of Cymbopogon Species. Int. J. Bot. Stud. 2019, 6, 1–5. [Google Scholar]
  8. Soenarko, S. The Genus Cymbopogon Sprengel (Gramineae). Reinwardtia 1977, 9, 225–375. [Google Scholar]
  9. Lavania, U.C. Karyomorphological Observations in Cymbopogon Sprengel. Cytologia 1988, 53, 517–524. [Google Scholar] [CrossRef]
  10. Ganjewala, D. Cymbopogon Essential Oils: Chemical Compositions and Bioactivities. Int. J. Essent. Oil Ther. 2009, 3, 56–65. [Google Scholar]
  11. Tibenda, J.J.; Yi, Q.; Wang, X.; Zhao, Q. Review of Phytomedicine, Phytochemistry, Ethnopharmacology, Toxicology, and Pharmacological Activities of Cymbopogon Genus. Front. Pharmacol. 2022, 13, 997918. [Google Scholar]
  12. Ekka, A.; Tirkey, A.; Kujur, V.K.; Ameen, G. Review on: Genetic Insights into Lemongrass (Cymbopogon flexuosus Steud): Traditional Uses to Modern Applications. Int. J. Adv. Biochem. Res. 2024, 8, 915–928. [Google Scholar] [CrossRef]
  13. Pathania, D.; Sharma, M.; Thakur, P.; Chaudhary, V.; Kaushik, A.; Furukawa, H.; Khosla, A. Exploring Phytochemical Composition, Photocatalytic, Antibacterial, and Antifungal Efficacies of Au NPs Supported by Cymbopogon Flexuosus Essential Oil. Sci. Rep. 2022, 12, 14249. [Google Scholar] [CrossRef]
  14. Verma, R.S.; Verma, S.K.; Tandon, S.; Padalia, R.C.; Darokar, M.P. Chemical Composition and Antimicrobial Activity of Java Citronella (Cymbopogon winterianus Jowitt Ex Bor) Essential Oil Extracted by Different Methods. J. Essent. Oil Res. 2020, 32, 449–455. [Google Scholar] [CrossRef]
  15. Avoseh, O.; Oyedeji, O.; Rungqu, P.; Nkeh-Chungag, B.; Oyedeji, A. Cymbopogon Species; Ethnopharmacology, Phytochemistry and the Pharmacological Importance. Molecules 2015, 20, 7438–7453. [Google Scholar] [CrossRef]
  16. Devi, K.; Mishra, S.K.; Sahu, J.; Panda, D.; Modi, M.K.; Sen, P. Genome Wide Transcriptome Profiling Reveals Differential Gene Expression in Secondary Metabolite Pathway of Cymbopogon Winterianus. Sci. Rep. 2016, 6, 21026. [Google Scholar] [CrossRef]
  17. Mieso, B.; Befa, A. Physical Characteristics of the Essential Oil Extracted from Released and Improved Lemongrass Varieties, Palmarosa and Citronella Grass. Agric. Food Sci. Res. 2020, 7, 65–68. [Google Scholar] [CrossRef]
  18. Prochnow, D.; Dos Santos, R.S.; Barros, L.M.; Schmidt, D.; Heinzmann, B.M.; da Luz, V.K.; Costa de Oliveira, A.; Pegoraro, C.; da Maia, L.C. Chemical Profile of Essential Oil in Four Cymbopogon Species Grown in Southern Brazil. Genet. Mol. Res. 2023, 22, 1–10. [Google Scholar] [CrossRef]
  19. Kopylova, E.; Noé, L.; Touzet, H. SortMeRNA: Fast and Accurate Filtering of Ribosomal RNAs in Metatranscriptomic Data. Bioinformatics 2012, 28, 3211–3217. [Google Scholar] [CrossRef] [PubMed]
  20. Milech, C.; do Amaral, M.N.; Auler, P.A.; Lucho, S.R.; Kleinowski, A.M.; da Maia, L.C.; Bianchi, V.J.; Braga, E.J.B. Betalain Accumulation and de Novo Transcriptome Sequencing Reveal the Potential to Increase Bioactive Compounds in Alternanthera Sessilis Elicited by Methyl Jasmonate. Acta Physiol. Plant. 2023, 45, 15. [Google Scholar] [CrossRef]
  21. Bolger, A.M.; Lohse, M.; Usadel, B. Trimmomatic: A Flexible Trimmer for Illumina Sequence Data. Bioinformatics 2014, 30, 2114–2120. [Google Scholar] [CrossRef]
  22. Grabherr, M.G.; Haas, B.J.; Yassour, M.; Levin, J.Z.; Thompson, D.A.; Amit, I.; Adiconis, X.; Fan, L.; Raychowdhury, R.; Zeng, Q.; et al. Full-Length Transcriptome Assembly from RNA-Seq Data without a Reference Genome. Nat. Biotechnol. 2011, 29, 644–652. [Google Scholar] [CrossRef]
  23. Sudheesh, S.; Sawbridge, T.I.; Cogan, N.O.I.; Kennedy, P.; Forster, J.W.; Kaur, S. De Novo Assembly and Characterisation of the Field Pea Transcriptome Using RNA-Seq. BMC Genom. 2015, 16, 611. [Google Scholar] [CrossRef]
  24. Huang, X.; Madan, A. CAP3: A DNA Sequence Assembly Program. Genome Res. 1999, 9, 868–877. [Google Scholar] [CrossRef] [PubMed]
  25. Pertea, M.; Kim, D.; Pertea, G.M.; Leek, J.T.; Salzberg, S.L. Transcript-Level Expression Analysis of RNA-Seq Experiments with HISAT, StringTie and Ballgown. Nat. Protoc. 2016, 11, 1650–1667. [Google Scholar] [CrossRef]
  26. Li, H.; Handsaker, B.; Wysoker, A.; Fennell, T.; Ruan, J.; Homer, N.; Marth, G.; Abecasis, G.; Durbin, R. The Sequence Alignment/Map Format and SAMtools. Bioinformatics 2009, 25, 2078–2079. [Google Scholar] [CrossRef] [PubMed]
  27. Anders, S.; McCarthy, D.J.; Chen, Y.; Okoniewski, M.; Smyth, G.K.; Huber, W.; Robinson, M.D. Count-Based Differential Expression Analysis of RNA Sequencing Data Using R and Bioconductor. Nat. Protoc. 2013, 8, 1765–1786. [Google Scholar] [CrossRef] [PubMed]
  28. Mortazavi, M.; Ren, Y.; Saini, S.; Antaki, D.; Pierre, C.L.S.; Williams, A.; Sohni, A.; Wilkinson, M.F.; Gymrek, M.; Sebat, J.; et al. SNPs, Short Tandem Repeats, and Structural Variants Are Responsible for Differential Gene Expression across C57BL/6 and C57BL/10 Substrains. Cell Genom. 2022, 2, 100102. [Google Scholar] [CrossRef]
  29. Robinson, M.D.; McCarthy, D.J.; Smyth, G.K. EdgeR: A Bioconductor Package for Differential Expression Analysis of Digital Gene Expression Data. Bioinformatics 2009, 26, 139–140. [Google Scholar] [CrossRef] [PubMed]
  30. R Core Team. R: A Language and Environment for Statistical Computing; R Foundation for Statistical Computing: Vienna, Austria, 2023; Available online: https://www.r-project.org/ (accessed on 22 September 2024).
  31. Altschul, S.F.; Gish, W.; Miller, W.; Myers, E.W.; Lipman, D.J. Basic Local Alignment Search Tool. J. Mol. Biol. 1990, 215, 403–410. [Google Scholar] [CrossRef]
  32. Tempel, S.; Bedo, J.; Talla, E. From a Large-Scale Genomic Analysis of Insertion Sequences to Insights into Their Regulatory Roles in Prokaryotes. BMC Genom. 2022, 23, 451. [Google Scholar] [CrossRef]
  33. Wickham, H. ggplot2: Elegant Graphics for Data Analysis; Springer: New York, NY, USA, 2009; Volume 35. [Google Scholar]
  34. Goodstein, D.M.; Shu, S.; Howson, R.; Neupane, R.; Hayes, R.D.; Fazo, J.; Mitros, T.; Dirks, W.; Hellsten, U.; Putnam, N.; et al. Phytozome: A Comparative Platform for Green Plant Genomics. Nucleic Acids Res. 2012, 40, D1178–D1186. [Google Scholar] [CrossRef]
  35. The UniProt Consortium. UniProt: A Worldwide Hub of Protein Knowledge. Nucleic Acids Res. 2019, 47, D506–D515. [Google Scholar] [CrossRef]
  36. Kawahara, Y.; de la Bastide, M.; Hamilton, J.P.; Kanamori, H.; Mccombie, W.R.; Ouyang, S.; Schwartz, D.C.; Tanaka, T.; Wu, J.; Zhou, S.; et al. Improvement of the Oryza Sativa Nipponbare Reference Genome Using next Generation Sequence and Optical Map Data. Rice 2013, 6, 4. [Google Scholar] [CrossRef]
  37. Miao, J.; Feng, Q.; Li, Y.; Zhao, Q.; Zhou, C.; Lu, H.; Fan, D.; Yan, J.; Lu, Y.; Tian, Q.; et al. Chromosome-Scale Assembly and Analysis of Biomass Crop Miscanthus Lutarioriparius Genome. Nat. Commun. 2021, 12, 2458. [Google Scholar] [CrossRef] [PubMed]
  38. De Silva, N.P.; Lee, C.; Battlay, P.; Fournier-Level, A.; Moore, J.L.; Hodgins, K.A. Genome Assembly of an Australian Native Grass Species Reveals a Recent Whole-Genome Duplication and Biased Gene Retention of Genes Involved in Stress Response. Gigascience 2023, 12, giad034. [Google Scholar] [CrossRef]
  39. Studer, A.J.; Schnable, J.C.; Weissmann, S.; Kolbe, A.R.; McKain, M.R.; Shao, Y.; Cousins, A.B.; Kellogg, E.A.; Brutnell, T.P. The Draft Genome of the C3 Panicoid Grass Species Dichanthelium Oligosanthes. Genome Biol. 2016, 17, 223. [Google Scholar] [CrossRef] [PubMed]
  40. Abrouk, M.; Ahmed, H.I.; Cubry, P.; Šimoníková, D.; Cauet, S.; Pailles, Y.; Bettgenhaeuser, J.; Gapa, L.; Scarcelli, N.; Couderc, M.; et al. Fonio Millet Genome Unlocks African Orphan Crop Diversity for Agriculture in a Changing Climate. Nat. Commun. 2020, 11, 4488. [Google Scholar] [CrossRef] [PubMed]
  41. Buchfink, B.; Xie, C.; Huson, D.H. Fast and Sensitive Protein Alignment Using DIAMOND. Nat. Methods 2014, 12, 59–60. [Google Scholar] [CrossRef] [PubMed]
  42. Ashburner, M.; Ball, C.A.; Blake, J.A.; Botstein, D.; Butler, H.; Cherry, J.M.; Davis, A.P.; Dolinski, K.; Dwight, S.S.; Eppig, J.T.; et al. The Gene Ontology Consortium. Gene Ontology: Tool for the Unification of Biology. Nat. Genet. 2011, 25, 25–29. [Google Scholar] [CrossRef]
  43. Chen, C.; Chen, H.; Zhang, Y.; Thomas, H.R.; Frank, M.H.; He, Y.; Xia, R. TBtools: An Integrative Toolkit Developed for Interactive Analyses of Big Biological Data. Mol. Plant 2020, 13, 1194–1202. [Google Scholar] [CrossRef] [PubMed]
  44. Katoh, K.; Standley, D.M. MAFFT Multiple Sequence Alignment Software Version 7: Improvements in Performance and Usability. Mol. Biol. Evol. 2013, 30, 772–780. [Google Scholar] [CrossRef] [PubMed]
  45. Stamatakis, A. RAxML Version 8: A Tool for Phylogenetic Analysis and Post-Analysis of Large Phylogenies. Bioinformatics 2014, 30, 1312–1313. [Google Scholar] [CrossRef]
  46. Guo, X.; Fang, D.; Sahu, S.K.; Yang, S.; Guang, X.; Folk, R.; Smith, S.A.; Chanderbali, A.S.; Chen, S.; Liu, M.; et al. Chloranthus Genome Provides Insights into the Early Diversification of Angiosperms. Nat. Commun. 2021, 12, 6930. [Google Scholar] [CrossRef]
  47. Darriba, D.; Posada, D.; Kozlov, A.M.; Stamatakis, A.; Morel, B.; Flouri, T. ModelTest-NG: A New and Scalable Tool for the Selection of DNA and Protein Evolutionary Models. Mol. Biol. Evol. 2020, 37, 291–294. [Google Scholar] [CrossRef]
  48. Tamura, K.; Battistuzzi, F.U.; Billing-Ross, P.; Murillo, O.; Filipski, A.; Kumar, S. Estimating Divergence Times in Large Molecular Phylogenies. Proc. Natl. Acad. Sci. USA 2012, 109, 19333–19338. [Google Scholar] [CrossRef]
  49. Tamura, K.; Stecher, G.; Kumar, S. MEGA11: Molecular Evolutionary Genetics Analysis Version 11. Mol. Biol. Evol. 2021, 38, 3022–3027. [Google Scholar] [CrossRef]
  50. Pi, H.W.; Chiang, Y.R.; Li, W.H. Mapping Geological Events and Nitrogen Fixation Evolution Onto the Timetree of the Evolution of Nitrogen-Fixation Genes. Mol. Biol. Evol. 2024, 41, msae023. [Google Scholar] [CrossRef] [PubMed]
  51. Kanehisa, M.; Furumichi, M.; Sato, Y.; Matsuura, Y.; Ishiguro-Watanabe, M. KEGG: Biological Systems Database as a Model of the Real World. Nucleic Acids Res. 2025, 53, D672–D677. [Google Scholar] [CrossRef]
  52. Kanehisa, M.; Sato, Y. KEGG Mapper for Inferring Cellular Functions from Protein Sequences. Protein Sci. 2020, 29, 28–35. [Google Scholar] [CrossRef] [PubMed]
  53. Kanehisa, M.; Sato, Y.; Morishima, K. BlastKOALA and GhostKOALA: KEGG Tools for Functional Characterization of Genome and Metagenome Sequences. J. Mol. Biol. 2016, 428, 726–731. [Google Scholar] [CrossRef]
  54. Wang, J.; Su, B.; Jiang, H.; Cui, N.; Yu, Z.; Yang, Y.; Sun, Y. Traditional Uses, Phytochemistry and Pharmacological Activities of the Genus Cinnamomum (Lauraceae): A Review. Fitoterapia 2020, 146, 104675. [Google Scholar] [CrossRef]
  55. Amil-Ruiz, F.; Herruzo-Ruiz, A.M.; Fuentes-Almagro, C.; Baena-Angulo, C.; Jiménez-Pastor, J.M.; Blasco, J.; Alhama, J.; Michán, C. Constructing a de Novo Transcriptome and a Reference Proteome for the Bivalve Scrobicularia Plana: Comparative Analysis of Different Assembly Strategies and Proteomic Analysis. Genomics 2021, 113, 1543–1553. [Google Scholar] [CrossRef]
  56. Meena, S.; Kumar, S.R.; Rao, D.K.V.; Dwivedi, V.; Shilpashree, H.B.; Rastogi, S.; Shasany, A.K.; Nagegowda, D.A. De Novo Sequencing and Analysis of Lemongrass Transcriptome Provide First Insights into the Essential Oil Biosynthesis of Aromatic Grasses. Front. Plant Sci. 2016, 7, 1129. [Google Scholar] [CrossRef]
  57. Bhat, S.; Sharma, A.; Sharma, P.; Singh, K.; Kundan, M.; Fayaz, M.; Wajid, M.A.; Gairola, S.; Misra, P. Development and Analysis of de Novo Transcriptome Assemblies of Multiple Genotypes of Cymbopogon Spp. Reveal Candidate Genes Involved in the Biosynthesis of Aromatic Monoterpenes. Int. J. Biol. Macromol. 2023, 253, 127508. [Google Scholar] [CrossRef] [PubMed]
  58. Mansouri, M.; Mohammadi, F. Transcriptome Analysis to Identify Key Genes Involved in Terpenoid and Rosmarinic Acid Biosynthesis in Lemon Balm (Melissa officinalis). Gene 2021, 773, 145417. [Google Scholar] [CrossRef]
  59. Prochetto, S.; Studer, A.J.; Reinheimer, R. De Novo Transcriptome Assemblies of C3 and C4 Non-Model Grass Species Reveal Key Differences in Leaf Development. BMC Genom. 2023, 24, 64. [Google Scholar] [CrossRef] [PubMed]
  60. Lamarre, S.; Frasse, P.; Zouine, M.; Labourdette, D.; Sainderichin, E.; Hu, G.; Le Berre-Anton, V.; Bouzayen, M.; Maza, E. Optimization of an RNA-Seq Differential Gene Expression Analysis Depending on Biological Replicate Number and Library Size. Front. Plant Sci. 2018, 9, 108. [Google Scholar] [CrossRef]
  61. Tariq, M.A.; Kim, H.J.; Jejelowo, O.; Pourmand, N. Whole-Transcriptome RNAseq Analysis from Minute Amount of Total RNA. Nucleic Acids Res. 2011, 39, e120. [Google Scholar] [CrossRef]
  62. Schurch, N.J.; Schofield, P.; Gierliński, M.; Cole, C.; Sherstnev, A.; Singh, V.; Wrobel, N.; Gharbi, K.; Simpson, G.G.; Owen-Hughes, T.; et al. Erratum: How Many Biological Replicates Are Needed in an RNA-Seq Experiment and Which Differential Expression Tool Should You Use? RNA 2016, 22, 1641. [Google Scholar] [CrossRef] [PubMed][Green Version]
  63. Husin, N.A. Identification of Novel Transcripts and Exons by RNA-Seq of Transcriptome in Durio zibethinus Murr. bioRxiv 2022. [Google Scholar] [CrossRef]
  64. Sangphukieo, A.; Laomettachit, T.; Ruengjitchatchawalya, M. Photosynthetic Protein Classification Using Genome Neighborhood-Based Machine Learning Feature. Sci. Rep. 2020, 10, 7108. [Google Scholar] [CrossRef]
  65. Treiber, M.L.; Taft, D.H.; Korf, I.; Mills, D.A.; Lemay, D.G. Pre- and Post-Sequencing Recommendations for Functional Annotation of Human Fecal Metagenomes. BMC Bioinform. 2020, 21, 74. [Google Scholar] [CrossRef]
  66. Ferreira De Carvalho, J.; Poulain, J.; Da Silva, C.; Wincker, P.; Michon-Coudouel, S.; Dheilly, A.; Naquin, D.; Boutte, J.; Salmon, A.; Ainouche, M. Transcriptome de Novo Assembly from Next-Generation Sequencing and Comparative Analyses in the Hexaploid Salt Marsh Species Spartina Maritima and Spartina Alterniflora (Poaceae). Heredity 2013, 110, 181–193. [Google Scholar] [CrossRef]
  67. Braich, S.; Sudheesh, S.; Forster, J.W.; Kaur, S. Characterisation of Faba Bean (Vicia faba L.) Transcriptome Using RNA-Seq: Sequencing, de Novo Assembly, Annotation, and Expression Analysis. Agronomy 2017, 7, 53. [Google Scholar] [CrossRef]
  68. Kaur, G.; Arya, S.K.; Singh, B.; Singh, S.; Sushmita; Saxena, G.; Verma, P.C.; Ganjewala, D. Comparative Transcriptional Analysis of Metabolic Pathways and Mechanisms Regulating Essential Oil Biosynthesis in Four Elite Cymbopogon spp. Int. J. Biol. Macromol. 2023, 229, 943–951. [Google Scholar] [CrossRef]
  69. Roy, N.S.; Kim, J.-A.; Choi, A.-Y.; Ban, Y.-W.; Park, N.-I.; Park, K.-C.; Yang, H.; Choi, I.-Y.; Kim, S. RNA-Seq De Novo Assembly and Differential Transcriptome Analysis of Korean Medicinal Herb Cirsium Japonicum Var. Spinossimum. Genom. Inform. 2018, 16, e34. [Google Scholar] [CrossRef]
  70. Mishra, A.; Gupta, P.; Lal, R.K.; Dhawan, S.S. Assessing and Integrating the Transcriptome Analysis with Plant Development, Trichomes, and Secondary Metabolites Yield Potential in Mentha ArvensisL. Plant Physiol. Biochem. 2021, 162, 517–530. [Google Scholar] [CrossRef]
  71. Kaur, G.; Arya, S.K.; Singh, B.; Singh, S.; Dhar, Y.V.; Verma, P.C.; Ganjewala, D. Transcriptome Analysis of the Palmarosa Cymbopogon Martinii Inflorescence with Emphasis on Genes Involved in Essential Oil Biosynthesis. Ind. Crops Prod. 2019, 140, 111602. [Google Scholar] [CrossRef]
  72. Conesa, A.; Madrigal, P.; Tarazona, S.; Gomez-Cabrero, D.; Cervera, A.; McPherson, A.; Szcześniak, M.W.; Gaffney, D.J.; Elo, L.L.; Zhang, X.; et al. A Survey of Best Practices for RNA-Seq Data Analysis. Genome Biol. 2016, 17, 13. [Google Scholar] [CrossRef] [PubMed]
  73. Toledo-Silva, G.; Cardoso-Silva, C.B.; Jank, L.; Souza, A.P. De Novo Transcriptome Assembly for the Tropical Grass Panicum Maximum Jacq. PLoS ONE 2013, 8, e70781. [Google Scholar] [CrossRef] [PubMed]
  74. Ni, Y.; Guo, N.; Zhao, Q.; Guo, Y. Identification of Candidate Genes Involved in Wax Deposition in Poa Pratensis by RNA-Seq. BMC Genom. 2016, 17, 314. [Google Scholar] [CrossRef] [PubMed]
  75. Yue, H.; Wang, L.; Liu, H.; Yue, W.; Du, X.; Song, W.; Nie, X. De Novo Assembly and Characterization of the Transcriptome of Broomcorn Millet (Panicum miliaceum L.) for Gene Discovery and Marker Development. Front. Plant Sci. 2016, 7, 1083. [Google Scholar] [CrossRef]
  76. Herbert, D.B.; Gross, T.; Rupp, O.; Becker, A. Transcriptome Analysis Reveals Major Transcriptional Changes during Regrowth after Mowing of Red Clover (Trifolium pratense). BMC Plant Biol. 2021, 21, 95. [Google Scholar] [CrossRef]
  77. Xu, J.; Li, Y.; Ma, X.; Ding, J.; Wang, K.; Wang, S.; Tian, Y.; Zhang, H.; Zhu, X.G. Whole Transcriptome Analysis Using Next-Generation Sequencing of Model Species Setaria Viridis to Support C4 Photosynthesis Research. Plant Mol. Biol. 2013, 83, 77–87. [Google Scholar] [CrossRef]
  78. Li, J.; Wang, L.; Zhan, Q.; Liu, Y.; Yang, X. Transcriptome Characterization and Functional Marker Development in Sorghum Sudanense. PLoS ONE 2016, 11, e0154947. [Google Scholar] [CrossRef] [PubMed][Green Version]
  79. Zhang, T.; Huang, L.; Wang, Y.; Wang, W.; Zhao, X.; Zhang, S.; Zhang, J.; Hu, F.; Fu, B.; Li, Z. Differential Transcriptome Profiling of Chilling Stress Response between Shoots and Rhizomes of Oryza Longistaminata Using RNA Sequencing. PLoS ONE 2017, 12, e0188625. [Google Scholar] [CrossRef]
  80. Xu, Y.C.; Zhang, J.; Zhang, D.Y.; Nan, Y.H.; Ge, S.; Guo, Y.L. Identification of Long Noncoding Natural Antisense Transcripts (LncNATs) Correlated with Drought Stress Response in Wild Rice (Oryza nivara). BMC Genom. 2021, 22, 424. [Google Scholar] [CrossRef]
  81. Pang, H.; Chen, Q.; Li, Y.; Wang, Z.; Wu, L.; Yang, Q.; Zheng, X. Comparative Analysis of the Transcriptomes of Two Rice Subspecies during Domestication. Sci. Rep. 2021, 11, 3660. [Google Scholar] [CrossRef] [PubMed]
  82. Lloyd Evans, D.; Joshi, S.V.; Wang, J. Whole Chloroplast Genome and Gene Locus Phylogenies Reveal the Taxonomic Placement and Relationship of Tripidium (Panicoideae: andropogoneae) to Sugarcane. BMC Evol. Biol. 2019, 19, 33. [Google Scholar] [CrossRef] [PubMed]
  83. Cordobés, F.M.; Robbiati, F.O.; Anton, A.M.; Scrivanti, L.R. Phylogeny, Evolution and Ecological Speciation Analyses of Imperata (Poaceae: andropogoneae) in the Neotropics. Syst. Biodivers. 2021, 19, 526–543. [Google Scholar] [CrossRef]
  84. Bianconi, M.E.; Hackel, J.; Vorontsova, M.S.; Alberti, A.; Arthan, W.; Burke, S.V.; Duvall, M.R.; Kellogg, E.A.; Lavergne, S.; McKain, M.R.; et al. Continued Adaptation of C4 Photosynthesis after an Initial Burst of Changes in the Andropogoneae Grasses. Syst. Biol. 2020, 69, 445–461. [Google Scholar] [CrossRef] [PubMed]
  85. Larson, D.A.; Itgen, M.W.; Denton, R.D.; Hahn, M.W. Reconsidering Cytonuclear Discordance in the Genomic Age. Evolution 2026, 80, 1–14. [Google Scholar] [CrossRef] [PubMed]
  86. Wang, W.; Li, H.; Chen, Z. Analysis of Plastid and Nuclear DNA Data in Plant Phylogenetics—Evaluation and Improvement. Sci. China Life Sci. 2014, 57, 280–286. [Google Scholar] [CrossRef]
  87. Emiliani, G.; Fondi, M.; Fani, R.; Gribaldo, S. A Horizontal Gene Transfer at the Origin of Phenylpropanoid Metabolism: A Key Adaptation of Plants to Land. Biol. Direct 2009, 4, 7. [Google Scholar] [CrossRef] [PubMed]
  88. Zhang, C.; Guo, H.; Li, Z.; Yue, S. Evolution of Phenylalanine Ammonia-Lyase Protein Family from Algae to Angiosperm. Funct. Integr. Genom. 2025, 25, 40. [Google Scholar] [CrossRef]
  89. Song, S.; Jin, R.; Chen, Y.; He, S.; Li, K.; Tang, Q.; Wang, Q.; Wang, L.; Kong, M.; Dudareva, N.; et al. The Functional Evolution of Architecturally Different Plant Geranyl Diphosphate Synthases from Geranylgeranyl Diphosphate Synthase. Plant Cell 2023, 35, 2293–2315. [Google Scholar] [CrossRef]
  90. Liu, X.; Chen, W.; Li, L.; Mu, D.; Wilson, I.W.; Huang, X.; Xiang, Y.; Zhu, L.; Pan, L.; Qiu, D.; et al. Identification and Functional Characterization of a Geraniol Synthase UrGES from Uncaria rhynchophylla. Plants 2025, 14, 2273. [Google Scholar] [CrossRef]
  91. Ali, M.; Hussain, R.M.; Rehman, N.U.; She, G.; Li, P.; Wan, X.; Guo, L.; Zhao, J.; Nishimura, M. De Novo Transcriptome Sequencing and Metabolite Profiling Analyses Reveal the Complex Metabolic Genes Involved in the Terpenoid Biosynthesis in Blue Anise Sage (Salvia guaranitica L.). DNA Res. 2018, 25, 597–617. [Google Scholar] [CrossRef]
  92. Rastogi, S.; Meena, S.; Bhattacharya, A.; Ghosh, S.; Shukla, R.K.; Sangwan, N.S.; Lal, R.K.; Gupta, M.M.; Lavania, U.C.; Gupta, V.; et al. De Novo Sequencing and Comparative Analysis of Holy and Sweet Basil Transcriptomes. BMC Genom. 2014, 15, 588. [Google Scholar] [CrossRef]
  93. Bai, Y.; Wang, S.; Zhong, H.; Yang, Q.; Zhang, F.; Zhuang, Z.; Yuan, J.; Nie, X.; Wang, S. Integrative Analyses Reveal Transcriptome-Proteome Correlation in Biological Pathways and Secondary Metabolism Clusters in A. Flavus in Response to Temperature. Sci. Rep. 2015, 5, 14582. [Google Scholar] [CrossRef]
  94. Ye, Z.; Yu, J.; Yan, W.; Zhang, J.; Yang, D.; Yao, G.; Liu, Z.; Wu, Y.; Hou, X. Integrative ITRAQ-Based Proteomic and Transcriptomic Analysis Reveals the Accumulation Patterns of Key Metabolites Associated with Oil Quality during Seed Ripening of Camellia Oleifera. Hortic. Res. 2021, 8, 157. [Google Scholar] [CrossRef]
  95. Mani, V.; Park, S.; Kim, J.A.; Lee, S.I.; Lee, K. Metabolic Perturbation and Synthetic Biology Strategies for Plant Terpenoid Production—An Updated Overview. Plants 2021, 10, 2179. [Google Scholar] [CrossRef]
  96. Ahmad, N.; Qamar, M.; Yuan, Y.; Nazir, Y.; Wilairatana, P.; Mubarak, M.S. Dietary Polyphenols: Extraction, Identification, Bioavailability, and Role for Prevention and Treatment of Colorectal and Prostate Cancers. Molecules 2022, 27, 2831. [Google Scholar] [CrossRef]
  97. Elshafie, H.S.; Camele, I.; Mohamed, A.A. A Comprehensive Review on the Biological, Agricultural and Pharmaceutical Properties of Secondary Metabolites Based-Plant Origin. Int. J. Mol. Sci. 2023, 24, 3266. [Google Scholar] [CrossRef]
  98. Fukushima, Y.; Taguchi, C.; Kishimoto, Y.; Kondo, K. Japanese Carotenoid Database with α- and β-Carotene, β-Cryptoxanthin, Lutein, Zeaxanthin, Lycopene, and Fucoxanthin and Intake in Adult Women. Int. J. Vitam. Nutr. Res. 2023, 93, 42–53. [Google Scholar] [CrossRef] [PubMed]
  99. Tufail, T.; Bader Ul Ain, H.; Noreen, S.; Ikram, A.; Arshad, M.T.; Abdullahi, M.A. Nutritional Benefits of Lycopene and Beta-Carotene: A Comprehensive Overview. Food Sci. Nutr. 2024, 12, 8715–8741. [Google Scholar] [CrossRef] [PubMed]
  100. Mitra, S.; Rauf, A.; Tareq, A.M.; Jahan, S.; Bin Emran, T.; Shahriar, T.G.; Dhama, K.; Alhumaydhi, F.A.; Aljohani, A.S.M.; Rebezov, M.; et al. Potential Health Benefits of Carotenoid Lutein: An Updated Review. Food Chem. Toxicol. 2021, 154, 112328. [Google Scholar] [CrossRef]
  101. Simsek, M.; Whitney, K. Examination of Primary and Secondary Metabolites Associated with a Plant-Based Diet and Their Impact on Human Health. Foods 2024, 13, 1020. [Google Scholar] [CrossRef] [PubMed]
  102. Rolim, T.d.S.; Sampaio, A.L.F.; Mazzei, J.L.; Moreira, D.L.; Siani, A.C. Synthesis, Bioproduction and Bioactivity of Perillic Acid—A Review. Molecules 2025, 30, 528. [Google Scholar] [CrossRef]
  103. Biva, I.J.; Ndi, C.P.; Semple, S.J.; Griesser, H.J. Antibacterial Performance of Terpenoids from the Australian Plant Eremophila Lucida. Antibiotics 2019, 8, 63. [Google Scholar] [CrossRef]
  104. Liu, Q.; Bi, H.; Wang, K.; Zhang, Y.; Chen, B.; Zhang, H.; Wang, M.; Fang, Y. Revealing the Mechanisms of Enhanced β-Farnesene Production in Yarrowia Lipolytica through Metabolomics Analysis. Int. J. Mol. Sci. 2023, 24, 17366. [Google Scholar] [CrossRef]
  105. Tiwari, R.; Shukla, A.K. Plant Metabolites and Their Role in Health Benefits: A Brief Review. Adv. Pharm. J. 2020, 5, 47–53. [Google Scholar] [CrossRef]
  106. Embuscado, M.E. Spices and Herbs: Natural Sources of Antioxidants—A Mini Review. J. Funct. Foods 2015, 18, 811–819. [Google Scholar] [CrossRef]
  107. Broda, M. Natural Compounds for Wood Protection against Fungi—A Review. Molecules 2020, 25, 3538. [Google Scholar] [CrossRef]
  108. Zullkiflee, N.; Taha, H.; Usman, A. Propolis: Its Role and Efficacy in Human Health and Diseases. Molecules 2022, 27, 6120. [Google Scholar] [CrossRef] [PubMed]
  109. Pei, K.; Ou, J.; Huang, J.; Ou, S. P-Coumaric Acid and Its Conjugates: Dietary Sources, Pharmacokinetic Properties and Biological Activities. J. Sci. Food Agric. 2016, 96, 2952–2962. [Google Scholar] [CrossRef]
  110. Chen, C.; Xu, L.; Xia, W.; Qi, C.; Liu, J.; Hua, B.; Zhang, Z.; Qi, X.; Miao, M. Metabolomics and Transcription Profiling of Pumpkin Fruit Reveals Enhanced Bioactive Flavonoids and Coumarins in Giant Pumpkin (Cucurbita maxima). J. Agric. Food Chem. 2023, 71, 10459–10469. [Google Scholar] [CrossRef]
  111. Zou, Y.; Teng, Y.; Li, J.; Yan, Y. Recent Advances in the Biosynthesis of Coumarin and Its Derivatives. Green Chem. Eng. 2024, 5, 150–154. [Google Scholar] [CrossRef]
  112. Shi, M.-F.; Ma, X.-N.; Zou, F.-S.; Feng, W.; Xu, Q. In Silico and In Vitro Analysis of Coniferin Mediates Apoptosis by Intervening the PTGS2/Apoptosis Pathway to Alleviate Rheumatoid Arthritis. Curr. Pharm. Des. 2025, 31, 1619–1632. [Google Scholar] [CrossRef]
  113. Hämäläinen, M.; Nieminen, R.; Vuorela, P.; Heinonen, M.; Moilanen, E. Anti-Inflammatory Effects of Flavonoids: Genistein, Kaempferol, Quercetin, and Daidzein Inhibit STAT-1 and NF-kappaB Activations, Whereas Flavone, Isorhamnetin, Naringenin, and Pelargonidin Inhibit Only NF-B Activation along with Their Inhibitory Effect on INOS Expression and NO Production in Activated Macrophages. Mediat. Inflamm. 2007, 2007, 45673. [Google Scholar] [CrossRef]
  114. Zahid, S.; Malik, A.; Waqar, S.; Zahid, F.; Tariq, N.; Khawaja, A.I.; Safir, W.; Gulzar, F.; Iqbal, J.; Ali, Q. Countenance and Implication of Β-Sitosterol, Β-Amyrin and Epiafzelechin in Nickel Exposed Rat: In-Silico and in-Vivo Approach. Sci. Rep. 2023, 13, 21351. [Google Scholar] [CrossRef] [PubMed]
  115. Alam, M.; Abbas, K.; Iram, F.; Raza, M.T.; Mustafa, M.; Zehra, Z. Molecular Docking and Dynamics Studies of Withania Somnifera Derived Compounds as GABA-A Receptor Modulators for Insomnia. Chronobiol. Med. 2024, 6, 77–86. [Google Scholar] [CrossRef]
Figure 1. Distribution of differentially expressed transcripts (DETs*) between Cymbopogon flexuosus and Cymbopogon winterianus, grouped by Log2FC intervals and statistical significance (p-value). (A) C. flexuosus and (B) C. winterianus. 1. Percentages were calculated from the respective total values (7421 and 10,255 DETs). 2. Transcripts with positive Log2FC values indicate higher expression in C. flexuosus, whereas negative values reflect higher expression in C. winterianus. 3. Colors represent different magnitudes of differential expression (up- and down-regulated transcripts).
Agronomy 16 00999 g001
Figure 2. Phylogenetic tree generated by maximum likelihood inference with a bootstrap of 1000 replications and divergence time, using complete genome sequences of chloroplasts of the genus Cymbopogon and related grasses of the family Poaceae. The colors highlight the main subfamilies: Panicoideae (blue and green), Chloridoideae (black), Oryzoideae (dark red) and Pooideae (purple). The dicotyledonous species Arabidopsis thaliana was used as an outgroup. Divergence time shown in million years ago (Mya).
Agronomy 16 00999 g002
Figure 3. Regression between the sort index and MCL genetic distance for Cymbopogon flexuosus and related species from the Poaceae family.
Agronomy 16 00999 g003
Figure 4. Phylogenetic tree of secondary metabolism genes in Cymbopogon and related species. (A.1): Initial steps of the monoterpenoid metabolism pathway. (A.2): Metabolic pathway for the biosynthesis of secondary metabolites specific to Cymbopogon spp. (A.3): Metabolic pathway for the biosynthesis of general secondary metabolites in various aromatic plant species. (B) Phylogenetic tree based on homologous sequences from the Cymbopogon-specific secondary metabolism pathway (A.2). (C): Phylogenetic tree based on homologous sequences from the general secondary metabolism pathway (A.3).
Agronomy 16 00999 g004
Figure 5. Percentage of nr-transcripts and DETs from Cymbopogon flexuosus (cf) and Cymbopogon winterianus (cw) with identified homologies in the KEGG Orthology database, organized by functional category. cf total: nr-transcripts mapped against the C. flexuosus reference transcriptome. cf deg: differentially expressed genes mapped against the C. flexuosus reference transcriptome. cw total: nr-transcripts mapped against the C. winterianus reference transcriptome. cw deg: differentially expressed genes mapped against the C. winterianus reference transcriptome.
Agronomy 16 00999 g005
Figure 6. Integrated visualization of the main secondary metabolism pathways with expression differences between the metabolic composition of Cymbopogon flexuosus and Cymbopogon winterianus. The numbers 1 to 19 indicate metabolites or intermediates associated with differentially expressed genes (DETs), according to transcriptome data (positive Log2FC values indicate higher expression in C. flexuosus and negative values indicate higher expression in C. winterianus) detailed in Tables S8 and S9. The letters a–t indicate metabolites identified by metabolomic analysis, with presence and relative abundance in each species, as described in Table 4, Tables S7 and S10.
Agronomy 16 00999 g006
Table 1. Summary of the de novo transcriptome assembly for Cymbopogon flexuosus and Cymbopogon winterianus: total number of filtered reads, number of assembled transcripts, N50 values, average (bp), number of non-redundant transcripts, average (bp) of non-redundant transcripts and number of back-mapped transcripts.
SpeciesTotal *TrinityTrinityTrinityCAP3CAP3
Filtered
Reads
Total of TranscriptsN50 (bp) TranscriptsAverage (bp) TranscriptsTotal
nr-Transcripts
Average (bp)
nr-Transcripts
Back Mapped
C. flexuosus15.1325,83669152625,57652824,841
C. winterianus18.9542,96885859242,25059732,418
* Millions of paired-end reads after filtering.
Table 2. Summary of the total and percentage of homologies found for the nr-transcripts of Cymbopogon flexuosus and Cymbopogon winterianus and other species in the local protein bank.
SpeciesSubFamilyTribeC. flexuosusC. winterianus%%
Total nr-transcripts-mapped 24,84132,418
Total homology 18,28622,4580.7360.692
Andropogon gerardiiPanicoideaeAndropogoneae5044640527.5828.52
Saccharum sp.PanicoideaeAndropogoneae3482447119.0419.91
Bothriochloa decipiensPanicoideaeAndropogoneae2223259412.1611.55
Orghum bicolorPanicoideaeAndropogoneae1921231710.5110.32
Miscanthus lutarioripariusPanicoideaeAndropogoneae1834223810.039.97
Miscanthus sinensisPanicoideaeAndropogoneae145218357.948.17
Zea sp.PanicoideaeAndropogoneae9509645.204.29
Panicum sp.PanicoideaePaniceae5186072.832.70
Setaria sp.PanicoideaePaniceae2302081.260.93
Digitaria exilisPanicoideaePaniceae1071060.590.47
Oryza sp.OryzoideaeOryzeae781000.430.45
Dichanthelium oligosanthesPanicoideaePaniceae60640.330.28
Eleusine coracanaChloridoideaeCynodonteae47460.260.20
Triticum sp.PooideaeTriticeae30560.160.25
Aegilops tauschiiPooideaeTriticeae30260.160.12
Hordeum vulgarePooideaeTriticeae26270.140.12
Brachypodium sp.PooideaeBrachypodieae23300.130.13
Others 2314371.261.95
Table 3. Number of annotated transcripts (genes) per genome, number of transcripts that received read mapping, percentage of mapped reads and average read depth per transcript in related species.
Transcripts Mapped % Reads MappedGene Depth
SpeciePloidyn.
Transcripts
Cf%Cw%avg%CfCwavgCfCwavgIndex *
Cfdi25.624.30.9522.10.8723.20.910.780.680.73224.5216.2220.43.72
Cwdi42.322.20.5231.60.7526.90.640.730.740.74232.8164.1198.53.92
S. bicolordi29.619.10.6519.60.6619.40.650.710.690.70259.8246.8253.33.42
Z. maysdi39.023.60.6024.30.6224.00.610.680.670.68203.4194.6199.03.23
S. viridisdi25.220.10.8020.40.8120.30.800.580.590.58203.8201.4202.62.40
S. italicadi34.322.50.6623.20.6822.80.670.560.580.57176.5174.9175.72.29
P. hallidi32.520.50.6321.10.6520.80.640.540.550.55185.2184.8185.02.11
D. oligosanthesdi26.518.40.6919.00.7218.70.710.500.510.50189.5188.8189.21.78
O. sativadi41.825.20.6026.20.6325.70.610.410.430.42115.4116.2115.81.26
B. distachyondi25.818.40.7119.00.7318.70.720.360.380.37139.2141.8140.50.98
H. vulgaredi39.720.60.5221.70.5421.10.530.320.350.34110.3112.8111.60.79
A. gerardihexa29.219.20.6619.70.6819.40.670.750.720.73274.1257.9266.03.80
S. officinarumdeca27.918.40.6618.80.6718.60.670.620.630.62236.3234.1235.22.73
M. sinensistetra30.919.00.6119.50.6319.30.620.600.610.61224.0220.5222.22.60
M. lutarioripariustetra32.418.90.5819.40.6019.10.590.590.610.60221.6219.7220.72.53
P. virgatumtetra39.824.60.6225.20.6324.90.620.600.600.60170.7166.4168.52.50
B. decipienstetra28.019.60.7020.30.7320.00.710.530.550.54191.7190.3191.02.07
D. exilistetra30.020.30.6821.20.7120.70.690.480.490.48165.3162.0163.71.64
E. coracanatetra24.320.00.8220.50.8420.20.830.450.470.46160.2162.4161.31.51
T. aestivumhexa43.722.50.5223.90.5523.20.530.310.320.3297.294.595.80.70
A. thalianadi27.621.00.7621.80.7921.40.780.210.210.2169.068.969.00.31
* Index = [(avg number of transcripts mapped × avg % reads mapped) × avg transcript depth]/1000.
Table 4. Quantification of compounds identified in the metabolomic profiles of Cymbopogon flexuosus and Cymbopogon winterianus, along with their reported biological functions in the literature.
IDCompoundsCf (%)Cw (%)Cf (%) *Cw (%) *Related Functions **
aLinalool0.000.362.41.51, 2, 12
bLimonene2.932.502.4–3.73.213, 4, 6
cCamphene0.190.000.04 3, 5, 11
dCitronellal3.2031.940.4–827.4–36.21, 2, 3, 4, 6, 12
eCitronellol0.0010.670.4–4.67.3–15.92, 3, 4, 8, 12
fNeral (β-Citral)28.640.0030–351.321, 2, 3, 4, 5, 10, 12
gGeranial (α-Citral)46.290.6640–500.871, 2, 3, 4, 5, 12
hNerol0.2112.400.55–1.227.71, 3, 4, 5, 6, 12
iGeranyl acetate0.001.112–51.12, 4, 5
jCitronellyl acetate0.001.641.2–3.60.74, 6, 12
lcis-Verbenol8.220.002.4–15 2, 6, 12
Total86.7458.43
mβ-Caryophyllene2.010.000.0155 2, 5, 7, 11
sCaryophyllene oxide0.540.000.0040.14
nGermacrene D0.000.640.110.46, 9, 12
oHermacrene A0.001.350.2-1, 2, 4, 6, 9
qδ-Cadinene0.003.780.10.1–2.4 6, 12
pγ-Cadinene0.470.9710.3 2, 7
rα-Cadinol0.002.788.54.7 1, 2, 5, 7,
tβ-Elemene0.004.3813.8 1, 2, 5, 7, 12
Total3.0113.90
Total 289.7572.33
cf *and cw * = quantification values reported in the literature. Related functions: 1—antioxidant; 2—anti-inflammatory; 3—antibacterial; 4—antifungal; 5—anticancer properties; 6—repellent; 7—antimicrobial; 8—antibiotic; 9—larvicidal; 10—anti-trypanosomal; 11—medicinal use; 12—perfumes/cosmetics. ** Table S10 provides detailed information for all listed compounds.
Disclaimer/Publisher’s Note: The statements, opinions and data contained in all publications are solely those of the individual author(s) and contributor(s) and not of MDPI and/or the editor(s). MDPI and/or the editor(s) disclaim responsibility for any injury to people or property resulting from any ideas, methods, instructions or products referred to in the content.