Article

Characterization and Genetic Diversity of IIAM Doubled-Haploid Maize Inbred Lines for Agro-Morphological Traits

by
Kolawole Peter Oladiran
1,2,*,
Rogerio Marcos Chiulele
1,2,
Pedro Silvestre Chauque
3,*,
Pedro Fato
3,
Suwilanji Nanyangwe
1,2,
Constantino Francisco Lhamine
1,2,3 and
Mable Chebichii Kipkoech
1,2
1
Department of Crop Production, Eduardo Mondlane University, Maputo 1102, Mozambique
2
Centre of Excellence in Agri-Food Systems and Nutrition (CE-AFSN), Eduardo Mondlane University, Praca 25 de Junho Edificio da Reitoria 5° Andar, Maputo 1102, Mozambique
3
Agricultural Research Institute of Mozambique (IIAM), Maputo 1102, Mozambique
*
Authors to whom correspondence should be addressed.
Agronomy 2026, 16(10), 984; https://doi.org/10.3390/agronomy16100984
Submission received: 24 March 2026 / Revised: 22 April 2026 / Accepted: 23 April 2026 / Published: 15 May 2026
(This article belongs to the Special Issue Development and Utilization of Maize Germplasm Resources)

Abstract

Genetic diversity within maize inbred populations is essential for sustaining genetic gain in breeding programmes. This study evaluated 280 maize inbred lines with two checks using an augmented block design (22 × 14). At harvest, 271 lines and two checks were analysed, with nine entries excluded due to poor survival. Using both descriptive (24) and quantitative (19) traits, significant variations were observed across many traits. Descriptive traits varied among the genotypes, as revealed by graphical analysis and correlation heatmaps. The likelihood ratio test (LRT) for lines showed significant differences for several quantitative traits with moderate–high heritability, while anthesis–silking interval, tassel length, ear position, ear aspect, bad husk cover, number of plants, and number of ears per plant exhibited low heritability. High genetic advance as a percentage of the mean was observed for grain yield, plant height, grain texture, number of plants, number of kernels, and grain weight per plant. Positive associations were observed among genotypic coefficient of variation, genetic advance, and heritability. Grain yield showed significant positive correlations with yield-related traits and morphological traits, but negative correlations with flowering traits. The first 10 principal components explained 86.17% of total variation, with flowering traits contributing most to variability in PC 1. Cluster analysis grouped genotypes into 10 clusters, with substantial genetic divergence within and between cluster groups. In conclusion, the study revealed considerable genetic diversity, supporting the selection of superior parents in breeding programmes and developing improved maize varieties to enhance productivity.

1. Introduction

Maize (Zea mays L.) is a major staple crop worldwide, providing food, feed, and industrial raw materials [1,2,3,4]. In developing regions, particularly Sub-Saharan Africa, South America, and parts of Asia, the crop plays a central role in food security and rural livelihoods [5,6,7,8]. Its high yield potential and adaptability across diverse agro-ecological zones position it as a strategic crop for combating global hunger [7,9,10,11] in countries where this commodity is used as staple food and/or generates income. Nonetheless, maize yields are declining across SSA, unlike other regions globally [8,12,13]. This affects food security and farmers’ livelihood, especially in rural settlements where maize serves as the major source of calories. The observed yield reduction in SSA has been attributed to lower adoption of improved varieties and recycling of OPVs, which is a common practice among smallholder farmers, who dominate maize production in SSA [7,9,14,15], including Mozambique. Biotic stresses and production under rainfed systems, which are vulnerable to climate-related stresses, especially drought, cause huge yield losses [16,17,18].
Some studies in Mozambique have revealed that maize production is also experiencing decline due to limited availability of adapted improved varieties from local research [19,20,21]. As is known, the use of conventional methods usually encounters challenges arising from environmental variation over the years of pedigree line development through selfing [22,23,24], leading to a marked inbreeding depression (low vigour), delay in identifying superior parent lines and a decrease in the release of improved varieties. Doubled-haploid (DH) technology, on the other hand, facilitates and shortens this length of time, supporting early identification and selection of parent lines [25,26,27]. Globally, modern breeding tools, such as genomics-assisted breeding and high-throughput phenotyping, are being used to improve tropical maize breeding [15,16,28,29], but these tools are not yet fully implemented in Mozambique. This emphasizes the need for efficient breeding strategies that support the food security and livelihoods of both large- and small-scale farmers.
To address these challenges, effective selection of parental lines from the available germplasm is important. To facilitate this decision-making process in selecting breeding parents, it is necessary that the available germplasm be well characterized botanically, agronomically and genetically [23,30]. This is done through phenotypic and genotypic characterization, as well as the classification of the population into distinct groups. This enables identification and selection of suitable parent material according to their genetic potential for a specific objective in a breeding programme [24,31,32]. Understanding the genetic diversity and population structure of the initial germplasm enables breeders to make a precise selection and assign lines into different heterotic groups. This facilitates the integration of desirable genes from specific germplasm sources into newly developed populations or varieties [23,33]. Also, crossing of genetically distant parents maximizes heterosis (hybrid vigour) through the creation of improved progenies [24,30,33]. This has been widely utilized in the development of parent lines in maize.
In this study, agro-morphological characterization in combination with efficient statistical analyses served as the initial step in evaluating genetic diversity. This enables phenotypic classification, description, and relationship analysis among the germplasm for selection of parent lines with desirable traits in the hybridization programme [24,34,35,36]. Analysis of variance (ANOVA) or restricted maximum likelihood (REML) is used in estimating variance components like genotypic and phenotypic variance, heritability, coefficient of variation, genetic advance and genetic advance as a percentage of the mean for each trait measured in the population [24,30]. Correlation and principal component analysis shows the trait relationship with the use of cluster analysis in grouping the material according to trait relatedness [32,36,37]. The use of doubled-haploid (DH) technology to develop the population of interest with phenotypic characterization makes this research an important step in supporting the maize breeding programme in Mozambique. Therefore, this study was conducted to characterize the newly developed doubled-haploid maize lines generated by the IIAM maize breeding programme by: (i) assessing their genetic variability; (ii) identifying traits and assessing genetic variability among DH lines; identifying traits with high heritability; and (ii) grouping of the line into distinct heterotic clusters. This will facilitate effective use of the lines for parent selection and development of improved varieties.

2. Materials and Methods

2.1. Site Description

The experiment was conducted at the Agricultural Research Institute of Mozambique (Instituto de Investigação Agrária de Moçambique, IIAM), Chokwe Research Station, Gaza Province. The site is classified as Zone R3 (Arid Interior South) of Mozambique’s agro-ecological zones, located at 24°31′ S, 33°0″ E, and 40 m above sea level. The area experiences an annual rainfall of 400–600 mm and temperatures ranging from 10.9 to 30.7 °C, with loamy-clay soil characteristics. The trial was established between May and October 2025 during the winter season and was fully irrigated.

2.2. Study Germplasm

A total of 280 maize inbred lines comprising 275 recently developed doubled-haploid lines and 5 CIMMYT lines were characterized. The DH lines were developed from a diverse population originating from different maize breeding programmes including the International Institute of Tropical Agriculture (IITA), the International Maize and Wheat Improvement Center (CIMMYT) and the Agricultural Research Institute of Mozambique (IIAM). Crosses were made between IIAM lines and the elite lines from the CIMMYT and IITA. The resulting heterozygous population was sent to CIMMYT-KENYA for doubled-haploid line production. Evaluation of the lines was carried out along with 2 check inbred lines for genetic diversity based on agro-morphological traits as the initial evaluation of the germplasm. The two elite CIMMYT maize lines have several attributes, and they have been used as parents in 3-way cross hybrid varieties being commercialized in Mozambique. Notably, CML 537 (CZL0617) is low-N-tolerant, while CML 548 (CZL054) is drought-tolerant. The list and pedigree information of the lines can be found in the Supplementary Materials File S1 in an Excel sheets (Study Germplasm).

2.3. Experimental Design

The trial was established in May 2025 using an unreplicated augmented design as described by Burgueño et al. [38], Bänziger et al. [39] and Zystro et al. [40], following Federer [41] and Federer et al. [42] as the augmented experimental design for an unreplicated trial. The trial was laid out in 14 blocks by 22 entries in which each block has 20 inbred lines and 2 checks (replicated in all blocks). Standard agronomic practices were first carried out including land preparation (ploughing, harrowing, and levelling). Pre-emergence and selective herbicides were applied using Atrazine (Atrazine) at the rate of 5 L/ha and Metalachlor (Chloroacetanilide 960 g/L) at the rate of 1 L/ha to minimize early competition with weeds. Seeds were treated with Apron Star fungicide (200 g/kg Thiamethoxam Metalaxyl and 20 g/kg Difenoconazole) at 10 g per 4 kg of seeds to prevent downy mildew infection. Each line was planted in a row 4 m long, with 25 cm spacing between plants and 75 cm spacing between rows, to maintain 53,333 spots/ha. Two seeds were planted per spot and later thinned to one plant at the six-leaf stage.
Fertilizer applications were applied at the rate of 200 kg N/ha and 60 kg P2O5 using NPK 12:24:12 and urea (46%N). This rate was used to cater for phosphorus deficiency and the nitrogen requirement of the maize as reported in the soil testing result (will be provided upon request). Basal application was done at planting using NPK and topdressing with urea before the onset of flowering to meet additional nitrogen requirements. Evaluation was conducted under optimal conditions using irrigation as the main water source. Subsequent weeding was performed manually. Rodents were controlled using bait and rodenticides, and insect pests such as the fall armyworm were managed using Ampligo insecticide (100 g/L Chlorantraniliprole and 50 g/L Lambda-Cyhalothrin) and Chloroperifos (O, O-dimethyl O-(3,5,6-trichloro-2-pyridinyl)) phosphorothioate (480 g/L) at 1 L/ha. Birds and monkeys were deterred using labourers to ensure successful evaluation.

2.4. Data Collection

Data were recorded following standard maize measurement procedures and the use of CIMMYT maize descriptors [43] and UPOV guidelines [44], supported with a maize descriptor book [45]. Data collection encompassed both qualitative (descriptive) and quantitative traits, assessed through visual scoring and direct field measurements. For quantitative traits, observations were taken as the mean values of five representative plants per plot, while qualitative traits were recorded based on the predominant trait expression observed within each plot (genotype). The descriptions of traits evaluated can be found in Tables S1 and S2 of the Supplementary Materials.

2.5. Data Analysis

The descriptive data were summarized using distribution plots (bar charts), while relationships among traits were evaluated using a correlation heatmap. Quantitative data were analysed based on the mean values of 5 plants per entry. Variance components were estimated using linear mixed-effects models fitted by restricted maximum likelihood (REML), and genotypic values were predicted as best linear unbiased predictors (BLUPs) following [46,47] and implemented using the lme4 package [48], with significance testing for fixed effects supported by the lmerTest package [49] in R (version 4.5.2) software. In the model, block effects were treated as fixed, while genotype effects were considered random [35,50,51]. Genotypic (σ2g), environmental (σ2e), and phenotypic (σ2p) variances obtained from the REML models were used to compute genotypic and phenotypic coefficients of variation (GCV and PCV), broad-sense heritability, expected genetic advance and genetic advance as a percentage. Genotype significance difference for all traits was assessed using a likelihood ratio test (LRT) [52,53].
The BLUPs adjusted mean was used in the estimation of multivariate analyses, which include correlation analysis, principal component analysis and cluster analysis. The results are presented in tables and figures in the form of a correlation matrix. Heatmap visualization and frequency distribution of traits were generated using Hmisc [54] and ggplot2 [55]. Principal component analysis was performed using factoextra [56], while hierarchical cluster analysis (CA) was carried out using cluster [57], ape [58], and scales [59]. Mahalanobis’ D2 statistics were applied in CA space to classify and group the inbred lines based on key agro-morphological traits.
Linear mixed model:
γ i j = μ + β i + g j + ε i j
where:
Yij is the phenotypic response;
μ is the overall mean;
βi is the block effect;
gj is the entries;
εij is the error associated with the observations.
  • Genotypic variance ( δ 2 g ) was estimated with REML using the random effect of the genotype [51,60].
  • Environmental variance component δ 2 e = M S e .
  • Phenotypic variance:
σ 2 p = σ 2 g + σ 2 e
where:
σ 2 p = phenotypic variance for each trait of the genotype;
σ 2 g = genotypic variance for each trait of the genotype;
σ 2 e = environmental variance component.
Heritability
  • Broad-sense heritability (H2) is the ratio of genotypic variance (g2) to phenotypic variance (p2) as described by [24,30]:
H 2 = G e n o t y p i c   V a r i a n c e P h e n o t y p i c   V a r i a n c e × 100
Correlation coefficient
  • Genotypic and phenotypic correlation coefficients were estimated to determine the nature and magnitude of associations between grain yield and other agro-morphological traits as described by [30] and implemented by [61]:
r p = C o v p   x · y σ 2 p x · σ 2 p y
r g = C o v g   x · y σ 2 g x · σ 2 g y
where:
  • r p and r g are the phenotypic and genotypic correlation coefficients, respectively;
  • C o v p ( x , y ) and C o v g ( x , y ) are the phenotypic and genotypic covariances between variables x and y , respectively;
  • σ p x 2 and σ g x 2 represent the phenotypic and genotypic variances of variable x ;
  • σ p y 2 and σ g y 2 denote the phenotypic and genotypic variances of variable y , respectively.
  • Genotypic and Phenotypic Coefficient of Variability (GCV and PCV)
GCV and PCV expressed as percentages were calculated according to the method proposed by [62]. These values were then categorized into three classes: less than 10% (low), 10–20% (moderate), and more than 20% (high).
PCV = P h e n o t y p i c   v a r i a n c e M e a n × 100
GCV = G e n o t y p i c   V a r i a n c e M e a n × 100
Expected genetic advance (EGA) was estimated under a selection intensity k computed using the formula:
EGA = k × σ p × H b 2
where:
EGA = expected genetic advance under selection;
σ p = phenotypic standard deviation ( σ 2 p );
H b 2 = broad-sense heritability;
k = selection intensity (2.06 at 5% selection intensity).
The genetic advance as a percentage of the mean (GAM) was calculated and categorized according to the method outlined by [63] using the following formula:
G A M = E G A m e a n × 100

3. Results

3.1. Analysis of Variance for 19 Agro-Morphological Traits of 273 Maize Inbred Lines

The evaluation of maize lines consisting of 271 entries (out of 280) along with two checks revealed substantial variation among genotypes and blocks for several traits (Table 1). Using the likelihood ratio test (LRT), the comparison within the population of the maize lines showed significant differences for almost all the traits (p < 0.05 to p < 0.001), except ASI, ES, EA and NEP (with absolute unity), indicating similar performance among the lines for these four traits. Traits with a very high significant difference and mean include Y (2.89), AD (77.93), SD (78.89), PH (148.75), TL (32.93), EP (0.43), GT (1.77), NP (13.71) EL (13.29), NR (13.73) and GWPP (72.01), while others fall within the high significant and significant level of probability. Block MS showed significant difference (p < 0.05 to p < 0.001) effects for Y, PH, TL, EP, ES, BH, LOG, NP, NEP, ED NR, NK and GWPP, indicating the influence of field heterogeneity associated with the large experimental size without replication. There was no significant difference across blocks for AD, SD, ASI, EA and GT.

3.2. Broad-Sense Heritability, Expected Genetic Advance (EGA), Genetic Advance as a Percentage of the Mean (GAM) and Coefficient of Variation (CV)

The variance component estimates indicate that genotypic variance (σ2g) was higher than environmental variance (σ2e) for Y, AD, SD, PH, GT, LOG, ED, NR, NK and GWPP, resulting in high heritability. Moderate heritability was observed with EL and NP, while the remaining traits exhibited low heritability. The highest value was observed in AD (H2 = 0.84), while NEP has a value of 0 for H2. Traits with low heritability indicate stronger environmental influence rather than genotypic differences among the germplasm evaluated, which suggested that selection of these traits based on phenotypic performance would result in very low efficiency. The expected genetic advance (EGA) and genetic advance as a percentage of the mean (GAM), shown in Table 1, also varied considerably among the traits, indicating differences in the relative contribution of genotypic and environmental variances to phenotypic expression. For most traits, the difference between GCV and PCV was minimal, except for ASI, EP, ES and NEP. Low EGA was observed in traits with large difference between GCV and PCV. High EGA observed in traits where GCV was very close to PCV suggests minimal environmental influence (variance). High GAM (>20%) was observed in Y, PH, GT, BH, LOG, NP, NK and GWPP, while moderate GAM (10–20%) was observed in AD, ASI, EP, TL EA, ED, EL, NK and NR; the remaining traits showed low GAM (<10%), with NEP recording zero. The estimation of CV (%) showed a low percentage (<10%) for AD, SD, PH, ED and NR; moderate CV (10–20%) for TL, EP, ES, EL and NK; and high CV (>20%) for the remaining traits. A positive association among H2 (broad), GCV, and GAM indicates that higher heritability was largely driven by greater genotypic variance relative to environmental variance, thereby enhancing selection efficiency for genetic improvement.

3.3. Descriptive Trait Analysis

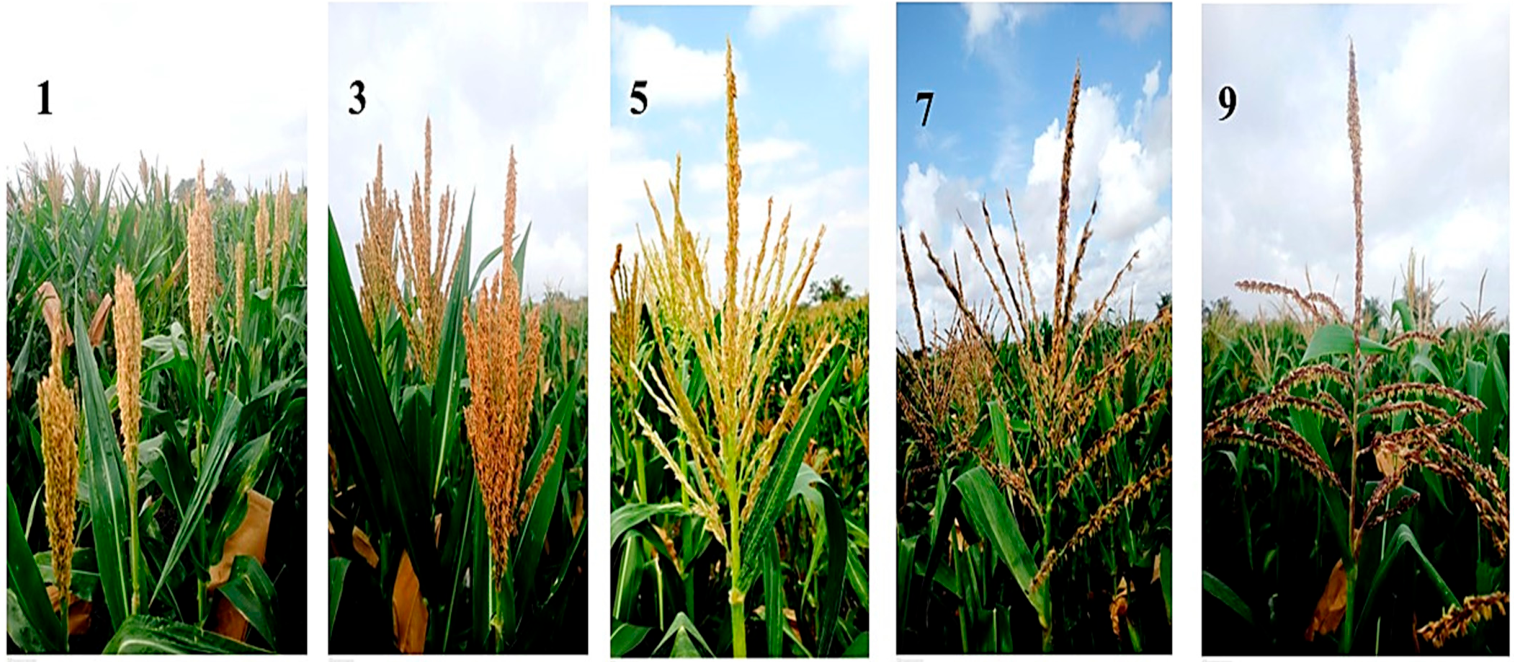
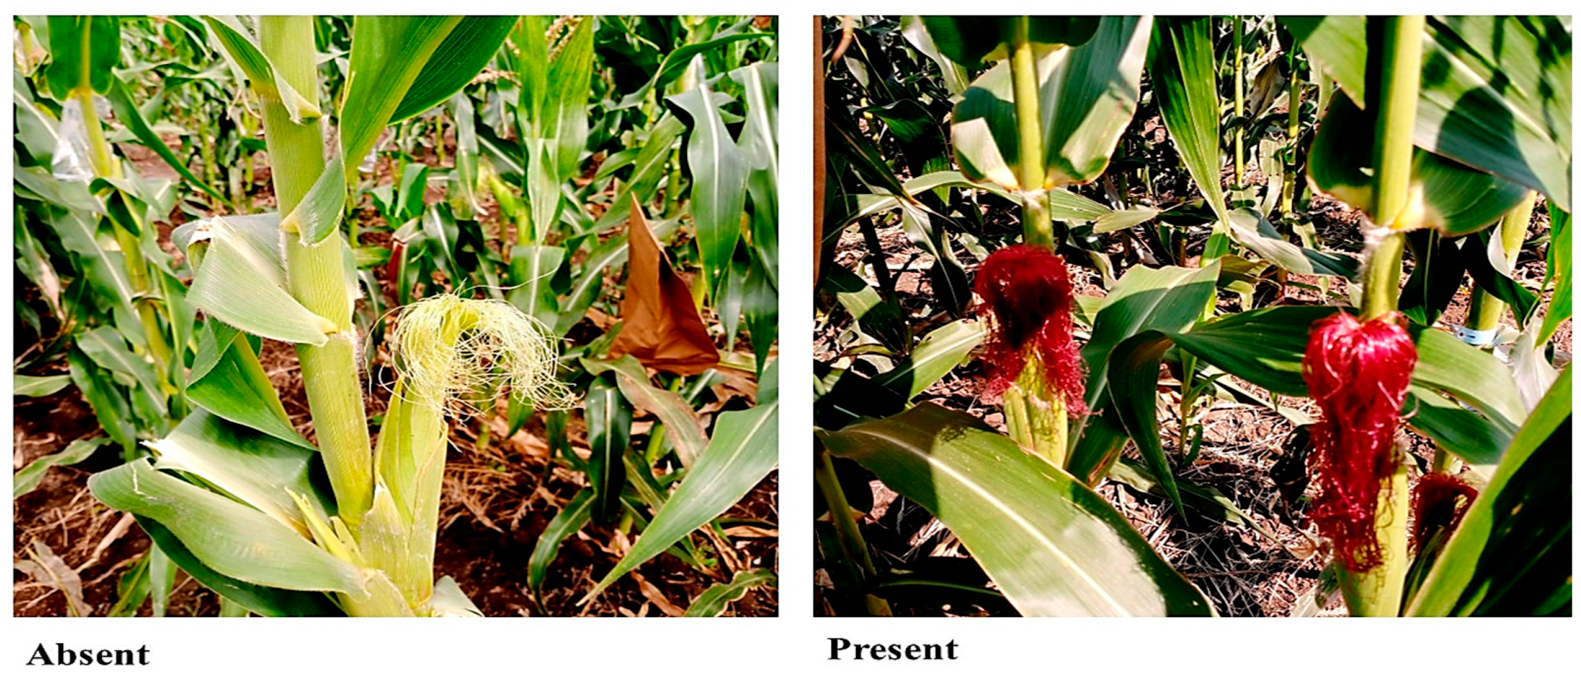
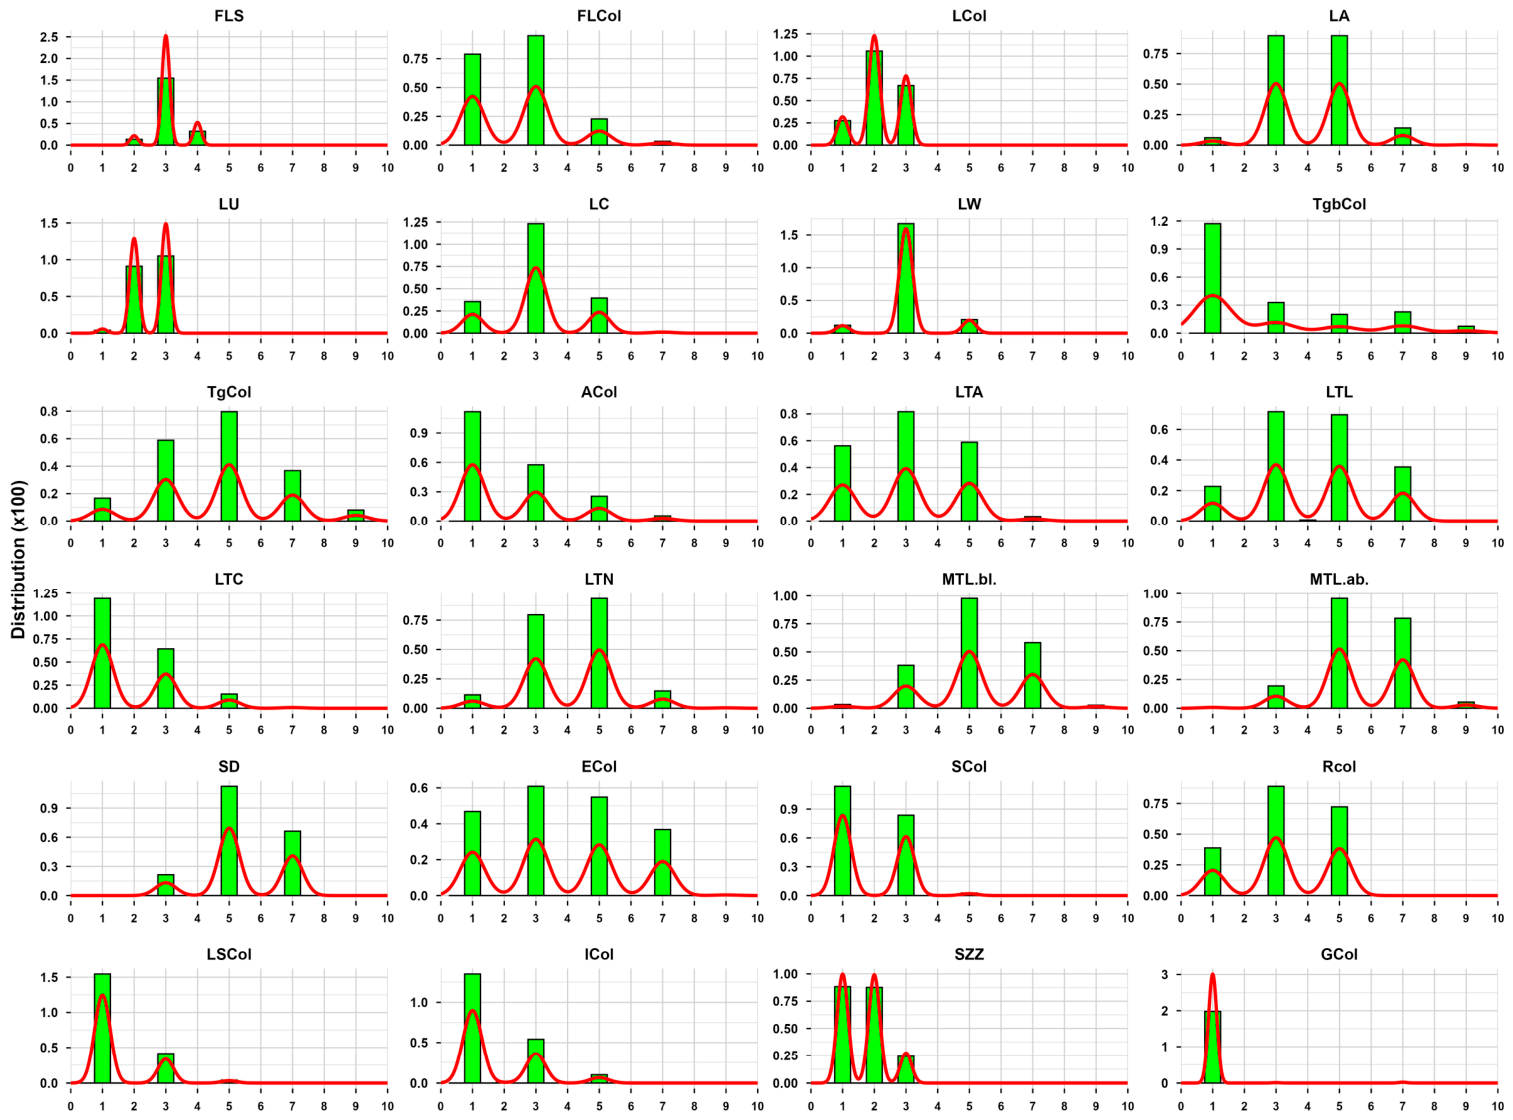
The qualitative traits showed wide variation among the genotypes, indicating that specific traits can be exploited in breeding programmes. As shown in Figure 1, which presents the trait distribution among the population (along with the density curve in red), many of the traits exhibited normal distribution patterns, confirming the presence of substantial genetic variability among the genotypes. Notable variation was observed in the presence and intensity of anthocyanin coloration, which occurred in different parts of the plant. Anthocyanin pigmentation was present in some genotypes from emergence, while it was absent in others, and its intensity varied considerably among pigmented genotypes. Variation was also observed in the shape of the first leaf across entries. At the vegetative stage, leaf characteristics differed widely, including the intensity of green foliage colour, the angle between the leaf and stem (ranging from very close to very wide), leaf curvature (from erect to strongly curved), and the degree of waviness along the leaf blade (straight to strongly waved). Other vegetative traits, including stem, internode, leaf sheath, and brace roots, also varied in presence and intensity of anthocyanin coloration. Reproductive traits showed similar variability as differences were observed in anthesis and silk colour traits including the whole glume, glume base, anther, and silk. Tassel characteristics such as angle, degree of curvature, length, number of branches, and spike density varied extensively among genotypes. At harvest, grain glumes exhibited varying degrees of anthocyanin pigmentation. Figure 2 and Figure 3 are pictorial representations of the observed variation and more can be found in the Supplementary Materials (Figures S2–S5).
The correlation heatmap (Figure S1 in Supplementary Materials) for the descriptive traits illustrated the relationships among variations observed in different plant parts. Traits associated with anthocyanin coloration showed generally positive correlations with one another, except for some with negative relationships. FLCol was positive with other colour-related traits except LCol. Tassel and ear colour were found to be positive with all other colour-related traits. Positive correlations were observed among LA, LU, and LC, while leaf width (LW) showed negative associations with LA and LC. This may reflect the tendency for wider leaves to have a wider angle to the stem and a stronger terminal curvature. The degree of stem zigzag (SZZ) was positively associated with leaf angle (LA), possibly reflecting contrasting growth directions between the stem and leaf during development. The variations observed among these traits revealed the associated between them.

3.4. Correlation Analysis

The phenotypic correlation (rp) analysis further revealed wide variation in the relationships among 18 agro-morphological traits, ranging from strong positive to weak and negative correlations, as illustrated by the correlation matrix (Table S3 of the Supplementary Materials). Due to no significant genotype variance for NEP among the genotypes, it was excluded while estimating the correlation among the traits and in subsequent analyses. Grain yield (Y) was significantly (p < 0.05 and p < 0.001) correlated (positive or negative coefficients) with 13 other traits and not significantly correlated (p > 0.05) with LOG, BH, ES and NR. Positive correlations with grain yield were achieved with PH, TL, EP, NP and key yield-related traits including GT, ED, EL, NK and GWPP. In contrast, AD, SD, ASI, and EA showed negative correlations with Y. Strong positive correlations were observed between AD and SD, as well as a significant positive association with EP and a negative association with GT, NP, and NK, while the other traits were not significantly correlated with AD and SD. ASI was found to be positively correlated with SD and negatively correlated with Y, NP, and NK, while no significant relationship was observed with the other traits. Ear traits, such as ED and EL, showed strong positive relationships with NK and GWPP. NR was positively correlated with ED and GWPP but not significant with EL and NK. The observed interactions among traits indicate that they jointly influence the performance of the materials and reflect the level of genetic variability present within the tested population.

3.5. Principal Components Analysis (PCA)

Principal component analysis resulted in 18 PCs, of which the first 10 PCs with eigenvalues = 0.71 explained 86.17% of the total phenotypic variation among the genotypes, as shown in Table 2. PC1 accounted for the highest variation (25.34%, eigenvalue = 4.56) and was mainly associated with phenological traits AD, SD, and ASI, together with plant architecture traits EA and ES, while yield and yield-component traits showed negative loadings. PC2 explained 12.28% of the variation (eigenvalue = 2.21) and was dominated by yield assessment traits (BH and EA), grain characteristics (GT and ES) and morphological traits TL, LOG and NP. GT, BH and NP were found to contribute more in PC2, while weak and negative contributions was recorded in AD and SD. PC3 accounted for 9.67% of the variation (eigenvalue = 1.74) and was influenced mainly by yield-related traits such as GT, ED, NR and GWPP with TL, while Y, PH, EP, EA, ES, BH, LOG, NP, and NK contributed negatively. Similarly, PC4 explained 7.94% of the variation (eigenvalue = 1.43); it showed negative loadings for phenological traits (AD and SD), as well as yield components and ear traits, including Y, TL, EA, GT, ES, NEP, EL and GWPP, but a positive contribution from ASI, PH, EP, LOG, NP, ED and NR. PC5 accounted for 6.46% of the variation (eigenvalue = 1.16), and positive contributions were recorded with Y, ES, NK and GWPP, while the remaining traits contributed negatively to PC5. PC6 explained 6.13% of the variation (eigenvalue = 1.1) and reflected positive contributions from SD, PH, TL, LOG, NP and the highest from ASI, while the other traits have 0 to negative contribution. PC7 accounted for 5.22% of the variation (eigenvalue = 0.94) and was influenced by phenological (AD and SD), architectural (TL and LOG) and ear traits (GT and NK). PC8 explained 4.78% of the variation (eigenvalue = 0.86) and was dominated by negative loadings, with positive contributions only from yield and grain traits Y, AD, SD, TL, EP, NP and the highest contribution from GT. PC9 with 4.43% and 0.80 eigenvalue was positive with Y, AD, SD, ASI, TL, BH, LOG, NP, NR and NK, with very weak negative contribution from GT and others. PC10 accounted for 3.94% of the total variation with an eigenvalue of 0.71 and has negative contributions across many traits except TL, PH, EP, ES, EL and NR. The variability observed in the relative contribution of each trait across the PCs explains different effects of each in the overall phenotypic performance of the population studied. The complete PCA table is included in the Supplementary Material (Table S4).

3.6. PCA Biplots (Traits and Genotypes)

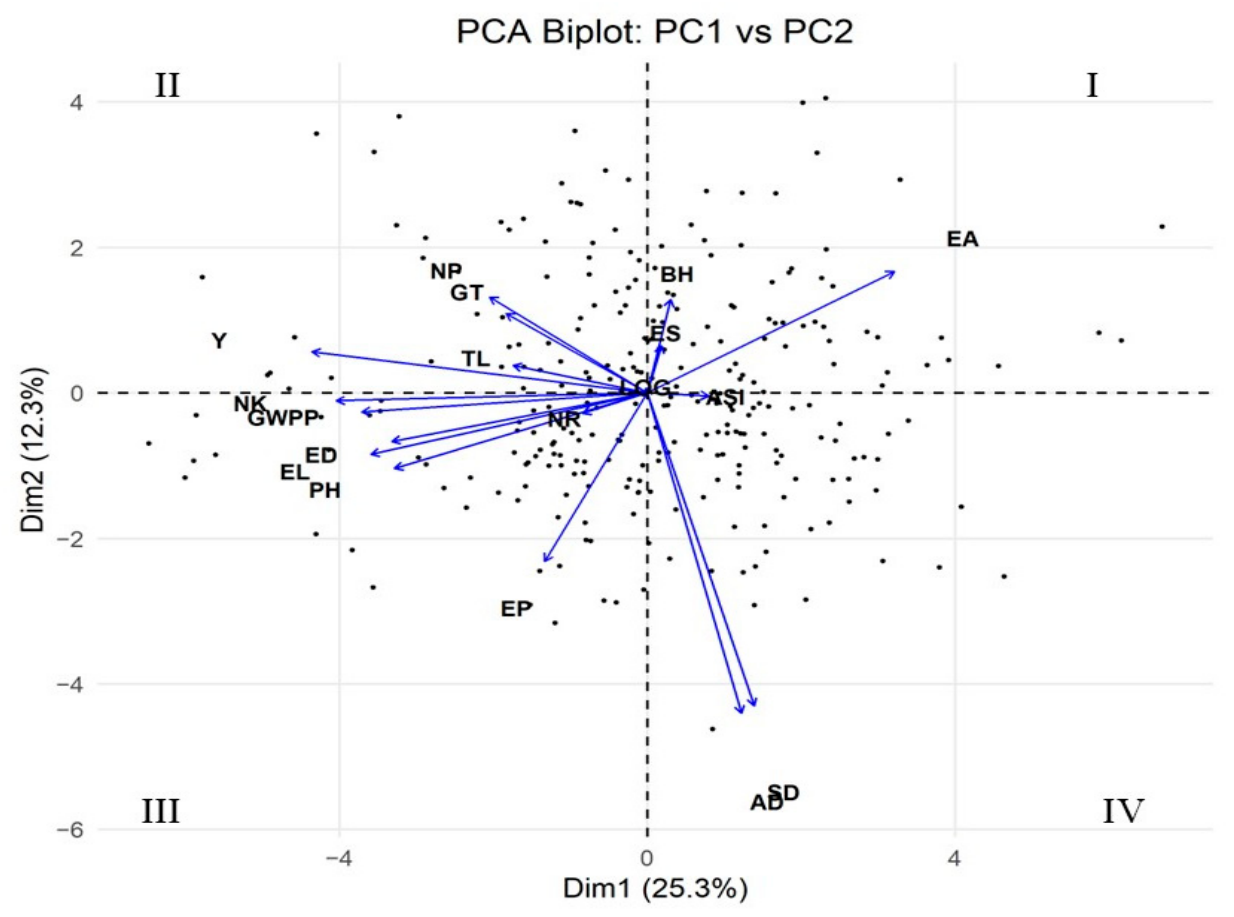
The trait distribution (Figure 4) and genotype distribution (Figure S6 in Supplementary Materials) in PC1 and PC2 are presented using biplots. The distribution of traits across the four quadrants explains their differential contribution to the overall phenotypic variation among the genotypes. The first two principal components, PC1 and PC2, together explained 37.6% of the total variation, with PC1 accounting for 25.3% and PC2 for 12.3%. Traits were grouped into different quadrants based on their relatedness. Days to anthesis (AD) and days to silking (SD) were positioned in the fourth quadrant, while grain yield (Y) and most yield-related traits were clustered mainly in the second and third quadrants. Traits such as ASI, BH, EA, ES, and LOG were grouped in the first quadrant. This pattern of trait distribution was reflected in the spread of the genotypes shown in the genotype PCA biplot (Figure S4, Supplementary Material), where the materials were distributed according to similarities in their trait expression and performance. The biplot further revealed positive associations among phenological traits, plant architectural traits (PH and EP), yield and yield-related traits (ED, GWPP, NK, and NR), and plant and ear assessment traits (BH, EA, ES, and LOG), as indicated by the close alignment of their vectors within the same quadrants.

3.7. Cluster Analysis

Hierarchical cluster analysis was conducted to group the genotypes based on the 18 agro-morphological traits. Ward’s minimum variance method (Ward.D2), applied to principal components explaining at least 85% of the cumulative variance, was used to compute Euclidean distances among genotypes. Using a hierarchical circular cluster dendrogram (Figure S7 in Supplementary Material), the genotypes were initially grouped into four major clusters, which were further resolved into ten sub-clusters. The number of genotypes per cluster varied considerably, reflecting differences in the traits governing each cluster, as presented in Table 3 (with top five trait means) and complete cluster mean table in the annex. The Mahalanobis distance matrices were also presented in Table 3 and Table 4, which described the genetic divergence within (homogenous) and between (heterogenous) clusters. Cluster 3 contains the highest number of genotypes (68) with an intra-cluster D2 of 10.19 and was found to be characterized with phenological and plant structural traits. Clusters 5 and 9 had 19 and 18 genotypes, respectively, and were characterized with yield and its associated traits, giving an insight into high-yielding clusters. Cluster 4 had the smallest number of genotypes (6) with ASI with plant and ear description traits and had an intra-cluster distance of 11.24, while Cluster 3 had the highest number of genotypes (68) and had an intra-cluster distance of 10.19. The highest intra-genetic distance was observed in Cluster 2 (12.87) with 39 genotypes, while Cluster 1 (8.87) had the lowest intra-genetic distance with 44 genotypes. The inter-cluster/genetic distance explains the genetic divergence across pairs of clusters. The widest genetic distance was observed between Clusters 4 and 10 (23.75) while the smallest genetic distance was observed between Clusters 1 and 3 (3.64). Notably, Cluster 4 showed a wide genetic distance across many clusters, unlike other clusters in pairs. The genotype members for all clusters will be provided upon request.

4. Discussion

4.1. Inbred Performance and Genetic Variability

The present study shows a diverse population with genetic and breeding potential that can be exploited for maize improvement through selection. The tested materials exhibited wide variability beginning from plant survivability (from 282 to 273 entries at harvest) as a result of low survivability of some entries. Also, during the investigation, field observations revealed considerable variations among the lines in terms of differences in vigour, stunted growth and weak stands. This variation reflects the ability of plants to compete for resources, survive, and reproduce, which indicates the presence of survival mechanisms that support persistence under sub-optimal or stressful conditions [22,34,64,65]. Significant differences reported with the likelihood ratio test (LRT) observed in grain yield, yield-related traits, phenological traits, and several morphological characteristics highlight the presence of substantial genetic variation for yield improvement. This is consistent with the conclusions of [66,67,68], who suggested that significant differences among genotypes for multiple agro-morphological traits are beneficial for parent selection and exploitation of the genetic divergence. The variability observed in this study is more of genotypic variance rather than environmental variance, as evidenced by high broad-sense heritability (H2). Predominance of genetic variance is advantageous for crop improvement, as it enhances the reliability of phenotypic selection and increases the likelihood of transmitting desirable traits to subsequent generations [24,34,69].
Furthermore, the estimates of expected genetic advance (GA) and genetic advance as a percentage of the mean (GAM) provided additional insight into the effectiveness of selection for different traits [63]. Traits exhibiting high heritability in combination with high GAM, such as Y, PH, NP, NK and GWPP in this study, have a predominance of additive genetic effects and indicate strong potential for their improvement through selection. Similar findings were reported by [70,71,72]. Moderate GAM values observed for some phenological and ear-related traits indicate an intermediate response to selection, while low or zero GAM values recorded for certain traits reflect greater environmental influence and limited chance for improvement through direct phenotypic selection. References [71,73,74] agreed that traits with high heritability and high GAM, particularly yield-related traits, can be considered indirectly for improving yield potential during selection.
The coefficient of variation (CV) reveals the design precision level and environmental influence in the result. In this study, CV values were found to be high for grain yield and some other traits but are similar to those reported by [35,75]. However, they differ from the findings of [71,72,75,76], where grain yield exhibited low-to-moderate CV values. High environmental effects may have contributed to the observed variation due to no replication [35,77,78,79]. Therefore, the collective consideration of other variance components such as heritability and genetic advance can help to mitigate this limitation [23,24,69]. The positive association among heritability, genetic variability, and genetic advance underscores the effectiveness of selection for traits largely governed by genetic factors and confirms the usefulness of the evaluated DH lines for maize breeding programmes.

4.2. Descriptive Trait Utilization in Breeding

The distribution of the descriptive traits indicates substantial variation within the evaluated population. Although many of these traits are qualitative and controlled by a few genes [23,24,30], their importance in maize breeding cannot be disregarded. Certain qualitative traits have been identified as useful in selecting for drought tolerance and yield performance [39,80], while resistance to some diseases has been reported to be controlled by a single resistant (R) gene conferring full resistance [81]. Morphological characteristics of the leaf, including angle, curvature, and waviness, influence plant architecture and enhance effective plant spacing and canopy cover. Proper canopy cover is beneficial in reducing soil evaporation and maintaining a cooler root zone, which enhances plant performance [82,83,84]. Likewise, tassel morphology is a quantitative trait controlled by multiple genes [85,86]; the traits such as tassel angle, length, branch number, and spike density are important in determining pollen production and dispersal efficiency [87,88]. These features highlight the importance of descriptive traits in genetic diversity and breeding decisions. All descriptive data generated in this study will be documented and archived at the Agricultural Research Institute of Mozambique (IIAM) for future reference and breeding use.

4.3. Trait Correlation

The understanding of correlation among traits is a foundation for effective selection of genotypes with collection of desirable characteristics. As previously discussed, selection of traits with high heritability influenced by high genotypic variance enhances rapid development of improved varieties. The present study revealed positive associations between grain yield and several yield-related and morphological traits, while negative associations were observed with phenological and yield-limiting traits. This agrees with previous studies reporting both positive and negative correlations between yield and agro-morphological traits [89,90,91,92]. The negative relationship between grain yield and phenological traits such as AD, SD and ASI indicates that early-flowering genotypes with shorter anthesis–silking intervals produce higher grain yield compared to late-flowering genotypes with extended ASI in this study. Similar to the result of [93,94,95], short ASI enhances reproductive synchrony, improves fertilization efficiency, and early-flowering reduces exposure to physiological stress. Although some studies [89,96,97] have suggested that early maturity may be associated with lower yield potential due to reduced duration for biomass accumulation, the results being reported here contradicted that, since correlation coefficients between grain yield and flowering time were significantly negative, suggesting that earliness traits confer adaptive advantages. This genetic potential can be exploited by developing high-yielding and early-maturing varieties, particularly under drought stress and limited moisture conditions. Several researchers have emphasized earliness as an effective drought effect mitigation strategy in maize improvement programmes [98,99,100,101,102]. For Mozambique, where the majority of the smallholder farmers practise rainfed agriculture [20,21,103,104], early-maturing varieties could help reduce yield losses and minimize production risks associated with recurrent late-season droughts and other climate change effects.

4.4. Principal Components Analysis (PCA) and Cluster Analysis (CA)

The contribution of traits to the total diversity among the population assessed with PCA and cluster analysis confirmed variable influence of each trait on the overall variance. This discriminated the population into different clusters in relation to their trait expression. The first 10 PCs with an eigenvalue of 0.83 and 84.88% cumulative variance presented in the result captured more than average genetic variance existing within the population. PC1 with the highest cumulative variance was found to be dominated by phenological traits. This explains their major influence in the classification of the studied population for maturity period, while other PCs varied with trait contributions confirming wider genetic variability resulting among the population [32,89,105]. The PCA biplots (genotypes and traits) present the distribution pattern of the traits and the associated genotypes. This approach enhances effective placement of genotypes along with their major traits. The observed grouping pattern seen in phenological traits (AD and SD) pointed in the same direction: yield and its associated trait clustered together, while ASI, LOG and other yield-limiting traits grouped together, which explains the interaction and relationship between the traits and their influence on genotype performance. The opposite orientation observed between yield and its associated trait clustering together away from yield-limiting traits suggests a negative relationship between the groups. Similar reports were seen in [74,89,106,107], where trait association enhanced and influenced the genotype distribution. Through this, classification of genotypes can be visualized and determined for further analysis.
Cluster analysis is an important tool in classifying genotypes into distinct groups based on their genetic divergence and trait performance. This explains that each cluster is governed by a combination of traits that relate the members (genotypes) of the cluster together. The Mahalanobis D2 distance further explains the divergence within a cluster (intra-distance) and between a pair of clusters (inter-distance). Using this, heterosis and accumulation of desirable traits can be achieved when selecting parent lines from different clusters for hybridization. A wider genetic distance is an indication of possible high heterosis, reflecting existence of wide genetic variability within or between clusters [23,32]. Clusters with high mean values for yield-enhancing traits such as ear characteristics and plant vigour are suitable genotypes for selection of female or male parents. In contrast, clusters with undesirable or yield-limiting traits, such as bad husk cover, high ear aspect or lodging scores, should be avoided when breeding for stress-prone environments. For example, Cluster 10 with the highest mean value for lodging (LOG) may not be considered for selection when developing a variety in an area prone to strong wind and loose soil. Likewise, a cluster with the lowest means for the ear assessment trait will be preferable in order to enhance the yield potential of the hybrids.
In addition, the level of genetic divergence between and within cluster groups will help in determining the best mating design for combining ability of the lines. Crosses between genetically distant clusters are recommended to maximize heterosis, while similar genotypes can result in inbreeding depression [23,24,30]. For example, Cluster 1 with narrow genetic distance will not be suitable for diallel crosses, while Clusters 5 and 9 can be exploited individually for diallel crosses owing to their broad genetic distance and presence of yield-enhancing traits [69,108]. A broad inter-cluster distance is an important factor to be considered when Line by Tester or North Carolina mating design is preferred. This enables introgression of traits into progenies from parent lines with different genetic potential [109,110,111]. This information will assist in the identification and selection of parent lines for the development of high-yielding varieties.

5. Conclusions

In conclusion, the present study revealed substantial genetic diversity in a maize population composed of DH lines developed by the IIAM maize breeding programme. Given the heterogeneity of production environments and requirements of different materials, the observed genetic diversity in this study confirms the allele richness and exploitable genetic potential present in the maize lines. It is evident that the germplasm is very diverse and can be used in the development of improved varieties through effective parent selection. Although inbred lines are generally characterized by lower yield due to inbreeding depression, the application of doubled-haploid technology accelerates homozygosity and reduces the prolonged selfing process associated with conventional inbred line development. Also, the relatively high grain yield observed in some DH lines indicates their potential suitability as parent lines for single-cross hybrid development, which is more efficient and high-yielding compared to two- or three-way crosses. The availability of stable and productive parental lines using DH technology will also facilitate adequate production of foundation seed for companies who engage in commercial seed multiplication.
Furthermore, the negative relationship observed between grain yield and phenological traits such as days to anthesis, days to silking, and anthesis–silking interval presents an opportunity of developing early-maturing and high-yielding varieties capable of escaping terminal drought stress associated with erratic rainfall patterns in Mozambique. This will mitigate production losses for small-scale farmers who practise maize production under rainfed conditions with climate variability. This will support food security and enhance their livelihoods.

Supplementary Materials

The following supporting information can be downloaded at: https://www.mdpi.com/article/10.3390/agronomy16100984/s1, Figure S1: Qualitative traits correlation heatmap, Figure S2: Leaf colour (greenness), Figure S3: Leaf angle, Figure S4: Leaf undulation, Figure S5: Tassel number, Figure S6: PCA 1- PCA 2 genotype biplot, Figure S7: Hierarchical Circular Cluster Dendogram; Table S1: Descriptive (Qualitative traits), Table S2: Quantitative traits, Table S3: Traits Correlation Matrix, Table S4: Principal Component Analysis (PCA) of 18 Quantitative traits, File S1: Study Germplasm.

Author Contributions

Conceptualization, K.P.O., P.S.C. and R.M.C.; methodology, P.S.C., P.F. and K.P.O.; project administration, P.S.C., R.M.C. and P.F.; resources, P.S.C. and P.F.; investigation, K.P.O., C.F.L., S.N. and M.C.K.; data curation, K.P.O., S.N., C.F.L. and M.C.K.; formal analysis, K.P.O., P.S.C. and S.N.; supervision, P.S.C., R.M.C. and P.F.; validation, K.P.O., P.S.C., P.F., S.N., C.F.L. and M.C.K.; visualization, K.P.O., P.S.C., S.N., C.F.L. and M.C.K.; writing—original draft, K.P.O. and P.S.C.; writing—review and editing, K.P.O., P.S.C. and R.M.C.; funding acquisition, R.M.C. All authors have read and agreed to the published version of the manuscript.

Funding

This research was funded by the Centre of Excellence in Agri-Food Systems and Nutrition, Eduardo Mondlane University, Maputo, Mozambique (grant number E089-MZ), with financial support from the World Bank under the African Centers of Excellence Project Phase II (ACE-II). This work is a part of a scholarship opportunity awarded to Kolawole Peter Oladiran which covers tuition fees, living expenses, research activities, and academic supervision support.

Data Availability Statement

All data supporting this review are included in this article and its supplementary files. Any additional information related to this study will be provided by the corresponding authors upon request.

Acknowledgments

Firstly, we acknowledge God for the success of this research. The authors appreciate the Agricultural Research Institute of Mozambique (IIAM) and the maize breeding team at Umbeluzi and Chokwe Research Station for their support during the research. Also, we thank the director and the supporting crew of the Centre of Excellence in Agri-Food Systems and Nutrition (CE-AFSN) for their timely financial support throughout the research. A GenAI tool (ChatGPT 5.2 OpenAI) was used during the manuscript preparation to improve the English grammar and to enhance comprehension. R studio open software was used in analysing the data and a photo editor was used in collaging the pictures taken directly from the field. All these tools are acknowledged for their supportive usage. The authors further acknowledge the Faculty of Agronomy and Forestry Engineering, Eduardo Mondlane University, for its continuous academic support.

Conflicts of Interest

The authors declare that there are no conflicts of interest regarding the publication of this review.

References

  1. Santpoort, R. THE drivers of maize area expansion in sub-Saharan Africa. How policies to boost maize production overlook the interests of smallholder farmers. Land 2020, 9, 68. [Google Scholar] [CrossRef] [Scilit]
  2. Ranum, P.; Peña-Rosas, J.P.; Garcia-Casal, M.N. Global maize production, utilization, and consumption. Ann. N. Y. Acad. Sci. 2014, 1312, 105–112. [Google Scholar] [CrossRef] [Scilit] [PubMed]
  3. Ekpa, O.; Palacios-Rojas, N.; Kruseman, G.; Fogliano, V.; Linnemann, A.R. Sub-Saharan African Maize-Based Foods—Processing Practices, Challenges and Opportunities. Food Rev. Int. 2019, 35, 609–639. [Google Scholar] [CrossRef] [Scilit]
  4. Ekpa, O.; Palacios-Rojas, N.; Kruseman, G.; Fogliano, V.; Linnemann, A.R. Sub-Saharan African maize-based foods: Technological perspectives to increase the food and nutrition security impacts of maize breeding programmes. Glob. Food Secur. 2018, 17, 48–56. [Google Scholar] [CrossRef] [Scilit]
  5. Watson, D. Adaption to climate change: Climate adaptive breeding of maize, wheat and rice. In Sustainable Solutions for Food Security: Combating Climate Change by Adaptation; Springer Nature Switzerland AG., 2019; pp. 67–89. [Google Scholar] [CrossRef] [Scilit]
  6. García-Lara, S.; Serna-Saldivar, S.O. Corn History and Culture. In Corn: Chemistry and Technology, 3rd ed.; Elsevier: Amsterdam, The Netherlands, 2018; pp. 1–18. [Google Scholar] [CrossRef] [Scilit]
  7. Erenstein, O. The evolving maize sector in Asia: Challenges and opportunities. J. New Seeds 2010, 11, 1–15. [Google Scholar] [CrossRef] [Scilit]
  8. Erenstein, O.; Jaleta, M.; Sonder, K.; Mottaleb, K.; Prasanna, B.M. Global maize production, consumption and trade: Trends and R&D implications. Food Secur. 2022, 14, 1295–1319. [Google Scholar] [CrossRef] [Scilit]
  9. Cairns, J.E.; Chamberlin, J.; Rutsaert, P.; Voss, R.C.; Ndhlela, T.; Magorokosho, C. Challenges for sustainable maize production of smallholder farmers in sub-Saharan Africa. J. Cereal Sci. 2021, 101, 103274. [Google Scholar] [CrossRef] [Scilit]
  10. Poole, N.; Donovan, J.; Erenstein, O. Viewpoint: Agri-nutrition research: Revisiting the contribution of maize and wheat to human nutrition and health. Food Policy 2021, 100, 100101976. [Google Scholar] [CrossRef] [Scilit]
  11. Mottaleb, K.A.; Kruseman, G.; Erenstein, O. Determinants of maize cultivation in a land-scarce rice-based economy: The case of Bangladesh. J. Crop Improv. 2018, 32, 453–476. [Google Scholar] [CrossRef] [Scilit]
  12. FAOSTAT. Food and Agriculture Organinzation (Crops and Livestock Products). Available online: https://www.fao.org/faostat/en/#data/QCL (accessed on 20 February 2025).
  13. Van Ittersum, M.K.; van Bussel, L.G.J.; Wolf, J.; Grassini, P.; van Wart, J.; Guilpart, N.; Claessens, L.; de Groot, H.; Wiebe, K.; Mason-D’Croz, D.; et al. Can sub-Saharan Africa feed itself? Proc. Natl. Acad. Sci. USA 2016, 113, 14964–14969. [Google Scholar] [CrossRef] [Scilit] [PubMed]
  14. Badu-Apraku, B.; Fakorede, M.A.B.; Akinwale, R.O. Key Challenges in Maize Breeding in Sub-Saharan Africa; Burleigh Dodds Science Publishing Limited: Sawston, UK, 2017; pp. 51–86. [Google Scholar] [CrossRef] [Scilit]
  15. Prasanna, B.M.; Cairns, J.E.; Zaidi, P.H.; Beyene, Y.; Makumbi, D.; Gowda, M.; Magorokosho, C.; Zaman-Allah, M.; Olsen, M.; Das, A.; et al. Beat the stress: Breeding for climate resilience in maize for the tropical rainfed environments. Theor. Appl. Genet. 2021, 134, 1729–1752. [Google Scholar] [CrossRef] [Scilit]
  16. McMillen, M.S.; Mahama, A.A.; Sibiya, J.; Lübberstedt, T.; Suza, W.P. Improving drought tolerance in maize: Tools and techniques. Front. Genet. 2022, 13, 1001001. [Google Scholar] [CrossRef] [Scilit]
  17. Badu-Apraku, B.; Fakorede, M.A.B.; Nelimor, C.; Osuman, A.S.; Bonkoungou, T.O.; Muhyideen, O.; Akinwale, R.O. Recent advances in breeding maize for drought, heat and combined heat and drought stress tolerance in Sub-Saharan Africa. CABI Rev. 2023, 2023. [Google Scholar] [CrossRef] [Scilit]
  18. Santos, T.B.D.; Ribas, A.F.; de Souza, S.G.H.; Budzinski, I.G.F.; Domingues, D.S. Physiological Responses to Drought, Salinity, and Heat Stress in Plants: A Review. Stresses 2022, 2, 113–135. [Google Scholar] [CrossRef] [Scilit]
  19. da Luz, Q.; Lunduka, W.R.; Vongai, K. Adoption of Drought Tolerant Maize Varieties in Mozambi. 2014. Available online: https://repository.cimmyt.org/bitstream/handle/10883/17795/57541.pdf?sequence=1&isAllowed=y (accessed on 15 January 2026).
  20. Nhantumbo, A.; Famba, S.; Fandika, I.; Cambule, A.; Phiri, E. Yield assessment of maize varieties under varied water application in semi-arid conditions of southern Mozambique. Agronomy 2021, 11, 2541. [Google Scholar] [CrossRef] [Scilit]
  21. Amaral, C.; Mouzinho, B.; Villisa, D.; Matchaya, G.; Nhlengethwa, S.; Wilson, D.; Nhemachena, C. Analysis of Maize Production and Yield in Mozambique (2000–2018): Trends, Challenges and Opportunities for Improvement. 2020. Available online: http://www.agricultura.gov.mz/wp-content/uploads/2020/02/Analysis-of-maize-production-and-yield-in-Mozambique-2000-2018.pdf (accessed on 15 January 2026).
  22. Bahadur, B.; Venkat, M.; Leela, R.; Krishnamurthy, K.V. Plant Biology and Biotechnology Volume I: Plant Diversity, Organization, Function and Improvement; Springer: Springer New Delhi, India, 2015. [Google Scholar] [CrossRef] [Scilit]
  23. Priyadarshan, P.M. Plant Breeding: Classical to Modern; Springer Nature Singapore Pte Ltd.: Singapore, 2019; pp. 1–570. [Google Scholar] [CrossRef] [Scilit]
  24. Carena, M.J.; Hallauer, A.R.; Filho, J.B.M. Quantitative Genetics in Maize Breed; Springer: New York, NY, USA, 2010. [Google Scholar] [CrossRef] [Scilit]
  25. Takele, M. Review on Haploid and Double haploid Maize (Zea mays) breeding technology. Int. J. Agric. Sci. Food Technol. 2022, 8, 052–058. [Google Scholar] [CrossRef] [Scilit]
  26. Khakwani, K.; Ahsan, M.; Sadaqat, H.A.; Ahmad, R. Development and genetics of maize doubled haploid lines. Maydica 2018, 63, 1–15. Available online: https://www.academia.edu/attachments/79787342/download_file (accessed on 15 January 2026).
  27. Ahmadi, B. In vitro- and in vivo-based approaches for doubled haploid production in Zea mays L.: Challenges and opportunities. Theor. Appl. Genet. 2025, 138, 87. [Google Scholar] [CrossRef] [Scilit] [PubMed]
  28. Aziz, M.A.; Masmoudi, K. Molecular breakthroughs in modern plant breeding techniques. Hortic. Plant J. 2025, 11, 15–41. [Google Scholar] [CrossRef] [Scilit]
  29. Hull, R.; Head, G.; Tzotzos, G.T. Technologies for crop improvement. In Genetically Modified Plants; Elsevier: Amsterdam, The Netherlands, 2021; pp. 35–81. [Google Scholar] [CrossRef] [Scilit]
  30. Acquaah, G. Principles of Plant Genetics and Breeding, 2nd ed.; Wiley: Hoboken, NJ, USA, 2012. [Google Scholar] [CrossRef] [Scilit]
  31. Matin, M.Q.I.; Rasul, M.G.; Islam, A.K.M.A.; Mian, M.A.K.; Ivy, N.A.; Ahmed, J.U. Study of Genetic Diversity in Maize (Zea mays L.) Inbreds. Plant 2017, 5, 31. [Google Scholar] [CrossRef] [Scilit]
  32. Singh, H.P.; Raigar, O.P.; Chahota, R.K. Estimation of genetic diversity and its exploitation in plant breeding. Bot. Rev. 2022, 88, 413–435. [Google Scholar] [CrossRef] [Scilit]
  33. Muntean, L.; Ona, A.; Berindean, I.; Racz, I.; Muntean, S. Maize Breeding: From Domestication to Genomic Tools. Agronomy 2022, 12, 2365. [Google Scholar] [CrossRef] [Scilit]
  34. Araus, J.L.; Serret, M.D.; Edmeades, G.O. Phenotyping maize for adaptation to drought. Front. Physio. 2012, 3, 305. [Google Scholar] [CrossRef] [Scilit]
  35. de Faria, S.V.; Zuffo, L.T.; Rezende, W.M.; Caixeta, D.G.; Pereira, H.D.; Azevedo, C.F.; DeLima, R.O. Phenotypic and molecular characterization of a set of tropical maize inbred lines from a public breeding program in Brazil. BMC Genom. 2022, 23, 54. [Google Scholar] [CrossRef] [Scilit]
  36. Mohammadi, S.A.; Prasanna, B.M. Review & Interpretation-Analysis of genetic diversity in crop plants—Salient statistical tools and considerations. Crop Sci. 2003, 43, 1235–1248. [Google Scholar] [CrossRef] [Scilit]
  37. Bhanu, A.N. Assessment of Genetic Diversity in Crop Plants—An Overview. Adv. Plants Agric. Res. 2017, 7, 279–286. [Google Scholar] [CrossRef] [Scilit]
  38. Burgueño, J.; Crossa, J.; Rodríguez, F.; Yeater, K.M.; Glaz, B.; Yeater, K.M. Chapter 13: Augmented Designs-Experimental Designs in Which All Treatments are not Replicated. In Applied Statistics in Agricultural, Biological, and Environmental Sciences; ACSESS: Madison, WI, USA, 2019; pp. 345–369. [Google Scholar] [CrossRef] [Scilit]
  39. Bänziger, M.; Edmeades, G.O.; Beck, D.; Bellon, M. Breeding for Drought and Nitrogen Stress Tolerance in Maize: From Theory to Practice. 2000. Available online: https://repository.cimmyt.org/server/api/core/bitstreams/49cdcaf5-16cb-4f0a-b3fe-dd291271e87d/content (accessed on 25 June 2025).
  40. Zystro, J.; Colley, M.; Dawson, J. Alternative Experimental Designs for Plant Breeding; Wiley: Hoboken, NJ, USA, 2019. [Google Scholar] [CrossRef] [Scilit]
  41. Federer, W.T. Augmented Designs with One-Way Elimination of Heterogeneity. Biometrics 1961, 17, 447–473. [Google Scholar] [CrossRef] [Scilit]
  42. Federer, W.T.; Reynolds, M.; Crossa, J. Combining results from augmented designs over sites. Agron. J. 2000, 93, 389–395. [Google Scholar] [CrossRef] [Scilit]
  43. IBPGR. Descriptors for Maize; International Maize and Wheat Improvement Center: Mexico City, Mexico; International Board for Plant Genetic Resources: Rome, Italy, 1991. [Google Scholar]
  44. UPOV. Guidelines for the Conduct of Tests for Distinctness, Uniformity and Stability—Calabrese, Sprouting Broccoli; International Union for the Protection of New Varieties of Plants: Geneva, Switzerland, 2008; Available online: https://www.upov.int/edocs/mdocs/upov/en/twv/42/tg_2_7_proj_3.pdf (accessed on 25 June 2025).
  45. Asefa, G.; Azmach, G.; Bayisa, E.; Chibsa, B.A.T.; Kalsa, K.K.; Bayisa, M. Morphological Description of Parents of Maize (Zea mays L.) Hybrids a Guideline for Seed Producers and Inspectors; Ethiopian Institute of Agricultural Research (EIAR): Addis Ababa, Ethiopia, 2021. Available online: https://www.academia.edu/85960057/Discriptors_for_maize_Manual (accessed on 25 June 2025).
  46. Coelho, I.F.; Peixoto, M.A.; Evangelista, J.S.P.C.; Alves, R.S.; Sales, S.; de Resende, M.D.V.; Pinto, J.F.N.; Reis, E.F.D.; Bhering, L.L. Multiple-trait, random regression, and compound symmetry models for analyzing multi-environment trials in maize breeding. PLoS ONE 2020, 15, e0242705. [Google Scholar] [CrossRef] [Scilit]
  47. Gilmour, A.R.; Thompson, R.; Cullis, B.R. Average Information REML: An Efficient Algorithm for Variance Parameter Estimation in Linear Mixed Models. Biometrics 1995, 51, 1440–1450. [Google Scholar] [CrossRef] [Scilit]
  48. Bates, D.; Mächler, M.; Bolker, B.M.; Walker, S.C. Fitting linear mixed-effects models using lme4. J. Stat. Softw. 2015, 67, 1–48. [Google Scholar] [CrossRef] [Scilit]
  49. Kuznetsova, A.; Brockhoff, P.B.; Christensen, R.H.B. lmerTest Package: Tests in Linear Mixed Effects Models. J. Stat. Softw. 2017, 82, 1–26. [Google Scholar] [CrossRef] [Scilit]
  50. Peiffer, J.A.; Flint-Garcia, S.A.; De Leon, N.; McMullen, M.D.; Kaeppler, S.M.; Buckler, E.S. The Genetic Architecture of Maize Stalk Strength. PLoS ONE 2013, 8, e67066. [Google Scholar] [CrossRef] [Scilit]
  51. Almeida, P.H.S.; Vilela, V.J.B.; Torres, I.Y.; Uberti, A.; Delima, R.O.; Reis, E.F.D. Genetic potential of maize populations derived from commercial hybrids for interpopulation breeding. Rev. Caatinga 2024, 37, e11736. [Google Scholar] [CrossRef] [Scilit]
  52. Thompsonf, E.A.; And, J.; Wei, S. Evaluation of Likelihood Ratios for Complex Genetic Models. IMA J. Math. Appl. Med. Biol. 1991, 8(3), 149–169. [Google Scholar] [CrossRef] [Scilit]
  53. Cantet, R.J.C.; Birchmeier, A.N.; Santos-Cristal, M.G.; De Avila, V.S. Comparison of restricted maximum likelihood and method ℜ for estimating heritability and predicting breeding value under selection. J. Anim. Sci. 2000, 78, 2554–2560. [Google Scholar] [CrossRef] [Scilit]
  54. Harrell, F.E., Jr. Hmisc: Harrell Miscellaneous, Version 5.2-4; CRAN: Windhoek, Namibia, 2025. [CrossRef]
  55. Wickham, H. ggplot2: Elegant Graphics for Data Analysis; Springer: New York, NY, USA, 2016; pp. 21–54. Available online: https://ggplot2.tidyverse.org (accessed on 10 December 2025).
  56. Kassambara, A.; Mundt, F. factoextra: Extract and Visualize the Results of Multivariate Data, Version 1.0.7; STHDA: Lyon, France, 2022. [CrossRef] [Scilit]
  57. Maechler, M.; Struyf, A.; Hubert, M.; Hornik, K.; Studer, M.; Roudier, P. Package ‘cluster’: Cluster Analysis Basics and Extensions. R package version 2.1.8.1. 2015. Available online: https://cran.r-project.org/web/packages/cluster/cluster.pdf (accessed on 10 December 2025).
  58. Paradis, E.; Schliep, K. Ape 5.0: An environment for modern phylogenetics and evolutionary analyses in R. Bioinformatics 2019, 35, 526–528. [Google Scholar] [CrossRef] [Scilit]
  59. Wickham, H.; Pedersen, T.L.; Seidel, D. Scale Functions for Visualization [R Package Scales Version 1.4, Version 1.4.0; CRAN: Windhoek, Namibia, 2025. [CrossRef] [Scilit]
  60. Alam, Z.; Khan, A.H.; Hossain, I.; Karim, R.; Mustakim, A.A.M.M.; Molla, M.H.; Islam, M.; Akhter, S.; Akter, S. Genetic variability and diversity analysis for some agronomic traits of a sweet potato (Ipomoea batatas L.) collection: Insights for breeding superior genotypes. Heliyon 2024, 10, e38616. [Google Scholar] [CrossRef] [Scilit]
  61. Aman, J.; Bantte, K.; Alamerew, S.; Sbhatu, D.B. Correlation and Path Coefficient Analysis of Yield and Yield Components of Quality Protein Maize (Zea mays L.) Hybrids at Jimma, Western Ethiopia. Int. J. Agron. 2020, 2020, 9651537. [Google Scholar] [CrossRef] [Scilit]
  62. Comstock, R.E.; Robinson, H.F. Genetic parameters, their estimate and significance. In Proceedings of the Sixth International Grassland Congress, State College, PA, USA, 17–23 August 1952; Volume 1, pp. 284–291. [Google Scholar]
  63. Johnson, H.W.; Robinson, H.F.; Comstock, R.E. Estimates of Genetic and Environmental Variability in Soybeans. Agron. J. 1955, 47, 314–318. [Google Scholar] [CrossRef] [Scilit]
  64. Osuman, A.S.; Badu-Apraku, B.; Ifie, B.E.; Tongoona, P.; Obeng-Bio, E.; Garcia-Oliveira, A.L. Genetic diversity, population structure and inter-trait relationships of combined heat and drought tolerant early-maturing maize inbred lines from west and central Africa. Agronomy 2020, 10, 1324. [Google Scholar] [CrossRef] [Scilit]
  65. Reynolds, M.; Chapman, S.; Crespo-Herrera, L.; Molero, G.; Mondal, S.; Pequeno, D.N.L.; Pinto, F.; Pinera-Chavez, F.J.; Poland, J.; Rivera-Amado, C. Breeder friendly phenotyping. Plant Sci. 2020, 295, 110396. [Google Scholar] [CrossRef] [Scilit]
  66. Patel, R.; Memon, J.; Kumar, S.; Patel, D.A.; Sakure, A.A.; Patel, M.B.; Das, A.; Karjagi, C.G.; Patel, S.; Patel, U.; et al. Genetic Diversity and Population Structure of Maize (Zea mays L.) Inbred Lines in Association with Phenotypic and Grain Qualitative Traits Using SSR Genotyping. Plants 2024, 13, 823. [Google Scholar] [CrossRef] [Scilit]
  67. Thakur, N.; Prakash, J.; Thakur, K.; Sharma, J.K.; Kumari, R.; Rana, M. Genetic Diversity and Structure of Maize Accessions of North Western Himalayas Based on Morphological and Molecular Markers. Proc. Natl. Acad. Sci. India Sect. B—Biol. Sci. 2017, 87, 1385–1398. [Google Scholar] [CrossRef] [Scilit]
  68. Singh, D.P.; Singh, A.K.; Singh, A. Primer on population and quantitative genetics. In Plant Breeding and Cultivar Development; Elsevier: Amsterdam, The Netherlands, 2021; pp. 77–127. [Google Scholar] [CrossRef] [Scilit]
  69. Govindaraj, M.; Vetriventhan, M.; Srinivasan, M. Importance of genetic diversity assessment in crop plants and its recent advances: An overview of its analytical perspectives. Genet. Res. Int. 2015, 2015, 43187. [Google Scholar] [CrossRef] [Scilit]
  70. Ige, S.A.; Bello, O.; Charity, A.; Stephen, A. Estimation of genetic variation, heritability and genetic advance for yield and agronomic traits correlation of some low nitrogen tolerance maize (Zea mays) varieties in the tropics. Res. Crops 2020, 21, 595–603. [Google Scholar] [CrossRef] [Scilit]
  71. Roy, P.R.; Haque, M.H.; Ferdausi, A.; Bari, M.A. Genetic variability, correlation and path co-efficients analyses of selected maize (Zea mays L.) genotypes. Fundam. Appl. Agric. 2018, 3, 382–389. [Google Scholar] [CrossRef] [Scilit]
  72. Rahman, S.; Mia, M.M.; Quddus, T.; Hassan, L.; Haque, M.A. Assessing Genetic Diversity of Maize (Zea mays L.) Assessing Genotypes for Agronomic Traits. Res. Agric. Livest. Fish. 2015, 2(1), 53–61. [Google Scholar] [CrossRef] [Scilit]
  73. Alake, C.O.; Ojo, D.K.; Oduwaye, O.a.; Adekoya, M.a. Genetic Variability and Correlation Studies in Yield and Yield Related Characters of Tropical Maize (Zea mays L.). ASSET Int. J. (Ser. A) 2008, 8, 14–27. Available online: https://publications.funaab.edu.ng/index.php/Series_A/article/view/42/46 (accessed on 11 February 2026).
  74. Islam, S.; Ferdausi, A.; Sweety, A.Y.; Das, A.; Ferdoush, A.; Haque, M.A. Morphological characterization and genetic diversity analyses of plant traits contributed to grain yield in maize (Zea mays L.). J. Biosci. Agric. Res. 2020, 25, 2047–2059. [Google Scholar] [CrossRef] [Scilit]
  75. Al-Naggar, A.M.M.; Soliman, A.M.; Hussien, M.H.; Mohamed, A.M.H. Genetic Diversity of Maize Inbred Lines Based on Morphological Traits and Its Association With Heterosis. SABRAO J. Breed. Genet. 2022, 54, 589–597. [Google Scholar] [CrossRef] [Scilit]
  76. Hassan, A.A.; Abdikadir, M.; Hasan, M.; Azad, A.K.; Hasanuzzaman. Genetic Variability and Diversity Studies in Maize (Zea mays L.) Inbred Lines. IOSR J. Agric. Vet. Sci. 2018, 11, 69–76. Available online: http://www.iosrjournals.org/iosr-javs/papers/Vol11-issue11/Version-1/L1111016976.pdf (accessed on 15 January 2026).
  77. Aci, M.M.; Lupini, A.; Mauceri, A.; Morsli, A.; Khelifi, L.; Sunseri, F. Genetic variation and structure of maize populations from Saoura and Gourara oasis in Algerian Sahara. BMC Genet. 2018, 19, 51. [Google Scholar] [CrossRef] [Scilit] [PubMed]
  78. Sinana, H.F.; Ravikesavan, R.; Iyanar, K.; Senthil, A. Study of genetic variability and diversity analysis in maize (Zea mays L.) by agglomerative hierarchical clustering and principal component analysis. Electron. J. Plant Breed. 2023, 14, 43–51. [Google Scholar] [CrossRef] [Scilit]
  79. Barbosa, P.A.M.; Fritsche-Neto, R.; Andrade, M.C.; Petroli, C.D.; Burgueño, J.; Galli, G.; Willcox, M.C.; Sonder, K.; Vidal-Martínez, V.A.; Sifuentes-Ibarra, E.; et al. Introgression of Maize Diversity for Drought Tolerance: Subtropical Maize Landraces as Source of New Positive Variants. Front. Plant Sci. 2021, 12, 691211. [Google Scholar] [CrossRef] [Scilit]
  80. Gunundu, R.; Shimelis, H.; Mashilo, J. Genomic selection and enablers for agronomic traits in maize (Zea mays): A review. Plant Breed. 2023, 142, 573–593. [Google Scholar] [CrossRef] [Scilit]
  81. Yang, Q.; Xu, M. Qualitative and Quantitative Trait Polymorphisms in Maize. In Diagnostics in Plant Breeding; Springer: Dordrecht, The Netherlands, 2013. [Google Scholar] [CrossRef] [Scilit]
  82. Maddonni, G.A.; Otegui, M.E. Leaf area, light interception, and crop development in maize. Field Crops Res. 1996, 48, 81–87. [Google Scholar] [CrossRef] [Scilit]
  83. Li, J.; Xie, R.Z.; Wang, K.R.; Hou, P.; Ming, B.; Zhang, G.Q.; Liu, G.Z.; Wu, M.; Yang, Z.S.; Li, S.K. Response of canopy structure, light interception and grain yield to plant density in maize. J. Agric. Sci. 2018, 156, 785–794. [Google Scholar] [CrossRef] [Scilit]
  84. Duan, M.; Zhang, X.; Wei, Z.; Chen, X.; Zhang, B. Effect of Maize Canopy Structure on Light Interception and Radiation Use Efficiency at Different Canopy Layers. Agronomy 2024, 14, 1511. [Google Scholar] [CrossRef] [Scilit]
  85. Wang, Y.; Bao, J.; Wei, X.; Wu, S.; Fang, C.; Li, Z.; Qi, Y.; Gao, Y.; Dong, Z.; Wan, X. Genetic Structure and Molecular Mechanisms Underlying the Formation of Tassel, Anther, and Pollen in the Male Inflorescence of Maize (Zea mays L.). Cells 2022, 11, 1753. [Google Scholar] [CrossRef] [Scilit]
  86. Landoni, M.; Sangiorgio, S.; Ghidoli, M.; Cassani, E.; Pilu, R. Study of Pollen Traits, Production, and Artificial Pollination Methods in Zea mays L. Agriculture 2024, 14, 1791. [Google Scholar] [CrossRef] [Scilit]
  87. Fonseca, A.E.; Westgate, M.E.; Grass, L.; Dornbos, D.L. Tassel Morphology as an Indicator of Potential Pollen Production in Maize. Crop Manag. 2003, 2, 1–15. [Google Scholar] [CrossRef] [Scilit]
  88. Ricci, B.; Monod, H.; Guérin, D.; Messéan, A.; Maton, C.; Balique, B.; Angevin, F. Predicting maize pollen production using tassel morphological characteristics. Field Crops Res. 2012, 136, 107–115. [Google Scholar] [CrossRef] [Scilit]
  89. Nelimor, C.; Badu-Apraku, B.; Nguetta, S.P.A.; Tetteh, A.Y.; Garcia-Oliveira, A.L. Phenotypic characterization of maize landraces from Sahel and Coastal West Africa reveals marked diversity and potential for genetic improvement. J. Crop Improv. 2020, 34, 122–138. [Google Scholar] [CrossRef] [Scilit]
  90. Nzuve, F.; Githiri, S.; Mukunya, D.M.; Gethi, J. Genetic Variability and Correlation Studies of Grain Yield and Related Agronomic Traits in Maize. J. Agric. Sci. 2014, 6, 166–176. [Google Scholar] [CrossRef] [Scilit]
  91. Rocha, R.S.; Nascimento, M.R.; Chagas, J.T.B.; de Almeida, R.N.; Santos, P.R.D.; da Silva Sanfim de Sant’Anna, C.Q.; da Cruz, D.P.; da Silva Costa, K.D.; de Amaral Gravina, G.; Daher, R.F. Association among Agro-morphological Traits by Correlations and Path in Selection of Maize Genotypes. J. Exp. Agric. Int. 2019, 34, 1–12. [Google Scholar] [CrossRef] [Scilit]
  92. Jagadeesh, K.; Sahi, V.P.; Babu, K.S.; Kumar, D.P. Correlation and Path Coefficient Analysis of Grain Yield and Yield Related Traits in Maize (Zea mays L.). Int. J. Plant Soil. Sci. 2022, 5, 1512–1520. [Google Scholar] [CrossRef] [Scilit]
  93. Twumasi, P.; Tetteh, A.Y.; Adade, K.B.; Asare, S.; Akromah, R.A. Morphological diversity and relationships among the ipgri maize (Zea mays L.) landraces held in IITA. Maydica 2017, 62, 1–9. Available online: https://www.researchgate.net/profile/Antonia-Tetteh/publication/323126985_Morphological_diversity_and_relation ships_among_the_IPGRI_maize_Zea_mays_L_landraces_held_in_IITA/links/5a8afdc10f7e9b1a9555a0ee/Morphological-diversity-and-relationships-among-the-IPGRI-maize-Zea-mays-L-landraces-held-in-IITA.pdf (accessed on 15 January 2026).
  94. Amegbor, I.K.; Abe, A.; Adjebeng-Danquah, J.; Adu, G.B. Genetic analysis and yield assessment of maize hybrids under low and optimal nitrogen environments. Heliyon 2022, 8, e09052. [Google Scholar] [CrossRef] [Scilit]
  95. Bonkoungou, T.O.; Adejumobi, I.I.; Adetimirin, V.O.; Badu-Apraku, B.; Agre, P.A.; Nanema, K.R.; Abubakar, A.M.; Dao, A. Joint analysis of phenotypic and molecular data for genetic diversity assessment in extra-early orange maize (Zea mays L.). BMC Genom. 2025, 26, 784. [Google Scholar] [CrossRef] [Scilit]
  96. Pswarayi, A.; Vivek, B.S. Combining ability amongst CIMMYT’s early maturing maize (Zea mays L.) germplasm under stress and non-stress conditions and identification of testers. Euphytica 2008, 162, 353–362. [Google Scholar] [CrossRef] [Scilit]
  97. Aslam, M.; Maqbool, M.A.; Cengiz, R. Effects of Drought on Maize. In Drought Stress in Maize (Zea mays L.); Springer: Cham, Switzerland, 2015. [Google Scholar] [CrossRef] [Scilit]
  98. Annor, B.; Badu-Apraku, B. Selection of extra-early white quality protein maize (Zea mays L.) inbred lines for drought and low soil nitrogen resilient hybrid production. Front. Sustain. Food Syst. 2023, 7, 1238776. [Google Scholar] [CrossRef] [Scilit]
  99. Osuman, A.S.; Badu-Apraku, B.; Ifie, B.E.; Nelimor, C.; Tongoona, P.; Obeng-Bio, E.; Karikari, B.; Danquah, E.Y. Combining Ability and Heterotic Patterns of Tropical Early-Maturing Maize Inbred Lines under Individual and Combined Heat and Drought Environments. Plants 2022, 11, 1365. [Google Scholar] [CrossRef] [Scilit]
  100. Makinde, S.A.; Badu-Apraku, B.; Ariyo, O.J.; Porbeni, J.B. Combining ability of extra-early maturing provitamin A maize (Zea mays L.) inbred lines and performance of derived hybrids under Striga hermonthica infestation and low soil nitrogen. PLoS ONE 2023, 18, e0280814. [Google Scholar] [CrossRef] [Scilit] [PubMed]
  101. Bhadmus, O.A.; Badu-apraku, B.; Adeyemo, O.A.; Ogunkanmi, A.L. Genetic analysis of early white quality protein maize inbreds and derived hybrids under low-nitrogen and combined drought and heat stress environments. Plants 2021, 10, 2596. [Google Scholar] [CrossRef] [Scilit] [PubMed]
  102. Oluwaseun, O.; Badu-Apraku, B.; Adebayo, M.; Abubakar, A.M. Combining Ability and Performance of Extra-Early Maturing Provitamin a Maize Inbreds and Derived Hybrids in Multiple Environments. Plants 2022, 11, 964. [Google Scholar] [CrossRef] [Scilit] [PubMed]
  103. Mango, N.; Mapemba, L.; Tchale, H.; Makate, C.; Dunjana, N.; Lundy, M. Maize value chain analysis: A case of smallholder maize production and marketing in selected areas of Malawi and Mozambique. Cogent Bus. Manag. 2018, 5, 1–15. [Google Scholar] [CrossRef] [Scilit]
  104. Tambo, A. A Critical Analysis of the Potential for Cereal Production in the Central Region of Mozambique. Ph.D. Thesis, Zimbabwe Open University, Harare, Zimbabwe, 2014. Available online: http://repositorio.ucm.ac.mz/bitstream/123456789/92/1/Armindo%20Tambo%20-Doctoral%20Thesis.pdf (accessed on 15 January 2026).
  105. Yan, W.; Kang, M.S. GGE Biplot Analysis: A Graphical Tool for Breeders, Geneticists, and Agronomists, 1st ed.; CRC Press, 2002; Available online: https://api.taylorfrancis.com/content/books/mono/download?identifierName=doi&identifierValue=10.1201/9781420040371&type=googlepdf (accessed on 15 January 2026).
  106. Hosseini, S.M.S.; Shiri, M.; Mostafavi, K.; Mohammadi, A.; Miri, S.M. Genetic analysis and association detection of agronomic traits in maize genotypes. Sci. Rep. 2025, 15, 399. [Google Scholar] [CrossRef] [Scilit]
  107. Kifayat, M.; Tahir, M.H.N.; Siddique, A.B.; Sajid, M.; Shehzad, M.A. Genetic Diversity among Maize (Zea mays L.) Genotypes Based on Fodder Yield and Quality Parameters. Mediterr. J. Basic Appl. Sci. 2022, 6, 7–17. [Google Scholar] [CrossRef] [Scilit]
  108. Fasahat, P. Principles and Utilization of Combining Ability in Plant Breeding. Biom. Biostat. Int. J. 2016, 4, 1–22. [Google Scholar] [CrossRef] [Scilit]
  109. Begna, T. Application of Combining Ability in Plant Breeding. Int. J. Agric. Biosci. 2021, 10, 74–83. [Google Scholar]
  110. Temesgen, B. Combining ability and heterosis in plant improvement. Open J. Plant Sci. 2021, 6, 108–117. [Google Scholar] [CrossRef] [Scilit]
  111. Begna, T.; Yali, W. Common mating design for Hybrid development. Int. Res. J. Plant Crop Sci. 2022, 7, 211–220. [Google Scholar]
Figure 1. Combined bar-chart for Trait distribution among the population (overview); the Y axis is in multiples of 100, representing the number of genotypes for each scoring. The green bar charts are distribution of each score class while the red line is the density of each score class.
Agronomy 16 00984 g001
Figure 2. Tassel branch angle (1: very small; 3: small; 5: medium; 7: large; 9: very large).
Agronomy 16 00984 g002
Figure 3. Ear colour (absence or presence of anthocyanin coloration).
Agronomy 16 00984 g003
Figure 4. Quantitative trait PCA biplot PC1 and PC2 (I–IV = quadrant number).
Agronomy 16 00984 g004
Table 1. REML estimate of block effects, variance components (CV%) and likelihood ratio test (LRT) for 19 agro-morphological traits in 271 DH maize lines.
StatisticdfY (t/ha)AD (Days)SD (Days)ASI (Days)PH (cm)TL (cm)EP EA (1–5)GT (1–3)ES (1–3)
Block MS132.85 **0.97 ns0.86 ns0.96 ns3.05 ***2.96 ***1.80 *1.07 ns1.15 ns2.38 **
Error MS2850.624.116.321.86160.0440.2100.590.250.26
Mean 2.8777.9378.891.81148.7532.930.433.021.772.61
σ2g 2.1421.719.060.16406.7616.7200.140.420.01
σ2e 0.624.116.321.86160.0440.2100.590.250.26
H2 (broad) 0.770.840.750.080.720.290.350.190.630.05
GCV (%) 50.995.985.5321.9913.5612.428.6312.2136.734.68
PCV (%) 57.966.526.3978.381622.9114.5628.1746.2520.18
GA 2.658.87.790.2335.24.570.050.331.070.06
GAM (%) 92.4211.299.8812.723.6613.8610.5410.960.082.23
CV (%) 27.552.63.1975.238.519.2511.7325.3828.1119.63
LRT 0 ***0 ***0 ***0.140 ***0 **0 ***0.350 ***0.49
StatisticdfBH (1–5)LOGNPNEPED (cm)EL (cm)NRNKGwpp (g)
Block MS133.82 ***6.33 ***2.06 *4.91 ***1.95 *1.51 ns1.83 *1.79 *2.83 **
Error MS2850.611.017.560.060.062.070.989.27282.92
Mean 1.881.1413.710.974.0413.2913.7324.4472.01
σ2g 0.262.058.3100.12.62.0617.721040.96
σ2e 0.611.017.560.060.062.070.989.27282.92
H2 (broad) 0.30.670.5200.60.560.680.660.79
GCV (%) 27.07126.0121.0307.6612.1410.4617.2244.81
PCV (%) 49.67153.9429.0625.379.8716.2612.7121.2650.53
GA 0.572.424.300.52.482.447.0358.94
GAM (%) 30.38212.4731.35012.2618.6817.7328.7581.85
CV (%) 41.6588.4320.0625.376.2210.827.2212.4623.36
LRT 0.01 **0 **0 ***10 **0 ***0 ***0.01 **0 ***
Abbreviations: ns (≥0.05); * (≤0.05); ** (≤0.01); *** (≤0.001); AD (days to anthesis); SD (days to silking); ASI (anthesis–silking interval); PH (plant height); EP (ear position); TL (tassel length); LOG (logging); BH (bad husk), EA (ear aspect); GT (grain texture); ES (ear shape); ED (ear diameter); EL (ear length); NR (number of rows); NK (number of kernels); NP (number of plants); Y (grain yield) GWPP (grain weight per plant; df (degrees of freedom).
Table 2. Principal component analysis (PCA) of 18 quantitative traits.
TraitPC1PC2PC3PC4PC5PC6PC7PC8PC9PC10
Y−0.410.08−0.120.010.05−0.01−0.020.070.12−0.39
AD0.12−0.6 *−0.01−0.13−0.15−0.080.080.040.11−0.13
SD0.13−0.59 *0.01−0.16−0.150.110.000.010.03−0.18
ASI0.08−0.010.100.10−0.070.74 *−0.42−0.16−0.28−0.31
PH−0.31−0.14−0.130.03−0.180.18−0.080.01−0.030.49
TL−0.170.050.27−0.32−0.200.350.35−0.310.310.22
EP−0.13−0.32−0.390.28−0.09−0.10−0.130.09−0.260.16
EA0.300.23−0.10−0.12−0.35−0.080.00−0.09−0.04−0.04
GT−0.170.150.26−0.16−0.27−0.040.180.39−0.64 *0.00
ES0.020.09−0.43−0.30.21−0.06−0.14−0.52 *−0.310.12
BH0.030.17−0.09−0.12−0.68 *−0.27−0.40−0.070.19−0.14
LOG0.000.01−0.230.39−0.320.070.63 *−0.30−0.20−0.22
NP−0.190.18−0.390.15−0.110.300.000.350.36−0.04
ED−0.31−0.090.310.20−0.07−0.06−0.160.00−0.050.04
EL−0.34−0.120.01−0.34−0.12−0.02−0.05−0.08−0.100.15
NR−0.08−0.040.330.53 *−0.10−0.17−0.18−0.400.080.16
NK−0.38−0.01−0.20−0.050.030.000.01−0.110.04−0.06
GWPP−0.35−0.040.12−0.120.13−0.220.00−0.20−0.01−0.50 *
Eigenvalue4.562.211.741.431.161.100.940.860.800.71
Variance (%)25.3412.289.677.946.466.135.224.784.433.94
Cumulative (%)25.3437.6247.2955.2261.6867.8173.0277.882.2386.17
Abbreviation: PC—principal component; * most determining trait in each PC.
Table 3. Mahalanobis intra-cluster distance and top 5 traits.
ClusterNo. of GenotypesIntra D2Top 5 Traits
C1448.87AD, SD, Y, NP, NK
C23912.87NP, Y, NK, EP, PH
C36810.19GT, AD, SD, LOG, EP
C4611.24ASI, ES, EP, ED, TL
C51912.67GT, ED, NR, GWPP, Y
C62112.27SD, AD, BH, EA, EL
C71910.03ED, NK, EL, PH, Y
C8149.40SD, AD, NP, Y, NK
C91811.67Y, GWPP, NK, EL, ED
C102512.70LOG, EP, GT, TL, GWPP
Table 4. Mahalanobis inter-cluster distance.
Cluster12345678910
1 5.373.6418.785.674.025.5410.365.277.74
25.37 4.3515.994.846.114.834.189.888.20
33.644.35 17.625.406.174.764.986.325.87
418.7815.9917.62 20.1221.9517.4120.0320.5123.75
55.674.845.4020.12 8.8511.328.554.776.49
64.026.116.1721.958.85 6.3912.6712.697.07
75.544.834.7617.4111.326.39 7.1316.039.48
810.364.184.9820.038.5512.677.13 13.618.48
95.279.886.3220.514.7712.6916.0313.61 10.84
107.748.205.8723.756.497.079.488.4810.84
Disclaimer/Publisher’s Note: The statements, opinions and data contained in all publications are solely those of the individual author(s) and contributor(s) and not of MDPI and/or the editor(s). MDPI and/or the editor(s) disclaim responsibility for any injury to people or property resulting from any ideas, methods, instructions or products referred to in the content.