Article

Quantifying Soil Organic Matter Effects on Nitrogen-Use Efficiency and Fate in Wheat–Maize Cropping Systems: A 15N Tracer Approach


1
College of Life Science, Changzhi University, Changzhi 046000, China
2
Key Laboratory of Plant Nutrition and the Agro-Environment in Northwest China, Ministry of Agriculture and Rural Affairs, College of Natural Resources and Environment, Northwestern A&F University, Yangling 712100, China
3
State Key Laboratory of Efficient Utilization of Arable Land in China, Institute of Agricultural Resources and Regional Planning, Chinese Academy of Agricultural Sciences, Beijing 100081, China
4
Shanxi Province Key Laboratory of Soil Environment and Nutrient Resources, Institute of Eco-Environment and Industrial Technology, Shanxi Agricultural University, Taiyuan 030031, China
*
Author to whom correspondence should be addressed.
Agronomy 2026, 16(10), 983; https://doi.org/10.3390/agronomy16100983
Submission received: 10 April 2026 / Revised: 6 May 2026 / Accepted: 13 May 2026 / Published: 15 May 2026

Abstract

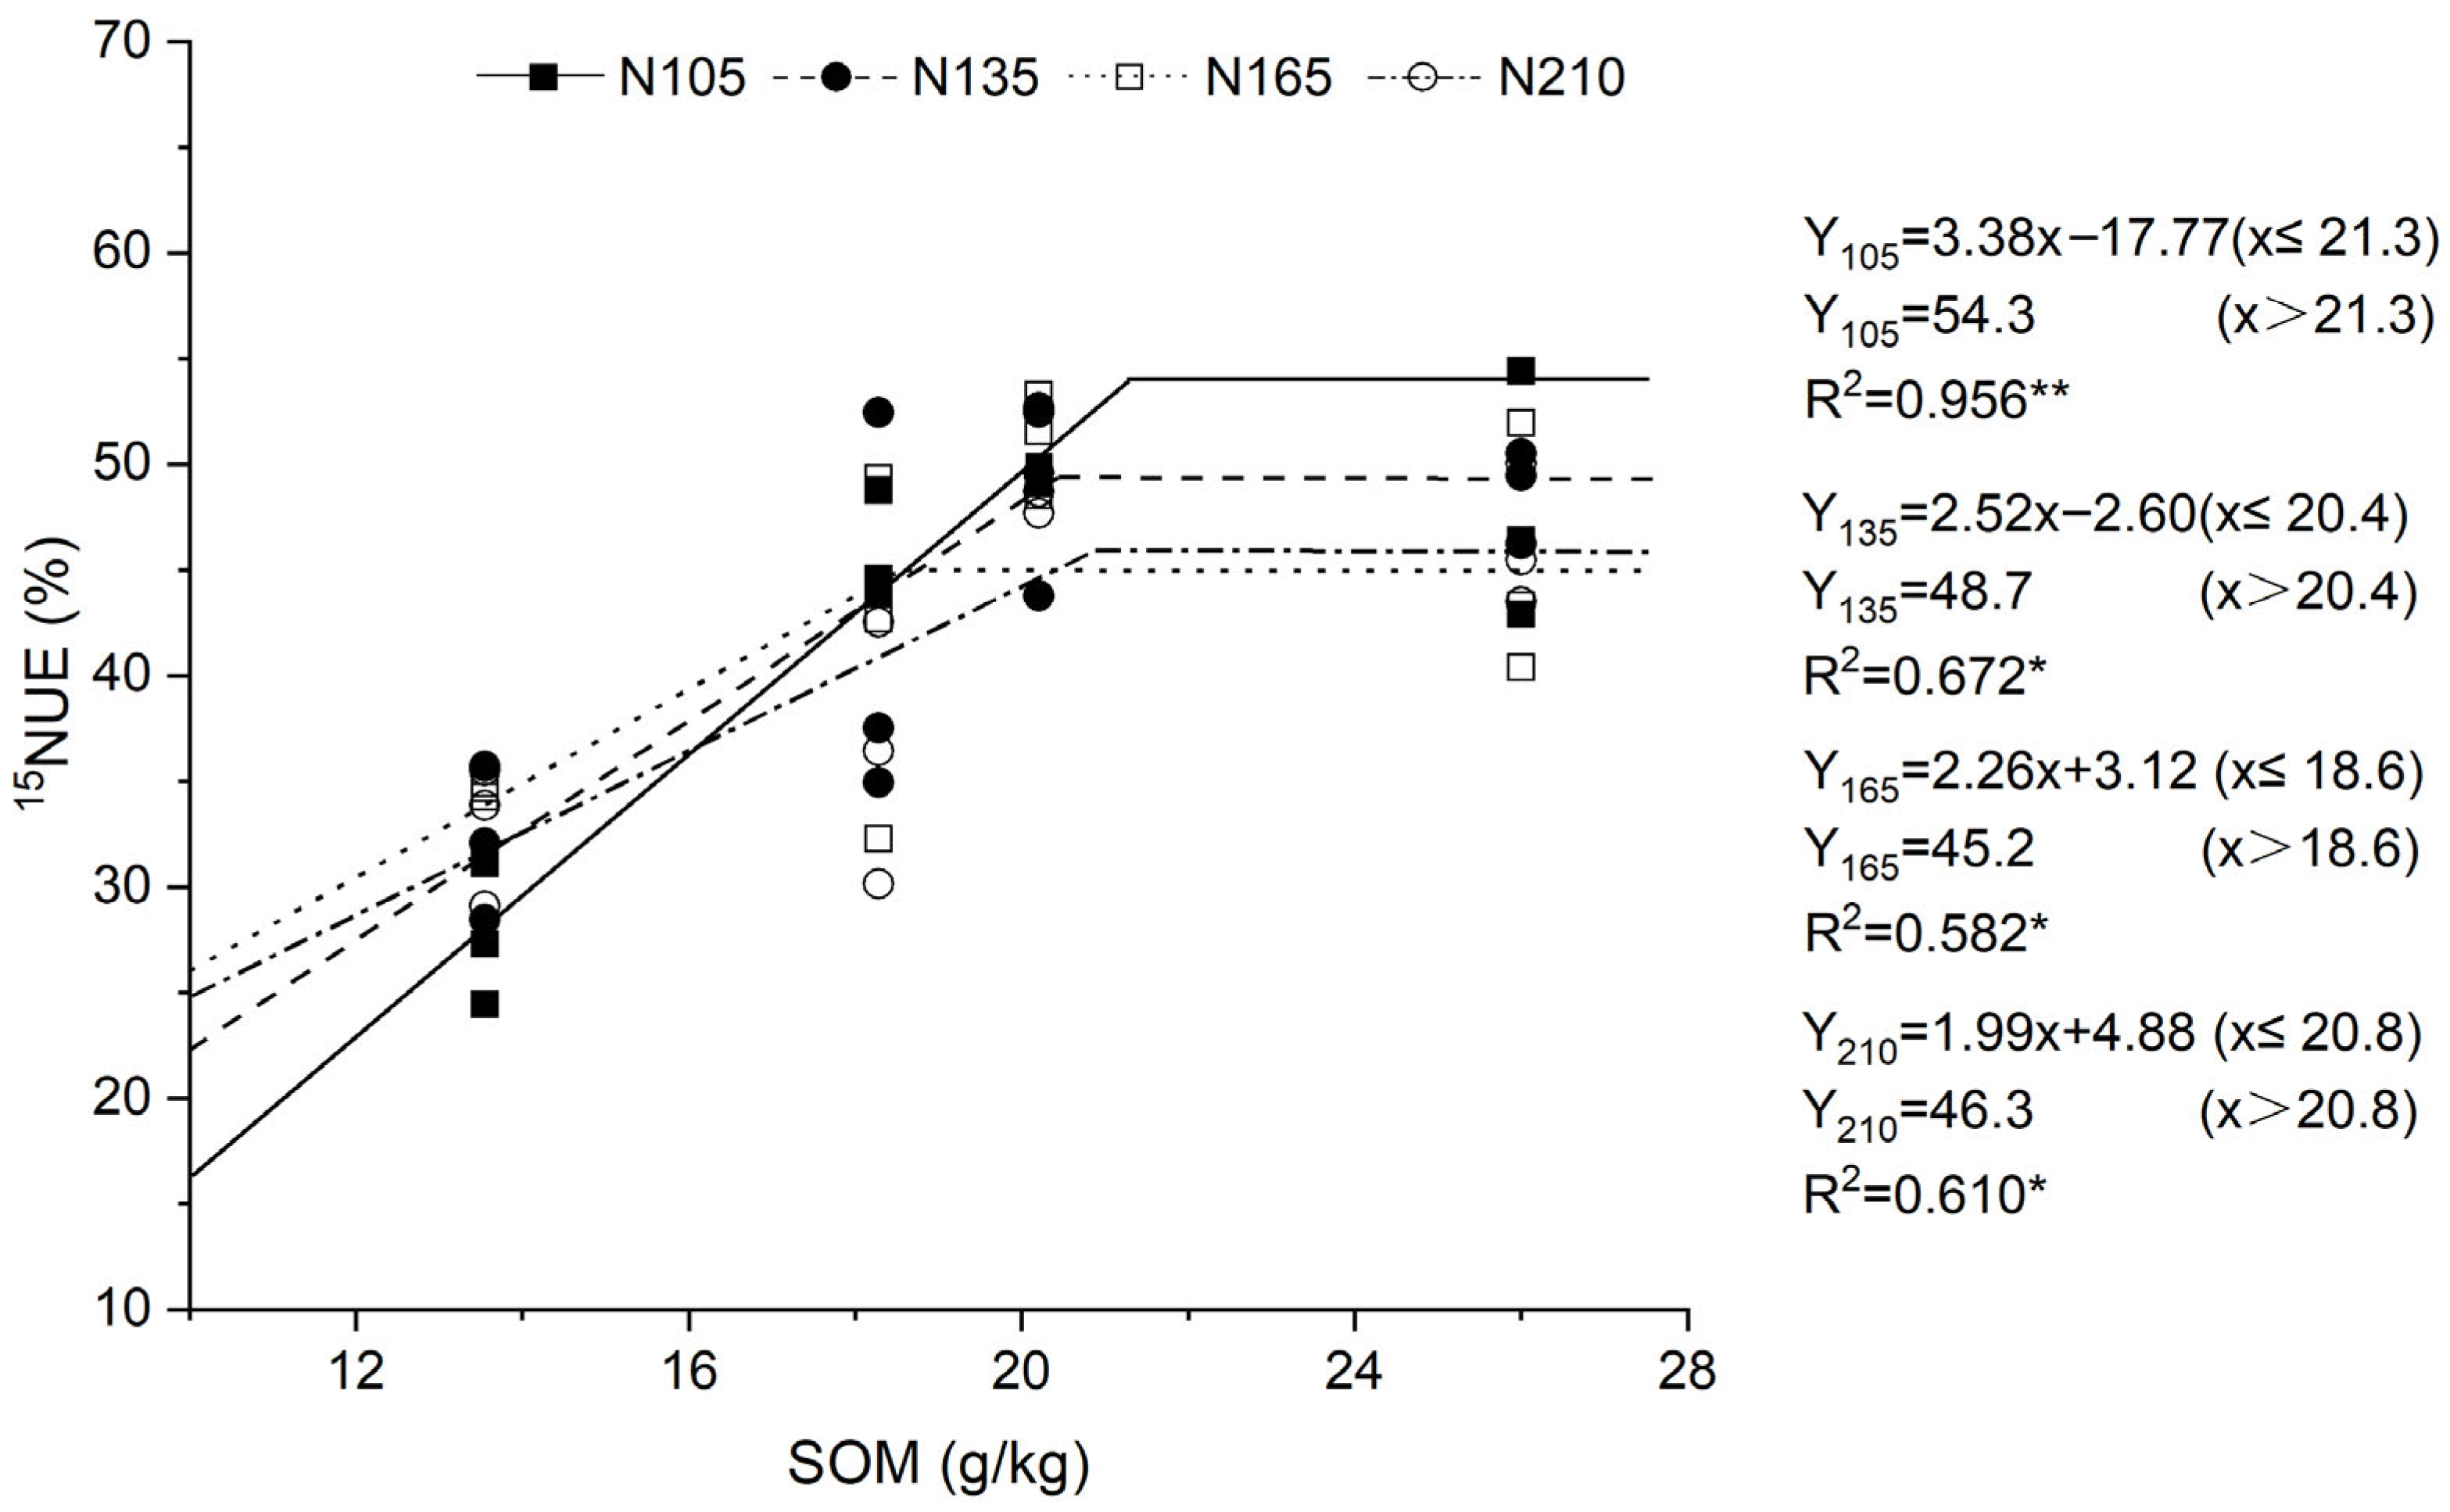
Soil organic matter (SOM) is a recognized determinant of nitrogen-use efficiency (NUE), but its quantitative control over the fate of fertilizer N remains unclear. Using a 15N tracer study within a winter wheat–summer maize region, we quantified the recovery of initially applied N from wheat and subsequent crops in relation to SOM and N application rates. We found that while N fertilization boosted yields by 85–340% in low-fertility soil, its effectiveness exhibited diminishing returns in high-fertility soils. Crucially, the total recovery efficiency of fertilizer N (cumulative 15NUE) across three cropping seasons was fundamentally governed by SOM content, following a linear–plateau relationship. The model revealed that the maximum 15NUE (54.3%) at an optimal application rate (105 kg N ha−1) was achieved when SOM exceeded a critical threshold of 21.3 g kg−1 (equivalent to 57.51 t ha−1 in the 0–20 cm soil layer). Below this threshold, 15NUE increased linearly with SOM (R2 = 0.956). Furthermore, residual 15N in soil was primarily stabilized in organic forms (58–64%), while recovery by subsequent crops was minimal (≤4.3%). This confirms that high SOM content minimizes the amount of unaccounted 15N by enhancing N fixation within the soil organic pool. Our findings establish a quantifiable SOM threshold for maximizing NUE, thereby providing a scientific basis for reducing fertilizer waste and enhancing the sustainability of intensive agriculture in the region.

1. Introduction

Wheat and maize are the world’s most important cereal crops, critically supporting global food security [1]. Together, they supply over 50% of humanity’s dietary calories [2]. In China, the winter wheat–summer maize double-cropping system is the dominant agricultural practice, accounting for a quarter of the nation’s total grain production [3]. This productivity has been largely sustained by the intensive application of synthetic or chemical nitrogen (N) fertilizer [4]. From 1980 to 2020, a 41% increase (from 0.987 billion to 1.395 billion) in China’s population necessitated a corresponding surge in chemical N application to ensure adequate food security [5].
Although N fertilizer application is crucial for agricultural productivity [6,7], excessive application leads to low nitrogen-use efficiency (NUE) [8] and causes serious environmental consequences, including pollution and ecosystem degradation [9,10,11,12,13]. Therefore, in the context of global sustainable and intensive agricultural production, the Food and Agriculture Organization (FAO) has established several conceptual frameworks to guide efficient N management, emphasizing the 4R principles of nutrient management: right source, right rate, right time, and right place. These principles for optimizing N management in agricultural fields aim to maintain soil health, improve crop uptake, and reduce environmental losses [6,14].
NUE is a key indicator for evaluating N management practices in agricultural systems and their environmental impacts [15]. China’s average NUE is only about 25%, far lower than that of the United States and Canada (68%) or European countries (52%) [16]. Although NUE is not a direct objective of farm management, researchers and policymakers use it widely to evaluate the effectiveness of fertilization practices [7,17]. This metric is typically calculated as the ratio of the crop N uptake to the applied fertilizer N, reflecting the relationship between crop yield and N inputs [18]. Therefore, optimizing N management to improve NUE is crucial for sustainable agriculture, as it helps minimize environmental impacts while maintaining yields [6,10,19,20].
Multiple factors affect NUE, with fertilizer application rate and soil fertility being among the most significant [21]. Reducing N input can directly improve NUE, though it may sometimes compromise crop yields [20,22]. The relationship between soil fertility and NUE, however, remains debated. For instance, Oelofse et al. [23] reported a negative relationship between NUE and soil organic carbon (SOC) in winter wheat and spring barley experiments in Denmark, while others found no significant relationships between 15NUE and soil organic matter (SOM) in winter wheat–summer maize systems on Fluvo-aquic soils. In contrast, other studies have demonstrated that higher soil fertility can enhance both crop yield and NUE [6,18,20,24].
Theoretically, high-fertility soils provide an optimal physical environment for root growth, balanced nutrient availability, and enhanced microbial activity that promotes N mineralization and uptake [25,26]. In such environments, crops tend to rely more on soil-derived N than fertilizer-derived N due to improved root vitality and microbial N turnover [22,27]. Conversely, low-fertility soils—despite potentially higher residual mineral N—often exhibit reduced N immobilization capacity, leading to greater N losses through leaching and reduced N availability for subsequent crops [26,28]. This suggests that low-fertility soils may require higher N inputs to meet crop N demands, highlighting the complex interplay between soil fertility and N management strategies.
Given these inconsistencies, the quantitative relationship between soil fertility and NUE remains unclear. We hypothesized that (1) aboveground N accumulation would increase with soil fertility—measured as SOC or SOM—until reaching a plateau, beyond which further improvements in fertility would yield diminishing returns, and (2) NUE will follow a similar trend, peaking at an optimal soil fertility level. To test these hypotheses, we conducted a study in a winter wheat–summer maize double-cropping system with the following objectives: (1) track the fate of fertilizer-derived 15N across three consecutive crop seasons under varying soil fertility levels and N application rates by quantifying 15N uptake in aboveground biomass, residual 15N in soil and unaccounted-for 15N; (2) model the response of 15NUE to SOM and N application rates.

2. Materials and Methods

2.1. Study Site

This study was conducted at the National Soil Fertility and Fertilizer Efficiency Long-term Monitoring Base for Loessial Soil in Yangling (34°17′51″ N, 108°00′48″ E), Shaanxi, China. The region has a warm temperate continental monsoon climate, characterized by a mean annual temperature of 12.9 °C and annual precipitation of 550–600 mm (60% between June and September). The soil is a silty clay loam (16% clay, 52% silt and 32% sand), classified as Anthrosol with a terric horizon derived from manure and loess material (WRB, 2014) or as Earth-cumuli-Orthic Anthrosol (Chinese Soil Taxonomy, 2001). The site operates under an annual winter wheat (T. aestivum L.)–summer maize (Z. mays L.) double-cropping system. The data were collected from a long-term fertilization experiment established in 1990, which includes 11 distinct nutrient management treatments. A detailed description of the experimental design is provided in Table S1.

2.2. Experimental Design

This study utilized four fertilization treatments from the long-term experiment: (1) inorganic P and K (PK); (2) inorganic N, P and K (NPK); (3) inorganic NPK with annual maize straw return (NPKS); and (4) inorganic NPK with annual cattle manure (NPKM). Given that long-term fertilization profoundly influenced soil fertility, particularly the key indicator of soil organic matter (SOM), SOM levels were employed as a proxy for overall fertility. These levels are designated as F1, F2, F3 and F4 fertility classes.
A 15N-labeled microplot was established on soils subjected to four different long-term fertilization treatments. The microplots were isolated from one another and from the surrounding fields using cylindrical polyvinyl chloride (PVC) barriers. These PVC cylinders had an inner diameter of 30 cm, an outer diameter of 32 cm, and a height of 60 cm. The PVC cylinders were buried vertically in the soil to a depth of 55 cm, with approximately 5 cm protruding above the soil surface to prevent the migration of soil, water, and experimental materials. Within each soil fertility level, five rates of N fertilizer (urea, 46% N) were tested: 0, 105, 135, 165, and 210 kg N ha−1 during the wheat growing season, labeled as N0, N105, N135, N165, and N210; and 0, 90, 135, 180, and 225 kg N ha−1 during the maize growing season, labeled as N0, N90, N135, N180, and N225. In the 15N-labeled microplots, superphosphate (16% P2O5) was applied as the phosphorus fertilizer and potassium sulfate (50% K2O) as the potassium fertilizer during both the wheat and maize growing seasons. The specific application rates are shown in Table S1. This experiment employed a randomized complete block design, with three replicates of each N fertilizer application rate within each soil fertility level. A total of 60 15N-labeled microplots were established across the four soil fertility levels. Table S2 lists the basic chemical properties of the four soil types prior to the start of the 15N experiment.
For each microplot, the full dose of fertilizers was thoroughly mixed into the top 0–20 cm of soil before sowing. In the initial winter wheat season, all treatments received 15N-labeled urea (20.01 atom% 15N, Shanghai Institute of Chemical Research, Shanghai, China) as the sole N source. This 15N-labeled urea was split-applied: 50% as a basal dose at sowing and 50% top-dressed at the elongating stage. In subsequent growing seasons, conventional unlabeled N fertilizer was applied at the corresponding rates.
The first wheat and maize and second wheat crops were planted on 19 October 2016, 15 June 2017 and 24 October 2017, and harvested on 6 June 2017, 2 October 2017 and 3 June 2018, respectively. For wheat, 25 seeds were sown per microplot and were subsequently thinned to 18 robust plants. For maize, three seeds were sown per microplot and thinned to one plant. Regular weeding and irrigation were performed as needed throughout the growth seasons.

2.3. Soil and Plant Sample Collection, Preparation and Chemical Analysis

Soil and plant samples were immediately collected upon harvest. Soil was sampled at 20 cm intervals to a depth of 100 cm using a 2.8 cm inner-diameter auger. The samples were then passed through a 2 mm sieve, and subsamples were air-dried for total N and 15N enrichment analysis. The aboveground biomass from each cylinder was harvested, oven-dried at 80 °C to constant weight and used to determine grain yield and straw (aboveground part excluding grains) biomass. Subsamples of grain and straw were then ground for subsequent analysis.
The total N in the soil and plant samples was determined using the Kjeldahl method. When determining total N using the Kjeldahl method, calibration was performed using an ammonium sulfate standard (purity ≥ 99.9%), and recovery tests were conducted using certified reference materials (GBW07493 for soil and GBW10046 for plant samples). The recovery range for the soil samples was 97% to 103% and for the plant samples it was 96% to 102%. The method detection limit (MDL) for total N was 0.01 mg N g−1 for the soil and 0.008 mg N g−1 for the plant samples, respectively. Inorganic N (NO3-N + NH4+-N) was extracted with 1 M KCl and quantified by a continuous flow analyzer (AA3, Bran + Luebbe, Norderstedt, Germany). For inorganic N measurements on the continuous flow analyzer, a five-point standard curve (0.1–10 mg N L−1) was prepared from KNO3 and (NH4)2SO4 (R2 > 0.999). The recovery of spiked inorganic N was 96–105%, and the detection limit was 0.05 mg N L−1. Fixed N in soil was determined via the Silva–Bremner method [29]. The 15N enrichment of inorganic N and fixed N pools was assessed using a diffusion technique [30]. Finally, the 15N enrichment and natural abundance in all samples were measured with an isotope mass spectrometer at the Stable Isotope Facility, University of California at Davis, USA. All sample batches included reagent blanks and duplicate analyses (one duplicate per ten samples) to ensure data quality.

2.4. Calculations

The amounts of soil N, plant N accumulation, inorganic N or fixed N and N derived from 15N-labeled fertilizer (Ndff) were calculated using the following equations:
Ndff = Cs × Es/Ef
Ndfs (mg pot−1) = Total N accumulation − Ndffp (mg pot−1)
Soil organic 15N (mg pot−1) = Total 15N residual in soil − inorganic 15N − fixed 15N
where Cs is the N content of a specific N pool (mg pot−1), Es is 15N at% excess of a specific N pool (soil total N, plant N, inorganic N, or fixed N), and Ef is 15N enrichment of the labeled fertilizer (20.01 atom%). Ndffp (mg pot−1) denotes the portion of aboveground N uptake (Nab) derived from 15N-labeled fertilizer, and Ndfs (mg pot−1) denotes the portion of Nab derived from the soil.
In addition, aboveground 15N-use efficiency (15NUE), soil residual 15N and unaccounted-for 15N were calculated as follows:
15NUE (%) = (Ndffp/Mf) × 100
Soil residual 15N (%) = (Ndffs/Mf) × 100
Unaccounted-for 15N (%) = 100 − 15NUE − Soil residual 15N
where Ndffp is the total aboveground biomass N accumulation (NdffTab) derived from 15N-labeled fertilizer, e.g., the grain N (Ndffg) and straw N (NdffTab-g) (mg pot−1), Ndffs is soil N derived from 15N-labeled fertilizer (mg pot−1), and Mf is the 15N-labeled fertilizer N application rate (mg pot−1). The percentage of unaccounted-for 15N was calculated based on the residual 15N at 0–100 cm soil depth, taking into account 15N gaseous losses and the amount of 15N remaining below the sampling depth.

2.5. Statistical Analysis

The data were presented as means ± SE (n = 3). Two-way ANOVA was employed to examine the effects of soil fertility, N application rates and their interaction on crop yield, plant N accumulation, and soil residual N. Duncan’s multiple range test was used to assess differences when treatment effects were found to be significant (p < 0.05). All statistical analyses were performed in SPSS 26.0. A linear–plateau regression model was used to analyze the relationships between SOM and 15NUE in SPSS 26.0 (IBM Corp., Armonk, NY, USA).

3. Results

3.1. Grain Yield Response to Nitrogen Application and Soil Fertility

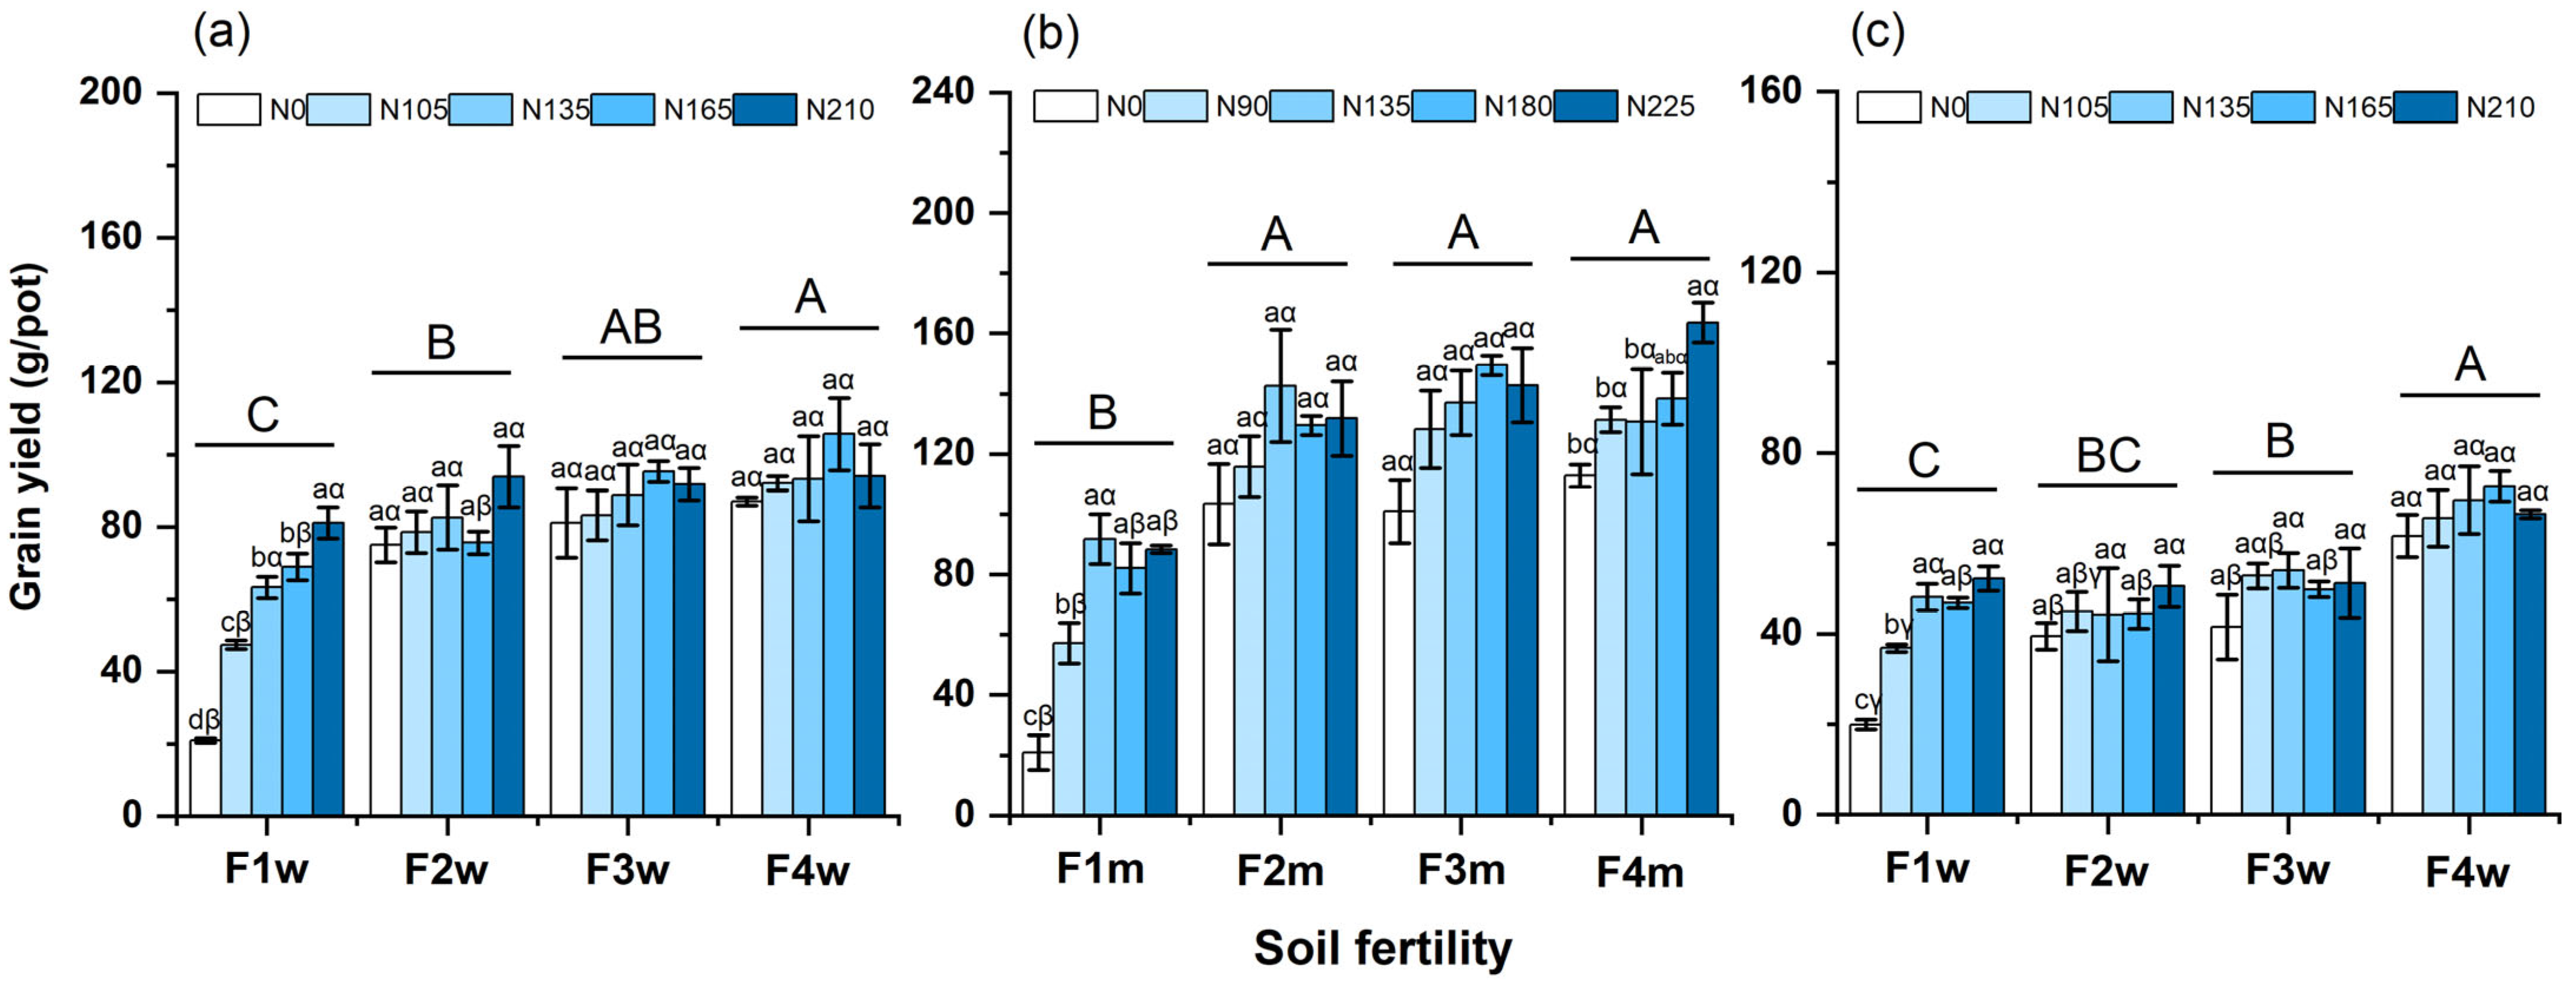
Grain yields varied substantially across the three consecutive cropping seasons, ranging from 21 to 106 g/pot for the first wheat season (Figure 1a), 21 to 164 g/pot for maize (Figure 1b), and 20 to 73 g/pot for the second wheat season (Figure 1c). In low-fertility soil (F1), N application significantly increased grain yields relative to the N0 treatment, with average increases of 85–287% for wheat and 174–340% for maize across the three cropping seasons. In contrast, yield differences among N rates in higher fertility soils (F2–F4) were generally not significant, except for maize in F4 soil (Figure 1b). A diminishing response to increasing N rates was observed across all fertility levels (Figure 1). Crop yields under equivalent N rates increased significantly with elevated soil fertility levels. In the first wheat season, the mean grain yield was 67.7% and 16.4% higher in the F4 soil than in the F1 and F2 soils, respectively (Figure 1a). In the subsequent second and third crop seasons, the mean grain yield in F4 soil remained significantly greater, surpassing the other three fertility levels by 2.8–99.0% in maize and 31.7–61.0% in the second wheat crop, respectively (Figure 1b,c). No significant yield differences were observed among the F2–F4 soils with high fertility levels.

3.2. Nitrogen Accumulation Dynamics Across Cropping Seasons

For the first wheat season, total N accumulation in the aboveground biomass (Nab, sum of N in grain and straw) ranged from 0.29 g/pot to 2.08 g/pot and was strongly influenced by both soil fertility level and N rate (Table 1). Compared to the N0 treatment, fertilizer N application significantly increased Nab in only the F1 (by 62–269%) and F3 (by 20–63%) soils. Soil-derived N (Ndfs) constituted the majority (57–82%) of Nab, ranging from 0.28 to 1.50 g/pot). The Ndfs was primarily increased with improving soil fertility and showed little response to N rate. In contrast, fertilizer-derived N (NdffTab) represented 18–43% of Nab (0.19–0.64 g/pot) and increased in response to both higher soil fertility and greater N application rates. The proportion of Nab derived from fertilizer (NdffTab) was also affected by soil fertility: it averaged 40% (range: 35–43%) in the F1 low-fertility soil, compared to an average of 25% (range: 18–33%) in the higher fertility F2–F4 soils. The grain accumulated a higher amount of Ndffg (0.17–0.50 g/pot) than the straw (NdffTab-g, 0.02–0.16 g/pot).
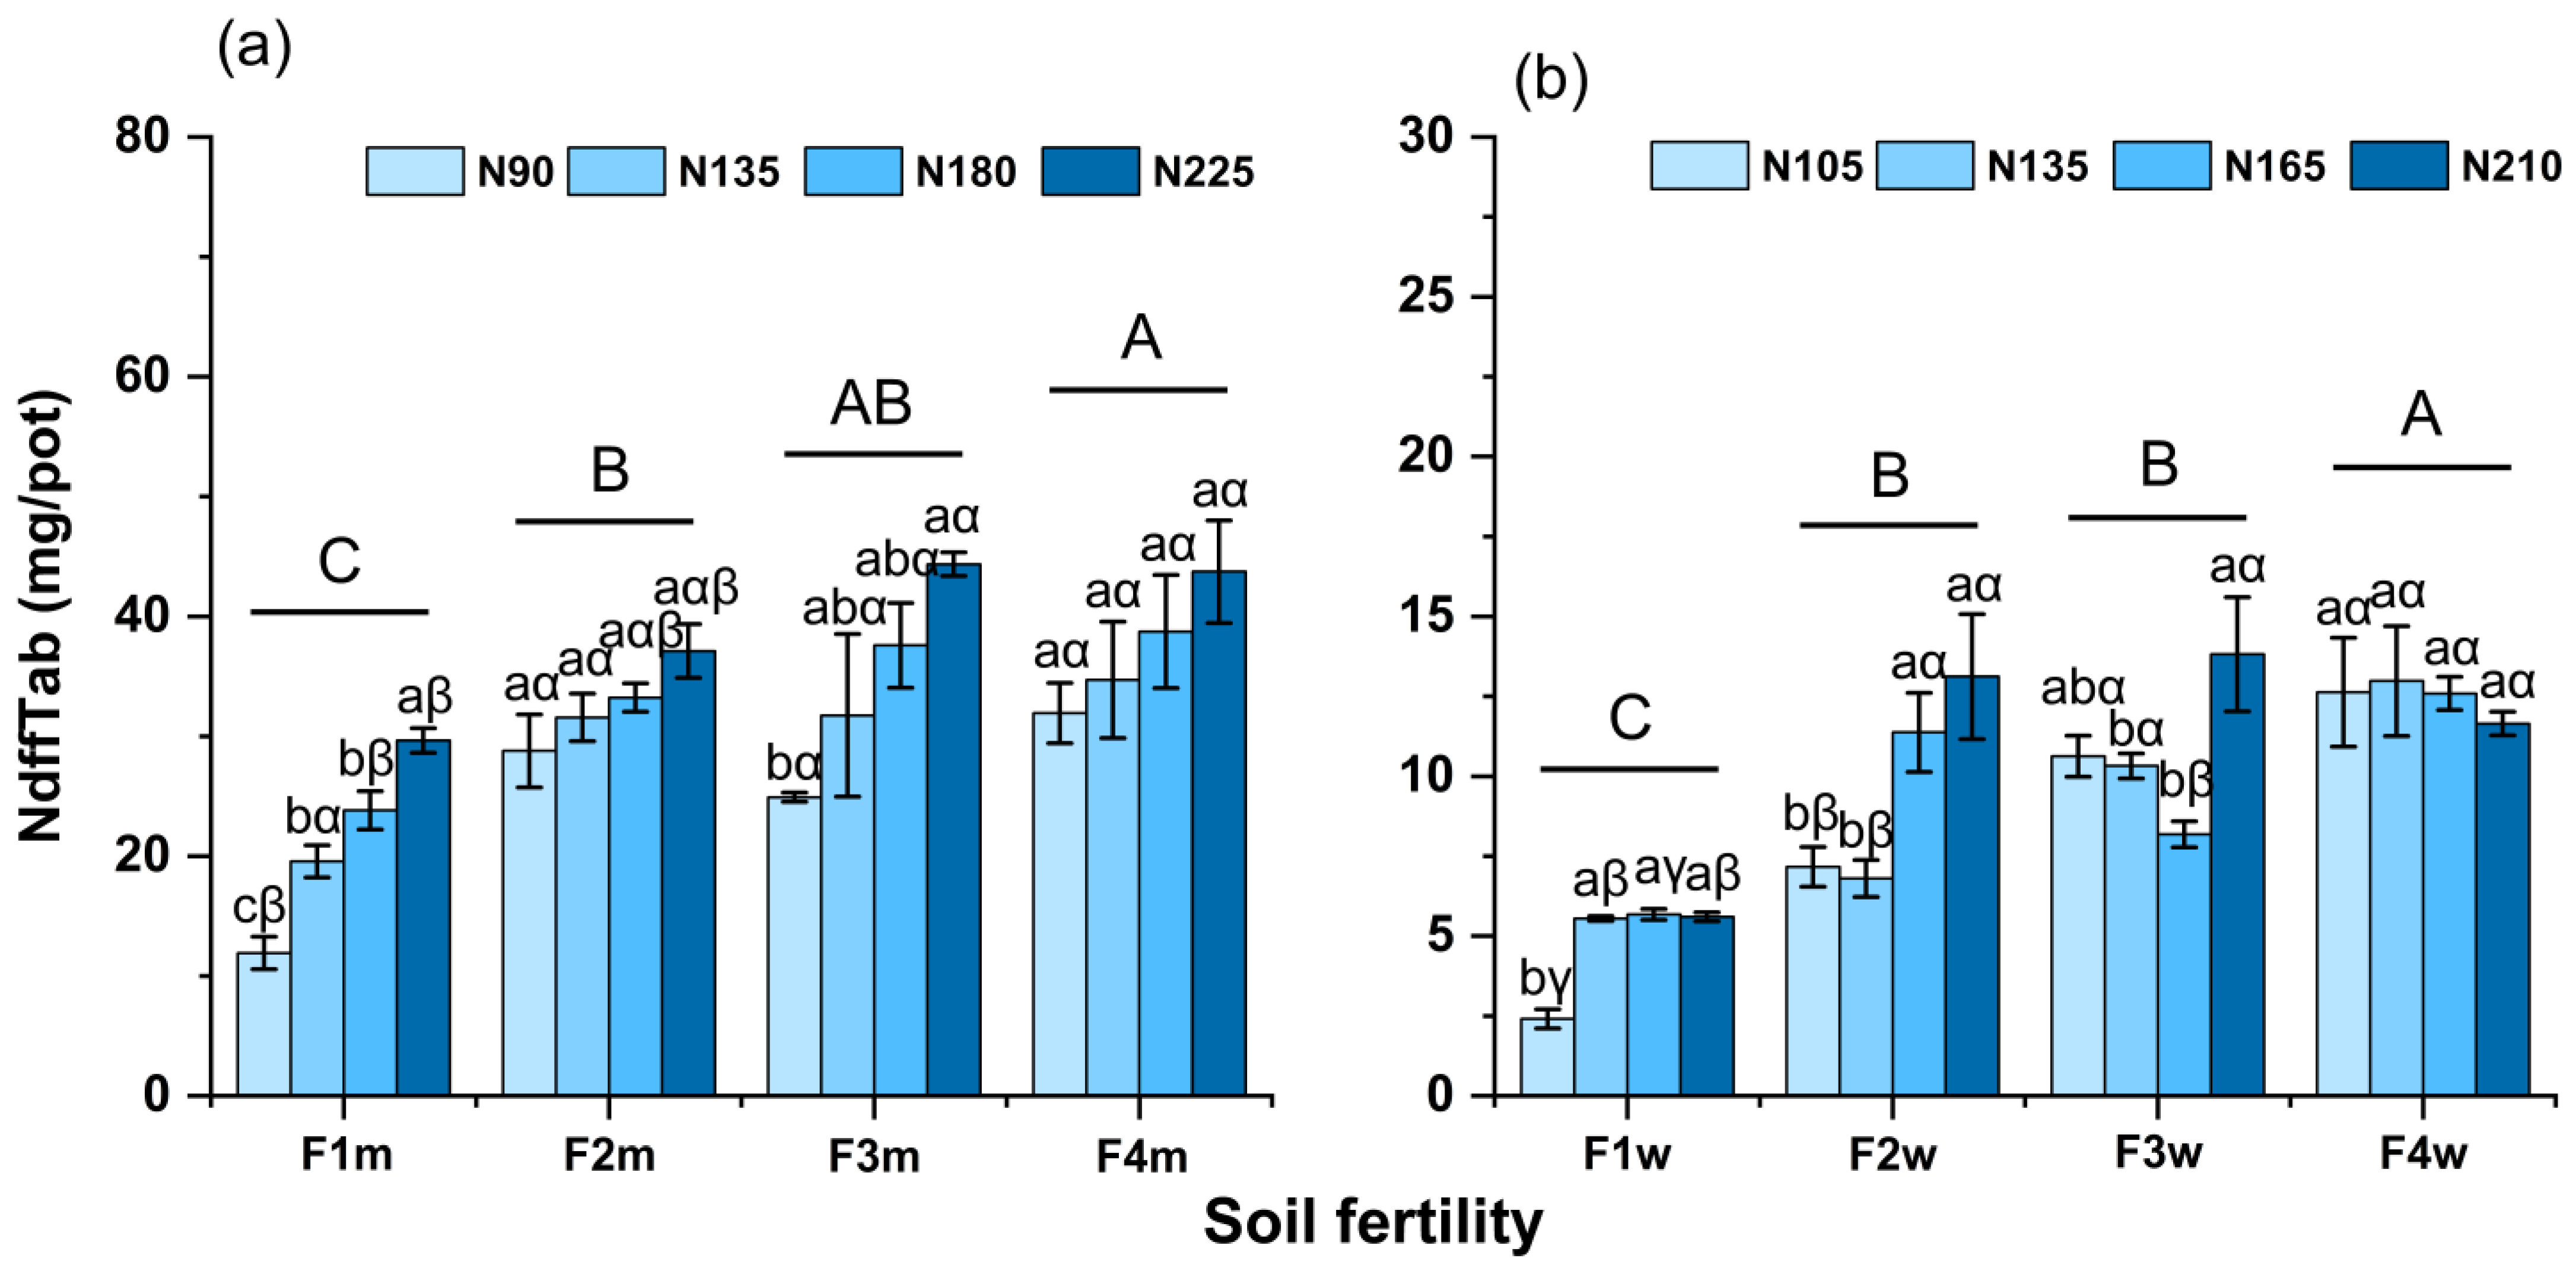
The recovery of fertilizer-derived N (NdffTab) and its use efficiency (15NUE) decreased dramatically in the subsequent crops compared to the first wheat season. During the maize season, NdffTab declined to 11.9–44.4 mg/pot, corresponding to a 15NUE of only 1.6–4.3% (Figure 2a). In the second wheat season, NdffTab further decreased to 2.41–13.8 mg/pot, with a 15NUE of just 0.3–1.7% (Figure 2b). These results showed that both Nab and NdffTab are significantly influenced by the main effects of soil fertility (F) and N application rate, whereas Ndfs is influenced only by soil fertility. Furthermore, no significant interaction was observed for any of the aboveground N uptake parameters between soil fertility level and N application rate. Despite the overall low 15NUE, NdffTab in the subsequent crop still depended on soil fertility and N application rate (Figure 2).

3.3. Residual 15N Distribution After Crop Harvest at 0–20 cm Soil Depth

3.3.1. Residual 15N Distribution After Wheat Harvest

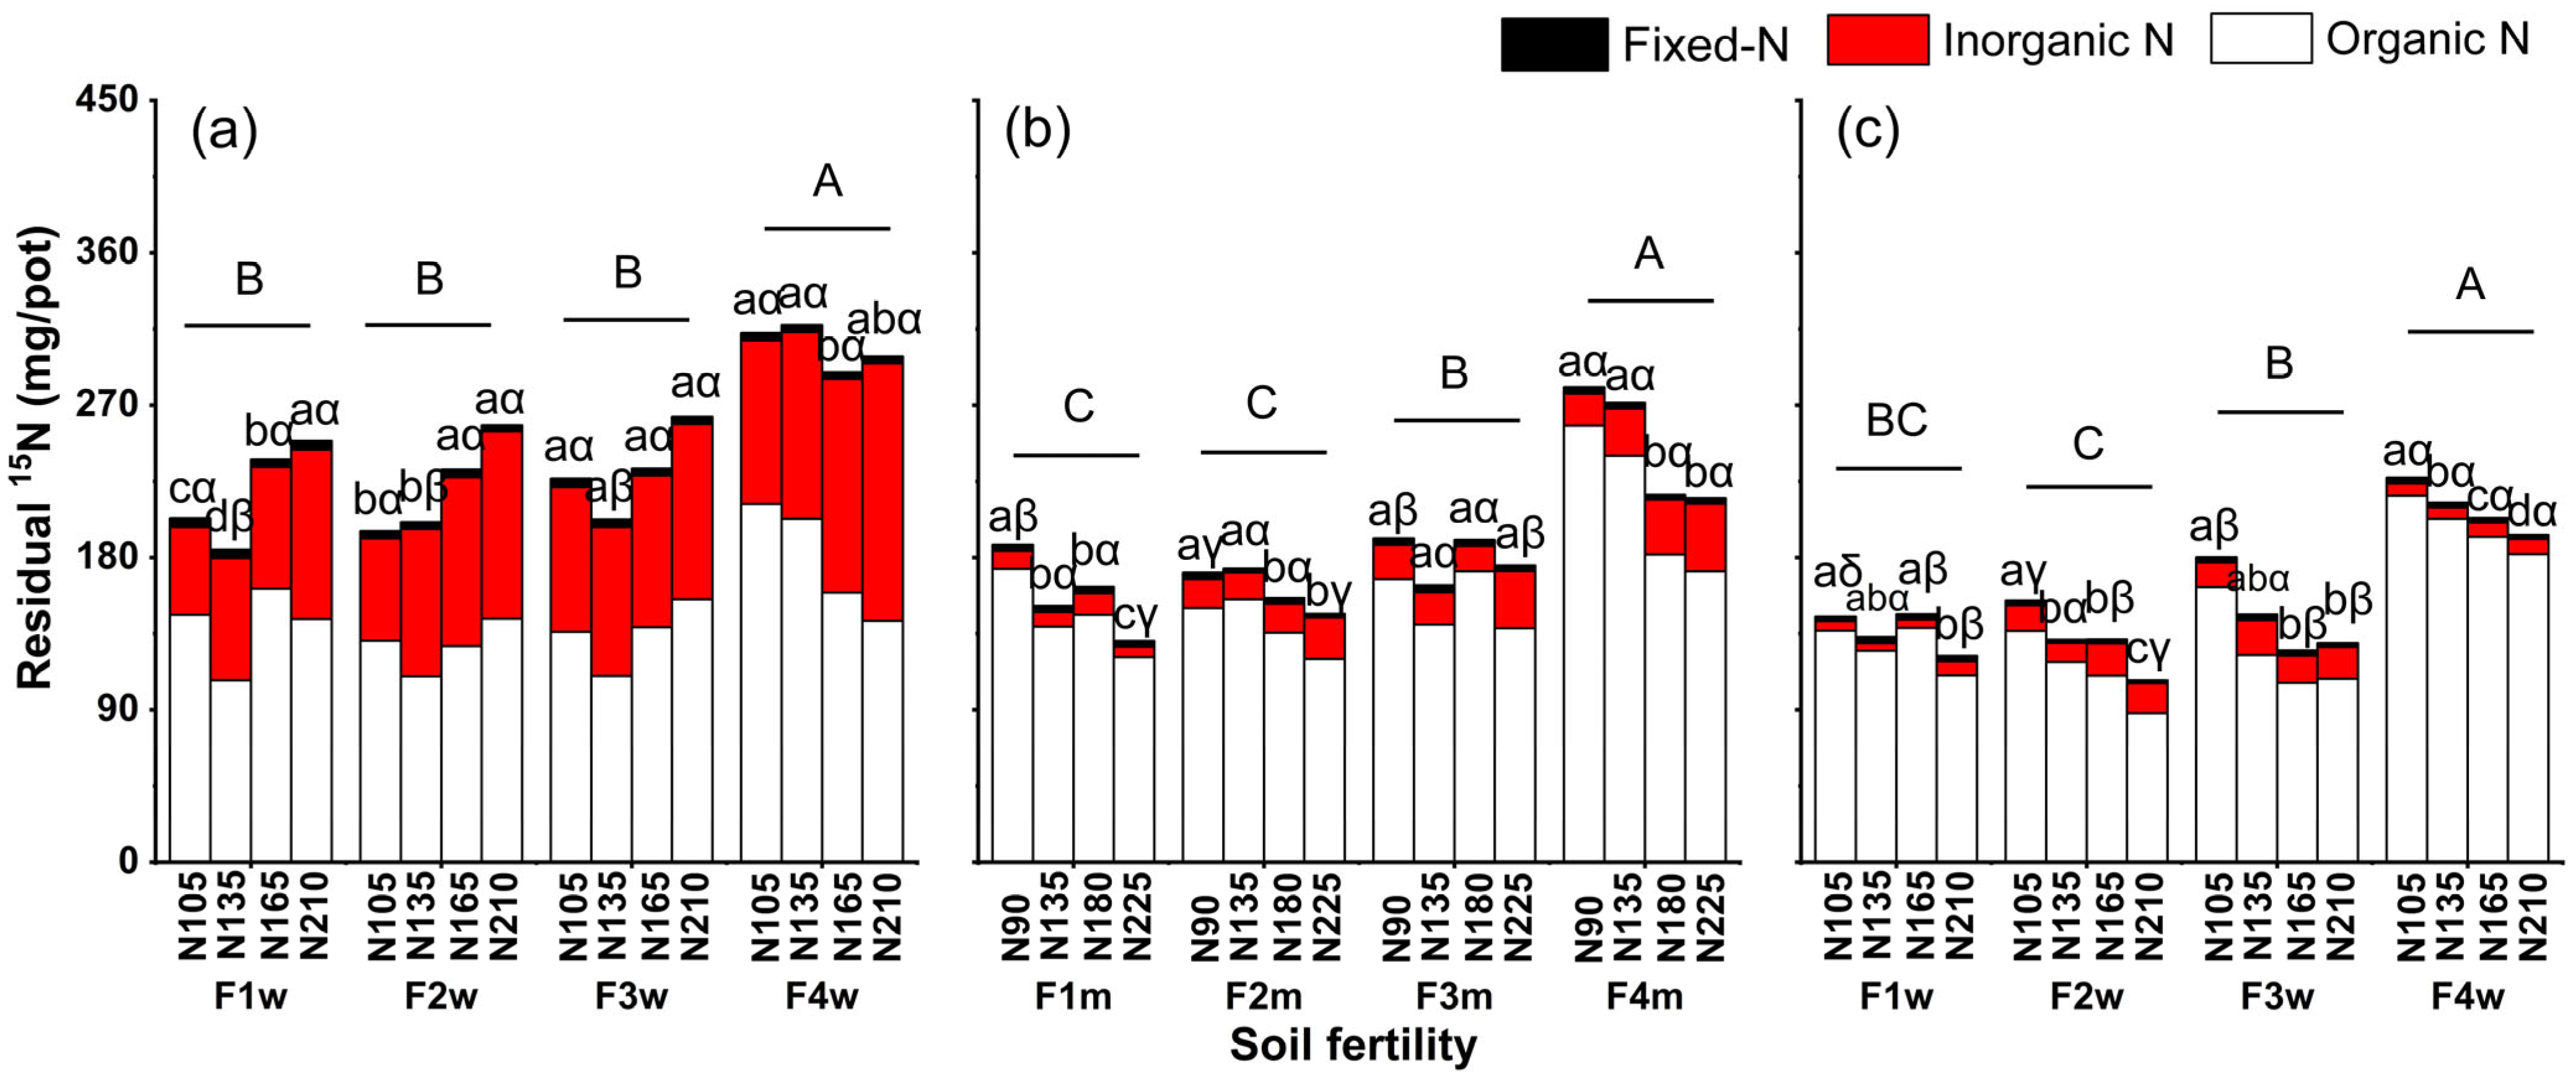
After the harvest of the first wheat crop, the residual fertilizer-derived 15N (Ndffs) at 0–20 cm soil depth ranged from 184.65 to 317.38 mg/pot, for 16.7 to 42.1% of the initially applied 15N (Figure 3a). Organic N formed the largest pool of this residual 15N, constituting 47.7% to 71.9% of the total N (107.4–211.6 mg/pot). Inorganic N (NH4+-N and NO3-N) represented an intermediate proportion, accounting for 25.6% to 50.9% (51.92–152.08 mg/pot), while the fixed N comprised the smallest fraction at only 1.3% to 2.7% (3.54–5.28 mg/pot). The high-fertility F4w soil retained significantly more residual 15N than the F1, F2 and F3 soils, exceeding them by 39.2%, 37.4% and 31.7%, respectively (Figure 3a).

3.3.2. Residual 15N Distribution After Subsequent Maize and Wheat Harvest

Following the harvest of the maize and wheat crops (Figure 3b,c), the residual fertilizer-derived 15N (Ndffs) at 0–20 cm soil depth decreased progressively to 130.63 to 280.62 mg/pot (8.8–37.8% of applied N, Figure 3b) and 107.38 to 227.21 mg/pot (7.2–30.6%, Figure 3c), respectively. Throughout this decrease, organic N remained the dominant pool, constituting 78.9–92.7% after maize cropping and 82.0–95.5% after wheat cropping. In contrast, inorganic 15N represented an intermediate proportion (5.7–19.2% after maize and 3.8–14.5% after wheat), while fixed 15N was minimal (1.2–2.7% and 1.3–2.6%, respectively). Note that the absolute amounts for each pool are detailed in Figure 3.
The amounts of residual fertilizer-derived 15N at 0–20 cm soil depth were significantly influenced by both soil fertility and N application rate, increasing with higher fertility but decreasing with higher N rates. Following the maize and wheat harvests, the Ndffs in the high-fertility F4 soil was 36.6–55.7% and 43.9–59.3% greater, respectively, than in the F1–F3 soils (Figure 3b,c). After crop 15N uptake, inorganic 15N substantially reduced, with only 6.07–39.84 mg/pot remaining post-maize. The vast majority of the residual 15N was present in the organic N pool (Figure 3b).

3.4. Fate of Fertilizer 15N Across Three Crop Seasons

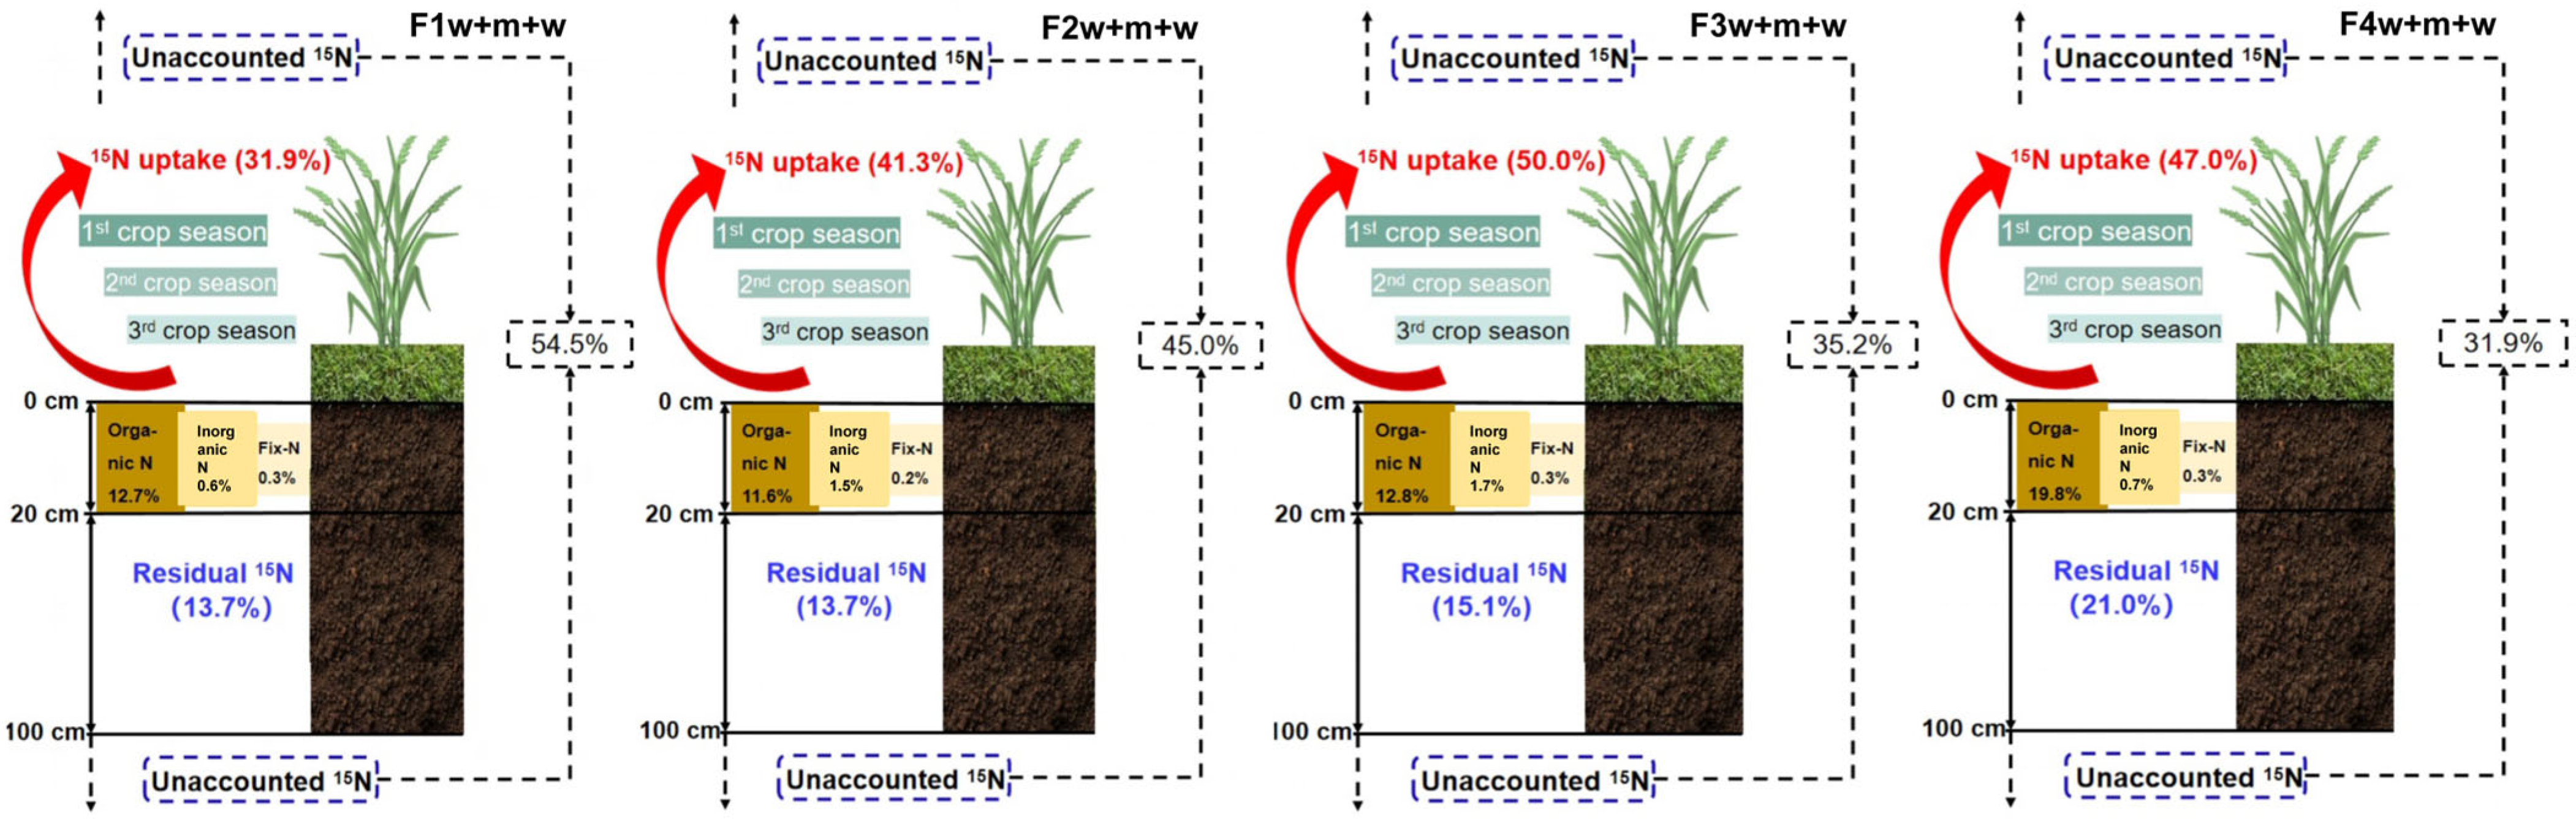
To evaluate the influence of soil fertility on the fate of applied 15N, we quantified its distribution (Figure 4). Of the total applied 15N, 31.9–50.0% was recovered in the aboveground biomass (NdffTab), 13.7–21.0% remained as residual 15N in the 0–100 cm soil profile (Ndffs), while 31.9–54.5% was unaccounted for. Within the 0–20 cm soil depth, the residual 15N consisted primarily of organic N (11.6–19.8% of applied N), with minor fractions as inorganic N (0.6–1.7%) and fixed N (0.2–0.3%). The relationship between SOM and total 15NUE after three cropping seasons was described by a linear–plateau model (Figure 5). The model revealed that 15NUE peaked at 45.2–54.3% across fertility levels when SOM concentrations reached a threshold of 18.6–21.3 g kg−1. Furthermore, the highest 15NUE was consistently achieved at the lowest N rate (105 kg ha−1) under the higher SOM content at 21.3 g kg−1 (Figure 5).

4. Discussion

4.1. Crop Yield Response to Nitrogen Application and Soil Fertility

Grain yield analysis revealed distinct responses to N application across fertility gradients. In low-fertility soil (F1), both winter wheat and summer maize exhibited significant yield increases with higher N application rates (p < 0.05). However, across all three crop seasons, maximum mean yields were consistently achieved in the high-fertility F4 soil, regardless of N rate (Figure 1). The F1 fertility soil, having received long-term inorganic P and K fertilization without N, demonstrated how nutrient imbalance could lead to progressive soil fertility decline and yield limitation [31,32]. Our results indicate that while N fertilization can partially compensate for low inherent fertility, optimal yields require both adequate N inputs and high soil fertility status (Figure 1).
The yield advantages observed in F4 soil are likely associated with the benefits of balanced fertilization management (Figure 1). Although we did not directly measure microbial or root parameters, previous studies conducted under similar fertilization regimes have reported increased soil microbial biomass and activity under combined organic and inorganic fertilization treatments [26,33], as well as improved root development [34,35]. Theoretically, these changes—enhanced microbial activity and root growth—may promote N mineralization and crop uptake, thereby providing a plausible explanation for the higher yields and N recovery rates observed in highly fertile soils. Moreover, long-term experiments have confirmed that such management practices not only improve inherent soil productivity [36] but also enhance yield stability across growing seasons [37].
Notably, crop responses to fertility gradients differed significantly (p < 0.01). Across the same range of soil fertility gradients, from F1 to F4, the maximum increase in maize grain yield was 99%, which was higher than the maximum increase in wheat grain yield (ranging from 61 to 68%) (Figure 1). This differential response appears to be driven by several key factors (1) temperature effects: winter wheat grows during cooler seasons (mean temperature: 5–8 °C), which limits microbial N mineralization [32,38,39]; (2) microbial activity: the warmer maize growing season (mean temperature: 22–26 °C) enhances organic matter decomposition and nutrient turnover rates [40,41,42]; and (3) water availability: maize cultivation, coinciding with the peak rainy season, receives 70–80% of the annual precipitation [39]. These factors collectively explain why even moderate-fertility soils (F2–F3) supported relatively high maize yields (Figure 1b), whereas wheat yields demonstrated a stronger dependence on maximum soil fertility (F4).

4.2. Nitrogen Uptake Dynamics in Relation to Soil Fertility and Fertilization Rates

Our results confirmed that both soil fertility level and N application rate significantly influenced N uptake (Table 1, Figure 2). The amount of 15N fertilizer-derived N in the aboveground biomass (NdffTab) exhibited a positive relationship with both soil fertility level (F) and N application rate (N) across all three cropping seasons (Table 1, Figure 2), mirroring the observed patterns in crop yield responses. The key findings from the first winter wheat season revealed several important patterns as follows. the NdffTab showed significant increases with both improving soil fertility and elevated N rates (Table 1). These responses can be attributed to enhanced aboveground biomass production and improved root development [22,34,43].
The proportion of soil-derived N (Ndfs) to total aboveground biomass N accumulation (Nab) revealed a negative correlation with N application rates and showed increased contribution with soil fertility improvement. Conversely, the percentage of NdffTab to Nab decreased with higher soil fertility. In high-fertility systems, organic N exists primarily in readily mineralizable forms, and both soil N nutrient supply capacity and microbial activity are enhanced [44,45]. These patterns indicate that in high-fertility soils, crop N uptake primarily depends on the soil N supply rather than fertilizer inputs [27,41,46].
Our findings demonstrate that soil fertility significantly influenced N dynamics through several key mechanisms as follows. In a previous study, we found that in highly fertile soils, the organic N fraction consists primarily of amino acid N; this fraction facilitates N release and availability [47], thereby enhancing the synchronization between crop nitrogen demand and soil nitrogen supply [48,49,50]. This enhanced nutrient availability persisted across multiple growing seasons [51], collectively explaining the residual effects of fertilizer 15N observed in the subsequent two crop seasons (Figure 3). Regarding N partitioning patterns, grain accounted for 69.0–89.5% of NdffTab, with a higher allocation percentage occurring in low-fertility soils (Table 1). These findings align with those of Xu et al. [52], demonstrating that a greater absolute 15N accumulation in grain (mg/pot) reflects biomass allocation patterns rather than necessarily indicating differences in N concentration (Ndff, %). This pattern suggests that crops growing in low-fertility soils prioritize N allocation to reproductive organs, potentially as an adaptive strategy to ensure reproductive success under nutrient-limited conditions.

4.3. Effects of Fertilizer N Application on Soil–Plant Systems

The fate of applied N fertilizer in soil–plant systems is primarily determined by the amount and forms of residual 15N, particularly in the root zone (0–20 cm depth), which represents the primary reservoir of residual fertilizer N after crop harvest [20]. Our study revealed three key patterns in N dynamics as follows. First, residual 15N distribution after the first wheat season showed distinct fertility-dependent patterns. The high-fertility F4 soil retained 31.7–39.2% more residual 15N in the 0–20 cm soil depth compared to that of lower fertility soils (Figure 3a). Residual 15N existed primarily in organic forms (57.8–63.9%), followed by inorganic and fixed forms (Figure 3a), consistent with previous field studies [51,53]. Second, soil fertility significantly influenced N transformations. Organic N serves as the dominant soil N pool, undergoing continuous microbial mineralization to inorganic N. Higher fertility soils exhibited enhanced microbial activity that accelerated organic N mineralization [42,53] and consequently greater inorganic N release (Figure 3). Third, regarding temporal dynamics across cropping seasons, residual 15N declined progressively with successive crops, particularly for inorganic N (Figure 3). This pattern reflected the significant contribution of the first-crop residual 15N to subsequent crops, with more efficient inorganic N mobilization to root zones in high-fertility soils (Figure 3b,c). Conversely, residual 15N showed a potential downward migration below 20 cm depth in low-fertility soils [51,53]. Nevertheless, several methodological considerations should be considered. The shift from 15N-labeled to ordinary urea application in subsequent seasons might have introduced a dilution effect on the residual N pool. Fixed N showed remarkable stability across three cropping seasons, despite its recognized role as a slow-release N source [22,25], while NH4+ retention in mineral lattices could be particularly important for N supply in low-fertility soils.

4.4. Fate and Efficiency of Fertilizer N in Soil–Plant Systems

The fate of applied fertilizer N can be categorized into three primary pathways: (1) recovery in crops (NUE), (2) soil residual retention, and (3) potential environmental loss [54]. The NUE is influenced by fertilization practices, soil nutrient status and climatic conditions [14]. Previous studies report a wide range of 15N recovery efficiencies (8–65%) in the first cropping season, depending on management practices and site-specific factors [28,52,53]. Typically, approximately 50% of applied 15N remains in the soil after crop harvest, while less than 10% is recovered by subsequent crops, regardless of crop type or location [55]. In our study, the maximum 15NUE for the second and third crops was only 4.3% and 1.7%, respectively (Figure 2). This was due not only to the migration and transformation of the 15N applied in the first crop within the soil during subsequent seasons, but also to the fact that, starting with the second crop, we applied unlabeled N fertilizer. The dilution effect of the unlabeled fertilizer also led to reduced uptake of 15N by subsequent crops.
Our three-season 15N tracer study demonstrated several key findings. 15NUE ranged between 25.7 and 47.2% in the first crop season (Table 1), while only 1.9–6.0% of the residual 15N was recovered in the subsequent two crop seasons (Figure 2). Meanwhile, 7.2–30.6% of the applied 15N remained as soil residual N, and 21.2–58.9% was unaccounted-for 15N from the system (Figure 3 and Figure 4). The 15N fate varied with soil fertility level (Figure 4). In the low-fertility F1w + m + w soil, the distribution pattern was: unaccounted-for 15N (54.5%) > crop uptake (31.9%) > soil residual (13.7%). In the moderate-fertility F2w + m + w soil, the pattern was: unaccounted-for 15N (45.0%) ≈ crop uptake (41.3%) > soil residual (13.7%). In contrast, both the F3w + m + w and F4w + m + w soils displayed: crop uptake (47.0–50.0%) > unaccounted losses (31.9–35.2%) > residual (15.1–21.0%). These findings confirm that improving soil fertility enhances 15N recovery efficiency and residual 15N retention while decreasing potential N losses [20].
The results from this study also revealed quantitative relationships between 15NUE, soil fertility, and N application rates. While both N application rate and soil fertility significantly affected 15NUE, their interactions showed complex patterns [18,23]. The linear–plateau model best described the relationship between 15NUE and SOM, indicating that the maximum 15NUE of 54.3% was achieved at 105 kg N ha−1 when SOM reached 21.3 g kg−1. When the SOM content is low, it is necessary to increase the amount of N fertilizer applied to achieve a higher 15NUE (Figure 5). These findings have practical implications: (1) higher fertility soils are necessary to achieve both high yield and NUE; (2) lower N inputs suffice for optimal NUE in higher fertility soils, minimizing potential N losses; and (3) soil fertility improvement represents a sustainable strategy to enhance NUE and reduce environmental risks. These results provide quantitative evidence supporting the importance of enhancing soil fertility, optimizing NUE, and implementing precision N management for sustainable agricultural development.

5. Conclusions

Our three-season 15N tracing study conducted in a winter wheat–summer maize cropping system confirms that high soil fertility, underpinned by SOM, is the cornerstone of efficient N management in intensive cropping systems. We demonstrated that fertile soils not only enhance grain yield and 15N recovery efficiency but also fundamentally alter the fate of fertilizer N by shifting its residual pool from transient mineral forms toward stable organic sequestration, thereby reducing potential environmental losses. Crucially, we quantified a definitive linear–plateau relationship between SOM and cumulative 15NUE, identifying a critical SOM threshold of 21.30 g kg−1 for maximizing fertilizer efficiency. These findings provide quantitative evidence for sustainable agriculture: increasing SOM content is a key requirement for achieving high yields and NUE while reducing unaccounted-for N, offering a pathway to mitigate potential N losses in cereal production systems.

Supplementary Materials

The following supporting information can be downloaded at https://www.mdpi.com/article/10.3390/agronomy16100983/s1, Table S1: Application rates of N, P and K (kg N ha−1 yr−1) under different fertilization management measures; Table S2: Basic chemical properties of the tested soils at 0–20 cm depth.

Author Contributions

L.L.: Data curation, Data collection, Investigation, Software, Writing—original draft. S.Z.: Conceptualization, Funding acquisition, Writing—review and editing. X.Y.: Conceptualization, Methodology, Writing—review and editing. Y.D.: Resources. X.H.: Writing—review and editing. M.X.: Resources, Project administration. All authors have read and agreed to the published version of the manuscript.

Funding

This research was funded by Fundamental Research Program in Natural Sciences—Shaanxi Provincial Field Station of Scientific Observation and Research on Soil Quality of Loess in Yangling (2025JC-YWGCZ-04) and the Fundamental Research Program of Shanxi Province, grant number 202303021222273.

Data Availability Statement

All data generated or analyzed during this study are included in this article.

Acknowledgments

We sincerely appreciate the support provided by the Shaanxi Provincial Field Station of Scientific Observation and Research on Soil Quality of Loess and Beijing Changping Soil Quality National Observation and Research Station. Meanwhile, we extend our sincere gratitude to all staff involved in the operation and management of the field experiments.

Conflicts of Interest

The authors declare that they have no known competing commercial interests or personal relationships that could have appeared to influence the work reported in this paper.

References

  1. Heisey, P.W. Crop Yields and Global Food Security: Will Yield Increase Continue to Feed the World? Am. J. Agr. Econ. 2015, 97, 661–663. [Google Scholar] [CrossRef] [Scilit]
  2. Nelson, G.C.; Rosegrant, M.W.; Palazzo, A.; Gray, I.; Ingerstoll, C.; Robertson, R. Food Security, Farming, and Climate Change to 2050: Scenarios, Results, Policy Options; Research Monograph; International Food Policy Research Institute (IFPRI): Washington, DC, USA, 2010. [Google Scholar] [CrossRef] [Scilit]
  3. Li, J.; Lei, H. Tracking the spatio-temporal change of planting area of winter wheat-summer maize cropping system in the North China Plain during 2001–2018. Comput. Electron. Agric. 2021, 187, 106222. [Google Scholar] [CrossRef] [Scilit]
  4. Zhang, X.; Fang, Q.; Zhang, T.; Ma, W.; Velthof, G.L.; Hou, Y.; Oenema, O.; Zhang, F. Benefits and trade-offs of replacing synthetic fertilizers by animal manures in crop production in China: A meta-analysis. Glob. Change Biol. 2020, 26, 888–900. [Google Scholar] [CrossRef] [Scilit]
  5. FAO. FAOSTAT. Statistics Division of the Food and Agriculture Organization of the United Nations. 2021. Available online: http://www.fao.org/faostat/en/#home (accessed on 9 April 2026).
  6. You, L.; Ros, G.H.; Chen, Y.; Shao, Q.; Young, M.D.; Zhang, F.; Vries, W. Global mean nitrogen recovery efficiency in croplands can be enhanced by optimal nutrient, crop and soil management practices. Nat. Commun. 2023, 14, 5747. [Google Scholar] [CrossRef] [Scilit] [PubMed]
  7. Duan, J.; Liu, H.; Zhang, X.; Ren, C.; Wang, C.; Cheng, L.; Xu, J.; Gu, B. Agricultural management practices in China enhance nitrogen sustainability and benefit human health. Nat. Food. 2024, 5, 378–389. [Google Scholar] [CrossRef] [Scilit] [PubMed]
  8. Zhang, C.; Ju, X.; Powlson, D.; Oenema, O.; Smith, P. Nitrogen surplus benchmarks for controlling N pollution in the main cropping systems of China. Environ. Sci. Technol. 2019, 53, 6678–6687. [Google Scholar] [CrossRef] [Scilit]
  9. Gu, B.; Zhang, X.; Lam, S.K.; Yu, Y.; van Grinsven, H.J.M.; Zhang, S.; Wang, X.; Bodirsky, B.L.; Wang, S.; Duan, J.; et al. Cost-effective mitigation of nitrogen pollution from global croplands. Nature 2023, 613, 77–84. [Google Scholar] [CrossRef] [Scilit]
  10. Dăncilă, A.M.; Modrogan, C.; Orbuleț, O.D. Effects of Nitrogen Fertilizer Application on N2O Emissions from Rice Cultivation: A Review. Environments 2025, 12, 383. [Google Scholar] [CrossRef] [Scilit]
  11. Liu, L.; Xu, W.; Lu, X.; Zhong, B.; Guo, Y.; Lu, X.; Zhao, Y.; He, W.; Wang, S.; Zhang, X.; et al. Exploring global changes in agricultural ammonia emissions and their contribution to nitrogen deposition since 1980. Proc. Natl. Acad. Sci. USA 2022, 119, e2121998119. [Google Scholar] [CrossRef] [Scilit]
  12. Feng, R.; Li, Z. Current investigations on global N2O emissions and reductions: Prospect and outlook. Environ. Pollut. 2023, 338, 122664. [Google Scholar] [CrossRef] [Scilit]
  13. Quan, Z.; Gurmesa, G.A.; Huang, B.; Li, X.; Su, C.; Wang, Y.; Chen, X.; Fang, Y. In Situ 15N tracer quantification of fertilizer- and soil-derived NH3, NO, and N2O emissions in maize fields. Agric. Ecosyst. Environ. 2026, 400, 110202. [Google Scholar] [CrossRef] [Scilit]
  14. Xu, X.; Zhang, X.; Zou, Y.; Chen, T.; Zhan, H.; Cheng, L.; Winwarter, W.F.; Zhang, S.; Vitousek, P.M.; Vries, W.D.; et al. Integrated carbon and nitrogen management for cost-effective environmental policies in China. Science 2025, 388, 1098–1103. [Google Scholar] [CrossRef] [Scilit]
  15. Zhu, X.; Ros, G.H.; Xu, M.; Xu, D.; Cai, Z.; Sun, N.; Duan, Y.; Vries, W. Long-term impacts of mineral and organic fertilizer inputs on nitrogen use efficiency for different cropping systems and site conditions in Southern China. Eur. J. Agron. 2023, 146, 126797. [Google Scholar] [CrossRef] [Scilit]
  16. Bhatt, R.; Kunal; Moulick, D.; Bárek, V.; Brestic, M.; Gaber, A.; Skalicky, M.; Hossain, A. Sustainable Strategies to Limit Nitrogen Loss in Agriculture through Improving Its Use Efficiency—Aiming to Reduce Environmental Pollution. J. Agric. Food Res. 2025, 22, 101957. [Google Scholar] [CrossRef] [Scilit]
  17. Sun, Z.; Zhu, B. Rethinking discrepancies between difference and 15N methods for estimating fertilizer nitrogen recovery. Biol. Fertil. Soils 2022, 58, 855–869. [Google Scholar] [CrossRef] [Scilit]
  18. Quan, Z.; Zhang, X.; Davidson, E.A.; Zhu, F.; Li, S.; Zhao, X.; Chen, X.; Zhang, L.; He, J.; Wei, W.; et al. Fates and use efficiency of nitrogen fertilizer in maize cropping systems and their responses to technologies and management practices: A global analysis on field 15N tracer studies. Earth’s Future 2021, 9, e2020EF001514. [Google Scholar] [CrossRef] [Scilit]
  19. Langholtz, M.; Davison, H.B.; Jager, I.J.; Lautrnce, E.; Baskaran, L.M.; Davis, M.; Brandt, C.C. Increased nitrogen use efficiency in crop production can provide economic and environmental benefits. Sci. Total Environ. 2021, 758, 143602. [Google Scholar] [CrossRef] [Scilit]
  20. Wang, C.; Shen, Y.; Fang, X.; Xiao, S.; Liu, G.; Wang, L.; Gu, B.; Zhou, F.; Chen, D.; Tian, H.; et al. Reducing Soil Nitrogen Losses from Fertilizer Use in Global Maize and Wheat Production. Nat. Geosci. 2024, 17, 1008–1015. [Google Scholar] [CrossRef] [Scilit]
  21. Li, H.; Gao, F.; Wang, L.; Sher, A.; Ren, B.; Zhao, B.; Liu, P.; Zhang, J. Increasing soil organic matter and nitrogen use by optimizing summer maize straw return and nitrogen fertilizer rates to minimize N2O emissions in a wheat-maize system. J. Integr. Agric. 2025, 1–20, in press. [Google Scholar] [CrossRef] [Scilit]
  22. Ma, Q.; Jiang, C.; Li, S.; Yu, W. Maize yield and nitrogen-use characteristics were promoted as consistently improved soil fertility: 6-year straw incorporation in Northeast China. Plant Soil Environ. 2021, 67, 383–389. [Google Scholar] [CrossRef] [Scilit]
  23. Oelofse, M.; Bo, M.; Knudsen, L.; Schelde, K.; Olesen, J.E.; Jensen, L.S.; Bruun, S. Do soil organic carbon levels affect potential yields and nitrogen use efficiency? An analysis of winter wheat and spring barley field trials. Eur. J. Agron. 2015, 66, 62–73. [Google Scholar] [CrossRef] [Scilit]
  24. Oldfield, E.E.; Bradford, M.A.; Wood, S.A. Global meta-analysis of the relationship between soil organic matter and crop yields. Soil 2019, 5, 15–32. [Google Scholar] [CrossRef] [Scilit]
  25. Ma, Q.; Li, S.; Xu, Z.; Fan, S.; Xia, Z.; Zhou, C.; Zhu, M.; Yu, W. Changes in N supply pathways under different long-term fertilization regimes in Northeast China. Soil Tillage Res. 2020, 201, 104609. [Google Scholar] [CrossRef] [Scilit]
  26. Chen, M.; Yang, Z.; Yang, N.; Wang, H.; Li, Y.; Wang, K.; Wang, J.; Fan, Q.; Zhang, J.; Yuan, J.; et al. Wheat yield, N use efficiency, soil properties, and soil bacterial community as affected by long-term straw incorporation and manure under wheat-summer maize cropping system in southern Shanxi Province, China. Plants 2025, 14, 1795. [Google Scholar] [CrossRef] [Scilit]
  27. Li, S.; Li, Y.; Yan, X.; Gu, Z.; Xue, D.; Wang, K.; Yang, Y.; Lv, M.; Han, Y.; Li, J.; et al. Long-term organic fertilization enhances soil fertility and reshapes microbial community structure with decreasing effects across soil depth. Microorganisms 2026, 14, 250. [Google Scholar] [CrossRef] [Scilit]
  28. Li, H.; Wang, L.; Peng, Y.; Lv, S.; Li, J.; Yang, Z.; Zhang, S.; Abdo, A.I.; Zhou, C.; Wang, L. Fate of fertilizer nitrogen from a winter wheat field under film mulching and straw retention practices. Nutr. Cycl. Agroecosyst. 2023, 125, 123–136. [Google Scholar] [CrossRef] [Scilit]
  29. Silva, J.A.; Bremner, J.M. Determination and isotope-ratio analysis of different forms of nitrogen in soils: 5. Fixed ammonium. Soil Sci. Soc. Am. J. 1966, 30, 587–594. [Google Scholar] [CrossRef] [Scilit]
  30. Sebilo, M.; Mayer, B.; Grably, M.; Billiou, D.; Mariotti, A. The use of the ‘ammonium diffusion’ method for δ15N-NH4+ and δ15N-NO3- measurements: Comparison with other techniques. Environ. Chem. 2004, 1, 99–103. [Google Scholar] [CrossRef] [Scilit]
  31. Duan, Y.; Xu, M.; Gao, S.; Yang, X.; Huang, S.; Liu, H.; Wang, B. Nitrogen use efficiency in a wheat-corn cropping system from 15 years of manure and fertilizer applications. Field Crops Res. 2014, 157, 47–56. [Google Scholar] [CrossRef] [Scilit]
  32. Hua, W.; Luo, P.; An, N.; Cai, F.; Zhang, S.; Chen, K.; Yang, J.; Han, X. Manure application increased crop yields by promoting nitrogen use efficiency in the soils of 40-year soybean-maize rotation. Sci. Rep. 2020, 10, 14882. [Google Scholar] [CrossRef] [Scilit]
  33. Yang, Q.; Zheng, F.; Jia, X.; Liu, P.; Dong, S.; Zhang, J.; Zhao, B. The combined application of organic and inorganic fertilizers increases soil organic matter and improves soil microenvironment in wheat-maize field. J. Soils Sediments 2020, 20, 2395–2404. [Google Scholar] [CrossRef] [Scilit]
  34. Hirte, J.; Leifeld, J.; Abiven, S.; Mayer, J. Maize and wheat root biomass, vertical distribution, and size class as affected by fertilization intensity in two long-term field trials. Field Crops Res. 2018, 216, 197–208. [Google Scholar] [CrossRef] [Scilit]
  35. Shang, B.; Tian, T.; Mo, Y.; Zhang, H.; Zhang, K.; Agathokleous, E.; Ji, Y.; Feng, Z. Combined application of organic and inorganic fertilizers sustained rice yields and N accumulation and decreased soil-canopy system NH3 emission. Agric. Ecosyst. Environ. 2025, 377, 109260. [Google Scholar] [CrossRef] [Scilit]
  36. Wang, J.; Yang, X.; Huang, S.; Wu, L.; Cai, Z.; Xu, M. Soil and its interaction with the climate jointly drive the change in basic soil productivity under long-term fertilizer management. Agronomy 2023, 13, 2934. [Google Scholar] [CrossRef] [Scilit]
  37. Zhang, C.; Rees, R.M.; Ju, X. Fate of 15N-labelled urea when applied to long-term fertilized soils of varying fertility. Nutr. Cycl. Agroecosyst. 2021, 121, 151–165. [Google Scholar] [CrossRef] [Scilit]
  38. Dai, Z.; Yu, M.; Chen, H.; Zhao, H.; Huang, Y.; Su, W.; Xia, F.; Chang, S.X.; Brookes, P.C.; Dahlgren, R.A.; et al. Elevated temperature shifts soil N cycling from microbial immobilization to enhanced mineralization, nitrification and denitrification across global terrestrial ecosystems. Glob. Change Biol. 2020, 26, 5267–5276. [Google Scholar] [CrossRef] [Scilit]
  39. Thapa, R.; Tully, K.L.; Cabrera, M.L.; Dann, C.; Schomberg, H.H.; Timlin, D.; Reberg-Horton, C.; Gaskin, J.; Davis, B.W.; Mirsky, S.B. Effects of moisture and temperature on C and N mineralization from surface-applied cover crop residues. Biol. Fertil. Soils 2021, 57, 485–498. [Google Scholar] [CrossRef] [Scilit]
  40. Haugwitz, M.S.; Bergmark, L.; Priemé, A.; Christensen, S.; Beier, C.; Michelsen, A. Soil microorganisms respond to five years of climate change manipulations and elevated atmospheric CO2 in a temperate heath ecosystem. Plant Soil 2014, 374, 211–222. [Google Scholar] [CrossRef] [Scilit]
  41. Hu, C.; Liu, X.; Driscoll, A.W.; Kuang, Y.; Jack Brookshire, E.N.; Lu, X.; Chen, C.; Song, W.; Mao, R.; Liu, C.; et al. Global distribution and drivers of relative contributions among soil nitrogen sources to terrestrial plants. Nat. Commun. 2024, 15, 6407. [Google Scholar] [CrossRef] [Scilit]
  42. Krause, H.M.; Mueller, R.C.; Lori, M.; Mayer, J.; Mäder, P.; Hartmann, M. Organic cropping systems alter metabolic potential and carbon, nitrogen and phosphorus cycling capacity of soil microbial communities. Soil Biol. Biochem. 2025, 203, 109737. [Google Scholar] [CrossRef] [Scilit]
  43. Li, J.; Li, Z.; Zhu, Y.; Niu, Y.; Li, X.; Lu, J.; Gao, C.; Zhang, Q.; Xu, M. Combined application of organic and inorganic fertilizers facilitates the restoration of the microbial communities and functions of carbon and nitrogen in reclaimed soil. J. Plant Nutr. Fertil. 2025, 31, 1285–1296. [Google Scholar] [CrossRef]
  44. Duan, Q.; Liu, Q.; Yang, R.; Kong, X.; Gao, Y.; Yue, S.; Shen, Y.; Xu, M. Long-term co-application of nitrogen and organic fertilizers enhances soil quality and wheat growth stability by modulating microbial communities. Appl. Soil Ecol. 2025, 213, 106309. [Google Scholar] [CrossRef] [Scilit]
  45. Lin, S.; Zhao, X.; Fu, Q.; Ma, Z.; Ma, Y.; Yang, T. Integrated organic-inorganic fertilization enhances soil microbial diversity and mitigates the yield-quality trade-off in pakchoi (Brassica chinensis L.). Agric. Water Manag. 2026, 325, 110189. [Google Scholar] [CrossRef] [Scilit]
  46. Farzadfar, S.; Knight, J.D.; Congreves, K.A. Soil organic nitrogen: An overlooked but potentially significant contribution to crop nutrition. Plant Soil 2021, 462, 7–23. [Google Scholar] [CrossRef] [Scilit] [PubMed]
  47. Liu, L.; Li, P.; Xu, M.; Ma, H.; Yang, X.; Zhang, S. Effects of soil fertility and N application rates on soil organic N components and N mineralization. J. Agro-Environ. Sci. 2026, 45, 446–455. [Google Scholar]
  48. Jiang, Z.; Liu, Y.; Yang, J.; Brookes, P.C.; Gunina, A. Rhizosphere priming regulates soil organic carbon and nitrogen mineralization: The significance of abiotic mechanisms. Geoderma 2021, 385, 114877. [Google Scholar] [CrossRef] [Scilit]
  49. Ashraf, M.N.; Hu, C.; Wu, L.; Duan, Y.; Zhang, W.; Aziz, T.; Cai, A.; Abrar, M.M.; Xu, M. Soil and microbial biomass stoichiometry regulate soil organic carbon and nitrogen mineralization in rice-wheat rotation subjected to long-term fertilization. J. Soils Sediments 2020, 20, 3103–3113. [Google Scholar] [CrossRef] [Scilit]
  50. Diacono, M.; Montemurro, F. Long-term effects of organic amendments on soil fertility: A review. Agron. Sustain. Dev. 2010, 30, 401–422. [Google Scholar] [CrossRef] [Scilit]
  51. Zhao, W.; Liang, B.; Yang, X.; Gale, W.; Zhou, J. Effect of long-term fertilization on 15N uptake and retention in soil. J. Plant Nutr. 2016, 39, 1431–1440. [Google Scholar] [CrossRef] [Scilit]
  52. Xu, A.; Khan, K.S.; Wei, X.; Chen, Y.; Zhou, Y.; Sun, C.; Effah, Z.; Li, L. Fertilizer nitrogen use efficiency and its fate in the spring wheat-soil system under varying N-fertilizer rates: A two-year field study using 15N tracer. Soil Tillage Res. 2025, 252, 106612. [Google Scholar] [CrossRef] [Scilit]
  53. Liang, B.; Zhao, W.; Yang, X.; Zhou, J. Fate of nitrogen-15 as influenced by soil and nutrient management history in a 19-year wheat–maize experiment. Field Crops Res. 2013, 144, 126–134. [Google Scholar] [CrossRef] [Scilit]
  54. Ju, X.; Xing, G.; Chen, X.; Zhang, S.; Zhang, L.; Liu, X.; Cui, Z.; Yin, B.; Christie, P.; Zhu, Z.; et al. Reducing environmental risk by improving N management in intensive Chinese agricultural systems. Proc. Natl. Acad. Sci. USA 2009, 106, 3041–3046. [Google Scholar] [CrossRef] [Scilit]
  55. Smith, C.J.; Chalk, P.M. The residual value of fertiliser N in crop sequences: An appraisal of 60 years of research using 15N tracer. Field Crops Res. 2018, 217, 66–74. [Google Scholar] [CrossRef] [Scilit]
Figure 1. Grain yield under different soil fertility levels and N application rates for the first crop of wheat (a), the second crop of maize (b) and the third crop of wheat (c), respectively. Bar represents means ± standard error (n = 3). The different lowercase letters (a, b, c, d) above the bar indicate significant differences (p < 0.05) between N application rates under the same soil fertility level and the lowercase letters (α, β, γ) above the bar indicate significant differences (p < 0.05) between soil fertility levels under the same N rates. The different uppercase letters on top of the bar indicate significant differences (p < 0.05) between soil fertility levels. In F1 w–F4 w, F1–F4 represents the soil fertility level, and “w” or “m” stands for the wheat season and maize season, respectively.
Agronomy 16 00983 g001
Figure 2. NdffTab (aboveground 15N uptake) under different soil fertility and N application rates for the second crop of maize (a) and the third crop of wheat (b), respectively. The different lowercase letters (a, b, c) above the bar indicate significant difference (p < 0.05) between N application rates under the same soil fertility level. The different lowercase letters (α, β, γ) above the bar indicate significant differences (p < 0.05) between soil fertility levels under the same N rates. The different uppercase letters on top of the bar indicate significant differences (p < 0.05) between soil fertility levels. F refers to the soil fertility level. In F1 w–F4 w, F1–F4 represents the soil fertility level, and “w” or “m” stands for the wheat season and maize season, respectively.
Agronomy 16 00983 g002
Figure 3. Changes in the total amount and various forms (inorganic N, fixed N, and organic N forms) of residual 15N in the 0–20 cm soil layer after the harvest of the first crop of wheat (a), the second crop of maize (b), and the third crop of wheat (c) under different soil fertility levels and N application rates. Different lowercase letters indicate significant differences in the total amount of residual 15N among various treatments, where the different lowercase letters (a, b, c, d) above the bar indicate significant differences (p < 0.05) in total residual 15N (Ndffs) between N application rates at the same soil fertility level, and the different lowercase letters (α, β, γ, δ) above the bar indicate significant differences (p < 0.05) in total residual 15N (Ndffs) between soil fertility levels at the same N rate. The different uppercase letters on top of the bar indicate significant differences (p < 0.05) in total residual 15N between soil fertility levels. F refers to the soil fertility level. In F1 w–F4 w, F1–F4 represents the soil fertility level, and “w” or “m” stands for the wheat season and maize season, respectively.
Agronomy 16 00983 g003
Figure 4. Fate of applied fertilizer 15N after the harvest of all three crop seasons (wheat1 + maize2 + wheat3) under different soil fertility levels. The values are means of different N rates at the same soil fertility level.
Agronomy 16 00983 g004
Figure 5. Relationships between total 15NUE and soil organic matter (SOM) after the harvest of three crop seasons under different N rates. ** and * represent significance at p < 0.01 and p < 0.05, respectively.
Agronomy 16 00983 g005
Table 1. Total N uptake in aboveground biomass (Nab), and N derived from soil (Ndfs) and 15N-labeled urea (Ndffp) of the first crop of wheat under different soil fertility levels and N rates.
Soil FertilityN Rates
(kg/ha)
Nab
(g/pot)
Ndffp
(g/pot)
NdffTab/
Nab
(%)
Ndfs
(g/pot)
Ndfs/
Nab
(%)
Grain
(Ndffg)
Straw
(NdffTab-g)
Total
(NdffTab)
F1wN00.29 ± 0.01 dβ
N1050.47 ± 0.04 cβ0.17 ± 0.02 dβ0.02 ± 0.00 bγ0.19 ± 0.02 dβ40.40.28 ± 0.05 bβ59.6
N1350.80 ± 0.06 bβ0.24 ± 0.02 cα0.04 ± 0.00 bβ0.28 ± 0.02 cβ35.30.52 ± 0.10 aβ64.7
N1650.88 ± 0.06 bγ0.33 ± 0.00 bα0.04 ± 0.00 bβ0.37 ± 0.00 bβ42.00.51 ± 0.09 aγ58.0
N2101.07 ± 0.06 aβ0.40 ± 0.03 aβγ0.05 ± 0.01 aβ0.46 ± 0.03 aβ42.80.61 ± 0.10 aβ57.2
Mean0.70 ± 0.32 B0.29 ± 0.10 A0.04 ± 0.01 B0.33 ± 0.10 A40.10.48 ± 0.14 C59.9
F2wN01.22 ± 0.17 aα
N1051.61 ± 0.28 aα0.21 ± 0.02 aαβ0.09 ± 0.01 aα0.30 ± 0.01 cα18.41.31 ± 0.26 aα81.6
N1351.71 ± 0.31 aα0.23 ± 0.05 aα0.11 ± 0.02 aα0.35 ± 0.05 cαβ20.31.36 ± 0.27 aα79.7
N1651.68 ± 0.19 aβ0.31 ± 0.06 aα0.13 ± 0.03 aα0.43 ± 0.06 bαβ25.91.24 ± 0.23 aβ74.1
N2101.75 ± 0.19 aα0.36 ± 0.03 aγ0.13 ± 0.03 aα0.49 ± 0.05 aβ27.91.26 ± 0.28 aα72.1
Mean1.60 ± 0.22 A0.28 ± 0.07 A0.12 ± 0.02 A0.39 ± 0.08 A23.11.30 ± 0.05 AB76.9
F3wN01.21 ± 0.17 cα
N1051.45 ± 0.10 bcα0.25 ± 0.01 dα0.08 ± 0.01 bαβ0.33 ± 0.00 dα22.91.12 ± 0.16 aα77.1
N1351.68 ± 0.06 abα0.32 ± 0.04 cα0.11 ± 0.02 abα0.43 ± 0.02 cα25.71.25 ± 0.07 aα74.3
N1651.88 ± 0.11 aαβ0.44 ± 0.00 bα0.13 ± 0.01 abα0.57 ± 0.01 bα30.41.31 ± 0.18 aαβ69.6
N2101.97 ± 0.07 aα0.50 ± 0.01 aα0.15 ± 0.01 aα0.65 ± 0.01 aα33.01.32 ± 0.14 aα67.0
Mean1.64 ± 0.31 A0.38 ± 0.11 A0.12 ± 0.03 A0.50 ± 0.14 A28.01.25 ± 0.09 B72.0
F4wN01.42 ± 0.08 aα
N1051.72 ± 0.08 aα0.24 ± 0.02 cα0.07 ± 0.01 aβ0.31 ± 0.01 cα18.01.41 ± 0.16 aα82.0
N1351.76 ± 0.20 aα0.29 ± 0.02 bcα0.13 ± 0.00 aα0.42 ± 0.01 bα23.71.34 ± 0.37 aα76.3
N1651.98 ± 0.12 aα0.34 ± 0.03 bα0.14 ± 0.02 aα0.48 ± 0.04 bαβ24.01.50 ± 0.20 aα76.0
N2102.08 ± 0.19 aα0.45 ± 0.01 aαβ0.16 ± 0.01 aα0.64 ± 0.03 aα30.71.44 ± 0.35 aα69.3
Mean1.78 ± 0.28 A0.34 ± 0.09 A0.12 ± 0.04 A0.46 ± 0.13 A24.11.43 ± 0.07 A75.9
F
N
F × N
************ ***
************ ns
nsnsnsns ns
Data are means ± standard error (n = 3). Different letters within the same column indicate significant differences at p < 0.05, where lowercase letters (a, b, c, d) denote significant differences among different fertilizer N application rates within the same soil fertility level. Lowercase letters (α, β, γ) represent significant differences across different soil fertility levels under the same N application rate. Uppercase letters (A, B, C) indicate significant differences among distinct soil fertility levels. F, N, and F × N effects were tested by two-way ANOVA. *** and ns represent significance at p < 0.001 and no significance, respectively. Nab represents the aboveground N uptake of wheat in the first season, where Ndffp denotes the portion of Nab derived from 15N-labeled fertilizer, and Ndfs denotes the portion of Nab derived from the soil. The straw refers to the aboveground biomass part excluding the grain. In F1 w–F4 w, F1–F4 represents the soil fertility level, and “w” stands for the wheat season.
Disclaimer/Publisher’s Note: The statements, opinions and data contained in all publications are solely those of the individual author(s) and contributor(s) and not of MDPI and/or the editor(s). MDPI and/or the editor(s) disclaim responsibility for any injury to people or property resulting from any ideas, methods, instructions or products referred to in the content.