


Abstract
Heterosis utilization is an effective strategy to improve crop yield, stress resistance, and quality, and has been widely used in crop breeding. Soybean is an important oil and protein crop worldwide with heterosis, but the genetic basis of soybean heterosis remains largely unclear. Whole-transcriptome analysis provides a new technical approach to explore the molecular mechanism of heterosis. In this study, HYBSOY2, a registered soybean hybrid variety with the strongest heterosis in China, together with its female parent JLCMS47A, maintainer line JLCMS47B, and male parent JLR2, were used as experimental material. Whole-transcriptome sequencing was performed using RNA extracted from seedling leaves. After mapping high-quality reads to the soybean reference genome, 57 co-expressed differentially expressed genes (DEGs) were identified in HYBSOY2 compared with both JLCMS47B and JLR2. GO and KEGG enrichment analyses shows that these DEGs were mainly enriched in ADP binding, oxidoreductase activity, fatty acid elongation, and pyruvate metabolism. A total of 787 transcription factors were identified between HYBSOY2 and its parents, most of which shows parental expression-level dominance, with the MYB family accounting for the highest proportion. In addition, 10 differentially expressed lncRNAs were detected between HYBSOY2 and its parents. In the comparison between HYBSOY2 and JLCMS47B, 18 differentially expressed miRNAs were identified, among which up-regulated miR396d functions in promoting leaf development and enhancing drought tolerance. In the comparison between HYBSOY2 and JLR2, 20 differentially expressed miRNAs were found, including down-regulated miR172c which is involved in flowering promotion. A total of 12 DEGs were further verified by qRT-PCR, which may be closely related to soybean heterosis. This study provides a comprehensive transcriptomic profile at the seedling stage of the hybrid soybean and offers valuable information for hybrid soybean breeding. These results lay a foundation for further revealing the molecular mechanism underlying soybean heterosis.
1. Introduction
Heterosis refers to the superiority of hybrids over their parents in different traits in plants [1]. It has been widely applied in main crops such as maize (Zea mays), rice (Oryza sativa), rapeseed (Brassica napus), wheat (Triticum aestivum), and cotton (Gossypium spp.), providing an important guarantee for global food security [2]. The extensive utilization of heterosis in crop breeding due to its significant yield-increasing effect, vigorous plant growth, and easy spread, but the research on the molecular genetic basis of heterosis needs to be further clarified [3].
Researchers presented three classic hypotheses: the dominance hypothesis, the over-dominance hypothesis, and the epistasis hypothesis, to explain the genetic basis of crop heterosis. These hypotheses explain part of the heterosis mechanism with limitations. With the widespread application of high-throughput sequencing technology and omics analysis, epigenetics, transcriptomics, metabolomics, proteomics, and other related technologies have been employed to study the heterosis mechanism of crops, including rice [4,5], maize [6,7], Chinese cabbage (Brassica rapa) [8], and chili pepper (Capsicum chinense) [9]. In particular, with the continuous development of high-throughput sequencing technology, researchers can explore the complex regulatory relationships of crop heterosis from the perspective of the whole transcriptome. Whole transcriptome analysis aims to capture coding and non-coding RNAs, enabling the integrated analysis of all RNAs to more comprehensively resolve differential RNA expression and regulatory networks. It can also investigate the crop heterosis mechanism at the transcriptional level. This method has been widely used for the identification of key module genes in crops. For example, Fu et al. [10] found through transcriptome sequencing and whole-genome resequencing that the gene expression of the super hybrid rice varieties Longliangyou Huazhan and Jingliangyou Huazhan was higher, and the differentially expressed genes (DEGs) were mainly enriched in pathways such as circadian rhythm, biotic and abiotic stress responses, and photosynthesis. Some DEGs may play a key role in heterosis; for instance, GNP1, a gene that increases the number of grains per panicle and rice yield, shows over-dominant expression in the leaves and panicles of both super hybrid rice varieties. The maize hybrid outperformed its parents in agronomic traits such as panicle size, kernel size, kernel weight, and total yield. Li et al. analyzed the DEGs of Yudan 132 at four stages of kernel development and found that DEGs were involved in various metabolic pathways, among which the transcription factor bZIP88 may affect kernel development [11]. This study revealed the genetic effects of heterosis and the regulatory mechanism of kernel development. Shu et al. [9] used mRNA and ncRNA transcriptome profiles and found that pepper hybrids had advantages in leaf area, plant type, plant height, and fruit-related traits, and identified the important potential role of plant hormone signal transduction in pepper heterosis, providing a theoretical basis for further explaining the pepper heterosis mechanism. Luo et al. [12] generated an integrated whole transcriptome map of mRNA abundance, m6A methylation, and translation efficiency for the maize F1 hybrid B73 × Mo17 and its two parental inbred lines through RNA sequencing (RNA-seq), m6A RNA immunoprecipitation sequencing (m6A-seq), and polysome profiling. They found higher levels of m6A modification and translation efficiency in the hybrid, and the study pointed out that transcriptional and post-transcriptional regulation of gene expression participate in the formation of heterosis in different ways, providing new ways for future exploration of the core mechanism of heterosis.
Soybean is an important oil crop worldwide, and its hybrids exhibit strong heterosis [13,14,15]. Similar to maize [16,17,18] and rice [19,20,21], Zhang et al. [22] found through transcriptome sequencing analysis that key genes in metabolic pathways regulating seed development are closely related to soybean heterosis. However, few in-depth studies have been reported, making it difficult to provide theoretical guidance for the efficient breeding of soybean hybrids. The high-heterosis soybean hybrid Zajiaodou 2 [23], a nationally approved variety with the highest yield increase per unit area, and its parents were used as experimental materials. Combined with whole transcriptome sequencing technology, the differential expression patterns and regulatory networks of mRNA and non-coding RNAs (lncRNA, miRNA, and circRNA) among different materials were analyzed. Based on the comprehensive analysis of multiple datasets, the metabolic pathways involved in key DEGs were identified, and their regulation and influence on the formation of soybean heterosis were predicted, providing a further theoretical basis for the analysis of the molecular mechanism of soybean heterosis.
2. Materials and Methods
2.1. Material Treatment and Growth Conditions
Zajiaodou 2 (JLCMS47A×JLR2) is a registered soybean hybrid variety with the strongest heterosis in China. Zajiaodou 2 (HYBSOY2) and the soybean lines, JLCMS47B (the maintainer line of the cytoplasmic male sterile line JLCMS47A, female parent) and JLR2 (restorer line, male parent) were used in this study. In 2021, HYBSOY2, JLCMS47B, and JLR2 were sown in spring at the core breeding base of the hybrid soybean of Jilin Academy of Agricultural Sciences, and individual plants were harvested at maturity for agronomic trait investigation.
In 2022, the materials were planted in culture pots in a plant growth chamber (GEN1000-TA, Conviron Inc., Winnipeg, MB, Canada) at the Key Laboratory of Hybrid Soybean of the Ministry of Agriculture and Rural Affairs under the conditions of 14 h light (5000 lx)/10 h dark and 25 °C. At the V1 stage, the middle leaflet of the first trifoliolate leaf was sampled into cryopreservation tubes with three biological replicates and stored in an ultra-low temperature refrigerator (DW-86L388J, Haier Inc., Qingdao, China) at −80 °C for total RNA extraction.
2.2. Phenotype Determination of the Hybrid and Its Parents
The growth of HYBSOY2, JLCMS47B, and JLR2 at the V1 stage (when the first trifoliolate leaf emerged) was recorded by photography, and the pod and grain phenotype at maturity of individual plants were observed by photography. Agronomic traits, including plant height (PH), number of nodes per stem (NNS), number of primary branches (NPS), number of pods per plant (NPP), 100-seed weight (HSW), grain yield per plant (GYPP), protein content (PC), and oil content (OC), were determined for HYBSOY2, JLCMS47B, and JLR2. PASW Statistics 18.0 was used for statistical significance analysis of the data (LSD method), and different lowercase letters indicated significant differences between HYBSOY2 and JLCMS47B or between HYBSOY2 and JLR2 (p < 0.05).
2.3. Total RNA Extraction and Whole Transcriptome Sequencing
Total RNA of the three materials was extracted using the OminiPlant RNA Kit (CoWin Biotech, Taizhou, Jiangsu, China). The concentration and purity of total RNA were detected with a micro nucleic acid detector Qubit 4.0 (Thermo Fisher, Singapore). Strand-specific libraries were then constructed using the RNA Library Prep Kit for Illumina (TransGen Biotech, Beijing, China) to generate mRNA, lncRNA, and circRNA data. Small RNA libraries were constructed using the Multiplex Small RNA Library Prep Set for Illumina (NEB, Ipswich, MA, USA) to generate miRNA data.
Sequencing was performed on Novaseq6000 (Illumina, San Diego, CA, USA), with PE150 and SE50 sequencing strategies for lncRNA and small RNA, respectively. The generated miRNA, lncRNA, circRNA, and small RNA data were processed into clean data using Bowtie v1.0.1 software, which was then aligned to the soybean reference genome Williams 82.a4.v1 (https://phytozome-next.jgi.doe.gov/info/Gmax_Wm82_a4_v1, accessed on 25 August 2022). The resulting data were used for subsequent analysis.
2.4. Differential Expression Analysis
The base quality values of the sequencing reads were evaluated using the Phred package. The FPKM method [24] was used to calculate the expression levels of mRNA and lncRNA, and the differentially expressed mRNAs were divided into four main expression categories with a total of 12 expression patterns (Table S2) according to the classification method of Rapp et al. [25]. The TPM method [26] was used for the normalization of miRNA and circRNA expression levels.
DESeq 2, a package for differential analysis of count data based on the negative binomial distribution, was used to analyze gene expression levels, followed by differential analysis. DEGs were screened with the criteria of p-value < 0.05 and |log2 (FoldChange)| ≥ 1, and DEGs between each group were obtained. All Venn diagrams were plotted with Jvenn4 [27], and cluster analysis heatmaps were plotted with the R 4.2.1 package pheatmap.
2.5. GO and KEGG Analysis
After screening the inter-group differentially expressed mRNAs, GO analysis (http://www.geneontology.org, accessed on 23 February 2023) and KEGG enrichment analysis (http://www.genome.jp/kegg, accessed on 23 February 2023) were performed on the sets of genes associated with the differentially expressed mRNAs according to the corresponding relationship between mRNAs and their associated genes, to annotate the functions of the differentially expressed mRNAs.
2.6. Analysis of Transcription Factors Encoded by mRNA
Transcription factors were analyzed using iTALK v1.2 software [28], and the transcription factors obtained by sequencing were aligned with plant transcription factors in the PlantTFDB database (http://planttfdb.cbi.pku.edu.cn, accessed on 8 March 2023).
2.7. Quantitative Real-Time PCR
To verify the transcriptome data, primers for quantitative real-time PCR (qRT-PCR) were designed using Primer Premier 5 software and synthesized, and the expression levels of 20 DEGs were verified by qRT-PCR (the genes and primer sequences are shown in Table S1). qRT-PCR was performed with UltraSYBR Mixture (Beijing TransGen Biotechnology Co., Ltd., Beijing, China), with 1 μL (100 ng) of template cDNA and 0.5 μM of each PCR primer. The cycling conditions were pre-denaturation at 95 °C for 15 min, denaturation at 95 °C for 10 s, annealing at 60 °C for 20 s, and extension at 72 °C for 20 s, for 40 cycles. The reaction was run on a real-time fluorescent quantitative PCR system (StepOne-Plus, Thermo Fisher Scientific, Singapore). Gmcons4 was used as the internal control, and the 2−ΔΔCt method was used to analyze the relative expression levels of the target genes, with three technical replicates for each sample.
3. Results
3.1. Comparison of Morphological and Yield Traits of Hybrid and Its Parents at the V1 Stage
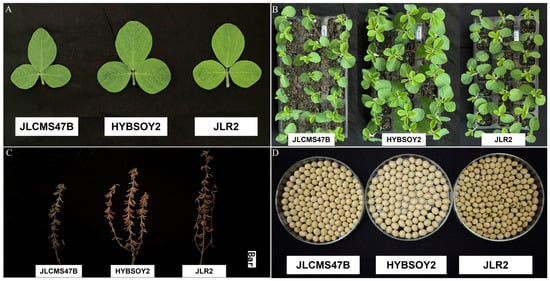
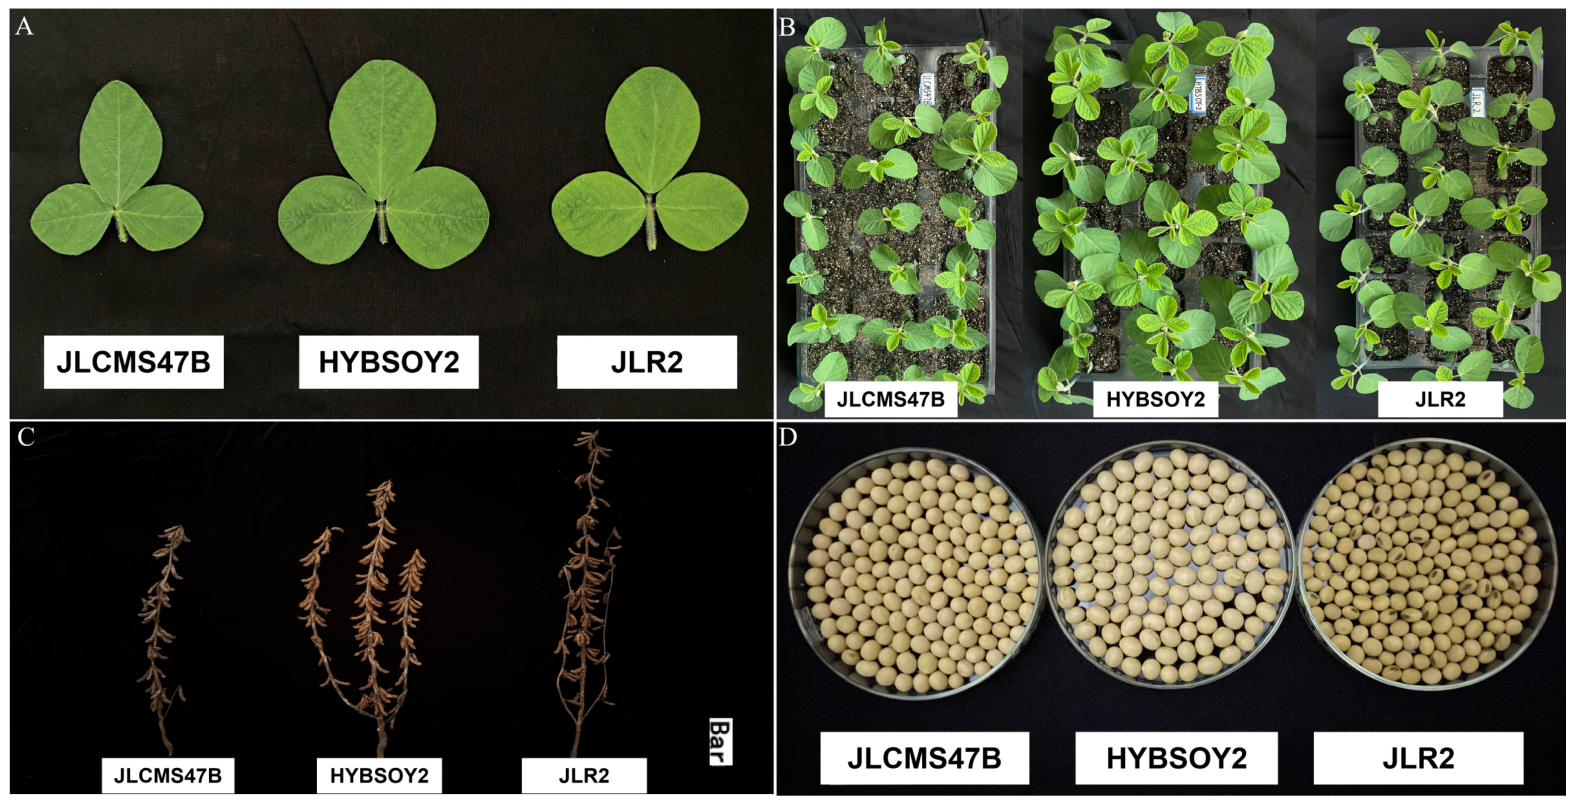
Morphological comparison of HYBSOY2, JLCMS47B, and JLR2 at the V1 stage (when the first trifoliolate leaf emerged) revealed significant differences in growth vigor among the three materials (Figure 1A,B). Therefore, the middle leaflet of the first trifoliolate leaf at this stage was selected for total RNA extraction and whole transcriptome sequencing. Agronomic traits of HYBSOY2, JLCMS47B, and JLR2 at maturity were analyzed in this study.
Figure 1.
Growth of HYBSOY2 and its parents at seedling and mature stages. (A) Leaves of HYBSOY2 and its parents at seedling stage. (B) Leaves of HYBSOY2 and its parents at seedling stage. (C) Mature stage single plant phenotype of HYBSOY2 and its parents. Bar: 15 cm. (D) Yield per plant at maturity of HYBSOY2 and its parents.
Analysis of agronomic trait data and calculation of mid-parent heterosis (MPH) and high-parent heterosis (HPH) shows that HYBSOY2 had no significant heterosis in 100-seed weight, protein content, and oil content, but exhibited significant heterosis in four agronomic traits, including plant height, number of nodes on the main stem, number of branches, number of pods per plant, and seed yield per plant. The MPH and HPH of yield per plant of HYBSOY2 were 30.73% and 7.95%, respectively (Table 1).
Table 1.
Comparison of agronomic traits between HYBSOY2 and its parents.
3.2. lncRNA and Small RNA Sequencing
A PE150 sequencing strategy was used for lncRNA sequencing, and the generated raw reads ranged from 86,311,544 bp to 95,001,616 bp. Using soybean Williams 82.a4.v1 as the reference genome, raw data were filtered and quality-controlled to obtain clean reads ranging from 85,398,212 bp to 94,092,580 bp for subsequent analysis. The percentage of bases with a quality value ≥ 30 (Q30) was higher than 92.83% of the total bases, the average GC content in the sequencing data was 40.56%, and 65.92~72.71% of the reads were mapped to the reference genome (Table 2).
Table 2.
lncRNA sequencing data quality.
An SE50 sequencing strategy was used for small RNA sequencing, and the generated raw small RNA data ranged from 11,318,756 bp to 13,707,753 bp. After filtering and quality control of the raw data, clean reads ranged from 11,179,688 bp to 13,528,110 bp. Q30 in the sequencing reads was higher than 96.75%. The GC content was 50.71~51.80%. A total of 89.66~95.99% clean reads were mapped to the reference genome. An average of 51.23% of the reads were distributed in the exon region, 14.69% in the intergenic region, and 34.08% in the intron region (Table 3). The above data indicated high accuracy of the sequencing results.
Table 3.
Small RNA sequencing data quality.
3.3. Analysis of Differentially Expressed mRNA Between HYBSOY2 and Its Parents
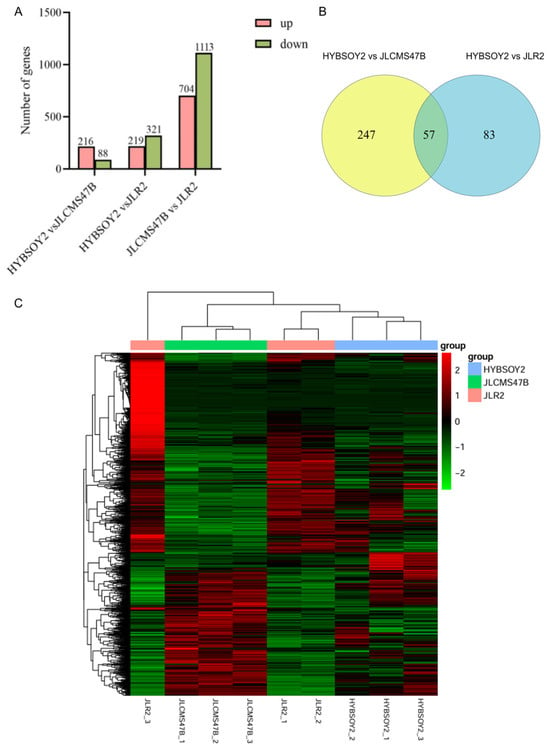
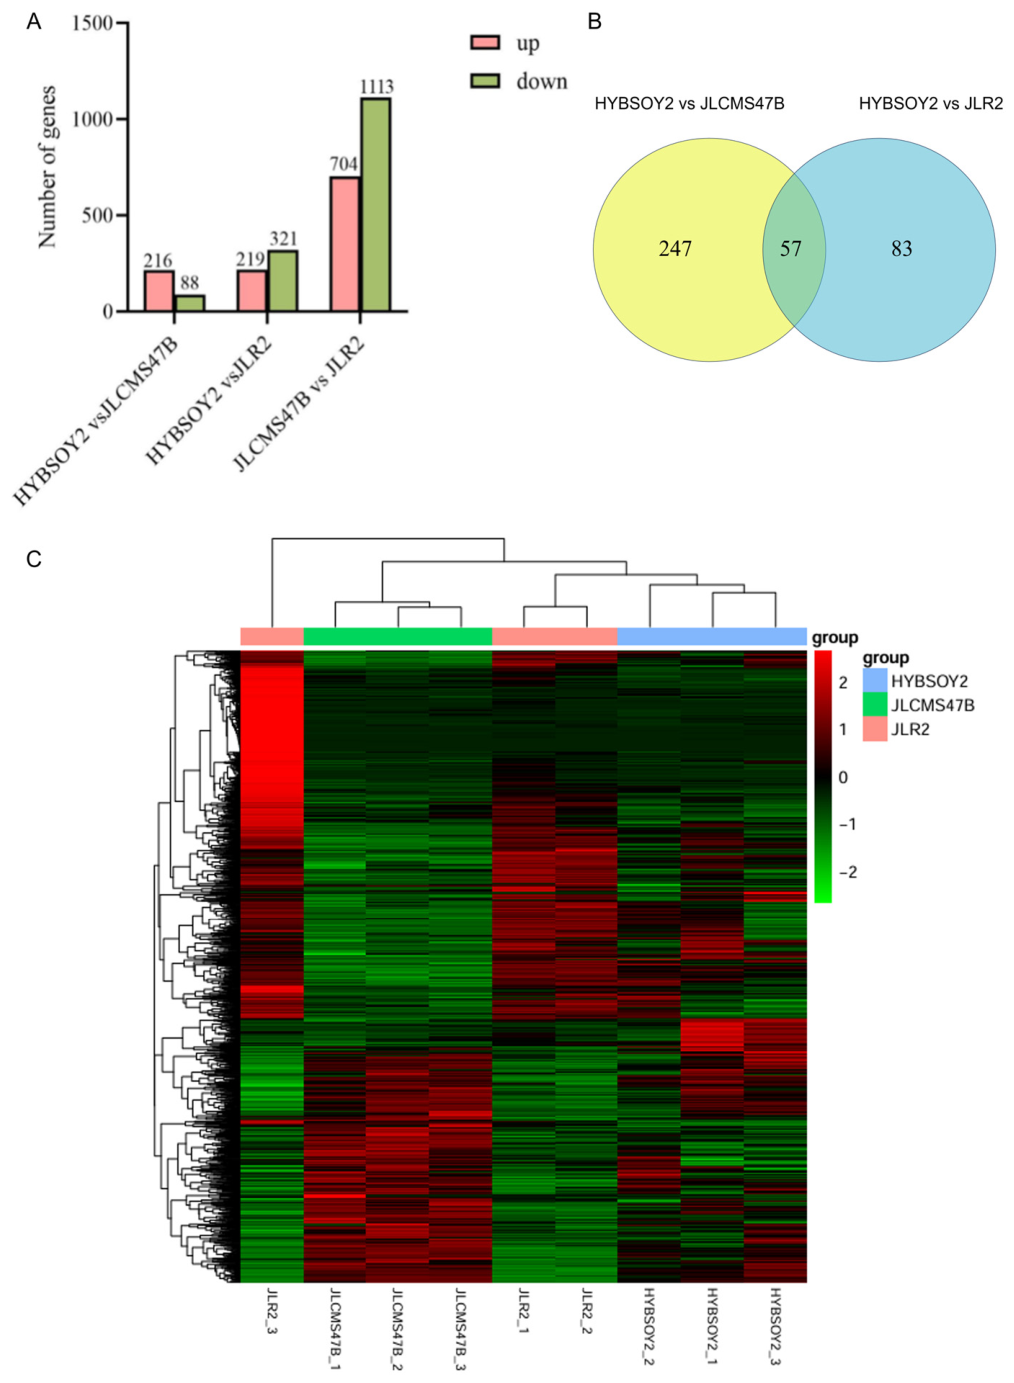
Statistics on the number of differentially expressed mRNAs in the filtered HYBSOY2 data shows that 216 up-regulated DEGs were identified in HYBSOY2 compared with JLCMS47B, and 219 up-regulated DEGs were identified in HYBSOY2 compared with JLR2, indicating a similar number of up-regulated DEGs between HYBSOY2 and its parents (Figure 2A). Venn diagram analysis identified a total of 787 DEGs at the V1 stage of HYBSOY2 and its parents, 304 DEGs in the comparison group of HYBSOY2 vs. JLCMS47B, and 540 DEGs in the comparison group of HYBSOY2 vs. JLR2, with 57 common DEGs between HYBSOY2 and its parents (Figure 2B). Cluster analysis of HYBSOY2 and its parents, which grouped samples with similar expression patterns together, found that the mRNA expression pattern of HYBSOY2 was more similar to that of JLR2 (Figure 2C).
Figure 2.
Gene differential mRNA expression between HYBSOY2 and their parents. (A) Number of differential genes between crosses. (B) Venn diagram of differentially expressed genes between HYBSOY2 and their parents. (C) Cluster analysis of differentially expressed genes.
Differentially expressed genes of HYBSOY2 and its parents at the V1 stage were divided into four main expression categories with a total of 12 expression patterns (I~XII). A total of 1201 additive genes were identified in HYBSOY2, and additive effect (I, XII) expression was dominant, accounting for the highest proportion among the 12 expression patterns. A total of 31 DEGs shows over-high-parent up-regulation and 10 DEGs shows over-high-parent down-regulation in HYBSOY2 (Table 4).
Table 4.
Summary of differentially expressed genes of HYBSOY2 in the V1 stage.
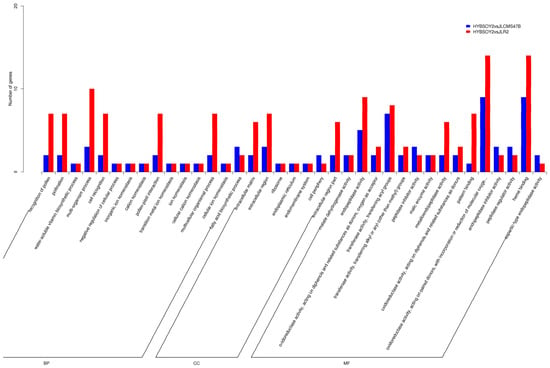
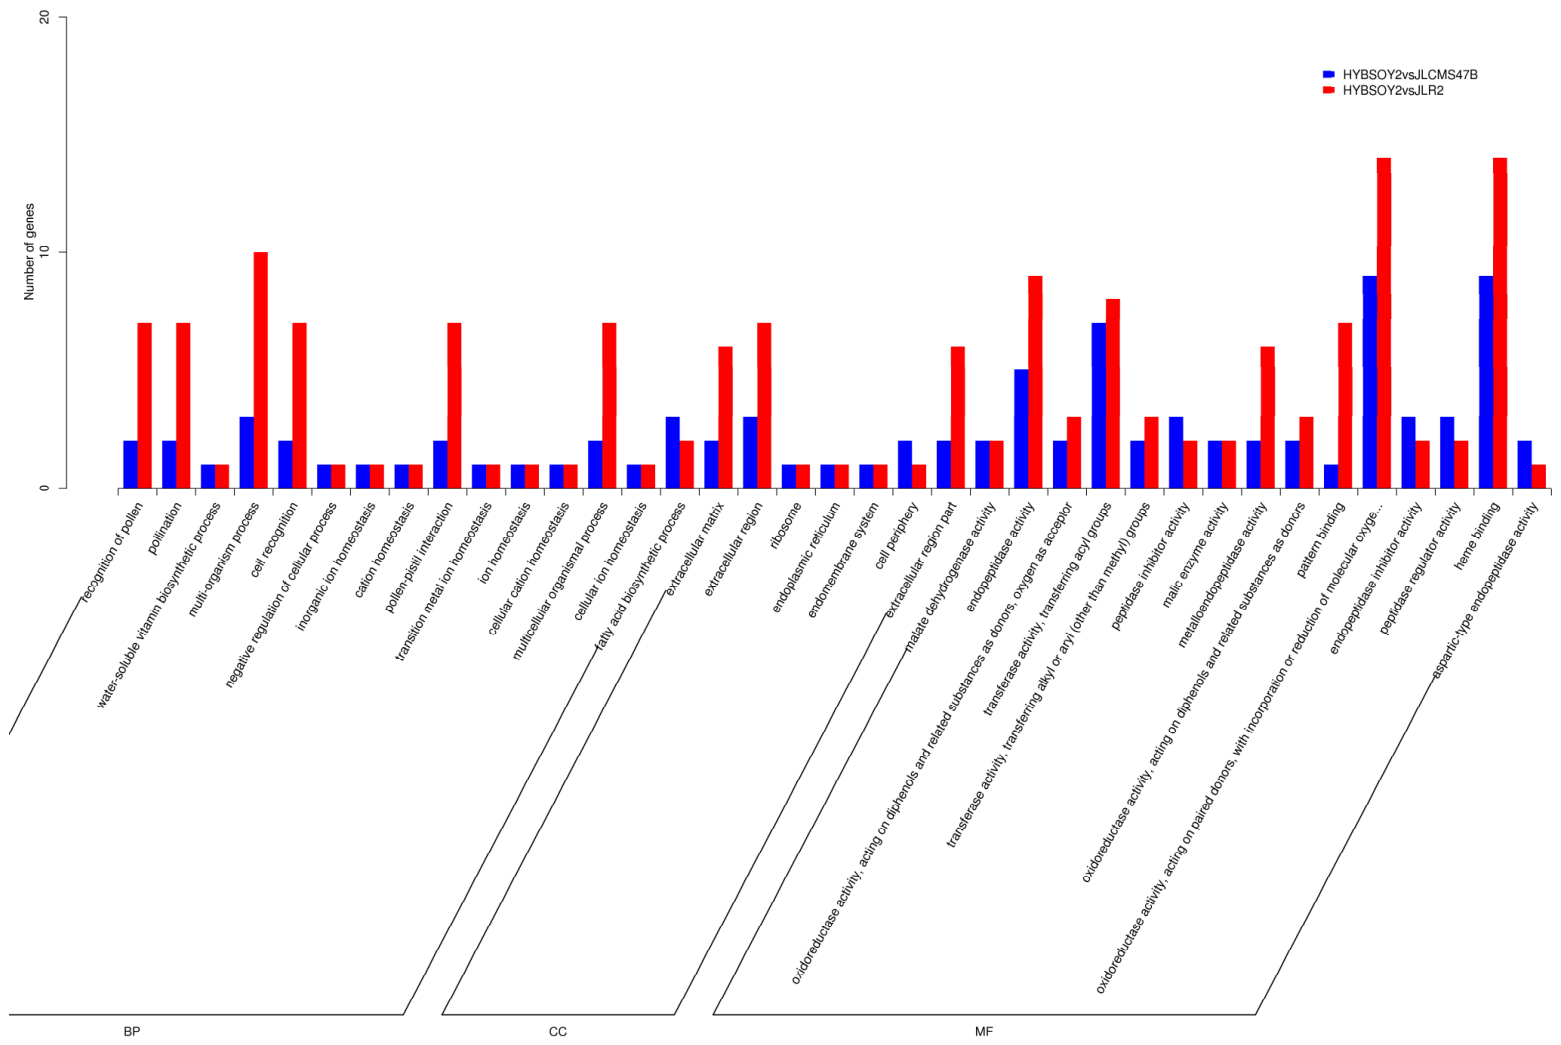
GO enrichment analysis was performed on the differentially expressed mRNAs identified in the comparison groups of HYBSOY2 vs. JLCMS47B and HYBSOY2 vs. JLR2 at three levels: biological process (BP), cellular component (CC), and molecular function (MF), to annotate gene functions and count the number of genes specifically enriched in the above pathways (Figure 3). The number of differentially expressed mRNAs identified in the comparison group of HYBSOY2 vs. JLR2 was generally higher than that in HYBSOY2 vs. JLCMS47B. A large number of genes were enriched in multiple biological processes in the BP category; in the CC category, more genes were enriched in the extracellular matrix and extracellular region pathways; the MF category had the largest number of enriched genes, with a large number of genes enriched in the heme binding and oxidoreductase activity pathways.
Figure 3.
GO enrichment map of differentially expressed mRNAs between HYBSOY2 and its parents.
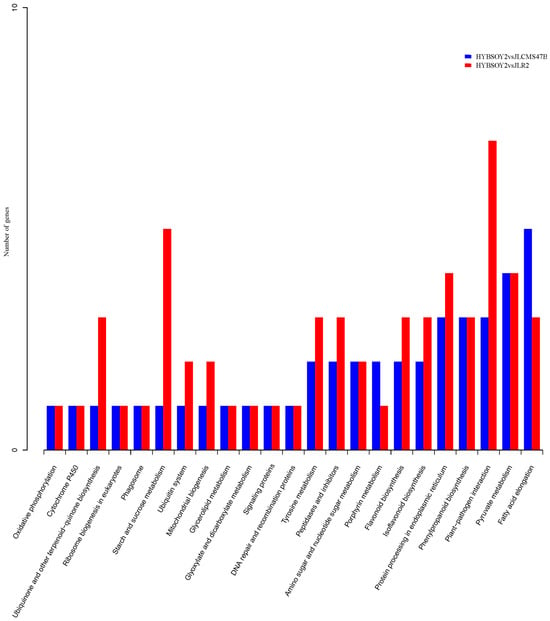
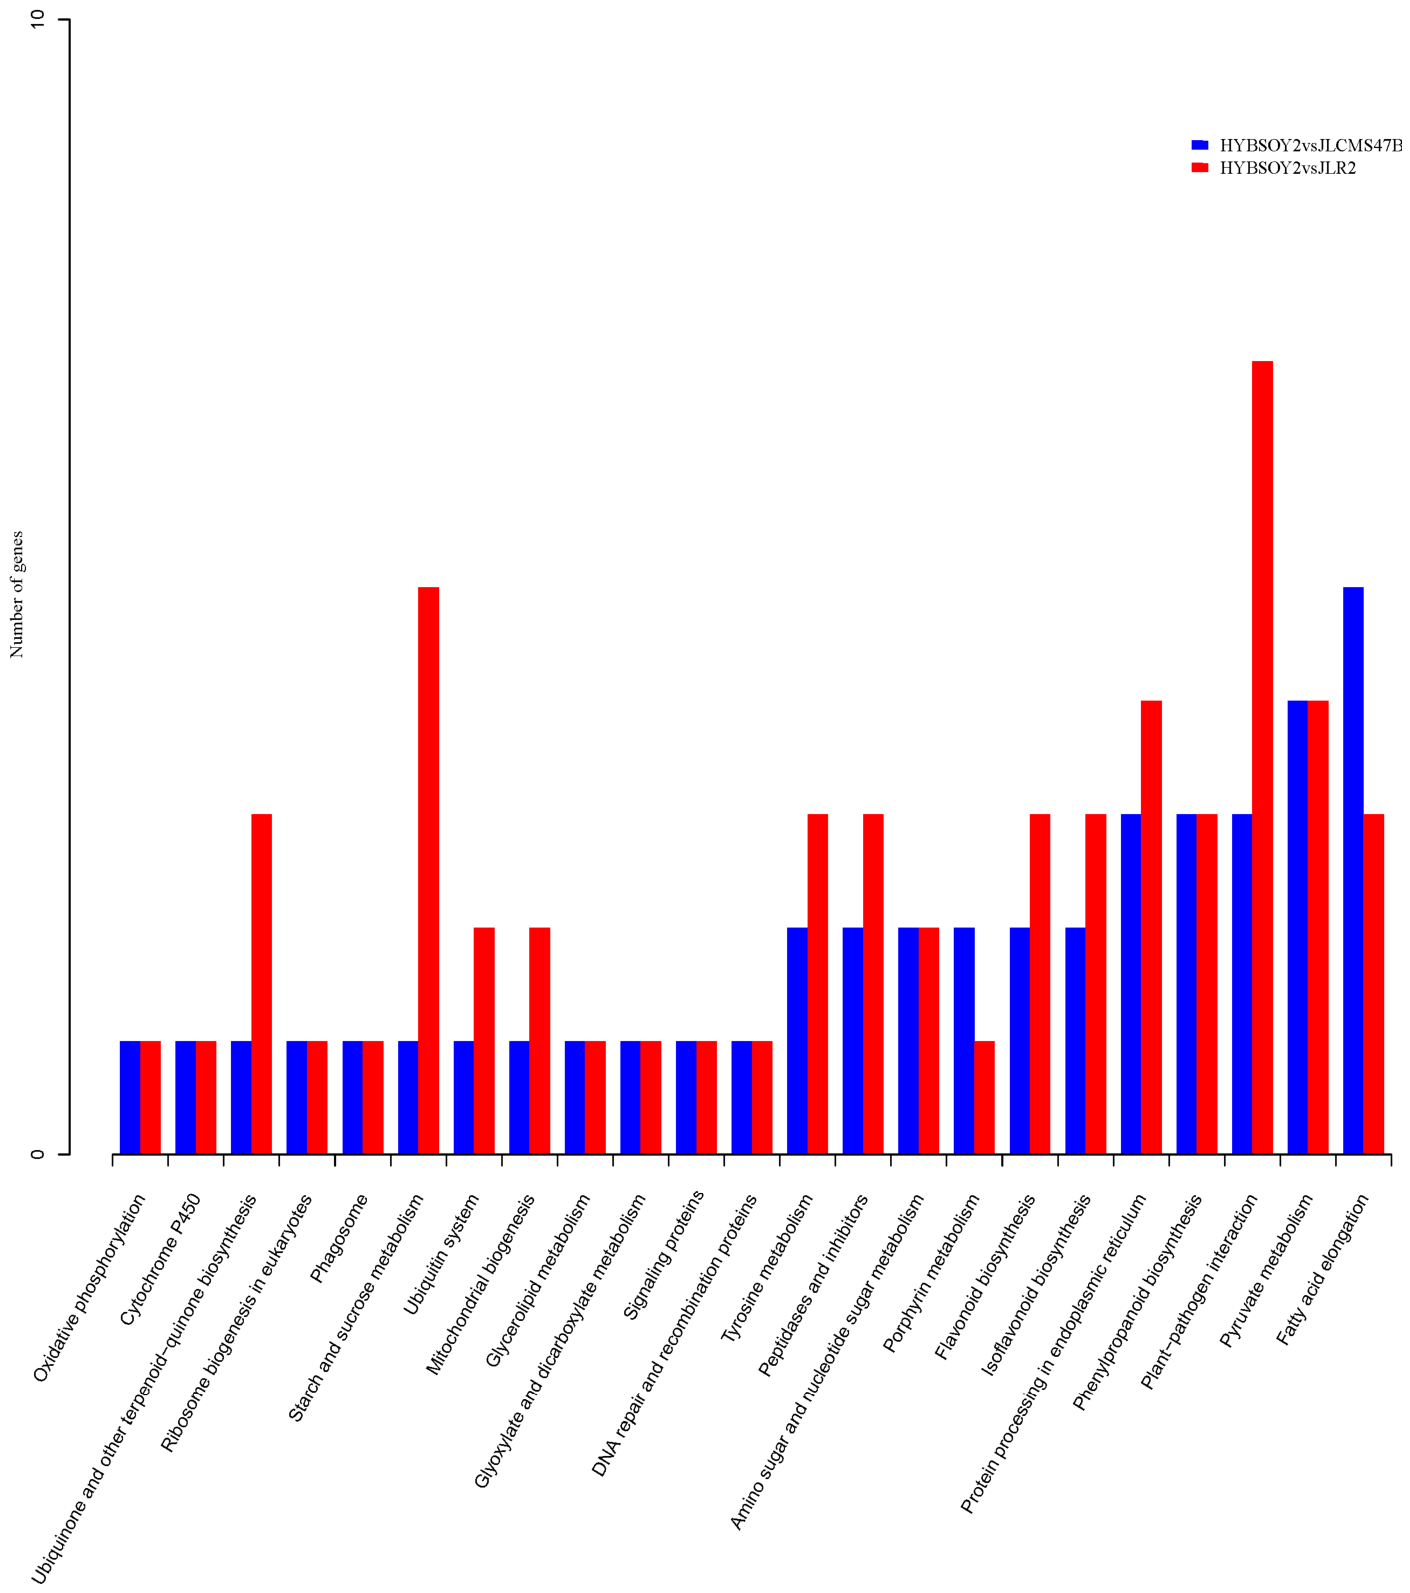
The KEGG classification of differentially expressed mRNAs identified in HYBSOY2 and the specific number of genes enriched in each pathway are shown in Figure 4. KEGG enrichment analysis of DEGs identified in HYBSOY2 was performed with a significance threshold of p-value < 0.05, and all DEGs were significantly enriched in five metabolic pathways: fatty acid elongation (gmx00062), pyruvate metabolism (gmx00620), flavonoid biosynthesis (gmx00943), tyrosine metabolism (gmx00350), and flavonoid biosynthesis (gmx00941).
Figure 4.
KEGG enrichment map of differentially expressed mRNA between HYBSOY2 and its parents.
The white background box indicates the gene or enzyme currently existing in this metabolic pathway, and the green background box indicates the gene or enzyme unique to the sequenced species. The numerical details refer to the international enzymology nomenclature EC number, and the red frame on the box indicates that the gene or enzyme is up-regulated.
Taking the flavonoid biosynthesis pathway as an example, the differential genes enriched in the flavonoid biosynthesis pathway are shown in Figure S1. Red outlines represent up-regulated genes or enzymes, and the genes or enzymes involved in this pathway regulate the biosynthesis of isoflavones through the following regulatory network. (Figure S1). These results strongly indicated the main pathways underlying the heterosis of HYBSOY2.
3.4. Analysis of Key Transcription Factors Encoded by Differentially Expressed mRNA
Identification in the comparison groups of HYBSOY2 vs. JLCMS47B and HYBSOY2 vs. JLR2 revealed a total of 787 transcription factors in HYBSOY2, belonging to 19 transcription factor families, including 23 WRKY, 21 MYB, 7 NAC, 6 bHLH, 4 C2H2, 3 AP2/ERF, 2 MADS, 2 B3, and 1 each of BES1, SWI/SNF, Pseudo ARR-B, CAMTA, HB, HSF, LOB, and LIM families. Analysis of the homologous gene functions and encoded transcription factor information of key differentially expressed mRNAs between HYBSOY2 and its parents found that the MYB family accounted for the highest proportion of transcription factors encoded by key differentially expressed mRNAs, and these transcription factors were mostly involved in plant growth and development or stress responses [29,30] (Table 5).
Table 5.
Information of partial differentially expressed mRNA encoding transcription factors between HYBSOY2 and its parents.
3.5. Non-Coding RNA Analysis
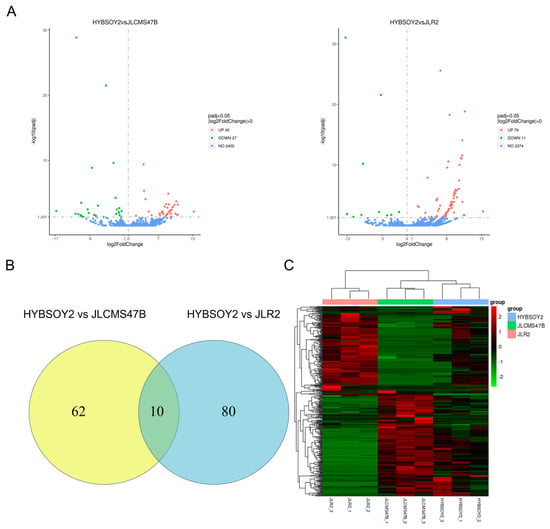
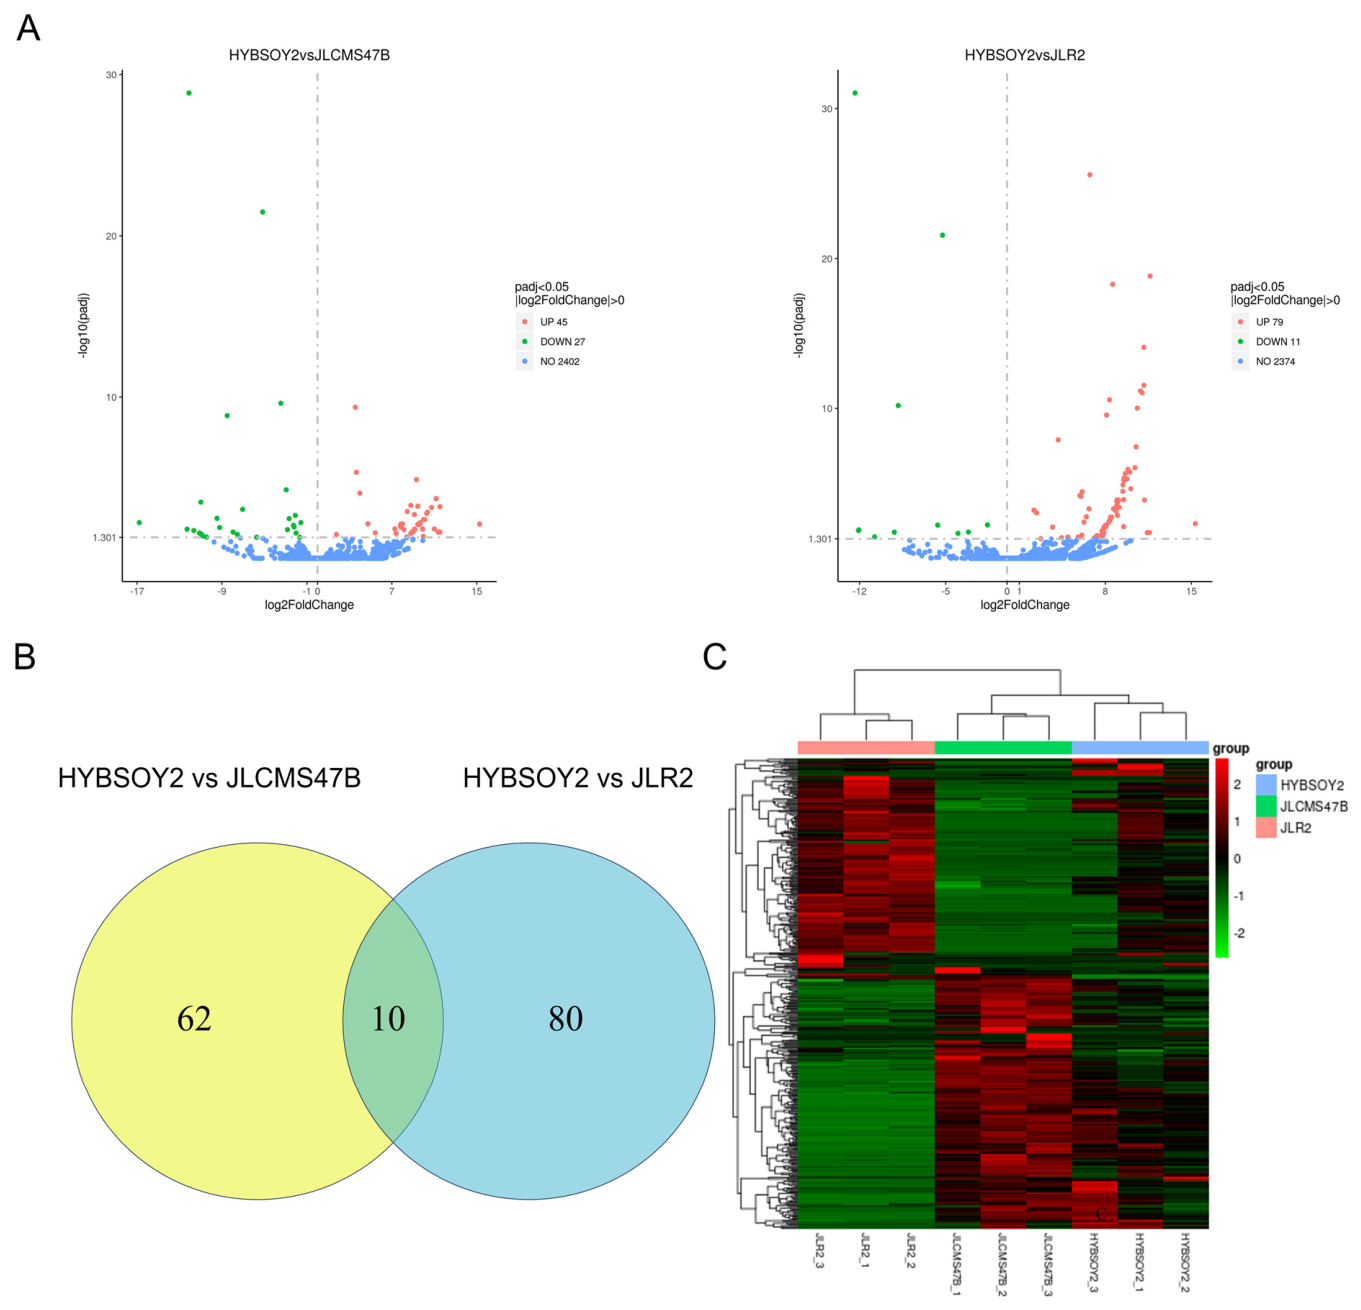
72 DE lncRNAs were identified in HYBSOY2 compared with JLCMS47B, including 45 up-regulated and 27 down-regulated DE lncRNAs; 90 DE lncRNAs were identified in HYBSOY2 compared with JLR2, including 79 up-regulated and 11 down-regulated DE lncRNAs (Figure 5A). Statistics on the number of DE lncRNAs in the filtered HYBSOY2 data shows that 152 DE lncRNAs were uniquely expressed in both the HYBSOY2 vs. JLCMS47B and HYBSOY2 vs. JLR2 groups, and only 10 DE lncRNAs were co-expressed in the two groups (Figure 5B). In addition, a cluster heatmap of DE lncRNAs shows that the expression pattern of HYBSOY2 was more similar to that of its female parent JLCMS47B (Figure 5C).
Figure 5.
Gene differential lncRNA expression between HYBSOY2 and its parents. (A) Number of differential genes between crosses. (B) Venn diagram of differentially expressed genes between HYBSOY2 and its parents. (C) Cluster analysis of differentially expressed genes.
The gene names and functions associated with the 10 co-expressed DE lncRNAs in the two comparison groups were counted. Among them, Glyma.12G232000, XLOC_048556, Glyma.07G105900, and XLOC_055821 were all up-regulated in HYBSOY2, while Glyma.19G038200, XLOC_028418, XLOC_049617, XLOC_025773, and XLOC_041489 were all down-regulated. Glyma.12G232000, which regulates ATP synthase, had the largest expression fold change of 15.32, and the functions of other genes were unknown (Table S3).
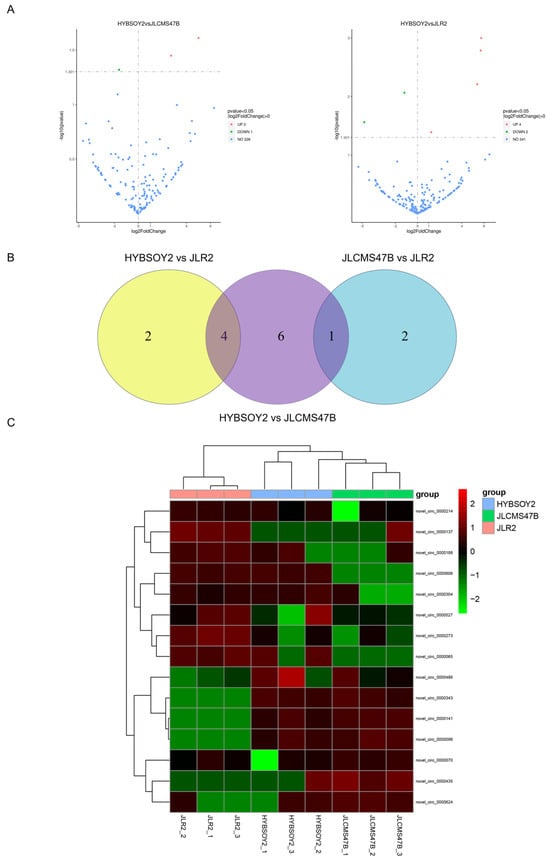
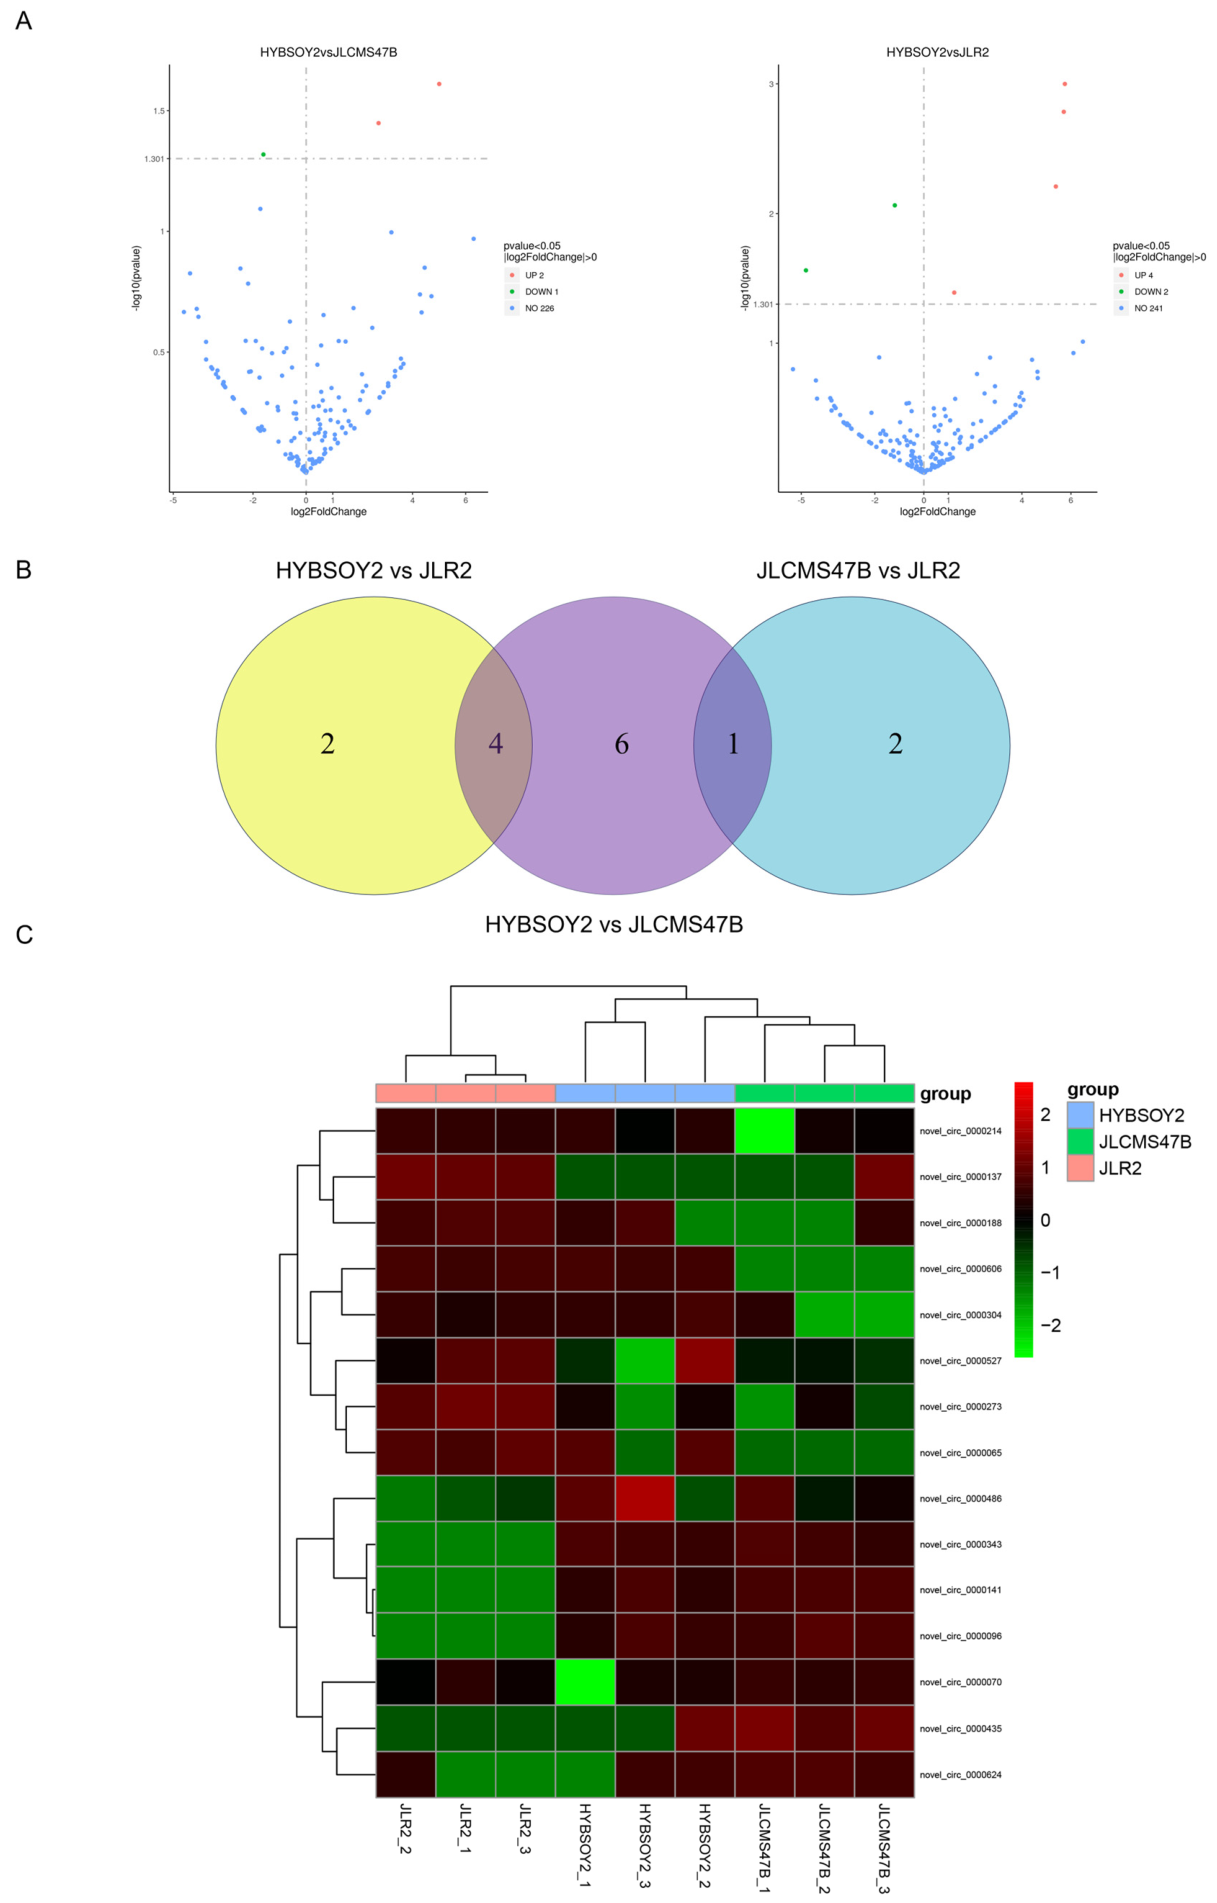
Three DE circRNAs were identified in HYBSOY2 compared with JLCMS47B, including 2 up-regulated and 1 down-regulated genes; six DE circRNAs were identified in HYBSOY2 compared with JLR2, including 4 up-regulated and 2 down-regulated genes. No common expressed genes were found in the comparison groups of HYBSOY2 vs JLCMS47B and HYBSOY2 vs JLR2 (Figure 6A,B). The cluster heatmap of DE circRNAs shows that the circRNA expression pattern of HYBSOY2 was more similar to that of its female parent JLCMS47B (Figure 6C).
Figure 6.
Differential expression of cricRNA between the hybrid and its parents. (A) Number of differential genes between crosses; (B) Venn diagram of differentially expressed genes between HYBSOY2 and its parents; (C) Cluster analysis of differentially expressed genes.
Statistical analysis of DE circRNAs between HYBSOY2 and JLCMS47B found that novel_circ_0000606 and novel_circ_0000304 were up-regulated genes, with novel_circ_0000606 having the largest expression fold change of 5.01; novel_circ_0000070 was a down-regulated gene with the smallest expression fold change of 1.61. The functions of the above DE circRNAs were all unknown (Table S4).
Statistics analysis of DEGs between HYBSOY2 and JLR2 found that novel_circ_0000343, novel_circ_0000141, novel_circ_0000096, and novel_circ_0000486 were up-regulated genes, with novel_circ_0000343 having the largest expression fold change of 5.75; novel_circ_0000273 and novel_circ_0000137 were down-regulated genes, with novel_circ_0000273 having the smallest expression fold change of 1.18. The functions of the above DE circRNAs were all unknown (Table S5).
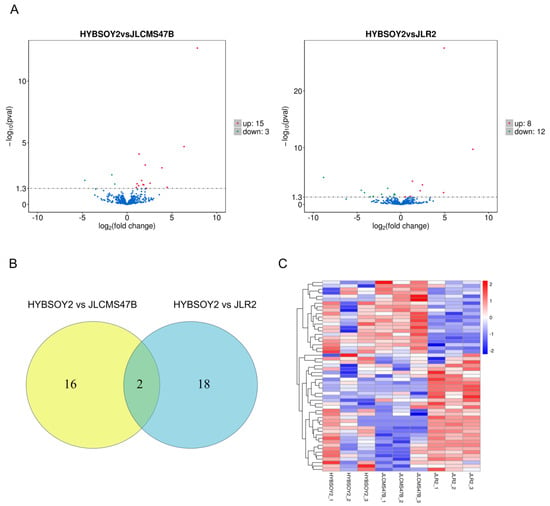
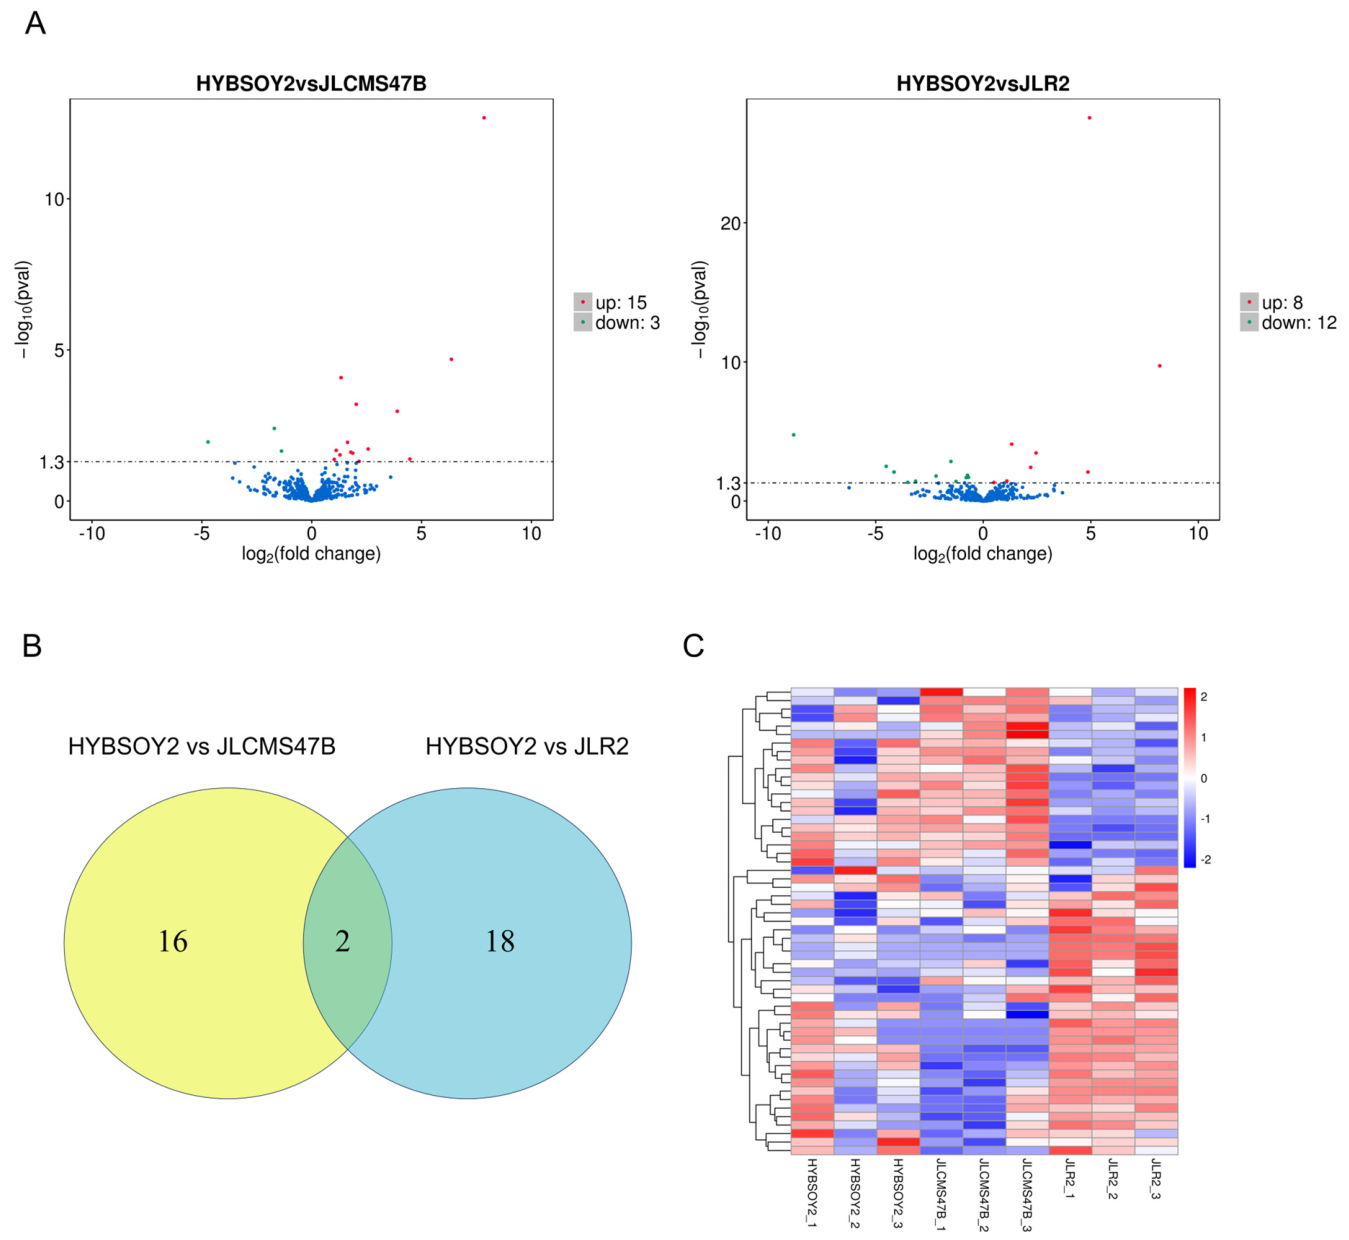
A total of 18 DE miRNAs were identified in HYBSOY2 compared with JLCMS47B, including 15 up-regulated and 3 down-regulated DE miRNAs; 20 DE miRNAs were identified in HYBSOY2 compared with JLR2, including 8 up-regulated and 12 down-regulated DE miRNAs (Figure 7A). Statistics of DE miRNAs in the comparison groups of the hybrid vs its parents by Venn diagram shows that 36 DE miRNAs were uniquely expressed in both the HYBSOY2 vs JLCMS47B and HYBSOY2 vs JLR2 groups, and only 2 DE miRNAs were co-expressed in the two groups (Figure 7B). In addition, the cluster heatmap of DE miRNAs shows that the miRNA expression pattern of HYBSOY2 was more similar to that of its female parent JLCMS47B (Figure 7C).
Figure 7.
Differential expression of miRNAs between the hybrid and its parents. (A) Number of differential genes between crosses; (B) Venn diagram of differentially expressed genes between HYBSOY2 and its parents; (C) Cluster analysis of differentially expressed genes.
Statistics of DE miRNAs in the HYBSOY2 vs JLCMS47B group shows that 15 genes from gma-miR10421 to novel_82 were up-regulated DE miRNAs, and 3 genes from gma-miR399i to gma-miR4365 were down-regulated DE miRNAs. The expression level of gma-miR396d was 31.96 in HYBSOY2 and 15.63 in JLCMS47B (Table S6).
Statistics of DE miRNAs in the HYBSOY2 vs JLR2 group shows that 8 genes (from gma-miR10417 to novel_201) were up-regulated and 12 genes (from gma-miR171k-5p to novel_185) were down-regulated. The expression level of gma-miR4416c~3p in HYBSOY2 was 8.80, with the largest expression fold change, and the expression level of novel_17 was 0.50, with the smallest expression fold change. The expression level of gma-miR172k-5p in HYBSOY2 was 44.44, while the expression level of gma-miR172c was 0.19 in HYBSOY2 and 4.82 in JLR2, showing a significant decrease in HYBSOY2 (Table S7).
3.6. Verification of Differential Expression Analysis
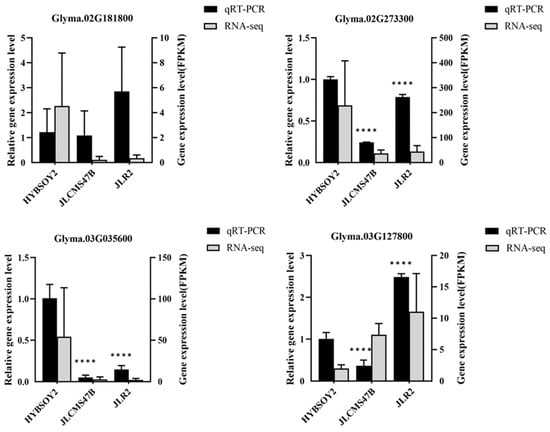
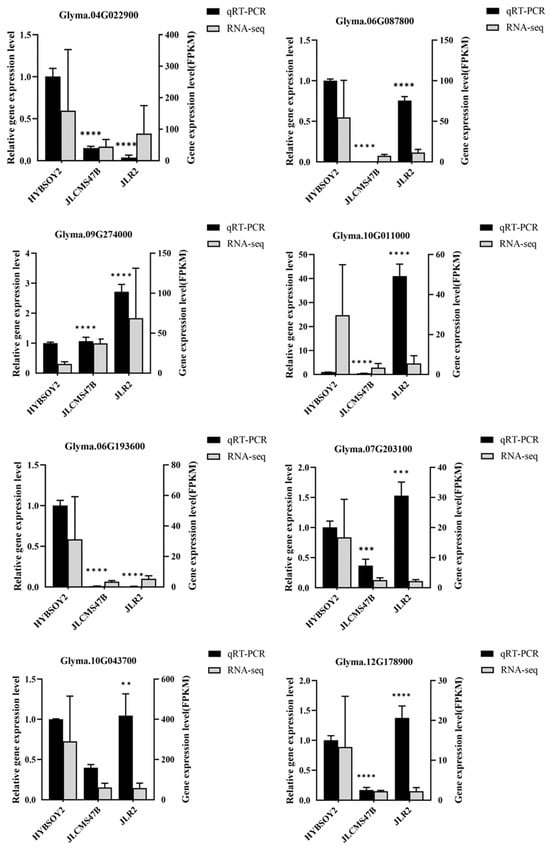
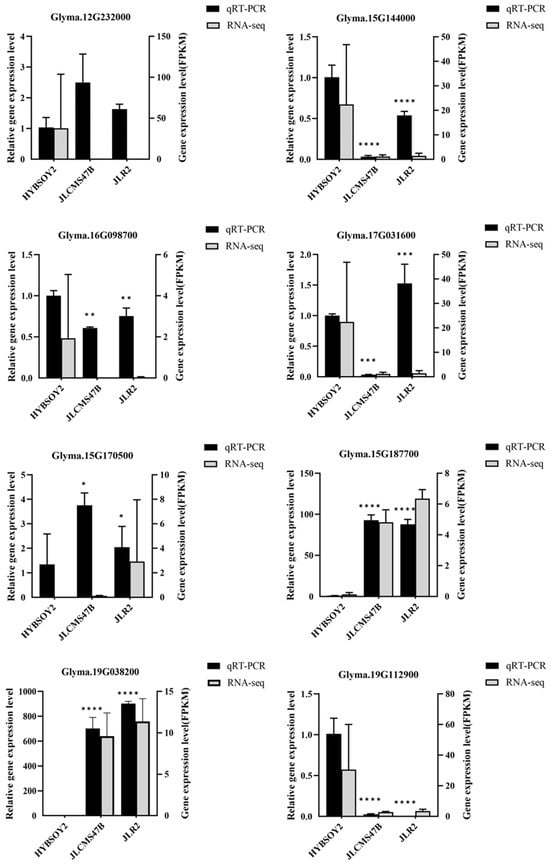
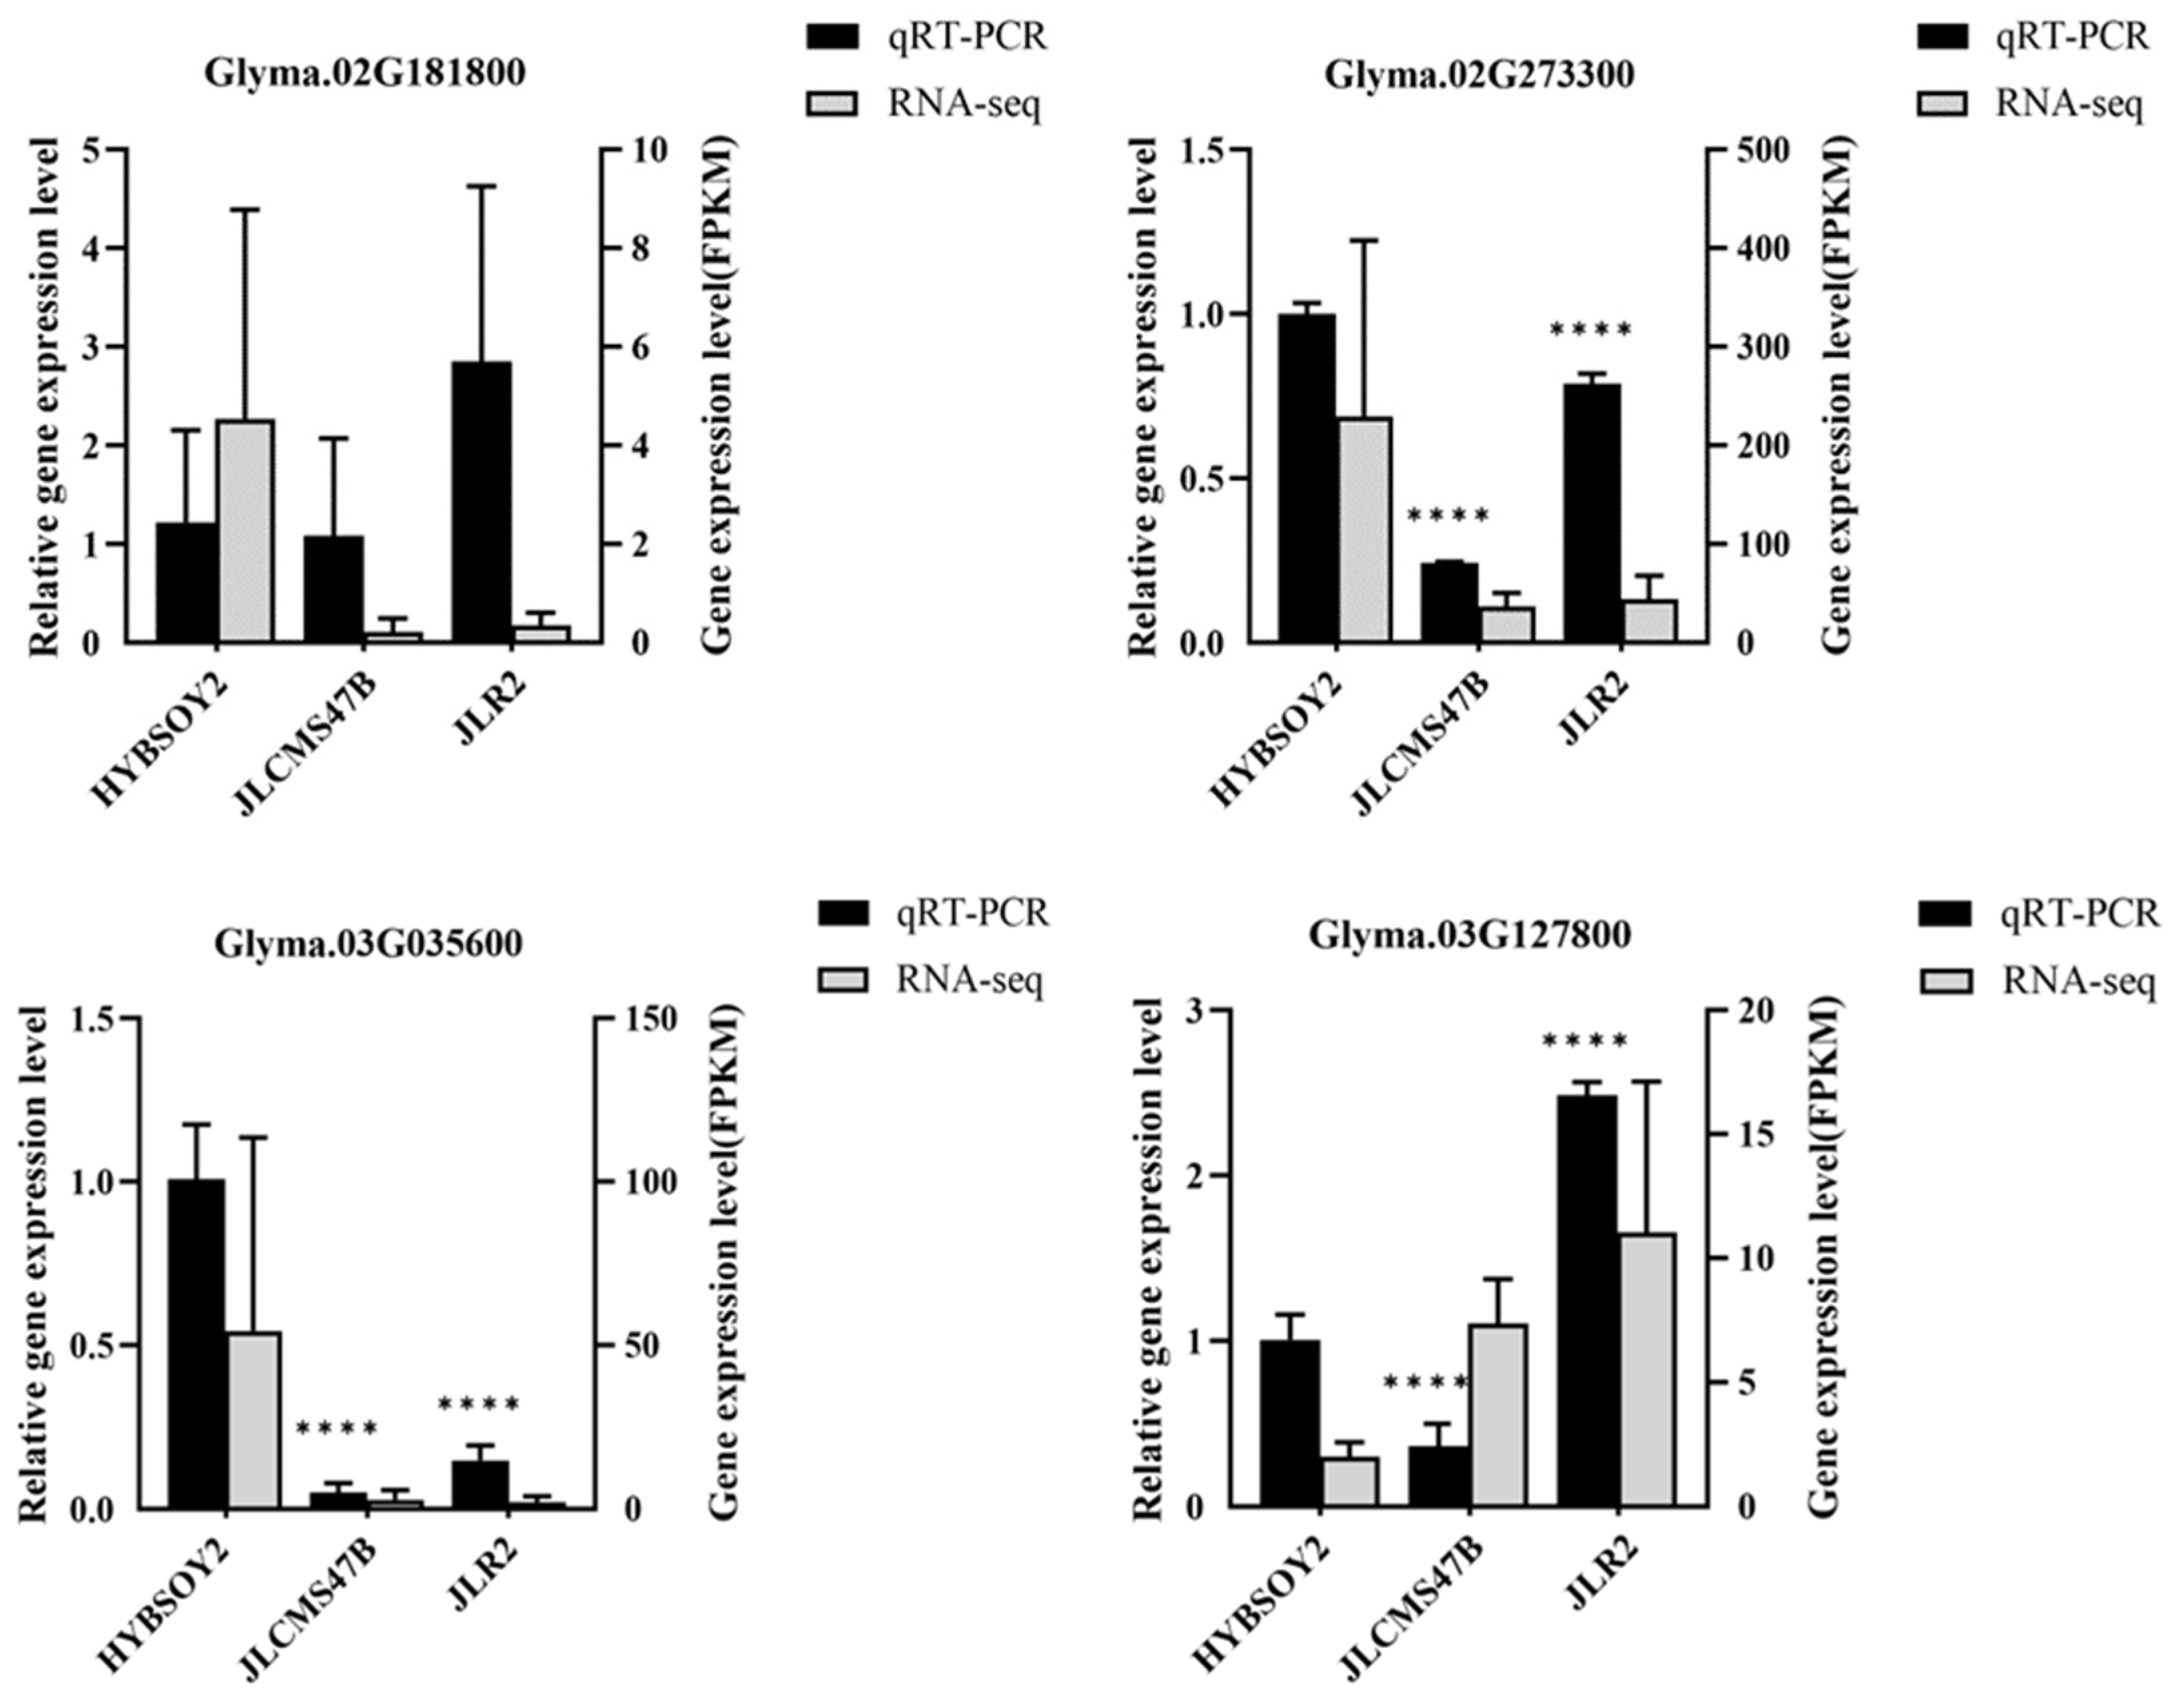
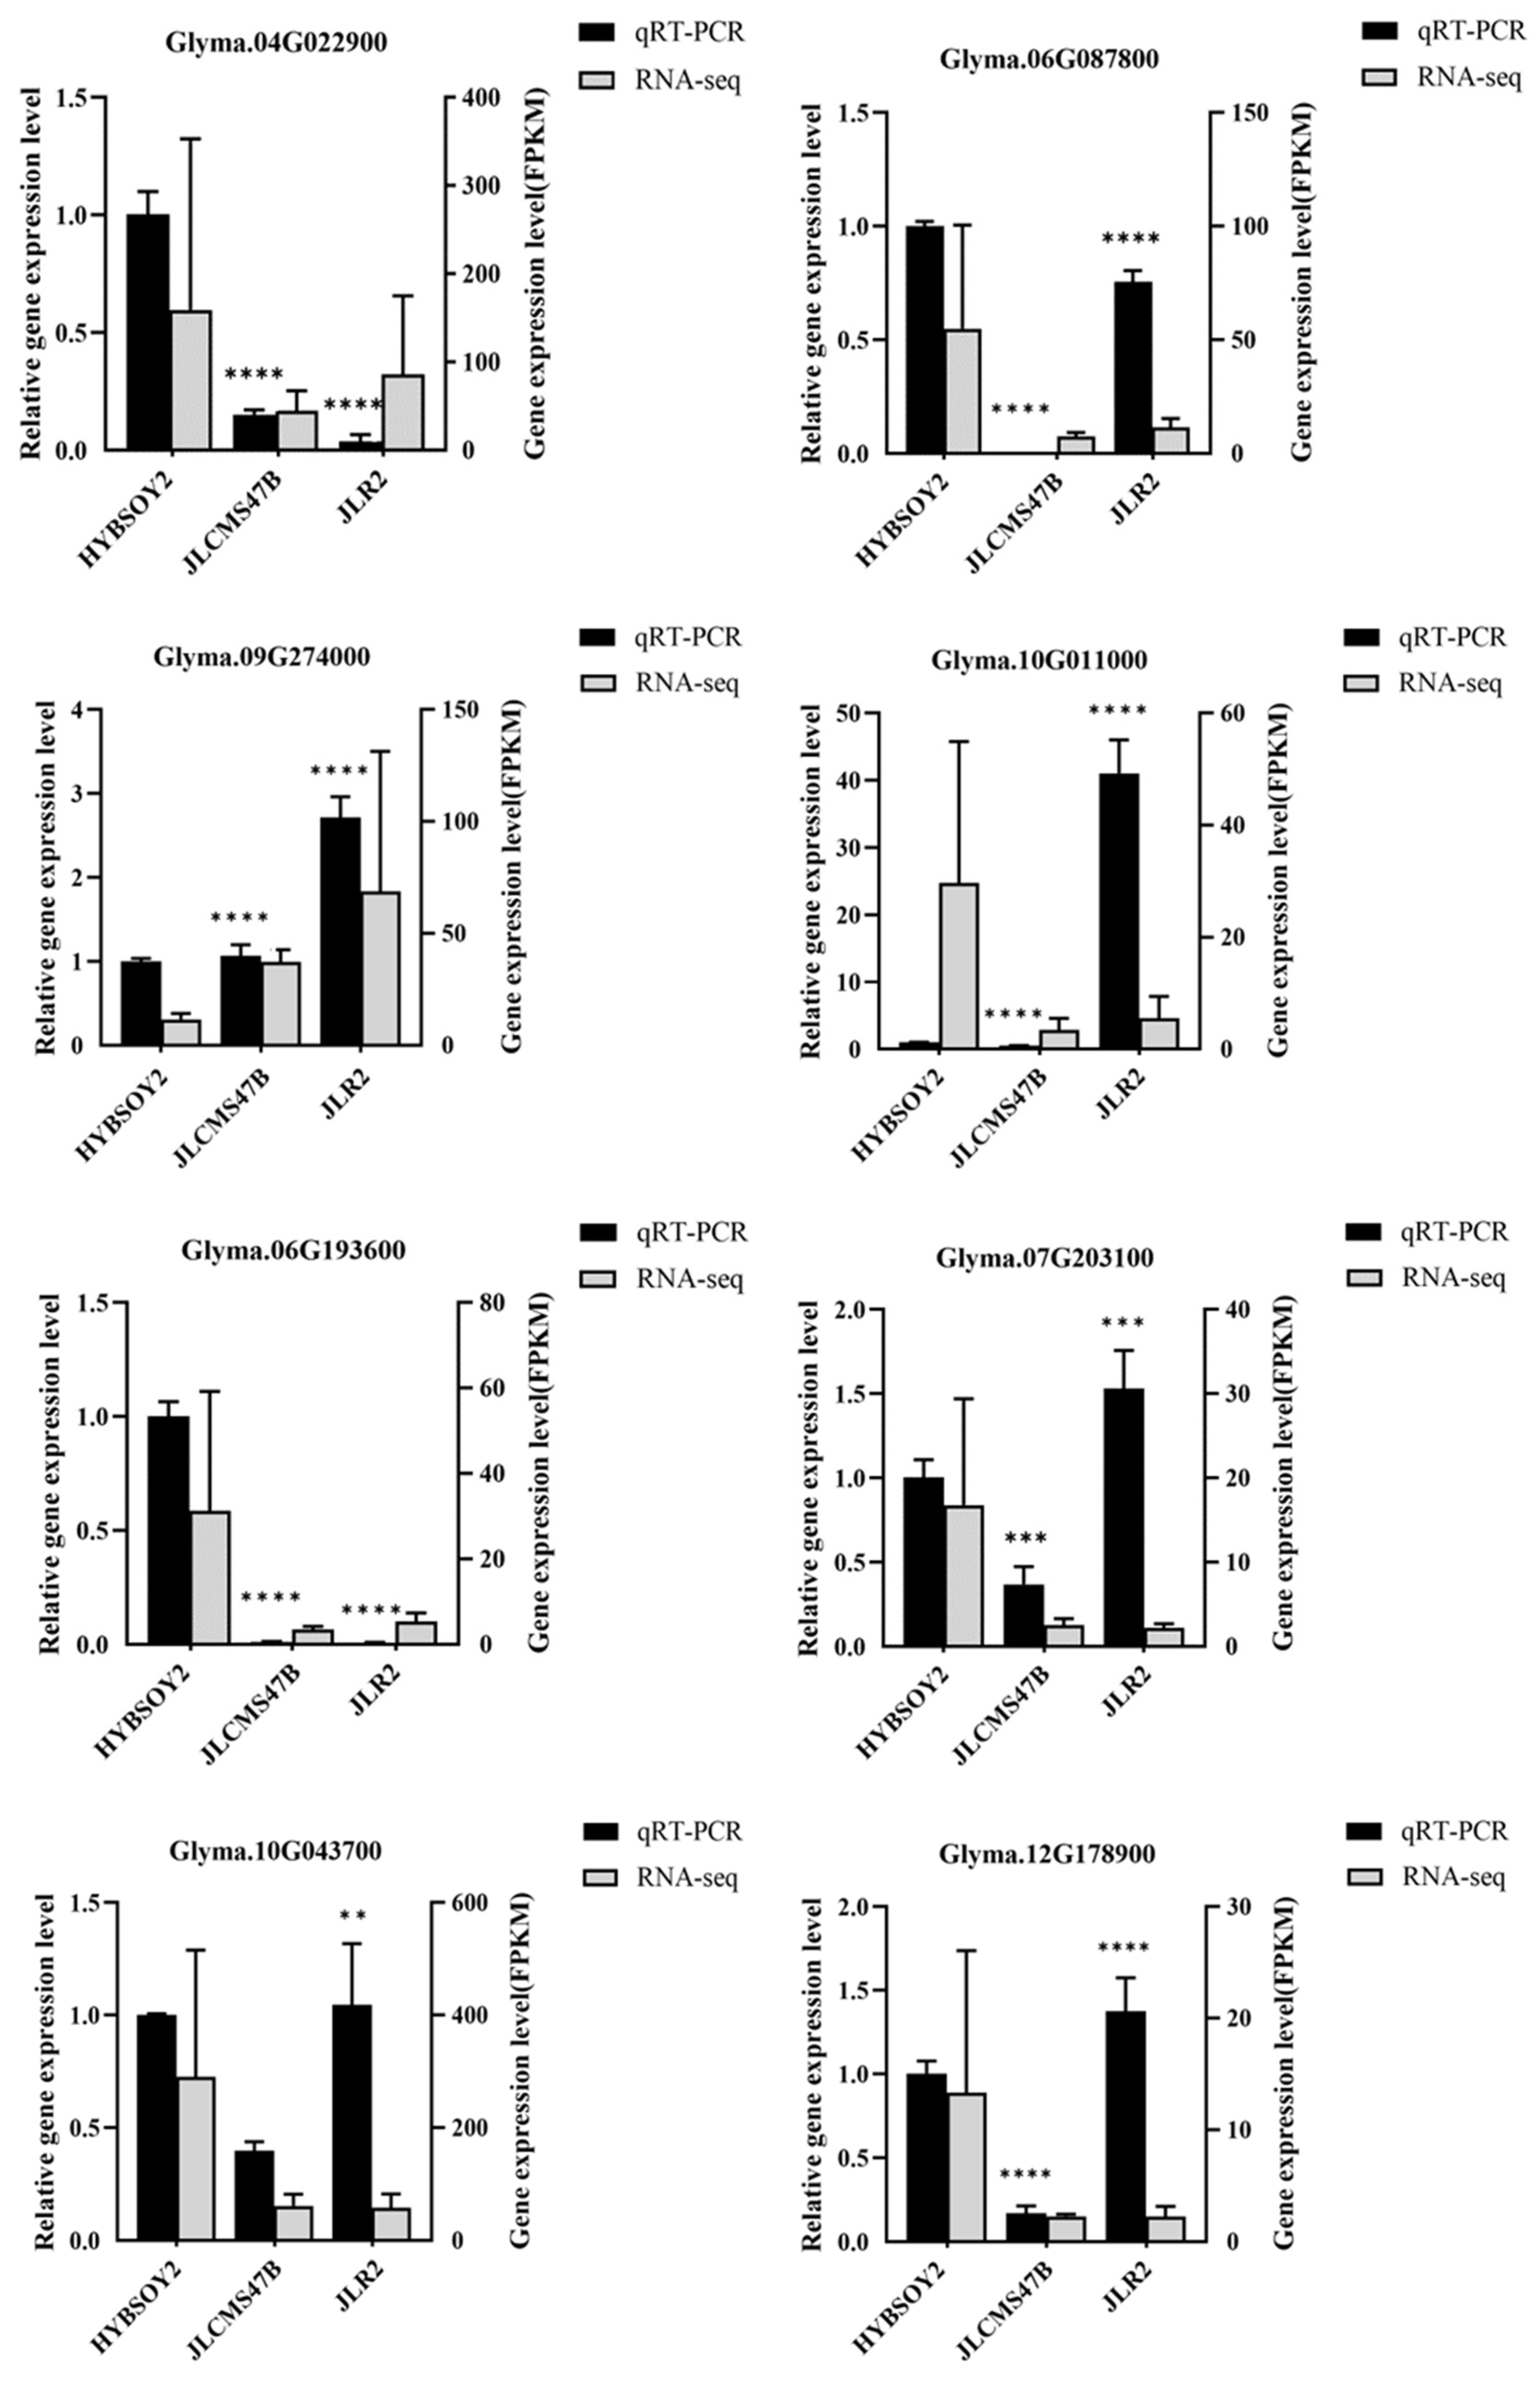
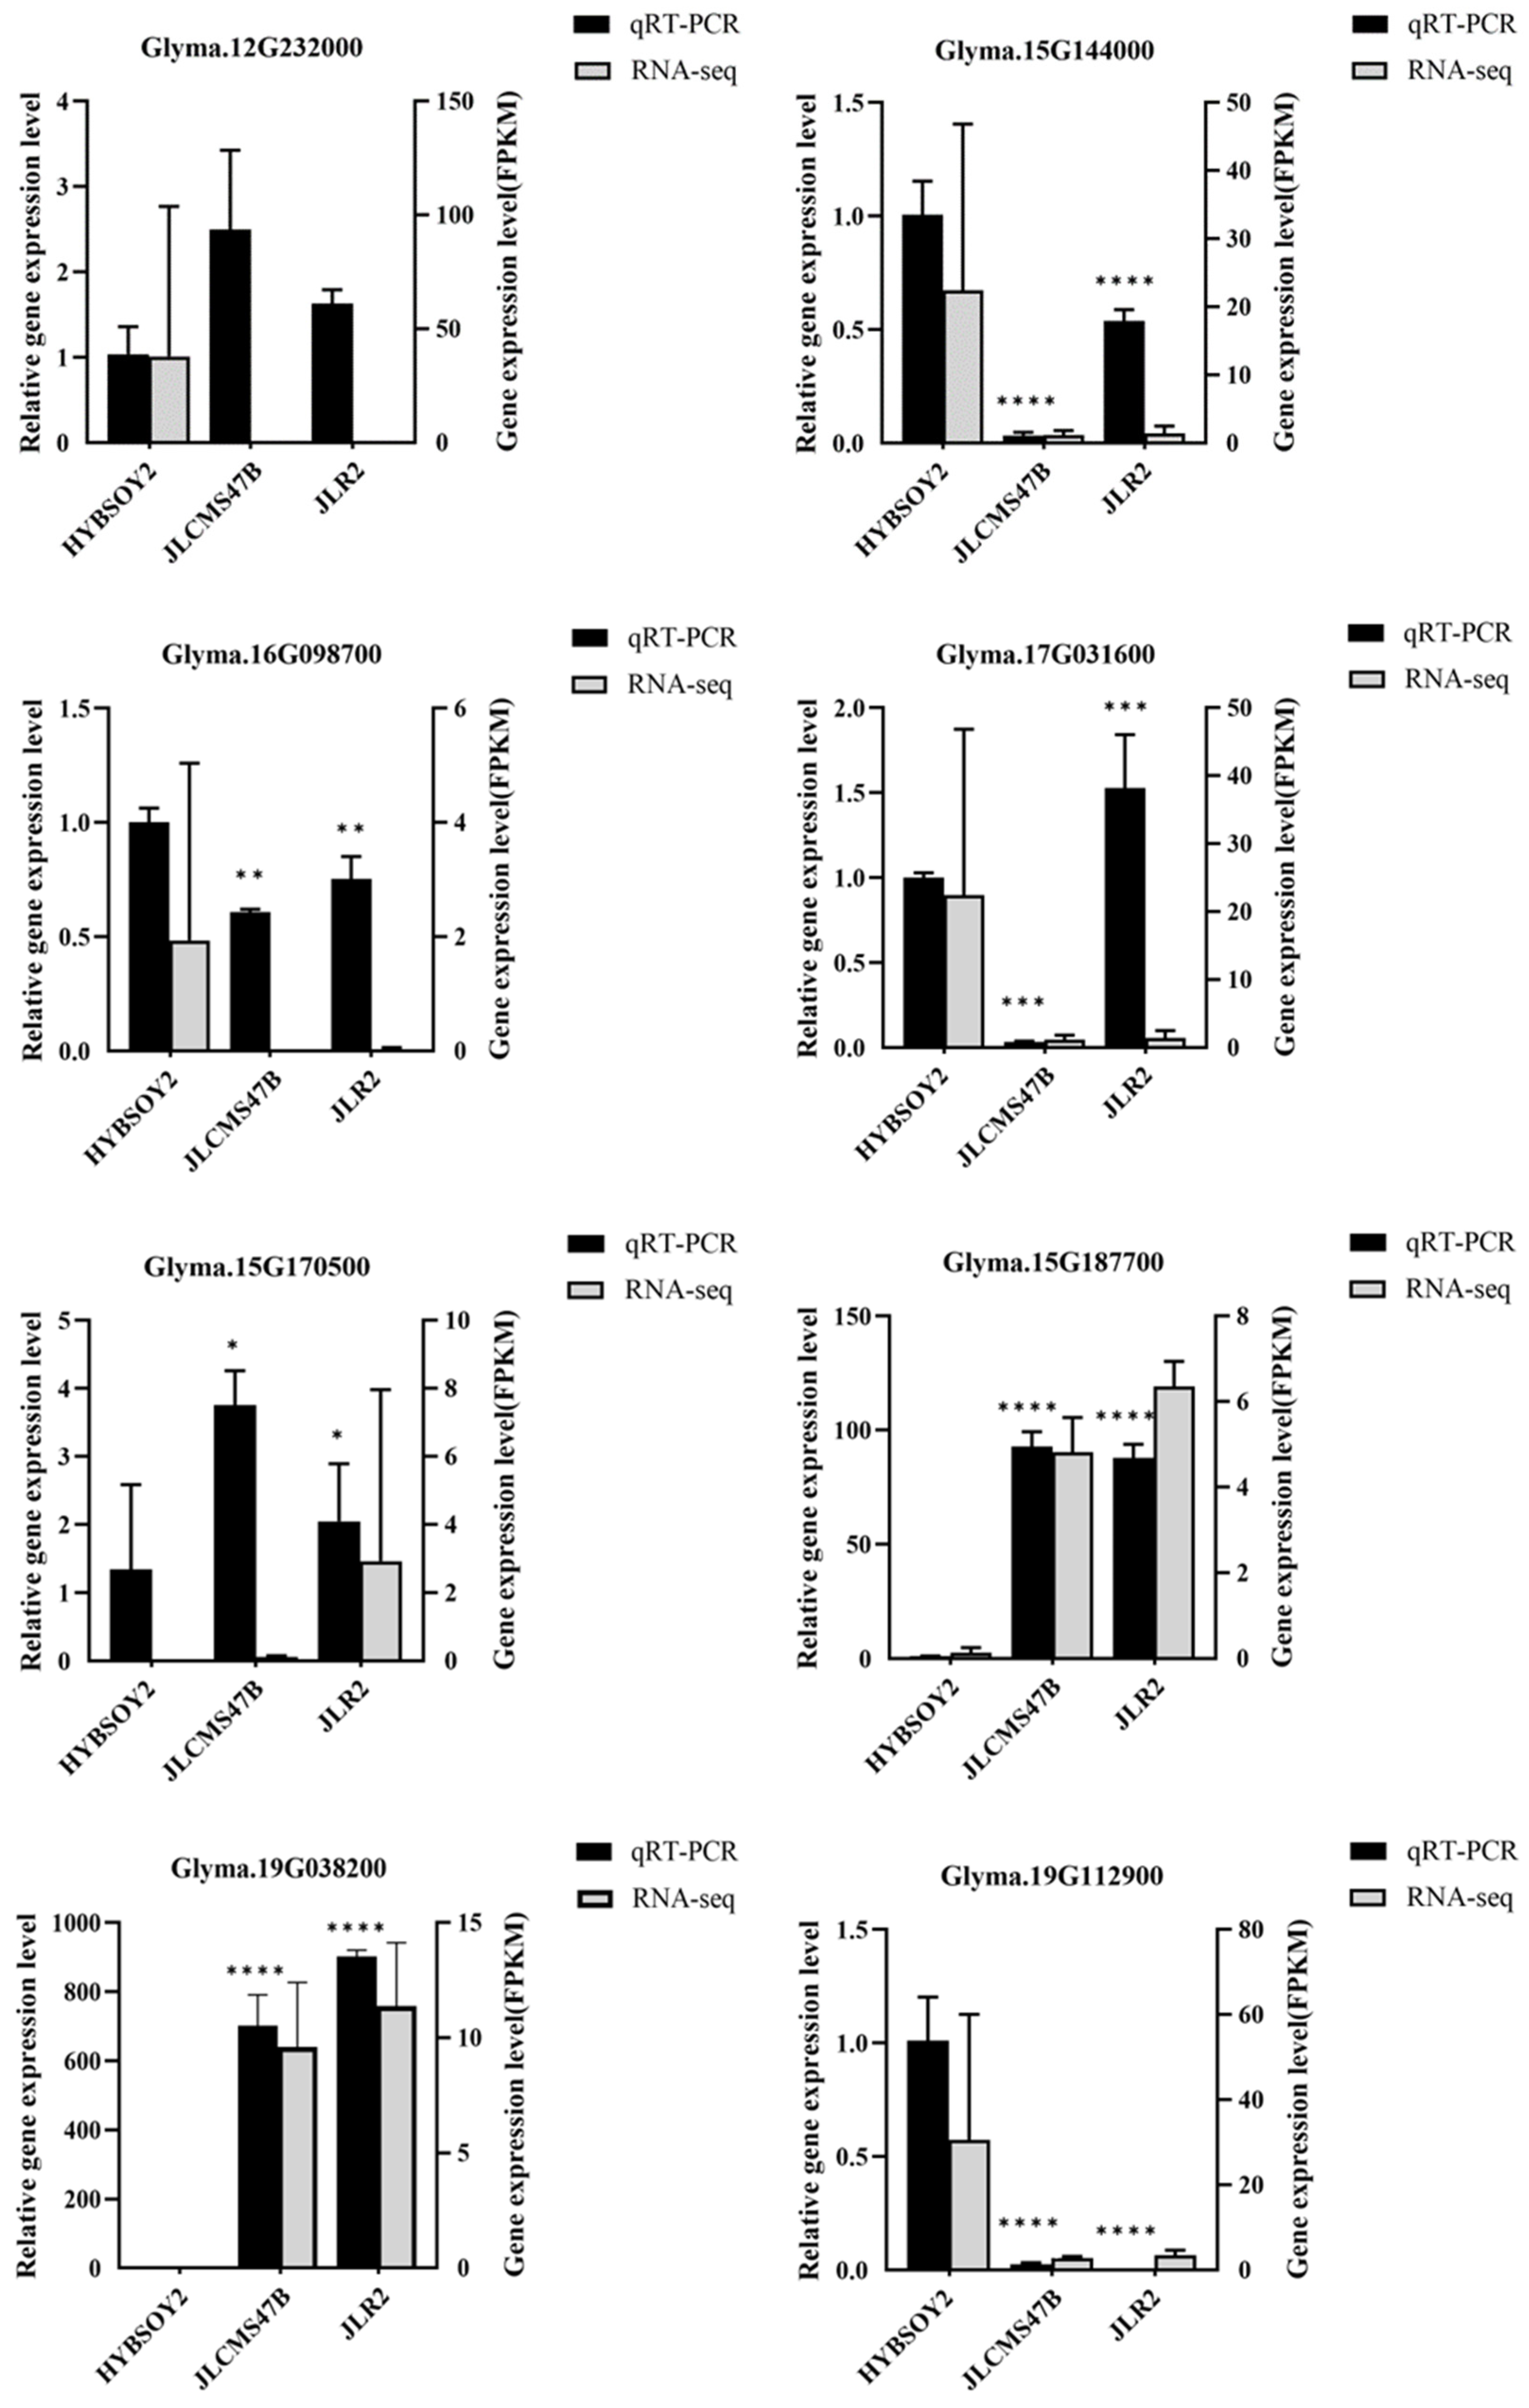
With the relative gene expression level of HYBSOY2 as control, 20 DEGs were selected for expression level validation by qRT-PCR in HYBSOY2, JLCMS47B, and JLR2 to further screen soybean heterosis-related genes (Figure 8).
Figure 8.
Comparison of sequencing results of key differentially expressed genes and qRT-PCR expression levels. ‘*’ indicate in qRT-PCR there were significant differences between HYBSOY2 and the parental lines p < 0.05, ‘**’ means p < 0.01, ‘***’ means p < 0.001, ‘****’ means p < 0.0001.
Comparison of the relative expression levels of key DEGs shows no significant differences in the relative expression levels of Glyma.02G181800 and Glyma.12G232000. The expression levels of Glyma.12G178900, Glyma.10G011000, Glyma.07G203100, Glyma.17G031600, Glyma.10G043700, and Glyma.03G127800 shows different trends (consistent up-regulation or down-regulation) between HYBSOY2 and its parents, while the expression levels of the other 12 DEGs shows the same trends between HYBSOY2 and its parents.
4. Discussion
DEGs between the hybrid and its parents are considered to be related to heterosis, but the molecular genetic mechanism of heterosis remains unclear [53,54,55]. In this study, we performed whole-transcriptome profiling on the first trifoliolate leaf of HYBSOY2 and its parents at the V1 stage [56], and key DEGs were screened and validated by qRT-PCR. This study verified the results of whole transcriptome analysis by qRT-PCR of 20 key DEGs, and the expression of these genes was basically consistent with the whole transcriptome results, indicating that the whole transcriptome data were true and reliable. In this study, a total of 57 co-expressed DEGs were identified in the comparison groups of HYBSOY2 and its parents, and these genes may be involved in the generation of heterosis.
4.1. Phenotypic Comparative Analysis of F1 Hybrids
Biscoe et al. [57] found that soybean yield was greatly affected by the number of pods per plant, while hundred-seed weight had a small effect on soybean yield. Meanwhile, soybean yield was closely related to the number of nodes per stem and grain yield per plant [58]. In this study, comparison of agronomic trait data of HYBSOY2 and its parents found that the hybrid HYBSOY2 exhibited significant heterosis in four agronomic traits: plant height, number of nodes per stem, number of primary branches, number of pods per plant, and grain yield per plant. It is speculated that the above four traits contribute to the high yield of the HYBSOY2 hybrid, but the specific physiological mechanism remains to be further studied.
4.2. Contribution of mRNA in the Screening of Plant Heterosis-Related Genes
Zhang et al. [22] identified 26 DEGs common to the two soybean hybrids HYBSOY-1 and HYBSOY-5 as potential heterosis genes based on the differential expression of mRNA in transcriptome sequencing, and found that DEGs were enriched in the extracellular region, extracellular region part, biological process, catalytic activity, molecular function, and secondary metabolite synthesis pathways. Shu et al. [9] screened DEGs in pepper parents and their hybrids according to mRNA expression levels, and found through GO and KEGG analysis that DEGs were significantly enriched in biological process, cellular component, and molecular function pathways, providing molecular resources for further explaining the pepper heterosis mechanism. Zhang et al. [59] found multiple interacting genes in rapeseed hybrids by comparing differentially expressed mRNAs of two rapeseed parents and their hybrids, and provided candidate genes related to heterosis.
GO analysis of the differentially expressed mRNAs identified in this study found that they were all enriched in biological process, cellular component, and molecular function pathways; KEGG analysis found significant enrichment in secondary metabolite synthesis pathways. In addition, 12 genes that may be involved in the formation of heterosis were further screened by qRT-PCR, providing new reference loci for the identification and utilization of heterosis genes.
4.3. Importance of Metabolic Processes for Heterosis
Metabolic processes produce compounds, such as fatty acids and flavonoids, that affect seed coat growth, which are crucial for seed development. In pepper hybrids, genes in the plant hormone signal transduction pathway were significantly up-regulated, indicating that hormone-regulated metabolic processes may promote heterosis by affecting cell division, expansion, and differentiation [9]. Similarly, metabolic pathways and secondary metabolite biosynthesis pathways were significantly enriched in soybean hybrids, and genes related to photosynthesis and carbohydrate metabolism in particular showed non-additive expression patterns, further supporting the importance of metabolic processes in heterosis [22]. Genes involved in metabolic processes in maize hybrids showed high activity at both the transcriptional and translational levels, indicating that the efficient expression of these genes may be an important driving force for heterosis [12]. The regulation of metabolic processes involves not only the transcriptional level of genes but also post-transcriptional modification and translation efficiency. m6A modification in maize hybrids significantly affected the translation efficiency of metabolism-related genes, indicating the important role of post-transcriptional modification in metabolic regulation [12]. These findings are consistent with previous studies, suggesting that the fine regulation of metabolic processes is one of the key factors in the formation of heterosis [60,61].
The importance of metabolic processes in heterosis is reflected at multiple levels, including gene transcription, post-transcriptional modification, and translation efficiency. Future research should further explore the functions of key genes in metabolic pathways and their specific mechanisms of action in heterosis, in order to provide new theoretical basis and technical support for crop breeding.
4.4. Regulation of Heterosis by miRNA
As an important class of non-coding RNA molecules, miRNAs play a key role in the post-transcriptional regulation of gene expression, especially in the formation of heterosis. In pepper hybrids, the expression of miRNAs such as miR156, miR169, and miR369 was significantly down-regulated, and these miRNAs are considered to be closely related to plant growth and stress responses [9]. miR156 affects plant growth, development, and flowering time by regulating its target genes (e.g., SPL transcription factors), and its down-regulation in hybrids may promote the manifestation of growth advantages [62,63].
In the comparison group of HYBSOY2 vs its female parent JLCMS47B in this study, gma-miR396d was identified as a differentially expressed miRNA, with an expression level of 31.96 in the hybrid and 15.36 in JLCMS47B, and no significant difference in expression level with the male parent JLR2. It is speculated that gma-miR396d may exert a dominant effect and produce heterosis effects by activating leaf proliferation and enhancing plant drought tolerance. In the comparison group of the hybrid vs its male parent, miR171k-5p, miR172c, and miR172d shows significant differences and a large decrease in expression level relative to the female parent, suggesting that they also exert a dominant effect and are involved in regulating chlorophyll synthesis and hormone biosynthesis to affect yield, thus influencing heterosis. miR9724b and novel_185, which shows differential expression in both comparison groups, had expression levels between those of the parents, suggesting that they may produce mid-parent heterosis and have a beneficial effect on hybrid growth. However, their gene functions and mechanisms of action are not yet clear, and their role in plant heterosis remains to be further studied.
4.5. The Impact of lncRNAs on Heterosis Formation
lncRNAs are closely related to plants’ responses to abiotic stress, biotic stress, photomorphogenesis, and flowering time regulation [64,65,66,67]. Studies have shown that lncRNAs can influence gene expression by regulating chromatin modifications, transcription factor activity, or RNA splicing [68]. In addition, lncRNAs may also affect gene expression levels by modulating mRNA stability or translation efficiency, thereby playing a role in the formation of heterosis [12]. Bai et al. [69], through RNA sequencing data of 26 pineapple (Ananas comosus) leaves at 13 different time points, found that in the highly representative GO pathway for cation/H+ transport, 18 of the genes included belong to the ATP synthase family, which plays an important role in pineapple growth and development. It can be seen that lncRNAs influence plant growth and development by enhancing seed vigor, regulating plant responses to abiotic stress, and participating in ion transport.
In this study, lncRNAs related to seed vigor and regulation of plant responses to abiotic stress were not found, but lncRNAs that can regulate ATP synthase were found. Its associated gene is Glyma.12G232000, which shows significant differential expression in both the hybrid and its parents. Meanwhile, some DE lncRNAs’ associated mRNAs also show differential expression, collectively contributing to soybean heterosis. Although the mechanism of lncRNA in heterosis is not fully understood, its diversity and complexity in gene expression regulation indicate that lncRNAs may be one of the key regulatory factors in heterosis formation. Future research should further explore the interaction network between lncRNAs and their target genes, and how these interactions affect the growth, development, and stress response of hybrids, thus providing new molecular targets and theoretical support for crop breeding.
4.6. Contribution of Transcription Factors to Heterosis
Transcription factors are a class of DNA-binding proteins that regulate gene transcription and play a key role in the formation of heterosis [70,71,72]. Studies have shown that many transcription factors are closely related to plant growth, development, and stress resistance. For example, WRKY family transcription factors not only participate in the plant response to biotic and abiotic stresses but also regulate carbohydrate synthesis, development, and the synthesis of secondary metabolites. WRKY proteins bind to W-box elements in the promoters of target genes to activate or suppress the expression of downstream genes, thereby regulating plant defense responses [73]. In addition, MYB transcription factors play important roles in plant growth, development, and responses to abiotic stresses [74], while the bHLH family plays a key role in hormone signal transduction and response to abiotic stress [75]. C2H2-type zinc finger proteins have also been shown to have important functions in enhancing plant tolerance to multiple abiotic stresses [76].
In this study, among the transcription factors associated with differentially expressed mRNAs, the MYB family accounted for the highest proportion, followed by C2H2-type transcription factors. Most transcription factors exhibited an overdominantly up-regulated expression pattern, while only a few shows an overdominantly down-regulated pattern. Among them, Glyma.06G193600 and Glyma.17G031600 influence the growth and development of the hybrid by regulating MYB transcription factors and exhibited an overdominantly up-regulated expression pattern in hybrids. The homologous functions of these two genes are related to stress resistance and flavonoid biosynthesis, indicating that they play important roles in the regulation of secondary metabolism and the response to abiotic stress in hybrids, thereby affecting the formation of heterosis. In addition, the C2H2-type zinc finger protein gene Glyma.12G178900 also exhibited an overdominantl up-regulated expression pattern, with homologous functions related to promoting ear and plant growth and enhancing resistance to abiotic stresses, suggesting that it plays a significant role in the formation of hybrid vigor.
In addition, this study confirmed that the transcriptional regulation of heterosis shows prominent stage specificity at the seedling and flowering stages, which also leads to differences in core candidate genes relative to those reported by Zhang et al. [22]. Several novel candidate genes were identified in this study, including two MYB transcription factors (Glyma.06G193600, Glyma.17G031600), gma-miR396d functioning in leaf development and drought tolerance, gma-miR172c participating in flowering regulation, as well as differentially expressed lncRNAs that target the ATP synthase gene Glyma.12G232000. In particular, transcription factors modulate the expression of genes governing plant growth, development, and stress resistance, thereby exerting crucial functions in heterosis formation. Our newly identified genes further complement the molecular regulatory basis of soybean heterosis.
5. Conclusions
In this study, whole transcriptome analysis was used to study the heterosis of soybean hybrid and their parents at the V1 stage. A large number of DEGs and novel ncRNAs were identified in the three genotypes. By comparing the significantly enriched genes between the hybrid and its parents, we identified some candidate transcripts that may be related to heterosis. This study will provide molecular resources for further explaining the mechanism of soybean heterosis.
Supplementary Materials
The following supporting information can be downloaded at: https://www.mdpi.com/article/10.3390/agronomy16101016/s1, Table S1: Primer sequences used for qRT-PCR; Table S2: 12 expression patterns between HYBSOY2 and its parent lines; Table S3: De lncRNAs co-expressed between hybrid and its parents; Table S4: DE cricRNAs information between HYBSOY2 and JLCMS47B; Table S5: DE cricRNAs information between HYBSOY2 and JLR2; Table S6: DE miRNAs information between HYBSOY2 and JLCMS47B; Table S7: DE miRNAs information between HYBSOY2 and JLR2; Figure S1: Differentially expressed genes enriched to the signal transduction pathway of isoflavone biosynthesis pathway. White background boxes indicate genes or enzymes currently present in this metabolic pathway, green background boxes indicate genes or enzymes specific to the sequenced species, with numbers detailed according to the International Enzyme Commission (EC) numbers, and a red outline on the box represents up-regulation of that gene or enzyme.
Author Contributions
Conceptualization, C.Z. and S.W.; methodology, N.J., C.L. and J.Z.; formal analysis, N.J. and C.L.; investigation, J.Z., M.W., Z.G. and L.W.; resources, J.Z.; data curation, N.J., C.L., M.W., Z.G. and L.W.; writing—original draft preparation, N.J. and C.L.; writing—review and editing, C.Z.; supervision, C.Z. and S.W.; project administration, C.Z.; funding acquisition, C.Z. All authors have read and agreed to the published version of the manuscript.
Funding
This research was funded by the earmarked Fund for China Agriculture Research System (CARS-04), the Science and Technology Program of XPCC (2025AB003), the National Natural Science Foundation of China (U21A20215), and the Changbai Talent Program of Jilin Province (202442115).
Data Availability Statement
The datasets generated by this study can be found in the China National Center for Bioinformation using accession number PRJCA061382.
Conflicts of Interest
The authors declare that no competing interests in this manuscript.
Abbreviations
The following abbreviations are used in this manuscript:
| DE | Differentially expressed |
| DEG | Differentially expressed gene |
| lncRNA | Long noncoding RNA |
| circRNA | Circular RNA |
| miRNA | MicroRNA |
| KEGG | Kyoto encyclopedia of genes and genomes |
| GO | Gene ontology |
References
- Hochholdinger, F.; Yu, P. Molecular concepts to explain heterosis in crops. Trends Plant Sci. 2025, 30, 95–104. [Google Scholar] [CrossRef] [Scilit]
- Schnable, P.S.; Springer, N.M. Progress toward understanding heterosis in crop plants. Annu. Rev. Plant Biol. 2013, 64, 71–88. [Google Scholar] [CrossRef] [Scilit] [PubMed]
- Nie, H.S. Cloning and Functional Analysis of Genes Related to Maize Heterosis. Jilin University, 2015. Available online: https://kns.cnki.net/kcms2/article/abstract?v=bKzrHQijxWbtykEzmZtQ27UI7uE9yd_sr7zmOAyUsdNVpuBkm66ra92R8YjzZTTEIJyNChuidPZlFEkxEjIEW6e6Y2j4iWpIgePTqA5H0Tvp6ZiVn8vZryhpPgj8uuz3JVwEbZxgAG3luIyBp286ZxJJcDW73C_Tpmg6m4EY71jNRta1DacL7MPv_lZQX7tM&uniplatform=NZKPT&language=CHS (accessed on 15 October 2022).
- Ma, X.; Xing, F.; Jia, Q.; Zhang, Q.; Hu, T.; Wu, B.; Shao, L.; Zhao, Y.; Zhang, Q.; Zhou, D.X. Parental variation in CHG methylation is associated with allelic-specific expression in elite hybrid rice. Plant Physiol. 2021, 186, 1025–1041. [Google Scholar] [CrossRef] [Scilit]
- Dan, Z.W.; Chen, Y.P.; Li, H.; Zeng, Y.F.; Xu, W.W.; Zhao, W.B.; He, R.F.; Huang, W.C. The metabolomic landscape of rice heterosis highlights pathway biomarkers for predicting complex phenotypes. Plant Physiol. 2021, 187, 1011–1025. [Google Scholar] [CrossRef] [Scilit]
- Birdseye, D.; de Boer, L.A.; Bai, H.; Zhou, P.; Shen, Z.; Schmelz, E.A.; Springer, N.M.; Briggs, S.P. Plant height heterosis is quantitatively associated with expression levels of plastid ribosomal proteins. Proc. Natl. Acad. Sci. USA 2021, 118, e2109332118. [Google Scholar] [CrossRef] [Scilit]
- Li, Z.; Zhu, A.; Song, Q.; Chen, H.Y.; Harmon, F.G.; Chen, Z.J. Temporal regulation of the metabolome and proteome in photosynthetic and photorespiratory pathways contributes to maize heterosis. Plant Cell 2020, 32, 3706–3722. [Google Scholar] [CrossRef] [Scilit] [PubMed]
- Kong, X.P.; Chen, L.; Wei, T.Z.; Zhou, H.W.; Bai, C.F.; Yan, X.P.; Miao, Z.J.; Xie, J.M.; Zhang, L.G. Transcriptome analysis of biological pathways associated with heterosis in Chinese cabbage. Genomics 2020, 112, 4732–4741. [Google Scholar] [CrossRef] [Scilit] [PubMed]
- Shu, H.Y.; Zhou, H.; Mu, H.L.; Wu, S.H.; Jiang, Y.L.; Yang, Z.; Hao, Y.Y.; Zhu, J.; Bao, W.L.; Cheng, S.H.; et al. Integrated analysis of mRNA and non-coding RNA transcriptome in pepper (Capsicum chinense) hybrid at seedling and flowering stages. Front. Genet. 2021, 12, 685788. [Google Scholar] [CrossRef] [Scilit]
- Fu, J.; Zhang, Y.L.; Yan, T.Z.; Li, Y.F.; Jiang, N.; Zhou, Y.B.; Zhou, Q.F.; Qin, P.; Fu, C.J.; Lin, H.Y.; et al. Transcriptome profiling of two super hybrid rice provides insights into the genetic basis of heterosis. BMC Plant Biol. 2022, 22, 314. [Google Scholar] [CrossRef] [Scilit]
- Li, W.Y.; Guo, X.K.; Yao, W.; Li, K.K.; Zheng, Q.; Yu, Y.B.; Zhang, Z.W.; Wang, Y.; Yao, W.G.; Wu, J.; et al. Comparative transcriptomic analysis of heterotic maize development during kernel filling. Plant Mol. Biol. 2025, 115, 53. [Google Scholar] [CrossRef] [Scilit]
- Luo, J.H.; Wang, M.; Jia, G.F.; He, Y. Transcriptome-wide analysis of epitranscriptome and translational efficiency associated with heterosis in maize. J. Exp. Bot. 2021, 72, 2933–2946. [Google Scholar] [CrossRef] [Scilit] [PubMed]
- Zhao, L.M.; Sun, H.; Wang, S.M.; Wang, Y.Q.; Huang, M.; Li, J.P. Breeding of hybrid soybean Hybsoy1. Chin. J. Oil Crop Sci. 2004, 26, 15–17. [Google Scholar] [CrossRef]
- Fang, X.L.; Sun, Y.Y.; Li, J.H.; Li, M.N.; Zhang, C.B. Male sterility and hybrid breeding in soybean. Mol. Breed. 2023, 43, 47. [Google Scholar] [CrossRef] [Scilit] [PubMed]
- Zhang, C.B.; Sun, Y.Y.; Zhao, L.M. Genetic basis and breeding application of cytoplasmic male sterility in soybean. J. Plant Genet. Res. 2024, 25, 857–869. [Google Scholar] [CrossRef]
- Zhou, Q.; Dong, Y.B.; Shi, Q.L.; Zhang, L.; Chen, H.Q.; Hu, C.H.; Li, Y.L. Verification and fine mapping of qGW1.05, a major QTL for grain weight in maize (Zea mays L.). Mol. Genet. Genom. 2017, 292, 871–881. [Google Scholar] [CrossRef] [Scilit] [PubMed]
- Chuck, G.S.; Brown, P.J.; Meeley, R.; Hake, S. Maize SBP-box transcription factors unbranched2 and unbranched3 affect yield traits by regulating the rate of lateral primordia initiation. Proc. Natl. Acad. Sci. USA 2014, 111, 18775–18780. [Google Scholar] [CrossRef] [Scilit]
- Liu, H.J.; Wang, Q.; Chen, M.J.; Ding, Y.H.; Yang, X.R.; Liu, J.; Zhou, C.C.; Tian, Q.L.; Lu, Y.Q.; Fan, D.L.; et al. Genome-wide identification and analysis of heterotic loci in three maize hybrids. Plant Biotechnol. J. 2020, 18, 185–194. [Google Scholar] [CrossRef] [Scilit]
- Song, X.J.; Huang, W.; Shi, M.; Zhu, M.Z.; Lin, X.H. A QTL for rice grain width and weight encodes a previously unknown RING-type E3 ubiquitin ligase. Nat. Genet. 2007, 39, 623–630. [Google Scholar] [CrossRef] [Scilit]
- He, G.M.; Luo, X.J.; Tian, F.; Li, K.G.; Zhu, Z.F.; Su, W.; Qian, X.Y.; Fu, Y.C.; Wang, X.K.; Sun, C.Q.; et al. Haplotype variation in structure and expression of a gene cluster associated with a quantitative trait locus for improved yield in rice. Genome Res. 2006, 16, 618–626. [Google Scholar] [CrossRef] [Scilit]
- Huang, X.Z.; Qian, Q.; Liu, Z.B.; Sun, H.Y.; He, S.Y.; Xia, G.M.; Chu, C.C.; Li, J.Y.; Fu, X.D. Natural variation at the DEP1 locus enhances grain yield in rice. Nat. Genet. 2009, 41, 494–497. [Google Scholar] [CrossRef] [Scilit]
- Zhang, C.B.; Lin, C.J.; Fu, F.Y.; Zhong, X.F.; Peng, B.; Yan, H.; Zhang, J.Y.; Zhang, W.L.; Wang, P.N.; Ding, X.Y.; et al. Comparative transcriptome analysis of flower heterosis in two soybean F1 hybrids by RNA-seq. PLoS ONE 2017, 12, e0181061. [Google Scholar] [CrossRef] [Scilit] [PubMed]
- Sun, Y.Y.; Zhao, L.M.; Zhang, W.; Zhang, C.B. Research progress on utilization of soybean heterosis. Soybean Sci. Technol. 2021, 6, 26–35. [Google Scholar] [CrossRef]
- Trapnell, C.; Williams, B.A.; Pertea, G.; Mortazavi, A.; Kwan, G.; Baren, M.J.; Salzberg, S.L.; Wold, B.J.; Pachter, L. Transcript assembly and quantification by RNA-Seq reveals unannotated transcripts and isoform switching during cell differentiation. Nat. Biotechnol. 2010, 28, 511–515. [Google Scholar] [CrossRef] [Scilit]
- Rapp, R.A.; Udall, J.A.; Wendel, J.F. Genomic expression dominance in allopolyploids. BMC Biol. 2009, 7, 18. [Google Scholar] [CrossRef] [Scilit] [PubMed]
- Zhou, L.; Chen, J.H.; Li, Z.Z.; Li, X.X.; Hu, X.D.; Huang, Y.; Zhao, X.K.; Liang, C.Z.; Wang, Y.; Sun, L.; et al. Integrated profiling of microRNAs and mRNAs: microRNAs located on Xq27.3 associate with clear cell renal cell carcinoma. PLoS ONE 2010, 5, e15224. [Google Scholar] [CrossRef] [Scilit]
- Bardou, P.; Mariette, J.; Escudié, F.; Djemiel, C.; Klopp, C. Jvenn: An interactive Venn diagram viewer. BMC Bioinform. 2014, 15, 293. [Google Scholar] [CrossRef] [Scilit]
- Pérez-Rodríguez, P.; Riaño-Pachón, D.M.; Corrêa, L.G.G.; Rensing, S.A.; Kersten, B.; Mueller-Roeber, B. PlnTFDB: Updated content and new features of the plant transcription factor database. Nucleic Acids Res. 2010, 38, D822–D827. [Google Scholar] [CrossRef] [Scilit] [PubMed]
- Ramsay, N.A.; Glover, B.J. MYB–bHLH–WD40 protein complex and the evolution of cellular diversity. Trends Plant Sci. 2005, 10, 63–70. [Google Scholar] [CrossRef] [Scilit]
- Zhao, Y.F.; Wen, H.L.; Teotia, S.; Du, Y.X.; Zhang, J.; Li, J.Z.; Sun, H.Z.; Tang, G.L.; Peng, T.; Zhao, Q.Z. Suppression of microRNA159 impacts multiple agronomic traits in rice (Oryza sativa L.). BMC Plant Biol. 2017, 17, 215. [Google Scholar] [CrossRef] [Scilit]
- Ursache, R.; Teixeira, C.D.J.V.; Denervaud, T.V.; Gully, K.; De, B.D.; Schmid-Siegert, E.; Grube, A.T.; Shekhar, V.; Calderon, S.; Pradervand, S.; et al. GDSL-domain proteins have key roles in suberin polymerization and degradation. Nat. Plants 2021, 7, 353–364. [Google Scholar] [CrossRef] [Scilit]
- Lee, D.S.; Kim, B.K.; Kwon, S.J.; Jin, H.C.; Park, O.K. Arabidopsis GDSL lipase 2 plays a role in pathogen defense via negative regulation of auxin signaling. Biochem. Biophys. Res. Commun. 2009, 379, 1038–1042. [Google Scholar] [CrossRef] [Scilit]
- Zhu, J.; Lou, Y.; Shi, Q.S.; Zhang, S.; Zhou, W.T.; Yang, J.; Zhang, C.; Yao, X.Z.; Xu, T.; Liu, J.L.; et al. Slowing development restores the fertility of thermo-sensitive male-sterile plant lines. Nat. Plants 2020, 6, 360–367. [Google Scholar] [CrossRef] [Scilit]
- Vadivel, A.K.A.; Renaud, J.; Kagale, S.; Dhaubhadel, S. GmMYB176 regulates multiple steps in isoflavonoid biosynthesis in soybean. Front. Plant Sci. 2019, 10, 562. [Google Scholar] [CrossRef] [Scilit] [PubMed]
- Liu, Y.T.; Zhang, S.R.; Li, J.; Muhammad, A.; Feng, Y.; Qi, J.; Sha, D.; Hao, Y.S.; Li, B.; Sun, J.M. An R2R3-type MYB transcription factor, GmMYB77, negatively regulates isoflavone accumulation in soybean [Glycine max (L.) Merr.]. Plant Biotechnol. J. 2025, 23, 824–838. [Google Scholar] [CrossRef] [Scilit] [PubMed]
- Yokochi, Y.; Yoshida, K.; Hahn, F.; Miyagi, A.; Wakabayashi, K.; Kawai-Yamada, M.; Weber, A.P.M.; Hisabori, T. Redox regulation of NADP-malate dehydrogenase is vital for land plants under fluctuating light environment. Proc. Natl. Acad. Sci. USA 2021, 118, e2016903118. [Google Scholar] [CrossRef] [Scilit]
- Lv, T.Q. Studies on Evolution of C2H2 Zinc-Finger Protein Gene Family in Brassica campestris subsp. Chinensis and Transcriptional Regulation of DAZ3 in Pollen Development. Zhejiang University. 2019. Available online: https://kns.cnki.net/kcms2/article/abstract?v=bKzrHQijxWaZ-XklJWmJ3nDj-m64dCCxQeSWrdGvv6EH1CNS3-DyyfUB95hFncbw-JY5RQUglPY2rJsLKspE_BH3wBhQCYO_uF13gmN1nYUpIeZ0eZbVDiqTR1yFTlxh32Y-hJp9P-K_wYa5tcSs3Lx1sFn9Xdfll5kLjddIXqwHPPll4bIRMRhO80c6Xvxh&uniplatform=NZKPT&language=CHS (accessed on 16 October 2022).
- Cheuk, A.; Ouellet, F.; Houde, M. The barley stripe mosaic virus expression system reveals the wheat C2H2 zinc finger protein TaZFP1B as a key regulator of drought tolerance. BMC Plant Biol. 2020, 20, 144. [Google Scholar] [CrossRef] [Scilit] [PubMed]
- Sun, L.P.; Xiang, X.J.; Yang, Z.F.; Yu, P.; Wen, X.X.; Wang, H.; Abbas, A.; Khan, R.M.; Zhang, Y.X.; Cheng, S.H.; et al. OsGPAT3 Plays a Critical Role in Anther Wall Programmed Cell Death and Pollen Development in Rice. Int. J. Mol. Sci. 2018, 19, 4017. [Google Scholar] [CrossRef] [Scilit]
- Zhong, M.S.; Jiang, H.; Cao, Y.; Wang, Y.X.; You, C.X.; Li, Y.Y.; Hao, Y.J. MdCER2 conferred to wax accumulation and increased drought tolerance in plant. Plant Physiol. Biochem. 2020, 149, 277–285. [Google Scholar] [CrossRef] [Scilit]
- Yu, G.C.; Jia, L.; Yu, N.; Feng, M.; Qu, Y. Cloning and functional analysis of CsROP5 and CsROP10 genes involved in cucumber resistance to Corynespora cassiicola. Biology 2024, 13, 308. [Google Scholar] [CrossRef] [Scilit]
- Tan, Z.W.; Lu, D.D.; Li, L.; Su, X.Y.; Sun, Y.; Wang, L.N.; Yu, Y.L.; Wan, X.F.; Xu, L.J.; Li, C.M.; et al. Comprehensive analysis of safflower R2R3-MYBs reveals the regulation mechanism of CtMYB76 on flavonol biosynthesis. Ind. Crops Prod. 2025, 227, 120795. [Google Scholar] [CrossRef] [Scilit]
- Xu, Y. Non-Specific Lipid Transfer Protein NtLTP4 as a PositiveRegulator Involved in Abiotic and Biotic Stress in Nicotiana tabacum. Shandong Agricultural University. 2018. Available online: https://kns.cnki.net/kcms2/article/abstract?v=bKzrHQijxWY6GUpOSrvsGI0OaQ-7vvAc4wrJpbZy9mnWUQlTgP5GaqWfZSkNnHmLRwlnuNvldR6LPgtNzlABleLSqhNqkPr0gyws2euMHv9hQPwcblsQWk8sbHxjsSzbYs1aOC4CV4UT135NMlbttSDAzlYvDv534eXKDXvjE6JTMf0v4nUwEbP07jAzdrjE&uniplatform=NZKPT&language=CHS (accessed on 16 October 2022).
- Zhou, W.; Zhou, T.; Li, M.X.; Zhao, C.L.; Jia, N.; Wang, X.X.; Sun, Y.Z.; Li, G.L.; Xu, M.; Zhou, R.G.; et al. The Arabidopsis J-protein AtDjB1 facilitates thermotolerance by protecting cells against heat-induced oxidative damage. New Phytol. 2012, 194, 364–378. [Google Scholar] [CrossRef] [Scilit]
- Li, G.Z.; Wang, Z.Q.; Yokosho, K.; Ding, B.; Fan, W.; Gong, Q.Q.; Li, G.X.; Wu, Y.R.; Yang, J.L.; Ma, J.F.; et al. Transcription factor WRKY 22 promotes aluminum tolerance via activation of OsFRDL4 expression and enhancement of citrate secretion in rice (Oryza sativa). New Phytol. 2018, 219, 149–162. [Google Scholar] [CrossRef] [Scilit]
- Baillo, E.H.; Hanif, M.S.; Guo, Y.H.; Zhang, Z.B.; Xu, P.; Algam, S.A. Genome-wide Identification of WRKY transcription factor family members in sorghum (Sorghum bicolor (L.) moench). PLoS ONE 2020, 15, e0236651. [Google Scholar] [CrossRef] [Scilit] [PubMed]
- Jiang, C.M.; Shen, Q.J.; Wang, B.; He, B.; Xiao, S.Q.; Chen, L.; Yu, T.Q.; Ke, X.; Zhong, Q.F.; Fu, J.; et al. Transcriptome analysis of WRKY gene family in Oryza officinalis Wall ex Watt and WRKY genes involved in responses to Xanthomonas oryzae pv. oryzae stress. PLoS ONE 2017, 12, e0188742. [Google Scholar] [CrossRef] [Scilit]
- Abd-Ellatif, S.; Ibrahim, A.A.; Safhi, F.A.; Abdel-Razik, E.S.; Kabeil, S.S.A.; Aloufi, S.; Alyamani, A.A.; Basuoni, M.M.; Alshamrani, S.M.; Elshafie, H.S. Green synthesized of Thymus vulgaris chitosan nanoparticles induce relative WRKY-genes expression in Solanum lycopersicum against Fusarium solani, the causal agent of root rot disease. Plants 2022, 11, 3129. [Google Scholar] [CrossRef] [Scilit]
- Cano-Ramirez, D.L.; Panter, P.E.; Takemura, T.; Fraine, T.S.D.; Dantas, L.L.D.B.; Dekeya, R.; Barros-Galvão, T.; Paajanen, P.; Bellandi, A.; Batstone, T.; et al. Low-temperature and circadian signals are integrated by the sigma factor SIG5. Nat. Plants 2023, 9, 661–672. [Google Scholar] [CrossRef] [Scilit]
- Chen, C.L.; Cui, Y.; Cui, M.; Zhou, W.J.; Wu, H.L.; Ling, H.Q. A FIT-binding protein is involved in modulating iron and zinc homeostasis in Arabidopsis. Plant Cell Environ. 2018, 41, 1698–1714. [Google Scholar] [CrossRef] [Scilit] [PubMed]
- Li, L.; Gao, W.W.; Peng, Q.; Zhou, B.; Kong, Q.H.; Ying, Y.H.; Shou, H.X. Two soybean bHLH factors regulate response to iron deficiency. J. Integr. Plant Biol. 2018, 60, 608–622. [Google Scholar] [CrossRef] [Scilit]
- Singh, M.; Gupta, A.; Singh, D.; Khurana, J.P.; Laxmi, A. Arabidopsis RSS1 mediates cross-talk between glucose and light signaling during hypocotyl elongation growth. Sci. Rep. 2017, 7, 16101. [Google Scholar] [CrossRef] [Scilit]
- Ding, D.; Wang, Y.J.; Han, M.S.; Fu, Z.Y.; Li, W.H.; Liu, Z.H.; Hu, Y.M.; Tang, J.H. MicroRNA transcriptomic analysis of heterosis during maize seed germination. PLoS ONE 2012, 7, e39578. [Google Scholar] [CrossRef] [Scilit] [PubMed]
- Wang, L.F.; Li, J.; Lin, Y.; Dang, K.T.; Wan, J.; Meng, S.J.; Qiu, X.Q.; Wang, Q.Y.; Mu, L.Q.; Ding, D. Comparative transcriptomics analysis at the key stage of maize ear development dissect heterosis. Plant Genome 2023, 16, e20293. [Google Scholar] [CrossRef] [Scilit]
- Dan, Z.W.; Chen, Y.P.; Zhou, W.; Xu, Y.H.; Huang, J.R.; Chen, Y.; Meng, J.Z.; Yao, G.X.; Huang, W.C. Additive and partially dominant effects from genomic variation contribute to rice heterosis. Adv. Sci. 2026, 13, e23376. [Google Scholar] [CrossRef] [Scilit]
- Bakir, Y.; Eldem, V.; Zararsiz, G.; Unver, T. Global transcriptome analysis reveals differences in gene expression patterns between nonhyperhydric and hyperhydric peach leaves. Plant Genome 2016, 9, plantgenome2015.09.0080. [Google Scholar] [CrossRef] [Scilit] [PubMed]
- Biscoe, P.V.; Scott, R.K.; Monteith, J.L. Barley and its environment. III. Carbon budget of the stand. J. Appl. Ecol. 1975, 12, 269–293. [Google Scholar] [CrossRef] [Scilit]
- Fu, M.M.; Wang, Y.P.; Ren, H.X.; Du, W.G.; Yang, X.Y.; Wang, D.L.; Cheng, Y.X.; Zhao, J.M.; Gai, J.Y. Exploring the QTL–allele constitution of main stem node number and its differentiation among maturity groups in a Northeast China soybean population. Crop Sci. 2020, 60, 1223–1238. [Google Scholar] [CrossRef] [Scilit]
- Zhang, J.F.; Li, G.R.; Li, H.J.; Pu, X.B.; Jiang, J.; Chai, L.; Zheng, B.C.; Cui, C.; Yang, Z.J.; Zhu, Y.Q.; et al. Transcriptome analysis of interspecific hybrid between Brassica napus and B. rapa reveals heterosis for oil rape improvement. Int. J. Genom. 2015, 2015, 230985. [Google Scholar] [CrossRef] [Scilit]
- Groszmann, M.; Gonzalez-Bayon, R.; Rebecca, L.L.; Greaves, I.K.; Kemal, K.; Peacock, W.J.; Elizabeth, S.D. Hormone-regulated defense and stress response networks contribute to heterosis in Arabidopsis F1 hybrids. Proc. Natl. Acad. Sci. USA 2015, 112, E6397–E6406. [Google Scholar] [CrossRef] [Scilit] [PubMed]
- Yang, H.; Wang, X.C.; Wei, Y.X.; Deng, Z.; Liu, H.; Chen, J.S.; Dai, L.J.; Xia, Z.H.; He, G.M.; Li, D.J. Transcriptomic analyses reveal molecular mechanisms underlying growth heterosis and weakness of rubber tree seedlings. BMC Plant Biol. 2015, 18, 10. [Google Scholar] [CrossRef] [Scilit]
- Wang, J.W.; Czech, B.J.; Weigel, D. miR156-regulated SPL transcription factors define an endogenous flowering pathway in Arabidopsis thaliana. Cell 2009, 138, 738–749. [Google Scholar] [CrossRef] [Scilit] [PubMed]
- Sun, Z.X.; Su, C.; Yun, J.X.; Jiang, Q.; Wang, L.X.; Wang, Y.N.; Cao, D.; Zhao, F.; Zhao, Q.S.; Zhang, M.C.; et al. Genetic improvement of the shoot architecture and yield in soya bean plants via the manipulation of GmmiR156b. Plant Biotechnol. J. 2019, 17, 50–62. [Google Scholar] [CrossRef] [Scilit]
- Wang, H.; Chung, P.J.; Liu, J.; Jang, I.C.; Kean, M.J.; Xu, J.; Chua, N.M. Genome-wide identification of long noncoding natural antisense transcripts and their responses to light in Arabidopsis. Genome Res. 2014, 24, 444–453. [Google Scholar] [CrossRef] [Scilit] [PubMed]
- Wang, Y.Q.; Fan, X.D.; Lin, F.; He, G.M.; Terzaghi, W.; Zhu, D.M.; Deng, X.W. Arabidopsis noncoding RNA mediates control of photomorphogenesis by red light. Proc. Natl. Acad. Sci. USA 2014, 111, 10359–10364. [Google Scholar] [CrossRef] [Scilit]
- Wang, Z.W.; Wu, Z.; Raitskin, O.; Sun, Q.W.; Dean, C. Antisense-mediated FLC transcriptional repression requires the P-TEFb transcription elongation factor. Proc. Natl. Acad. Sci. USA 2014, 111, 7468–7473. [Google Scholar] [CrossRef] [Scilit]
- Wang, T.Z.; Liu, M.; Zhao, M.G.; Chen, R.J.; Zhang, W.H. Identification and characterization of long non-coding RNAs involved in osmotic and salt stress in Medicago truncatula using genome-wide high-throughput sequencing. BMC Plant Biol. 2015, 15, 131. [Google Scholar] [CrossRef] [Scilit]
- Rinn, J.L.; Chang, H.Y. Genome regulation by long noncoding RNAs. Annu. Rev. Biochem. 2012, 81, 145–166. [Google Scholar] [CrossRef] [Scilit]
- Bai, Y.H.; Dai, X.Z.; Li, Y.; Wang, L.L.; Li, W.M.; Liu, Y.H.; Cheng, Y.; Qin, Y. Identification and characterization of pineapple leaf lncRNAs in crassulacean acid metabolism (CAM) photosynthesis pathway. Sci. Rep. 2019, 9, 6658. [Google Scholar] [CrossRef] [Scilit] [PubMed]
- Zhang, H.Y.; He, H.; Chen, L.B.; Li, L.; Liang, M.Z.; Wang, X.F.; Liu, X.G.; He, G.M.; Chen, R.S.; Ma, L.G.; et al. A genome-wide transcription analysis reveals a close correlation of promoter INDEL polymorphism and heterotic gene expression in rice hybrids. Mol. Plant 2008, 1, 720–731. [Google Scholar] [CrossRef] [Scilit]
- Guo, H.B.; Mendrikahy, J.N.; Xie, L.; Deng, J.F.; Lu, Z.J.; Wu, J.W.; Li, X.; Shahid, M.Q.; Liu, X.D. Transcriptome analysis of neo-tetraploid rice reveals specific differential gene expressions associated with fertility and heterosis. Sci. Rep. 2017, 7, 40139. [Google Scholar] [CrossRef] [Scilit]
- Chen, L.; Bian, J.M.; Shi, S.L.; Yu, J.F.; Khanzada, H.; Wassan, G.M.; Zhu, C.L.; Luo, X.; Tong, S.; Yang, X.R.; et al. Genetic analysis for the grain number heterosis of a super-hybrid rice WFYT025 combination using RNA-Seq. Rice 2018, 11, 37. [Google Scholar] [CrossRef] [Scilit] [PubMed]
- Jiang, J.; Ma, S.; Ye, N.; Jiang, M.; Cao, J.; Zhang, J. WRKY transcription factors in plant responses to stresses. J. Integr. Plant Biol. 2017, 59, 86–101. [Google Scholar] [CrossRef] [Scilit]
- Wang, D.; Pan, Y.J.; Zhao, X.Q.; Zhu, L.H.; Fu, B.Y.; Li, Y.K. Genome-wide temporal-spatial gene expression profiling of drought responsiveness in rice. BMC Genom. 2011, 12, 149. [Google Scholar] [CrossRef] [Scilit] [PubMed]
- Zhou, J.; Chen, S.Q.; Shi, W.J.; Schwartz, R.D.S.; Li, S.T.; Yang, F.L.; Lin, Z.X. Transcriptome profiling reveals the effects of drought tolerance in Giant Juncao. BMC Plant Biol. 2021, 21, 2. [Google Scholar] [CrossRef] [Scilit] [PubMed]
- Rai, A.C.; Singh, M.; Shah, K. Engineering drought tolerant tomato plants over-expressing BcZAT12 gene encoding a C2H2 zinc finger transcription factor. Phytochemistry 2013, 85, 44–50. [Google Scholar] [CrossRef] [Scilit] [PubMed]

Disclaimer/Publisher’s Note: The statements, opinions and data contained in all publications are solely those of the individual author(s) and contributor(s) and not of MDPI and/or the editor(s). MDPI and/or the editor(s) disclaim responsibility for any injury to people or property resulting from any ideas, methods, instructions or products referred to in the content. |
© 2026 by the authors. Licensee MDPI, Basel, Switzerland. This article is an open access article distributed under the terms and conditions of the Creative Commons Attribution (CC BY) license.