Abstract
Photosynthetic efficiency and dry matter accumulation are essential for achieving high rice yields, yet conventional controlled-release fertilizers often fail to synchronize nitrogen (N) supply with crop demand. In this study, we evaluated a novel double core–shell controlled-release urea (DCSCRU) designed to align with the bimodal N uptake pattern of rice. A two-year field experiment was conducted to compare DCSCRU at three application rates (180, 225, and 270 kg N ha−1) with conventional urea and conventional controlled-release urea (both at 270 kg N ha−1). DCSCRU exhibited a distinct biphasic N release profile, with a rapid initial release peaking at 1.60% d −1 on day 10 to meet early vegetative demand, followed by a second peak (1.85% d−1 on day 45) supporting reproductive development. Compared with conventional urea, DCSCRU treatments significantly improved photosynthetic efficiency and dry matter accumulation during critical growth stages. The 270 kg N ha−1 DCSCRU treatment achieved a grain yield exceeding 11.50 × 10³ kg ha−1, substantially higher than that of conventional urea. Notably, the 225 kg N ha−1 DCSCRU treatment produced a comparable yield (10.90 × 10³ kg ha−1) to that of the conventional urea treatment (10.83 × 10³ kg ha−1), indicating the potential to reduce N input by 16.7% without compromising yield. The enhanced physiological performance was attributed to improved N availability and optimized canopy function. These findings highlight DCSCRU as a promising strategy for high-yield, resource-efficient, and environmentally sustainable rice production.
1. Introduction
Rice (Oryza sativa L.), a staple for nearly half of the global population, is central to global food security [1]. However, its production is increasingly challenged by climate change, shrinking arable land, and rising population pressures [2,3]. In response, improving rice yield through resource-efficient and environmentally sustainable technologies has become a major focus of modern agriculture. The rice production in China exemplifies the resource–environment dilemma. Nitrogen (N) fertilizer input averages 209 kg ha−1, approximately 90% higher than the global average [4], yet nitrogen use efficiency (NUE) remains below 35% [5]. Excess N leads to ammonia volatilization, denitrification, and runoff, contributing to greenhouse gas emissions and water eutrophication [6,7]. This “high input-low efficiency-high pollution” cycle necessitates the adoption of green, high-efficiency fertilization strategies [8].
Among the fertilization strategies, slow- and controlled-release nitrogen fertilizers (SCRFs) have demonstrated potential to synchronize nitrogen supply with crop demand, enhance NUE, and reduce environmental losses [9,10]. Polymer-coated urea (PCU), for example, extends N release from tillering to grain filling, improves chlorophyll retention, and boosts photosynthetic efficiency by 10–15%, resulting in improved yield and grain quality [11,12,13]. Nitrogen is fundamental for synthesizing chlorophyll, proteins, and nucleic acids, thereby regulating photosynthesis, dry matter accumulation, and grain formation [14,15]. Rice requires 15–20 kg of N to produce one ton of grain [16,17], yet fast-release fertilizers often fail to meet the crop’s stage-specific needs. Optimal N supply during vegetative growth promotes canopy establishment, while appropriately timed and precisely measured N application during the reproductive and grain-filling stages is essential to support panicle differentiation without causing excessive vegetative growth that impedes the translocation of assimilates to the grains [17]. Conventional practices, which emphasize heavy basal applications, are poorly aligned with these dynamics.
SCRFs overcome this mismatch by regulating release patterns through physical or biochemical mechanisms, thereby improving synchrony with plant uptake and reducing environmental losses [18]. Compared with urea, SCRFs can raise NUE to 50–70%, cut ammonia volatilization by 30–50%, and enhance flag leaf photosynthesis during grain filling [19,20,21]. Given that ~90% of rice biomass derives from photosynthesis (60–80% of which occurs post-anthesis) maintaining canopy photosynthetic capacity is essential [22,23]. This is closely tied to leaf area index (LAI), nitrogen distribution, and delayed leaf senescence. Moreover, N availability influences grain filling via effects on carbon metabolism enzymes and assimilate translocation [24,25]. Despite these advancements, key gaps remain. First, the impact of N management during the grain-filling stage on carbon-nitrogen interactions and grain quality is underexplored. Second, the release kinetics of diverse SCRFs require mechanistic evaluation to match rice’s dynamic N demands. Third, most field studies emphasize final yield but neglect physiological measurements during critical growth stages. Lastly, results from pot or hydroponic studies often lack validation under complex field conditions.
To address these gaps, we conducted a two-year field experiment in Jiangsu Province, China, using two japonica rice cultivars (Oryza sativa L. subsp. japonica cv. ‘Nanjing 9108’ and Oryza sativa L. subsp. japonica cv. ‘Nanjing 9308’). The study aimed to clarify the physiological mechanisms by which double core–shell controlled-release urea (DCSCRU) influences canopy photosynthesis and biomass accumulation. Specifically, we examined (1) how DCSCRU affects light energy utilization efficiency; (2) the role of LAI dynamics in regulating photosynthesis; (3) the contribution of enhanced late-stage panicle formation to yield; and (4) variations in dry matter translocation efficiency and their impact on yield components. These findings aim to support precision nitrogen management, promote innovations in controlled-release fertilizer technology, and contribute to sustainable, low-carbon rice production systems.
2. Materials and Methods
2.1. Experimental Site
Field experiments were conducted during the 2023 and 2024 rice-growing seasons in Yangzhou City, Jiangsu Province, China (119°40′ E, 32°34′ N). Meteorological data were obtained from the Xihe Energy Big Data Platform (Tudor Technology Co., Ltd., Nanjing, China). During the experimental periods, the average temperatures were 25.90 °C in 2023 and 26.60 °C in 2024, with total precipitation of 627 mm and 779 mm, respectively (Figure 1). The experimental soil was classified as sandy loam with the following characteristics: pH 6.52, organic matter 24.80 g kg−1, total N 1.49 g kg−1, NO3−-N 17.50 mg kg−1, NH4+-N 1.50 mg kg−1, available phosphorus 42.20 mg kg−1, and available potassium 71.10 mg kg−1.
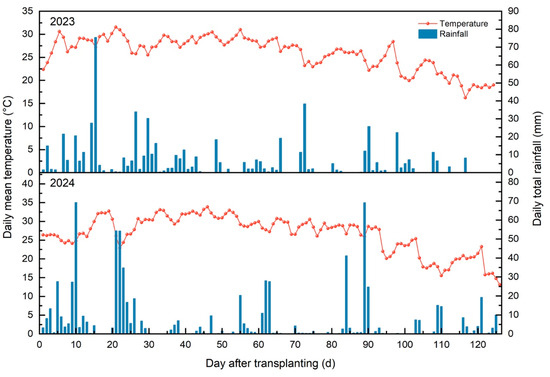
Figure 1.
Daily rainfall and temperature from transplanting to harvest in 2023 and 2024.
2.2. Experimental Materials
Two late-maturing japonica rice cultivars, ‘Nanjing 9108’ and ‘Nanjing 9308’, were used in this study. Both cultivars were developed by the Institute of Grain Crops, Jiangsu Academy of Agricultural Sciences (Nanjing, China) and are characterized by compact plant architecture, high panicle number, strong lodging resistance, and adaptability to the agroecological conditions of central Jiangsu Province. The growth duration of both varieties is approximately 158 days.
Three nitrogen fertilizers were employed: double-core–shell controlled-release urea (DCSCRU, 43.1% N), conventional controlled-release urea (CRU, 43.6% N), and conventional urea (46% N), with the controlled-release types supplied by Maoshi Agricultural Science and Technology Co., Ltd. (Chizhou, China).
2.3. Experimental Design
To evaluate the effects of nitrogen type and rate, six treatments were established in a randomized complete block design with three replicates: (i) CK1, no nitrogen fertilizer; (ii) CK2, conventional urea at 270 kg N ha−1; (iii) T1, conventional CRU at 270 kg N ha−1; (iv) T2, DCSCRU at 180 kg N ha−1; (v) T3, DCSCRU at 225 kg N ha−1; and (vi) T4, DCSCRU at 270 kg N ha−1. In the CK2 treatment, nitrogen was applied in three splits: 40% before transplanting (as basal fertilizer), 30% at the tillering stage (7 days after transplanting), and 30% at panicle initiation. In contrast, all controlled-release urea treatments were applied entirely as basal fertilizer. In addition to nitrogen, all plots received 135 kg ha−1 of P2O5 (as calcium superphosphate) and 216 kg ha−1 of K2O (as potassium chloride) prior to transplanting.
The size of each plot was 30 m2 (5 m × 6 m). Rice seedlings were raised in plastic nursery trays, subjected to 48 h of dark treatment to promote uniform germination, and then transferred to a moist environment for seedling growth. At 25 days old, seedlings were manually transplanted on 24 June 2023, and 20 June 2024, at a spacing of 12.5 cm × 25 cm, with four seedlings per hill (the basic agronomic unit for transplanting) [26]. The corresponding harvest dates were 14 October 2023, and 20 October 2024. Standard crop management practices, including irrigation scheduling and pest, disease, and weed control, were conducted according to local agricultural guidelines to ensure optimal growth conditions across all treatments.
2.4. Sampling and Measurements
2.4.1. Yield and Yield Components
At maturity, 30 hills per plot were sampled to assess yield components. All panicles were collected, air-dried, threshed, and cleaned. Total grain number per 30 hills was counted, and grains per spike were calculated. Thousand-grain weight was determined from three replicate samples of 1000 randomly selected filled grains. Grain yield was measured after sun drying and adjusted to a moisture content of 14.5% using a portable moisture meter (PM-8188-A, Kett Electric Laboratory, Tokyo, Japan).
2.4.2. Chlorophyll Content
Three plants were randomly selected per plot, and the upper three fully expanded leaves of each were measured for chlorophyll content using a SPAD-502 Plus handheld meter (Konica Minolta Sensing, Inc. Tokyo, Japan). Chlorophyll content was expressed as SPAD values.
2.4.3. Photosynthetic Efficiency
During heading and grain-filling stages, flag leaf photosynthetic parameters were measured using a portable photosynthesis system (Li-6400, LI-COR, Inc., Lincoln, NE, USA) under natural light. Measurements included net photosynthetic rate (Pn), stomatal conductance (Gs), intercellular CO2 concentration (Ci), and transpiration rate (Tr).
2.4.4. Leaf Area Index and Dry Matter Accumulation
At tillering, jointing, heading, and maturity stages, three representative plants per plot were sampled. Leaf area was determined using the length × width method, and LAI was calculated as the ratio of total leaf area to ground area. For dry matter determination, above-ground plant samples were collected at maturity. The samples were first oven-killed at 105 °C for 30 min to deactivate enzymatic activity and then dried at 80 °C to constant weight.
2.4.5. Enzyme Activities of Nitrogen Metabolism
To evaluate nitrogen metabolism, the uppermost fully expanded leaves were collected from three randomly selected plants per plot. The leaf veins were removed, and the samples were immediately frozen in liquid nitrogen, ground into a fine powder, and stored at −80 °C until further enzymatic analysis. Crude enzyme extracts were prepared from 0.10 g of fresh leaf tissue for subsequent assays. Nitrate reductase (NR) activity was determined according to a modified method based on Savidov et al. [27], which involves extraction in buffer, centrifugation, and spectrophotometric measurement of nitrite-N accumulation via sulfanilamide colorimetry. Glutamine synthetase (GS) activity was measured according to Han et al. [28] by quantifying the formation of γ-glutamyl hydroxamate. Meanwhile, glutamate synthase (GOGAT) activity was assessed spectrophotometrically by monitoring NADH oxidation in the presence of glutamine, as described by Liu et al. [29].
2.4.6. Nutrient Release Rate
The nutrient release characteristics of the DCSCRU were determined using the standard water immersion method [30]. The DCSCRU was placed into a permeable inert nylon bag with a pore size ≤ 0.15 mm. The bag was then immersed in 200 mL of deionized water and incubated under constant temperature conditions. At predetermined time intervals (0.25 (6 h), 0.75 (18 h), 1, 2, 5, 10, 20, 28, 38, 45, 55, 60, 70, and 80 days), aliquots of the solution were collected, and the nitrogen concentration was determined using the Kjeldahl method [31] with a Kjeltec 8400 system (FOSS, Hillerød, Denmark). After each sampling, an equal volume of fresh pre-tempered extraction solution was replenished to maintain a constant total volume throughout the experiment. The cumulative nutrient release rate was calculated as the percentage of the total nutrient released at each time point relative to the initial nutrient content in the fertilizer. Release curves were plotted based on these values to evaluate the release profiles.
2.5. Statistical Analysis
Data were processed using Microsoft Excel 2023 and analyzed with SPSS 19.0. One-way ANOVA was conducted, and treatment means were compared using the least significant difference (LSD) test at the 0.05 significance level. Figures were generated using Origin 2024.
3. Results
3.1. Nitrogen Release Characteristics of Double-Core–Shell Controlled-Release Urea
As shown in Figure 2, the DCSCRU exhibited a biphasic nitrogen release pattern, with two distinct peaks occurring around days 10 and 45 after soil incorporation. The initial peak supported early vegetative growth, while the second, more pronounced peak corresponded to the panicle differentiation stage, providing a sustained nutrient supply that enhanced grain number per panicle and minimized late-stage spikelet abortion. This dual-release profile facilitated nutrient synchronization with crop demand, improved nitrogen accumulation, and ultimately contributed to enhanced panicle formation and grain setting, thereby promoting higher yield potential.
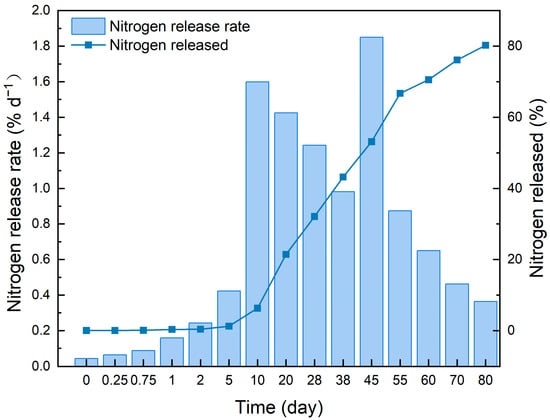
Figure 2.
Nitrogen release, total nitrogen accumulation and total nitrogen release rate of controlled-release nitrogen fertilizer with double core–shell structure.
3.2. Productive Tiller Percentage
Significant differences in productive tiller percentage were observed across treatments and cultivars (Figure 3). In ‘Nanjing 9108’, the T3 treatment increased the productive tiller percentage by 12.94% relative to CK2, while in ‘Nanjing 9308’, there was no significant difference between the T4 treatment and the CK2 treatment. These findings suggest that DCSCRU significantly enhances late-stage panicle formation by aligning nitrogen release with critical reproductive growth phases, which is essential for yield improvement.
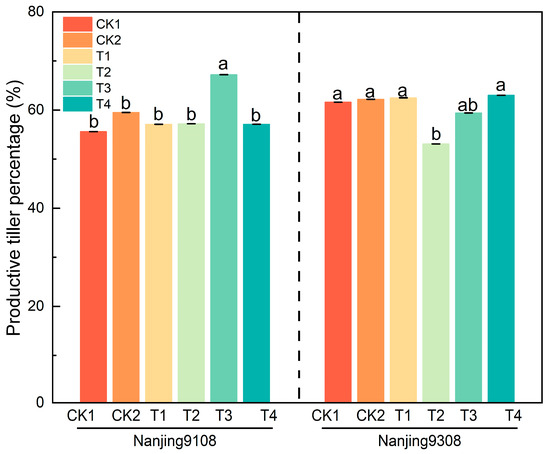
Figure 3.
Effects of different fertilization treatments on rice productive tiller percentage. Different letters indicate a significant difference among treatments (p < 0.05).
3.3. Photosynthetic Traits
Chlorophyll content (SPAD values) differed significantly among treatments and cultivars but showed no significant year effect or year × treatment × cultivar interaction. As shown in Table 1, SPAD values declined after August 26, likely due to dilution of nitrogen concentration during the vegetative-to-reproductive transition. During heading and grain filling, DCSCRU treatments (T2–T4) maintained higher SPAD values than conventional and non-fertilized controls, with T4 showing a 16.74–30.88% increase compared to CK2. The sustained SPAD levels in controlled-release treatments indicate delayed leaf senescence and enhanced photosynthetic capacity, supporting higher biomass production.

Table 1.
Effect of different treatments on chlorophyll content in rice.
As shown in Figure 4 and Figure 5, ‘Nanjing 9108’ exhibited consistently higher transpiration rates throughout the heading stage compared to ‘Nanjing 9308’, indicating inherent differences in their water use strategies. Both cultivars showed a progressive decline in transpiration rate from early to late heading. However, the distinct absolute values suggest that ‘Nanjing 9308’ may possess traits conducive to water conservation, potentially leading to higher water-use efficiency under water-limited conditions. Further analysis of Table 1, Figure 4 and Figure 5 reveals that although SPAD values and photosynthetic rates declined after heading, the rate of decline was slower in DCSCRU treatments, indicating prolonged photosynthetic activity and nutrient supply during grain filling. This enhanced the formation of photoassimilates, contributing to yield stability.
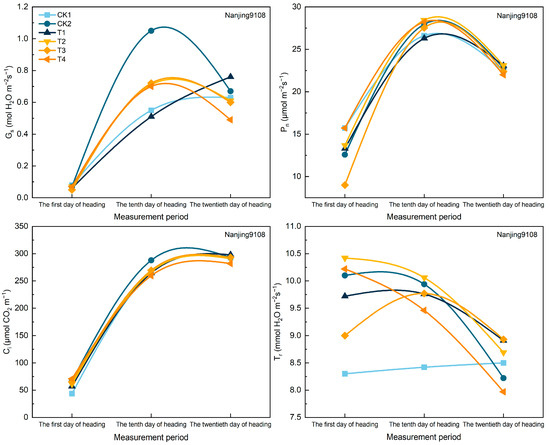
Figure 4.
Effect of different treatments on photosynthetic rate of ‘Nanjing 9108’. Gs, stomatal conductance; Pn, net photosynthetic rat; Ci, intercellular CO2 concentration; Tr, transpiration rate.
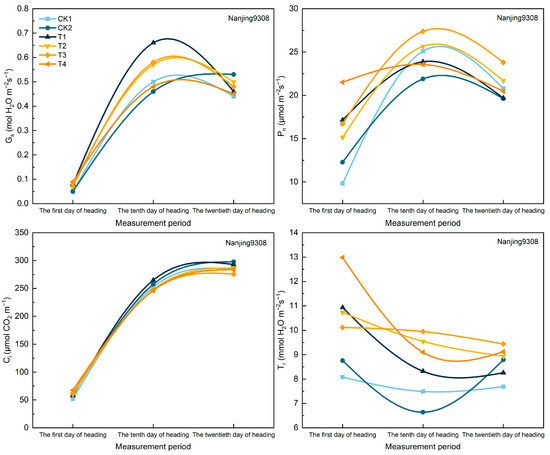
Figure 5.
Effect of different treatments on photosynthetic rate of ‘Nanjing 9308’. Gs, stomatal conductance; Pn, net photosynthetic rat; Ci, intercellular CO2 concentration; Tr, transpiration rate.
Fertilizer treatments significantly influenced LAI at each growth stage, with no significant effects of year or interactions. LAI increased during vegetative development and declined thereafter (Table 2). Compared to CK2, the T4 treatment consistently yielded the highest LAI during both the heading and maturity stages, with average increases of 20.16% and 43.86% for ‘Nanjing 9108’, and 43.38% and 37.26% for ‘Nanjing 9108’, respectively. The impact of DCSCRU on late-stage LAI became more pronounced with increasing nitrogen dosage, highlighting its role in maintaining canopy structure and photosynthetic efficiency during grain filling.

Table 2.
Effect of different treatments on leaf area index of rice.
3.4. Grain Yield and Yield Components
As shown in Table 3, in 2023, yield differences between CK2 and T4 were not significant, but in 2024, T4 improved yield by 7.60% and 8.53% in ‘Nanjing 9108’ and ‘Nanjing 9308’, respectively. Yield improvements were primarily attributed to increased effective panicle number and grains per panicle, while differences in grain-setting rate and 1000-grain weight were not statistically significant. For example, T4 average increased effective panicle number by 19% and 19.05% in ‘Nanjing 9108’ and ‘Nanjing 9308’, respectively, compared to CK2.

Table 3.
Effect of different fertilization treatments on rice yield and its components.
3.5. Effects on Rice Dry Matter Accumulation
As shown in Figure 6, fertilizer treatment had a highly significant effect on dry matter accumulation, while year effects were not significant. For ‘Nanjing 9108’, T4 treatments resulted in significantly higher dry weights at maturity compared to T2 and T3, though no differences were observed from tillering to heading stages. In ‘Nanjing 9308’, T4 also exhibited significantly higher dry matter accumulation from jointing onward, except at the tillering stage. These results suggest that DCSCRU ensures stable biomass production in late growth stages.
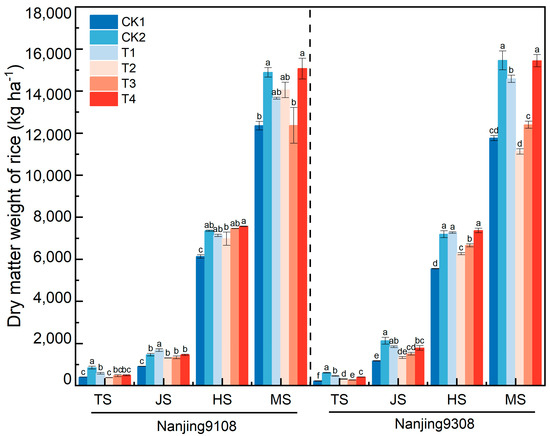
Figure 6.
Effect of different fertilization treatments on dry matter weight of rice. Different letters indicate a significant difference among treatments (p < 0.05). TS: Tillering stage; JS: Jointing stage; HS: Heading stage; MS: Maturity stage.
The yield performance of different treatments (T1–T4) relative to the control (CK2) in 2023 is shown in Table 4, Figure 7 and Figure 8. Among them, T4 demonstrated the most significant improvement, with yield increases of 5.99% and 6.78%, respectively. In contrast, T3 resulted in more modest gains, corresponding to 0.46% and 1.47%, respectively. These findings support a positive correlation between higher grain percentage and enhanced yield, confirming that the higher the grain percentage, the greater the yield.

Table 4.
Effect of different fertilization treatments on the distribution ratio of rice dry matter weight among different organs.
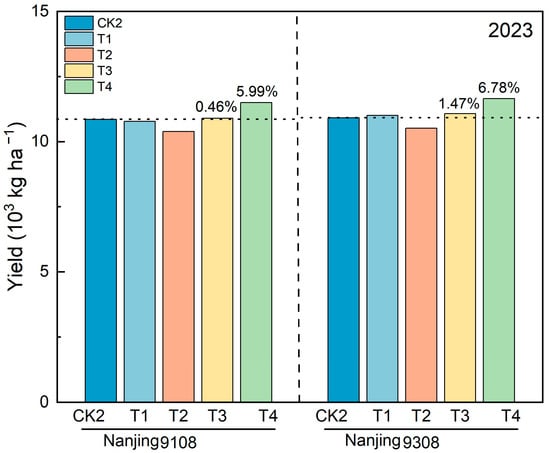
Figure 7.
Yield differences from CK2 under various treatments in 2023. A dashed line indicates the yield standard for CK2.
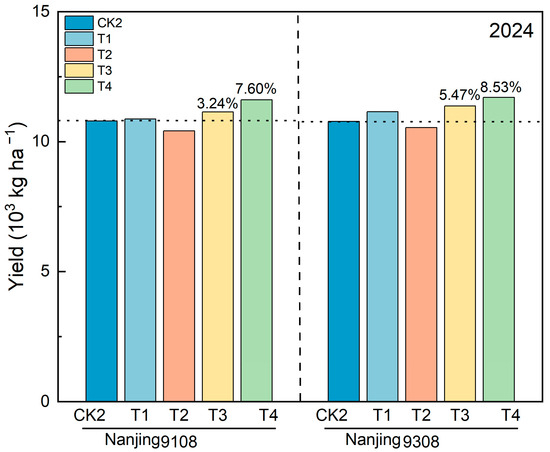
Figure 8.
Yield differences from CK2 under various treatments in 2024. A dashed line indicates the yield standard for CK2.
A comparison of the yield performance between treatments (T1–T4) and CK2 in 2023 is provided in Table 4 and Figure 7 and Figure 8. Specifically, T4 exhibited the most substantial increase, corresponding to 5.99% and 6.78% improvement. In contrast, T3 resulted in more modest increases of 0.46% and 1.47%, respectively. These results support a positive correlation between higher grain percentage and improved yield, The higher the grain percentage, the higher the yield.
3.6. Enzyme Activities Related to Nitrogen Metabolism
As shown in Table 5, activities of nitrate reductase (NR), glutamine synthetase (GS), and glutamate synthase (GOGAT) were significantly influenced by fertilizer treatment and cultivar, with no significant year effect. DCSCRU treatments (T3 and T4) consistently exhibited higher enzyme activities than CK2. Averaged across two years, T4 increased NR activity by 9.73% and 12.28%, GS activity by 10.84% and 11.29%, and GOGAT activity by 12.7% and 9.28% in ‘Nanjing 9108’ and ‘Nanjing 9308’, respectively, highlighting improved nitrogen assimilation efficiency under DCSCRU regimes.

Table 5.
Effects of different fertilization treatments on enzyme activities of nitrogen metabolism in rice leaves.
3.7. Correlation Analysis of Physiological and Agronomic Traits
Pearson correlation analysis (Figure 9) revealed that activities of NR, GS, and GOGAT were significantly correlated with heading-stage LAI (LAIH) and dry matter at maturity (DWM), suggesting that enhanced nitrogen metabolism is closely associated with improved canopy function and biomass accumulation. Notably, NR showed strong correlations with GS (r = 0.88) and GOGAT (r = 0.92), indicating efficient conversion of inorganic nitrogen into organic forms. LAIH was also strongly correlated with DWM (r = 0.75) and all three enzymes (r = 0.89–0.92), confirming that canopy structural optimization plays a central role in translating metabolic efficiency into yield gains.
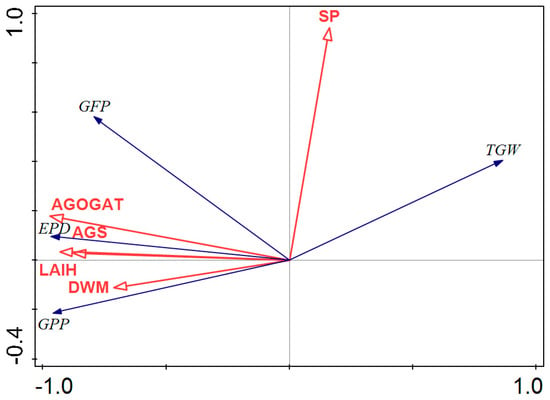
Figure 9.
Correlation coefficients between rice yield composition and some indexes under 6 nitrogen fertilizer treatments across the two years. TGW, 1000-grain weight; EPD, effective panicle density; GFP, grain filling percentage; GPP, Grains per panicle; AGS, the activity of GS; AGOGAT, the activity of GOGAT; DWM, dry weight at maturity stage; LAIH, Leaf area index at heading stage; SP, Spike as a proportion of dry matter weight. The correlation is positive when the angle between the arrows is acute and negative when the angle between the arrows is larger than 90 degrees. The correlation between two indicators is interpreted by projecting one onto the arrow representing the other: the farther the projection point lies in the direction of the arrow, the stronger the positive correlation; a point near the coordinate origin suggests a near-zero correlation, whereas a projection in the opposite direction indicates a negative correlation.
3.8. Pathway Analysis of Yield Determinants
Path analysis revealed a well-fitted model explaining causal relationships among key physiological and yield-related traits. Heading-stage LAI exhibited the highest direct contribution to yield (R2 = 0.882), followed by 1000-grain weight (0.668). These results underscore the central role of canopy photosynthetic capacity and assimilate accumulation in yield formation. The findings suggest that optimizing nitrogen supply to enhance LAI and grain weight is critical for achieving higher rice yields under controlled-release fertilization strategies.
4. Discussion
4.1. Effects of the Double Core–Shell Controlled-Release Urea on Rice Photosynthesis and Dry Matter Accumulation
Nitrogen is a central regulator of rice growth and development, directly influencing photosynthesis, dry matter accumulation, and ultimately grain yield [32,33]. The precise management of nitrogen supply is therefore crucial to optimizing crop productivity and sustainability. Our results demonstrate that the application of double core–shell controlled-release urea (DCSCRU) significantly enhances photosynthetic performance and dry matter accumulation in rice through multiple coordinated mechanisms. Compared with conventional urea and single-layer controlled-release fertilizers, DCSCRU exhibited a more stable and prolonged nitrogen release pattern, enabling a better match between nitrogen availability and crop demand during the critical growth period of rice. This sustained nitrogen supply supported continuous leaf development and delayed leaf senescence, as reflected by higher SPAD values and net photosynthetic rates during the grain-filling stage. Previous studies have similarly shown that extended leaf functionality improves source capacity and grain filling [11,34].
The leaf area index, a key indicator of canopy structure and photosynthetic potential, was significantly increased by DCSCRU, particularly under the T4 treatment. LAI at maturity increased by 50.73% and 39.52% in ‘Nanjing 9108’ and ‘Nanjing 9308’, respectively, compared to conventional urea. This suggests that DCSCRU promotes the formation of a more robust and photosynthetically active canopy, consistent with findings that optimized canopy architecture contributes to higher photosynthetic efficiency and grain yield [35,36]. In terms of dry matter accumulation, DCSCRU-treated plants exhibited greater biomass production, especially during the latter growth stages. This increase is attributable to enhanced nitrogen-use efficiency and improved coordination between nitrogen metabolism and carbon assimilation pathways. Our results align with previous studies indicating that controlled-release nitrogen fertilizers can significantly increase aboveground biomass by synchronizing nitrogen supply with crop physiological needs [19,37]. The increased proportion of dry matter allocated to reproductive organs further underscores the role of DCSCRU in optimizing source-sink relationships, which is essential for high-yield formation. Overall, DCSCRU both enhanced photosynthetic efficiency and ensured stable dry matter accumulation, providing a physiological basis for improved grain yield. Its slow and regulated nutrient release pattern offers a promising strategy for improving nitrogen management in rice cultivation under resource- and environment-constrained conditions. Furthermore, emerging research demonstrates that advanced biodegradable polymer coatings significantly reduce environmental persistence while maintaining controlled-release efficacy, thereby lowering the risk of microplastic pollution and promoting sustainable and environmentally friendly development [38].
4.2. Effects of Double Core–Shell Controlled-Release Urea on Yield and Yield-Related Physiological Traits
The application of DCSCRU significantly improved grain yield in both japonica rice cultivars tested, with average increases of 6.8% and 7.66% over conventional fertilization. Yield gains were not attributable to a single component but rather to a comprehensive enhancement of key yield determinants, including effective panicle number, grain number per panicle, seed-setting rate, and 1000-grain weight. The effective panicle number is a critical determinant of rice yield and is particularly responsive to nitrogen availability during the tillering stage [39]. DCSCRU, by releasing nitrogen gradually and steadily, facilitated consistent tiller growth and survival. Our findings showed that the T4 treatment increased effective panicle number by 16.42% (‘Nanjing 9108’) and 11.57% (‘Nanjing 9308’), demonstrating the superior capacity of DCSCRU to support high tillering productivity [40].
Productive tiller percentage was also significantly improved under DCSCRU treatments. Compared with CK2, T3 treatment increased productive tiller percentage by 12.94% in 2023. This improvement reflects the role of sustained nitrogen supply in supporting panicle differentiation and reducing degeneration during reproductive development [37]. A well-timed nitrogen supply during the panicle initiation stage enhances spikelet primordia survival and promotes the formation of fertile florets, directly influencing grain number per panicle [14,41]. Moreover, the grain number per panicle and 1000-grain weight also remained stable under DCSCRU treatments. This is consistent with previous findings showing that maintaining high leaf nitrogen content and chlorophyll levels during grain filling enhances photoassimilate production and translocation, leading to improved grain filling and weight [22,23]. Thus, DCSCRU not only improved nitrogen utilization efficiency but also facilitated better coordination between nitrogen supply and physiological processes governing rice yield formation. This study confirms the potential of DCSCRU as an effective tool for synchronizing nutrient availability with crop demand, thereby enhancing multiple physiological traits that contribute to high and stable rice yields.
5. Conclusions
This study demonstrated that double core–shell controlled-release urea (DCSCRU) significantly improves rice yield by 6.80–7.66%, primarily through spatiotemporal alignment of nitrogen release with crop demand. Compared with traditional controlled-release fertilizers, DCSCRU shows the potential to maintain relatively high chlorophyll content and photosynthetic activity, extend the functional period of flag leaves, and promote dry matter accumulation, even under reduced fertilizer application rates and fewer topdressing events. At early stages, its controlled nitrogen release supports canopy formation, while during reproductive stages, it enhances spikelet differentiation, panicle formation rate, and grain filling. Application at 225 kg N ha−1 achieved yields comparable to those under conventional split fertilization, while 270 kg N ha−1 significantly outperformed it. The coordinated improvement in photosynthesis, nitrogen metabolism, and source–sink balance under DCSCRU provides a theoretical and technical foundation for advancing precision fertilization strategies in rice production, contributing to yield enhancement and agricultural sustainability.
Author Contributions
R.F.: Data curation, Formal analysis, Writing—original draft. C.D.: Data curation, Writing—review and editing. T.C.: Writing—review and editing. H.L.: Conceptualization, Software. P.C.: Data curation. N.Z.: Writing—review and editing. Y.Y.: Writing—review and editing, Conceptualization, Funding acquisition, Writing—review and editing. H.Z.: Funding acquisition. All authors have read and agreed to the published version of the manuscript.
Funding
This work is supported by the National Key R&D Program of China (2023 YFD2300405), the National Natural Science Foundation of China (32472223, 41701329), the Priority Academic Program Development of Jiangsu Higher Education Institutions, and the Qinglan Project of Jiangsu Province.
Data Availability Statement
Data supporting the findings of this study are available within the article.
Conflicts of Interest
The authors declare no conflicts of interest.
Abbreviations
The following abbreviations are used in this manuscript:
| DCSCRU | Double Core–Shell Controlled-Release Urea |
| N | Nitrogen |
| NUE | Nitrogen Use Efficiency |
| SCRFs | Slow- and Controlled-Release Nitrogen Fertilizers |
| PCU | Polymer-Coated Urea |
| LAI | Leaf Area Index |
| CRU | Controlled-Release Urea |
| NR | Nitrate Reductase |
| GS | Glutamine Synthetase |
| GOGAT | Glutamate Synthase |
| LSD | Least Significant Difference |
| TS | Tillering Stage |
| JS | Jointing Stage |
| HS | Heading Stage |
| MS | Maturity Stage |
| TGW | 1000-grain Weight |
| EPD | Effective Panicle Density |
| GFP | Grain Filling Percentage |
| GPP | Grains Per Panicle |
| ANR | the Activity of NR |
| AGS | the Activity of GS |
| AGOGAT | the Activity of GOGAT |
| DWM | Dry Weight at Maturity Stage |
| LAIH | Leaf Area Index at Heading Stage |
| SP | Spike as a Proportion of Dry Matter Weight |
References
- Zhou, Y.; Lei, F.; Wang, Q.; He, W.C.; Yuan, B.; Yuan, W.Y. Identification of novel alleles of the rice blast-resistance gene Pi9 through sequence-based allele mining. Rice 2020, 13, 80. [Google Scholar] [CrossRef] [PubMed]
- Gan, C.I.; Soukoutou, R.; Conroy, D.M. Sustainability framing of controlled environment agriculture and consumer perceptions: A review. Sustainability 2023, 15, 304. [Google Scholar] [CrossRef]
- Shao, Y.E.; Dai, J.T. Integrated feature selection of ARIMA with computational intelligence approaches for food crop price prediction. Complexity 2018, 2018, 1910520. [Google Scholar] [CrossRef]
- Chen, X.P.; Cui, Z.L.; Fan, M.S.; Vitousek, P.; Zhao, M.; Ma, W.Q.; Wang, Z.L.; Zhang, W.J.; Yan, X.Y.; Yang, J.C.; et al. Producing more grain with lower environmental costs. Nature 2014, 514, 486–489. [Google Scholar] [CrossRef]
- Peng, S.B.; Buresh, R.J.; Huang, J.L.; Yang, J.C.; Zou, Y.B.; Zhong, X.H.; Wang, G.H.; Zhang, F.S. Strategies for overcoming low agronomic nitrogen use efficiency in irrigated rice systems in China. Field Crops Res. 2006, 96, 37–47. [Google Scholar] [CrossRef]
- Islam, S.M.M.; Gaihre, Y.K.; Biswas, J.C.; Jahan, M.S.; Singh, U.; Adhikary, S.K.; Satter, M.A.; Saleque, M.A. Different nitrogen rates and methods of application for dry season rice cultivation with alternate wetting and drying irrigation: Fate of nitrogen and grain yield. Agric. Water Manag. 2018, 196, 144–153. [Google Scholar] [CrossRef]
- Shi, X.R.; Li, X.K.; Guo, C.; Feng, P.Y.; Hu, K.L. Modeling ammonia volatilization following urea and controlled-release urea application to paddy fields. Comput. Electron. Agric. 2022, 196, 106888. [Google Scholar] [CrossRef]
- He, Z.X.; Cao, C.S.; Feng, C. Media attention, environmental information disclosure and corporate green technology innovations in China’s heavily polluting industries. Emerg. Mark. Financ. Trade. 2022, 58, 3939–3952. [Google Scholar] [CrossRef]
- Ji, P.T.; Li, X.L.; Peng, Y.J.; Zhang, Y.C.; Tao, P.J. Effect of polyaspartic acid and different dosages of controlled-release fertilizers on nitrogen uptake, utilization, and yield of maize cultivars. Bioengineered 2021, 12, 527–539. [Google Scholar] [CrossRef]
- Cai, J.W.; Cheng, W.X.; Liang, Z.H.; Li, C.Z.; Deng, Y.; Yin, T.; Li, C.J. Organic and slow-release fertilizer substitution strategies improved the sustainability of pineapple production systems in the tropics. Sustainability 2023, 15, 10353. [Google Scholar] [CrossRef]
- Xiong, Q.Q.; Tang, G.P.; Zhong, L.; He, H.H.; Chen, X.R. Response to nitrogen deficiency and compensation on physiological characteristics, yield formation, and nitrogen utilization of rice. Front. Plant Sci. 2018, 9, 1075. [Google Scholar] [CrossRef] [PubMed]
- Yang, X.; Wu, S.F.; Wu, L.H.; Chen, J.Q.; Zhu, Y.H. Optimizing weight method to evaluate nitrogen release characters of polymer-coated urea in paddy soil under field conditions. Commun. Soil Sci. Plant Anal. 2017, 48, 608–614. [Google Scholar] [CrossRef]
- Wang, B.C.; Shen, Y.Z.; Xie, W.; Zhu, S.X.; Zhao, X.; Wang, S.Q. FeIII-tannic acid-modified waterborne polymer-coated urea has agronomic, environmental and economic benefits in flooded rice paddy. J. Clean. Prod. 2021, 321, 129013. [Google Scholar] [CrossRef]
- Peng, M.S.; Hudson, D.; Schofield, A.; Tsao, R.; Yang, R.; Gu, H.L.; Bi, Y.M.; Rothstein, S.J. Adaptation of Arabidopsis to nitrogen limitation involves induction of anthocyanin synthesis which is controlled by the NLA gene. J. Exp. Bot. 2008, 59, 2933–2944. [Google Scholar] [CrossRef] [PubMed]
- Wang, T.; Yang, K.X.; Ma, Q.Y.; Jiang, X.; Zhou, Y.Q.; Kong, D.L.; Wang, Z.Y.; Parales, R.E.; Li, L.; Zhao, X.; et al. Rhizosphere microbial community diversity and function analysis of cut chrysanthemum during continuous monocropping. Front. Microbiol. 2022, 13, 801546. [Google Scholar] [CrossRef]
- Patil, M.D.; Das, B.S.; Barak, E.; Bhadoria, P.B.S.; Polak, A. Performance of polymer-coated urea in transplanted rice: Effect of mixing ratio and water input on nitrogen use efficiency. Paddy Water Environ. 2010, 8, 189–198. [Google Scholar] [CrossRef]
- Zhou, W.; Yang, Z.P.; Wang, T.; Fu, Y.; Chen, Y.; Hu, B.H.; Yamagishi, J.; Ren, W.J. Environmental compensation effect and synergistic mechanism of optimized nitrogen management increasing nitrogen use efficiency in indica hybrid rice. Front. Plant Sci. 2019, 10, 245. [Google Scholar] [CrossRef]
- Mi, W.H.; Gao, Q.; Xia, S.Q.; Zhao, H.T.; Wu, L.H.; Mao, W.; Hu, Z.P.; Liu, Y.L. Medium-term effects of different types of N fertilizer on yield, apparent N recovery, and soil chemical properties of a double rice cropping system. Field Crops Res. 2019, 234, 87–94. [Google Scholar] [CrossRef]
- Wahid, M.A.; Irshad, M.; Irshad, S.; Khan, S.; Hasnain, Z.; Ibrar, D.; Khan, A.R.; Saleem, M.F.; Bashir, S.; Alotaibi, S.S.; et al. Nitrogenous fertilizer coated with zinc improves the productivity and grain quality of rice grown under anaerobic conditions. Front. Plant Sci. 2022, 13, 914653. [Google Scholar] [CrossRef]
- Deng, F.; Li, W.; Wang, L.; Hu, H.; Liao, S.; Pu, S.L.; Tao, Y.F.; Li, G.H.; Ren, W.J. Effect of controlled-release fertilizers on leaf characteristics, grain yield, and nitrogen use efficiency of machine-transplanted rice in southwest China. Arch. Agron. Soil Sci. 2021, 67, 1739–1753. [Google Scholar] [CrossRef]
- Wu, Q.; Wang, Y.H.; Ding, Y.F.; Tao, W.K.; Gao, S.; Li, Q.X.; Li, W.W.; Liu, Z.H.; Li, G.H. Effects of different types of slow- and controlled-release fertilizers on rice yield. J. Integr. Agric. 2021, 20, 1503–1514. [Google Scholar] [CrossRef]
- Zhang, J.Y.; Shuang, S.P.; Zhang, L.; Xie, S.Q.; Chen, J.W. Photosynthetic and photoprotective responses to steady-state and fluctuating light in the shade-demanding crop amorphophallus xiei grown in intercropping and monoculture systems. Front. Plant Sci. 2021, 12, 663473. [Google Scholar] [CrossRef] [PubMed]
- Han, R.C.; He, X.F.; Pan, X.H.; Shi, Q.H.; Wu, Z.M. Enhancing xanthine dehydrogenase activity is an effective way to delay leaf senescence and increase rice yield. Rice 2020, 13, 16. [Google Scholar] [CrossRef] [PubMed]
- Lin, W.W.; Guo, X.D.; Pan, X.F.; Li, Z.W. Chlorophyll composition, chlorophyll fluorescence, and grain yield change in esl mutant rice. Int. J. Mol. Sci. 2018, 19, 2945. [Google Scholar] [CrossRef]
- Zhai, L.Y.; Wang, F.; Yan, A.; Liang, C.W.; Wang, S.; Wang, Y.; Xu, J.L. Pleiotropic effect of GNP1 underlying grain number per panicle on sink, source and flow in rice. Front. Plant Sci. 2020, 11, 933. [Google Scholar] [CrossRef] [PubMed]
- Xiao, Z.W.; Zhang, R.C.; Cao, F.B.; Liu, L.S.; Chen, J.N.; Huang, M. Effects of Decreasing Hill Number per Unit Area Combined with Increasing Seedling Number per Hill on Grain Quality in Hybrid Rice. Agronomy 2024, 14, 1172. [Google Scholar] [CrossRef]
- Savidov, N.A.; Tokarev, B.I.; Lips, S.H. Regulation of Mo-cofactor, NADH- and NAD(P)H-specific nitrate reductase activities in the wild type and two nar-mutant lines of barley (Hordeum vulgare L.). J. Exp. Bot. 1997, 48, 847–855. [Google Scholar] [CrossRef]
- Han, Y.L.; Liao, J.Y.; Yun, Y.; Song, H.X.; Rong, N.; Guan, C.Y.; Lepo, J.E.; Ismail, A.M.; Zhang, Z.H. Exogenous abscisic acid promotes the nitrogen use efficiency of Brassica napus by increasing nitrogen remobilization in the leaves. J. Plant Nutr. 2017, 40, 2540–2549. [Google Scholar] [CrossRef]
- Liu, L.; Zhang, R.; Yang, C.; Li, L.; Gao, D.S. Effect of sodium molybdate foliar sprays on key enzymes activities of nitrogen metabolism and 15N absorption, distribution and utilization of strawberry seedling. Plant Physiol. 2016, 52, 1035–1044. [Google Scholar]
- Han, X.Z.; Chen, S.S.; Hu, X.G. Controlled-release fertilizer encapsulated by starch/polyvinyl alcohol coating. Desalination 2009, 240, 21–26. [Google Scholar] [CrossRef]
- Kjeldahl, J. Neue Methode zur Bestimmung des Stickstoffs in organischen Körpern. Anal. Bioanal. Chem. 1883, 22, 366–382. [Google Scholar] [CrossRef]
- Xu, Y.Q.; Guan, X.Y.; Han, Z.Y.; Zhou, L.J.; Zhang, Y.; Asad, M.A.U.; Wang, Z.W.; Jin, R.; Pan, G.; Cheng, F.M. Combined effect of nitrogen fertilizer application and high temperature on grain quality properties of cooked rice. Front. Plant Sci. 2022, 13, 874033. [Google Scholar] [CrossRef]
- Yang, Z.Q.; Yan, H.F.; Liu, H.W.; Yang, L.; Mi, G.H.; Wang, P. Enhancing crop nitrogen efficiency: The role of mixed nitrate and ammonium supply in plant growth and development. Biology 2025, 14, 546. [Google Scholar] [CrossRef]
- Wei, H.Y.; Chen, Z.F.; Xing, Z.P.; Zhou, L.; Liu, Q.Y.; Zhang, Z.Z.; Jiang, Y.; Hu, Y.J.; Zhu, J.Y.; Cui, P.Y.; et al. Effects of slow or controlled release fertilizer types and fertilization modes on yield and quality of rice. J. Integr. Agric. 2018, 17, 2222–2234. [Google Scholar] [CrossRef]
- Ji, S.; Gu, C.; Xi, X.B.; Zhang, Z.H.; Hong, Q.Q.; Huo, Z.Y.; Zhao, H.T.; Zhang, R.H.; Li, B.; Tan, C.W. Quantitative monitoring of leaf area index in rice based on hyperspectral feature bands and ridge regression algorithm. Remote Sens. 2022, 14, 2777. [Google Scholar] [CrossRef]
- Yuan, W.S.; Meng, Y.; Li, Y.; Ji, Z.G.; Kong, Q.M.; Gao, R.; Su, Z.B. Research on rice leaf area index estimation based on fusion of texture and spectral information. Comput. Electron. Agric. 2023, 211, 108016. [Google Scholar] [CrossRef]
- Sun, Y.Y.; Yuan, X.J.; Chen, K.R.; Wang, H.Y.; Luo, Y.H.; Guo, C.C.; Wang, Z.L.; Shu, C.H.; Yang, Y.G.; Weng, Y.F.; et al. Improving the yield and nitrogen use efficiency of hybrid rice through rational use of controlled-release nitrogen fertilizer and urea topdressing. Front. Plant Sci. 2023, 14, 1240238. [Google Scholar] [CrossRef] [PubMed]
- Zhang, S.G.; Shen, T.L.; Yang, Y.C.; Ma, X.X.; Gao, B.; Li, Y.C.; Wang, P.F. Novel environment-friendly superhydrophobic bio-based polymer derived from liquefied corncob for controlled-released fertilizer. Prog. Org. Coat. 2021, 151, 106018. [Google Scholar] [CrossRef]
- Hu, M.M.; Li, Z.X.; Chen, K.R.; Xiong, Y.; Luo, Y.H.; Wang, A.L.; Li, L.L.; Shu, C.H.; Chen, Z.K.; Yang, Z.Y.; et al. Side deep placement of slow-release N as base fertilizer combined with urea as panicle fertilizer increases rice yield by optimizing dry matter and N accumulation and translocation. Front. Plant Sci. 2025, 16, 1600215. [Google Scholar] [CrossRef]
- Ma, S.T.; Meng, Y.; Han, Q.S.; Ma, S.C. Drip fertilization improve water and nitrogen use efficiency by optimizing root and shoot traits of winter wheat. Front. Plant Sci. 2023, 14, 1201966. [Google Scholar] [CrossRef]
- Yang, W.L.; Que, H.L.; Wang, S.W.; Zhu, A.N.; Zhang, Y.J.; He, Y.; Xin, X.L.; Zhang, X.F.; Ding, S.J. High temporal resolution measurements of ammonia emissions following different nitrogen application rates from a rice field in the Taihu Lake Region of China. Environ. Pollut. 2020, 257, 113489. [Google Scholar] [CrossRef] [PubMed]
Disclaimer/Publisher’s Note: The statements, opinions and data contained in all publications are solely those of the individual author(s) and contributor(s) and not of MDPI and/or the editor(s). MDPI and/or the editor(s) disclaim responsibility for any injury to people or property resulting from any ideas, methods, instructions or products referred to in the content. |
© 2025 by the authors. Licensee MDPI, Basel, Switzerland. This article is an open access article distributed under the terms and conditions of the Creative Commons Attribution (CC BY) license (https://creativecommons.org/licenses/by/4.0/).