Article

Biochar Application Methods Matter: Biochemical and Enological Responses of an Italian Field-Grown Grapevine (Vitis vinifera L.) Using Solid and Liquid Formulations

1
BioAgry Lab, Department of Life Sciences, University of Siena, Via Mattioli 4, 53100 Siena, Italy
2
Department of Agricultural, Forest and Food Sciences (DISAFA), University of Turin, Largo Paolo Braccini 2, 10095 Grugliasco, Italy
3
NBFC—National Biodiversity Future Center, 33, 56127 Palermo, Italy
*
Author to whom correspondence should be addressed.
Agronomy 2025, 15(9), 2124; https://doi.org/10.3390/agronomy15092124
Submission received: 15 August 2025 / Revised: 30 August 2025 / Accepted: 3 September 2025 / Published: 4 September 2025

Abstract

Viticulture is increasingly seeking sustainable practices that enhance grape quality while reducing reliance on synthetic inputs. Among bio-based strategies, biochar has attracted growing interest for its potential to improve soil fertility and influence plant metabolism. However, its effects can vary depending on formulation and application methods. This study evaluated the effects of the use of solid (SB) and liquid biochar (LB) on the biochemical and nutritional composition in leaves, berry skins, and must of a grapevine (Vitis vinifera L., cv. Sangiovese) cultivated in a vineyard in Tuscany (Italy). SB was applied once to the soil at 2.5% (w/w), while LB was applied five times/season at 10% (v/v) via fertigation. Results revealed formulation-specific effects on grapevine physiology and fruit composition. SB maintained leaf chlorophyll concentrations, increased total soluble proteins (+65%), total polyphenols (+57%), and tannin content (+33%) in berry skins and must, and reduced Cu and Zn. Conversely, LB reduced leaf chlorophyll concentrations (−24%) and nutrient contents (P, Fe, Cu, and Zn), but increased total flavonoids (+13%), antioxidant capacity (+20%), and vitamin C (+18%) in berry skins, alongside higher fructose and reducing sugars in musts. The findings highlight biochar’s potential as a bio-based input in viticulture, emphasizing the importance of formulation and application strategy. SB appears suited to long-term soil improvement and enhanced phenolic richness, while LB may modulate sugar metabolism for targeted enological outcomes.

Graphical Abstract

1. Introduction

The shift toward more sustainable and environmentally friendly agriculture is also reflected in measurable changes: for example, the share of organic farming in the European Union increased from 5.9% of total agricultural land in 2012 to 10.5% in 2021 [1], and the use of chemical pesticides decreased by approximately 14% between 2011 and 2020 [2]. These trends highlight that sustainability is not only a goal policy but also a tangible transformation in European farming practices. Climate change, understood as long-term shifts in temperature and precipitation patterns driven largely by anthropogenic greenhouse gas emissions [3], together with biodiversity loss and soil degradation, are among the most pressing challenges facing the agri-food sector today, prompting urgent calls for innovation and transformation in raw food production [4]. Within this context, the European Union has taken a proactive role through policy frameworks such as the European Green Deal, which aims to make the EU climate-neutral by 2050, and the “Farm to Fork” strategy, which specifically targets the sustainability of food systems [5,6]. This strategy sets robust objectives, including reducing the use of fertilizers and pesticides by at least 20–50%, increasing organic farming to cover 25% of total agricultural land by 2030, and promoting the circular use of resources [5]. These targets are not only environmental in nature, but also seek to ensure food security through approaches such as climate-smart agriculture, precision farming, crop diversification, and the adoption of bio-based solutions (i.e., biostimulants, biofertilizers, and natural biocontrol agents). At the same time, they aim to preserve natural ecosystems via established systems including agroecological farming, conservation agriculture, and integrated pest management, while improving farmer livelihoods by promoting resilient and resource-efficient production models [7].
A need of this transformation is the increased adoption of bio-based and low-impact agricultural inputs, particularly in organic and low-input farming systems [8]. In organic farming, their use is driven by regulatory restrictions on synthetic fertilizers and pesticides and by consumer demand for certified organic products. In low-input or integrated systems, adoption is supported by agri-environmental schemes, subsidies, and precision farming practices designed to reduce chemical use. Even in conventional farming, although still at a smaller scale, bio-based solutions are increasingly adopted in response to sustainability standards, environmental regulations, and the growing availability of effective commercial products [8]. These include soil amendments such as composts and biochars, or soil microbial inoculants, or plant biostimulants. All of them contribute to improving soil fertility, enhancing plant resilience, and reducing the environmental footprint of agriculture [9,10,11,12]. Biochar is notable for its unique ability to simultaneously serve agronomic and environmental purposes [13]. Biochar serves clear and defined agrotechnical functions, such as improving soil fertility, enhancing water retention, stabilizing soil pH, and increasing nutrient use efficiency, all contributing to better plant performance under stress. Simultaneously, it provides environmental benefits, including long-term carbon sequestration, adsorption or immobilization of contaminants like heavy metals and pesticides, and the valorization of agricultural residues in line with circular economy goals. As a solid carbon-rich material derived from the thermochemical conversion of biomass under limited oxygen (pyrolysis), biochar is recognized for its potential to sequester carbon over long periods [14], contribute to soil regeneration [15], and improve plant nutrient use efficiency [16]. Moreover, it can be produced from local agricultural and forestry residues, providing a sustainable strategy for organic waste reuse, which is in line with circular economy principles [17].
The agronomic interest in biochar is largely attributable to its physical and chemical properties, including high porosity, extensive surface area, alkaline pH, and high cation exchange capacity (CEC) [18,19]. These characteristics allow biochar to improve soil structure, increase water retention, pH, and the retention/release of nutrients such as nitrogen, phosphorus, and potassium [20,21]. It also acts as a habitat for beneficial soil microorganisms, contributing to the development of a more active rhizosphere [22,23]. Several field and greenhouse studies have demonstrated that the application of biochar can improve crop yield, plant biomass, and stress tolerance, particularly in degraded or nutrient-poor soils. For instance, field trials in maize reported significant yield increases following applications of 20–40 t/ha of biochar on sandy or nutrient-depleted soils, while greenhouse experiments in tomato and wheat showed enhanced nutrient uptake, chlorophyll stability, and drought tolerance when biochar was incorporated at 2–5% (w/w) into the growth substrate [24,25,26].
Recent technological advances have led to the introduction of liquid biochar, a new formulation gaining interest from farmers [27,28,29]. It is produced either by suspending finely ground solid biochar, derived from pyrolysis, in water, or by extracting water-soluble compounds like organic acids, phenolics, and minerals from biomass during or after pyrolysis. Compared to solid biochar, the liquid product may offer faster bioavailability, greater mobility within the soil, and a more immediate impact on plant roots and soil microbial communities due to its direct application to the field. These properties make liquid biochar especially interesting for fertigation systems and may open up new possibilities for its use in precision agriculture and biological crop management.
Viticulture offers an ideal system for evaluating the role of biochar as a sustainable input. Grapevines (Vitis vinifera L.) are perennial, deep-rooted plants that are highly sensitive to changes in soil structure, water availability, and nutrient supply since their thin, non-lignified epidermis and actively dividing cells are directly exposed to soil changes [30,31,32]. Furthermore, the quality of grapes and resulting wine is closely linked to the vine’s physiological status (i.e., photosynthetic capacity, nutrient uptake, and water status) and metabolic balance (i.e., the equilibrium between primary metabolism for energy and sugars and secondary metabolism for phenolic compounds and redox homeostasis), making viticulture a useful model for studying plant–soil interactions and the biochemical effects of bio-based amendments [33,34]. With the wine sector increasingly shifting toward organic production and low-input management practices, viticulturists are seeking new solutions that can enhance soil fertility, improve plant health, and support high-quality grape production without relying on synthetic fertilizers. Biochar, in both its solid and liquid formulations, could potentially address these needs, although its specific effects on grapevine physiology, berry composition, and final product quality remain underexplored. Although several studies have reported positive effects of biochar on soil fertility and crop performance in annual and some perennial species, there is still a lack of comparative evidence on how different biochar formulations (solid vs. liquid) influence grapevine physiology and fruit quality. Therefore, the present study aimed to evaluate the effects of solid and liquid biochar on the biochemical and nutritional composition of grapevine leaves, berry skins, and must in the Sangiovese cultivar.

2. Materials and Methods

2.1. Biochar

Biochar was provided by Bio-Esperia S.r.l. (Italy) [35] and obtained from the pyrolysis of woody biomass (i.e., Castanea sativa Mill., Robinia pseudoacacia L., Fraxinus ornus L., Alnus lutinosa (L.) Gaertn., and Quercus robur L.). The production process was performed using a Bach microwave system operating under oxygen-free conditions, maintained through nitrogen injection for 7 s every 5 min. The device is equipped with an automated control system that regulates temperature, nitrogen flow, and aerosol extraction, with the latter treated downstream by a scrubber unit. During the process, the material was gradually heated to 600 °C and then maintained at this temperature for 1 h, ensuring uniform and complete pyrolysis. The solid biochar was dropped into a reservoir at the bottom of the reactor, finely ground, and sieved at 2 mm. Afterwards, the liquid biochar was obtained by grinding again the solid biochar (<1 nm) and resuspending this powder in water. The physio-chemical characteristics of the biochars are reported in Fedeli et al. [36].

2.2. Site Description and Experimental Design

The experiment was conducted between 2022 and 2024 in a vineyard located in Tuscany, Central Italy (43.6845° N, 11.1846° E). The vineyard is situated in a field with 9-year-old grapevines of the Sangiovese cultivar (Figure 1).
The study involved three treatments:
i.
A control (indicated as “NB—No Biochar”), where no formulation of biochar was applied to the soil;
ii.
A solid biochar (indicated as “SB”), where solid biochar was applied to the soil only once at the beginning of the experiment (November 2022);
iii.
A liquid biochar (indicated as “LB”), where liquid biochar was applied five times (in November, April, May, June, and July) during both the 2022–2023 and 2023–2024 growing seasons.
The SB was applied at a concentration of 2.5% (w/w) under the grapevine canopy (within a 50 cm width area and 20 cm depth), while the LB was applied via fertigation at a concentration of 10% (v/v) on the same area. For each treatment, five plants were considered as biological replicates. Although this number is relatively limited for field studies, plants were selected for their uniformity in age, vigor, and vineyard position to minimize background variability. This aspect is acknowledged as a limitation of the study, and future trials with larger sample sizes across different vineyards would help to confirm and extend these findings. Due to a significant reduction in grape productivity across Tuscany during the 2023 season caused by the extreme climate events (such as prolonged drought and elevated temperatures), only the 2024 season was considered for data collection and analysis. During this season, both leaves and grapevine fruits were collected. The leaves were immediately stored at −80 °C for biochemical analysis, while the fruits were squeezed to obtain the must, and the remaining skin was first dehydrated in an oven for 7 days at 50 °C and finally crushed and sieved (<2 mm) to obtain a homogenized powder.

2.3. Leaf Material

2.3.1. Assimilation Pigments

The quantification of assimilation pigments (chlorophyll a, chlorophyll b, and total carotenoids) was performed following the procedure reported by Lichtenthaler and Wellburn [37] and recently reported in Borella et al. [38]. Briefly, 0.05 g of frozen leaf material was weighed and placed into a 15 mL tube. To each sample, 4 mL of absolute methanol, previously stored at –20 °C, were added. The material was homogenized thoroughly, and the tubes were then sealed and kept in the dark at 4 °C for 30 min to allow for complete pigment extraction. Subsequently, the samples were centrifuged at 3500 rpm for 20 min (PK110 centrifuge, Alc International S.r.l., Cologno Monzese, Milan, Italy). The supernatant was carefully recovered and transferred into 2 mL microcentrifuge tubes. A blank was prepared using 2 mL of absolute methanol. Absorbance readings were taken immediately at three wavelengths (470, 653, and 666 nm) using a UV-Vis spectrophotometer (Agilent 8453, Santa Clara, CA, USA). Pigment concentrations were calculated using the following equations:
C h l a   m g g   F W = 15.65   ×   A 666 7.34   ×   A 653 ×   m L   o f   t h e   e x t r a c t i o n F W   o f   t h e   s a m p l e s
C h l b   m g g   F W = 27.05 × A 653 11.21 × A 666 × m L   o f   t h e   e x t r a c t i o n F W   o f   t h e   s a m p l e s
C a r o t e n o i d s   m g g   F W = 1000 × A 470 2.86 × C h l a 129.6 × C h l b × m L   o f   t h e   e x t r a c t i o n 245   ×   F W   o f   t h e   s a m p l e s

2.3.2. Malondialdehyde

The content of malondialdehyde (MDA) was assessed following the method described by Mendes [39] and recently reported in Azarnejad et al. [40], with slight procedural adjustments. In brief, 0.5 g of frozen leaf material was homogenized in 5 mL of extraction solution composed of 0.25% (w/v) 2-thiobarbituric acid (TBA; Merck KGaA, Darmstadt, Germany) dissolved in 10% (w/v) trichloroacetic acid (TCA; Panreac, Castellar del Vallès, Barcelona, Spain). The mixture was incubated at 95 °C for 30 min using a thermoblock (FALC Instruments, Bergamo, Italy), then rapidly cooled on ice to block the reaction. Following centrifugation at 4000× g rpm for 10 min (PK110 centrifuge, Alc International S.r.l., Cologno Monzese, Milan, Italy), the supernatant was collected and its absorbance measured at 532 nm and 600 nm using a UV-Vis spectrophotometer (Agilent 8453, Santa Clara, CA, USA). MDA content was calculated by subtracting the non-specific absorbance at 600 nm from the absorbance at 532 nm, applying an extinction coefficient of 155 mM−1 cm−1 for the MDA–TBA complex.

2.3.3. Proline

The concentration of proline was determined following the protocol described by Bates [41] and recently reported in Fedeli et al. [42], with minor modifications. Briefly, 0.1 g of frozen leaf material was homogenized in 2 mL of 3% (w/v) 5-sulfosalicylic acid dihydrate (Merck KGaA, Darmstadt, Germany). The homogenate was centrifuged at 4000 rpm for 10 min (PK110 centrifuge, Alc International S.r.l., Cologno Monzese, Milan, Italy). A 0.5 mL aliquot of the resulting supernatant was mixed with 0.5 mL of glacial acetic acid and 0.5 mL of acid-ninhydrin reagent (prepared by dissolving 1.25 g of ninhydrin [Carlo Erba, Milan, Italy] in 30 mL of glacial acetic acid and 20 mL of 6 M phosphoric acid [Merck KGaA, Darmstadt, Germany]). The mixture was incubated at 100 °C for 1 h, then immediately cooled on ice to stop the reaction. Subsequently, 1.5 mL of toluene was added to each sample, and the absorbance of the upper toluene phase was measured at 520 nm using a UV-Vis spectrophotometer (Agilent 8453, Santa Clara, CA, USA). Quantification was performed using a calibration curve with a 1 mM stock solution of L-proline (Merck KGaA, Darmstadt, Germany), with concentrations in the range 2–600 µL.

2.3.4. Soluble Proteins

The total content of soluble proteins was determined following the method described by Bradford [43] and recently reported in Fedeli et al. [44]. Briefly, 0.2 g of frozen leaf material was homogenized in 4 mL of deionized water and centrifuged at 4000 rpm for 5 min. An aliquot of 0.2 mL from the supernatant was combined with 0.8 mL of Bradford reagent (Sigma-Aldrich, Darmstadt, Germany). Absorbance was recorded at 595 nm using a UV-Vis spectrophotometer (Agilent 8453, Santa Clara, CA, USA). Protein content was quantified using a standard calibration curve (10–100 µg mL−1) constructed with bovine serum albumin (Sigma-Aldrich, Darmstadt, Germany).

2.3.5. Antioxidants

Approximately 1 g of dried leaf material was extracted with 10 mL of 80% methanol (v/v). The mixture was subjected to orbital shaking for 30 min (ASAL VDRL model 711, Cernusco sul Naviglio, Milan, Italy), followed by incubation in the dark at 4 °C for 48 h. After extraction, the solution was filtered through Whatman no. 1 filter paper, and the resulting filtrates were used for the determination of the content of total phenols, total flavonoids, and condensed tannins.
Total phenol content (TPC) was quantified following the method described by Al-Duais et al. [45] and recently reported in Fedeli et al. [46]. In this assay, 0.125 mL of the leaf extract were mixed with 2 mL of deionized water and 0.125 mL of Folin–Ciocalteu’s reagent. After a 3 min reaction period in the dark, 1.25 mL of 7% (w/v) sodium carbonate and 1 mL of deionized water were added. The mixture was vigorously shaken and incubated for 90 min in the dark. Absorbance was measured at 760 nm using an Agilent UV-Vis 8453 spectrophotometer (Santa Clara, CA, USA). Gallic acid (98%, Thermo Fisher Scientific, Rodano, Milan, Italy) was employed as calibration standard over the concentration range of 5–300 µg mL−1.
For the total flavonoid content (TFC) determination, the procedure described by Cheng et al. [47] and recently reported in Fedeli et al. [48] was applied. A volume of 0.250 mL of the leaf extract was mixed with 0.075 mL of 5% (w/v) sodium nitrite. After 5 min, 0.075 mL of 10% (w/v) aluminum chloride was added. Following another 5 min incubation in the dark with shaking, 0.5 mL of 1 M sodium hydroxide was added. The final mixture was incubated for 15 min in the dark before absorbance was recorded at 415 nm. Quantification was carried out using quercetin (≥95%, Merck KGaA, Darmstadt, Germany) as reference standard, with calibration standards ranging 12.5–150 µg mL−1.
The content of condensed tannins was assessed following the method described in Broadhurst and Jones [49] and recently reported in Borella et al. [38]. For this assay, 0.5 mL of leaf extract was reacted with 3 mL of a 4% vanillin solution in methanol and 1.5 mL of concentrated HCl. After a 20 min incubation in the dark, absorbance was measured at 500 nm. Tannic acid (ACS reagent grade, Merck KGaA, Darmstadt, Germany) served as calibration standard, with concentrations between 12.5 and 900 µg mL−1.

2.3.6. Minerals

The mineral content in the leaves of the grapevine was determined using a portable X-ray fluorescence (XRF) spectrometer, adhering to the methodology outlined by Fedeli et al. [50,51,52]. Approximately 1 g of oven-dried material was placed in a plastic sample cup and positioned in the instrument’s analysis chamber. Nutrient concentrations (P, S, K, Ca, Mn, Fe, Cu, and Zn) were measured using the Geochem analytical mode. Each sample was analyzed using three sequential beams, with an acquisition time of 20 s per beam. Nutrient concentrations are reported as milligrams of each element per kilogram of dry weight.

2.4. Berry Skin Material

2.4.1. Antioxidants

The quantification of total polyphenol, total flavonoid, and condensed tannins was carried out in accordance with the protocol described in Section 2.3.5.
Total antioxidant capacity was assessed using the DPPH radical scavenging method, as described in Bondet et al. [53] and recently reported by Carullo et al. [54], with slight modifications. Briefly, 0.5 g of frozen skin material were homogenized in 2 mL of 80% ethanol (Merck KGaA, Darmstadt, Germany) for 2 min and centrifuged at 4000 rpm for 5 min (PK110 centrifuge, Alc International S.r.l., Cologno Monzese, Milan, Italy). A 200 µL aliquot of the resulting supernatant was then combined with 1 mL of DPPH working solution, prepared by dissolving 3.9 mg of 2,2-diphenyl-1-picrylhydrazyl (DPPH; Merck KGaA, Darmstadt, Germany) in 100 mL of 80% methanol. Blank and control samples were prepared by mixing 200 µL of 80% ethanol with either 1 mL of 80% methanol (blank) or 1 mL of DPPH solution (control). After incubation in the dark for 1 h, absorbance was measured at 517 nm using a UV-Vis spectrophotometer (Agilent 8453, Santa Clara, CA, USA). Antioxidant capacity was expressed in percentage and calculated according to the following formula:
D P P H   % = 1 s a m p l e   a b s c o n t r o l   a b s ×   100
Vitamin C content was quantified using the method described in Ghasemnezhad et al. [55] and recently reported by Et-Tazy et al. [56]. In brief, 200 mg of plant tissue was homogenized with 0.8 mL of 10% (w/v) trichloroacetic acid (TCA) using an ULTRA-TURRAX® homogenizer (T 10 basic, Werke GmbH and Co. KG, Staufen, Germany). The homogenate was then filtered through gauze and kept on ice before being centrifuged at 3000 rpm for 5 min. An aliquot of 0.4 mL of the resulting extract was combined with 0.2 mL of 0.2 M Folin–Ciocalteu reagent (Carlo Erba, Cornaredo, Italy). Absorbance was measured at 760 nm using a UV-Vis spectrophotometer (8453, Agilent, Santa Clara, CA, USA). Vitamin C concentration was calculated based on a calibration curve generated using 0.05–0.2 mL of pure ascorbic acid (BioXtra, ≥99.0%, crystalline).

2.4.2. Starch

Starch content was quantified using the protocol described in Fedeli et al. [57] and recently reported in Fedeli et al. [58]. Approximately 0.05 g of frozen skin material was homogenized in 2 mL of dimethyl sulfoxide (DMSO), followed by the addition of 0.5 mL of 8 M hydrochloric acid (HCl). The mixture was then incubated at 60 °C for 30 min to facilitate hydrolysis. After cooling to room temperature, 0.5 mL of 8 M sodium hydroxide (NaOH) and 7 mL of deionized water were added to neutralize the solution. The samples were subsequently centrifuged at 4000 rpm for 5 min. An aliquot of 0.5 mL of the supernatant was mixed with 2.5 mL of Lugol’s iodine solution (containing 0.05 M HCl, 0.03% (w/v) I2, and 0.06% (w/v) KI). After a 15 min reaction, absorbance was measured at 605 nm using a UV-Vis spectrophotometer (model 8453, Agilent Technologies, Santa Clara, CA, USA). Quantification was carried out using a calibration curve prepared with pure starch (Sigma-Aldrich) at concentrations ranging from 10 to 400 mg mL−1.

2.4.3. Proteins

The quantification of total soluble proteins was carried out in accordance with the protocol described in Section 2.3.4.

2.4.4. Soluble Sugars and Pectin

The quantification of sugars (glucose, sucrose, and fructose) and pectin was conducted according to the procedure described by Fedeli et al. [59]. Approximately 0.5 g of sample was homogenized in 4 mL of deionized water, followed by centrifugation at 15,000× g rpm for 5 min. The resulting supernatant was passed through a 0.45 µm syringe filter prior to chromatographic analysis. High-performance liquid chromatography was carried out using a Waters ArcHPLC system equipped with a 2410 refractive index detector. Separation of sugar compounds was achieved using deionized water as the mobile phase, delivered at a flow rate of 0.6 mL min−1, through a Sugar-Pak I ion-exchange column (6.5 × 300 mm, Waters), maintained at 90 °C using an external column heater (Waters Column Heater Module). Quantitative analysis of sugars and pectin was performed using calibration curves generated from analytical-grade sugar standards dissolved in deionized water, within the concentration range of 0.1–0.5 mg mL−1.

2.4.5. Mineral Content

The quantification of minerals was carried out in accordance with the protocol described in Section 2.3.6.

2.5. Must Material

2.5.1. Antioxidants

The quantification of total polyphenols, total flavonoids, and condensed tannins was carried out in accordance with the protocol described in Section 2.3.5.

2.5.2. Quality Parameters

The quantification of soluble sugars (such as glucose, fructose, and sucrose) in the must was carried out in accordance with the protocol described in Section 2.4.4.
Reducing sugars, °Brix, pH, total acidity, and malic acid were determined in grape musts using a FOSS WineScan™ Flex (FOSS, Hillerød, Denmark), based on a Fourier Transform Infrared (FTIR) spectroscopy, following the procedure described by Bevin et al. [59]. Briefly, must samples were centrifuged at 4000 rpm for 10 min and filtered through 0.45 µm membranes prior to analysis to remove suspended solids and ensure spectral accuracy. Approximately 7 mL of clarified must was used for each sample. Measurements were conducted at room temperature. All parameter determinations were based on the instrument’s built-in calibration models, specifically validated for grape must analysis.

2.6. Statistical Analysis

The dataset conformed to a normal distribution, as verified by the Shapiro–Wilk test (p > 0.05), and the results were thus expressed as means ± standard error. Statistical differences among groups were assessed using one-way analysis of variance (ANOVA), followed by the least significant difference (LSD) test for post hoc comparisons, with significance set at p < 0.05. All statistical analyses were conducted using CoStat software (version 6.451, CoHort Software, Monterey, CA, USA) [60].

3. Results

3.1. Leaves

Chlorophyll a and b remained unchanged in SB but decreased significantly by approximately 25% in LB compared to NB. Carotenoids were reduced in both SB and LB, with reductions of 21% and 24%, respectively, compared to NB.
Malondialdehyde content decreased significantly by 16% in SB, while LB showed no significant difference compared to the NB. Proline content remained statistically similar across all treatments.
Total soluble protein content increased significantly in SB (+65%) and in LB (+40%) compared to NB. Total phenol content increased by 57% in SB, while remained stable in LB with respect to NB. Conversely, TFC increased by 13% in LB and did not change in SB compared to NB. No difference was observed in condensed tannin content with respect to the NB.
Phosphorus, S, and Fe contents reduced significantly in LB by 25%, 20%, and 18%, respectively, compared to NB. Potassium was reduced by 12% in SB compared to NB. Calcium and Zn were reduced in both SB and LB, with reductions of 16% and 22% on average, respectively, with respect to NB. Manganese decreased by 20% in SB and 9% in LB. Copper content showed the most significant decrease being reduced by 56% in SB and by 30% in LB, compared to NB (Table 1).

3.2. Berry Skins

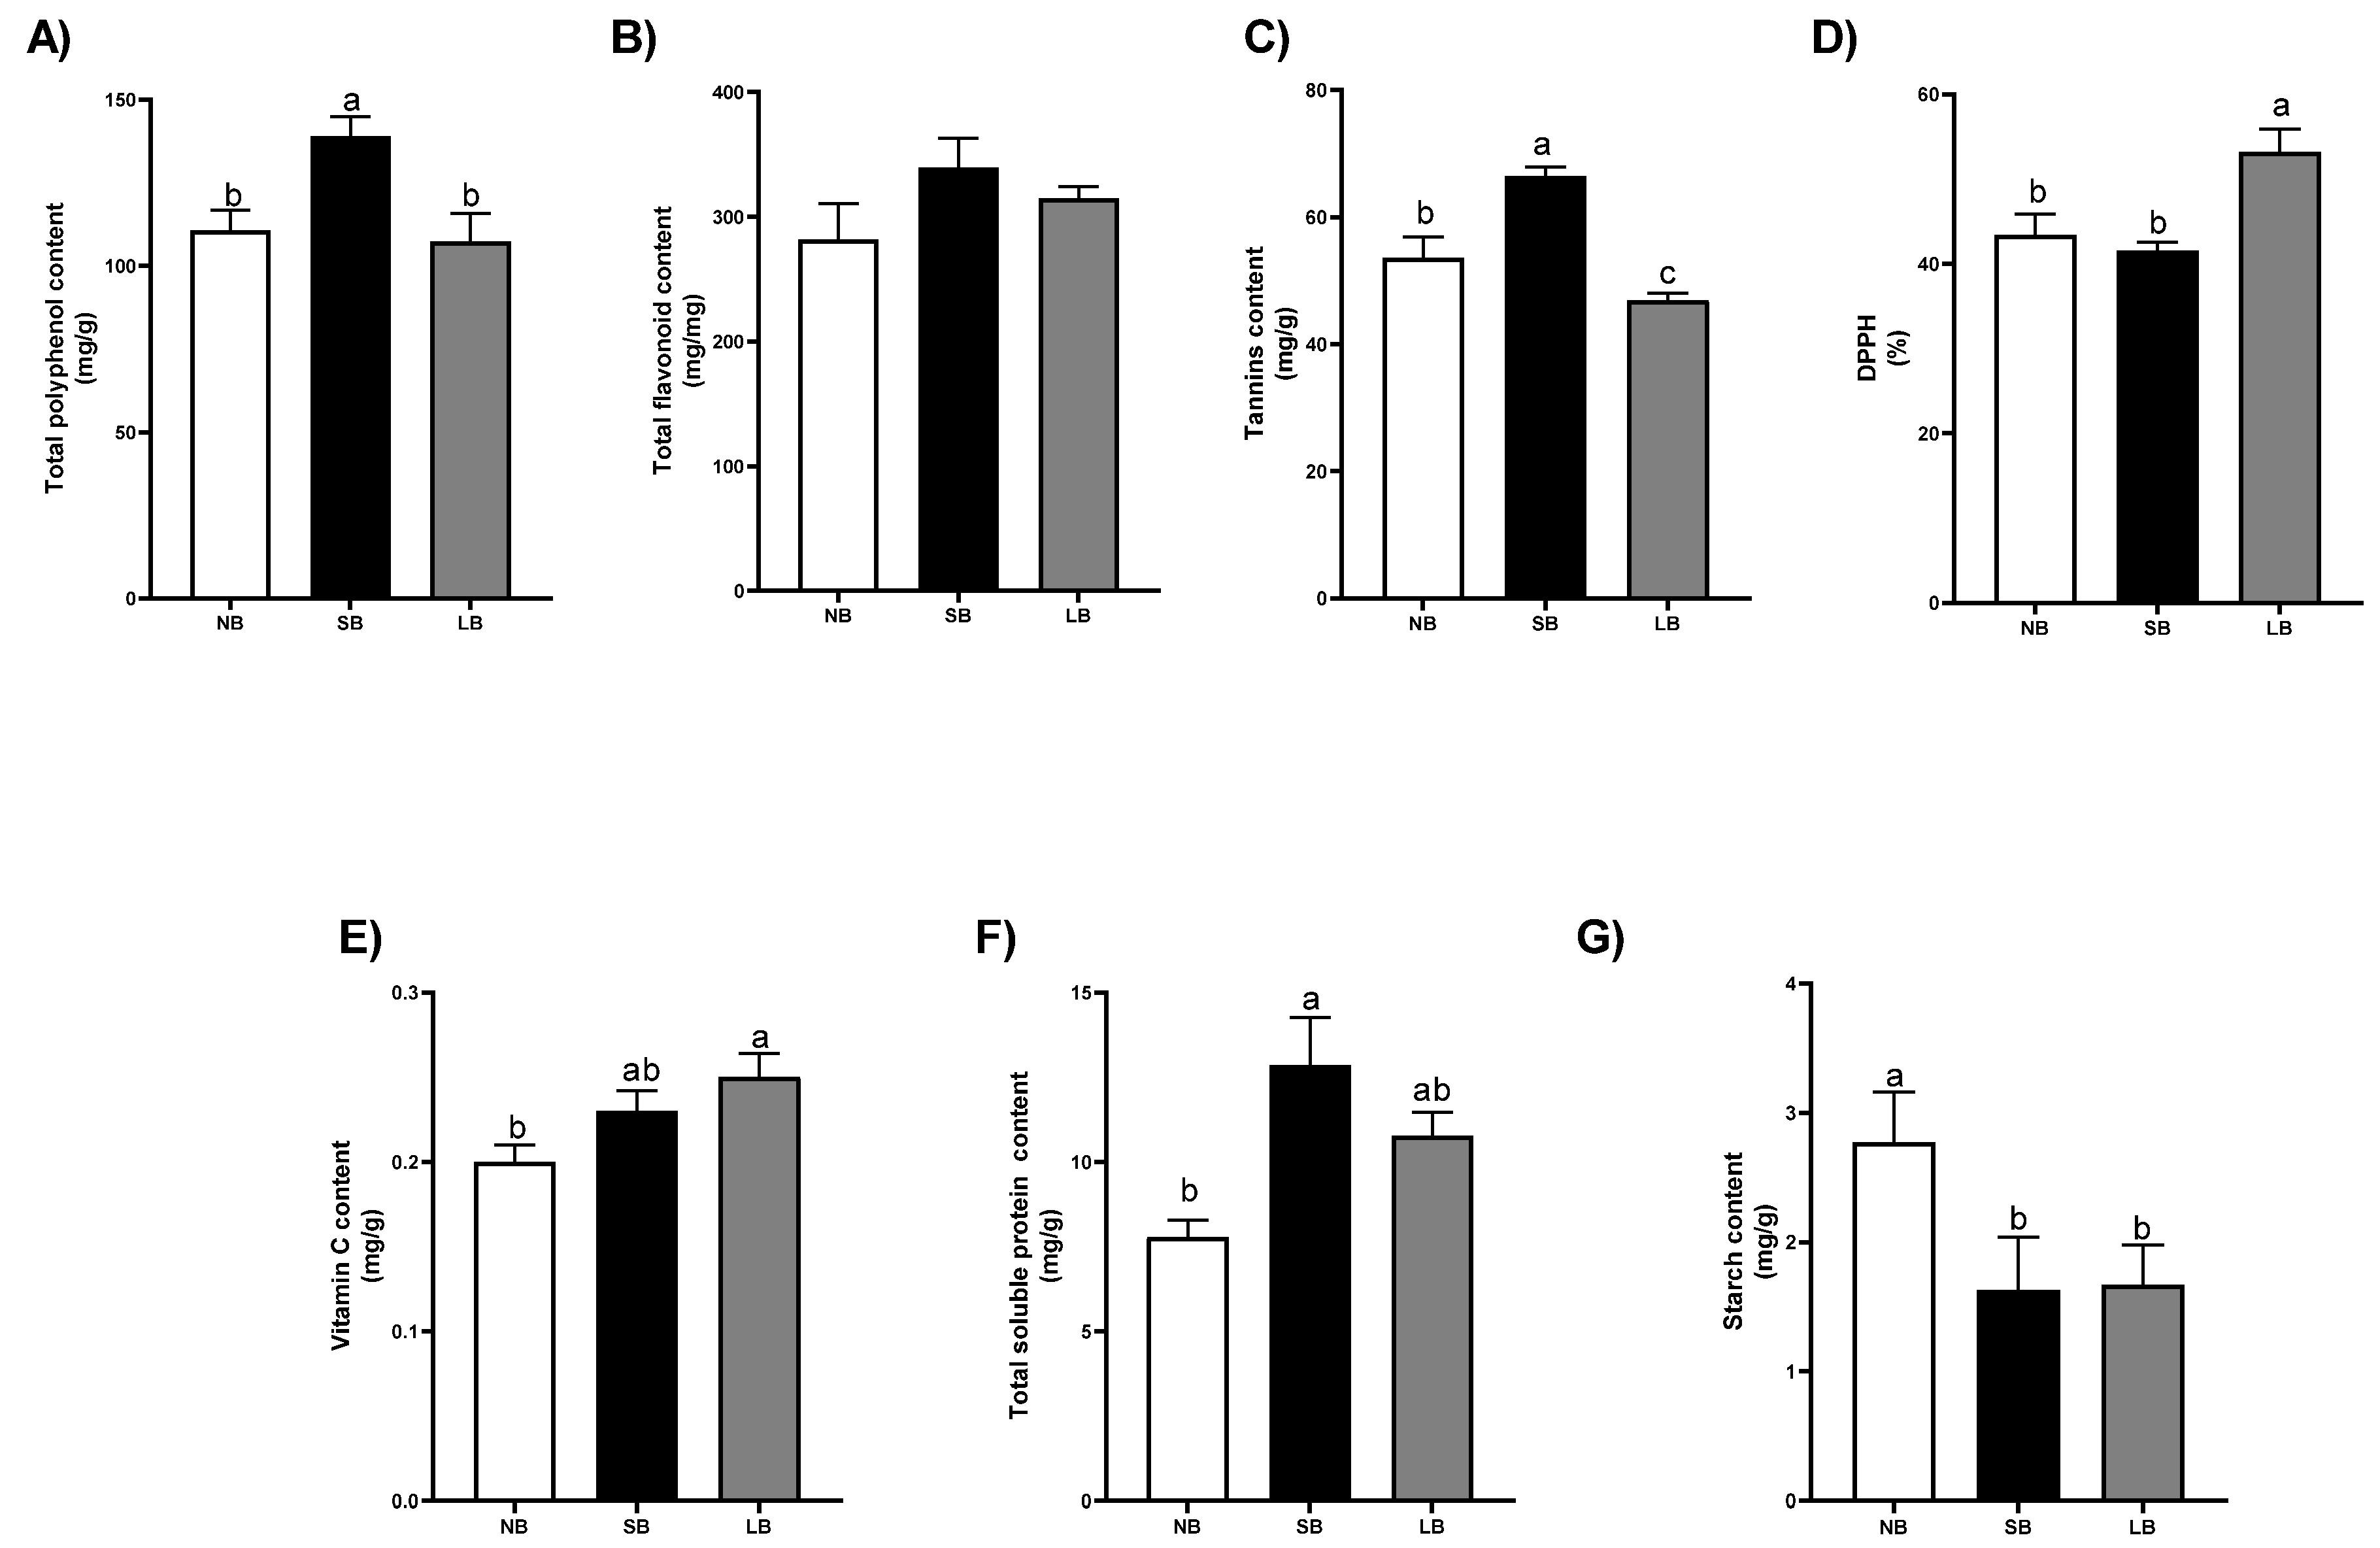
Total polyphenol content increased significantly under SB (+51.1%) compared to NB (Figure 2A). No significant differences were observed for TFC (Figure 2B). Tannin content increased significantly under SB (+33%), whereas LB decreased significantly with respect to NB (−41%) (Figure 2C). Antioxidant capacity measured through the DPPH assay was significantly higher in LB compared to NB, with an increase of approximately 20% (Figure 2D). Vitamin C content was significantly higher in LB compared to NB, with an increase of approximately 18% (Figure 2E). Total soluble proteins were higher in SB, showing a 47% increase compared to NB (Figure 2F). Finally, the starch content was reduced in both treatments compared to NB (−47% for SB; −45% for LB) (Figure 2G).
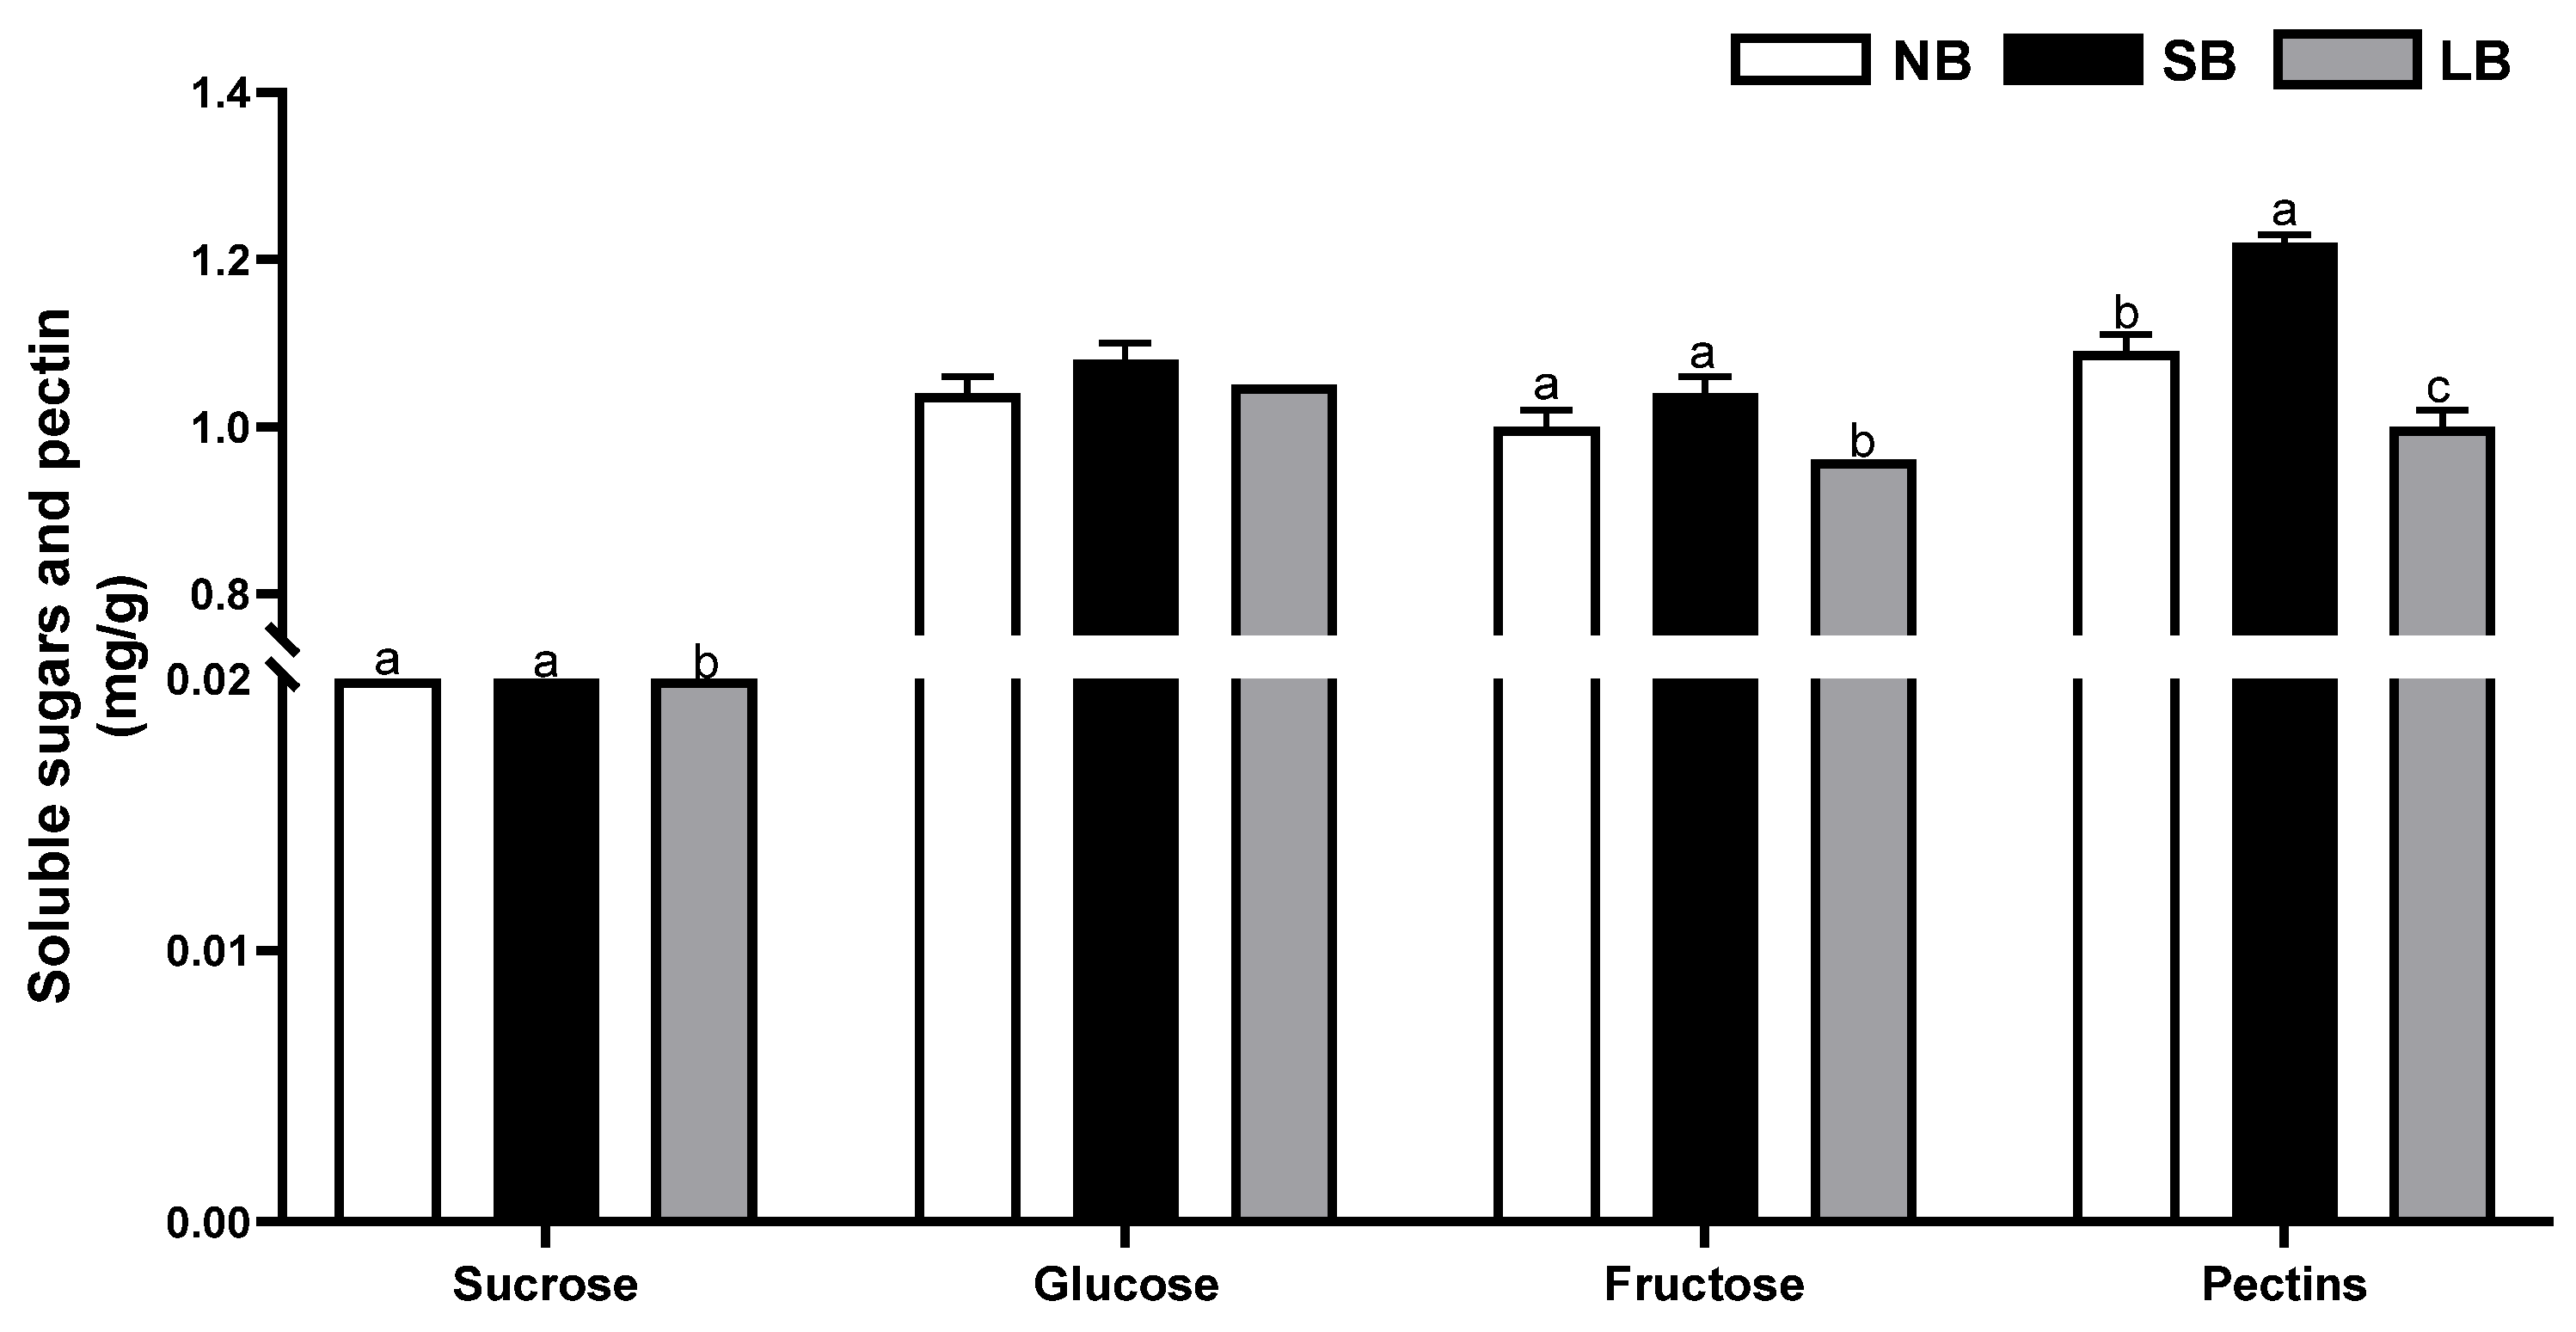
Sucrose and fructose content showed no differences in SB with respect to NB; meanwhile, a statistically significant decrease was found for LB (−10% and −18%, respectively) (Figure 3). Glucose content showed no statistical difference across all treatments (Figure 3). Differently, pectin content showed a significant increase in SB (+25%) and a significant decrease in LB (−34%) with respect to NB (Figure 3).
Phosphorus content was highest in SB, showing an 8% increase over NB and a 22% increase over LB, with SB and NB being statistically similar. Sulfur did not vary significantly among treatments. Potassium decreased significantly in SB and LB, showing reductions of 12% and 26%, respectively, with respect to NB. Calcium remained relatively stable among treatments, with no statistically significant differences. Manganese was reduced in SB and LB, with reductions of 49% and 55%, respectively. Iron showed no significant variations among treatments. Copper and Zn were strongly reduced under SB and LB compared to NB: Cu content in SB and LB was reduced by 54% and 59%, respectively, while Zn levels decreased by 86% in SB and 83% in LB (Table 2).

3.3. Musts

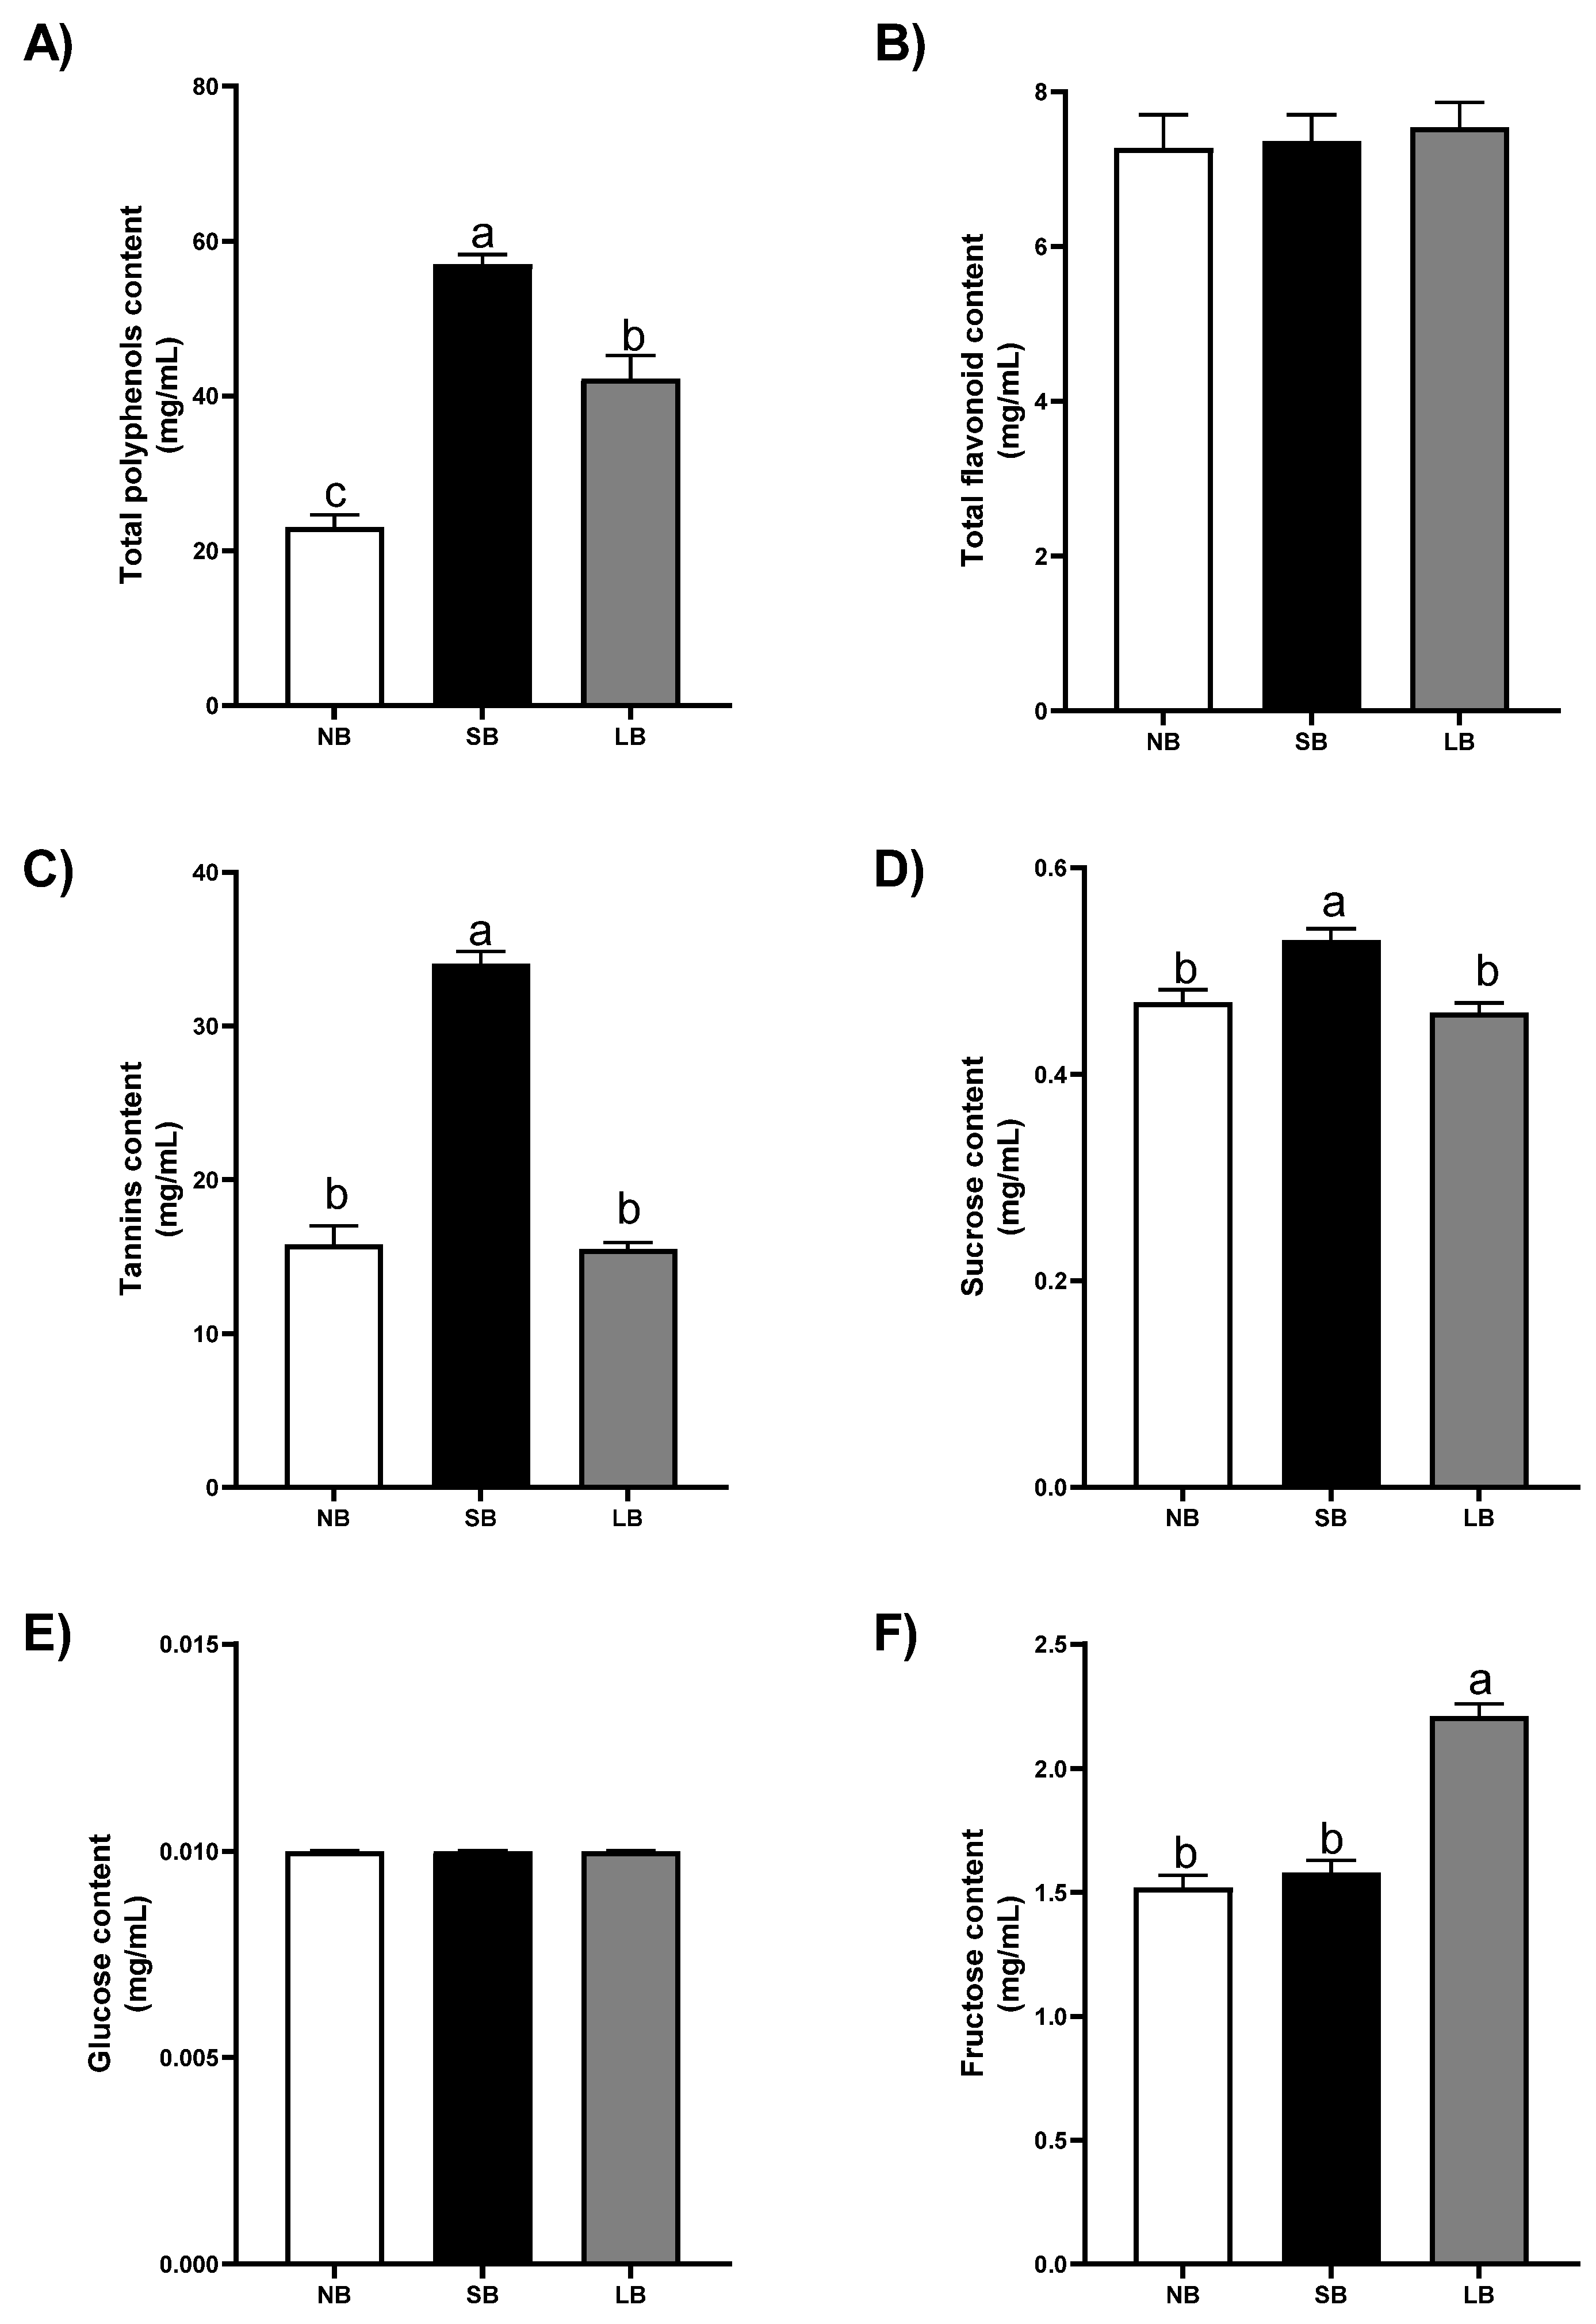
Total polyphenol content showed a statistically significant increase under SB, with a 127% increase compared to NB and a 44% increase over LB (Figure 4A). Total flavonoid content remained consistent across treatments, with no significant differences observed (Figure 4B). Tannin content was significantly higher in SB, showing a 94% increase compared to NB (Figure 4C). Sucrose content was also highest in SB, 16% greater than NB (Figure 4D). Glucose content was unaffected by treatment (Figure 4E). Fructose content was significantly higher in LB, showing an 11% increase compared to NB (Figure 4F).
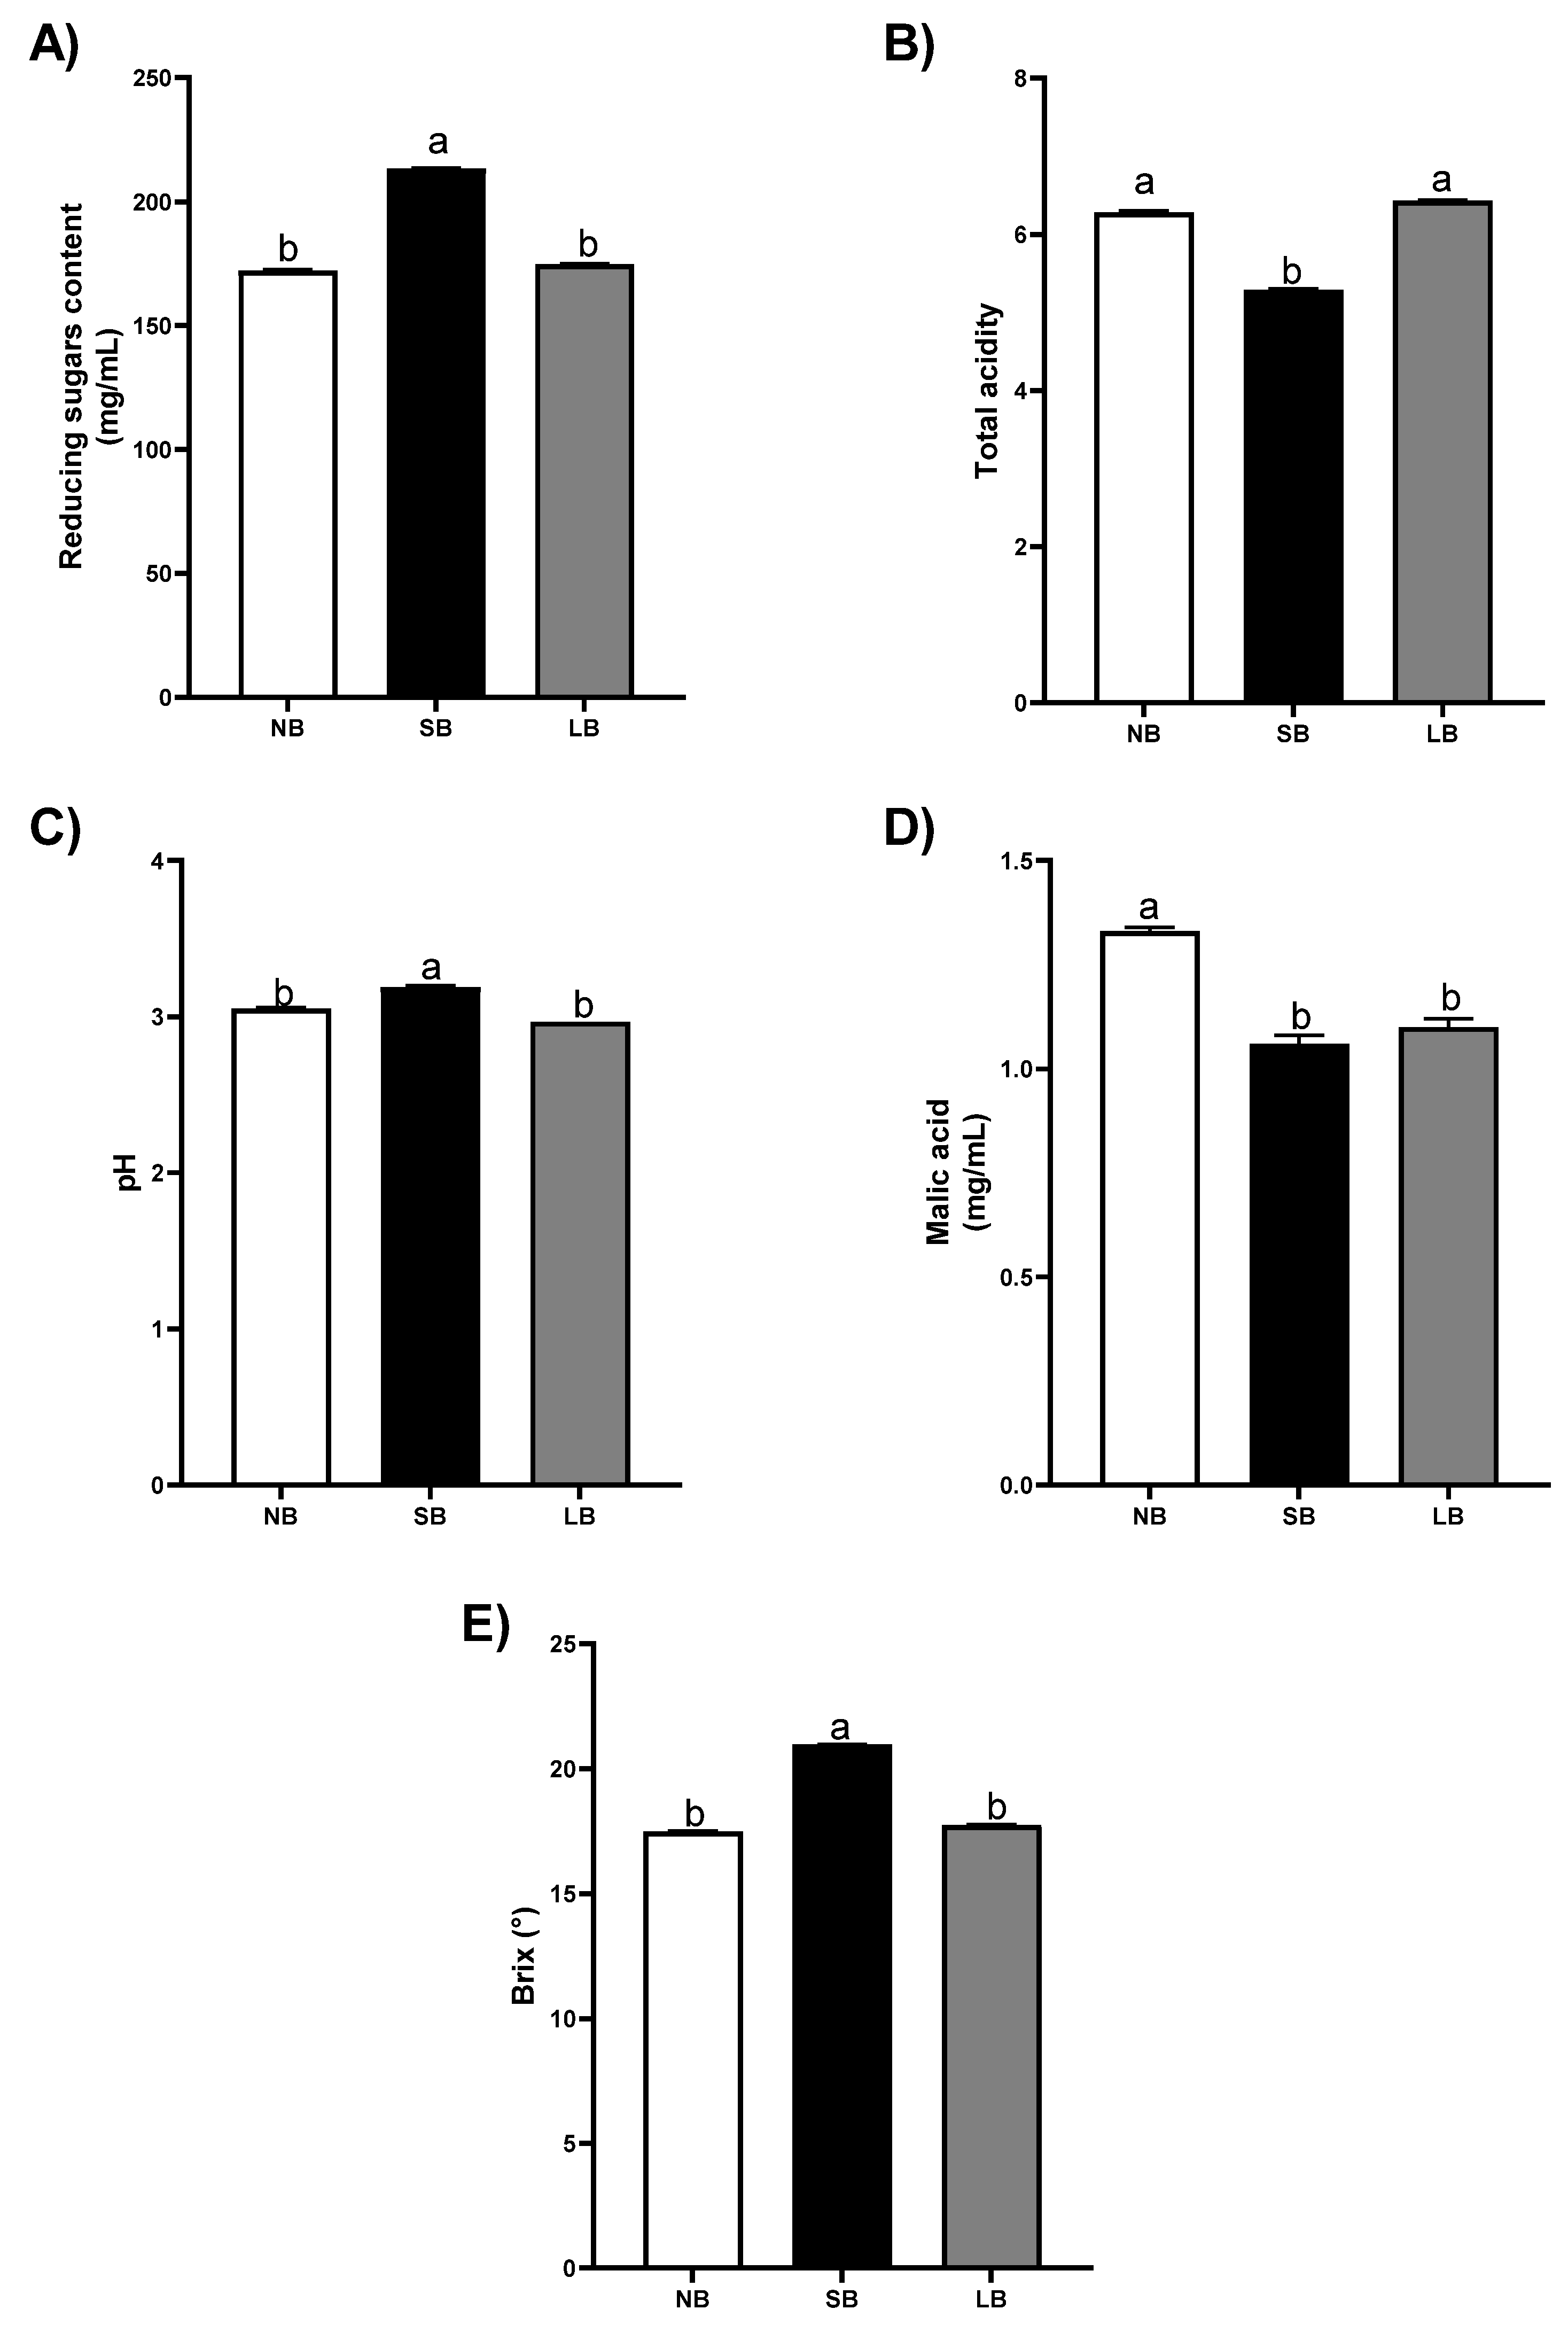
Reducing sugar content and pH were significantly higher in SB, showing an increase of 21% and 13% compared to NB, respectively (Figure 5A,C). Conversely, the total acidity was significantly lower in SB (−17%) compared to NB (Figure 5B). Malic acid content was significantly reduced in SB and LB (14% and 9%, respectively) with respect to NB (Figure 5D). °Brix was significantly higher in SB by 14% compared to NB (Figure 5E).

4. Discussion

4.1. Leaves

Biochar is increasingly recognized as a soil amendment capable of modulating plant physiology through a range of physical, chemical, and biological pathways [61,62]. Its porous structure, high CEC, and role as a microbial niche, collectively contribute to enhance soil fertility, improve water retention, and make more efficient nutrient cycling-factors particularly critical for the performance of perennial crops under abiotic stress [63,64,65,66]. Previous studies in grapevine, olive, and apple have documented enhanced photosynthetic activity and oxidative stress mitigation associated with biochar use, often attributed to improved root performance and nutrient homeostasis [67,68,69].
In this context, the different biochemical responses of the grapevine plants observed following the application of the two biochar formulations can be understood in terms of their application strategies. Solid biochar acts primarily as a soil amendment, and this mode of application supports a slow-release effect that promotes long-term improvement in soil structure and nutrient availability [70]. These conditions promote improved nitrogen assimilation, chlorophyll stability, and redox homeostasis, as previously reported in studies conducted on perennial woody plants [69,71]. This physiological response may indicate a more stable and regulated metabolic environment that supports pigment stability; in fact, our data confirmed that pigment concentrations were maintained in leaves grown with SB, with no observed decrease. In contrast, the application of LB via fertigation introduces a more dynamic interaction at the rhizosphere level. Frequent exposure to biochar surfaces may temporarily alter microbial activity and nutrient fluxes, inducing more rapid but potentially transient physiological responses. This could include modulation of photosynthetic pigment synthesis or turnover, especially under stress-prone conditions, where shifts in chloroplast function often serve as early indicators of metabolic imbalance [72]. Moreover, the lack of structural integration of LB into the soil matrix may limit its long-term stabilizing effects, instead favoring short-term signaling and stress-related responses. In our study, this was reflected by a significant reduction in pigment concentrations in leaves treated with LB, further supporting the idea that its effects are more acute and potentially stress-associated. The maintenance of chlorophyll in SB-treated plants may be attributed to improved nitrogen assimilation and stable availability of cofactors such as Mg and Fe, which are critical for chlorophyll biosynthesis [73]. Conversely, the reduction observed under LB fertigation could result from transient imbalances in rhizosphere nutrient fluxes and oxidative stress responses, which accelerate pigment degradation [74]. Such patterns are consistent with emerging evidence suggesting that particle scale and delivery frequency play a decisive role in determining biochar’s mode of action [75].
From a biochemical point of view, both treatments enhanced total soluble protein content, suggesting improved nitrogen metabolism, though this increase was significantly stronger with solid biochar. This likely reflects a more effective stimulation of nitrogen assimilation and protein biosynthesis, potentially due to improved nutrient retention and microbial interactions in the rhizosphere. Our findings are consistent with those reported by Cong et al. [76], who observed that long-term biochar application in maize significantly increased soluble protein and sugar contents, along with improved chlorophyll levels and plant growth parameters. Their results support the idea that biochar enhances metabolic efficiency and stress resilience, particularly through better nitrogen utilization and photosynthetic activity.
The divergent trends in phenols and flavonoid accumulation highlight how secondary metabolism is differentially modulated by the treatments: TPC was significantly enhanced under SB, consistent with a primed antioxidant status, while LB led to increased TFC, possibly reflecting a more acute, stress-induced response. This aligns with findings by Zhou et al. [77], who reported that applying a 2% biochar to nursery-grown Bidens pilosa significantly increased both total phenol and flavonoid contents, pointing to a biochar-induced boost in baseline antioxidant metabolism rather than a stress-response artifact.
Regarding the mineral elements in the leaf, our results suggest that SB treatment favored the retention of key micronutrients such as Fe and Mg, which are essential for chlorophyll synthesis and photosynthetic function. This stable nutritional profile likely contributed to the sustained pigment contents and overall photosynthetic efficiency observed, in line with the role of these elements in chloroplast structure and function [78]. Conversely, LB-treated plants showed greater variability in the availability of Fe and P, which may underlie the fluctuations observed in both pigment accumulation and oxidative responses, pointing to a less balanced metabolic state.

4.2. Skins

Solid biochar significantly enhanced TPC and tannin content, as well as total soluble proteins and proline, suggesting a sustained activation of the phenylpropanoid pathway and nitrogen metabolism. This profile is consistent with previous studies reporting that biochar can prime antioxidant and osmoprotective responses in perennial crops under non-stressful conditions [79,80]. The concurrent increase in pectin content in SB-treated berries further supports the notion of a structurally reinforced berry skin, which could have implications for both fruit resilience and post-harvest quality. In contrast, LB did not increase total polyphenols or tannins but significantly enhanced total antioxidant power and vitamin C content. This suggests a different mode of action, possibly linked to short-term oxidative signaling or shifts in rhizosphere microbial activity due to repeated fertigation. Similar redox-sensitive responses without increased polyphenol biosynthesis have been reported in crops exposed to mild oxidative stimuli [75]. Moreover, the significant decrease in sucrose and fructose under LB may reflect altered sugar partitioning or transport, potentially driven by stress-associated metabolic adjustments. Both treatments led to a reduction in starch content, indicating an increased turnover of carbohydrate reserves, but only SB preserved sugar levels. The divergent effects on pectin, accumulated under SB and reduced under LB, highlight how the two biochar forms differently influence cell wall metabolism. This could translate into contrasting impacts on berry texture and integrity, especially during ripening.
These findings align with previous research in olive (Olea europea, L.) and lemon grass (Cymbopogon citratuc, L.) showing that biochar-enriched soils can enhance phenolic content via improved K availability and moderated oxidative environments [69,81]. In grapevine, such responses may be mediated by biochar-induced activation of the phenylpropanoid pathway [82], with long-term soil conditioning under SB promoting consistent antioxidant compound synthesis [67]. The consistent enrichment of sugars in SB-treated berries supports the hypothesis that biochar can act as a metabolic “primer,” stimulating osmolyte and secondary metabolite accumulation [83]. Mineral data reinforce these trends: P was significantly higher in SB, while K declined in both biochar treatments, more so in LB, possibly due to leaching. Micronutrients, particularly Zn, Cu, and Mn, were markedly depleted, especially in SB, likely due to biochar’s high surface area and binding affinity, which can reduce micronutrient availability through adsorption mechanisms. Though short-term metabolic outcomes were not evidently compromised, long-term reductions in essential cofactors such as Cu and Zn may affect enzymatic functions critical for photosynthesis (i.e., plastocyanin), redox homeostasis (i.e., superoxide dismutase), and fruit maturation (i.e., alcohol dehydrogenase). Sustained micronutrient depletion could predispose vines to latent deficiency symptoms and potentially compromise grape composition and wine quality. These results suggest that, under intensive SB application, supplementary micronutrient management (i.e., foliar sprays or soil amendments) may be required to avoid long-term deficiency risks. For LB, the repeated fertigation likely intensified short-term rhizosphere interactions, possibly enhancing microbial turnover and redox-sensitive signaling without inducing broad phenolic biosynthesis. Given the limited literature on LB in perennial fruit crops, these findings provide novel insights into formulation-dependent metabolic modulation in grapevine skin berry.

4.3. Musts

The biochemical composition of grape must is a critical determinant of wine quality [84], and it is well established that soil and water management practices influence sugar–acid dynamics, phenolic content, and aromatic precursors [85,86]. Biochar application markedly influenced these parameters, with SB eliciting the most pronounced improvements. Specifically, SB significantly increased tannin and TPC, nearly doubling tannin concentration and enhancing polyphenols by >120% relative to NB, supporting its role in stimulating phenylpropanoid metabolism and enriching the phenolic complexity of must. These compositional improvements suggest potential benefits for wine structure and aging potential, particularly due to the elevated tannin content, which plays a key role in mouthfeel, color stability, and antioxidant activity during winemaking [87].
These findings are in line with previous studies in fruit (Prunus persica (L.) Batsch) and citrus (Citrus L.), where biochar use enhanced fruit sugar content and reduced total acidity through improved water retention and root-zone nutrition [81,88]. In grapevine, the observed increases and °Brix content under SB reinforce its potential for optimizing harvest indices under climate-affected ripening conditions. Total flavonoid content remained unchanged, suggesting targeted enhancement of non-flavonoid polyphenolics or condensed tannins. SB-treated must also showed lower malic acid and total acidity, higher pH, and increased reducing sugars and sucrose, indicating more mature and compositionally balanced fruit. The improved °Brix content with SB also indicates an earlier and more favorable ripening period, critical in regions experiencing heat stress and accelerated sugar accumulation. These effects could aid growers in better synchronizing harvest timing with enological objectives [89].
Interestingly, the application of LB led to a marked accumulation of fructose and reducing sugars, while polyphenol content and °Brix remained unchanged. This pattern suggests a targeted modulation of carbohydrate metabolism, potentially mediated by osmotic adjustments or transient stress signaling pathways, rather than a generalized enhancement of secondary metabolism or soluble solids. While no adverse effects on fruit development or must quality were observed with LB, its influence on sugar partitioning may affect fermentation kinetics or wine style. In this sense, LB may be more suitable when short-term modulation of sugar levels is desired, such as for lighter wine styles or early-harvest strategies, while SB appears better aligned with premium wine production goals where compositional depth and phenolic richness are priorities [90,91,92]. To date, no published studies have evaluated the enological consequences of LB provided by fertigation in vineyard systems; however, these findings suggest that LB acts more as a short-term modulator of sugar metabolism and osmotic status, whereas SB confers gradual and integrative improvements in fruit compositional balance. Each may therefore serve distinct agronomic purposes, depending on the desired ripening profile, vineyard water regime, and winemaking objectives.
The present study provides novel evidence on the formulation-specific effects of solid and liquid biochar in grapevine cultivation. Unlike previous reports that mainly addressed biochar as a generic soil amendment, our findings demonstrate for the first time that SB and LB induce distinct biochemical and nutritional responses at the level of leaves, berry skins, and musts. This represents a new contribution to the understanding of biochar–plant interactions in perennial fruit crops, highlighting the importance of both formulation and application strategy.
From an applicative standpoint, these results suggest that SB may be most suitable for long-term vineyard management, improving soil fertility, phenolic richness, and must quality, thus supporting premium wine production. Conversely, LB may be strategically used to modulate sugar metabolism and antioxidant capacity in the short term, offering potential advantages for targeted enological outcomes or under specific climatic and agronomic conditions.
Looking ahead, future research should explore the long-term impacts of repeated SB and LB applications on vineyard ecosystems, with particular attention to soil microbial dynamics, micronutrient availability, and the enological properties of wines produced from treated grapes. Moreover, comparative experiments across different grapevine cultivars and pedoclimatic contexts will be essential to establish the broader applicability and scalability of these bio-based strategies within sustainable viticulture.

5. Conclusions

The aim of this study was to evaluate the effects of solid (SB) and liquid biochar (LB) on the biochemical and nutritional composition of grapevine leaves, berry skins, and must in a commercial Sangiovese vineyard. Our experimental results demonstrate that SB, applied once to the soil, promoted chlorophyll stability in leaves, increased soluble proteins, and significantly enhanced phenolic compounds and tannins in berry skins and must. These outcomes confirm the capacity of SB to improve soil–plant interactions and support long-term enhancement of fruit quality, particularly for premium wine production where phenolic richness is essential. Conversely, LB, applied repeatedly via fertigation, reduced chlorophyll and nutrient contents in leaves but increased fructose, reducing sugars, vitamin C, and antioxidant capacity in berry skins. This selective modulation indicates that LB may be effectively used for short-term adjustment of sugar and antioxidant profiles, making it suitable for lighter wine styles or early-harvest strategies. Overall, the study highlights that formulation and application method decisively shape biochar’s mode of action in vineyards, and their targeted use can help align agronomic practices with specific enological objectives.

Author Contributions

Conceptualization: S.C. and S.L.; data curation: R.F.; formal analysis: R.F. and S.C.; funding acquisition: S.L.; investigation: R.F. and S.C.; methodology: R.F. and S.C.; supervision: S.C. and S.L.; writing—original draft: R.F. and S.C.; writing—review and editing: R.F., S.C. and S.L. All authors have read and agreed to the published version of the manuscript.

Funding

This work was supported by FSE REACT-EU, PON Ricerca e Innovazione 2014–2020 and by a project funded under the National Recovery and Resilience Plan (NRRP), Mission 4, Component 2, Investment 1.4—call for tender No. 3138, 16 December 2021, rectified by Decree n.3175 on 18 December 2021 by the Italian Ministry of University and Research, funded by the European Union—NextGenerationEU. Project code CN_00000033; Concession Decree No. 1034, 17 June 2022, adopted by Italy.

Data Availability Statement

The authors declare that they have no known competing financial interests or personal relationships that could have appeared to influence the work reported in this paper.

Acknowledgments

We thank Francesco Barbagli (BioEsperia and BioDea) for kindly providing the biochar; Ferdinando Barbagli for kindly providing the vineyard for the experimentation.

Conflicts of Interest

The authors declare no conflicts of interest.

References

  1. Eurostat. Organic Farming Statistics. 2022. Available online: https://ec.europa.eu/eurostat (accessed on 30 June 2025).
  2. Eurostat. Sustainable Use of Pesticides Statistics. 2021. Available online: https://ec.europa.eu/eurostat (accessed on 30 June 2025).
  3. IPCC. Climate Change 2021: The Physical Science Basis. Contribution of Working Group I to the Sixth Assessment Report of the Intergovernmental Panel on Climate Change; Cambridge University Press: Cambridge, UK, 2021. [Google Scholar]
  4. Kuo, W.H.J.; Chung, C.L.; Juang, K.W.; Tung, C.W.; Liu, L.Y.D. Challenges to agriculture production under climate change. In Agricultural Nutrient Pollution and Climate Change: Challenges and Opportunities; Springer Nature Switzerland: Cham, Switzerland, 2025; pp. 29–56. [Google Scholar]
  5. European Commission. Farm to Fork. Available online: https://food.ec.europa.eu/horizontal-topics/farm-fork-strategy_en (accessed on 14 August 2025).
  6. European Commission. European Green Deal. Available online: https://commission.europa.eu/strategy-and-policy/priorities-2019-2024/european-green-deal_en (accessed on 14 August 2025).
  7. Garibaldi, L.A.; Gemmill-Herren, B.; D’Annolfo, R.; Graeub, B.E.; Cunningham, S.A.; Breeze, T.D. Farming approaches for greater biodiversity, livelihoods, and food security. Trends Ecol. Evol. 2017, 32, 68–80. [Google Scholar] [CrossRef]
  8. Michaliszyn-Gabryś, B.; Krupanek, J.; Kalisz, M.; Smith, J. Challenges for sustainability in packaging of fresh vegetables in organic farming. Sustainability 2022, 14, 5346. [Google Scholar] [CrossRef]
  9. Fedeli, R.; Fiaschi, T.; Angiolini, C.; Maccherini, S.; Loppi, S.; Fanfarillo, E. Dose-Dependent and Species-Specific Effects of Wood Distillate Addition on the Germination Performance of Threatened Arable Plants. Plants 2023, 12, 3028. [Google Scholar] [CrossRef]
  10. Khan, M.T.; Aleinikovienė, J.; Butkevičienė, L.M. Innovative organic fertilizers and cover crops: Perspectives for sustainable agriculture in the era of climate change and organic agriculture. Agronomy 2024, 14, 2871. [Google Scholar] [CrossRef]
  11. Mamatha, B.; Mudigiri, C.; Ramesh, G.; Saidulu, P.; Meenakshi, N.; Prasanna, C.L. Enhancing soil health and fertility management for sustainable agriculture: A review. Asian J. Soil Sci. Plant Nutr. 2024, 10, 182–190. [Google Scholar] [CrossRef]
  12. Sani, M.N.H.; Yong, J.W. Harnessing synergistic biostimulatory processes: A plausible approach for enhanced crop growth and resilience in organic farming. Biology 2021, 11, 41. [Google Scholar] [CrossRef]
  13. Panwar, N.L.; Pawar, A.; Salvi, B.L. Comprehensive review on production and utilization of biochar. SN Appl. Sci. 2019, 1, 168. [Google Scholar] [CrossRef]
  14. Spokas, K.A.; Cantrell, K.B.; Novak, J.M.; Archer, D.W.; Ippolito, J.A.; Collins, H.P.; Nichols, K.A. Biochar: A synthesis of its agronomic impact beyond carbon sequestration. J. Environ. Qual. 2012, 41, 973–989. [Google Scholar] [CrossRef]
  15. Gopal, M.; Gupta, A.; Hameed, K.S.; Sathyaseelan, N.; Rajeela, T.H.K.; Thomas, G.V. Biochars produced from coconut palm biomass residues can aid regenerative agriculture by improving soil properties and plant yield in humid tropics. Biochar 2020, 2, 211–226. [Google Scholar] [CrossRef]
  16. Liu, Y.; Li, H.; Hu, T.; Mahmoud, A.; Li, J.; Zhu, R.; Jing, P. A quantitative review of the effects of biochar application on rice yield and nitrogen use efficiency in paddy fields: A meta-analysis. Sci. Total Environ. 2022, 830, 154792. [Google Scholar] [CrossRef]
  17. Hu, Q.; Jung, J.; Chen, D.; Leong, K.; Song, S.; Li, F.; Wang, C.H. Biochar industry to circular economy. Sci. Total Environ. 2021, 757, 143820. [Google Scholar] [CrossRef]
  18. Harty, M.; Forrestal, P.; Watson, C.; McGeough, K.; Carolan, R.; Elliot, C.; Krol, D.; Laughlin, R.; Richards, K.; Lanigan, G.J. Reducing nitrous oxide emissions by changing N fertiliser use from calcium ammonium nitrate (CAN) to urea based formulations. Sci. Total Environ. 2016, 563, 576–586. [Google Scholar] [CrossRef]
  19. Tomczyk, A.; Sokołowska, Z.; Boguta, P. Biochar physicochemical properties: Pyrolysis temperature and feedstock kind effects. Rev. Environ. Sci. Bio/Technol. 2020, 19, 191–215. [Google Scholar] [CrossRef]
  20. Bilias, F.; Kalderis, D.; Richardson, C.; Barbayiannis, N.; Gasparatos, D. Biochar application as a soil potassium management strategy: A review. Sci. Total Environ. 2023, 858, 159782. [Google Scholar] [CrossRef]
  21. Scott, H.L.; Ponsonby, D.; Atkinson, C.J. Biochar: An improver of nutrient and soil water availability—What is the evidence? CABI Rev. 2014, 1–19. [Google Scholar] [CrossRef]
  22. Palansooriya, K.N.; Wong, J.T.F.; Hashimoto, Y.; Huang, L.; Rinklebe, J.; Chang, S.X.; Ok, Y.S. Response of microbial communities to biochar-amended soils: A critical review. Biochar 2019, 1, 3–22. [Google Scholar] [CrossRef]
  23. Quilliam, R.S.; Glanville, H.C.; Wade, S.C.; Jones, D.L. Life in the ‘charosphere’—Does biochar in agricultural soil provide a significant habitat for microorganisms? Soil Biol. Biochem. 2013, 65, 287–293. [Google Scholar] [CrossRef]
  24. Diatta, A.A.; Fike, J.H.; Battaglia, M.L.; Galbraith, J.M.; Baig, M.B. Effects of biochar on soil fertility and crop productivity in arid regions: A review. Arab. J. Geosci. 2020, 13, 595. [Google Scholar] [CrossRef]
  25. Khan, S.; Irshad, S.; Mehmood, K.; Hasnain, Z.; Nawaz, M.; Rais, A.; Ibrar, D. Biochar production and characteristics, its impacts on soil health, crop production, and yield enhancement: A review. Plants 2024, 13, 166. [Google Scholar] [CrossRef]
  26. Singh, R.; Singh, P.; Singh, H.; Raghubanshi, A.S. Impact of sole and combined application of biochar, organic and chemical fertilizers on wheat crop yield and water productivity in a dry tropical agro-ecosystem. Biochar 2019, 1, 229–235. [Google Scholar] [CrossRef]
  27. Lou, Y.; Joseph, S.; Li, L.; Graber, E.R.; Liu, X.; Pan, G. Water extract from straw biochar used for plant growth promotion: An initial test. BioResources 2016, 11, 249–266. [Google Scholar] [CrossRef]
  28. Bian, X.; Wang, K.; Gong, H. Biochar-enhanced agricultural application of liquid digestate from food waste anaerobic digestion for celery cultivation. Sci. Total Environ. 2023, 869, 161562. [Google Scholar] [CrossRef]
  29. Sixt, T.; Pacholski, A.; Winkhart, F.; Jaufmann, E.; Schmid, H.; Hülsbergen, K.J. Does woody biochar mixed with liquid organic fertilizer reduce ammonia volatilization following field application? Nutr. Cycl. Agroecosyst. 2025, 131, 165–184. [Google Scholar] [CrossRef]
  30. Cataldo, E.; Salvi, L.; Sbraci, S.; Storchi, P.; Mattii, G.B. Sustainable viticulture: Effects of soil management in Vitis vinifera. Agronomy 2020, 10, 1949. [Google Scholar] [CrossRef]
  31. Lavee, S. Grapevine (Vitis vinifera) growth and performance in warm climates. In Temperate Fruit Crops in Warm Climates; Springer: Dordrecht, The Netherlands, 2000; pp. 343–366. [Google Scholar] [CrossRef]
  32. Torregrosa, L.; Vialet, S.; Adivèze, A.; Iocco-Corena, P.; Thomas, M.R. Grapevine (Vitis vinifera L.). In Agrobacterium Protocols: Volume 2; Wang, K., Ed.; Humana Press: New York, NY, USA, 2015; pp. 177–194. [Google Scholar] [CrossRef]
  33. Conde, C.; Silva, P.; Fontes, N.; Dias, A.C.P.; Tavares, R.M.; Sousa, M.J.; Gerós, H. Biochemical changes throughout grape berry development and fruit and wine quality. Phytochemistry 2007, 68, 1343–1355. [Google Scholar] [CrossRef]
  34. Ferrandino, A.; Lovisolo, C. Abiotic stress effects on grapevine (Vitis vinifera L.): Focus on abscisic acid-mediated consequences on secondary metabolism and berry quality. Environ. Exp. Bot. 2014, 103, 138–147. [Google Scholar] [CrossRef]
  35. Biodea. Available online: https://biodea.bio/scheda-colturale/vigneto/ (accessed on 15 July 2025).
  36. Fedeli, R.; Celletti, S.; Alexandrov, D.; Nafikova, E.; Loppi, S. Biochar-mediated bioremediation: A sustainable strategy to increase Avena sativa L. tolerance to crude oil soil contamination. Environ. Sci. Pollut. Res. 2024, 31, 52774–52783. [Google Scholar] [CrossRef]
  37. Lichtenthaler, H.K.; Wellburn, A.R. Determinations of total carotenoids and chlorophylls a and b of leaf extracts in different solvents. Biochem. Soc. Trans. 1983, 11, 591–592. [Google Scholar] [CrossRef]
  38. Borella, M.; Baghdadi, A.; Bertoldo, G.; Della Lucia, M.C.; Chiodi, C.; Nardi, S. Transcriptomic and physiological approaches to decipher cold stress mitigation exerted by brown-seaweed extract application in tomato. Front. Plant Sci. 2023, 14, 1232421. [Google Scholar] [CrossRef]
  39. Mendes, R.; Cardoso, C.; Pestana, C. Measurement of malondialdehyde in fish: A comparison study between HPLC methods and the traditional spectrophotometric test. Food Chem. 2009, 112, 1038–1045. [Google Scholar] [CrossRef]
  40. Azarnejad, N.; Celletti, S.; Ghorbani, M.; Fedeli, R.; Loppi, S. Dose-dependent effects of a corn starch-based bioplastic on basil (Ocimum basilicum L.): Implications for growth, biochemical parameters, and nutrient content. Toxics 2024, 12, 80. [Google Scholar] [CrossRef]
  41. Bates, L.S.; Waldren, R.P.; Teare, I.D. Rapid determination of free proline for water-stress studies. Plant Soil 1973, 39, 205–207. [Google Scholar] [CrossRef]
  42. Fedeli, R.; Zhatkanbayeva, Z.; Marcelli, R.; Zhatkanbayev, Y.; Desideri, S.; Loppi, S. Mitigation of cadmium and copper stress in lettuce: The role of biochar on metal uptake, oxidative stress, and yield. Plants 2025, 14, 2255. [Google Scholar] [CrossRef]
  43. Bradford, M.M. A rapid and sensitive method for the quantitation of microgram quantities of protein utilizing the principle of protein-dye binding. Anal. Biochem. 1976, 72, 248–254. [Google Scholar] [CrossRef]
  44. Fedeli, R.; Mazza, I.; Perini, C.; Salerni, E.; Loppi, S. New frontiers in the cultivation of edible fungi: The application of biostimulants enhances the nutritional characteristics of Pleurotus eryngii (DC.) Quél. Agriculture 2024, 14, 1012. [Google Scholar] [CrossRef]
  45. Al-Duais, M.; Müller, L.; Böhm, V.; Jetschke, G. Antioxidant capacity and total phenolics of Cyphostemma digitatum before and after processing: Use of different assays. Eur. Food Res. Technol. 2009, 228, 813–821. [Google Scholar] [CrossRef]
  46. Fedeli, R.; Cruz, C.; Loppi, S.; Munzi, S. Hormetic effect of wood distillate on hydroponically grown lettuce. Plants 2024, 13, 447. [Google Scholar] [CrossRef]
  47. Chang, C.C.; Yang, M.H.; Wen, H.M.; Chern, J.C. Estimation of total flavonoid content in propolis by two complementary colorimetric methods. J. Food Drug Anal. 2002, 10, 178–182. [Google Scholar]
  48. Fedeli, R.; Loppi, S.; Cruz, C.; Munzi, S. Evaluating seawater and wood distillate for sustainable hydroponic cultivation: Implications for crop growth and nutritional quality. Sustainability 2024, 16, 7186. [Google Scholar] [CrossRef]
  49. Broadhurst, R.B.; Jones, W.T. Analysis of condensed tannins using acidified vanillin. J. Sci. Food Agric. 1978, 29, 788–794. [Google Scholar] [CrossRef]
  50. Fedeli, R.; Di Lella, L.A.; Loppi, S. Suitability of XRF for routine analysis of multi-elemental composition: A multi-standard verification. Methods Protoc. 2024, 7, 53. [Google Scholar] [CrossRef]
  51. Fedeli, R.; Zhatkanbayeva, Z.; Loppi, S. Soil amendment with biochar from slaughterhouse waste bones enhances soil quality and promotes the growth of crop plants. Plant Biosyst. 2025, 159, 378–386. [Google Scholar] [CrossRef]
  52. Fedeli, R.; Zhatkanbayeva, Z.; Loppi, S. Wood distillate as a solution for growing crops under water deficiency. Crops 2025, 5, 22. [Google Scholar] [CrossRef]
  53. Bondet, V.; Brand-Williams, W.; Berset, C.L.W.T. Kinetics and mechanisms of antioxidant activity using the DPPH. free radical method. LWT-Food Sci. Technol. 1997, 30, 609–615. [Google Scholar] [CrossRef]
  54. Carullo, G.; Borghini, F.; Fusi, F.; Saponara, S.; Fontana, A.; Pozzetti, L.; Fedeli, R.; Panti, A.; Gorelli, B.; Aquino, G.; et al. Traceability and authentication in agri-food production: A multivariate approach to the characterization of the Italian food excellence elephant garlic (Allium ampeloprasum L.), a vasoactive nutraceutical. Food Chem. 2024, 444, 138684. [Google Scholar] [CrossRef]
  55. Ghasemnezhad, M.; Sherafati, M.; Payvast, G.A. Variation in phenolic compounds, ascorbic acid and antioxidant activity of five coloured bell pepper (Capsicum annum) fruits at two different harvest times. J. Funct. Foods 2011, 3, 44–49. [Google Scholar] [CrossRef]
  56. Et-Tazy, L.; Fedeli, R.; Khibech, O.; Lamiri, A.; Challioui, A.; Loppi, S. Effects of Monoterpene-Based Biostimulants on Chickpea (Cicer arietinum L.) Plants: Functional and Molecular Insights. Biology 2025, 14, 657. [Google Scholar] [CrossRef]
  57. Fedeli, R.; Celletti, S.; Loppi, S.; Vannini, A. Comparison of the Effect of Solid and Liquid Digestate on the Growth of Lettuce (Lactuca sativa L.) Plants. Agronomy 2023, 13, 782. [Google Scholar] [CrossRef]
  58. Fedeli, R.; Vannini, A.; Grattacaso, M.; Loppi, S. Wood distillate (pyroligneous acid) boosts nutritional traits of potato tubers. Ann. Appl. Biol. 2023, 183, 135–140. [Google Scholar] [CrossRef]
  59. Bevin, C.J.; Dambergs, R.G.; Fergusson, A.J.; Cozzolino, D. Varietal discrimination of Australian wines by means of mid-infrared spectroscopy and multivariate analysis. Anal. Chim. Acta 2008, 621, 19–23. [Google Scholar] [CrossRef]
  60. CoHort Software, version 6.4; Costat Statistical Software; CoHort Software: Monterey, CA, USA, 2025. Available online: https://www.cohortsoftware.com (accessed on 14 August 2025).
  61. Ahmed, N.; Deng, L.; Wang, C.; Shah, Z.U.H.; Deng, L.; Li, Y.; Tu, P. Advancements in biochar modification for enhanced phosphorus utilization in agriculture. Land 2024, 13, 644. [Google Scholar] [CrossRef]
  62. Elad, Y.; Cytryn, E.; Harel, Y.M.; Lew, B.; Graber, E.R. The biochar effect: Plant resistance to biotic stresses. Phytopathol. Mediterr. 2011, 50, 335–349. [Google Scholar] [CrossRef]
  63. Biederman, L.A.; Harpole, W.S. Biochar and its effects on plant productivity and nutrient cycling: A meta-analysis. GCB Bioenergy 2013, 5, 202–214. [Google Scholar] [CrossRef]
  64. Leng, L.; Xiong, Q.; Yang, L.; Li, H.; Zhou, Y.; Zhang, W.; Huang, H. An overview on engineering the surface area and porosity of biochar. Sci. Total Environ. 2021, 763, 144204. [Google Scholar] [CrossRef]
  65. Munera-Echeverri, J.L.; Martinsen, V.; Strand, L.T.; Zivanovic, V.; Cornelissen, G.; Mulder, J. Cation exchange capacity of biochar: An urgent method modification. Sci. Total Environ. 2018, 642, 190–197. [Google Scholar] [CrossRef]
  66. Razzaghi, F.; Obour, P.B.; Arthur, E. Does biochar improve soil water retention? A systematic review and meta-analysis. Geoderma 2020, 361, 114055. [Google Scholar] [CrossRef]
  67. Baronti, S.; Vaccari, F.P.; Miglietta, F.; Calzolari, C.; Lugato, E.; Orlandini, S.; Genesio, L. Impact of biochar application on plant water relations in Vitis vinifera (L.). Eur. J. Agron. 2014, 53, 38–44. [Google Scholar] [CrossRef]
  68. Liu, J.; Huang, S.; Chen, K.; Wang, T.; Mei, M.; Li, J. Preparation of biochar from food waste digestate: Pyrolysis behavior and product properties. Bioresour. Technol. 2020, 302, 122841. [Google Scholar] [CrossRef]
  69. Vaccari, F.P.; Maienza, A.; Miglietta, F.; Baronti, S.; Di Lonardo, S.; Giagnoni, L.; Genesio, L. Biochar stimulates plant growth but not fruit yield of processing tomato in a fertile soil. Agric. Ecosyst. Environ. 2015, 207, 163–170. [Google Scholar] [CrossRef]
  70. Wang, C.; Luo, D.; Zhang, X.; Huang, R.; Cao, Y.; Liu, G.; Wang, H. Biochar-based slow-release of fertilizers for sustainable agriculture: A mini review. Environ. Sci. Ecotechnol. 2022, 10, 100167. [Google Scholar] [CrossRef]
  71. Genesio, L.; Miglietta, F.; Baronti, S.; Vaccari, F.P. Biochar increases vineyard productivity without affecting grape quality: Results from a four years field experiment in Tuscany. Agric. Ecosyst. Environ. 2015, 201, 20–25. [Google Scholar] [CrossRef]
  72. Dubey, R.S. Photosynthesis in plants under stressful conditions. In Handbook of Photosynthesis, 3rd ed.; Pessarakli, M., Ed.; CRC Press: Boca Raton, FL, USA, 2018; pp. 629–649. [Google Scholar] [CrossRef]
  73. Mengel, K.; Kirkby, E.A. Principles of Plant Nutrition; Springer Science & Business Media: Berlin/Heidelberg, Germany, 2012. [Google Scholar]
  74. Tripathy, B.C.; Pattanayak, G.K. Chlorophyll biosynthesis in higher plants. In Photosynthesis: Plastid Biology, Energy Conversion and Carbon Assimilation; Springer: Dordrecht, The Netherlands, 2011; pp. 63–94. [Google Scholar]
  75. Zulfiqar, F.; Moosa, A.; Nazir, M.M.; Ferrante, A.; Ashraf, M.; Nafees, M.; Chen, J.; Darras, A.; Siddique, K.H. Biochar: An emerging recipe for designing sustainable horticulture under climate change scenarios. Front. Plant Sci. 2022, 13, 1018646. [Google Scholar] [CrossRef]
  76. Cong, M.; Hu, Y.; Sun, X.; Yan, H.; Yu, G.; Tang, G.; Siddique, K.H. Long-term effects of biochar application on the growth and physiological characteristics of maize. Front. Plant Sci. 2023, 14, 1172425. [Google Scholar] [CrossRef]
  77. Zhou, Y.; Zou, Z.; Wang, M.; Wang, Y.; Li, J.; Qiu, L.; Dai, Z. Biochar and nano-ferric oxide synergistically alleviate cadmium toxicity of muskmelon. Environ. Sci. Pollut. Res. 2023, 30, 57945–57959. [Google Scholar] [CrossRef] [PubMed]
  78. Rout, G.R.; Sahoo, S. Role of iron in plant growth and metabolism. Rev. Agric. Sci. 2015, 3, 1–24. [Google Scholar] [CrossRef]
  79. Fiorentino, N.; Sánchez-Monedero, M.A.; Lehmann, J.; Enders, A.; Fagnano, M.; Cayuela, M.L. Interactive priming of soil N transformations from combining biochar and urea inputs: A 15N isotope tracer study. Soil Biol. Biochem. 2019, 131, 166–175. [Google Scholar] [CrossRef]
  80. Sharifi, M.; Hajiaghaei-Kamrani, M. Biochar–compost mixture and cover crop effects on soil carbon and nitrogen dynamics, yield, and fruit quality in an irrigated vineyard. Can. J. Soil Sci. 2022, 103, 200–212. [Google Scholar] [CrossRef]
  81. Agegnehu, G.; Jemal, K.; Abebe, A.; Lulie, B. Plant growth and oil yield response of lemon grass (Cymbopogon citratus L.) to biochar application. Ethiop. J. Agric. Sci. 2019, 29, 1–12. [Google Scholar]
  82. Pontin, M.A.; Piccoli, P.N.; Francisco, R.; Bottini, R.; Martinez-Zapater, J.M.; Lijavetzky, D. Transcriptome changes in grapevine (Vitis vinifera L.) cv. Malbec leaves induced by ultraviolet-B radiation. BMC Plant Biol. 2010, 10, 224. [Google Scholar] [CrossRef]
  83. Schmidt, H.P.; Kammann, C.; Niggli, C.; Evangelou, M.W.; Mackie, K.A.; Abiven, S. Biochar and biochar-compost as soil amendments to a vineyard soil: Influences on plant growth, nutrient uptake, plant health and grape quality. Agric. Ecosyst. Environ. 2014, 191, 117–123. [Google Scholar] [CrossRef]
  84. Rouxinol, M.I.; Martins, M.R.; Barroso, J.M.; Rato, A.E. Wine grapes ripening: A review on climate effect and analytical approach to increase wine quality. Appl. Biosci. 2023, 2, 347–372. [Google Scholar] [CrossRef]
  85. Alem, H.; Rigou, P.; Schneider, R.; Ojeda, H.; Torregrosa, L. Impact of agronomic practices on grape aroma composition: A review. J. Sci. Food Agric. 2019, 99, 975–985. [Google Scholar] [CrossRef] [PubMed]
  86. González-Barreiro, C.; Rial-Otero, R.; Cancho-Grande, B.; Simal-Gándara, J. Wine aroma compounds in grapes: A critical review. Crit. Rev. Food Sci. Nutr. 2015, 55, 202–218. [Google Scholar] [CrossRef]
  87. Herderich, M.J.; Smith, P.A. Analysis of grape and wine tannins: Methods, applications and challenges. Aust. J. Grape Wine Res. 2005, 11, 205–214. [Google Scholar] [CrossRef]
  88. Frąc, M.; Sas-Paszt, L.; Sitarek, M. Influence of biochar on the vegetative and generative growth of ‘Meredith’ peach trees. Acta Sci. Pol. Hortorum Cultus 2022, 21, 61–69. [Google Scholar] [CrossRef]
  89. Van Leeuwen, C.; Roby, J.P.; De Rességuier, L. Soil-related terroir factors: A review. OENO One 2018, 52, 173–188. [Google Scholar] [CrossRef]
  90. Bely, M.; Sablayrolles, J.M.; Barre, P. Automatic detection of assimilable nitrogen deficiencies during alcoholic fermentation in oenological conditions. J. Ferment. Bioeng. 1990, 70, 246–252. [Google Scholar] [CrossRef]
  91. Kontoudakis, N.; Esteruelas, M.; Fort, F.; Canals, J.M.; De Freitas, V.; Zamora, F. Influence of the heterogeneity of grape phenolic maturity on wine composition and quality. Food Chem. 2011, 124, 767–774. [Google Scholar] [CrossRef]
  92. Gutiérrez-Escobar, R.; Aliaño-González, M.J.; Cantos-Villar, E. Wine polyphenol content and its influence on wine quality and properties: A review. Molecules 2021, 26, 718. [Google Scholar] [CrossRef]
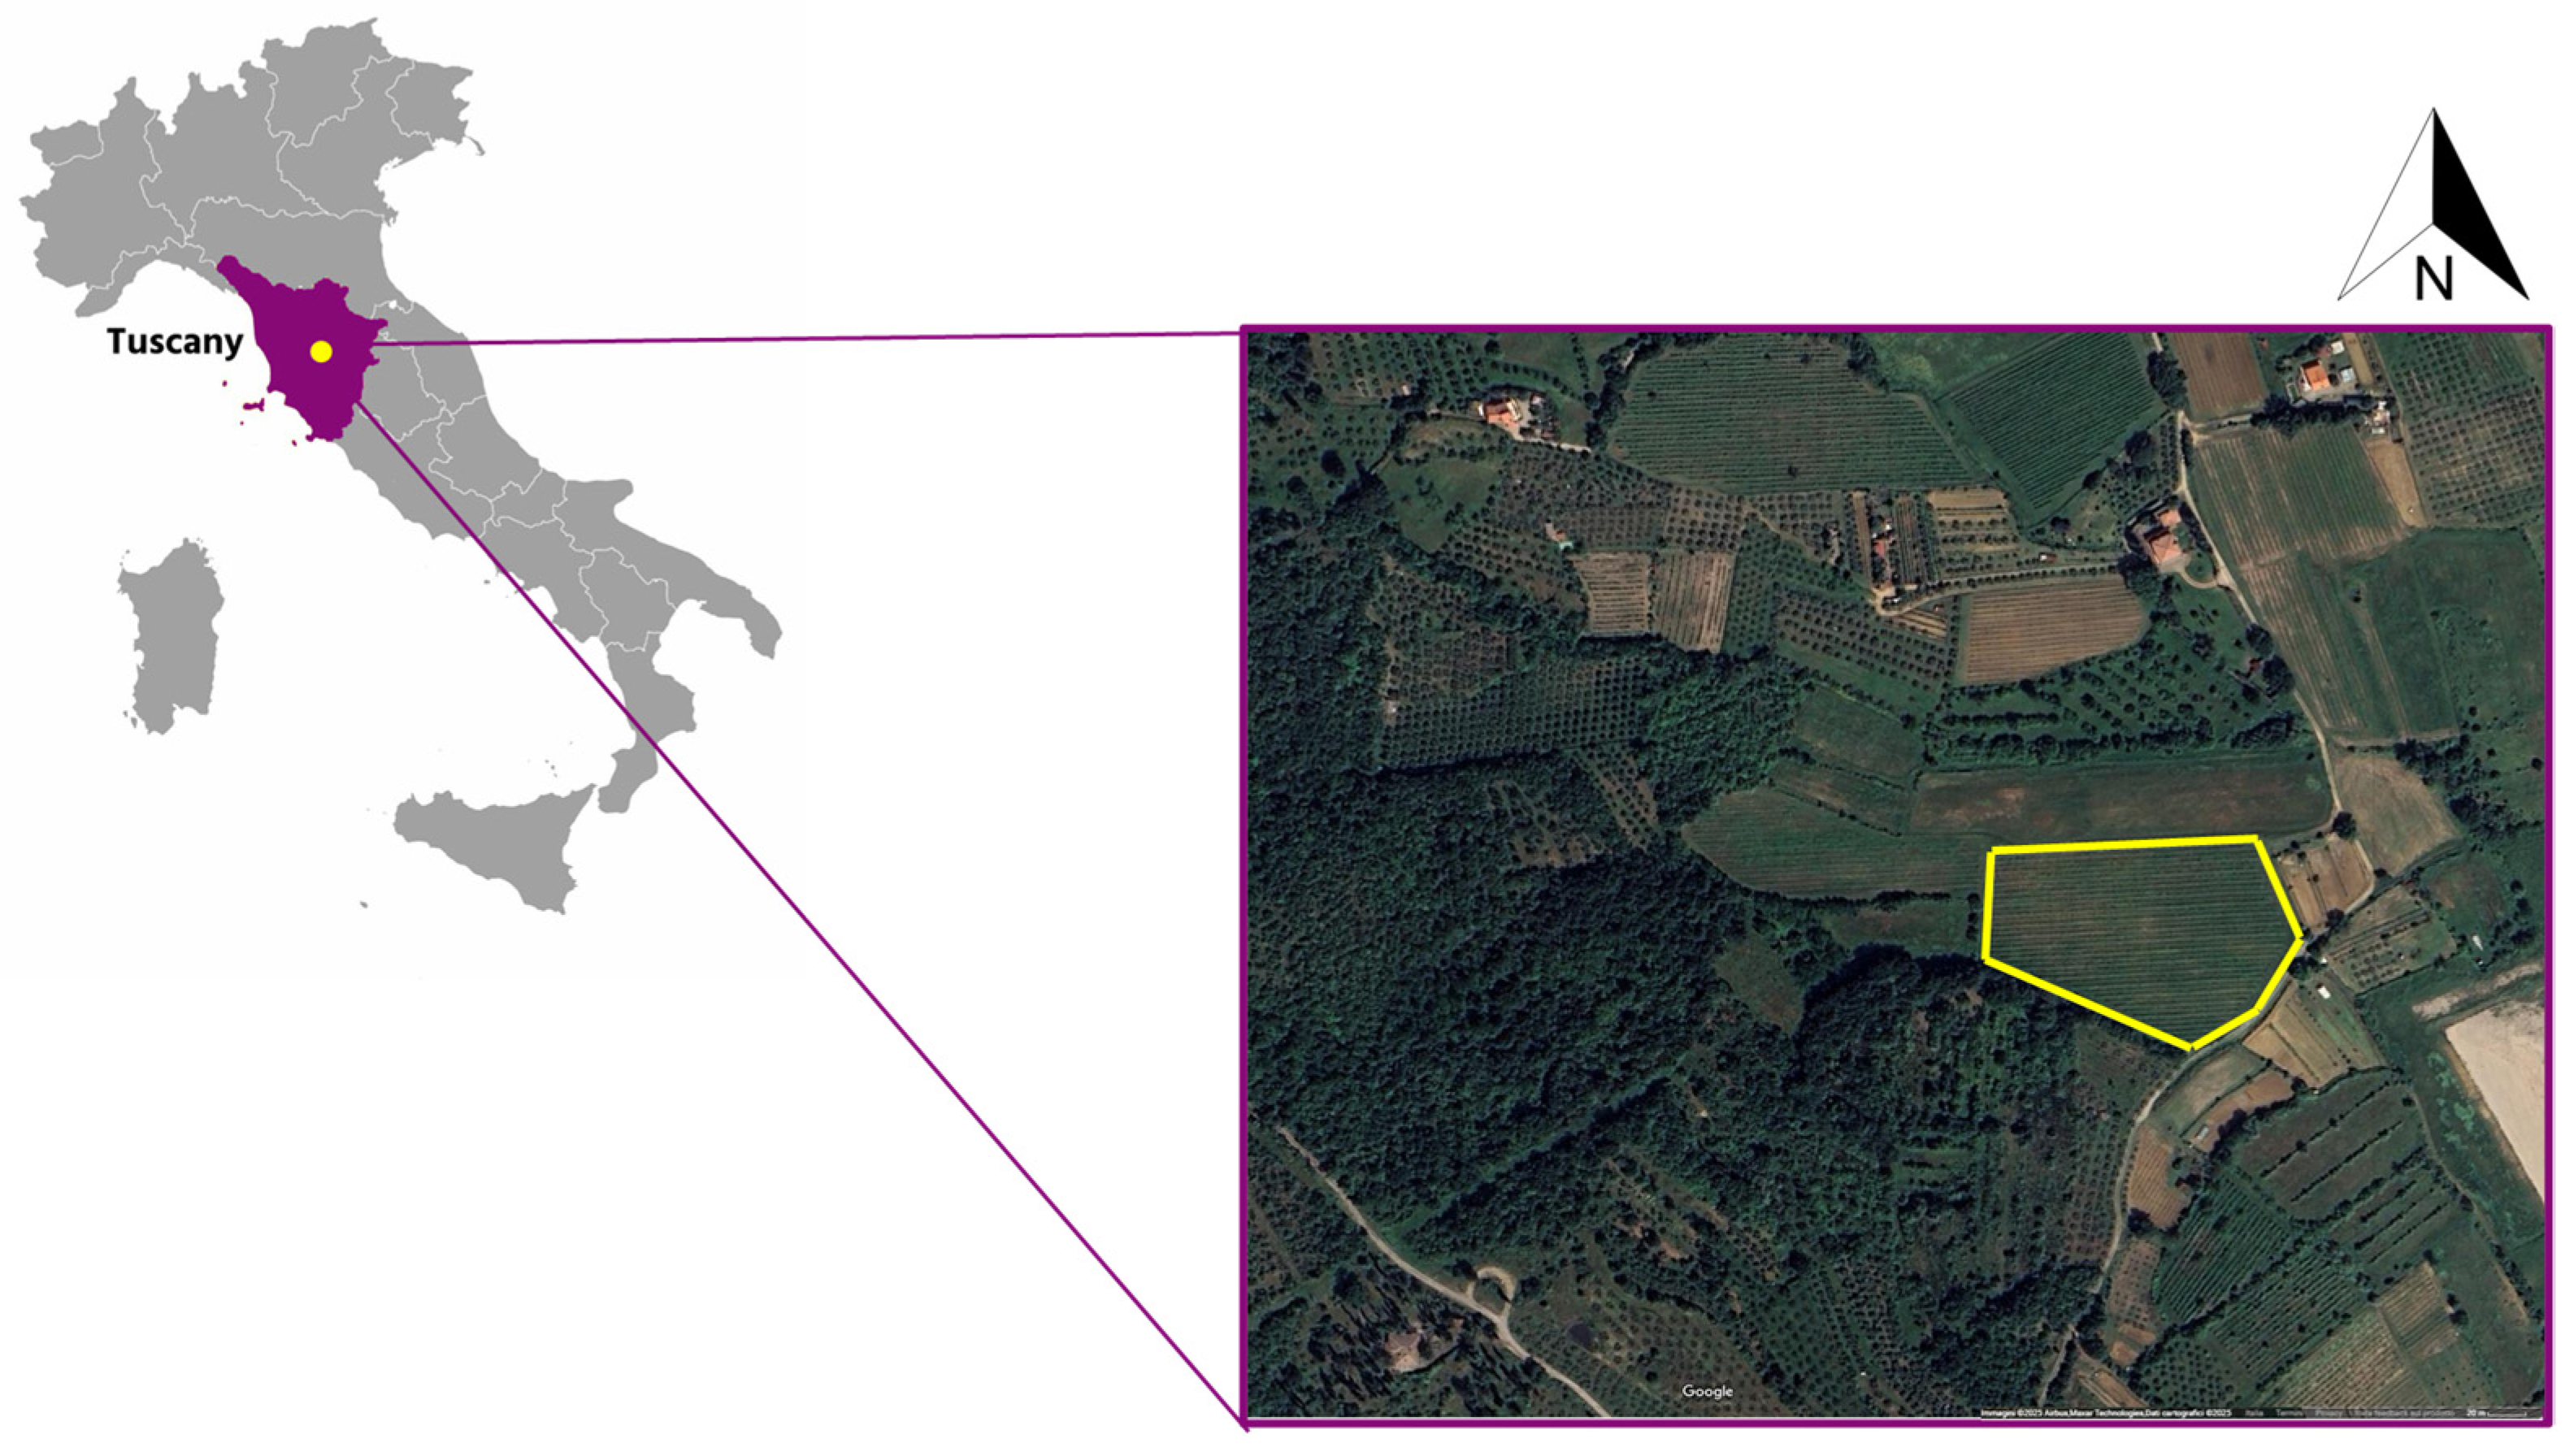
Figure 1. Location of the field experiment conducted between 2022 and 2024 in a vineyard situated in Tuscany, Italy (43.6845° N, 11.1846° E), marked in yellow.
Agronomy 15 02124 g001
Figure 2. Total polyphenol content (A), total flavonoid content (B), tannin content (C), total antioxidant capacity (DPPH) (D), vitamin C content (E), total soluble protein content (F), and starch content (G) in grapevine berry skins expressed as means ± error standard (n = 5). NB = samples derived from plants grown without biochar addition; SB = samples derived from plants grown with the addition of solid biochar; LB = samples derived from plants grown with liquid biochar. Different letters indicate statistically significant differences between the treatments.
Agronomy 15 02124 g002
Figure 3. Sucrose, glucose, fructose, and pectin content in grapevine berry skins expressed as means ± error standard (n = 5). NB = samples derived from plants grown without biochar addition; SB = samples derived from plants grown with the addition of solid biochar; LB = samples derived from plants grown with liquid biochar. Different letters indicate statistically significant differences between the treatments.
Agronomy 15 02124 g003
Figure 4. Tannin content (A), total flavonoid content (B), total polyphenols content (C), sucrose content (D), glucose content (E), fructose content (F) in grapevine must expressed as means ± error standard (n = 5). NB = samples derived from plants grown without biochar addition; SB = samples derived from plants grown with the addition of solid biochar; LB = samples derived from plants grown with liquid biochar. Different letters indicate statistically significant differences between the treatments.
Agronomy 15 02124 g004
Figure 5. Reducing sugars (A), Brix (°) (B), pH (C), total acidity (D), and malic acid (E) in grapevine must expressed as means ± error standard (n = 5). NB = samples derived from plants grown without biochar addition; SB = samples derived from plants grown with the addition of solid biochar; LB = samples derived from plants grown with liquid biochar. Different letters indicate statistically significant differences between the treatments.
Agronomy 15 02124 g005
Table 1. Contents of biochemical parameters in grapevine leaves, expressed as means ± error standard (n = 5). NB = samples derived from plants grown without biochar addition; SB = samples derived from plants grown with the addition of solid biochar; LB = samples derived from plants grown with liquid biochar. Different letters indicate statistically significant differences between the treatments.
NBSBLB
Chla (mg/g)0.56 ± 0.03 a0.58 ± 0.02 a0.42 ± 0.02 b
Chlb (mg/g)1.20 ± 0.04 a1.21 ± 0.03 a0.91 ± 0.04 b
Carotenoids (mg/g)0.19 ± 0.02 a0.15 ± 0.02 b0.15 ± 0.01 b
MDA (µg/g)4.61 ± 0.15 a3.87 ± 0.37 b4.48 ± 0.39 a
Proline (µmol/g)19.5 ± 1.0 a20.1 ± 0.3 a18.5 ± 1.3 a
Total soluble proteins(mg/g)3.94 ± 0.25 c6.52 ± 0.73 a5.50 ± 0.35 b
TPC (mg/g)1.57 ± 0.23 b2.47 ± 0.49 a1.40 ± 0.37 b
TFC (mg/g)604 ± 34 b610 ± 13 b682 ± 26 a
Tannins (mg/g)522 ± 5521 ± 6509 ± 6
P (mg/kg)1582 ± 75 a1622 ± 137 a1181 ± 47 b
S (mg/kg)1682 ± 79 a1738 ± 152 a1352 ± 52 b
K (mg/kg)6825 ± 260 a5988 ± 503 b6612 ± 271 a
Ca (mg/kg)18,293 ± 863 a15,396 ± 1353 b14,400 ± 575 b
Mn (mg/kg)63.6 ± 5.0 a51.0 ± 9.0 b57.6 ± 5.1 b
Fe (mg/kg)152 ± 6 a150 ± 15 a124 ± 5 b
Cu (mg/kg)93.1 ± 2.7 a41.0 ± 2.8 c65.0 ± 2.1 b
Zn (mg/kg)21.3 ± 0.6 a17.6 ± 0.8 b16.3 ± 0.6 b
Chlorophyll a (Chla), chlorophyll b (Chlb), carotenoids, malondialdehyde (MDA), proline, total soluble proteins, total phenols (TPC), total flavonoids (TFC), tannins, phosphorus (P), sulfur (S), potassium (K), calcium (Ca), manganese (Mn), iron (Fe), copper (Cu), and zinc (Zn).
Table 2. Mineral content (mg/kg) in grapevine berry skins expressed as means ± error standard (n = 5). NB = samples derived from plants grown without biochar addition; SB = samples derived from plants grown with the addition of solid biochar; LB = samples derived from plants grown with liquid biochar. Different letters indicate statistically significant differences between the treatments.
NBSBLB
P653 ± 53 ab703 ± 30 a575 ± 16 b
S241 ± 20220 ± 7211 ± 8
K5496 ± 255 a4844 ± 208 b4064 ± 89 c
Ca395 ± 26425 ± 37406 ± 13
Mn19.9 ± 4.4 a10.2 ± 1.2 b9.0 ± 1.5 b
Fe11.3 ± 0.812.0 ± 1.110.2 ± 0.9
Cu9.2 ± 0.4 a4.2 ± 0.3 b3.8 ± 0.1 b
Zn26 ± 1.6 a3.6 ± 0.2 b4.5 ± 0.2 b
Phosphorus (P), sulfur (S), potassium (K), calcium (Ca), manganese (Mn), iron (Fe), copper (Cu), and zinc (Zn) content.
Disclaimer/Publisher’s Note: The statements, opinions and data contained in all publications are solely those of the individual author(s) and contributor(s) and not of MDPI and/or the editor(s). MDPI and/or the editor(s) disclaim responsibility for any injury to people or property resulting from any ideas, methods, instructions or products referred to in the content.