Abstract
Dry topsoil restricts root growth and nutrient uptake in arid regions, thereby significantly reducing crop yield. Hydraulic lift occurs due to the dry topsoil and wet deep soil. This study investigates the effects of topsoil drought intensity (three field capacities in topsoil: 60–70% (W1), 50–60% (W2), and 40–50% (W3)) and nitrogen application rate (N1: 120, N2: 240, and N3: 360 kg ha−1) on cotton quality and the distribution of nitrogen in soil and plant under hydraulic lift using a root-splitting device. The upper pot of the root-splitting device was 22 cm high, with a 26 cm top diameter and a 23 cm bottom diameter; the lower pot of the root-splitting device was 45 cm high, with a 48 cm top diameter and a 36 cm bottom diameter. Topsoil moisture was maintained at W1 without nitrogen application under the control treatment (CK). The W2 and W3 treatments (representing different topsoil drought intensities) were designed to compare the interactive effects of water and nitrogen fertiliser on nitrogen distribution and cotton quality with the CK treatment. Results indicate that the concentrations of nitrate nitrogen (NO3−-N) in the 10–20 cm soil were generally higher than those in the 0–10 cm soil. The topsoil drought intensity and nitrogen application rate had significant impacts on nitrogen concentrations in cotton organs. The W2 treatment produced the maximum nitrogen concentration, except for the root nitrogen concentration in 2021. The nitrogen concentration in the roots and stems peaked at 240 kg ha−1 of nitrogen application rate. The topsoil drought intensity and nitrogen application rate had considerable influences on the cotton dry matter. The nitrogen application rate had a significant impact on the following indexes: internal nitrogen-fertiliser use efficiency (INUE), physiological nitrogen-fertiliser use efficiency (PNUE), and nitrogen-fertiliser recovery efficiency (NRE), except for PNUE in 2020. The INUE of other treatments decreased by 13.82–43.44% compared with CK treatment. In 2021, fibre length and elongation were significantly impacted by the topsoil drought intensity, nitrogen application rates, and their interactions. The nitrogen application rate’s effects on the uniformity index were significant in 2020 and 2021. The hydraulic lift magnitude, NRE, and NO3−-N in the 0–10 cm soil were significantly correlated with each other. There were correlations among cotton quality indexes: fibre length and strength, uniformity index and micronaire, and micronaire and elongation. These findings provide a reference for future research on the mechanism by which hydraulic lift participates in nitrogen distribution in soil and crops and also offer a new direction to utilize deep water to improve the utilization rate of water resources.
1. Introduction
Cotton is essential to worldwide production owing to its natural fibre [1,2], cultivated by 88 nations with 2.48 × 10⁷ t ginned cotton lint in 2022 [3]. Cotton, as one of the most economic and agricultural crops in China, is grown with an area of 2788 thousand ha and has a 561.8 M tonne yield in 2023 [4]. Xinjiang, as the main cotton production area in China, produces ~90.1% (yield percentage) of China’s cotton [4]. Southern Xinjiang, in Northwest China, is arid, with low precipitation and high evaporation [5]. Moreover, agricultural water accounts for a relatively high proportion, which exacerbates water resource scarcity in this area. Increasing air temperature caused by climate change dries the land, threatening global crop production [6]. Therefore, increasing the water use efficiency in this area is crucial.
Owing to the high land surface temperature, low rainfall, and high evaporation, the topsoil is dry whereas the deep soil is wet in the oasis of Xinjiang. In this situation, a phenomenon termed ‘hydraulic lift’ occurs. Hydraulic lift can redistribute water from wet deep soil to drier topsoil [7]. This phenomenon typically occurs at night, as transpiration stops when the stomata close [8]. The water potential of the plant increases to balance with the higher water potential in deep soil layers, and water will then move from plant roots into the shallow soil regions where the water potential is comparatively lower [9,10,11]. Hydraulic lift increases the moisture content in drier soils to render the soil water status more homogeneous in the root zone [12,13]. Hydraulic lift can alleviate the water deficits of plants and neighbouring plants, and more importantly, it induces ecological effects. Moreover, hydraulic lift can extend the survival time of fine roots in dry topsoil [14], promote microbial activity [15], and facilitate the nutrient cycle [16]. One of the ecosystem services that agricultural soils provide is the nutrient cycle, such as nitrogen and phosphorus [17], which is essential for plant growth.
Nutrient absorption forms the basis for the accumulation and storage of dry matter, which is necessary for yield formation [18]. In addition to being a crucial component of chloroplasts, nucleic acids, proteins, and several secondary metabolites, nitrogen is an important mineral nutrient element that influences plant growth and development. Water–nutrient deficit can negatively affect photosynthetic pigments and photosynthesis [19]. Reduced nitrogen uptake can be attributed to water or detrimental impacts of nitrogen stress on the physiological traits of roots (nitrate reductase, root vigour, and hormonal alterations) [20,21,22]. Alternatively, over-dose nitrogen fertilisation causes serious negative effects, such as soil degradation, low nitrogen use efficiency, greenhouse gas emissions, and groundwater pollution risks [23,24,25,26]. Moreover, cotton requires more nitrogen than other nutrients [27]. Integrated nutrient and water management approaches have been shown to significantly enhance nitrogen and water use efficiency under varying irrigation regimes [28]. Thus, properly managing nitrogen fertiliser in arid regions is crucial.
Nitrogen plays a critical role associated with yield in the plant metabolic system. Soil nitrogen is usually found as nitrate and ammonium nitrogen (NO3−-N and NH4+-N) [29]. Plants can directly absorb NH4+-N and convert NH4+-N into organic substances such as proteins for their growth and life-sustaining activities. In addition, NH4+-N can be converted into NO3−-N through nitrification, further participating in the nitrogen cycle. Meanwhile, NO3−-N is involved in plant growth and metabolism. NH4+-N and NO3−-N have important effects on soil fertility and plant growth. Various studies have analysed nitrogen use and distribution under different water pressures and nitrogen rates. However, hydraulic lift can influence nitrogen cycling. A previous study’s result indicated that hydraulic lift positively affected plant nutrient dynamics and turnover [30]. Hydraulic lift maintains root behaviour and growth in dry topsoil [31,32], which is good for nutrient capture [33,34]. Hydraulic redistribution, including hydraulic lift, has been proven to increase the absorption of some nutrients, like N [30,35] and PO43− [36]. The process of hydraulic lift can transport soluble ions such as nitrate and dissolved organic carbon through water movement, increasing the uptake of nutrients [37]. Decomposition and nitrogen cycling in surface soils were also enhanced by hydraulic lift of sagebrush [38].
Previous studies on cotton quality and nitrogen distribution primarily focused on water–nitrogen synergy; however, studies on the regulation of nitrogen in cotton quality and nitrogen distribution under a topsoil drought condition wherein hydraulic lift usually occurs remain scarce. Moreover, though there are studies about the role of hydraulic lift in the nitrogen cycle, those on the relationship between hydraulic lift and nitrogen use efficiency in cotton are few. The hypothesis of this study was that hydraulic lift participates in the nitrogen cycle and is correlated with nitrogen distribution and nitrogen use efficiency. The nitrogen distribution in soil and plant subsequently affects the cotton quality. Therefore, the targets of this study are to determine (1) the effects of topsoil drought intensity and nitrogen rates on nitrogen distribution in soil and plants and the cotton quality under hydraulic lift and (2) the relationship between soil nitrogen distribution and plant nitrogen distribution.
2. Materials and Methods
2.1. Experimental Site Details
The experiment was conducted in a greenhouse for 2 successive years (2020–2021) at the Jiangsu Irrigation Experimental Centre. The experimental site is situated at 118°50′ E and 31°57′ N, characterized by a subtropical monsoon climate. The average annual temperature is 17.5 °C, with an annual average of 2017 sunshine hours, and an average air relative humidity of 75%. The annual mean precipitation was 1025 mm, and the average annual water surface evaporation was 950.1 mm. The daily maximum and minimum temperatures and total solar radiation in 2020 and 2021 are shown in Figure 1.

Figure 1.
Daily maximum and minimum temperature and total solar radiation in 2020 (a) and 2021 (b).
The surface layer of the experimental site (0–30 cm) is the test soil, which was then removed, allowed to air dry, and sieved using a 2 mm mesh screen for filling. The physical and chemical characteristics of the soil are described in Table 1.

Table 1.
The physical and chemical characteristics of the soil.
2.2. Experimental Design
2.2.1. Root-Splitting Device
A root-splitting device with upper and lower pots was used to enable easy and precise management of the water conditions (Figure 2). The upper pot was 22 cm high, with a 26 cm top diameter and a 23 cm bottom diameter; the lower pot was 45 cm high, with a 48 cm top diameter and a 36 cm bottom diameter. Direct surface irrigation was applied to the soil in the upper pot, whereas the soil in the lower pot was irrigated using two mesh hollow-out steel pipes with a length of 35 cm and an inner diameter of 30 mm. The outer side of the pipe was wrapped with permeable gauze to prevent soil particles from blocking the mesh. Circular holes of 10 mm in diameter were evenly drilled at the bottom of the upper pot to facilitate the smooth penetration of the cotton roots into the soil of the lower pot. A 1.5 cm thick gravel layer was filled at the bottom of the upper pot to prevent capillary water transfer from the lower to the upper pot. The upper and lower pots were filled with sieved soil, with depths of 20 and 40 cm, respectively, and a bulk density of 1.30 g cm−3. White polyethylene plastic film was used to cover the bare soil surface of the lower pots and the watering tube to prevent water evaporation during non-irrigation periods. The root-splitting device was used to observe the hydraulic lift of tomato in our previous study, and so it is replicated here [11]. The bottom of the upper pot may restrict the natural growth of the root system to some extent. To reduce the edge effects on the root growth, some holes were arranged at the bottom of the upper pot to meet the needs of root growth as much as possible, as well as to avoid the holes being too large, which would cause gravel to enter the lower pot and fail to play the role of blocking capillary water. Future research could explore further improvements to this device.
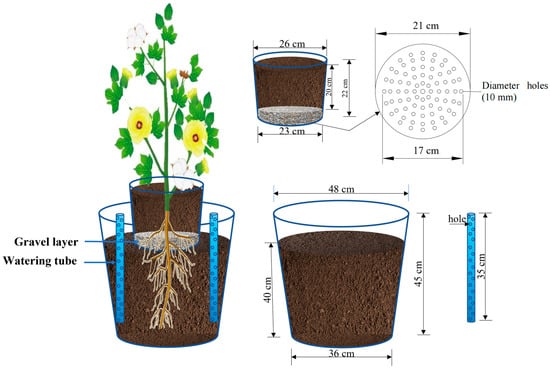
Figure 2.
Schematic diagram of root-splitting device.
2.2.2. Experimental Treatments
Two factors of soil moisture and nitrogen application rates were determined. The details of the treatments involved in the study are shown in Table 2. Each treatment was replicated three times. The arrangement of the 30 root-splitting devices was completely random. Urea (CH4N2O) was applied as the nitrogen fertiliser to the soil in the upper pot before transplanting. Without fertiliser application, the soil moisture content in the lower pot was maintained between 70% and 80% of the field capacity through the growth stages. The soil moisture content in the upper pot was maintained between 70% and 80% of the field capacity to keep the seedlings alive during the seedling stage of cotton, and then all plants were treated according to the set soil moisture conditions at the end of the seedling stage. In order to maintain the soil moisture at the set conditions, the cotton was planted under a rain shelter to prevent rain from directly entering the soil in the root-splitting device. Hydraulic lift was proven to occur depending on the gradients in soil water potential [35,39], so we set three different soil water treatments to simulate the upper-layer-dry and lower-layer-wet conditions in field. Soil water content in the root-splitting device was measured every 2 or 3 days using a TDR 350 soil moisture metre. If the soil moisture content was less than the set lower limit, the required irrigation amount was calculated and irrigated.

Table 2.
Experimental treatment design.
2.2.3. Plant Type and Agronomic Practices
Cotton (Gossypium hirsutum L. cv. Zhongmian 117) was seeded in the nutrition bowl on 10 May 2020 and 18 April 2021. When the cotton established four true leaves, healthy seedlings exhibiting uniform growth were transplanted into root-splitting devices on 20 June 2020 and 29 May 2021. Superphosphate (Ca(H2PO4)2) was used for phosphate fertiliser, and 180 kg ha−1 was applied for P2O5. Potassium sulphate (K2SO4) was used for potassium fertiliser, and 180 kg ha−1 was applied for K2O. Phosphate and potassium fertilisers, as base fertilisers, were evenly distributed into the soil in the upper pot before transplantation. The growth period of cotton was separated into four stages: seedling, bud, flowering and boll forming, and boll opening, with the start date of each stage presented in Table 3. The same was true for other agronomic techniques that depended on local growing knowledge, such as weeding and deworming. No topping was performed in the 2-year experiment.

Table 3.
The specific dates of each stage.
2.3. Measurements
- (1)
- Soil water content
The soil water content in the root-splitting device was measured every 2 or 3 days using a TDR 350 soil moisture metre (Spectrum Technologies, Inc., Aurora, IL, USA), the calibration of which was completed.
- (2)
- The magnitude of hydraulic lift
To observe the hydraulic lift magnitude, soil water content was recorded at 20:00 and 06:00 the next day using a TDR 300 soil moisture metre every 5 days. The average value of the soil water content was measured at multiple points to reduce errors. Plant transpiration and soil evaporation at night were small and can be ignored. The hydraulic lift magnitude at night was determined according to the following formula:
where HL is the cotton hydraulic lift magnitude (mm), V is the soil volume in the upper pot (cm3), S is the area of the soil in the upper pot (cm2), θAM is the soil volume moisture content at 06:00 the following day (cm3 cm−3), and θPM is the soil volume moisture content at 20:00 the preceding day (cm3 cm−3).
- (3)
- NH4+-N and NO3−-N in the soil
Soil drilling was used to take the 0–10 and 10–20 cm soil samples from the upper pot every 15 days.
Fresh soil samples were put into a 150 mL conical bottle with a weight of 10 g and extracted with 50 mL of 1 mol L−1 potassium chloride solution. The extracted soil sample was shaken for 1 h and then stood for 4 h, and the supernatant was taken for filtration. The contents of NO3−-N and NH4+-N in the soil were measured using a SmartChem200 Automatic Chemical Analyzer (Alliance, Paris, France, 2010).
- (4)
- Dry matter
After harvesting, the cotton plants of each treatment were separated into root, stem, leaf, and reproductive organs. After 0.5 h of drying at 105 °C, the plant samples were placed in an oven and dried at 75 °C until their weights were uniform [40]. The weight of each part was measured with an electronic balance with an accuracy of 0.001 g.
- (5)
- Nitrogen in the plant
Each part of the cotton that had been measured for the dry matter mass was crushed using a small grinder and sieved using a 0.5 mm sieve, and 0.2 g of the sample was weighed and placed in a digestion tube. After a concentrated H2SO4–H2O2 digestion, a SmartChem 200 Automatic Chemical Analyzer (Alliance, France, 2010) was used to measure the total nitrogen content. The amount of plant nitrogen uptake was calculated as follows, according to the equation in a previous study [40]:
- (6)
- Nitrogen use efficiency (NUE)
- (7)
- Total evapotranspiration (ET)
Since the experiment was conducted in the root-splitting device, there was no effective precipitation, upward capillary flow into the root zone, run off, or downward drainage. The ET of the cotton plants was calculated according to the following equation, which was simplified [42]:
where I is the cumulative irrigation depth (mm) and ΔW is the variation of soil water in the root zone between two soil water measurements (mm).
- (8)
- Water use efficiency (WUE)
2.4. Statistical Analysis
SPSS version 24.0 (IBM SPSS Statistics, Chicago, IL, USA) was the software used to analyse the data. Origin 9.1 (OriginLab Corporation, Northampton, MA, USA) was used to draw the figures. To evaluate the significance between the treatments, a one-way analysis of variance and the least significant difference test were used. A multiway analysis of variance was conducted to determine whether the treatment factors and their interactions had significant effects at p < 0.05. The data are displayed as mean ± standard error (n = 3).
3. Results and Discussion
3.1. Soil Concentrations of NO3−-N and NH4+-N
Drought intensity, nitrogen application rates, and their interaction significantly affected soil NO3−-N and NH4+-N concentrations, except that NH4+-N was not significantly affected by drought intensity in 2021 (Table 4). The result was supported by a previous study in which nitrogen fertilization, irrigation regime, and their interactive effects on the accumulation of nitrate were remarkable [43]. Soil NO3−-N and NH4+-N concentrations fluctuated and exhibited a decreasing trend over time in the topsoil under all treatments (Figure 3, Figure 4, Figure 5 and Figure 6) because the soil NO3−-N and NH4+-N concentrations were gradually diluted with time [44]. In 2020 and 2021, the soil NO3−-N and NH4+-N concentrations ranged from 0.73 to 27.79 mg kg−1 and 0.75 to 8.89 mg- kg−1, respectively. Under different drought intensities, the soil NO3−-N and NH4+-N concentrations showed a similar response to nitrogen application rate. The high nitrogen application rate caused overall higher soil NO3−-N and NH4+-N concentrations. However, the differences were smaller than expected. This can be attributed to increased nitrogen loss via NH3 volatilisation and N2O emission with higher nitrogen application rates [45,46]. NO3−-N concentrations in the 10–20 cm soil were overall higher than those in the 0–10 cm soil. Generally, soil NO3−-N concentrations were high in the weak drought treatments during the pre-measurement time. As the cotton growth period progressed, soil NO3−-N concentrations in the heavy drought treatment were high instead. The W2 treatment generally showed the highest soil NH4+-N concentrations instead of W3 in 2020. Furthermore, the soil NH4+-N concentrations in 2020 were higher than those in 2021. Low temperature may be the reason for the difference [47]. Lower temperature decreased the ammonia volatilization, leading to higher soil NH4+-N concentrations in 2020.

Table 4.
The average values of soil ammonia nitrogen and nitrate nitrogen throughout the entire growth period.
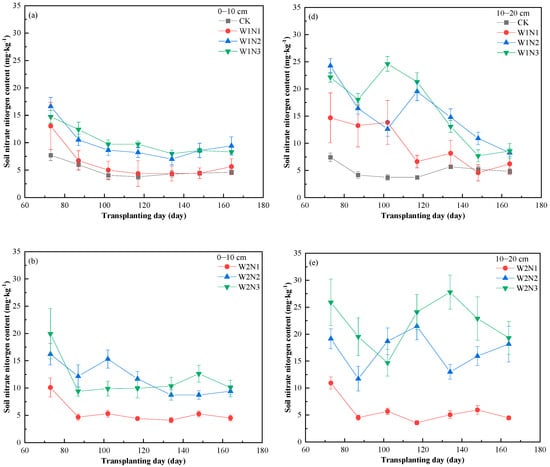
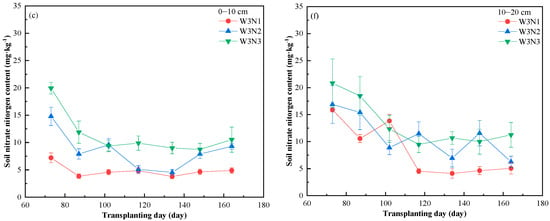
Figure 3.
Soil concentrations of nitrate nitrogen (NO3−-N) as affected by topsoil water condition and nitrogen application rate in 2020. (a) NO3−-N concentrations in the 0–10 cm soil under CK, W1N1, W1N2, and W1N3 treatments; (b) NO3−-N concentrations in the 0–10 cm soil under W2N1, W2N2, and W2N3 treatments; (c) NO3−-N concentrations in the 0–10 cm soil under W3N1, W3N2, and W3N3 treatments; (d) NO3−-N concentrations in the 10–20 cm soil under CK, W1N1, W1N2, and W1N3 treatments; (e) NO3−-N concentrations in the 10–20 soil cm under W2N1, W2N2, and W2N3 treatments; (f) NO3−-N concentrations in the 10–20 soil cm under W3N1, W3N2, and W3N3 treatments. Note: The error bars represent standard error of means from the triplicate readings.
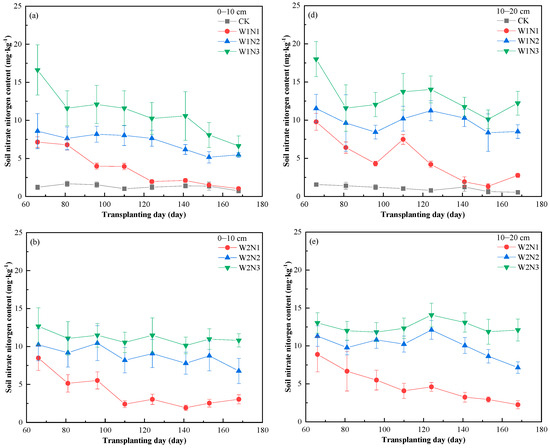
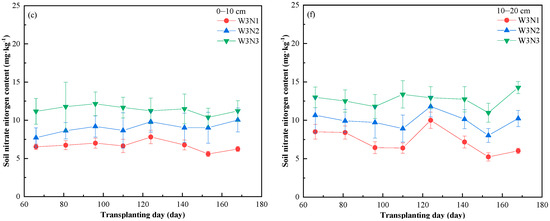
Figure 4.
Soil concentrations of nitrate nitrogen (NO3−-N) as affected by topsoil water condition and nitrogen application rate in 2021. (a) NO3−-N concentrations in the 0–10 cm soil under CK, W1N1, W1N2, and W1N3 treatments; (b) NO3−-N concentrations in the 0–10 cm soil under W2N1, W2N2, and W2N3 treatments; (c) NO3−-N concentrations in the 0–10 cm soil under W3N1, W3N2, and W3N3 treatments; (d) NO3−-N concentrations in the 10–20 cm soil under CK, W1N1, W1N2, and W1N3 treatments; (e) NO3−-N concentrations in the 10–20 cm soil under W2N1, W2N2, and W2N3 treatments; (f) NO3−-N concentrations in the 10–20 cm soil under W3N1, W3N2, and W3N3 treatments. Note: The error bars represent standard error of means from the triplicate readings.
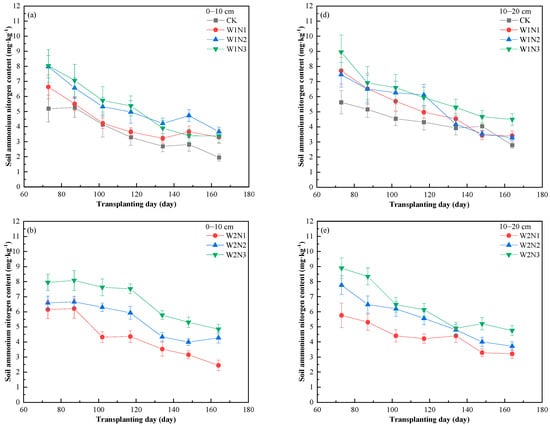
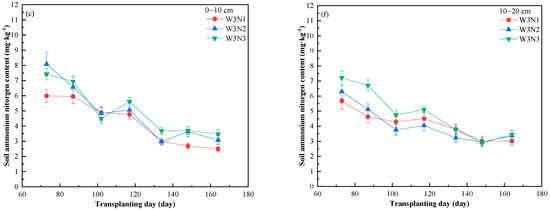
Figure 5.
Soil concentrations of ammonium nitrogen (NH4+-N) as affected by topsoil drought intensity and nitrogen application rate in 2020. (a) NH4+-N concentrations in the 0–10 cm soil under CK, W1N1, W1N2, and W1N3 treatments; (b) NH4+-N concentrations in the 0–10 cm soil under W2N1, W2N2, and W2N3 treatments; (c) NH4+-N concentrations in the 0–10 cm soil under W3N1, W3N2, and W3N3 treatments; (d) NH4+-N concentrations in the 10–20 cm soil under CK, W1N1, W1N2, and W1N3 treatments; (e) NH4+-N concentrations in the 10–20 cm soil under W2N1, W2N2, and W2N3 treatments; (f) NH4+-N concentrations in the 10–20 cm soil under W3N1, W3N2, and W3N3 treatments. Note: The error bars represent standard error of means from the triplicate readings.
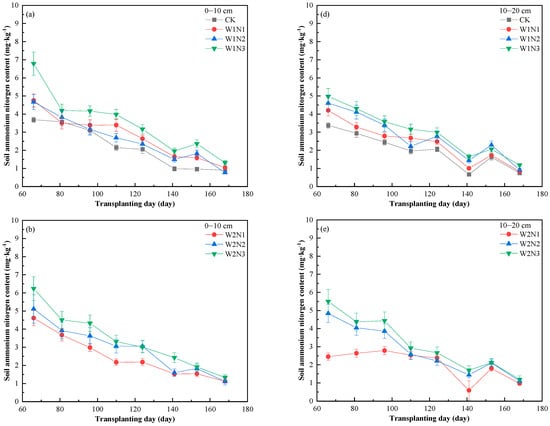
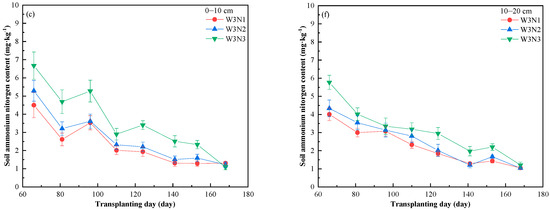
Figure 6.
Soil concentrations of ammonium nitrogen (NH4+-N) as affected by topsoil drought intensity and nitrogen application rate in 2021. (a) NH4+-N concentrations in the 0–10 cm soil under CK, W1N1, W1N2, and W1N3 treatments; (b) NH4+-N concentrations in the 0–10 cm soil under W2N1, W2N2, and W2N3 treatments; (c) NH4+-N concentrations in the 0–10 cm soil under W3N1, W3N2, and W3N3 treatments; (d) NH4+-N concentrations in the 10–20 cm soil under CK, W1N1, W1N2, and W1N3 treatments; (e) NH4+-N concentrations in the 10–20 cm soil under W2N1, W2N2, and W2N3 treatments; (f) NH4+-N concentrations in the 10–20 cm soil under W3N1, W3N2, and W3N3 treatments. Note: The error bars represent standard error of means from the triplicate readings.
3.2. Nitrogen Concentration in the Cotton Organs, Cotton Dry Matter and Nitrogen Accumulation
There were significant differences in the nitrogen concentration in the cotton organs under different topsoil intensities and nitrogen application rates (Figure 7). The nitrogen concentration of cotton organs under the W2 treatment reached the maximum, except for the root nitrogen concentration in 2021 (Figure 7a,b). This indicates that the appropriate water deficit was beneficial for nitrogen accumulation in cotton plants. Drought has been shown to reduce the rate of xylem NO3− translocation by 40–80%, thereby decreasing nitrogen accumulation in the shoots [48,49]. Further studies showed that inadequate root adenosine triphosphate accumulation owing to drought was detrimental to the root uptake of NO3−, which transferred to the shoot [50]. That is the reason why nitrogen in the root was lower than that in the leaf and stem under W2 and W3 treatments. Moreover, the lower uptake of NO3− caused by drought led to less NO3− translocation to the shoot under the W3 condition compared with the W2 condition. That is why nitrogen concentrations in the cotton organs under heavy drought intensity (W3) were lower than those under mild drought intensity (W2). However, the nitrogen concentrations in the cotton organs under sufficient irrigation (W1) were also lower than those under mild drought intensity (W2), which was not consistent with what we expected. This difference can be attributed to the fact that the higher topsoil water condition obtained higher nitrogen accumulation; however, nitrogen concentrations in cotton organs were diluted by higher biomass [51], as supported by the result showing that dry matter was higher in the W1 treatment than that under the W2 treatment (Table 5).
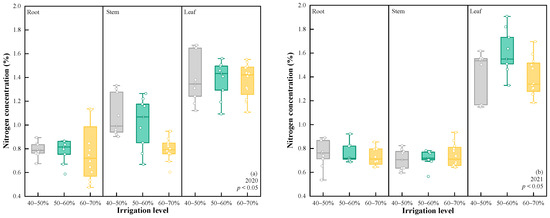
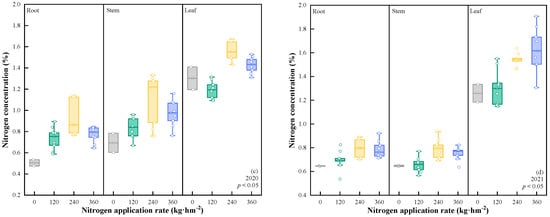
Figure 7.
Effects of different irrigation levels and nitrogen application rates on nitrogen concentration in different cotton organs. (a) Nitrogen concentration in root, stem and leaf of cotton under different irrigation levels in 2020; (b) nitrogen concentration in root, stem and leaf of cotton under different irrigation levels in 2021; (c) nitrogen concentration in root, stem and leaf of cotton under different nitrogen application rates in 2020; (d) nitrogen concentration in root, stem and leaf of cotton under different nitrogen application rates in 2021. Note: p < 0.05 indicates that it is significant at the level of 0.05. The error bars represent standard error of means from the triplicate readings.

Table 5.
The changes in cotton dry matter and plant nitrogen uptake in 2020 and 2021.
The responses of the nitrogen concentrations in different cotton organs to the nitrogen application rate were similar. The nitrogen concentration of the cotton organs could increase with a moderate nitrogen-fertiliser treatment. Similar improvements in nitrogen uptake and efficiency under different moisture levels have been reported in cereal-based systems using integrated nutrient strategies [28]. The results indicate that the root and stem nitrogen concentration reached the maximum at a nitrogen application rate of 240 kg ha−1 (Figure 7c,d)). Previous studies have proved that nitrogen fertiliser significantly affected nutrient uptake and distribution under water-deficit conditions [52]. With the nitrogen application rate increasing to 360 kg ha−1, the root and stem nitrogen concentration decreased. The results of Boquet and Breitenbeck [53] supported this finding. Insufficient nitrogen application (120 kg·ha−1) exposed cotton plants to both drought and nitrogen deficiency stress; excessive nitrogen application (360 kg·ha−1) further exacerbated the drought stress on the cotton plants [54]. This reduction in root activity would impair nutrient uptake, ultimately resulting in lower nitrogen concentration. Year-to-year differences were observed in the response of leaf nitrogen concentration to nitrogen application rate; however, the higher nitrogen application rate promoted more leaf nitrogen concentration in general.
The results from the 2-year experiment indicated that topsoil drought intensity and nitrogen application rate significantly affected cotton dry matter in 2020 and 2021 (Table 5). The synergetic effects of topsoil drought intensity and the nitrogen application rate on cotton dry matter were not significant. Cottons under the W2 and W3 conditions gained lower dry matter compared with the W1 treatment. In 2020, compared with the CK treatment, cotton dry matter in the W1N1, W1N2, and W1N3 treatments increased by 30.88%, 40.28%, and 61.96%, respectively Under the W2 condition, the cotton dry matter decreased in all nitrogen application rate treatments compared with the W1 condition. Meanwhile, 6.00%, 6.46%, and 15.56% reductions were found under the N1, N2, and N3 treatments, respectively. Under the W3 condition, the cotton dry matter further decreased in the three nitrogen application rate treatments. The biomass of the N1, N2 and N3 treatments decreased by 10.65%, 16.98%, and 8.89%, respectively, compared with the W2 treatment. In 2021, the N1, N2, and N3 treatments under the W1 condition enhanced the cotton dry matter by 31.17%, 30.93%, and 65.99%, respectively, compared with the CK treatment. Cotton dry matter decreased in each W2 treatment compared with the W1 treatment. When the drought intensity was heavy (W3), the cotton dry matter of each nitrogen application rate treatment was reduced by 12.35%, 1.33%, and 4.30%, respectively, compared with the W2 treatment. The results indicate that high topsoil moisture was more beneficial for cotton to obtain high dry matter than low topsoil moisture. This agrees with the findings of earlier research [55,56]. In a 3-year cotton-growing experiment, Wu et al. [57] found that cotton dry matter accumulation increased by 13.11% and 21.12% under typical and adequate irrigation, respectively, compared with deficit irrigation. On the one hand, deficit irrigation decreased the root length density [57]. This reduction was detrimental to the ability of cotton to absorb nutrients and moisture. A previous study [58] found a significant positive association between root length density and shoot dry weight to further support this view. On the other hand, more irrigation could significantly increase photosynthesis in cotton leaves, promote the formation of assimilates, and increase aboveground dry matter of cotton [59].
According to the findings of the study, cotton dry matter generally increased when the rate of nitrogen treatment increased (Table 5). Applying nitrogen fertiliser could alleviate the inhibitory effects of drought on crop development [60,61]. The positive effects of nitrogen on cotton development could be attributed to increased dry matter [62]. Under water stress, nitrogen application could promote the leaf area index, sustain the duration, increase photosynthesis in cotton leaves, and facilitate assimilate formation, increasing cotton dry matter [59,63]. Furthermore, the increased rates of nitrogen application reduced the reproductive allocation [64]. That is why cotton dry matter increased with increased nitrogen application rate.
Nitrogen accumulation is the basis of cotton organ growth, quality, and yield formation, and nitrogen uptake strongly relies on water and nitrogen availability. As shown in Table 5, the W1N3 treatment achieved the highest plant nitrogen accumulation in 2020 and 2021. This was primarily attributed to the highest dry matter accumulation in roots, stems, and leaves. Considerable effects of the nitrogen application rate on plant nitrogen accumulation were found, and this result was similar to that of Zhang et al. [65]. Topsoil drought intensity, nitrogen application rate, and year significantly affected plant nitrogen accumulation, but their interactions did not. In 2020 and 2021, the nitrogen uptake under the W1 treatment increased as the rate of nitrogen application increased. The nitrogen uptake under the N2 and N3 treatments increased by 44.70% and 37.97%, respectively, compared with the N1 treatment. In 2020, the nitrogen accumulation of the W2 and W3 treatments first increased and then decreased with the increased nitrogen application rate. The N3 treatment accumulated more nitrogen than the N1 treatment did. Nitrogen accumulation of the N3 treatment increased by 31.82% and 25.38%, respectively, compared with the N1 treatment. In 2021, nitrogen accumulation of the W2 and W3 treatments increased as the nitrogen application rate increased. Nitrogen accumulation of the N3 treatment was 18.89% and 27.04% higher than that of the N1 treatment. The results were similar to those of Yang et al. [66]. According to Yang et al., nitrogen accumulation increased with nitrogen supply under the 75% ETc treatment. However, when the supply of water and nitrogen fertiliser exceeded a certain range (water, 100% ETc; nitrogen, 186 kg N ha−2), plant nitrogen accumulation no longer increased significantly at each growth stage. This result was different from the results of this study. The reason was that the topsoil water condition was dry in this experiment, and the increased nitrogen application rate increased the root volume and root hydraulic lift [67], which could promote plant dry matter accumulation (Table 5). Nitrogen accumulation increased with decreased topsoil drought intensity, except for the N2 treatment in 2020. This was proven by a previous study in which the total nitrogen accumulation under 100% ETc treatment was higher than that under 11% ETc and 60% ETc [68]. The different response of nitrogen accumulation to treatments between the 2 years was due to the difference in climate, which affected soil enzyme activity related to soil nitrogen transformation [69].
3.3. Nitrogen Use Efficiency, Total Evapotranspiration and Water Use Efficiency
Table 6 presents the changes in INUE, PNUE, and NRE under different topsoil drought intensity and nitrogen application rate treatments. The nitrogen application rate had a considerable impact on INUE, PNUE, and NRE, which is consistent with previous studies [70,71]. In addition, INUE was significantly impacted by the topsoil drought intensity in 2021. The INUE of the CK treatment was greater compared with other treatments. The effects of topsoil drought intensity on PNUE were not significant in both years, but there were significant differences between W1N2 and W3N2 in 2020 and between W1N2 and W3N2 in 2021. The nitrogen application rate significantly affected PNUE in 2021. Under the W1 and W2 treatments, the increased nitrogen application rate increased the PNUE. The N3 treatment resulted in a higher PNUE than the N1 treatment. The change in PNUE with the nitrogen application rate was different from that in Bai et al.’s [72] study, and the reason was that 400 kg ha−1 may be too much for cotton growth, thus decreasing PNUE. The values of PNUE were negative under the W3N2 (in 2020) and W3N1 (in 2021) treatments. Lower yield under these two treatments was the reason for the negative PNUE, according to the definition of PNUE, compared with the yield of the CK treatment. The topsoil drought intensity of the W3 treatment was the severest among the treatments. Though the application of nitrogen fertiliser could decrease abscisic acid to increase net photosynthetic rate [73], leading to a higher accumulation of matter, the self-regulating ability of crops was limited under the N1 treatment in 2021. The yield from the W3N1 treatment was slightly lower than that from the CK treatment, resulting in a negative PNUE. The N2 treatment not only enhanced the drought-resistance ability compared to the N1 treatment but also did not waste nitrogen fertilizer like the N3 treatment. Thus, the highest PNUE was observed under the W3N2 treatment in 2021. Significant effects of topsoil drought intensity and nitrogen application rate on NRE were observed in 2021. By contrast to NRE treated by N1, NRE treated by N3 decreased by 14.33–44.25% in 2020 and 2021. This indicated that excess nitrogen decreased the NRE. Similar to the NRE change under 80% ETc and 100% ETc conditions in Bai et al.’s [74] study, NRE decreased with the nitrogen application rate. NRE decreased with increased topsoil drought intensity, except for the N2 treatment in 2020. In comparison with NRE treated by W1, NRE treated by W3 decreased by 24.65–49.95% in 2020 and 2021. This was in accordance with the fact that the nitrogen use efficiency was related to the soil water [75,76]. The interannual variations in the results could be attributed to considerable differences in the sowing and transplanting dates between the 2 experimental years. In addition, the hydraulic lift magnitude in 2021 exceeded that of 2020, with the exception of the CK, W1N2, and W2N1 treatments. A prior study found that decomposition rates were increased compared to conditions without hydraulic lift, and comparable in both soil layers under wet conditions [30]. Hydraulic lift improves microbial activity and promotes nutrient absorption [76,77]. This may also cause interannual variations in the three nitrogen use efficiencies.

Table 6.
Nitrogen use efficiency under different treatments.
The effects of topsoil drought intensity and nitrogen rate on ET and WUE are shown in Figure 8. Topsoil drought intensity, nitrogen rate, and experimental year significantly affected ET, but their interactive effects on ET were not significant (Table 7). The ET generally decreased with increasing topsoil drought intensity in 2020 and 2021 under the same nitrogen rate. The ET firstly increased and then decreased as the nitrogen increased under the W2 and W3 treatments in 2020 and the W1 and W2 treatments in 2021. Compared with CK treatments, the ET was significantly lower under the W3 treatments in both years. WUE was significantly affected by nitrogen rate, experimental year, the interaction between topsoil drought intensity and nitrogen application rate, the interaction between topsoil drought intensity and experimental year, and the three-way interaction of topsoil drought intensity, nitrogen application rate, and experimental year (Table 7). The response of WUE to nitrogen rate was different in 2020 and 2021, and the increased nitrogen rate increased WUE in 2021. The possible mechanisms behind the changes in ET and WUE under hydraulic lift were discussed in a previous study [67].
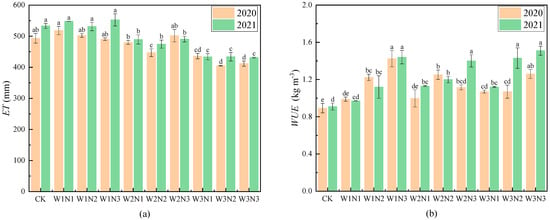
Figure 8.
The change in total evapotranspiration (ET) and water use efficiency (WUE). (a) ET in 2020 and 2021; (b) WUE in 2020 and 2021. Note: The error bars represent standard error of means from the triplicate readings. Different superscripts above the standard error are significantly different at p < 0.05 in the same year.

Table 7.
Significance levels (p-values) of the effects of topsoil drought intensity and nitrogen rate on total evapotranspiration (ET) and water use efficiency (WUE).
3.4. Cotton Quality
Figure 9 presents the change in cotton quality under different topsoil drought intensities and nitrogen application rates. Topsoil drought intensity, nitrogen application rate, and their interaction significantly affected fibre length in 2021 but not in 2020 (Figure 9a). According to a previous study, the amount of irrigation significantly affected the length of the fibre [78,79]. The findings of this study in 2021 support the results. Fibre length increased under other treatments without statistical significance compared with CK treatments, except for the W1N2, W2N2, and W3N2 treatments in 2020. On the one hand, the results may suggest that fibre quality was not significantly harmed by the moisture deficit [80]. On the other hand, compared to the CK treatments, the hydraulic lift magnitude under the other treatments was higher, except for the W1N1 treatments in 2020. The water lifted by the root at night alleviates topsoil drought stress [81,82]. This, to some extent, mitigates the negative impacts of severe water stress on fibre length. Under the W1 condition, fibre length was highest under N3 in 2020 and 2021. Fibre length under the N3 treatment was greater than that under the N1 treatment when the topsoil drought intensity was the same in 2021. In 2021, the fibre length was longer with nitrogen-treated treatments than under CK treatment. Earlier studies reported that the nitrogen application rate had significant impacts on fibre length, which is consistent with the results of this study in 2021 [78,79,83].
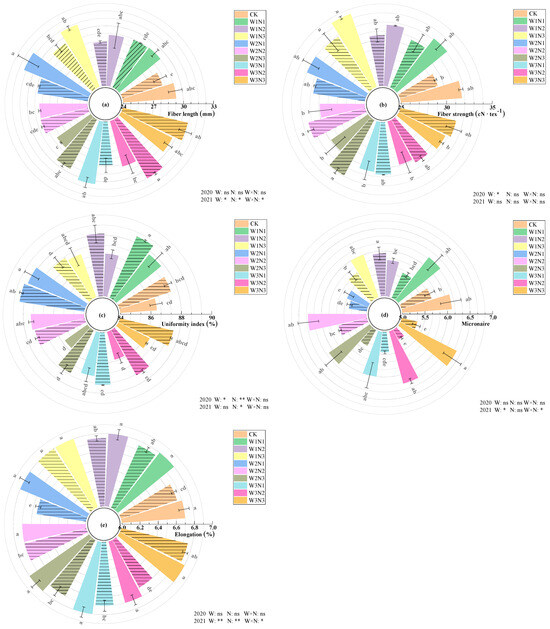
Figure 9.
The change in cotton quality. (a) Fiber length; (b) fiber strength; (c) uniformity index; (d) micronaire; (e) elongation. Note: * indicates that it is significant at the level of 0.05; ** indicates that it is significant at the level of 0.01. ns indicates that it is not significant. W is topsoil drought intensity. N is nitrogen application rate. The solid colour column represents quality index in 2020, and the column with diagonal stripes represents quality index in 2021. The error bars represent standard error of means from the triplicate readings. Different superscripts above the standard error are significantly different at p < 0.05 in the same year.
Fibre strength directly affects the yarn strength [84]. In this study, topsoil drought intensity had significant effects on fibre strength in 2020 but not in 2021 (Figure 9b). The results were similar to those of Chalise et al. [79] and Booker et al. [85], who found that irrigation had various effects on fibre strength over 2 years. The influences of water on fibre strength are inconsistent in the literature. Some studies found that irrigation water had significant effects on fibre strength [86,87,88], whereas some studies revealed that fibre strength was not affected by irrigation water [85,89]. When the topsoil drought intensities were W1 and W3, the N3 treatment increased fibre strength compared with the N1 treatment. Changes in fibre strength, influenced by topsoil drought intensity and nitrogen application rate, were similar to fibre length in 2020. By contrast with fibre strength under the CK treatment, fibre strength under other treatments increased in 2021 (4.09–8.67%). The results of this study indicate that the application rate of nitrogen had no considerable impact on fibre strength (Figure 9b), and this was different from the observations of others [83,90]. The differences may be attributed to the diverse cotton varieties.
Topsoil drought intensity significantly affected the uniformity index in 2020 but not in 2021 (Figure 9c). When the nitrogen rates were N1 and N2, the uniformity index was the lowest under the W3 treatment. When the nitrogen rates were N3, it was the lowest under the W2 treatment in both years. The result was comparable to that of Bai et al. [90], in which the influence of irrigation water was significant in 2020 and not in 2021. This may indicate that hydraulic lift could increase topsoil water, thereby decreasing the adverse effects of topsoil drought on the uniformity index. In comparison to the N1 treatment, the N2 and N3 treatments decreased the uniformity index except for W3N1 in 2021. The differences between W2N1 and W2N3 in 2020 and W1N1 and W1N3, as well as W2N1 and W2N3 in 2021, were significant. The highest uniformity index was under the W2N1 treatment in 2020 and the W1N1 treatment in 2021, the second-highest uniformity index was under the W1N1 treatment in 2020 and the W2N1 treatment in 2021, and the lowest uniformity index was under the W2N3 treatment in both years. This study found that the effects of nitrogen application rate on the uniformity index were significant in 2020 and 2021, which was in line with the findings of Ma et al. [83]. Nevertheless, the reaction of the uniformity index to the rate of nitrogen application differed from that of Ma et al. [83]. The uniformity index was not improved with a high nitrogen application rate in this study, whereas Ma et al. [83] reported an initial increase followed by a decline as the nitrogen levels increased. A previous study observed that the uniformity index first increased and then decreased as nitrogen rate increased, and four cotton cultivars obtained the highest uniformity index at the rates of 149.5, 136.25, 163.0, and 157.14 kg of N ha−1 [91]. The results were similar to those in this study, in which the rate of 120 kg of N ha−1 gained the highest uniformity index. A higher nitrogen rate may negatively influence the secondary cell wall’s chemical and structural composition, leading to a worse uniformity index [92]. The different response of the uniformity index to nitrogen rates may be due to the different varieties of cotton compared with those of Ma et al.’s [83] and da Silva Ribeiro et al.’s [91] studies.
As a comprehensive trait to reflect fibre fineness and maturity, micronaire was sensitive and difficult to predict owing to environmental changes [93]. The influence of topsoil drought intensity on micronaire was an interannual variability (Figure 9d). Topsoil drought intensity had significant effects on micronaire in 2021, and its interaction with nitrogen application rate also had significant influences on micronaire. The observations regarding the impact of water stress on micronaire were inconsistent: Micronaire can be increased [94,95] or decreased [89,96] depending on water stress time and duration [87]. Micronaire did not change much with the range of 5.5–6.4 in 2020 and 5.3–6.0 in 2021, and it was not significantly affected by nitrogen rates. This meant fibre quality was negatively affected because the allowed range is between 3.5 and 4.9 [97]. The possible reason was that micronaire was more sensitive to environmental factors compared with fibre strength and length [98]. However, the soil water condition remained relatively stable within a certain range and was not regulated to the cotton demand in different growth stages. This may make the soil water not suitable for the deposition and development of cotton cellulose, leading to the increased micronaire. A previous study also pointed out that different drought severities and the entire reproductive growth period of drought increased micronaire [99]. Micronaire of the same treatment was lower in 2021 than in 2020. Micronaire was relative to temperature [100]. So, the interannual variability of micronaire may be due to the different effective accumulative temperatures in the two years. Another possible reason for low micronaire quality was that the cotton bolls were harvested too late, resulting in the fibre being overly mature and having a larger fineness.
Elongation changed a little in both years (6.6–6.8) (Figure 9e). The response to experimental treatments was different in 2020 and 2021. Reports regarding fibre elongation changes were inconsistent. Some studies observed that the increased irrigation amount increased elongation [87,101], whereas some reported that the irrigation amounts had no effects on elongation [102,103]. Different results over the 2-year experiment were also observed in this study. Significant effects of topsoil drought intensity were observed in 2021 but not in 2020. In addition, the effects of nitrogen application rate on elongation differed over the 2 years. Previous studies indicate different results: nitrogen either had significant effects on elongation [83] or not [103].
3.5. The Correlation Between Nitrogen Distribution and Cotton Quality Under Hydraulic Lift
Figure 10 presents the correlation between the variables with nitrogen and cotton quality under hydraulic lift. The results indicate a positive correlation between hydraulic lift and NO3−-N in the 0–10 cm soil. The water from hydraulic lift enhanced the activity of soil microorganisms [16], and a positive correlation between decomposition rates and hydraulic lift was proved [30]. These factors led to the presence of more NO3−-N in the topsoil. In addition, the results provided evidence that the hydraulic lift participated in the nitrogen cycle. This verified the hypothesis of this study. Findings from other cropping systems also support the potential of integrated management practices to improve nitrogen use efficiency under water-limited conditions [28]. Moreover, previous studies revealed that hydraulic redistribution helps absorb nutrients such as nitrogen and phosphorus accumulated in topsoil owing to plant litterfall [104,105]. Meanwhile, the hydraulic lift was negatively correlated with NRE in this study. Although an increased nitrogen application rate increased the hydraulic lift magnitude and plant nitrogen accumulation compared with CK treatments, increased plant nitrogen accumulation was lower than the increased nitrogen fertiliser. The increased topsoil drought intensity and nitrogen rate increased the hydraulic lift magnitude, and detailed data were reported in our previous study [67]. However, severe topsoil drought intensity could decrease the activity of nitrogen metabolism enzymes, leading to lower assimilation and absorption of nitrogen by roots [106]. This caused the negative relationship between hydraulic lift and NRE. The response of hydraulic lift magnitude to topsoil drought and nitrogen application rate has been studied by Wang et al. [67]. Thus, this study mainly explored the relationship of all indexes under hydraulic lift.
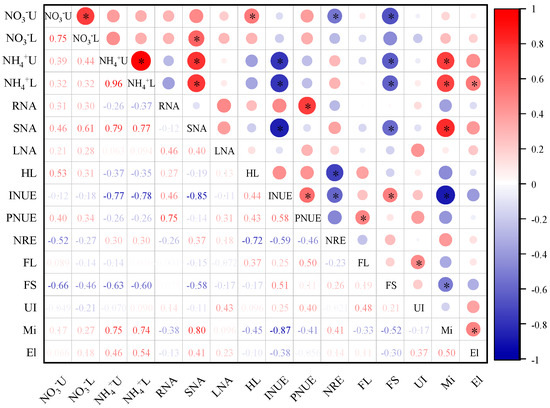
Figure 10.
The correlation between indicators. Note: NO3−U, NO3−L, NH4+U, NH4+L, RNA, SNA, LNA, HL, INUE, PNUE, NRE, FL, NI, Mi, and El mean nitrate nitrogen concentration in 0–10 cm soil, nitrate nitrogen concentration in 10–20 cm soil, ammonium nitrogen concentration in 0–10 cm soil, ammonium nitrogen concentration in 10–20 cm soil, root nitrogen accumulation, stem nitrogen accumulation, leaf nitrogen accumulation, tomato root hydraulic lift magnitudes, internal nitrogen-fertilizer use efficiency, physiological nitrogen-fertilizer use efficiency, nitrogen-fertilizer recovery efficiency, fibre length, fibre strength, uniformity index, micronaire, and elongation. * means significant difference (p < 0.05).
NO3−-N in 10–20 cm topsoil was correlated with stem nitrogen concentration. In addition, stem nitrogen concentration had correlations with NH4+-N in topsoil. Root and leaf nitrogen concentration were not correlated with NO3−-N or NH4+-N, and they had no significant correlation with cotton quality. Roots are important means of absorption and transport, and the changes in nitrogen in them may render them unstable. Nitrogen in the leaf is affected by photosynthesis. Therefore, nitrogen accumulation in the stem was correlated with NO3−-N and NH4+-N in soil, which is not the case for nitrogen accumulation in root and leaf. Root and leaf nitrogen concentrations were related to INRE, which was related to NH4+-N in topsoil. When the NH4+-N concentration in topsoil was high, the INUE was low. The same relationship was found between NRE and NO3−-N in the 0–10 cm soil. More NO3−-N and NH4+-N in soil meant less uptake and utilisation by the plant, decreasing NUE.
Uniformity index had a negative correlation with micronaire, which was consistent with the results in an early study [78]. There was a significant correlation between elongation and micronaire in this study; however, this was not the case for Hou et al.’s [78] study. This can be attributed to several factors such as irrigation amount, fertilisation, genotype, and weather conditions, affecting fibre quality [107,108]. A positive relationship between fibre strength and length was observed, and similar results were found by previous scholars [109]. In addition, cotton quality traits exhibited correlations between micronaire and elongation. Uniformity index and micronaire had correlations with NH4+-N in topsoil, nitrogen accumulation in the stem, and INRE. NO3−-N in the 0–10 cm soil had effects on the uniformity index. Meanwhile, elongation was affected by NH4+-N in the 10–20 cm soil. Fibre length was mainly affected by PNRE, whereas NRE was related to uniformity index and micronaire. This indicates that cotton quality was influenced by nitrogen application rate and nitrogen absorption, utilisation, and transformation to some extent.
4. Conclusions
Topsoil moisture of 50–60% of field capacity or applying nitrogen at a rate of 240 kg ha−1 significantly increased root and stem nitrogen concentrations. Cotton dry matter significantly increased with decreased topsoil intensity and was significantly affected by nitrogen application rate. Plant nitrogen accumulation was significantly affected by topsoil drought intensity. INUE, PNUE, and NRE were significantly affected by nitrogen application rate, except for PNUE in 2020. The INUE of the CK treatment was the highest. Meanwhile, the highest and the second-highest uniform index were found under the W2N1 and W1N1 treatments over the 2 years, whereas the lowest was under the W2N3 treatment in both years. Drought intensity, nitrogen application rate, and their interactions significantly affected fibre length and elongation in 2021. Hydraulic lift magnitude, NRE, and NO3−-N in the 0–10 cm soil were correlated with each other with statistical significance. There was a positive correlation between nitrogen accumulation in the stem and NO3−-N (0–10 cm) and NH4+-N (10–20 cm). Fibre length was positively correlated with strength, which was observed between micronaire and elongation, whereas there was a negative correlation between uniformity index and micronaire. The W2N1 treatment can achieve the best quality based on the consideration of five quality indicators and high nitrogen utilization efficiency. However, in actual production, it is necessary to adjust soil moisture and nitrogen fertilizer in combination with yield performance and also take into account climate and soil properties. Although our experiments simulated different soil moisture conditions (upper-layer-dry and lower-layer-wet), the minimum water potential difference observed in actual field conditions when root hydraulic lift occurs was not addressed in this study. Future research could focus on the water potential difference at which root hydraulic lift occurs. Additionally, soil enzymes and microbial activity are worthy of study since they have critical roles in the nutrient cycle.
Author Contributions
Conceptualization, J.L. and G.S.; methodology, J.L. and G.S.; software, J.L.; validation, J.L., L.T., and G.S.; formal analysis, L.T. and D.X.; investigation, D.X.; resources, J.L.; data curation, D.X. and L.T.; writing—original draft preparation, J.L.; writing—review and editing, L.T., G.S., and D.X.; project administration, J.L.; funding acquisition, J.L. All authors have read and agreed to the published version of the manuscript.
Funding
This work was supported by the Postdoctoral Fellowship Program of China Postdoctoral Science Foundation (GZC20230669) and the National Nature & Science Foundation of China (52309045).
Data Availability Statement
The data presented in this study are available on request from the corresponding author.
Acknowledgments
The authors extend their gratitude to the editor and anonymous reviewers for substantial comments on an earlier version of this paper.
Conflicts of Interest
No conflicts of interest exist in the submission of this manuscript, and the manuscript has been approved by all authors for publication.
References
- Jia, Y.L.; Li, Y.; He, J.Q.; Biswas, A.; Siddique, K.H.M.; Hou, Z.N.; Luo, H.H.; Wang, C.X.; Xie, X.W. Enhancing precision nitrogen management for cotton cultivation in arid environments using remote sensing techniques. Field Crops Res. 2025, 321, 109689. [Google Scholar] [CrossRef]
- Abdelraheem, A.; Esmaeili, N.; O’Connell, M.; Zhang, J.F. Progress and perspective on drought and salt stress tolerance in cotton. Ind. Crop Prod. 2019, 130, 118–129. [Google Scholar] [CrossRef]
- FAOSTAT, Food and Agricultural Organization of United Nations, Rome. 2025. Available online: https://www.fao.org/faostat/en/#data/QCL (accessed on 11 June 2025).
- National Bureau of Statistics of China. China Statistical Yearbook 2024, 2024th ed.; China Statistics Press: Beijing, China, 2024.
- Wang, Z.M.; Jin, M.G.; Šimůnek, J.; van Genuchten, M.T. Evaluation of mulched drip irrigation for cotton in arid Northwest China. Irrig. Sci. 2014, 32, 15–27. [Google Scholar] [CrossRef]
- Lesk, C.; Coffel, E.; Winter, J.; Ray, D.; Zscheischler, J.; Seneviratne, S.I.; Horton, R. Stronger temperature-moisture couplings exacerbate the impact of climate warming on global crop yields. Nat. Food 2021, 2, 683–691. [Google Scholar] [CrossRef]
- McMichael, B.L.; Lascano, R.J. Evaluation of hydraulic lift in cotton (Gossypium hirsutum L.) germplasm. Environ. Exp. Bot. 2010, 68, 26–30. [Google Scholar] [CrossRef]
- Oliveira, R.S.; Dawson, T.E.; Burgess, S.S.O.; Nepstad, D.C. Hydraulic redistribution in three Amazonian trees. Oecologia 2005, 145, 354–363. [Google Scholar] [CrossRef]
- Caldwell, M.M.; Dawson, T.E.; Richards, J.H. Hydraulic lift: Consequences of water efflux from the roots of plants. Oecologia 1998, 113, 151–161. [Google Scholar] [CrossRef]
- Alagele, S.M.; Jose, S.; Anderson, S.H.; Udawatta, R.P. Hydraulic lift: Processes, methods, and practical implications for society. Agroforest. Syst. 2021, 95, 641–657. [Google Scholar] [CrossRef]
- Lu, J.; Shao, G.C.; Wang, W.G.; Gao, Y.; Wang, Z.Y.; Zhang, Y.; Wang, J.; Song, E.Z. The role of hydraulic lift in tomato yield and fruit quality under different water and salt stresses. Agric. Water Manag. 2024, 299, 108899. [Google Scholar] [CrossRef]
- Sekiya, N.; Araki, H.; Yano, K. Applying hydraulic lift in an agroecosystem: Forage plants with shoots removed supply water to neighboring vegetable crops. Plant Soil 2011, 341, 39–50. [Google Scholar] [CrossRef]
- Zhang, W.Q.; Zwiazek, J.J. Hydraulic redistribution in slender wheatgrass (Elymus trachycaulus Link Malte) and yellow sweet clover (Melilotus officinalis L.): Potential benefits for land reclamation. Agronomy 2018, 8, 308. [Google Scholar] [CrossRef]
- Dawson, T.E. Water loss from tree roots influences soil water and nutrient status and plant performances. In Radical Biology: Advances and Perspectives in the Function of Plant Roots (Current Topics in Plant Physiology No. 18); Flores, H.E., Lynch, J.P., Eissenstat, D.M., Eds.; American Society of Plant Physiologists: Rockville, MD, USA, 1998; pp. 235–250. [Google Scholar]
- Querejeta, J.I.; Egerton-Warburton, L.M.; Allen, M.F. Direct nocturnal water transfer from oaks to their mycorrhizal symbionts during severe soil drying. Oecologia 2003, 134, 55–64. [Google Scholar] [CrossRef] [PubMed]
- Warren, J.M.; Brooks, J.R.; Meinzer, F.C.; Eberhart, J.L. Hydraulic redistribution of water from Pinus ponderosa trees to seedlings: Evidence for an ectomycorrhizal pathway. N. Phytol. 2008, 178, 382–394. [Google Scholar] [CrossRef] [PubMed]
- Schröder, J.J.; Schulte, R.P.O.; Creamer, R.E.; Delgado, A.; van Leeuwen, J.; Lehtinen, T.; Rutgers, M.; Spiegel, H.; Staes, J.; Tóth, G.; et al. The elusive role of soil quality in nutrient cycling: A review. Soil Use Manag. 2016, 32, 476–486. [Google Scholar] [CrossRef]
- Pask, A.J.D.; Sylvester-Bradley, R.; Jamieson, P.D.; Foulkes, M.J. Quantifying how winter wheat crops accumulate and use nitrogen reserves during growth. Field Crop Res. 2012, 126, 104–118. [Google Scholar] [CrossRef]
- Lawlor, D.W.; Cornic, G. Photosynthetic carbon assimilation and associated metabolism in relation to water deficits in higher plants. Plant Cell Environ. 2002, 25, 275–294. [Google Scholar] [CrossRef]
- Blum, A. Drought resistance, water-use efficiency, and yield potential–are they compatible, dissonant, or mutually exclusive? Aust. J. Agric. Res. 2005, 56, 1159–1168. [Google Scholar] [CrossRef]
- Luo, H.H.; Zhang, H.Z.; Han, H.Y.; Hu, Y.Y.; Zhang, Y.L.; Zhang, W.F. Effects ofwater storage in deeper soil layers on growth, yield, and water productivity of cotton (Gossypium hirsutum L.) in arid areas of northwestern China. Irrig. Drain. 2014, 63, 59–70. [Google Scholar] [CrossRef]
- Chen, Z.K.; Tao, X.P.; Khan, A.; Tan, D.K.Y.; Luo, H.H. Biomass accumulation, photosynthetic traits and root development of cotton as affected by irrigation and nitrogen-fertilization. Front. Plant Sci. 2018, 9, 173. [Google Scholar] [CrossRef]
- Hodges, S.C. Fertilization. In Cotton Information; Edmisten, K.L., Ed.; North Carolina Cooperative Extension Service: Raleigh, NC, USA, 2002; pp. 40–54. [Google Scholar]
- Rochester, I.J.; O′Halloran, J.; Maas, S.; Sands, D.; Brotherton, E. Monitoring nitrogen use efficiency in your region. Aust. Cottongrower 2007, 28, 24–27. [Google Scholar]
- Geng, J.B.; Ma, Q.; Chen, J.Q.; Zhang, M.; Li, C.L.; Yang, Y.C.; Yang, X.Y.; Zhang, W.T.; Liu, Z.G. Effects of polymer coated urea and sulfur fertilization on yield, nitrogen use efficiency and leaf senescence of cotton. Field Crops Res. 2016, 187, 87–95. [Google Scholar] [CrossRef]
- Dai, J.L.; Li, W.J.; Zhang, D.M.; Tang, W.; Li, Z.H.; Lu, H.Q.; Kong, X.Q.; Luo, Z.; Xu, S.Z.; Xin, C.S.; et al. Competitive yield and economic benefits of cotton achieved through a combination of extensive pruning and a reduced nitrogen rate at high plant density. Field Crops Res. 2017, 209, 65–72. [Google Scholar] [CrossRef]
- Hou, Z.N.; Li, P.F.; Li, B.G.; Gong, J.; Wang, Y.N. Effects of fertigation scheme on N uptake and N use efficiency in cotton. Plant Soil 2007, 290, 115–126. [Google Scholar] [CrossRef]
- Dhakal, G.; Fujino, T.; Magar, S.T.; Araki, Y. Optimizing Nitrogen and Water Use Efficiency in Wheat Cropping Systems Through Integrated Application of Biochar and Bokashi Under Different Irrigation Regimes. Nitrogen 2025, 6, 21. [Google Scholar] [CrossRef]
- Shafreen, M.; Vishwakarma, K.; Shrivastava, N.; Kumar, N. Physiology and Distribution of Nitrogen in Soils. In Soil Nitrogen Ecology, 1st ed.; Cruz, C., Vishwakarma, K., Choudhary, D.K., Varma, A., Eds.; Springer International Publishing: Cham, Germany, 2021; Volume 62, pp. 3–31. [Google Scholar] [CrossRef]
- Armas, C.; Kim, J.H.; Bleby, T.M.; Jackson, R.B. The effect of hydraulic lift on organic matter decomposition, soil nitrogen cycling, and nitrogen acquisition by a grass species. Oecologia 2012, 168, 11–22. [Google Scholar] [CrossRef]
- Domec, J.C.; King, J.S.; Noormets, A.; Treasure, E.; Gavazzi, M.J.; Sun, G.; McNulty, S.G. Hydraulic redistribution of soil water by roots affects whole-stand evapotranspiration and net ecosystem carbon exchange. New Phytol. 2010, 187, 171–183. [Google Scholar] [CrossRef]
- Ferreira, M.I.; Green, S.; Conceição, N.; Fernández, J.-E. Assessing hydraulic redistribution with the compensated average gradient heat-pulse method on rain-fed olive trees. Plant Soil 2018, 425, 21–41. [Google Scholar] [CrossRef]
- Prieto, I.; Armas, C.; Pugnaire, F.I. Water release through plant roots: New insights into its consequences at the plant and ecosystem level. New Phytol. 2012, 193, 830–841. [Google Scholar] [CrossRef]
- Prieto, I.; Armas, C.; Pugnaire, F.I. Hydraulic lift promotes selective root foraging in nutrient-rich soil patches. Funct. Plant Biol. 2012, 39, 804–812. [Google Scholar] [CrossRef]
- Shen, Y.F.; Zhang, Y.; Li, S.Q. Nutrient effects on diurnal variation and magnitude of hydraulic lift in winter wheat. Agric. Water Manag. 2021, 98, 1589–1594. [Google Scholar] [CrossRef]
- Quijano, J.C.; Kumar, P.; Drewry, D.T. Passive regulation of soil biogeochemical cycling by root water transport. Water Resour. Res. 2013, 49, 3729–3746. [Google Scholar] [CrossRef]
- Wang, X.; Tang, C.; Guppy, C.N.; Sale, P.W.G. The role of hydraulic lift and subsoil P placement in P uptake of cotton (Gossypium hirsutum L.). Plant Soil 2009, 325, 263–275. [Google Scholar] [CrossRef]
- Cardon, Z.G.; Stark, J.M.; Herron, P.M.; Rasmussen, J.A. Sagebrush carrying out hydraulic lift enhances surface soil nitrogen cycling and nitrogen uptake into inflorescences. Proc. Natl. Acad. Sci. 2013, 110, 18988–18993. [Google Scholar] [CrossRef] [PubMed]
- Warren, J.M.; Meinzer, F.C.; Brooks, J.R.; Domec, J.-C.; Coulombe, R. Hydraulic redistribution of soil water in two old-growth coniferous forests: Quantifying patterns and controls. N. Phytol. 2007, 173, 753–765. [Google Scholar] [CrossRef]
- Guo, J.J.; Fan, J.L.; Xiang, Y.Z.; Zhang, F.C.; Yan, S.C.; Zhang, X.Y.; Zheng, J.; Li, Y.P.; Tang, Z.J.; Li, Z.J. Coupling effects of irrigation amount and nitrogen fertilizer type on grain yield, water productivity and nitrogen use efficiency of drip-irrigated maize. Agric. Water Manag. 2022, 261, 107389. [Google Scholar] [CrossRef]
- Hou, X.H.; Xiang, Y.Z.; Fan, J.L.; Zhang, F.C.; Hu, W.H.; Yan, F.L.; Guo, J.J.; Xiao, C.; Li, Y.P.; Cheng, H.L.; et al. Evaluation of cotton N nutrition status based on critical N dilution curve, N uptake and residual under different drip fertigation regimes in Southern Xinjiang of China. Agric. Water Manag. 2021, 256, 107134. [Google Scholar] [CrossRef]
- Hillel, D. Applications of Soil Physics; Academic Press, Inc.: New York, NY, USA, 1980; p. 385. [Google Scholar]
- Asibi, A.E.; Yin, W.; Hu, F.L.; Fan, Z.L.; Gou, Z.W.; Yang, H.W.; Guo, Y.; Chai, Q. Optimized nitrogen rate, plant density, and irrigation level reduced ammonia emission and nitrate leaching on maize farmland in the oasis area of China. PeerJ 2022, 10, e12762. [Google Scholar] [CrossRef]
- Li, Y.Y.; Gao, X.P.; Tenuta, M.; Gui, D.W.; Li, X.Y.; Xue, W.; Zeng, F.J. Enhanced efficiency nitrogen fertilizers were not effective in reducing N2O emissions from a drip-irrigated cotton field in arid region of Northwestern China. Sci. Total Environ. 2020, 748, 141543. [Google Scholar] [CrossRef]
- Liu, T.Q.; Fan, D.J.; Zhang, X.X.; Chen, J.; Li, C.F.; Cao, C.G. Deep placement of nitrogen fertilizers reduces ammonia volatilization and increases nitrogen utilization efficiency in no-tillage paddy fields in central China. Field Crops Res. 2015, 184, 80–90. [Google Scholar] [CrossRef]
- Alves, I.M.D.; Soares, J.R.; Montezano, Z.F.; DelGrosso, S.; Vitti, A.C.; Rossetto, R.; Cantarella, H. Nitrogen sources and application rates affect emissions of N2O and NH3 in sugarcane. Nutr. Cycl. Agroecosyst. 2020, 116, 329–344. [Google Scholar]
- Guntiñas, M.E.; Leirós, M.C.; Trasar-Cepeda, C.; Gil-Sotres, F. Effects of moisture and temperature on net soil nitrogen mineralization: A laboratory study. Eur. J. Soil Biol. 2012, 48, 73–80. [Google Scholar] [CrossRef]
- Gloser, V.; Dvorackova, M.; Mota, D.H.; Petrovic, B.; Gonzalez, P.; Geilfus, C.M. Early changes in nitrate uptake and assimilation under drought in relation to transpiration. Front. Plant Sci. 2020, 11, 602065. [Google Scholar] [CrossRef] [PubMed]
- Orieux, C.; Demarest, G.; Decau, M.-L.; Beauclair, P.; Bataillé, M.-P.; Le Deunff, E. Changes in 15NO3- availability and transpiration rate are associated with a rapid diurnal adjustment of anion contents as well as 15N and water fluxes between the roots and shoots. Front. Plant Sci. 2018, 9, 1751. [Google Scholar] [CrossRef] [PubMed]
- He, J.Q.; Hu, W.; Li, Y.X.; Zhu, H.H.; Zou, J.; Wang, Y.H.; Meng, Y.L.; Chen, B.L.; Zhao, W.Q.; Wang, S.S.; et al. Prolonged drought affects the interaction of carbon and nitrogen metabolism in root and shoot of cotton. Environ. Exp. Bot. 2022, 197, 104839. [Google Scholar] [CrossRef]
- Greenwood, D.J.; Lemaire, G.; Gosse, G.; Cruz, P.; Draycott, A.; Neeteson, J.J. Decline in percentage N of C3 and C4 crops with increasing plant mass. Ann. Bot. 1990, 66, 425–436. [Google Scholar] [CrossRef]
- ShangGuan, Z.P.; Shao, M.A.; Dyckmans, J. Nitrogen nutrition and water stress effects on leaf photosynthetic gas exchange and water use efficiency in winter wheat. Environ. Exp. Bot. 2000, 44, 141–149. [Google Scholar] [CrossRef] [PubMed]
- Boquet, D.J.; Breitenbeck, G.A. Nitrogen rate effect on partitioning of nitrogen and dry matter by cotton. Crop Sci. 2000, 40, 1685–1693. [Google Scholar] [CrossRef]
- Liu, R.X.; Guo, W.Q.; Chen, B.L.; Wang, Y.H.; Zhou, Z.G. Effects of nitrogen on the dry matter, nitrogen accumulation and distribution of cotton under short-term soil drought during the flowering and boll-forming stage. Acta Bot. Boreali-Occident. Sin. 2008, 6, 1179–1187, (In Chinese with English abstract). [Google Scholar]
- Chen, X.P.; Qi, Z.M.; Gui, D.W.; Sima, M.W.; Zeng, F.J.; Li, L.H.; Li, X.Y.; Feng, S.Y. Responses of cotton photosynthesis and growth to a new irrigation control method under deficit irrigation. Field Crops Res. 2022, 275, 108373. [Google Scholar] [CrossRef]
- Zhu, L.X.; Li, A.C.; Sun, H.C.; Li, P.; Liu, X.Q.; Guo, C.C.; Zhang, Y.J.; Zhang, K.; Bai, Z.Y.; Dong, H.Z.; et al. The effect of exogenous melatonin on root growth and lifespan and seed cotton yield under drought stress. Ind. Crop Prod. 2023, 204, 117344. [Google Scholar] [CrossRef]
- Wu, F.Q.; Tang, Q.X.; Cui, J.P.; Tian, L.W.; Guo, R.S.; Wang, L.; Zheng, Z.P.; Zhang, N.; Zhang, Y.J.; Lin, T. Deficit irrigation combined with a high planting density optimizes root and soil water-nitrogen distribution to enhance cotton productivity in arid regions. Field Crop Res. 2024, 317, 109524. [Google Scholar] [CrossRef]
- Zhang, H.; Khan, A.; Tan, D.K.Y.; Luo, H. Rational water and nitrogen management improves root growth, increases yield and maintains water use efficiency of cotton under mulch drip irrigation. Front. Plant Sci. 2017, 8, 912. [Google Scholar] [CrossRef] [PubMed]
- Liu, C.; Zhang, J.S.; Wei, X.; Xu, X.X. Effects of mepiquat chloride on physiological indicators of leaf function and characteristics of yield of hybrid cotton in South Xinjiang. Cott. Sci. 2014, 26, 122–129, (In Chinese with English abstract). [Google Scholar]
- Cramer, M.D.; Hawkins, H.-J.; Verboom, G.A. The importance of nutritional regulation of plant water flux. Oecologia 2009, 161, 15–24. [Google Scholar] [CrossRef]
- Gonzalez-Dugo, V.; Durand, J.L.; Gastal, F. Water deficit and nitrogen nutrition of crops. A review. Agron. Sustain. Dev. 2010, 30, 529–544. [Google Scholar] [CrossRef]
- Kumar, R.; Pareek, N.K.; Kumar, U.; Javed, T.; Al-Huqail, A.A.; Rathore, V.S.; Nangia, V.; Choudhary, A.; Nanda, G.; Ali, H.M.; et al. Coupling Effects of Nitrogen and Irrigation Levels on Growth Attributes, Nitrogen Use Efficiency, and Economics of Cotton. Front. Plant Sci. 2022, 13, 890181. [Google Scholar] [CrossRef]
- Latiri-Souki, L.; Nortcliff, S.; Lawlor, D.W. Nitrogen fertilizer can increase dry matter, grain production and radiation and water use efficiencies for durum wheat under semi-arid conditions. Eur. J. Agron. 1998, 9, 21–34. [Google Scholar] [CrossRef]
- Shah, A.N.; Wu, Y.Y.; Tanveer, M.; Hafeez, A.; Tung, S.A.; Ali, S.; Khalofah, A.; Alsubeie, M.S.; Al-Qthanin, R.N.; Yang, G.Z. Interactive effect of nitrogen fertilizer and plant density on photosynthetic and agronomical traits of cotton at different growth stages. Saudi Saudi J. Biol. Sci. 2021, 28, 3578–3584. [Google Scholar] [CrossRef]
- Zhang, Z.X.; Liu, M.; Qi, Z.J. Effects of different water and nitrogen managements on soil nitrogen and fertilizer nitrogen in maize field. Trans. Chin. Soc. Agric. Mach. 2020, 51, 284–291, (In Chinese with English abstract). [Google Scholar]
- Yang, T.R.; Zhao, J.H.; Hong, M.; Ma, M.J. Appropriate water and nitrogen supply regulates the dynamics of nitrogen translocation and thereby enhancing the accumulation of nitrogen in maize grains. Agric. Water Manag. 2024, 306, 109610. [Google Scholar] [CrossRef]
- Wang, Z.Y.; Zhang, K.; Shao, G.C.; Lu, J.; Gao, Y. Effects of water and nitrogen regulation on cotton growth and hydraulic lift under dry topsoil conditions. Agronomy 2023, 13, 2022. [Google Scholar] [CrossRef]
- Coelho, A.P.; de Faria, R.T.D.; Leal, F.T.; Barbosa, J.D.A.; Lemos, L.B. Biomass and nitrogen accumulation in white oat (Avena sativa L.) under water deficit. Rev. Ceres 2020, 67, 1–8. [Google Scholar] [CrossRef]
- Ge, G.F.; Li, Z.J.; Fan, F.L.; Chu, G.X.; Hou, Z.N.; Liang, Y.C. Soil biological activity and their seasonal variations in response to long-term application of organic and inorganic fertilizers. Plant Soil 2010, 326, 31–44. [Google Scholar] [CrossRef]
- Luo, Z.; Liu, H.; Li, W.P.; Zhao, Q.; Dai, J.L.; Tian, L.W.; Dong, H.Z. Effects of reduced nitrogen rate on cotton yield and nitrogen use effiiency as mediated by application mode or plant density. Field Crops Res. 2018, 218, 150–157. [Google Scholar] [CrossRef]
- Li, W.T.; Wang, S.W.; Deng, X.P.; Li, H.B. Effects of different water and nitrogen levels on tuber yield, water and nitrogen use efficiency of potato. Agric. Res. Arid Areas 2016, 34, 191–196, (In Chinese with English abstract). [Google Scholar]
- Bai, Z.T.; Xie, C.; Yu, J.; Bai, W.Q.; Pei, S.Z.; Li, Y.X.; Li, Z.J.; Zhang, F.C.; Fan, J.L.; Yin, F.H. Effects of irrigation and nitrogen levels on yield and water-nitrogen-radiation use efficiency of drip-fertigated cotton in south Xinjiang of China. Field Crops Res. 2024, 308, 109280. [Google Scholar] [CrossRef]
- Radin, J.W.; Ackerson, R.C. Water relation of cotton plants under nitrogen deficiency: III. Stomatal conductance, photosynthesis and ABA accumulation during drought. Plant Physiol. 1984, 67, 115–119. [Google Scholar] [CrossRef]
- Quemada, M.; Gabriel, J.L. Approaches for increasing nitrogen and water use efficiency simultaneously. Glob. Food Secur. 2016, 9, 29–35. [Google Scholar] [CrossRef]
- Chilundo, M.; Joel, A.; Wesström, I.; Brito, R.; Messing, I. Influence of irrigation and fertilisation management on the seasonal distribution of water and nitrogen in a semi-arid loamy sandy soil. Agric. Water Manag. 2018, 199, 120–137. [Google Scholar] [CrossRef]
- Lee, E.; Kumar, P.; Barron-Gafford, G.A.; Hendryx, S.M.; Sanchez-Cañete, E.P.; Minor, R.L.; Colella, T.; Scott, R.L. Impact of hydraulic redistribution on multispecies vegetation water use in a semiarid savanna ecosystem: An experimental and modeling synthesis. Water Resour. Res. 2018, 54, 4009–4027. [Google Scholar] [CrossRef]
- Wang, Y.Y.; Jia, B.H.; Xie, Z.H. Impacts of hydraulic redistribution on eco-hydrological cycles: A case study over the Amazon basin. Sci China Earth Sci. 2018, 61, 1330–1340. [Google Scholar] [CrossRef]
- Hou, X.H.; Fan, J.L.; Hu, W.H.; Zhang, F.C.; Yan, F.L.; Xiao, C.; Li, Y.P.; Cheng, H.L. Optimal irrigation amount and nitrogen rate improved seed cotton yield while maintaining fibre quality of drip-fertigated cotton in northwest China. Ind. Crop Prod. 2021, 170, 113710. [Google Scholar] [CrossRef]
- Chalise, D.P.; Snider, J.L.; Hand, L.C.; Roberts, P.; Vellidis, G.; Ermanis, A.; Collins, G.D.; Lacerda, L.N.; Cohen, Y.; Pokhrel, A.; et al. Cultivar, irrigation management, and mepiquat chloride strategy: Effects on cotton growth, maturity, yield, and fibre quality. Field Crops Res. 2022, 286, 108633. [Google Scholar] [CrossRef]
- Meng, Z.J.; Bian, X.M.; Liu, A.N.; Pang, H.B.; Wang, H.Z. Effect of regulated deficit irrigation on growth and development characteristics in cotton and its yield and fibre quality. J. Cotton Sci. 2008, 20, 39–44, (In Chinese with English abstract). [Google Scholar]
- Liste, H.-H.; White, J.C. Plant hydraulic lift of soil water–implications for crop production and land restoration. Plant Soil 2008, 313, 1–17. [Google Scholar] [CrossRef]
- Hafner, B.D.; Tomasella, M.; Häberle, K.-H.; Goebel, M.; Matyssek, R.; Grams, T.E.E. Hydraulic redistribution under moderate drought among English oak, European beech and Norway spruce determined by deuterium isotope labeling in a split-root experiment. Tree Physiol. 2017, 37, 950–960. [Google Scholar] [CrossRef]
- Ma, K.; Wang, Z.H.; Li, H.Q.; Wang, T.Y.; Chen, R. Effects of nitrogen application and brackish water irrigation on yield and quality of cotton. Agric. Water Manag. 2022, 264, 107512. [Google Scholar] [CrossRef]
- May, O.L.; Taylor, R.A. Breeding cottons with higher yarn tenacity. Text. Res. J. 1998, 68, 302–307. [Google Scholar] [CrossRef]
- Booker, J.D.; Bordovsky, J.R.; Lascano, J.; Segarra, E. Variable rate irrigatıon on cotton lint yield and fibre quality. In Proceedings of the Beltwide Cotton Conferences, San Antonio, TX, USA, 3–6 January 2006; pp. 1768–1776. [Google Scholar]
- Johnson, R.M.; Downer, R.G.; Bradow, J.M.; Bauer, P.J.; Sadler, E.J. Variability in cotton fibre yield, fibre quality, and soil properties in a southeastern coastal plain. Agron. J. 2002, 94, 1305–1316. [Google Scholar] [CrossRef]
- Dağdelen, N.; Başal, H.; Yilmaz, E.; Gürbüz, T.; Akçay, S. Different drip irrigation regimes affect cotton yield, water use efficiency and fibre quality in western Turkey. Agric. Water Manag. 2009, 96, 111–120. [Google Scholar] [CrossRef]
- Abdelraheem, A.; Adams, N.; Zhang, J. Effects of drought on agronomic and fibre quality in an introgressed backcross inbred line population of Upland cotton under field conditions. Field Crops Res. 2020, 254, 107850. [Google Scholar] [CrossRef]
- Pettigrew, W.T. Moisture deficit effects on cotton lint yield, yield components, and boll distribution. Agron. J. 2004, 96, 377–383. [Google Scholar] [CrossRef]
- Bai, Z.T.; Bai, W.Q.; Xie, C.; Yu, J.; Dai, Y.L.; Pei, S.Z.; Zhang, F.C.; Li, Y.X.; Fan, J.L.; Yin, F.H. Irrigation depth and nitrogen rate effects on seed cotton yield, fibre quality and water-nitrogen utilization efficiency in southern Xinjiang, China. Agric. Water Manag. 2023, 290, 108583. [Google Scholar] [CrossRef]
- da Silva Ribeiro, J.E.; de Lima Tartaglia, F.; Caetano, L.P.; dos Santos Coêlho, E.; dos Santos, G.L.; de Oliveira, A.K.S.; da Silva, E.F.; de Almeida Oliveira, P.H.; da Silva, A.G.C.; da Silveira, L.M.; et al. Effect of nitrogen fertilization on the quality of colored cotton fibers in the Brazilian Semi-Arid Region. J. Nat. Fibers 2024, 21, 2391010. [Google Scholar] [CrossRef]
- Abdul Khalil, H.P.S.; Sohrab Hossain, M.; Rosamah, E.; Azli, N.A.; Saddon, N.; Davoudpoura, Y.; Nazrul Islam, M.d.; Dungani, R. The role of soil properties and it’s interaction towards quality plant fiber: A review. Renew. Sust. Energ. Rev. 2015, 43, 1006–1015. [Google Scholar] [CrossRef]
- Ulloa, M.; De Santiago, L.M.; Hulse-Kemp, A.M.; Stelly, D.M.; Burke, J.J. Enhancing upland cotton for drought resilience, productivity, and fibre quality: Comparative evaluation and genetic dissection. Mol. Genet. Genom. 2019, 295, 155–176. [Google Scholar] [CrossRef]
- Bradow, J.M.; Davidonis, G.H. Quantitation of fibre quality and the cotton production-processing interface: A physiologist’s perspective. J. Cotton Sci. 2000, 4, 34–64. [Google Scholar]
- McWilliams, D. Drought Strategies for Cotton. Cooperative Extension Service, Circular 582 College of Agriculture and Home Economics; New Mexico State University: Las Cruces, NM, USA, 2003. [Google Scholar]
- Guan, H.J.; Li, J.S.; Li, Y.F. Effects of drip system uniformity and irrigation amount on cotton yield and quality under arid conditions. Agric. Water Manag. 2013, 124, 37–51. [Google Scholar] [CrossRef]
- GB 1103-2007; Chinese National Standard, Cotton-Upland cotton. Standards Press of China: Beijing, China, 2007.
- Meredith, W., Jr. Improving fiber strength through genetics and breeding. In Proceedings of the Cotton Fiber Cellulose: Structures, Functions, and Utilization Conference, Savannah, GA, USA, 28–31 October 1992. [Google Scholar]
- Basal, H.; Dagdelen, N.; Unay, A.; Yilmaz, E. Effects of deficit drip irrigation ratios on cotton (Gossypium hirsuum L.) yield and fibre quality. J. Agron. Crop Sci. 2009, 195, 19–29. [Google Scholar] [CrossRef]
- Lokhande, S.; Reddy, K.R. Quantifying temperature effects on cotton reproductive efficiency and fiberquality. Agron. J. 2014, 106, 1275–1282. [Google Scholar] [CrossRef]
- Mert, M. Irrigation of cotton cultivars improves seed cotton yield, yield components and fibre properties in the Hatay region, Turkey. Acta Agric. Scand. Sect. B-Soil Plant Sci. 2005, 55, 44–50. [Google Scholar] [CrossRef]
- Wen, Y.J.; Rowland, D.L.; Piccinni, G.J.; Cothren, T.; Leskovar, D.I.; Kemanian, A.R.; Woodard, J.D. Lint yield, lint quality, and economic returns of cotton production under traditional and regulated deficit irrigation schemes in Southwest Texas. J. Cotton Sci. 2013, 17, 10–22. [Google Scholar]
- Li, X.X.; Liu, H.G.; He, X.L.; Gong, P.; Lin, E. Water-nitrogen coupling and multi-objective optimization of cotton under mulched drip irrigation in arid Northwest China. Agronomy 2019, 9, 894. [Google Scholar] [CrossRef]
- Jobbágy, E.G.; Jackson, R.B. The vertical distribution of soil organic carbon and its relation to climate and vegetation. Ecol. Appl. 2000, 10, 423–436. [Google Scholar] [CrossRef]
- Jobbágy, E.G.; Jackson, R.B. The uplift of soil nutrients by plants: Biogeochemical consequences across scales. Ecology 2004, 85, 2380–2389. [Google Scholar] [CrossRef]
- Xu, G.W.; Wang, H.Z.; Zhai, Z.H.; Sun, M.; Li, Y.J. Effect of water and nitrogen coupling on root morphology and physiology, yield and nutrition utilization for rice. Trans. Chin. Soc. Agric. Eng. 2015, 31, 132–141, (In Chinese with English abstract). [Google Scholar]
- Bilalis, D.; Patsiali, S.; Karkanis, A.; Konstantas, A.; Makris, M.; Efthimiadou, A. Effects of cultural system (organic and conventional) on growth and fier quality of two cotton (Gossypium hirsutum L.) varieties. Renew. Agric. Food Syst. 2010, 25, 228–235. [Google Scholar] [CrossRef]
- Girma, K.; Teal, R.K.; Freeman, K.W.; Boman, R.K.; Raun, W.R. Cotton lint yield and quality as affected by applications of N, P, and K Fertilizers. J. Cotton Sci. 2007, 11, 12–19. [Google Scholar]
- Su, W.; Shi, Y.Z.; Song, W.W.; Li, S.Q.; Kong, L.L.; Gong, J.W.; Liu, A.Y.; Li, J.W.; Ge, Q.; Gong, W.K.; et al. Fibre yield and quality traits and their correlation analysis of cotton chromosome segment substitution lines population (BC7F2) from Gossypium hirsutum L. × Gossypium barbadense L. Chin. Agric. Sci. Bull. 2017, 33, 21–27, (In Chinese with English abstract). [Google Scholar]
Disclaimer/Publisher’s Note: The statements, opinions and data contained in all publications are solely those of the individual author(s) and contributor(s) and not of MDPI and/or the editor(s). MDPI and/or the editor(s) disclaim responsibility for any injury to people or property resulting from any ideas, methods, instructions or products referred to in the content. |
© 2025 by the authors. Licensee MDPI, Basel, Switzerland. This article is an open access article distributed under the terms and conditions of the Creative Commons Attribution (CC BY) license (https://creativecommons.org/licenses/by/4.0/).