Abstract
The increasing demand for renewable energy, coupled with the urgent challenges posed by climate change, has positioned perennial biomass crops (BPGs) as essential and sustainable alternatives for bioenergy production. This study investigated the impact of irrigation regimes on the physiological performance of three BPG species—Arundo donax L., Saccharum spontaneum, and Miscanthus—with a focus on leaf gas exchange (net assimilation rate and transpiration rate) and instantaneous water use efficiency (iWUE) at varying levels of irrigation input, adopting a split-plot experimental design under the Mediterranean climatic conditions of Sicily (Italy). The results clearly showed that A. donax, a C3 species, outperformed the C4 species S. spontaneum and Miscanthus, exhibiting significantly higher stomatal conductance and net photosynthesis, especially under irrigated conditions. S. spontaneum demonstrated the highest iWUE, particularly in rainfed treatments, reflecting its efficient use of water. Miscanthus showed the greatest sensitivity to water stress, with a more pronounced decline in photosynthesis during drought periods. This study accentuated the role of effective water management and genotype selection in optimizing biomass yield and resource efficiency, providing valuable insights for improving crop productivity in Mediterranean and other semi-arid regions.
1. Introduction
In recent years, improved irrigation practices, along with the selection of more resilient plant varieties, emerged as promising strategies for increasing the productivity of biomass perennial grasses (BPGs) in semi-arid environments such as the Mediterranean, characterized by high temperatures and low rainfall [1,2]. These strategies are particularly relevant in the current context of climate change [3], which exacerbates water scarcity and intensifies the competition for resources between food and energy crops. Numerous studies underlined the influence that water availability and irrigation regimes have on BPGs growth, and the consequential parameters (i.e., stem density, height, and weight directly reflecting on biomass yield) [1,3,4,5,6,7,8].
In this context, developing water-use-efficient species is crucial for meeting global energy demands while ensuring sustainable water management. BPGs stand out as promising crops that can optimize productivity, even under prolonged drought conditions, thanks to their high water-use efficiency (WUE) and the efficiency of their photosynthesis system [5].
BPGs are ideally suited for marginal lands, offering significant ecosystem benefits, such as preventing soil erosion, sequestering carbon, and remediating contaminated soils [9]. They also find application as feedstock for biorefinery and as a source of bioenergy (i.e., biofuels), making them particularly interesting crops to meet the ambitious sustainable goals set by the Agenda 2030, also respecting the new European Union Renewable Energy Directive (RED III) [7,10].
Among BPGs, giant reed (Arundo donax L.) and African fodder cane (Saccharum spontaneum L. subsp. aegyptiacum (Willd.)) are characterized by a strong resistance to abiotic stresses [6], in particular limiting soil water availability [8,11,12].
Miscanthus (Miscanthus × giganteus (J.M. Greef, Deuter ex Hodk., Renvoize) is originally adapted to temperate and rainy climates [13]. For this reason, among Miscanthus species, new germplasm was selected for competitiveness and drought tolerance to be more suitable for Mediterranean conditions [14].
Despite these advantages, abiotic stresses have direct effects on stomatal function, reducing CO2 assimilation and biomass production, and consequently affecting both plant growth and yield [15,16]. To maximize yield, an integrated approach is needed that combines effective water management with selection of BPG genotypes that can make the most of periods of increased water availability, such as early emergence in spring and late senescence in fall [17].
Comparative data concerning the physiological response of the aforementioned BPGs to different irrigation regimes and the relationship with biomass productivity under soil water-scarce conditions remain scarce. This lack of data hinders the identification of the most suitable genotypes for cultivation in water-limited environments, which is crucial for sustainable bioenergy production under climate variability and increasing water stress. Hence, the aim of the present research is to evaluate leaf gas exchange and instant water use efficiency of A. donax, S. spontaneum, and Miscanthus hybrids under varying irrigation conditions, and their role in biomass productivity, with the objective of identifying the most-suited BPG genotypes for contrasting soil water scarcity.
2. Materials and Methods
2.1. Experimental Design
The field trial was carried out at the experimental farm of the University of Catania (37°24′ N, 15°03′ E, 10 m a.s.l.), in a typical Xerofluvents soil, with a preponderantly clayey texture, whose characteristics are listed in Table S1.
Two factors were studied in a split-plot experimental design with three replications in the two following years. The main factor assigned to the plots is the irrigation input, with three levels: 100, 50, and 0% of maximum crop evapotranspiration (ETm) restoration during the summer months (June–August). Genotype is the second factor, assigned to the sub-plots within the main irrigation plots.
Each plot measures 16 m2 (4 m × 4 m).
2.2. Irrigation Setup
Irrigation is provided by a drip irrigation system. During the first year of plant establishment (2018), irrigation was not differentiated, and all the plots received 100% of maximum crop evapotranspiration restoration during the summer months. Whereas, in the second (2019) and third year (2020), irrigation was differentiated.
Irrigation was scheduled when the sum of daily ETm corresponded to the volume, subtracting rainfall events from the calculation.
Daily ETm was calculated according to the following:
where ETm is the maximum daily evapotranspiration (mm), ETO is the evaporation of a class-A pan (mm), and Kc is the highest crop coefficient (Kc) among those applied for Miscanthus × giganteus, A. donax, and S. spontaneum grown in the same environment [15,18].
ETm = ETO × Kc
The irrigation volume was calculated using the following formula:
where V is the water volume (mm), 0.66 is the amount of readily available water not limiting evapotranspiration, FC is the soil water content at field capacity (27% of the dry weight of the soil), WP is the soil water content at the point of wilting (11% of the dry weight of the soil), Φ is the bulk density (1.1 g cm−3), and D is the depth of the soil explored by the roots (0.6 m).
V = 0.66 × (FC − WP) × Φ × D × 103
At the end of the summer season, when the available soil moisture was adequate for the crops, the irrigation was suspended. Water shortage during the first half of August 2019 led to the suspension of the ETm restoration, which has been resumed in the second half of the month.
2.3. Crop Genotypes
Six BPG genotypes belonging to the species A. donax L., M. × giganteus, and S. spontaneum L. ssp. aegypticum Willd (Hack.) were evaluated with three replications over two years (2019–2020). The details of the genotypes are given in Table S2.
Rhizomes of SAC, ARMO, and ARCT were collected from the in situ germplasm collection located at the Experimental Farm. Plantlets of M×G were provided by Energene sp. z o.o (Wrocław, Poland), while the GNT9 and the GNT10 were provided by Terravesta Ltd. (Lincoln, UK). Fresh rhizomes of approximately 100 g with 2–3 main buds (ARMO, ARCT, and SAC) and plantlets (M×G, GNT9, and GNT10) were directly transplanted in a previously prepared soil bed, ploughed in autumn, and disk harrowed in spring.
2.4. Agronomic Management
The transplant was performed manually in May 2018 at a density of 1 rhizome or plant m−2. With the aim of reducing the external input supply, no fertilization was supplied before transplanting.
Weeds were controlled manually during the year of establishment by means of a grass trimmer when necessary.
The first-year harvest was executed in February 2019, and the second-year harvest in February 2020. Fresh biomass was collected, excluding the edges of the plot, in an area of 4 m2. The whole aboveground biomass (AGB) was harvested from the sampling area by cutting the stems 5 cm above the ground. The AGB fresh weight was measured immediately.
A subsample of five representative stems per plot was taken to measure the fresh weight of stems and leaves. The subsamples were dried in an oven at 65 °C until a constant weight was reached. Afterwards, the dry weight (DW) of stems and leaves was measured in order to calculate the dry matter yield. The AGB yields were reported in previous studies [1,2].
2.5. Weather Conditions
Temperatures follow a typical seasonal pattern, with higher values in the summer months (June–August) and lower values in the winter months (December–February) (Figure 1). Maximum temperature (Tmax) presents a peak around July–August, exceeding 30 °C. Precipitation shows significant monthly variability, with some months characterized by high peaks, such as March and November 2020, while other months show little or no precipitation, such as June and July 2019. Overall, an uneven distribution of precipitation is observed throughout the year. ETO follows a similar trend to temperatures, with maximum values in the summer months and minimums in the winter months, indicating greater evaporative demand during the warm seasons.
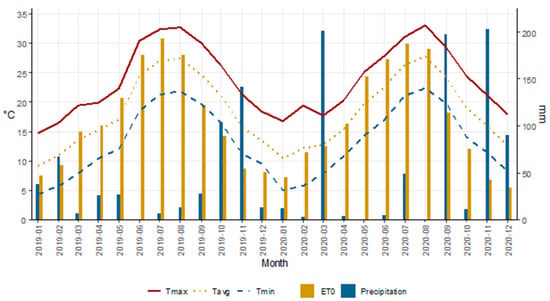
Figure 1.
Meteorological variables (Tmax = month average of daily maximum temperature, Tavg = month average of daily mean temperature, Tmin = month average of daily minimum temperature, ETO = month sum of daily reference evapotranspiration according to (Crop Evapotranspiration-Guidelines for Computing Crop Water Requirements-FAO), Precipitation = monthly precipitation) from January 2019 to December 2020 at the experimental site (Catania, 37°24′ N., 15°03′ E., 10 m a.s.l.).
2.6. Measurements
During the growing seasons, meteorological conditions have been continuously monitored through a weather station connected to a data logger (Delta-T, WS-GP1). Potential evapotranspiration is calculated according to Allen, R. G. et al., 1998 [19].
Field measurements of leaf gas exchanges have been made with a 2-week frequency from shoot emission at the beginning of spring to leaf senescence in autumn. Leaf gas exchange (CO2 and H2O) has been measured during the interval between one hour before and one hour after midday, on clear-sky days, on the uppermost fully expanded leaf of two randomly sampled plants per plot using a LCi-SD Portable Photosynthesis system (ADC BioScientific Ltd., Hoddesdon, UK) equipped with a 6 cm2 leaf chamber. The instrument also measures PAR, leaf, and atmospheric temperature. Net photosynthesis (µmol CO2 m−2 s−1), transpiration (mmol H2O m−2 s−1), and stomatal conductance (mol H2O m−2 s−1) have been calculated on the basis of CO2 and H2O gas exchange. Soil water content has been measured every two weeks using Teros10 moisture sensors (Delta-T).
2.7. Statistical Analysis
All analyses were performed using the R CRAN software (version 4.5.1).
A mixed-model analysis of variance was performed on AGB, net assimilation rate, transpiration rate, stomatal conductance, and iWUE with year as the random factor and irrigation and the genotype as fixed factors assigned to the subplot. Independence of observations was assumed based on the experimental design. The Shapiro–Wilk test was used to test residuals for normality. The Bartlett test was used to test homoscedasticity. Tukey’s HSD test with a 0.05 significance level has been performed to assess the differences among each genotype using RStudio software (version 4.5.1) [20]. Correlation between variables has been studied with Pearson’s product-moment correlation test.
The relationships between stomatal conductance–photosynthesis, stomatal conductance–transpiration, and photosynthesis–transpiration were fitted using the following model:
where α is the maximum asymptotic value of the function and b is the growth rate, which determines how quickly the function approaches the maximum value. The formula used to describe the linear relationship between above-ground biomass photosynthesis, above-ground biomass transpiration, above-ground biomass instant water use efficiency (iWUE), and vapour pressure deficit (VPD) transpiration was as follows:
where y0 is the intercept, a is the slope (angular coefficient) of the line, and x is the independent variable.
f(x) = α·(1 − e−bx)
f = y0 + a·x
3. Results
3.1. Physiological Parameters
3.1.1. Stomatal Conductance
The genotype factor explained most of the variance in stomatal conductance (gs), while the irrigation regimes had a lower but significant influence (Table 1). The effect of irrigation varied depending on the genotypes, with a significant interaction of Irrigation × Genotype.

Table 1.
Results of analysis of variance (ANOVA) for physiological and production parameters: above-ground biomass (AGB), net assimilation, transpiration, stomatal conductance, and intrinsic water use efficiency (iWUE). Values represent p-values associated with the sources of variation: year, irrigation, genotype, and interaction between irrigation and genotype. Degrees of freedom (df) are given for each source of variation. Significant p-values (<0.05) highlight the significant influence of the variables considered on the parameters analyzed.
The full-irrigated (100% ETm) and the partly-irrigated treatments (50% ETm) led to the highest stomatal conductance in all genotypes (Table 2). The rainfed condition (0% ETm) resulted in the lowest gs values, 27% lower than 100% ETm values.

Table 2.
Mean values of stomatal conductance (mol m−2 s−1) for each genotype (ARCT, ARMO, SAC, GNT9, GNT10, M×G) in response to different levels of irrigation (I0 = no irrigation, I50 = 50% irrigation, I100 = 100% irrigation). Mean values are reported for each treatment and for each genotype. Different letters (a, b, c) indicate statistically significant differences (p < 0.05) between genotypes or irrigation levels, determined by post-hoc analysis.
A. donax genotypes had the highest gs values, with ARMO achieving 0.217 mol m−2 s−1 on average and ARCT achieving 0.234 mol m−2 s−1 under 100% ETm.
C4 genotypes had lower gs values; among them, GNT10 exhibited the lowest stomatal conductance value for all treatments (0.060, 0.087, and 0.105 mol m−2 s−1 for I0, I50, and I100, respectively). GNT9 showed the steepest response to irrigation, with 53% lower values under rainfed treatment compared to 100% ETm.
The drop in gs values under 100% and 50% ETm treatments in August 2019 was caused by the suspension of the ETm restoration during that period (Figure S1). Higher than average precipitation in July 2020 led to higher soil moisture availability that benefited, in particular, the gs values under rainfed treatment (Figure S2).
3.1.2. Net Photosynthesis
Net photosynthesis (A) was significantly affected by irrigation and genotype (Table 3), while the interaction Irrigation × Genotype had no significant effect.

Table 3.
Mean values of net photosynthesis (µmol m−2 s−1) for each genotype (ARCT, ARMO, SAC, GNT9, GNT10, M×G) in response to different levels of irrigation (I0 = no irrigation, I50 = 50% irrigation, I100 = 100% irrigation). Mean values are reported for each treatment and for each genotype. Different letters (a, b, c) indicate statistically significant differences (p < 0.05) between genotypes or irrigation levels, determined by post-hoc analysis.
The I100 treatment led to higher net photosynthesis rates than I50 and I0 treatments (Table 3). A. donax genotypes and S. spontaneum had the highest net photosynthesis rates under all irrigation treatments. Miscanthus hybrids GNT9 and GNT10 had the lowest net photosynthesis rates and exhibited the steepest response to irrigation, with values 43% and 39% lower, respectively, under I0 treatment compared to I100 treatment.
All genotypes showed the same trend under fully irrigated conditions, with a peak during the beginning of summer, followed by lower values during periods of thermal stress and high VPD, and a recovery during the beginning of autumn, when thermal stress and VPD are lower (Figures S3 and S4). A similar course was followed under partial irrigation (I50) during the growth cycle. In contrast, I0 suffered from drastic declines during the summer period (June–August), with a recovery in September.
A. donax genotypes maintained higher net photosynthesis rates during summer than S. spontaneum and Miscanthus hybrids, which showed the sharpest decline during summer, in particular under I0.
In 2020, more pronounced fluctuations were observed, with clear differences between irrigation treatments, especially during summer stress periods. Overall, the values are higher than in 2019.
3.1.3. Transpiration Rate
The transpiration rate (E) is significantly affected by the irrigation and genotype factors (Table 4). Under fully irrigated treatment (I100), A. donax genotypes maintained higher transpiration rates than the other genotypes, 5.21 mmol m−2 s−1 for ARCT and 5.29 mmol m−2 s−1 for ARMO (Table 4). GNT10 showed the lowest transpiration rates among the genotypes, with values ranging from 1.96 mmol m−2 s−1 under I0 treatment and 3.60 mmol m−2 s−1 under I100 treatment.

Table 4.
Mean values of transpiration rate (mmol m−2 s−1) for each genotype (ARCT, ARMO, SAC, GNT9, GNT10, M×G) in response to different levels of irrigation (I0 = no irrigation, I50 = 50% irrigation, I100 = 100% irrigation). Mean values are reported for each treatment and for each genotype. Different letters (a, b, c) indicate statistically significant differences (p < 0.05) between genotypes or irrigation levels, determined by post-hoc analysis.
As for net photosynthesis rates and transpiration rates, higher differences between irrigation treatments are observed during summer stress periods in 2020 than in 2019 (Figures S5 and S6).
3.1.4. Instant Water Use Efficiency
Instant water use efficiency (iWUE), calculated as the ratio between the net photosynthesis rate and transpiration rate, is directly dependent on the previous physiological traits. Irrigation and genotype had a significant effect on iWUE (Table 5). IWUE was higher under I0 treatment; C4 genotypes (Miscanthus hybrids and S. spontaneum) had higher iWUE than C3 A. donax genotypes (Table 5).

Table 5.
Mean values of instant water use efficiency (iWUE, µmol CO2 mmol−1 H2O) for each genotype (ARCT, ARMO, SAC, GNT9, GNT10, M×G) in response to different levels of irrigation (I0 = no irrigation, I50 = 50% irrigation, I100 = 100% irrigation). Mean values are reported for each treatment and for each genotype. Different letters (a, b) indicate statistically significant differences (p < 0.05) between genotypes or irrigation levels, determined by post-hoc analysis.
All genotypes show a drastic reduction in iWUE during summer months, with minimum values between June and August in both years (Figures S7 and S8). During summer months, characterized by elevated temperature and vapor pressure deficit, which limit the efficiency of photosystems and increase the atmospheric water uptake, the iWUE was generally lower for all genotypes. The highest values of iWUE were recorded in May, which is characterized by high levels of solar radiation and lower temperature and vapor pressure deficit than in summer months. S. spontaneum showed the highest iWUE in 2020 among the genotypes in this study, especially in I0 (6.85 µmol CO2 mmol−1 H2O) and slightly lower values during 2019 for I0 (6.08 µmol CO2 mmol−1 H2O) and for I50 (5.37 µmol CO2 mmol−1 H2O).
3.2. Aboveground Biomass
Aboveground biomass (AGB) was significantly affected by irrigation and genotype and by their interaction (Table 6).

Table 6.
Aboveground biomass yield (AGB, Mg ha−1) for six genotypes ARCT, ARMO, SAC, GNT10, GNT9, and M×G under three water restoration levels (I0, I50, I100). Different letters (a, b, c, d, e) indicate statistically significant differences (p < 0.05) between genotypes or irrigation levels, determined by post-hoc analysis.
Giant reed and African fodder cane showed the highest aboveground biomass (AGB) yields in both the first and second years of the trial (Table 6).
ARMO clone had the highest AGB yield on average, while ARCT clone and S. spontaneum had 8% lower AGB yield on average. Miscanthus hybrid M×G had the lowest AGB yields.
Under full irrigation (I100), ARMO produced the greatest AGB yields, 35.1 Mg ha−1 in 2019 and 36.8 Mg ha−1 in 2020. In contrast, Miscanthus hybrids yielded less AGB, with values under I100 ranging from 19.5 Mg ha−1 for GNT10 to 14.1 Mg ha−1 for M × G in 2020. Reducing irrigation resulted in significantly lower AGB yields, with average decreases of 45.7% under rainfed conditions and 18.55% with the I50 irrigation input compared to full irrigation.
S. spontaneum showed the lowest reduction of AGB yield under rainfed conditions, losing 39% on the two-year average, while Miscanthus hybrid M×G showed the highest reduction of AGB yield under rainfed conditions, losing 56% on the two-year average.
3.3. Correlation Between Variables
3.3.1. AGB—Net Assimilation Rate Correlation
Net assimilation rate and AGB are positively correlated, with a Pearson correlation coefficient between 0.74 and 0.94 (Table 7). The slope of the regression lines varies between genotypes, showing differences in the conversion efficiency of net assimilation rate to biomass (Figure 2), ranging from 0.88 Mg m2 s1 ha−1 µmol−1 CO2 in GNT9 to 2.72 in ARCT (Table 7). Despite having similar net assimilation rates, SAC and ARMO show higher yields than GNT9 and GNT10. The y0 values vary considerably between genotypes. ARCT has the lowest intercept (−29.24), while SAC has a value very close to zero (−0.07), indicating that the latter has a high yield despite being less sensitive to the net assimilation rate.

Table 7.
Correlation curve (f = y0 + a·x) coefficients between yield and net assimilation rate for six genotypes: ARCT, ARMO, SAC, GNT10, GNT9, and M×G. Pearson correlation coefficient (R) and the coefficient of determination (R2) are reported.
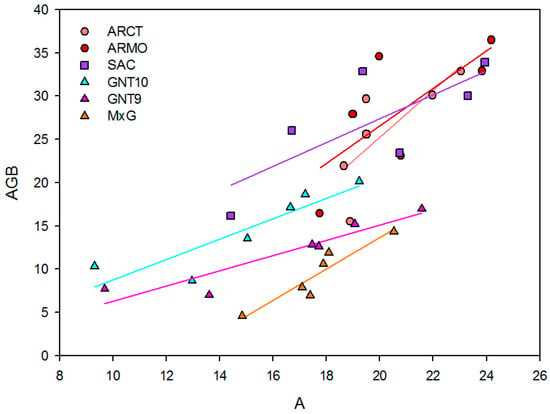
Figure 2.
Correlation (f = y0 + a·x) between net assimilation rate (µmol m−2 s−1) and AGB yield (Mg ha−1) across six genotypes (ARCT, ARMO, GNT10, GNT9, M×G, SAC) under three irrigation regimes (I0, I50, I100).
3.3.2. AGB—Transpiration Correlation
Transpiration rate and yield are positively correlated, with Pearson correlation coefficients between 0.79 and 0.96 (Table 8). A. donax genotypes, ARCT and ARMO, show higher slopes of linear regression, 11.15 and 13.23 Mg m2 s1 ha−1 mmol−1 H2O, respectively (Table 8). SAC tends to maintain lower transpiration rates than A. donax genotypes while providing high yields.

Table 8.
Correlation curve (f = y0 + a·x) coefficients between AGB yield and transpiration for six genotypes: ARCT, ARMO, SAC, GNT10, GNT9, and M×G. Pearson correlation coefficient (R) and the coefficient of determination (R2) are reported.
In contrast, Miscanthus genotypes have lower linear regression slopes, particularly GNT9 (3.75 Mg m2 s1 ha−1 mmol−1 H2O). SAC tends to maintain lower transpiration levels while providing high yields (Figure 3).
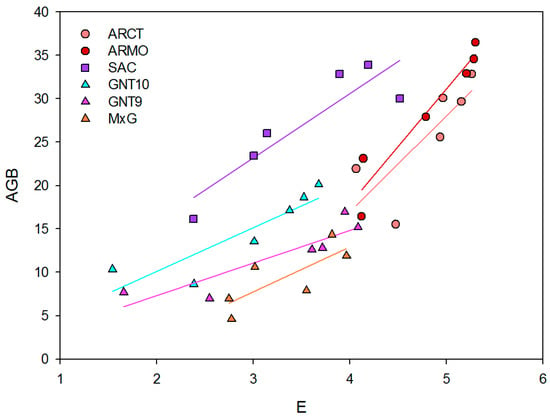
Figure 3.
Correlation (f = y0 + a·x) between transpiration rate (mmol m−2 s−1) and AGB yield (Mg ha−1) across six genotypes (ARCT, ARMO, GNT10, GNT9, M×G, SAC) under three irrigation regimes (I0, I50, I100).
3.3.3. AGB iWUE Correlation
A negative correlation was observed between iWUE and AGB, with Pearson correlation coefficients between –0.14 and −0.66 (Table 9), with a general trend of decreasing biomass as iWUE increases (Figure 4). Among the studied genotypes, M×G and ARCT have the lowest linear regression slope (Table 9), suggesting a low influence of iWUE on AGB yield. The highest yield values are obtained with low values of iWUE (~3–4 µmol CO2 mmol−1 H2O). ARMO and ARCT have the highest yield (~30–35 Mg ha−1) and the lowest iWUE.

Table 9.
Correlation curve (f = y0 + a·x) coefficients between AGB yield and instant water use efficiency for six genotypes: ARCT, ARMO, SAC, GNT10, GNT9, and M×G. Pearson correlation coefficient (R) and the coefficient of determination (R2) are reported.
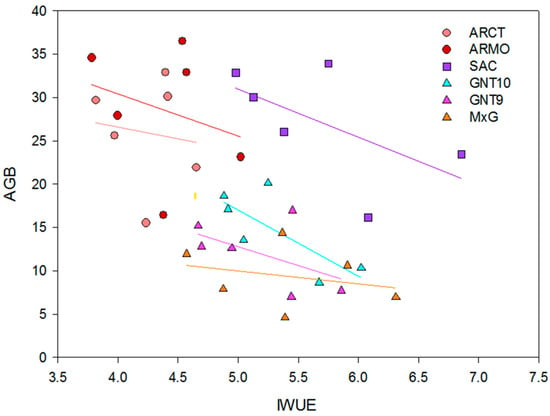
Figure 4.
Correlation (f = y0 + a·x) between AGB yield (Mg ha−1) and instant water use efficiency (µmol CO2 mmol−1 H2O) across different genotypes (ARCT, ARMO, GNT10, GNT9, M×G, SAC) and irrigation treatments (I0, I50, I100).
3.3.4. Stomatal Conductance—Net Assimilation Rate Correlation
Stomatal conductance and net assimilation rate are positively correlated for C4 genotypes, with Pearson correlation coefficients between 0.09 and 0.99, while the correlation was non-significant for A. donax genotypes (Table 10).

Table 10.
Correlation curve (f(x) = α·(1−e−bx)) coefficients between stomatal conductance (gs, mol m−2 s−1) and net assimilation rate (A, µmol m−2 s−1) for six genotypes ARCT, ARMO, SAC, GNT10, GNT9, and M×G. Pearson correlation coefficient (R) and the coefficient of determination (R2) are reported.
The relationship between stomatal conductance and net assimilation rate has been described by a saturating exponential function (Figure 5).
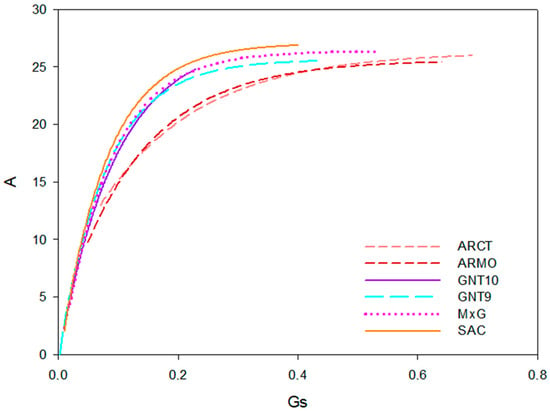
Figure 5.
Correlation curve (f(x) = α·(1−e−bx)) between stomatal conductance (gs, mol m−2 s−1) and net assimilation rate (A, µmol m−2 s−1) for six genotypes: ARCT, ARMO, SAC, GNT10, GNT9, and M×G.
The α coefficient of the function is the scaling factor (the horizontal asymptote) representing the maximum net assimilation rate that has been achieved under the conditions of the experiment. C4 plants had higher α values (between 25.69 and 27.72 µmol m−2 s−1) than C3 A. donax genotypes (between 25.35 and 25.64 µmol m−2 s−1) (Table 10). The b coefficient controls the rate of growth of the net assimilation rate at increasing stomatal conductance values. Miscanthus genotypes had higher b values, indicating high net assimilation rates at low stomatal conductance values, while A. donax genotypes had lower b values (Table 10).
3.3.5. Stomatal Conductance—Transpiration—Correlation
Stomatal conductance and transpiration rate are positively correlated (Figure 6), with Pearson correlation coefficients between 0.55 and 0.99 (Table 11).
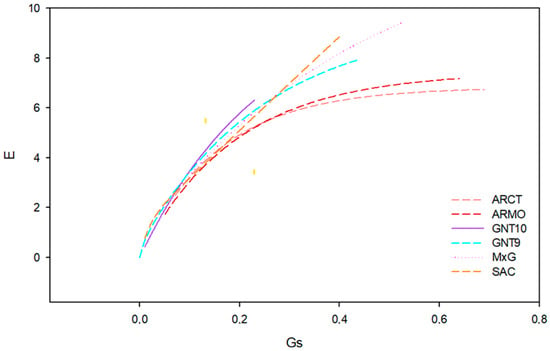
Figure 6.
Correlation curve (f(x) = α·(1 − e−bx)) between stomatal conductance (gs, mol m−2 s−1) and transpiration (E, mmol m−2 s−1) for six genotypes: ARCT, ARMO, SAC, GNT10, GNT9, and M×G.

Table 11.
Correlation curve (f(x) = α·(1 − e−bx)) coefficients between stomatal conductance (gs, mol m−2 s−1) and transpiration (E, mmol m−2 s−1) for six genotypes: ARCT, ARMO, SAC, GNT10, GNT9, and M×G. Pearson correlation coefficient (R) and the coefficient of determination (R2) are reported.
The α coefficient of the correlation curve represents the maximum transpiration rate that has been achieved under the conditions of the experiment. S. spontaneum had the highest α value (13.23 mmol m−2 s−1), while A. donax genotypes had the lowest values (between 6.81 and 7.42 mmol m−2 s−1) (Table 11). The b coefficient controls the rate of growth of the transpiration rate at increasing stomatal conductance values. A. donax genotypes had higher b values, indicating a higher sensitivity of transpiration to stomatal conductance.
3.3.6. Transpiration—Net Assimilation Rate Correlation
Stomatal conductance and transpiration rate are positively correlated (Figure 7), with Pearson correlation coefficients between 0.64 and 0.99 (Table 12).
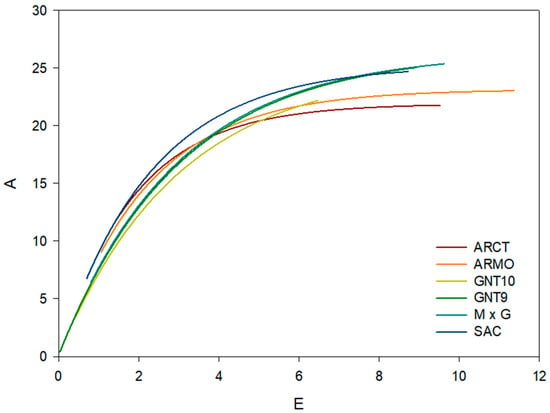
Figure 7.
Correlation curve (f(x) = α·(1 − e−bx)) between net assimilation rate (A, µmol m−2 s−1) and transpiration (E, mmol m−2 s−1) (f(x) = α·(1 − e−bx)) for six genotypes: ARCT, ARMO, SAC, GNT10, GNT9, and M×G.

Table 12.
Correlation curve (f(x) = α·(1 − e−bx)) coefficients between net assimilation (A, µmol m−2 s−1) and transpiration (E, mmol m−2 s−1) for six genotypes ARCT, ARMO, SAC, GNT10, GNT9, and M×G. Pearson correlation coefficient (R) and the coefficient of determination (R2) are reported.
As observed for the gs—A correlation, the α was higher for C4 plants, which had higher α values (between 25.03 and 26.35 µmol m−2 s−1) and lower for C3 A. donax genotypes (between 21.89 and 23.14 µmol m−2 s−1) (Table 12). The b coefficient controls the rate of growth of the net assimilation rate at increasing transpiration rates. A. donax genotypes had higher b values than the S. spontaneum and Miscanthus genotypes, indicating a decreasing rate of growth of net assimilation rate at increasing transpiration rates.
3.3.7. Vapor Pressure Deficit—Transpiration Correlation
Vapor pressure deficit and transpiration are positively correlated in all tested genotypes and under all irrigation inputs (Table 13 and Figure 8). Irrigation input led to higher transpiration rates and thus linear regression slopes, while in water stress regimes (I0 and I50), the transpiration response to VPD was less intense. Under rainfed conditions, A. donax genotypes had higher linear regression slopes (0.58–0.63 mmol m−2 s−1 kPa−1) than C4 SAC and Miscanthus genotypes (0.22–0.29 mmol m−2 s−1 kPa−1) (Table 13). Under I50 irrigation input, the linear regression slopes of A. donax genotypes and C4 genotypes were comparable, while under I100 irrigation input, A. donax genotypes had lower linear regression slopes than C4 genotypes, with the exception of GNT10, which maintained low transpiration rates.

Table 13.
Correlation curve (f(x) = y0 + a·x) coefficients between vapor pressure deficit (kPa) and transpiration rate (E, mmol m−2 s−1) for six genotypes: ARCT, ARMO, SAC, GNT10, GNT9, and M×G. Pearson correlation coefficient (R) is reported.
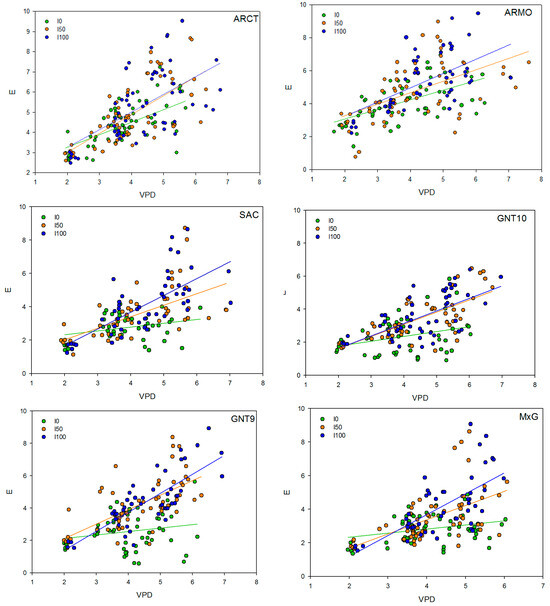
Figure 8.
Correlation (f(x) = y0 + a·x) between vapor pressure deficit (VPD, kPA) and transpiration (E, mmol m−2 s−1) in six genotypes (ARCT, ARMO, SAC, GNT10, GNT9, M×G) grown under three different water regimes (different symbols). The regression lines represent the response trend of each treatment.
4. Discussion
The observed results demonstrated the strong influence of irrigation regimes on physiological responses among the tested BPGs, with significant genotype-dependent variation.
Stomatal conductance (gs), a key indicator of gas exchange regulation, was markedly affected by water availability during the growing season and at different levels of irrigation input, confirming its sensitivity to drought stress.
The seasonal trend, particularly the reduction in gs during the summer months, further highlights the impact of climatic stress on physiological performance. C4 genotypes like SAC and GNT9 displayed steeper increases in gs with increasing water availability, indicating high stomatal plasticity, a trait beneficial for optimizing carbon assimilation under variable water supply.
The reduction in gs under rainfed conditions (I0) aligns with findings in other C3 and C4 crops, reflecting a common adaptive mechanism to limit water loss under drought conditions [22]. The pronounced genotypic differences, such as the low gs values in GNT10 across all treatments and the higher gs in A. donax genotypes, in particular under rainfed conditions, suggest intrinsic differences in stomatal control strategies, confirming previous studies [23,24]. Cosentino et al. [7] observed that A. donax possesses particularly efficient stomatal regulatory mechanisms that allow it to maintain CO2 assimilation even during periods of low water availability in the soil.
Net photosynthesis (A) followed similar responses to the irrigation input and to the seasonal variation in water availability and climatic conditions. The consistent peak during early summer (May–June) followed by a decline during July–August reflects stress-induced photosynthetic downregulation, mainly due to stomatal control.
These results are in line with what has been observed in other research [13], which has shown that higher values of net photosynthesis and transpiration rate occur during the early measurement periods. This is due to the fact that stress exposure time is still limited, and solar radiation is generally at its highest levels. As the season progresses, net photosynthesis and transpiration rate decrease, a phenomenon that was also observed in our study.
A. donax genotypes maintained higher photosynthetic rates under both irrigated and rainfed conditions, suggesting a greater tolerance to high temperatures and water stress, as reported by several studies [5,8]. The high net assimilation rates of A. donax under non-limiting water conditions have been attributed to the high capacity for both RuBP-limited and RuBP-saturated photosynthesis, which are comparable to C4 plants and higher than other C3 plants [5]. Under severe water stress, the photosynthetic capacity of A. donax becomes increasingly constrained by the increase of diffusive resistance due to stomatal control, widening the gap with C4 plants [5]. The present study found consistently higher values of stomatal conductance for A. donax in comparison with S. spontaneum and Miscanthus genotypes, in particular under rainfed conditions, demonstrating a lower water stress for A. donax due to the access to water reserves from deeper soil layers enabled by the extensive root system [22].
Conversely, Miscanthus’ net photosynthesis and thus productivity are highly limited by low water availability. Several studies suggest that M. × giganteus has poor stomatal control that leads to early leaf senescence under water stress conditions [13,23], while it maintains higher water use efficiency than A. donax under non-limiting soil moisture [25], thanks to the lower transpiration rates. This is in line with our study, where M. × giganteus achieved high net photosynthesis rates under fully irrigated conditions but demonstrated higher sensitivity to water scarcity than A. donax and S. spontaneum. On the contrary, the new miscanthus hybrids GNT9 and GNT10 showed a tighter stomatal control than M. × giganteus, maintaining lower transpiration rates which allowed soil moisture to be retained until late summer even under rainfed conditions, leading to longer leaf area duration and therefore higher AGB yields, as reported by Corinzia et al. (2023) [2].
The strong correlations between net photosynthesis and aboveground biomass (AGB) yield confirm the central role of carbon assimilation in biomass accumulation. However, the variable regression slopes among genotypes indicate differing efficiencies in converting photosynthates into biomass, with A. donax showing the highest slope, indicating the ability to allocate a large fraction of assimilated carbon directly into aboveground structural biomass, while losing or storing less carbon in soluble sugars or non-growth functions, in particular under non-limiting conditions [26]. S. spontaneum had a lower regression slope and a higher intercept, indicating that factors other than immediate photosynthetic rates, such as pre-existing reserves, tillering emission, and root growth, are responsible for AGB yield. Conversely, Miscanthus genotypes have lower conversion efficiency of photosynthesis to biomass, in agreement with Scordia et al. [13], who showed that although Miscanthus can be highly productive under non-limiting conditions, environmental constraints significantly affect its conversion efficiency from photosynthates to biomass.
Transpiration rate (E) followed a pattern similar to that of net assimilation in response to the irrigation input. A. donax genotypes exhibited the highest transpiration rates under all irrigation inputs. The higher transpiration rates of A. donax were noticeable in particular under water limiting conditions, confirming the greater water uptake even during periods of low water availability in the upper soil layers, allowed by the deeper root system of A. donax [18].
A key aspect that emerged from the study concerns water use efficiency (iWUE), which varies significantly in response to different irrigation regimes, suggesting that optimal water management could greatly improve crop productivity [27]. A. donax genotypes, having a C3 metabolism, are characterized by higher stomatal conductance needed to maintain high photosynthetic rates in comparison to C4 crops, leading to higher transpiration rate under similar conditions of water availability and therefore resulting in lower values of instant water use efficiency (iWUE), in agreement with what has been shown by Triana et al. (2015) [25]. IWUE decreases as water availability increases, confirming the findings of several studies [1,3,13,18], which show that water stress induces tighter stomatal regulation, leading to a decrease in the photosynthetic rate and to the concomitant higher reduction in transpiration, due to higher CO2 permeability, and therefore promoting water use efficiency [28,29]. A compromise between high photosynthetic rates and iWUE emerged, in line with previous studies [30]. This observation is particularly important for water management strategies in arid and semi-arid environments. Excessive irrigation may not always be the best choice to maximize crop yield, especially in water-limited regions.
The negative correlation between iWUE and biomass yield highlights a trade-off, which suggests a resource use strategy prioritizing biomass growth over water conservation. In contrast, the C4 Miscanthus genotypes, which maintained higher iWUE, did so at the cost of biomass accumulation, indicative of a conservative water-use strategy. S. spontaneum, having a C4 metabolism and a morphological adaptation that limits transpiration [31], showed the highest iWUE among the genotypes in this study, with higher values under rainfed conditions (I0), in agreement with Cosentino et al. [11]. Miscanthus genotypes and S. spontaneum have been reported to have lower crop water use than the A. donax genotype [1], in agreement with the difference in iWUE found in the present study.
The strong positive correlation between vapor pressure deficit (VPD) and transpiration highlights the significant role of atmospheric demand in controlling crop water losses. Water loss through transpiration is highly dependent on soil water availability under high VPD, while the effect is negligible under low VPD. A. donax genotypes showed greater transpiration rates at high VPD even under rainfed conditions, suggesting the ability to better use the soil water reserve and a growth-oriented physiology.
5. Conclusions
This study highlights the role of irrigation and genotype selection in optimizing biomass yield and physiological performance of biomass perennial grasses (BPG) under semi-arid Mediterranean conditions. Among the evaluated genotypes, A. donax showed the highest stomatal conductance, photosynthesis rate, and transpiration at all irrigation levels, underlining its ability to maintain productivity when deep soil water reserves are present, even under rainfed conditions in the Mediterranean climate.
S. spontaneum, despite showing lower net assimilation and transpiration rates than A. donax, demonstrated a remarkably high intrinsic water use efficiency (iWUE), especially under sprinkler irrigation conditions, making it a suitable candidate for cultivation under water-scarce conditions. In contrast, Miscanthus hybrids, although capable of achieving high photosynthesis under full irrigation, showed increased sensitivity to water stress, with reduced biomass yield and physiological activity under rainfed conditions.
The seed-based Miscanthus hybrids GNT9 and GNT10, selected to cope with limited soil water availability and high vapor pressure deficit, demonstrated a tight stomatal control and low transpiration rates, in particular under rainfed conditions, suggesting potential applications when water conservation is a priority.
The negative correlation between iWUE and biomass yield suggests a trade-off between water conservation and growth maximization, underlining the need for careful balancing of irrigation strategies. Overall, the results indicate that selection of genotypes such as A. donax or S. spontaneum, depending on the prevailing water availability, can significantly improve biomass productivity and resource use efficiency in arid environments.
Supplementary Materials
The following supporting information can be downloaded at: https://www.mdpi.com/article/10.3390/agronomy15082007/s1, Figure S1: Stomatal conductance (mol m−2 s−1) trends over the vegetative stages (April to October 2019), Figure S2: Stomatal conductance (mol m−2 s−1) trends over the vegetative stages (June to October 2020); Figure S3: Net photosynthesis rate (µmol m−2 s−1) trends over the vegetative stages (April to October 2019); Figure S4: Net photosynthesis rate (µmol m−2 s−1) trends over the vegetative stages ((June to October 2020); Figure S5: Transpiration rate (mmol m−2 s−1) trends over the vegetative stages (April to October 2019); Figure S6: Transpiration rate (mmol m−2 s−1) trends over the vegetative stages (June to October 2020); Figure S7: Instant water use efficiency (IWUE) (µmol CO2 mmol−1 H2O) trends over the vegetative stages (April to October 2019); Figure S8: Instant water use efficiency (IWUE) (µmol CO2 mmol-1 H2O) trends over the vegetative stages (June to October 2020); Table S1: Soil characteristics of the field site in the top layer (0–50 cm); Table S2: Description of the studied biomass perennial grasses (BPGs).
Author Contributions
Conceptualization, E.C., S.A.C. and G.T.; methodology, E.C., S.A.C. and G.T.; software, E.C. and S.A.C.; validation, S.A.C. and S.L.C.; formal analysis, E.C., S.A.C. and A.P.; investigation, E.C., S.A.C. and A.P.; resources, S.L.C. and G.T.; data curation, E.C., S.A.C. and S.L.C.; writing—original draft preparation, E.C.; writing—review and editing, E.C., S.A.C. and S.L.C.; visualization, E.C. and S.A.C.; supervision, S.L.C. and G.T.; project administration, S.L.C. and G.T.; funding acquisition, S.L.C. and G.T. All authors have read and agreed to the published version of the manuscript.
Funding
This paper is part of a project that has received funding from the “European Union’s Horizon 2020 research and innovation programme under grant agreement No 727698”.
Data Availability Statement
The original contributions presented in this study are included in the article/Supplementary Material. Further inquiries can be directed to the corresponding author.
Conflicts of Interest
The authors declare no conflicts of interest.
References
- Danilo, S.; Corinzia Sebastiano Andrea, C.; Salvatore, L.; Giorgio, T. Soil Water Availability on Biomass Yield and Water Indicators of Diverse Warm-Season Perennial Grasses in Dryness Conditions. Ind. Crops Prod. 2022, 180, 114744. [Google Scholar] [CrossRef]
- Corinzia, S.A.; Crapio, E.; Testa, G.; Cosentino, S.L.; Patanè, C.; Scordia, D. Leaf Area Duration and Crop Radiation Use Efficiency Determine Biomass Yield of Lignocellulosic Perennial Grasses under Different Soil Water Content. Agronomy 2023, 13, 2270. [Google Scholar] [CrossRef]
- Arias, C.; Lino, G.; Sánchez, E.; Nogués, S.; Serrat, X. Drought Impact on the Morpho-Physiological Parameters of Perennial Rhizomatous Grasses in the Mediterranean Environment. Agriculture 2023, 13, 1233. [Google Scholar] [CrossRef]
- Hatfield, J.L.; Dold, C. Water-Use Efficiency: Advances and Challenges in a Changing Climate. Front. Plant Sci. 2019, 10, 103. [Google Scholar] [CrossRef]
- Sánchez, E.; Rivera-Vargas, P.; Serrat, X.; Nogués, S. Arundo donax L.: How High Photosynthetic Capacity Is Maintained under Water Scarcity Conditions. Agronomy 2021, 11, 1089. [Google Scholar] [CrossRef]
- Volaire, F.; Barkaoui, K.; Norton, M. Designing Resilient and Sustainable Grasslands for a Drier Future: Adaptive Strategies, Functional Traits and Biotic Interactions. Eur. J. Agron. 2014, 52, 81–89. [Google Scholar] [CrossRef]
- Cosentino, S.L.; Patanè, C.; Sanzone, E.; Testa, G.; Scordia, D. Leaf Gas Exchange, Water Status and Radiation Use Efficiency of Giant Reed (Arundo donax L.) in a Changing Soil Nitrogen Fertilization and Soil Water Availability in a Semi-Arid Mediterranean Area. Eur. J. Agron. 2016, 72, 56–69. [Google Scholar] [CrossRef]
- Webster, R.J.; Driever, S.M.; Kromdijk, J.; McGrath, J.; Leakey, A.D.B.; Siebke, K.; Demetriades-Shah, T.; Bonnage, S.; Peloe, T.; Lawson, T.; et al. High C3 Photosynthetic Capacity and High Intrinsic Water Use Efficiency Underlies the High Productivity of the Bioenergy Grass Arundo donax. Sci. Rep. 2016, 6, 20694. [Google Scholar] [CrossRef]
- He, Y.; Jaiswal, D.; Liang, X.Z.; Sun, C.; Long, S.P. Perennial Biomass Crops on Marginal Land Improve Both Regional Climate and Agricultural Productivity. GCB Bioenergy 2022, 14, 558–571. [Google Scholar] [CrossRef]
- Sandmann, L.; Bülbül, E.; Castaño-Rosa, R.; Hanke, F.; Großmann, K.; Guyet, R.; Jiglau, G.; Laakso, S.; Nuorivaara, E.; Vornicu, A. The European Green Deal and Its Translation into Action: Multilevel Governance Perspectives on Just Transition. Energy Res. Soc. Sci. 2024, 115, 103659. [Google Scholar] [CrossRef]
- Cosentino, S.L.; Copani, V.; Testa, G.; Scordia, D. Saccharum spontaneum L. ssp. aegyptiacum (Willd.) Hack. a Potential Perennial Grass for Biomass Production in Marginal Land in Semi-Arid Mediterranean Environment. Ind. Crops Prod. 2015, 75, 93–102. [Google Scholar] [CrossRef]
- Rossa, B.; Tüffers, A.V.; Naidoo, G.; Von Willert, D.J. Arundo donax L. (Poaceae)—A C3 Species with Unusually High Photosynthetic Capacity. Bot. Acta 1998, 111, 216–221. [Google Scholar] [CrossRef]
- Scordia, D.; Scalici, G.; Clifton-Brown, J.; Robson, P.; Patanè, C.; Cosentino, S.L. Wild Miscanthus Germplasm in a Drought-Affected Area: Physiology and Agronomy Appraisals. Agronomy 2020, 10, 679. [Google Scholar] [CrossRef]
- Clifton-Brown, J.; Harfouche, A.; Casler, M.D.; Dylan Jones, H.; Macalpine, W.J.; Murphy-Bokern, D.; Smart, L.B.; Adler, A.; Ashman, C.; Awty-Carroll, D.; et al. Breeding Progress and Preparedness for Mass-Scale Deployment of Perennial Lignocellulosic Biomass Crops Switchgrass, Miscanthus, Willow and Poplar. GCB Bioenergy 2019, 11, 118–151. [Google Scholar] [CrossRef]
- Panoutsou, C.; Chiaramonti, D. Socio-economic Opportunities from Miscanthus Cultivation in Marginal Land for Bioenergy. Energies 2020, 13, 2741. [Google Scholar] [CrossRef]
- Twalla, J.T.; Ding, B.; Cao, G.; Bao, S.; Li, M.; Chen, X.; Xie, X.; Wang, J. Roles of Stomata in Gramineous Crops Growth and Biomass Production. Cereal Res. Commun. 2022, 50, 603–616. [Google Scholar] [CrossRef]
- Robson, P.R.H.; Farrar, K.; Gay, A.P.; Jensen, E.F.; Clifton-Brown, J.C.; Donnison, I.S. Variation in Canopy Duration in the Perennial Biofuel Crop Miscanthus Reveals Complex Associations with Yield. J. Exp. Bot. 2013, 64, 2373–2383. [Google Scholar] [CrossRef] [PubMed]
- Cosentino, S.L.; Scordia, D.; Sanzone, E.; Testa, G.; Copani, V. Response of Giant Reed (Arundo donax L.) to Nitrogen Fertilization and Soil Water Availability in Semi-Arid Mediterranean Environment. Eur. J. Agron. 2014, 60, 22–32. [Google Scholar] [CrossRef]
- Allen, R.G.; Pereira, L.S.; Raes, D.; Smith, M. Crop Evapotraspiration Guidelines for Computing Crop Water Requirements; Food and Agriculture Organization of the United Nations: Rome, Italy, 1998; ISBN 9251042195. [Google Scholar]
- R Core Team. R: A Language and Environment for Statistical Computing, version 4.5.1; R Foundation for Statistical Computing: Vienna, Austria, 2023.
- Corinzia, S.A. Modelling of Bioenergy Crops on Marginal Lands. Ph.D. Thesis, University of Catania, Catania, Italy, 2021. [Google Scholar]
- Medrano, H.; Escalona, J.M.; Bota, J.; Gulías, J.; Flexas, J. Regulation of Photosynthesis of C3 Plants in Response to Progressive Drought: Stomatal Conductance as a Reference Parameter. Ann. Bot. 2002, 89, 895–905. [Google Scholar] [CrossRef]
- Clifton-Brown, J.; Schwarz, K.U.; Awty-Carroll, D.; Iurato, A.; Meyer, H.; Greef, J.; Gwyn, J.; Mos, M.; Ashman, C.; Hayes, C.; et al. Breeding Strategies to Improve Miscanthus as a Sustainable Source of Biomass for Bioenergy and Biorenewable Products. Agronomy 2019, 9, 673. [Google Scholar] [CrossRef]
- Clifton-Brown, J.C.; Lewandowski, I. Water Use Efficiency and Biomass Partitioning of Three Different Miscanthus Genotypes with Limited and Unlimited Water Supply. Ann. Bot. 2000, 86, 191–200. [Google Scholar] [CrossRef]
- Triana, F.; Nassi o Di Nasso, N.; Ragaglini, G.; Roncucci, N.; Bonari, E. Evapotranspiration, Crop Coefficient and Water Use Efficiency of Giant Reed (Arundo donax L.) and Miscanthus (Miscanthus × giganteus Greef et Deu.) in a Mediterranean Environment. GCB Bioenergy 2015, 7, 811–819. [Google Scholar] [CrossRef]
- Herod, M.; Martina, J. Influence of Light, Nutrients, and Soil Moisture on the Growth and Resource Allocation of Arundo donax. Weed Res. 2024, 64, 54–64. [Google Scholar] [CrossRef]
- di Nasso, N.N.; Roncucci, N.; Triana, F.; Tozzini, C.; Bonari, E. Productivity of Giant Reed (Arundo donax L.) and Miscanthus (Miscanthus × giganteus Greef et Deuter) as Energy Crops: Growth Analysis. Ital. J. Agron. 2011, 6, 141–147. [Google Scholar] [CrossRef]
- Erickson, J.E.; Soikaew, A.; Sollenberger, L.E.; Bennett, J.M. Water Use and Water-Use Efficiency of Three Perennial Bioenergy Grass Crops in Florida. Agriculture 2012, 2, 325–338. [Google Scholar] [CrossRef]
- Sánchez, E.; Lino, G.; Arias, C.; Serrat, X.; Nogués, S. Photosynthesis, Resource Acquisition and Growth Responses of Two Biomass Crops Subjected to Water Stress. J. Plant Sci. 2018, 6, 68–86. [Google Scholar] [CrossRef]
- Blum, A. Effective Use of Water (EUW) and Not Water-Use Efficiency (WUE) Is the Target of Crop Yield Improvement under Drought Stress. Field Crops Res. 2009, 112, 119–123. [Google Scholar] [CrossRef]
- Munawarti, A.; Taryono, T.; Semiarti, E.; Sismindari, S. Morphological and Biochemical Responses of Saccharum spontaneum L. Accessions to Drought Stress. J. Trop. Life Sci. 2014, 4, 61–66. [Google Scholar] [CrossRef]
Disclaimer/Publisher’s Note: The statements, opinions and data contained in all publications are solely those of the individual author(s) and contributor(s) and not of MDPI and/or the editor(s). MDPI and/or the editor(s) disclaim responsibility for any injury to people or property resulting from any ideas, methods, instructions or products referred to in the content. |
© 2025 by the authors. Licensee MDPI, Basel, Switzerland. This article is an open access article distributed under the terms and conditions of the Creative Commons Attribution (CC BY) license (https://creativecommons.org/licenses/by/4.0/).