Article

Characterization of GmABI3VP1 Associated with Resistance to Soybean Cyst Nematode in Glycine max

1
Key Laboratory of Soybean Biology in Chinese Ministry of Education, Key Laboratory of Soybean Biology and Breeding/Genetics of Chinese Agriculture Ministry (Harbin), College of Agriculture, Northeast Agricultural University, Harbin 150030, China
2
State Key Laboratory of Crop Gene Resources and Breeding, The National Key Facility for Crop Gene Resources and Genetic Improvement (NFCRI), Key Laboratory of Soybean Biology (Beijing), Ministry of Agriculture and Rural Affairs, Institute of Crop Science, Chinese Academy of Agricultural Sciences, Beijing 100081, China
*
Authors to whom correspondence should be addressed.
Agronomy 2025, 15(8), 2005; https://doi.org/10.3390/agronomy15082005
Submission received: 23 July 2025 / Revised: 8 August 2025 / Accepted: 18 August 2025 / Published: 21 August 2025

Abstract

The ABI3 transcription factor is a key regulator in plant growth and development. Through transcriptome analysis of the resistant soybean cultivar ‘Dongnong L10′ and the susceptible cultivar ‘Heinong 37′ exposed to soybean cyst nematode race 3 (SCN 3) stress, the differentially expressed gene GmABI3VP1 was identified. The GmABI3VP1 gene was then cloned and analyzed through bioinformatics, subcellular localization, and qRT-PCR analysis of resistant and susceptible soybean germplasms, as well as overexpression and gene editing of soybean hairy roots followed by SCN 3 identification analysis. It was found that the protein encoded by GmABI3VP1 is an acidic and hydrophilic protein with transmembrane domains. It has a collinear relationship with Arabidopsis and is widely distributed in plants. Through the analysis of promoter elements, it was shown that this gene contains multiple hormone-responsive promoter elements like ABRE/ABRE3a/ABRE/4a/as-1 and stress-responsive elements such as Myb/MYC/MYc. Transient expression in tobacco indicated that the GmABI3VP1 gene is located in the nucleus. The transcription of GmABI3VP1 responds to the stress of SCN, and its transcriptional level is relatively high in the roots of resistant materials. Genetic transformation mediated by Agrobacterium rhizogenes was used to obtain GmABI3VP1 gene overexpressed and CRISPR-Cas9 gene-edited soybean hairy roots. In comparison to the wild type (WT), the density of nematodes per area was notably lower in hairy roots overexpressing (OX) the gene, whereas the density of SCN per unit area (per cm of lateral root length) significantly increased in gene-edited (KO) soybean hairy roots. Through SCN phenotyping, GmABI3VP1 was identified as a contributor to SCN 3 resistance. This study provides initial insights into the role of the GmABI3VP1 gene in SCN resistance, establishing a robust basis for future research on the mechanisms underlying SCN disease resistance and offering valuable genetic reservoirs for SCN 3 resistance.

1. Introduction

The cultivation of soybeans (Glycine max (L.) Merr.) has been traced back to China, where they have been planted for over 5000 years [1]. It is classified under the genus Glycine and is an annual herbaceous plant. The objectives of modern crop breeders encompass achieving high yields, ensuring excellent quality, maintaining stable production, synchronizing the growth cycle, and adapting to the requirements of modern harvesting [2]. Elevating the per-unit yield and quality of soybeans constitutes the cardinal strategy for safeguarding soybean food security.
Soybean cyst nematode disease (Heterodera glycines Ichinohe, SCN) is widely distributed worldwide. The disease was first discovered in Japan in 1915 [3]. Subsequently, the disease was discovered in the central North American region of the United States. SCN has caused soybean yield losses of up to $1.2 billion [4]. In China, SCN is primarily distributed in the Northeast and Huanghuai regions. The disease exhibits differentiation into multiple physiological races. In the Huanghuai region, a major soybean-producing area in China, physiological races SCN 1 and SCN 4 are dominant. In the Northeast region, another major soybean-producing area, physiological races SCN 3 and SCN 4 are primarily found [5].
J2 stage SCN causes the most severe damage to soybean root systems. SCN releases cellulase and pectinase through its mouthparts, dissolving the cell walls of plant roots and forming syncytia. Obtaining nutrients from the host soybean [5], leads to a significant reduction in soybean yield. Yields may decrease by 20% to 30%, and, in severe cases, result in complete crop failure. Currently, the primary measures for controlling SCN include crop rotation, SCN chemical agents, and the development of SCN-resistant varieties. In terms of crop rotation, the corn–soybean–corn rotation system is widely adopted. However, it cannot completely eradicate the SCN pathogen. Chemical agents can control the disease to some extent, but they have a significant impact on the surrounding soil ecosystem. Currently, the SCN antigens widely recognized by the scientific community include PI88788, PI54840 (Peaking), and PI437654 [6]. However, with the overuse of antigen resistance, the resistance of antigens gradually weakens, and SCN evolves into more potent physiological populations [7]. The pathogenicity of SCN populations was initially classified as physiological populations based on the responses of four soybean genotypes. Subsequently, seven soybean lines are identified with unique resistance through genotyping methods [8]. As SCN physiological populations continue to evolve, SCN populations have gradually overcome antigens such as PI88788. Therefore, it is crucial to continue screening for new resistant germplasm and genes from soybean germplasm resources, and to expand the genetic background of superior germplasm resources. Rgh1, located on chromosome 18, exhibits incomplete dominance [9], while Rgh4, located on chromosome 8, exhibits complete dominance [10,11]. Rgh1 and Rgh4 have been extensively validated by quantitative trait locus (QTL) studies and are widely recognized as the primary resistance loci for SCN resistance [12,13]. Many studies have focused on developing molecular markers at these loci. However, Rgh1 and Rgh4 can only explain 60% of the genetic variation [14], and the remaining portion still requires further exploration and development.
ABI transcription factors are widely distributed in plants such as soybeans, corn, wheat, tomatoes, and Arabidopsis thaliana [15,16]. This type of transcription factor contains four conserved domains, namely A, B1, B2, and B3. Among them, the N-terminal A structure is rich in acidic residues; and, in the B1 domain, there are essential elements necessary for the interaction with bZIP transcription factors [17]. The B2 domain encompasses a putative nuclear-localization signal and is considered to play a crucial function in transcriptional regulation [18]. The B3 domain is a highly conserved DNA-binding domain. It is widely involved in the regulation of seed development, participates in stress responses, and affects the growth and development of plants, among other aspects [19].
ABI3 is widely involved in plant abiotic stress and plays an important regulatory role under conditions such as temperature stress and dehydration stress. ABI3 mediates the dehydration stress response in non-seed plants and seed plants by regulating downstream genes [20]. When AtABI3 is absent in A. thaliana its recovery capacity under dehydration stress is impaired [21]. The development of seed coats in Brassica napus is regulated by BnABI3, which plays a crucial role in seed dehydration tolerance [22]. In response to dehydration stress, ABI3 inhibits the transcription of the RAV1 gene by suppressing the recruitment of RNA polymerase II. Under stress conditions, the downregulation of RAV1 gene expression induces a decrease in the expression of ethylene-insensitive 2 (EIN2) and ethylene receptor 1 (ETR1), thereby generating an effective dehydration stress response [23]. In A. thaliana, ABI3 transgenic plants exhibit enhanced cold tolerance under short-term ABA treatment, suggesting that the ectopic expression of the ABI3 gene may regulate cold-induced cold tolerance and confer higher cold temperature tolerance [24]. The transcription of genes such as SOS1, SOS2, SOS3 sodium/hydrogen ion exchanger, drought stress response 29B, abscisic acid insensitive protein 2, ABI3, MYB15, and δ-1-pyrrolidine-5-carboxylic acid synthase 1 is promoted by salt stress [25]. The ABI3VP1 protein possesses a B3 DNA-binding domain and is widely involved in regulation during development and under adverse stress conditions [26].
In this study, RNA sequencing (RNA-Seq) was conducted on the root systems of highly resistant and susceptible soybean varieties. Analysis of the transcriptome data revealed the differentially expressed gene GmABI3VP1, which was identified between the resistant and susceptible root samples. Overexpression and gene editing vectors were constructed, and transgenic root systems were developed using Agrobacterium-mediated genetic transformation technology. By analyzing the gene expression patterns in both overexpressed and gene-edited roots, the role of this gene in response to SCN stress was established. Additionally, SCN disease resistance to SCN and measurements of root physiological parameters were conducted. This study aims to explore the function of the GmABI3VP1 gene and provide insights into the mechanisms underlying its role in SCN disease resistance.

2. Materials and Methods

2.1. Plant Materials and Growth Conditions

The soybean materials used in the experiment included Dongnong 50 (DN50, SCN-susceptible varieties; it is a variety highly susceptible to SCN), Dongnong L10 (SCN-resistant varieties), Suinong14 (SN14,SCN-susceptible varieties), and Heinong 37 (HN 37,SCN-susceptible varieties). Y16 (SCN-resistant varieties; RILF15, Recombinant Inbred LineF15, line 16). All soybean germplasm resources were planted in 2023 in China, Harbin City, Heilongjiang Province (45°45′16.2″ N, 126°54′39.6″ E) in Xiangyang Farm of Northeast Agricultural University. The field experiment was conducted in a randomized block design with 1 m row length, 0.65 m row width, 0.06 m plant spacing, and three replications.

2.2. Preparation of Sequencing Materials

Dongnong 50, which exhibits sensitivity to SCN 3, was sown in black pots to facilitate the propagation of SCN 3. Thirty days after sowing, the intact root systems of the plants were carefully extracted and subsequently rinsed with tap water at a slow flow rate. SCN 3 was isolated using 60-mesh sieves, and the SCN 3 retained on the sieves was meticulously and gently ground by hand. The 40-mesh sieve was then thoroughly rinsed with distilled water, and the collected J4 eggs were transferred to 50 mL centrifuge tubes. After thorough mixing, a fraction of the cyst-containing liquid was retrieved. The J4 eggs were observed under a microscope to determine their quantity, and the solution was adjusted to a final concentration of 1800 J4 eggs per milliliter by appropriate dilution.
Dongnong L10 and Heinong 37 were, respectively, inoculated with SCN 3 to form the experimental groups, while those not inoculated with SCN 3 were set as the control groups. The indoor temperature was set at 25 °C, and the humidity was adjusted to 70%. At the V2 stage of the seedlings, 2 mL of the soybean SCN 3 J4 egg suspension was inoculated into each plant. The root tissues at 0 d and 14 d were collected and stained with acid fuchsin to ensure successful SCN 3 inoculation at 14 d. These root tissues were then used for preparing RNA-Seq sequencing samples.

2.3. RNA Extraction and cDNA Synthesis from Soybean Roots

The soybean variety Dongnong L10, which is resistant to the SCN, was planted in vermiculite. When the soybeans grew to the stage of the second pair of true leaves (V2 stage), the vermiculite on the soybean roots was thoroughly rinsed off with clean water, and then 1.5 g of the soybean roots were cut off by a surgical scalpel. RNA from soybean roots was extracted by using the TRIzol™ reagent (Thermo Fisher Scientific, Waltham, MA, USA). Use 2% agarose gel electrophoresis to detect the quality of the RNA.
RNA was reverse transcribed using the ReverTra Ace® qPCR RT Master Mix (TOYOBO, Osaka, Japan). (1) A total of 4 μL of RNA was heat-denatured at 65 °C for 5 min. After denaturation, it was quickly inserted into crushed ice. (2) Add 2 μL of 4 × DN Master Mix, 2 μL of ddH2O, and 4 μL of the denatured RNA. Remove DNA at 37 °C for 5 min and then take and place it into the denatured solution. (3) Take 2 μL of 5 × RT Master Mix II and add it into the denatured solution in Step 2. Incubate at 37 °C for 15 min, at 50 °C for 5 min, and at 98 °C for 5 min to form cDNA.

2.4. Transcriptome Sequencing and Analysis

In this study, transcriptome sequencing analysis was conducted using the Illumina HiSeq™ 2500 platform to examine the changes in gene expression levels related to synthesis and regulation between soybean varieties exhibiting extreme resistance and susceptibility to SCN. The analysis included both SCN-resistant (Dongnong L10) and SCN-susceptible (Heinong 37) soybean varieties, which were either infected with SCN or not infected.
The same quantity of root tissue from identical parts was collected from both the treatment group and the control group. Subsequently, the samples were rapidly frozen in liquid nitrogen and wrapped in aluminum foil. Total RNA was extracted using the TRNzol Universal kit (Thermo Fisher Scientific, Waltham, MA, USA). The cDNA library was constructed with the assistance of the Illumina TruSeq RNA library preparation kit (Illumina, San Diego, CA, USA), and RNA-Seq sequencing of the cDNA was conducted on the Illumina HiSeq™ 2500. The visualization analysis of transcriptome data can be performed using the DESeq2 R package in Rstudio software V2025.05.1+513.pro3. The up-regulated and down-regulated genes in the transcriptome were utilized to screen for candidate genes through fold change analysis of differential expression and KEGG enrichment analysis. Consequently, the candidate gene GmABI3VP1, which exhibited differential expression under SCN 3 stress and non-stress treatments, was identified.

2.5. Fluorescence Quantitative PCR

The PrimerQuest™ Tool (https://sg.idtdna.com/PrimerQuest/Home/Index accessed on 1 May 2025) was employed for the design of quantitative primers targeting the GmABI3VP1 candidate gene (see Table S7). The housekeeping gene selected for this study was GmActin4 (GenBank accession number: AF049106). The PCR instrument utilized was the Gene ROCGENE quantitative real-time PCR system (Kunpeng, Beijing, China), and the operating software used was Archimed X6 (ver. 201905v1.08, Microvision Instruments, Evry, Île-de-France, France). For specific procedures, experiments were conducted following the operational guidelines provided with the TaKaRa fluorescent quantitative reagent TB Green kit (TaKaRa, Shiga Prefecture, Japan). Relative expression levels were calculated using the 2−ΔΔCT method. CT values were determined by averaging three biological replicates.

2.6. Cloning of the GmABI3VP1 Gene

Cloning was performed using the cDNA extracted from the roots of Dongnong L10 as a template. A 20 μL reaction mixture was prepared, consisting of the following: 1 μL of cDNA, 10 μL of KOD One Plus (TOYOBO, Osaka, Japan), 1 μL of GmABI3VP1-F primer, 1 μL of GmABI3VP1-R primer (refer to Table S7), and 6 μL of ddH2O. The PCR program was configured as follows: initial denaturation at 98 °C for 3 min; followed by denaturation at 98 °C for 10 s; annealing at 58 °C; extension at 68 °C for 5 s; and a further extension step at 68 °C for an additional 10 min. The denaturation–extension cycles were repeated for a total of 38 cycles before storing the samples at 4 °C. The position of the target band was assessed through electrophoresis on a gel containing agarose at a concentration of 2%.

2.7. Bioinformatics Analysis of Tools

The signal peptide of the protein encoded by GmABI3VP1 was predicted using the website (https://novopro.cn/tools/signalp accessed on 1 May 2025). The hydrophilicity and hydrophobicity of the protein were analyzed by Novopro 3.0 (https://www.novopro.cn/tools/protein-hydrophilicity-plot.html accessed on 1 May 2025). The transmembrane domains of the protein were analyzed by TMHMM (https://www.novopro.cn/tools/tmhmm.html accessed on 1 May 2025). The secondary and tertiary structures of the protein were analyzed by SOPMA (https://npsa-prabi.ibcp.fr/cgi-bin/npsa_automat.pl?page=npsa%20_sopma.html accessed on 1 May 2025) and SWISS-MODEL (https://swissmodel.expasy.org/ accessed on 1 May 2025), respectively. The promoter elements were analyzed using the online website Plant CARE (https://bioinformatics.psb.ugent.be/webtools/plantcare/html/ accessed on 1 May 2025). Phosphorylation sites were analyzed using the online website NetPhos (https://services.healthtech.dtu.dk/services/NetPhos-3.1/ accessed on 1 May 2025). Download the genome files as well as the GFF3 annotation files of soybean and A. thaliana via Ensembl Plant (https://plants.ensembl.org/index.html accessed on 1 May 2025). Subsequently, perform a collinearity analysis between these two species using Tbtools II software (ver. 2.322, South China Agricultural University, Guangzhou, China). In regard to the collinearity analysis within the soybean species group, first retrieve the genome file and gene annotation file of soybean from Ensembl Plant, and then utilize Tbtools II to conduct the collinearity analysis within the soybean genome.

2.8. Analysis of the Subcellular Localization of GmABI3VP1

Prepare MS solid medium (Table S2) and pour tobacco seeds into a 1.5 mL sterile EP tube. Add 100 μL of sodium hypochlorite (NaClO) and 900 μL of sterile water. Shake in a vortex oscillator for 8 min, then let it stand still at 25 °C for 4 min. Wash it with 500 μL of sterilized water three times in a sterile operating platform. Use a pipette tip to plant the tobacco seeds in the MS solid medium and cultivate them for 10 d. Transfer the seedlings to black pots filled with a 1:1 mixture of vermiculite and nutrient soil. Conduct the subcellular localization experiment after the tobacco has grown for 28 d. Firstly, pretreat the tobacco. Place the tobacco in the dark for 24 h. Secondly, put the tobacco under normal light conditions 1 h before infection. Then, perform tobacco injection. For the Agrobacterium carrying pCAMBIA1302-GmABI3VP1 (adjust the tobacco resuspension to an OD600 value of 0.8), incubate it at a constant temperature for 5 h, then inject it into the abaxial side of tobacco leaves using a sterile syringe. After tobacco injection is completed, place the plants in a dark environment for 12 h, then expose them to light for 24 h. Finally, observe and take pictures under an inverted fluorescence microscope.

2.9. Over-Expression, Gene Editing and Homologous Recombination

The plasmid was linearized by single enzyme digestion. The pCAMBIA3300 vector was linearized with Hind III enzyme (Biolabs New England Biolabs #R3104, Ipswich, MA, USA), the pCAMBIA1302 vector was linearized with Nco Ι enzyme (Biolabs New England Biolabs #R3193, Ipswich, MA, USA), and the pYLCRISPR/Cas9 vector was linearized with Bas I enzyme (Biolabs New England Biolabs #R3733, Ipswich, MA, USA). The PCR program was set as follows: incubation at 37 °C for 5 h, then at 65 °C for 25 min, and, finally, storage at 12 °C. The enzyme digestion system had a total volume of 20 μL, which consisted of 2 μL of Hind III enzyme, 4 μL of enzyme buffer, 10 μL of plasmid (150 ng/μL), and 4 μL of ddH2O.
Use the ClonExpress II One Step Cloning Kit (VAZYME, Nanjing, China) to perform homologous recombination ligation between the cloned DNA and the linearized pCAMBIA3300 and pCAMBIA1302, respectively. The homologous recombination system had a total volume of 20 μL, which consisted of 2 μL of homologous recombination enzyme, 4 μL of buffer, 3.5 μL of the linearized pCAMBIA3300 vector, 1.5 μL of the target fragment, and 9 μL of water. Place it in a water bath at 37 °C, 30 min (Tables S4 and S5).
Construction of the gene editing vector; for Reaction 1, specific amplification was carried out (including 1 round-3d, 1 round-3b). Based on Reaction 1, Reaction 2 was performed for the second specific PCR amplification (2 rounds-3d, 2 rounds-3b). After the gel purification of the products from the 2 rounds of amplification, they were recombined with the pYLCRISPR/Cas9 vector.
The pCAMBIA3300 and pCAMBIA1302 plasmids were linearized by the method of single enzyme digestion. The results showed that lanes 1–4 carried the flanking target sequences of the pCAMBIA3300 plasmid, and lanes 5–7 carried the flanking target sequences of the pCAMBIA1302 plasmid. After single enzyme digestion, there was a certain electrophoresis distance between the linearized vectors and the plasmids, indicating that the enzyme digestion was complete (Figure S4C,D). The coding sequence of the target gene was cloned using specific primers. The results demonstrated that an obvious band appeared at 1236 bp (Figure S4E). The linearized gel products and the target gene gel products were ligated using the ClonExpress II One Step Cloning Kit and then transformed into DH5α. PCR specific amplification was carried out (Figure S4I), followed by sequencing analysis. The sequencing results indicated that the target gene sequence was successfully recombined into DH5α.

2.10. Agrobacterium-Mediated Hairy Root Transformation

The recipient used Dongnong 50 for the creation of both gene-edited (KO) hairy roots and overexpressed (OX) hairy roots. Soybean Dongnong 50, which is sensitive to SCN 3, was planted in black pots filled with vermiculite. When the soybeans grew to the bud stage (VE stage), the main roots of the soybeans were obliquely cut and then were transferred into Agrobacterium K599 containing the plasmid (7.5 μL of 1M As, and 1 mL of 500 mM MgCl2 with an OD600 value ranging from 0.6 to 0.8). The mixture was placed in a shaker at 28 °C with a rotation speed of 50 rpm/min for 30 min. After that, the soybeans were taken out from the shaker and subjected to vacuum treatment using a vacuum pump. The pressure was set at 5–10 kPa, and the vacuum treatment lasted for 1 min. Then, they were left to stand still for 30 s. This process was repeated three times. For the control group, the soybeans were soaked in distilled water, and the operation process was the same as that of the Agrobacterium-mediated hairy root transformation method. The soybean seedlings in the bacterial solution were reinserted into the vermiculite and were cultured under 80% humidity at 25–28 °C until they reached the second trifoliate leaf stage (V2 stage) for the subsequent identification of SCN.

2.11. Identification of the Disease Phenotype of SCN

The soybeans were extracted from the vermiculite, thoroughly washed with water, and a portion of their root tissues were harvested. Subsequently, both the transgenic plants for validation and the control group plants were transferred into soil inoculated with SCN 3. They were cultured at 25 °C with a soil humidity of 40%. After 14 d, the roots were removed from the infected soil and rinsed extensively with clean water. The identification of SCN 3 in the root tissues of soybeans was conducted using the acid fuchsin staining method. The operational steps are as follows: Firstly, the roots were decolorized by soaking them in a solution of 5% sodium hypochlorite for 80 min. Following this step, they were washed by soaking in double-distilled water (ddH2O) for an additional 15 min. Next, a working solution of acid fuchsin (1× concentration; Table S1) was prepared and heated in an induction cooker until boiling for approximately 60 s to firm up the roots. Afterward, the roots were carefully removed from the induction cooker and dried gently using clean paper towels. Finally, for microscopic examination, soybean roots were evenly spread on a transparent plastic pressing plate. The number of SCN present was observed and counted under a stereomicroscope at a magnification of ×20.

2.12. Measurement of the Indices Related to the Resistance of Roots to Stress Caused by SCN

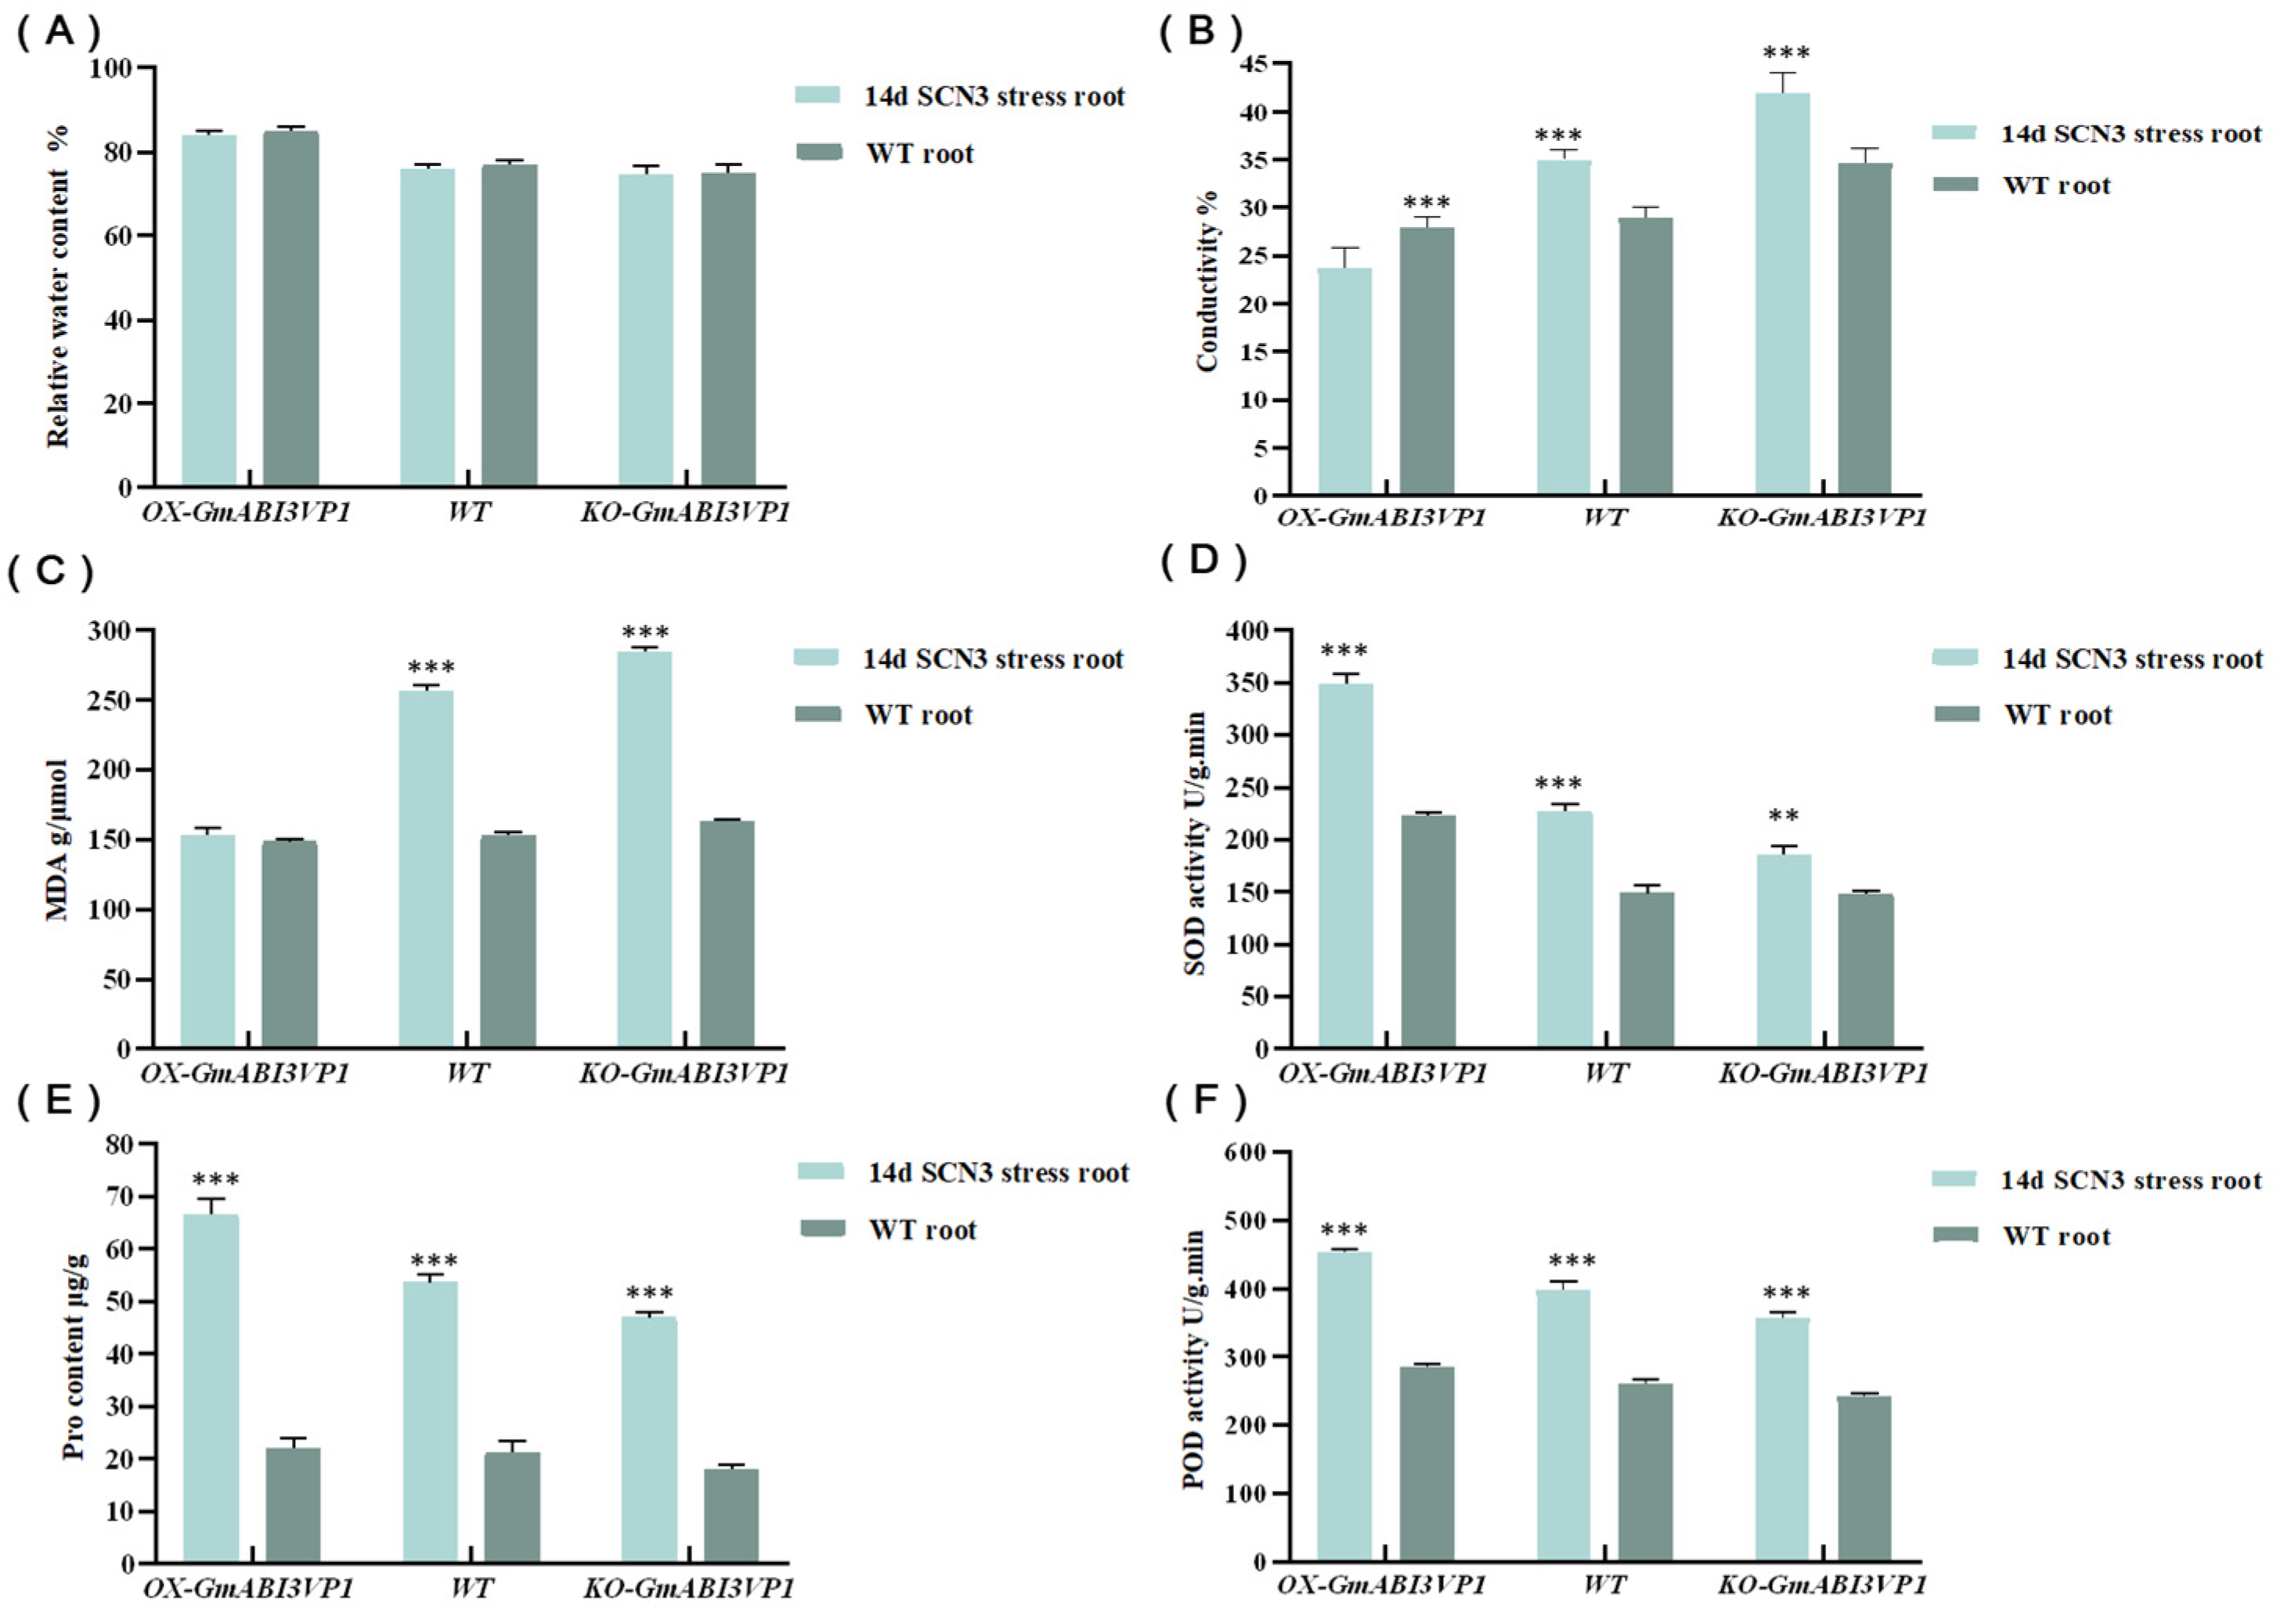
In this study, roots of transgenic plants stressed by SCN 3 for 14 d and WT plants were rinsed with water. Then, equal-mass lateral roots were selected to measure Peroxidase (POD) and superoxide dismutase (SOD) activities, malondialdehyde (MDA) content, relative water content (RWC), electrical conductivity (EC), and proline synthetase (Pro) activity. The specific determination method was carried out according to the instructions in the manual [27].

3. Results

3.1. RNA Quality Assessment of Soybean Roots

The results showed that the concentration and purity of RNA were measured by Nano Drop One/One C, and the integrity of RNA was detected by agarose gel electrophoresis. With an OD260/280 ratio of 2.0, high-quality and intact RNA samples were obtained. The results of 2% agarose gel electrophoresis indicated that the electrophoresis bands were clear without obvious smearing, and the brightness ratio of the 28 S rRNA and 18 S rRNA bands was close to 2:1, suggesting that the RNA had good integrity (Figure S4A) and could be used for subsequent reverse transcription. The concentration of cDNA measured by NanoDrop One/One C was good, and it could be used for the subsequent gene cloning and RNA sequence.

3.2. Transcriptome Sequencing Results and Analysis

Data quality control was carried out on 12 sequenced samples. After filtering, the Q30 ratio ranged from 94.38% to 95.32%, and the GC content after filtering was between 41.75% and 44.15% (Table S3). It was indicated by the results that the base recognition was accurate and could be used for subsequent analysis.
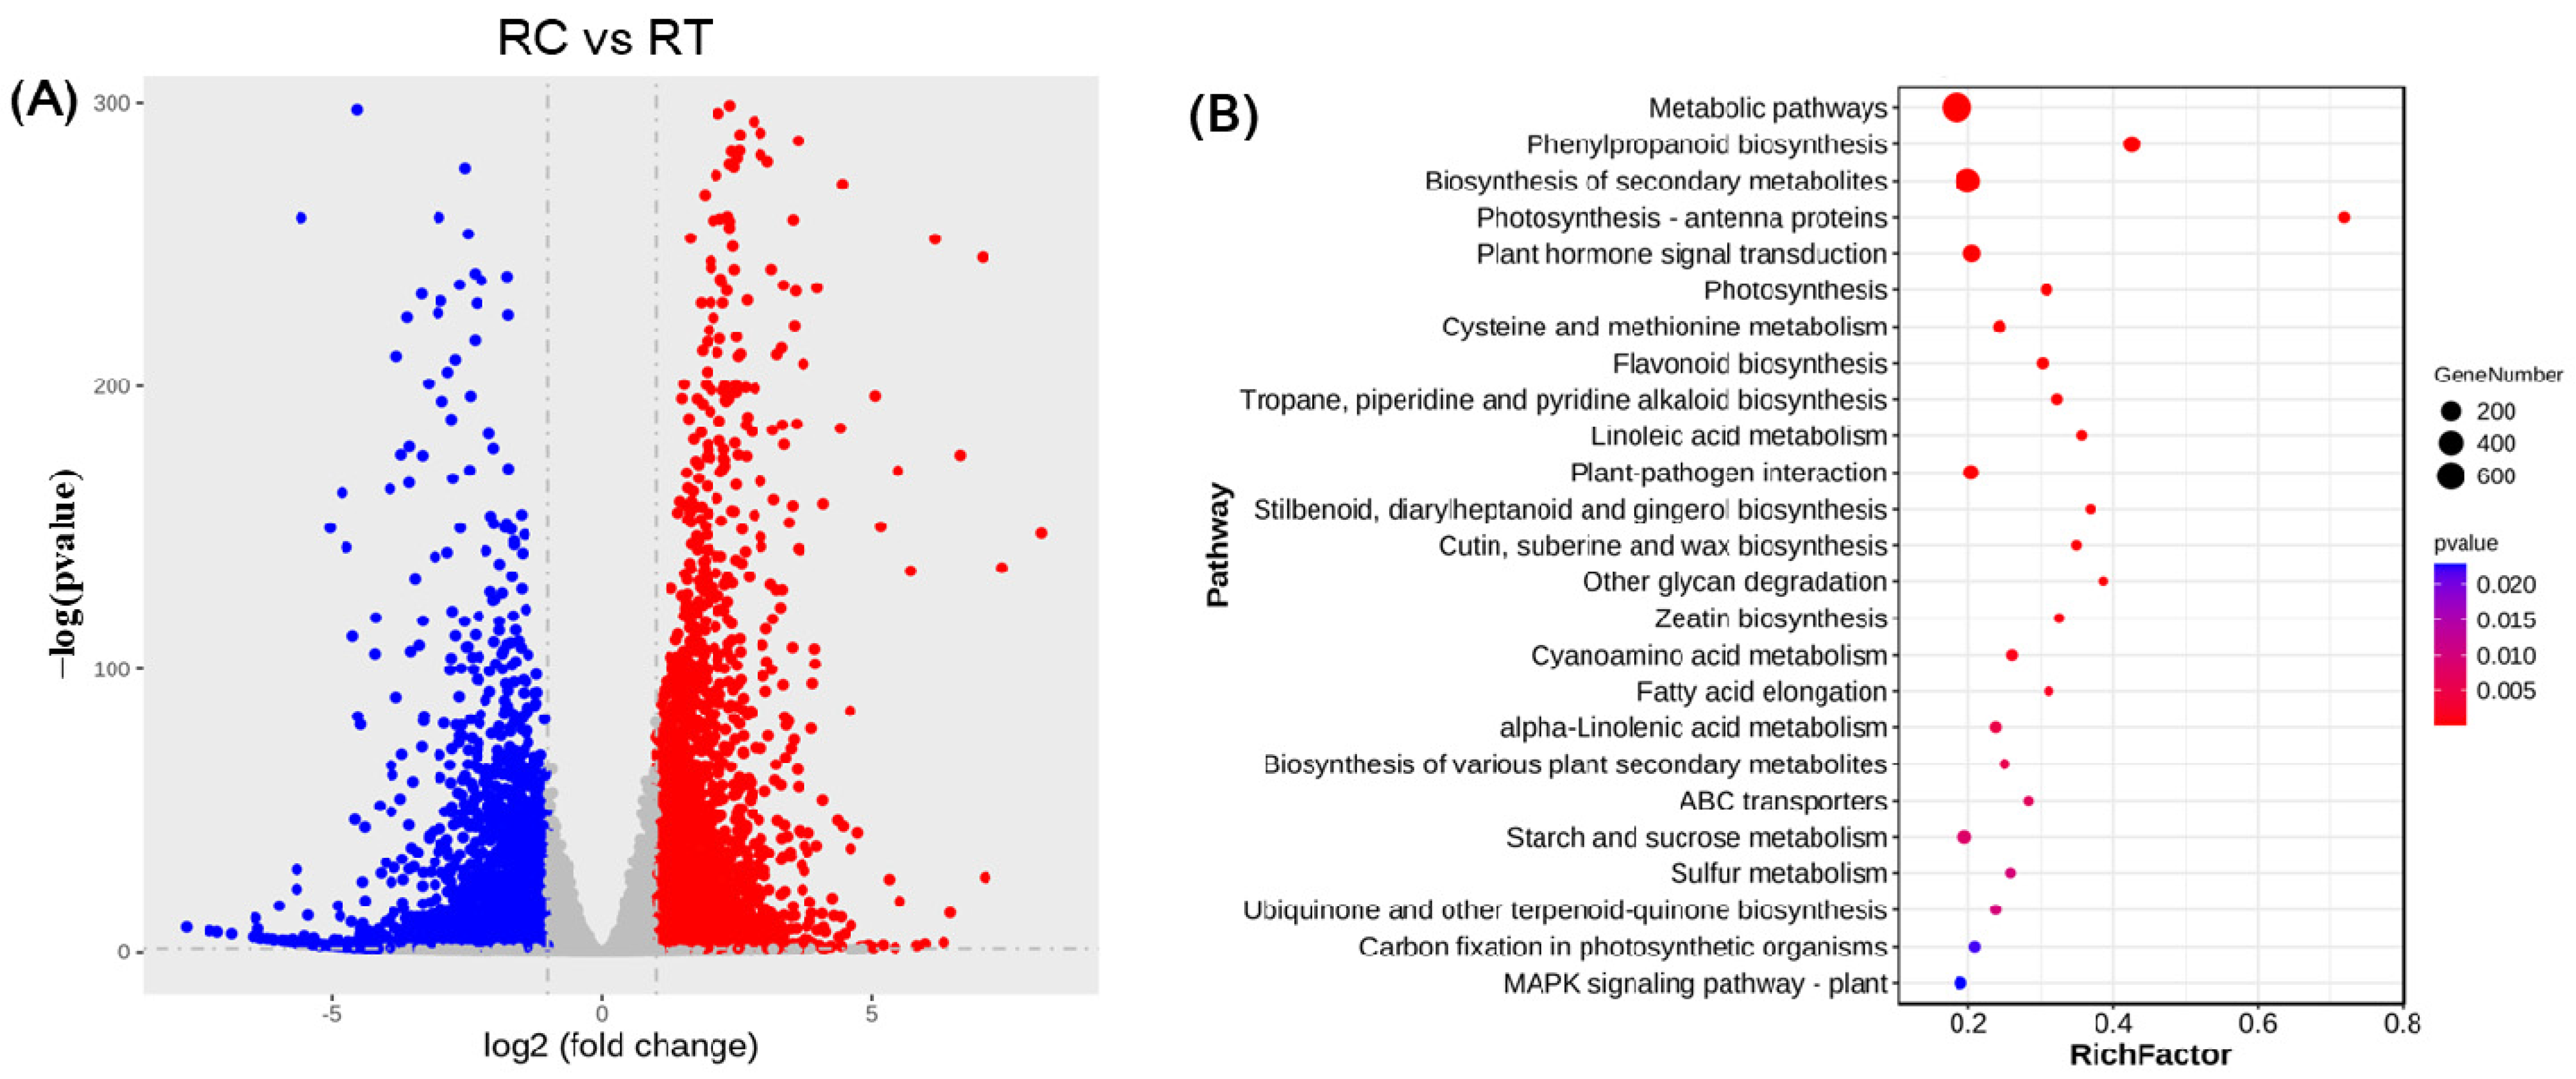
The sequencing data obtained were aligned with the soybean reference genome (Glycine max Wm82.a2.v1) by using the HISAT2 software V2.2.1. It was found that among the 12 sequenced samples, the mapped rate coverage ranged from 82.48% to 91.82% (Table S6), and a high coverage was shown. It was demonstrated by the results that the sequencing results were reliable and could be further analyzed. The differentially expressed genes were visualized by using volcano plots (Figure 1A). The thresholds of |log2(Fold change)| > 1 and adjusted p value < 0.05 for screening the fold change in differences; among them, 4185 up-regulated genes and 3195 down-regulated genes were identified.
The screened genes were analyzed by KEGG (Figure 1B). In total, 1127 differentially expressed genes were found to be enriched in KEGG pathways, including metabolic pathways, Phenylpropanoid biosynthesis, biosynthesis of secondary metabolites, and many other pathways. In addition, differentially expressed genes were also significantly enriched in the plant hormone signal transduction pathway, Flavonoid biosynthesis pathway, and MAPK signaling pathway–plant. It appears from the research findings that when soybeans are affected by SCN, the resistance genes within them may exhibit a relatively obvious upward regulation trend and could be involved in various biological metabolic processes. Eventually, candidate genes with large fold changes in differential expression were selected for the research on subsequent genes.

3.3. qRT-PCR Analysis

It was shown by the results that a relative expression level of the GmABI3VP1 gene existed in the soybean roots. When compared with the non-stressed Dongnong 50 soybeans, the GmABI3VP1 gene in the Dongnong 50 soybeans under SCN 3 stress treatment was found to be up-regulated in expression. The average relative expression level in the root tissues of Dongnong 50 under SCN 3 stress treatment was 2.064, while that in the non-stressed ones was 0.509. For SN 14, the average relative expression level in the root tissues under SCN 3 stress treatment was 3.495, while that in the non-stressed ones was 0.481. As for Dongnong L10, the average relative expression level in the root tissues under SCN 3 stress treatment was 8.520, while that in the non-stressed ones was 1.927. Regarding Y16, the average relative expression level in the root tissues under SCN 3 stress treatment was 7.491, while that in the non-stressed ones was 2.243. Under SCN 3 stress, when compared with the non-stressed soybean roots, the GmABI3VP1 gene in the root parts under SCN 3 stress treatment was observed to be significantly up-regulated. Moreover, the up-regulation of the relative expression level in the disease-resistant germplasms was noticed to be more significant than that in the disease-susceptible germplasms under SCN 3 stress (Figure 2A). The qRT-PCR results for SCN stress in soybean roots, stems, and leaves showed that the relative expression level was highest in the disease-resistant Dongnong L10 variety, with an average of 8.33, while the average relative expression level in the disease-resistant Y16 variety was 7.3 (Figure 2B). In the gene expression analysis, the relative expression level in the root system was 8.336, consistent with the experimental results (Figure 2C). It was proved that the GmABI3VP1 gene could respond to the stress response under SCN 3 stress, and it was considered that this gene might be involved in the response after SCN stress. In summary, through qRT-PCR validation of two disease-resistant materials (Dongnong L10, Y16) and two susceptible materials (Suinong 14, Dongnong 50) subjected to SCN 3 stress, it was observed that during the peak stage of SCN 3 infestation in root systems (J2 stage), the relative expression level of the GmABI3VP1 gene in disease-resistant varieties was extremely significantly higher than that in susceptible ones. Thus, this gene is regarded as a potential candidate gene to be prioritized for further validation.
The gene expression levels of OX-GmABI3VP1 and KO-GmABI3VP1 hairy roots of soybean under SCN 3 stress were analyzed using quantitative reverse transcription polymerase chain reaction (qRT-PCR). The results indicated that the relative expression level of the GmABI3VP1 gene in wild-type (WT) was approximately 1.0, while it was about 3.7 in overexpression (OX) hairy roots and around 0.4 in gene-edited (KO) hairy roots. This gene showed a significant upregulation trend after overexpression. The overexpression mutant exhibited upregulation due to the inserted overexpression cassette and was involved in regulating the response of soybean-to-soybean cyst nematode (SCN) disease.

3.4. Vector Construction for Over-Expression and Gene Editing

The results of the construction of the gene editing vector showed that in the first round of specific PCR amplification, obvious electrophoresis bands of 3d DNA were observed to appear near 250–500 bp and those of 3b DNA were observed to appear near 140 bp in gel electrophoresis (Figure S4F). Based on the first round of PCR, the second round of specific PCR amplification was conducted. It was indicated by the electrophoresis results that an obvious electrophoresis band was observed to appear near 500 bp (Figure S4G). The purified products of the second round of specific PCR and the Bas I linearized pYLCRISPR/Cas9 (Figure S4B) were connected by using the ClonExpress II One Step Cloning Kit and then were transformed into DH5α. Sequencing analysis was carried out, and it was shown by the sequencing results that the target gene sequence was successfully recombined into DH5α (Figure S4H). The correct recombinant plasmids, pCAMBIA3300-GmABI3VP1 and pYLCRISPR/Cas9-GmABI3VP1, were transformed into Agrobacterium tumefaciens K599.

3.5. Bioinformatics Analysis of GmABI3VP1

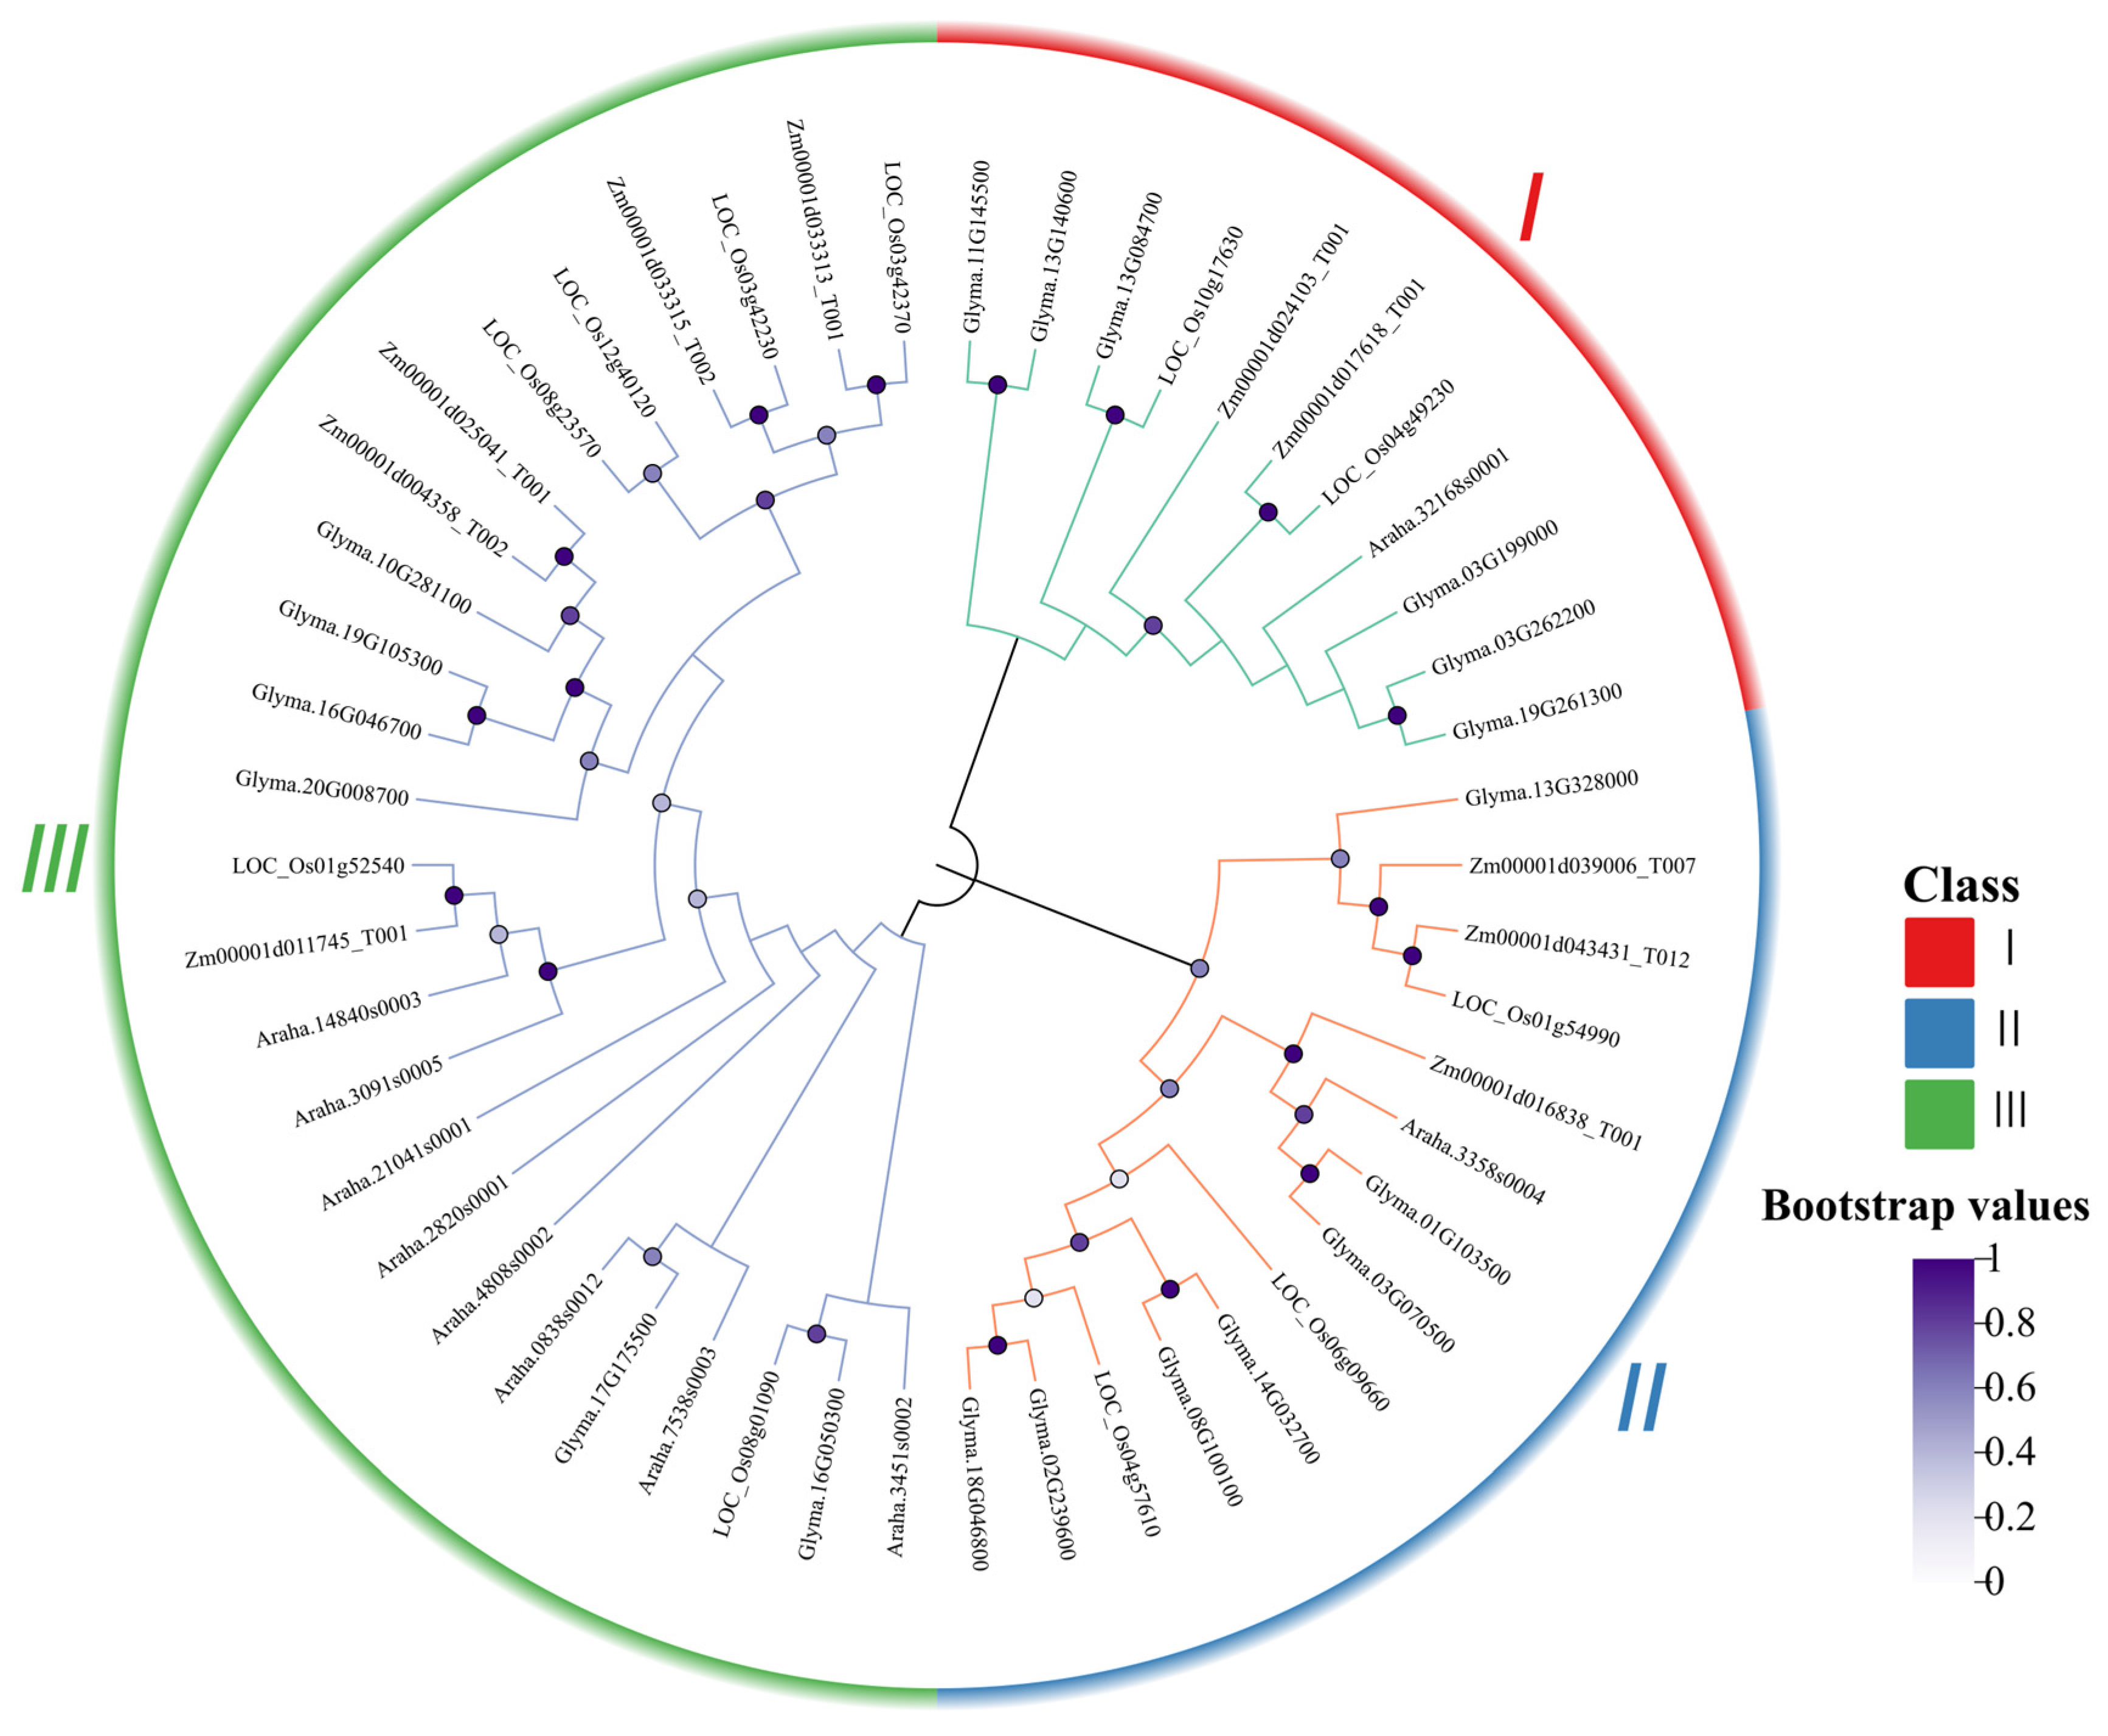
The bioinformatics results indicated that, in terms of the physicochemical properties of the protein encoded by GmABI3VP1, 421 amino acids were encoded. Its molecular weight was calculated to be 103.45 Ku, the isoelectric point (PI) of the amino acids was determined as 5.02, and its chemical formula was identified as C3757H6253N1263O1561S292, with the aliphatic index being 27.32. It was found that this protein had no signal peptide and was classified as a non-secretory protein (Figure S5A). Through the hydrophilicity analysis, it was observed that the protein was generally a hydrophilic one (Figure S5B). In the analysis of whether the protein was involved in transmembrane transport, it was noticed that the encoded protein at 0–200 bp might be involved, as was shown (Figure S5C). Regarding the secondary conformation of the protein, it was demonstrated that there were three spatial configurations (Figure S5D), namely α-helix (9.29%), random coil (77.52%), and extended strand (11.19%) and (3.14%). Among them, the random coil accounted for the largest proportion. There were 36 potential phosphorylation sites in the protein (Figure S5E), including 7 threonine (Thr) sites, 27 serine (Ser) sites, and 2 tyrosine (Tyr) sites. It was shown that the tertiary conformation of the protein was highly consistent with the secondary conformation, and when compared with the homologous gene in A. thaliana, a similarity as high as 92.54% was obtained (Figure S5F). Collinearity analysis was conducted on the GmABI3VP1 gene within and between groups. The results indicated that there was collinearity for the GmABI3VP1 gene between soybean and A. thaliana. For the between-group analysis, Chromosome 3 of soybean exhibited a collinear relationship with Chromosomes 1, 2, and 3 of A. thaliana (Figure S2). For the within-group analysis, Chromosome 3 of soybean exhibited a collinear relationship with Chromosomes 7, 16, and 19 (Figure S3). The results of the promoter element analysis were presented as follows: multiple elements responsive to hormonal substances were found (Figure S1), such as abscisic acid-responsive elements like ABRE/ABRE3a/ABRE4a, anaerobic induction elements like ARE, and elements related to environmental stress response such as Myb, MYC, and MYc, as well as cis-acting elements for salicylic acid like as-1. Phylogenetic tree analysis showed that the gene was divided into three branches, I–III (Figure 3). The gene had the highest homology with soybean Glyma.19G261300 (Supplementary S1). It was inferred that the GmABI3VP1 gene was closely related to biotic and abiotic stresses, and it was speculated that this gene might be involved in the SCN stress response.

3.6. Subcellular Localization Analysis of GmABI3VP1

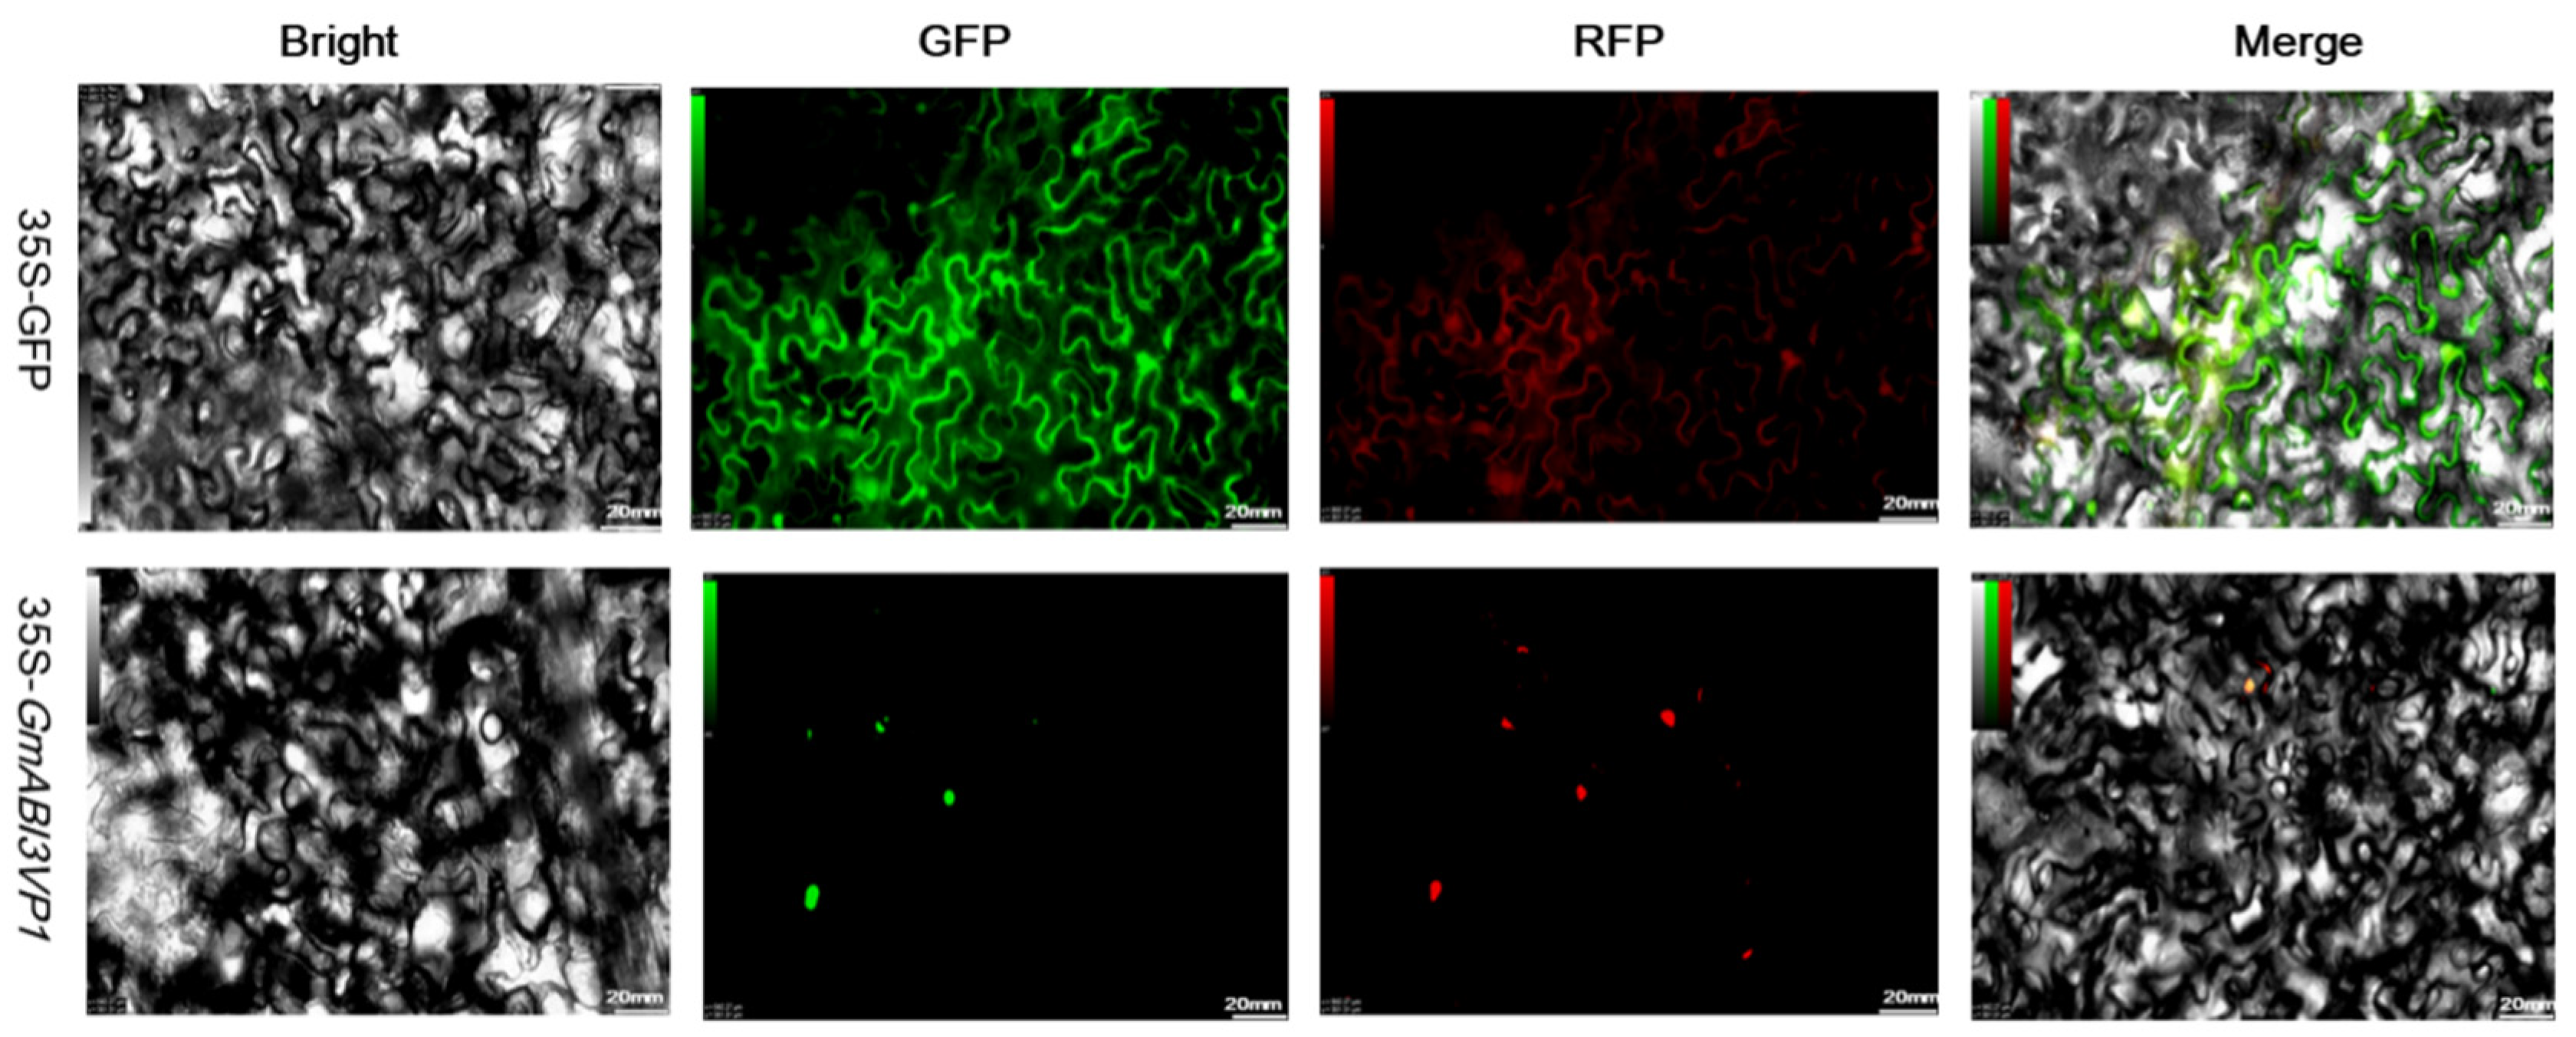
The distribution of the GFP (Green fluorescent tag) protein in plants was observed under a confocal laser scanning microscope (Figure 4). The results showed that in the tobacco-containing pCAMBIA1302-GFP in the control group, green fluorescence was present in both the nuclear envelope and the cytoplasm, demonstrating that there was certain expression in the cell membrane, cytoplasm, and nucleus. In the case of pCAMBIA1302-GmABI3VP1, the brightest fluorescence was observed in the nucleus of tobacco, indicating that the protein encoded by GmABI3VP1 was mainly expressed in the nucleus and belonged to a nuclear-localized protein. The experimental results were highly consistent with those predicted by bioinformatics.

3.7. Agrobacterium Transformation and SCN Disease Identification and Analysis

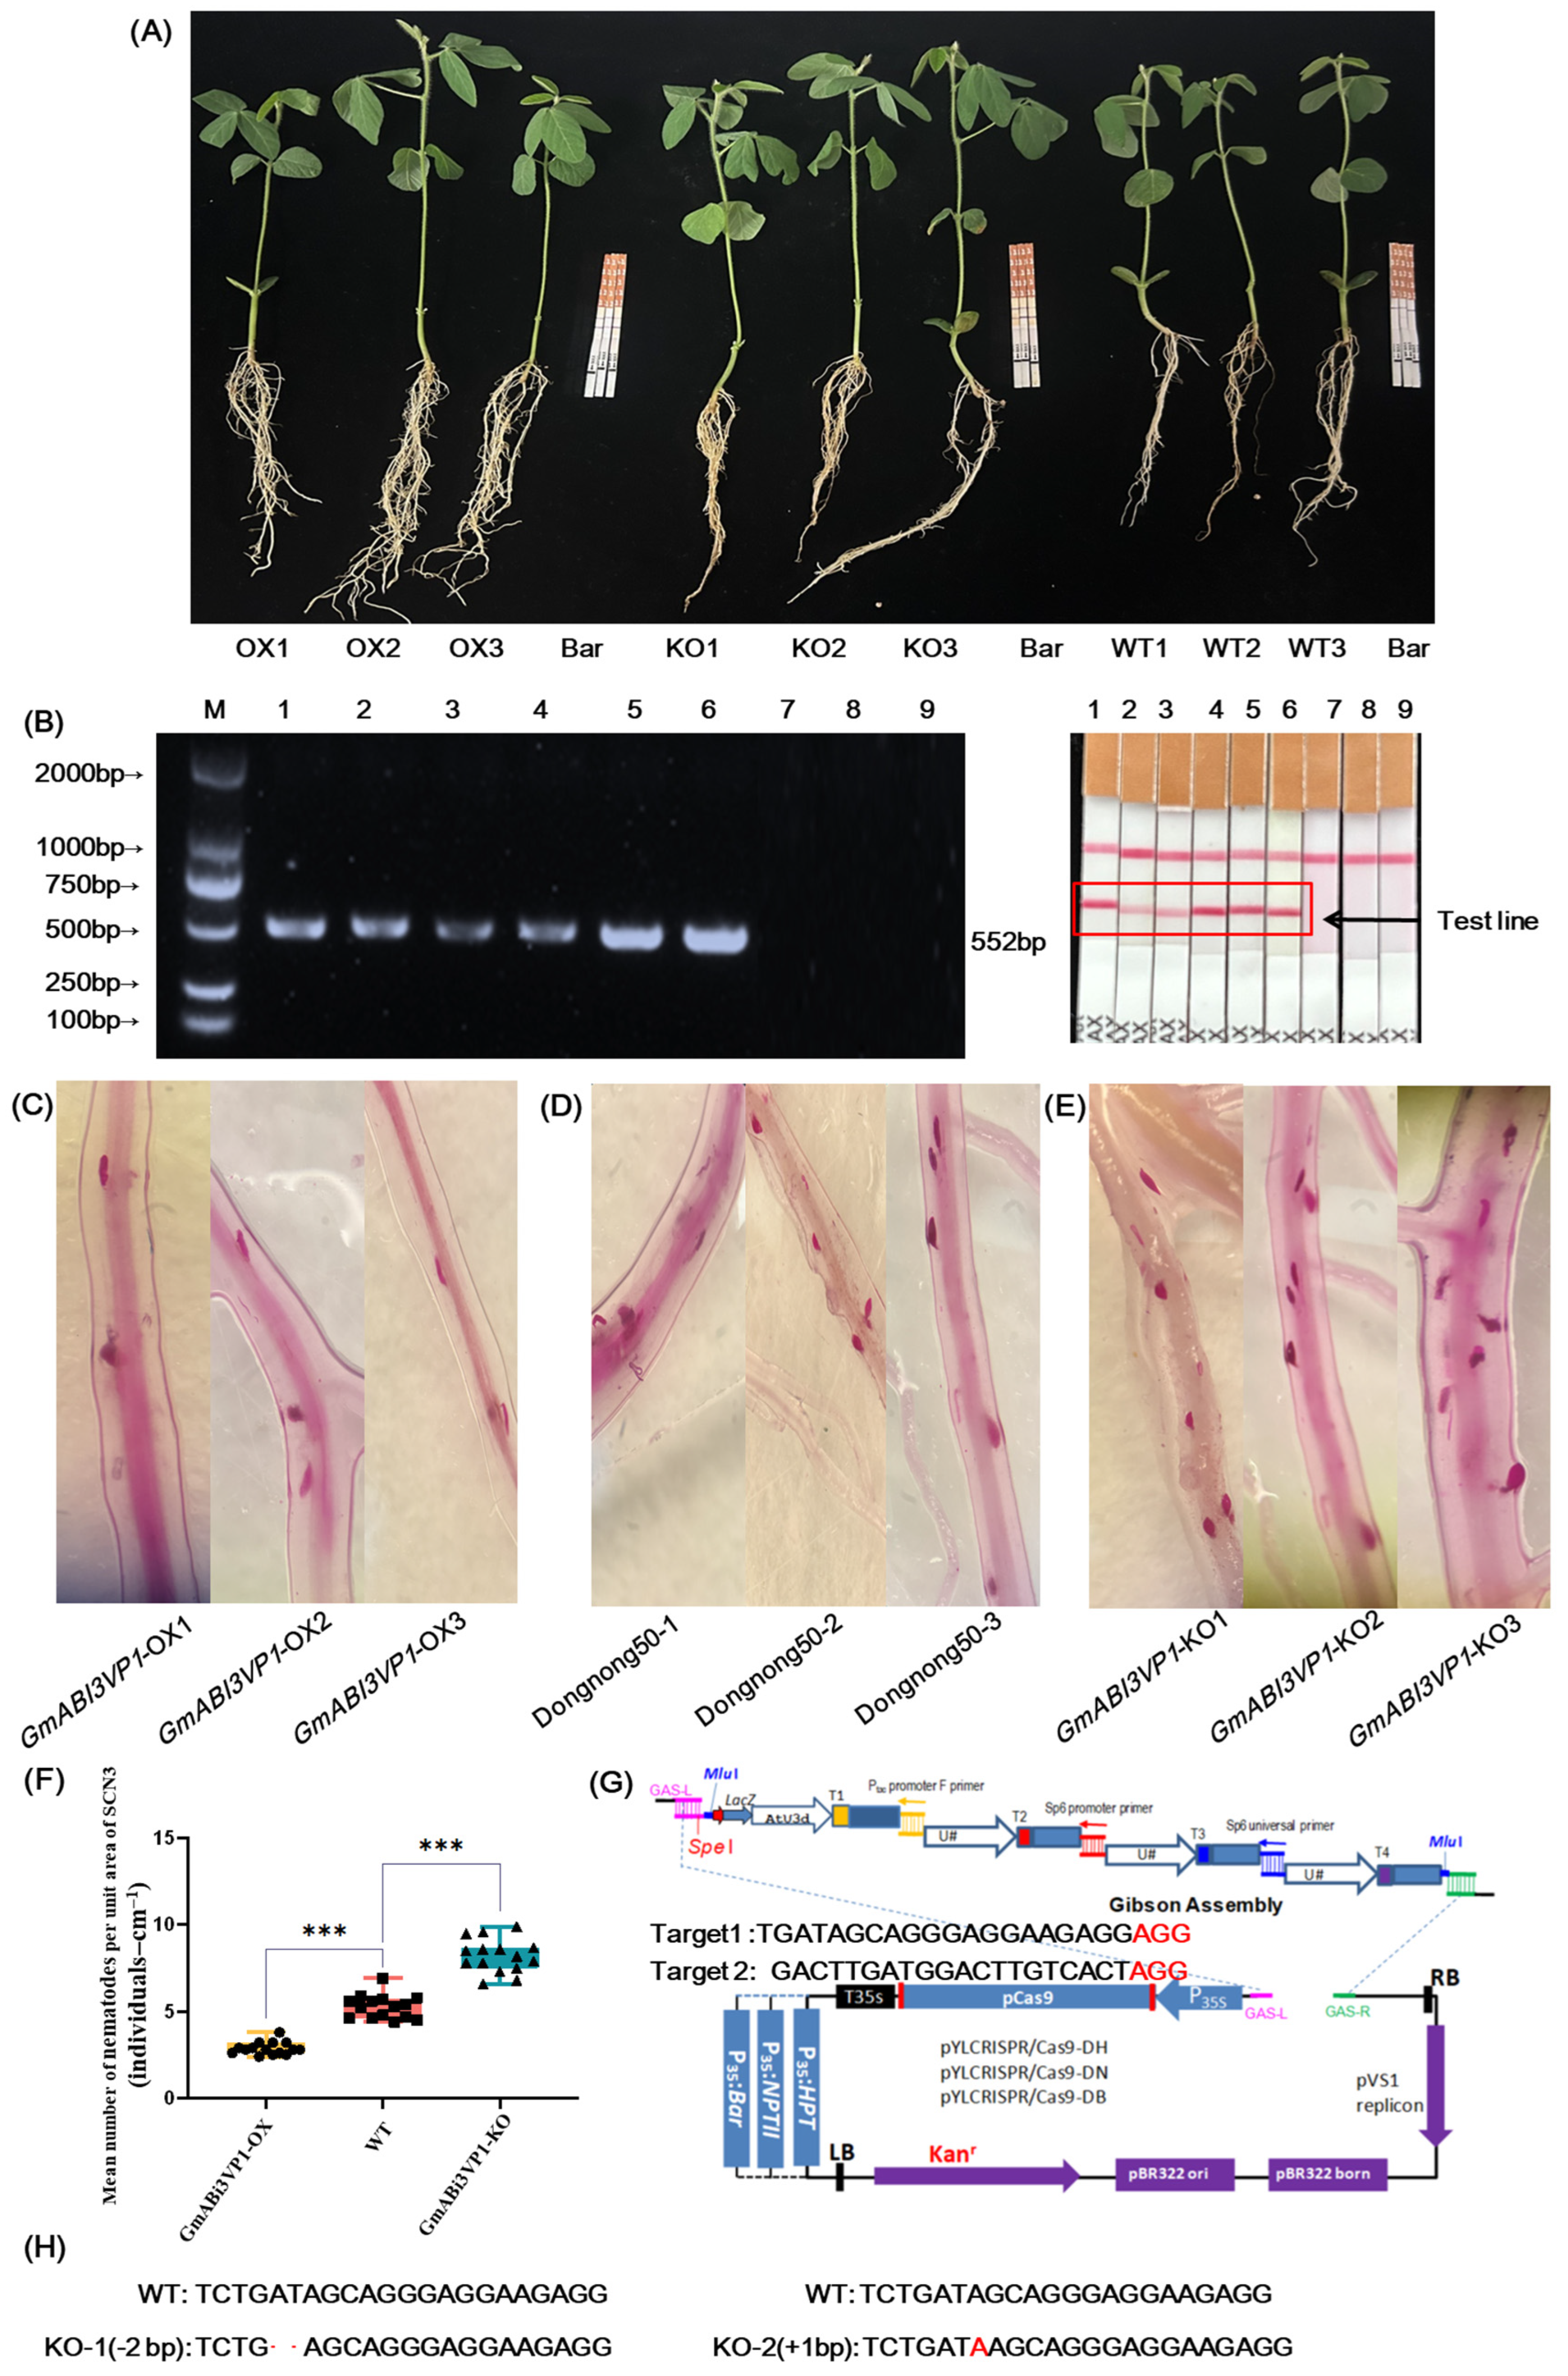
The DNA of soybean roots was detected for transgenic hairy roots by using specific PCR amplification and PAT/bar EPSPS LFD Strips (Figure 5A).The results showed that for the roots of OX1–OX3, the electrophoresis bands of the BAR gene amplified specifically from the root DNA appeared near 552 bp, and the BAR test strips for the root tissue samples showed positive results, indicating that pCAMBIA3300-GmABI3VP1 had been successfully transformed into the roots of soybeans. For the roots of KO1-KO3, the electrophoresis bands of the BAR gene amplified specifically from the root DNA also appeared near 552 bp, and the PAT/bar EPSPS LFD Strips (LS) for the root tissue samples showed positive results, meaning that pYLCRISPR/Cas9-GmABI3VP1 had been successfully transformed into the roots of soybeans (Figure 5B). The PAT/bar EPSPS LFD Strips (LS) for the root tissue samples of WT1-WT3 showed negative results.
The roots of OX1-OX3, KO1-KO3, and WT1-WT3 were planted in the soil infected with SCN 3. Meanwhile, in order to increase the number of SCN 3 per unit area (per cm of lateral root length), SCN 3 J4 eggs (100) were sown around the roots of each plant. After 14 d later, the results of acid fuchsin staining identification showed that the average number of nematodes per unit area in the OX lines was 2.86, the average number of SCN per unit area in the KO lines was 8.22, and the number of SCN 3 per unit area in the WT was 5.26. The SPSS V25.0 software was used to conduct statistical analysis on the data. It was found that there was an extremely significant difference between the OX lines and the WT lines, and also between the KO lines and the WT lines. The results proved that the OX-GmABI3VP1 gene had the function of inhibiting SCN 3. Graphd Prism 9 was used to conduct statistical analysis on the data regarding the average number distribution of SCN in the roots of OX, WT, and KO in the Dongnong 50 genetic background. The gene-edited hairy roots exhibited an AT base deletion and an A base insertion, which resulted in subsequent amino acid disorder, and successfully obtained gene-edited hairy roots (Figure 5H). The results indicated that the number of SCN per unit area presented a normal distribution, and the differences in the number of SCN 3 between OX and WT as well as between KO and WT were extremely significant (Figure 5C–F).
The SPSS V25.0 software was used to conduct a T-test difference analysis on the number of SCN 3 per unit area in the GmABI3VP1 overexpressed roots treated with SCN 3, the number of SCN 3 per unit area in the roots edited by trans-pYLCRISPR/Cas9-GmABI3VP1, and the number of SCN 3 per unit area in the WT roots. The results showed that among the three groups of data, the averages of WT, KO, and OX were 5.26, 8.22, and 2.86, respectively; the standard deviations of OX-WT and OX-KO were 0.32 and 0.75, respectively; the p-values (two-tailed) of the means of OX-WT and OX-KO were 6.1998 × 10⁻⁹ and 2.2641 × 10⁻⁷, respectively. The results indicated that there was an extremely significant difference in the average number of SCN 3 per unit area between the OX group and the WT group, and there was also an extremely significant difference in the average number of SCN 3 per unit area between the KO group and the WT group. It suggested that GmABI3VP1 might play a positive regulatory function and participate in regulating the resistance of soybeans to SCN (Table 1).

3.8. Root Physiological and Biochemical Indicator Identification

After 14 d of being stressed by SCN 3, in the roots of both the over-expression (OX) group and the wild-type (WT) group, the plants in the OX group were found to have a more vigorous growth trend compared to those in the WT group. The plants in the WT group were shown to have a more vigorous growth trend than those in the knockout (KO) group (Figure 6A–F). In terms of relative water content, the over-expression group was observed to have a higher water content than the WT and KO groups. After being stressed by SCN, regarding relative electrical conductivity, POD activity, and SOD activity, a trend was presented where the values were in the order of the OX group > the WT group > the KO group. After being stressed by SCN, a trend was shown in the content of MDA, with the order being the OX group < the WT group < the KO group. When not stressed by SCN, no obvious changes were detected in the physiological and biochemical indexes. The data suggest that the GmABI3VP1 gene is considered to be involved in the stress response to SCN, and a positive regulatory function is played by it, which can significantly improve the stress resistance of plants.

4. Discussion

Currently, most of the research mainly focuses on genes near the major resistance loci, Rgh1 and Rgh4. However, Rgh1 and Rgh4 can only account for 60% of the genetic variation, and a large portion remains to be further explored and developed. Thus, how to identify and discover new genes resistant to SCN disease has become of paramount importance.
ABI3/VP1 was initially detected as being part of the seed-specific transcription factors and was utilized as an intermediary in the regulation of ABA-responsive genes throughout the seed development stage. Nowadays, it is acknowledged to play a role beyond the scope of seed physiology, particularly when non-biological stress occurs. Currently, in the numerous literature, it has been frequently documented that under adverse situations like drought, dehydration, temperature variations and salt-alkali stress, the functions of ABI3/VP1 proteins are activated and engaged. The drought resistance of plants and the photosynthetic efficiency can be enhanced and improved simultaneously when the AtABI3 gene in A. thaliana is overexpressed in cotton (Gossypium spp.) [28]. The growth and differentiation of poplar (Populus) plumule leaves can be affected by the overexpression of the PtABI3 gene [29]. Through next-generation sequencing of the ABI3 deletion mutants and wild type, it was indicated in the degradome analysis that the ABI3 gene might be regulated by the plant-specific miR536, with desiccation tolerance being potentially affected [30]. In Brassica napus L., the seeds can be made to have higher desiccation tolerance under dehydration stress by BnABI3 through the regulation of seed-coat development so as to adapt to the stressful environment [31]. In Brassica napus, it was found that the plant’s cold tolerance system could be triggered by the excessive accumulation of ABI3 in seeds and pods, and the decomposition of chlorophyll could be effectively promoted by plant embryos and pods even when they were exposed to frost, and the economic value of oil crops could be ensured to a certain extent [32]. The salt tolerance of the loss-of-function mutants of the A. thaliana transcription factor DIV2-encoding gene AtDIV2 was improved, the sensitivity to exogenous ABA was enhanced, and the ABA content was significantly increased. In the DIV2 mutants, the transcriptional levels of ABA-related genes and stress-related genes such as ABA1, ABI3, and P5CS2 were all up-regulated. It was indicated that the activity of ABI3 might be appropriately regulated by AtDIV2 in wild-type plants to participate in the salt stress response [33,34].
Although the responsive reactions of the ABI3 gene can be observed under various adverse stress conditions, there have been no relevant reports regarding its role in SCN disease to date. The potential function of this target gene in SCN disease requires further exploration, and ongoing efforts should be made to identify and investigate new genes that confer resistance to SCN disease. Dongnong 50 does not contain the rhg1 and Rhg4 loci, while Dongnong L10 contains both the rhg1 and rhg4 loci. Further research and exploration are still needed on the GmABI3VP1 gene. Currently, whether allelic genotypes exist in the GmABI3VP1 promoter remains to be further investigated, and it is also necessary to explore whether upstream effector factors regulate the GmABI3VP1 protein.
Current management of soybean cyst nematode (SCN) resistance predominantly relies on genes such as Rhg1 and Rhg4, which account for only 60% of the observed genetic variation [35]. Our study identifies GmABI3VP1 as a novel contributor to SCN resistance, thereby expanding the genetic toolkit available for breeding efforts. The association of the gene with various stress-responsive pathways, including plant hormone signaling and MAPK pathways, indicates that it may interact with existing resistance loci to synergistically enhance defense mechanisms. Future research should explore its interplay with Rhg1 and Rhg4, as well as its role in resisting other SCN physiological races, to validate its broad applicability. While our results highlight GmABI3VP1′s role in SCN 3 resistance, several questions remain. The downstream target genes of GmABI3VP1 in the SCN response pathway require identification, as do the specific molecular mechanisms by which it regulates antioxidant enzyme activity and stress signaling. Additionally, validating its function in stable transgenic soybean lines and under field conditions will be critical for translational applications. Finally, investigating its role in cross-resistance to other pathogens or abiotic stresses could further broaden its utility. In conclusion, GmABI3VP1 emerges as a key regulator of soybean resistance to SCN 3, acting through transcriptional modulation and physiological adaptation. Its characterization provides a foundation for developing SCN-resistant soybean varieties and deepens our understanding of plant-nematode interactions.
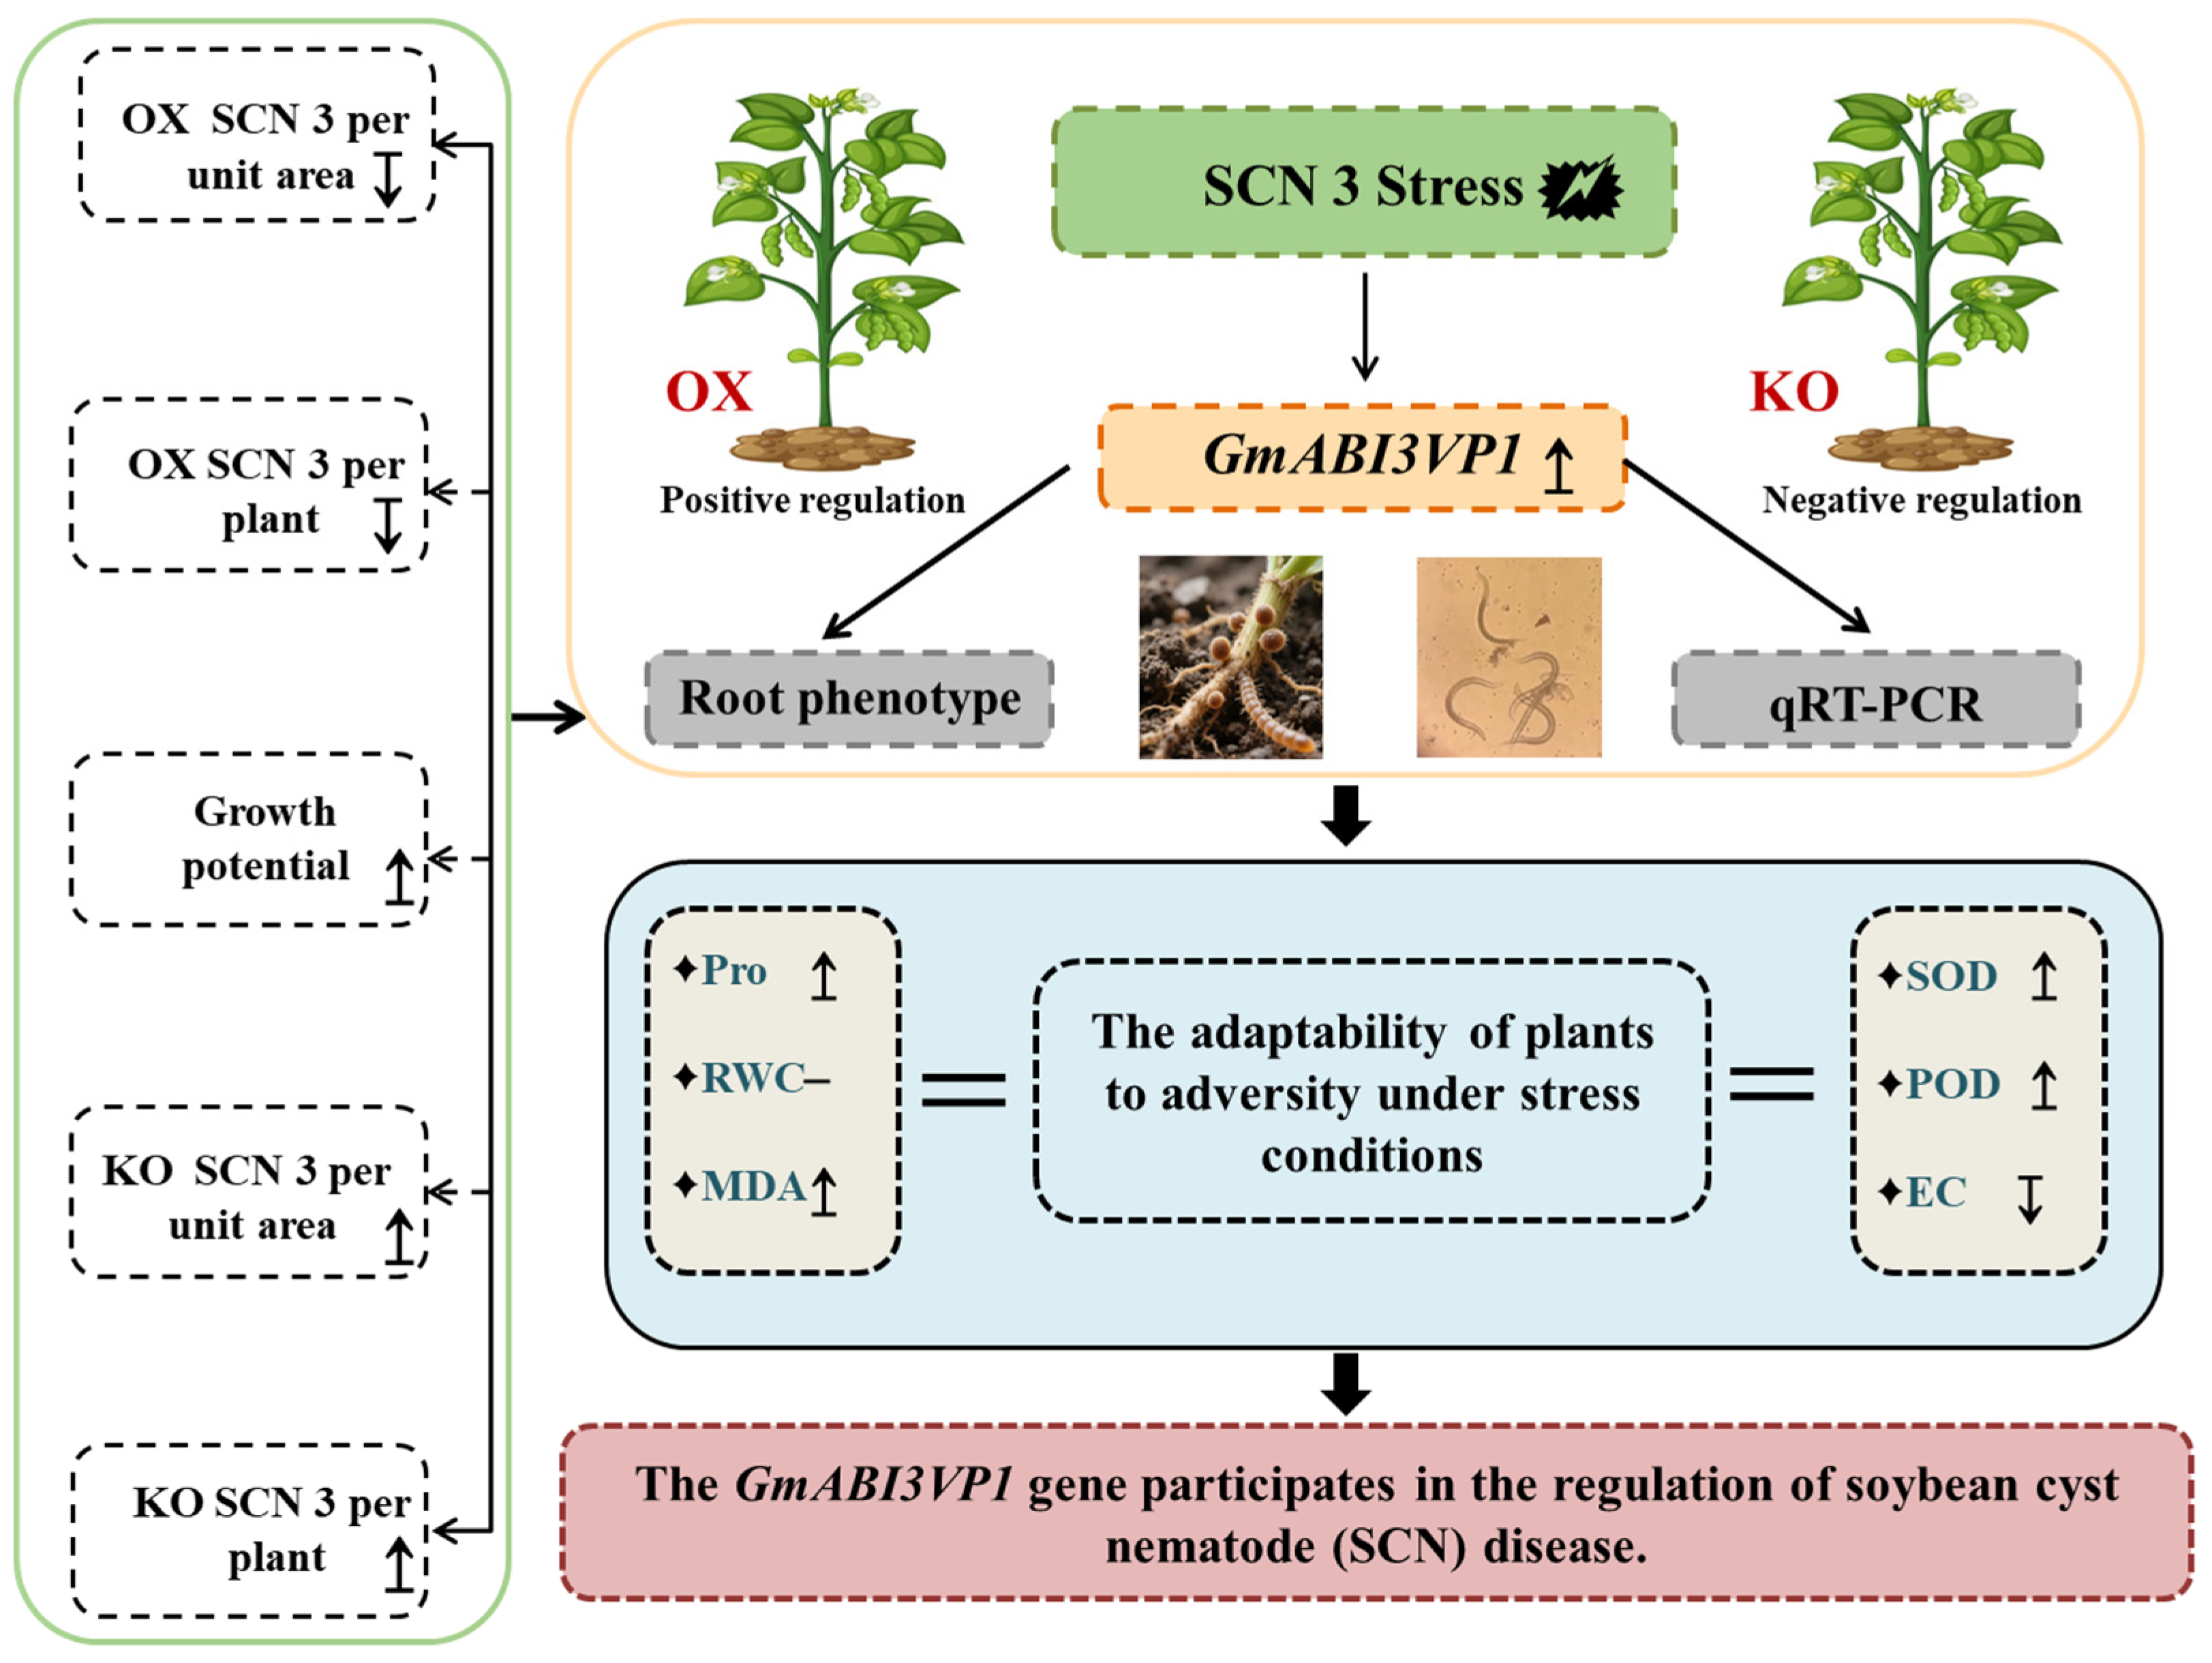
In this study, the Dongnong L10, which is resistant to SCN, and the Heinong 37, which is susceptible to SCN, were adopted. After being subjected to SCN 3 stress for 14 d, the root tissues were sent for RNA-Seq sequencing. The differentially expressed gene GmABI3VP1 was identified through transcriptome data (RNA-Seq) screening. Then, the overexpression recombinant plasmid pCAMBIA3300-GmABI3VP1, the subcellular localization recombinant plasmid pCAMBIA1302-GmABI3VP1, and the gene editing recombinant plasmid pYLCRISPR/Cas9-GmABI3VP1 were constructed. The successfully constructed recombinant plasmids were, respectively, transferred into the competent cells of Escherichia coli DH5α and Agrobacterium tumefaciens K599. Bioinformatics analysis was carried out on the GmABI3VP1 protein, including phosphorylation, secondary and tertiary structures of the protein, and promoter elements. It was shown by the results that multiple gene elements related to responding to adverse stress were contained in this gene, and the plant adverse stress was involved with them. It was also confirmed by the SCN phenotype identification that this gene was involved in resistance to SCN 3, and this gene was classified as a positive regulatory factor. It was preliminarily proved that obvious resistance to SCN 3 disease was possessed by the GmABI3VP1 gene (Figure 7).

5. Conclusions

This study shows that the differentially expressed GmABI3VP1 gene was mined through the transcriptomes of SCN-resistant and SCN-susceptible soybean plants. RT-qPCR was used to verify that the gene exhibits a response SCN disease. The GmABI3VP1 gene was cloned, and the overexpression and gene editing vectors were introduced into soybean roots for the verification of its disease resistance function. The physiological indicators Pro, MDA, and SOD exhibited significant increases, whereas EC demonstrated a notable decrease. The results indicate that the GmABI3VP1 gene is a gene that positively regulates SCN resistance.

Supplementary Materials

The following supporting information can be downloaded at: https://www.mdpi.com/article/10.3390/agronomy15082005/s1, Figure S1: Promoter element analysis; Figure S2: The gene collinearity relationship between groups; Figure S3: Intra-group collinearity analysis; Figure S4: 2% agarose Gel Electrophoresis; Figure S5: Bioinformatics analysis of GmABI3VP1 protein; Table S1: 30× fuchsine solution stock solution; Table S2: MS medium formulations; Table S3: Statistics Table of Sample Sequencing Data; Table S4: Statistics of sequencing date aligned with reference genome sequence; Table S5: Homologous recombination system; Table S6: Statistics of sequencing date aligned with reference genome sequence; Table S7: Primers sequence information; Supplementary S1: Gene sequences.

Author Contributions

Conceptualization, S.Q. and G.S.; methodology, S.Q.; software, S.Q., S.H. and M.Z.; validation, W.T. and Y.L.; formal analysis, S.Q. and Y.L.; investigation, H.L.; resources, H.L.; data curation, S.Q. and X.Z.; writing—original draft preparation, S.Q.; writing—review and editing, R.G. and X.Z.; visualization, S.Q.; supervision, S.Q.; project administration, H.L.; funding acquisition, H.L. All authors have read and agreed to the published version of the manuscript.

Funding

This study was conducted in the Key Laboratory of Soybean Biology of the Chinese Education Ministry, Soybean Research & Development Center (CARS) and the Key Laboratory of Northeastern Soybean Biology and Breeding/Genetics of the Chinese Agriculture Ministry, and was financially supported by The Inner Mongolia Science and Technology project (2023DXZD0002), The Chinese National Natural Science Foundation (32472196, U22A20473), Heilongjiang Provincial ‘Outstanding Young Teachers’ Basic Research Support Program (YQJH2023187), The National Key Research and Development Project of China (2021YFD1201103), The Youth Leading Talent Project, The Ministry of Science and Technology in China (2015RA228), The national project (CARS-04-PS07), and Young leading talents of Northeast Agricultural University (NEAU2023QNLJ-003). National Key R&D Program of China (2022YFE0203300).

Data Availability Statement

The original contributions presented in this study are included in the article. Further inquiries can be directed to the corresponding authors. Data will be made available upon request.

Acknowledgments

Grateful acknowledgment is made to the Key Laboratory of Soybean Biology (Ministry of Education of China), the Key Laboratory of Soybean Biology and Breeding/Genetics (Ministry of Agriculture of China, Harbin), and the College of Agriculture, Northeast Agricultural University for providing the experimental platform. Thanks are also extended to the Closed Breeding Center, Anda City, Daqing City (Heilongjiang Academy of Agricultural Sciences) for providing soil samples containing soybean cyst nematodes. All individuals included in this section have consented to the acknowledgement.

Conflicts of Interest

The authors declare no conflicts of interest.

References

  1. Qu, S.; Liu, F.; Song, G.S.; Hu, S.H.; Fang, Y.Y.; Zhao, X.; Han, Y.P. Cloning and preliminary functional analysis of zinc finger protein gene GmC2H2-2like resistance to cyst nematode in soybean. Acta Agric. Boreali-Sin. 2024, 39, 195–207. [Google Scholar]
  2. Tian, Z.; Nepomuceno, A.L.; Song, Q.; Stupar, R.M.; Liu, B.; Kong, F.; Ma, J.; Lee, S.H.; Jackson, S.A. Soybean2035: A decadal vision for soybean functional genomics and breeding. Mol. Plant. 2025, 18, 245–271. [Google Scholar] [CrossRef]
  3. Mahecha-Garnica, S.; Ye, W.; Schumacher, L.A.; Gorny, A.M. Soybean Cyst Nematode of Soybean: A Diagnostic Guide. Plant Health Prog. 2022, 23, 507–513. [Google Scholar] [CrossRef]
  4. Yan, G.P.; Baidoo, R. Current research status of Heterodera glycines resistance and its implication on soybean breeding. Engineering 2018, 4, 534–541. [Google Scholar] [CrossRef]
  5. Jiang, H.P.; Qu, S.; Liu, F.; Sun, H.W.; Li, H.Y.; Teng, W.L.; Zhan, Y.H.; Li, Y.G.; Han, Y.P.; Zhao, X. Multi-omics analysis identified the GmUGT88A1 gene, which coordinately regulates soybean resistance to cyst nematode and isoflavone content. Plant Biotechnol. J. 2025, 23, 1291–1307. [Google Scholar] [CrossRef]
  6. Dong, J.; Hudson, M.E. WI12Rhg1 interacts with DELLAs and mediates soybean cyst nematode resistance through hormone pathways. Plant Biotechnol. J. 2022, 20, 283–296. [Google Scholar] [CrossRef]
  7. Riggs, R.D.; Schmitt, D.P. Complete characterization of the race scheme for Heterodera glycines. J. Nematol. 1988, 20, 392–395. [Google Scholar] [PubMed]
  8. Niblack, T.L.; Arelli, P.R.; Noel, G.R.; Opperman, C.H.; Orf, J.H.; Schmitt, D.P.; Shannon, J.G.; Tylka, G.L. A revised classification scheme for genetically diverse populations of Heterodera glycines. J. Nematol. 2002, 34, 279–288. [Google Scholar]
  9. Caldwell, B.E.; Brim, C.A.; Ross, J.P. Inheritance of resistance of soybeans to the cyst nematode. Agron. J. 1960, 52, 635–636. [Google Scholar] [CrossRef]
  10. Matson, A.L.; Williams, L.F. Evidence of a fourt gene for resistance to the soybean cyst nematodde. Crop Sci. 1965, 5, 477. [Google Scholar] [CrossRef]
  11. Rao-Arelli, A.P. Inheritance of resistance to Heterodera glycines Race 3 in soybean accessions. Plant Dis. 1994, 78, 898. [Google Scholar] [CrossRef]
  12. Concibido, V.C.; Diers, B.W.; Arelli, P.R. A decade of QTL mapping for cyst nematode resistance in soybean. Crop Sci. 2004, 44, 1121–1131. [Google Scholar] [CrossRef]
  13. Niblack, T.L.; Colgrove, A.L.; Colgrove, K.; Bond, J.P. Shift in virulence of soybean cyst nematode is associated with use of resistance from PI88788. Plant Health Prog. 2008, 9, 1535–1539. [Google Scholar] [CrossRef]
  14. Chu, S.; Ma, H.; Li, K.; Li, J.; Liu, H.; Quan, L.; Zhu, X.; Chen, M.; Lu, W.; Chen, X.; et al. Comparisons of constitutive resistances to soybean cyst nematode between PI 88788- and Peking-type sources of resistance in soybean by transcriptomic and metabolomic profilings. Front. Genet. 2022, 13, 1055867. [Google Scholar] [CrossRef]
  15. Suzuki, M.; Kao, C.Y.; Cocciolone, S.; McCarty, D.R. Maize VP1 complements Arabidopsis abi3 and confers a novel ABA/auxin interaction in roots. Plant 2001, 28, 409–418. [Google Scholar]
  16. Bassel, G.W.; Mullen, R.T.; Bewley, J.D. ABI3 expression ceases following, but not during, germination of tomato and Arabidopsis seeds. J. Exp. Bot. 2006, 57, 1291–1297. [Google Scholar] [CrossRef]
  17. Ezcurra, I.; Wycliffe, P.; Nehlin, L.; Ellerström, M.; Rask, L. Transactivation of the Brassica napus napin promoter by ABI3 requires interaction of the conserved B2 and B3 domains of ABI3 with different cis-elements: B2 mediates activation through an ABRE, whereas B3 interacts with an RY/G-box. Plant J. Cell Mol. Biol. 2000, 24, 57–66. [Google Scholar] [CrossRef] [PubMed]
  18. Marella, H.H.; Quatrano, R.S. The B2 domain of VIVIPAROUS1 is bi-functional and regulates nuclear localization and transactivation. Planta 2007, 225, 863–872. [Google Scholar] [CrossRef] [PubMed]
  19. Romanel, E.A.C.; Schrago, C.G.; Couñago, R.M.; Russo, C.A.; Alves-Ferreira, M. Evolution of the B3 DNA binding superfamily: New insights into REM family gene diversification. PLoS ONE 2009, 4, e5791. [Google Scholar] [CrossRef]
  20. Bedi, S.; Nag, C.R. Transcription factor ABI3 auto-activates its own expression during dehydration stress response. FEBS Lett. 2018, 592, 2594–2611. [Google Scholar] [CrossRef]
  21. Finkelstein, R.R.; Gampala, S.S.; Rock, C.D. Abscisic acid signaling in seeds and seedlings. The Plant Cell 2002, 14 (Suppl. 1), S15–S45. [Google Scholar] [CrossRef] [PubMed]
  22. Xu, P.; Cai, W. Function of Brassica napus BnABI3 in Arabidopsis gs1, an Allele of AtABI3, in Seed Development and Stress Response. Front. Plant Sci. 2019, 10, 67. [Google Scholar] [CrossRef] [PubMed]
  23. Liu, C.J.; Yang, S.S.; Sun, G.; Liu, S.J. Research progress on ABI3 transcription factor in plants. J. Qufu Norm. Univ. (Nat. Sci. Ed.) 2021, 47, 99–105. [Google Scholar]
  24. Tamminen, I.; Mäkelä, P.; Heino, P.; Palva, E.T. Ectopic expression of ABI3 gene enhances freezing tolerance in response to abscisic acid and low temperature in Arabidopsis thaliana. Plant J. Cell Mol. Biol. 2001, 25, 1–8. [Google Scholar] [CrossRef]
  25. Ma, X.Y.; Qiao, Z.; Chen, D.H.; Yang, W.G.; Zhou, R.J.; Zhang, W.; Wang, M. CYCLIN-DEPENDENT KINASE G2 regulates salinity stress response and salt mediated flowering in Arabidopsis thaliana. Plant Mol. Biol. 2015, 88, 287–299. [Google Scholar] [CrossRef]
  26. Wang, S.; Guo, T.; Wang, Z.; Kang, J.; Yang, Q.; Shen, Y.; Long, R. Expression of Three Related to ABI3/VP1 Genes in Medicago truncatula Caused Increased Stress Resistance and Branch Increase in Arabidopsis thaliana. Front. Plant Sci. 2020, 11, 611. [Google Scholar] [CrossRef]
  27. Qu, S.; Hu, S.; Zhang, M.; Song, G.; Liu, F.; Teng, W.; Zhan, Y.; Li, Y.; Li, H.; Zhao, X.; et al. In Silico Characterization of GmbHLH18 and Its Role in Improving Soybean Cyst Nematode Resistance via Genetic Manipulation. Agronomy 2025, 15, 32–34. [Google Scholar] [CrossRef]
  28. Mittal, A.; Gampala, S.; Ritchie, G.L.; Payton, P.; Burke, J.J.; Rock, C.D. Related to ABA Insensitive3(ABI3)/Viviparous1 and AtABI5 transcription factor coexpression in cotton enhances drought stress adaptation. Plant Biotechnol. J. 2014, 12, 578–589. [Google Scholar] [CrossRef]
  29. Rohde, A.; Prinsen, E.; Rycke, R.D.; Engler, G.; Montagu, M.; Boerjan, W. PtABI3 impinges on the growth and differentiation of embryonic leaves during bud set in poplar. Plant Cell 2002, 14, 1885–1901. [Google Scholar] [CrossRef]
  30. Xia, J.; Wang, X.Q.; Perroud, P.F.; He, Y.K.; Quatrano, R.; Zhang, W.X. Endogenous Small-Noncoding RNAs and Potential Functions in Desiccation Tolerance in Physcomitrella Patens. Sci. Rep. 2016, 6, 30118. [Google Scholar] [CrossRef] [PubMed]
  31. Chen, X.Y.; Wu, H.X.; Zhang, X.H.; Guo, R.H.; Li, K.; Fu, Y.L.; Huang, Z.; Xu, A.X.; Dong, J.G.; Yu, C.Y. Comparative Transcriptomics Uncovers Upstream Factors Regulating BnFAD3 Expression and Affecting Linolenic Acid Biosynthesis in Yellow-Seeded Rapeseed (Brassica napus L.). Plants 2024, 13, 760. [Google Scholar] [CrossRef]
  32. Perkins, M.; Skori, L.; Hickerson, N.M.N.; Jamshed, M.; Samuel, M.A. Genetic manipulation of ABI3 confers frost tolerant seed degreening in canola. Plant Biotechnol. J. 2020, 18, 602–604. [Google Scholar] [CrossRef]
  33. Haslekas, C.; Grini, P.E.; Nordgard, S.H.; Thorstensen, T.; Viken, M.K.; Nygaard, V.; Aalen, R.B. ABI3 mediates expression of the peroxiredoxin antioxidant AtPER1 gene and induction by oxidative stress. Plant Mol. Biol. 2003, 53, 313–326. [Google Scholar] [CrossRef] [PubMed]
  34. Shu, K.; Chen, F.; Zhou, W.G.; Luo, X.F.; Dai, Y.J.; Shuai, H.W.; Yang, W.Y. ABI4 regulates the floral transition independently of ABI5 and ABI3. Mol. Biol. Rep. 2018, 45, 2727–2731. [Google Scholar] [CrossRef] [PubMed]
  35. Patil, G.B.; Lakhssassi, N.; Wan, J.; Song, L.; Zhou, Z.; Klepadlo, M.; Vuong, T.D.; Stec, A.O.; Kahil, S.S.; Colantonio, V.; et al. Whole-genome re-sequencing reveals the impact of the interaction of copy number variants of the rhg1 and Rhg4 genes on broad-based resistance to soybean cyst nematode. Plant Biotechnol. J. 2019, 17, 1595–1611. [Google Scholar] [CrossRef] [PubMed]
Figure 1. Analysis of gene expression levels and KEGG enrichment. (A): RC: SCN-resistant control; RT: resistant SCN treatment group; and RC vs. RT: volcano plot of differentially expressed genes between the control group of Dongnong L10 and the treatment group of Dongnong L10; The down-regulated genes are presented in blue, the up-regulated genes are presented in red, and the non-differentially expressed genes are presented in gray. (B): KEGG enrichment of 25 pathways for the differentially expressed genes. p value: 0.005–0.02, p < 0.001 extremely significant; p < 0.05 significant; Gene Number: The size of the sphere represents the number of enriched genes: the larger the sphere, the more enriched genes there are. The enrichment range is 200–600.
Agronomy 15 02005 g001
Figure 2. Analysis of the relative expression levels in soybean roots under SCN 3 stress. (A): Four soybean materials, including two extremely resistant to SCN 3 (Dongnong L10, Y 16) and two extremely sensitive to SCN 3 (Dongnong 50, SN 14), were chosen to be subjected to SCN 3 stress as the treatment groups. Meanwhile, the four resistant and susceptible soybeans without SCN 3 stress treatment were regarded as the control groups; CK: Soybean plants without SCN 3 stress treatment; (B): Results of qRT-PCR of GmABI3VP1 gene in different tissue parts of DN L10, Y16, DN50, and SN14 plants; Circle: relative expression level of the gene; the larger the circle, the higher the relative expression level; (C): TPM (1–10): Transcripts Per Kilobase of exon model per million mapped reads, 1–10 Relative expression level, The closer the color is to red, the higher the relative expression level; the closer the color is to yellow, the lower the relative expression level; (D): Analysis of GmABI3VP1 gene expression on different developmental structures; WT: Wild Type; OX-GmABI3VP1: Overexpression-GmABI3VP1; KO-GmABI3VP1: Knock Out-GmABI3VP1, *** p < 0.001, ** p < 0.01.
Agronomy 15 02005 g002
Figure 3. Phylogenetic tree analysis of the B3 DNA binding domain protein in soybean, maize, rice, and foxtail millet. This phylogenetic tree was constructed using the maximum likelihood method in the MEGA X software (ver. 10.2.6, Molecular Evolutionary Genetics Analysis Group, Tempe, AZ, USA). We selected 19, 9, 10, and 10 VP1/ABI3 transcription genes from soybean, maize, rice, and foxtail millet, respectively; Bootstrap values: Bootstrap values range from 0 to 1. The darker the color, the higher the bootstrap value, and the closer the genetic relationship.
Agronomy 15 02005 g003
Figure 4. Subcellular Localization Analysis of the Protein Encoded by GmABI3VP1. Bright: Bright field; GFP: Green fluorescent protein field; RFP: Red fluorescent protein field; Merge: Merged field; 35S-GFP: Results of injecting tobacco with Agrobacterium tumefaciens GV3101 (p-soup19) carrying pCAMBIA1302-GFP; 35S-GmABI3VP1: Results of injecting tobacco with Agrobacterium tumefaciens GV3101 (p-soup19) transformed with the competent cells of pCAMBIA1302-GmABI3VP1.
Agronomy 15 02005 g004
Figure 5. Results of SCN disease phenotype identification. “***”: p < 0.001; “#”: symbol to mark different DNA segments. (A): Roots of OX1–OX3 with overexpressed GmABI3VP1; Roots of KO1-KO3 with GmABI3VP1 edited by the pYLCRISPR/Cas9 gene; Wild-type Dongnong 50 soybeans of WT1–WT3. (B): M: DL2000 Marker; 1–3: PCR electrophoresis results of the BAR gene in the roots of OX1–3; 4–6: PCR electrophoresis results of the BAR gene in the roots of KO4–6; 7–9:WT; (C): GmABI3VP1-OX1–3: Phenotype identification of SCN in overexpressed roots; (D): WT roots: Phenotypic characterization of wild-type SCN; (E): GmABI3VP1-KO1–3: Phenotypic characterization of GmABI3VP1 Roots Edited with pYLCRISPR/Cas9 Gene; (F): Box plot of the identified number of SCN in GmABI3VP1-OX, GmABI3VP1 KO, and WT roots per unit area (per cm of lateral root length); (G): pYLCRISPR/Cas9 Basic plasmid backbone; (H): Information on the backbone and target sequences of the pYLCRISPR/Cas9 gene editing.
Agronomy 15 02005 g005
Figure 6. Determination of SCN 3 stress-related indices in transgenic root systems. (A): Determine the relative water content of OX-GmABI3VP1, WT (Dongnong 50), and KO-GmABI3VP1; (B): Determine the electrical conductivity of OX-GmABI3VP1, WT (Dongnong 50), and KO-GmABI3VP1; (C): Determine the MDA content of OX-GmABI3VP1, WT (Dongnong 50), and KO-GmABI3VP1; (D): Determine the SOD content of OX-GmABI3VP1, WT (Dongnong 50), and KO-GmABI3VP1; (E): Determine the content of proline synthase in OX-GmABI3VP1, WT (Dongnong 50), and KO-GmABI3VP1; (F): Determine the POD content of OX-GmABI3VP1, WT (Dongnong 50), and KO-GmABI3VP1, ** p < 0.01, *** p < 0.001.
Agronomy 15 02005 g006
Figure 7. GmABI3VP1 participates in regulating the pathogenesis of soybean cyst nematode disease Mechanism diagram; Pro: Proline; RWC: Relative Water Content; MDA: Malondialdehyde; SOD: Superoxide Dismutase; POD: Peroxidase; EC: Electrical Conductivity; ↑: up-regulated; ↓: down-regulated; OX: Overexpressed hairy roots; KO: Gene-edited hairy roots.
Agronomy 15 02005 g007
Table 1. Paired samples T-test results.
TreatmentsAverageVarianceObserved ValueStandard DeviationStandard ERROR of the Meanp (T ≤ t) Double Tailp (T ≤ t) Double Tail Criticality
GmABI3VP1-KO8.220.13150.320.316.1998 × 10−99.30
GmABI3VP1-OX2.860.13150.750.192.2641 × 10−712.39
WT5.260.1215----
Disclaimer/Publisher’s Note: The statements, opinions and data contained in all publications are solely those of the individual author(s) and contributor(s) and not of MDPI and/or the editor(s). MDPI and/or the editor(s) disclaim responsibility for any injury to people or property resulting from any ideas, methods, instructions or products referred to in the content.